DISS. ETH NO. 19080 EXPERIMENTAL DETERMINATION OF SPECTRAL RADIATIVE HEAT TRANSFER PROPERTIES IN PARTICIPATING MEDIA A dissertation submitted to ETH ZURICH for the degree of Doctor of Sciences presented by PATRICK SEAN CORAY Master of Engineering Science University of New South Wales, Sydney, Australia born June 15 th , 1979 citizen of Laax GR, Switzerland accepted on the recommendation of Prof. Dr. Aldo Steinfeld, examiner Prof. Dr. PD Wojciech Lipiński, co-examiner 2010
Transcript
DISS. ETH NO. 19080
EXPERIMENTAL DETERMINATION OF SPECTRAL RADIATIVE HEAT TRANSFER PROPERTIES IN
PARTICIPATING MEDIA
A dissertation submitted toETH ZURICH
for the degree of
Doctor of Sciences
presented by
PATRICK SEAN CORAY
Master of Engineering ScienceUniversity of New South Wales, Sydney, Australia
born June 15th, 1979
citizen of Laax GR, Switzerland
accepted on the recommendation of
Prof. Dr. Aldo Steinfeld, examinerProf. Dr. PD Wojciech Lipiński, co-examiner
2010
This is the A5 for print edition.
All revisions, corrections and additional material are available at: http://www.yaroc.ch/diss_eth/
Radiative properties of participating media are required in applications where energy processes in general, and high temperature solar energy applications in particular, are to be optimised with respect to radiation heat transfer in an emitting, absorbing and scattering (i.e. participating) medium. One route for determining the radiative properties is theoretical prediction, which requires knowledge of the material's composition and electromagnetic properties as well as the availability of a suitable solution to the underlying Maxwell equations. In the event where theoretical prediction is either not possible or its result too uncertain, experimental determination and verification can offer a viable solution. The present work therefore aims at contributing to the experimental approach. It encompasses the review, summary and development of strategies for measurement and evaluation; the development of experimental set-ups enabling goniometric and transmission mode measurements; and the results of the investigations on reticulate porous ceramics (RPC) and a packed-bed of zinc-oxide particles.
The first major achievement is a goniometric set-up capable of measuring the angular distribution of radiation. It irradiates a sample perpendicularly with a rectangular beam sized 8 mm × 6 mm and then scans the entire sample cross-section at freely selectable wavelengths between 0.3 μm ÷ 4.0 μm and viewing angles between
iii Abstract
-30° ÷ 156°, with 0° being the forward direction. Upgrades for covering a larger wavelength range up to 10 μm and larger angular range up to and including 180° have been designed and are presented together with a furnace for measuring at sample temperatures up to 800°C.
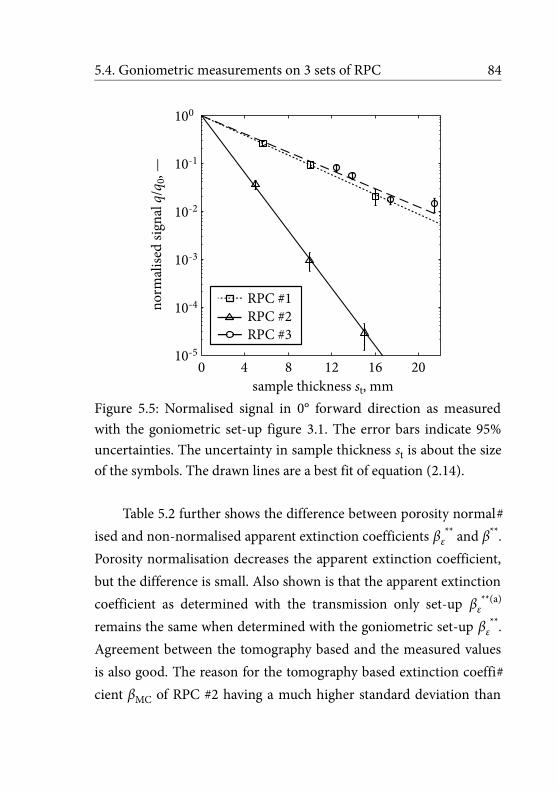
The investigations on RPCs reveal a strong forward peak in 0° direction caused by a large fraction of radiation being able to travel through the entire sample without interacting with the solid phase. This is then followed by a steep drop in signal strength indicating that in-scattering in forward direction is low, which corroborates the good agreement the slope of a log-linear fit to the forward directed RPC signal to thickness data has with numerically determined extinction coefficients based on tomography scans from the same sample. The encountered apparent extinction coefficients for RPCs with porosities around 0.9 range between 220 m-1 for a nominal pore size of 2.54 mm and 690 m-1 for a nominal pore size of 1.27 mm.
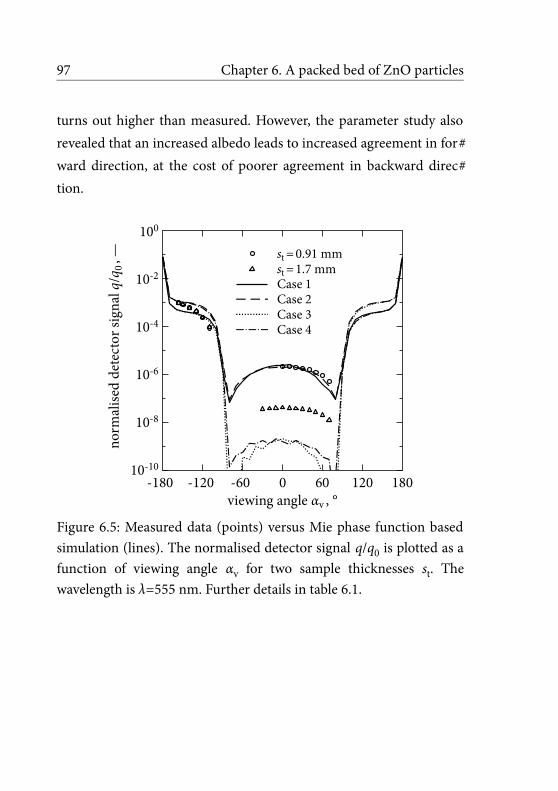
Unlike the RPCs the densely packed beds of ZnO powder reveal a very smooth angular distribution of radiative power with no particular peaks in forward direction. This has to do with virtually no radiation being able to travel through the sample without experiencing multiple scattering events. A Monte Carlo ray-tracing model of the ZnO sample and set-up was used to estimate the radiative properties from a best fit to the measurement data, resulting in a model extinction coefficient of 35'000 m-1 and a scattering albedo of 0.999. In case of the ZnO samples, the experimental results do not support but contradict theoretical results based on independent scattering Mie theory. Reasons for this contradiction can be attributed to the
Abstract iv
investigated packed beds lying in the dependent scattering regime and their particle size distribution being marred by high uncertainties.
In conclusion, the experimental results demonstrate the functionality of the experimental set-up, the feasibility of supportive / contradictive verification of theoretical predictions, and the successful determination of apparent and model radiative properties from measurement data.
Zusammenfassung
Diese Dissertation befasst sich mit der experimentellen Bestimmung von Strahlungseigenschaften von sogenannt teilnehmenden Medien, in denen thermische Strahlung sowohl absorbiert als auch emittiert und gestreut werden kann. Eine wichtige Anwendung dieser Eigenschaften liegt in der Optimierung energetischer Prozesse, bei denen Wärmeübertragung durch Strahlung in teilnehmenden Medien eine zentrale Rolle spielt. Hierzu gehören im speziellen solare Energieanwendungen bei hohen Temperaturen. Eine Möglichkeit liegt darin, die Strahlungseigenschaften auf theoretisch / numerischem Weg zu bestimmen. Dies bedingt jedoch die Kenntnis der geometrischen Materialstruktur, der elektromagnetischen Materialeigenschaften sowie der Verfügbarkeit einer geeigneten Lösung der Maxwellschen Gleichungen. Falls die theoretische Vorhersage nicht möglich oder mit unzulässig hohen Unsicherheiten verbunden ist, kann gegebenenfalls eine experimentelle Bestimmung oder Verifizierung der benötigten Daten weiterhelfen. Entsprechend befasst sich die vorliegende Arbeit zunächst mit dem Erarbeiten einer Übersicht zu experimentellen Methoden, dann mit der Entwicklung von experimentellen Aufbauten und zuletzt mit direkten Anwendungen im Bereich netzartiger poröser Keramiken sowie in einem aus Zinkoxidpulver bestehendem Festbett.
vii Zusammenfassung
Grundlage für die experimentellen Untersuchungen ist ein goniometrischer Messaufbau zur winkelabhängigen Bestimmung der Strahlungsleistung. Die zu untersuchenden Proben werden dabei senkrecht zu einem rechteckigen Strahl der Grösse 8 mm × 6 mm aufgestellt und die durchschnittliche Strahlungsleistung durch Mittelwertbildung des Signals über die gesamte Probenoberfläche bestimmt. Der einstellbare Wellenlängenbereich beträgt 0.3 μm ÷ 4.0 μm und der Betrachtungswinkelbereich -30° ÷ 156°, wobei 0° die Vorwärtsrichtung des Strahls bezeichnet. Weitere Arbeiten im Bereich des Messaufbaus sind Erweiterungen zur Abdeckung des Wellenlängenbereichs bis 10 μm, zur Erhöhung des Betrachtungswinkels auf bis und mit 180° und zur Messung bei Probentemperaturen bis 800 °C durch Benutzung eines speziell für die Anlage konstruierten Ofens.
Charakteristisch für die Messungen an netzartigen porösen Keramiken ist ein sehr starkes Signal in 0° Richtung. Diese Signalspitze lässt sich durch die Eigenschaft der Proben, einen grossen Teil der Strahlung ohne jegliche Interaktion mit dem Festkörper durchzulassen, erklären. Direkt ausserhalb der 0° Richtung folgt ein sehr starker Signalabfall, was ein Indiz für die nur sehr schwache Verstärkung des Signals durch Streuung in Vorwärtsrichtung ist. Ferner zeigt sich, dass die Steigung einer linearen Regression des Signals in Vorwärtsrichtung über die Probendicke gut mit numerisch aus Tomographiedaten bestimmten Extinktionskoeffizienten übereinstimmt, was ein weiteres Indiz für die nur sehr schwache Vorwärtsstreuung ist. Die bestimmten scheinbaren Extinktionskoeffizienten der untersuchten Proben, welche alle eine Porosität im Bereich von 90% haben, umfas
Zusammenfassung viii
sen den Bereich zwischen circa 220 m-1 bei einer nominellen Porengrösse von 2.54 mm und 690 m-1 bei einer nominellen Porengrösse von 1.27 mm.
Anders als bei den netzartigen porösen Keramiken zeigt sich bei den Zinkoxid Festbett Proben eine äusserst glatte Verteilung der Strahlungsleistung in Vorwärtsrichtung, was mit der dichten Packung des Zinkoxidpulvers zusammenhängt. Diese dichte Packung führt dazu, dass praktisch die ganze Strahlung mehrfach gestreut und deren Verteilung entsprechend geglättet wird. Die Bestimmung der Strahlungseigenschaften des Zinkoxidbetts erfolgte durch iteratives Angleichen einer Monte Carlo Simulation an die Messdaten. Der resultierende modellbezogene Extinktionskoeffizient beträgt 35'000 m-1 und das Albedo 0.999. Im Falle der Zinkoxidproben ergibt sich keine Übereinstimmung mit den theoretisch durch Anwendung der Mie Theorie für unabhängig streuende Strahlung erzielten Resultaten. Gründe dafür liegen einerseits in der dichten Packung des Festbetts, welches abhängig streut und andererseits in der Unsicherheit der Partikelgrössenverteilung.
Als Fazit: Die Resultate demonstrieren die Funktionalität des experimentellen Messaufbaus, die Machbarkeit der Bestätigung als auch der Widerlegung theoretischer Voraussagen und schliesslich die Bestimmung von modellbezogenen Strahlungseigenschaften aus Messdaten.
Preface
This dissertation was performed jointly at the Paul Scherrer Insitute (PSI), and the Swiss Federal Insititute of Technology Zurich (ETH). The topic lies in experimental determination of radiative transport properties, a need which arose from the modelling work performed at ETH's Professorship of Renewable Energy Carriers and PSI's Solar Technology Laboratory. It occurred that the models either lacked experimental verification for theoretically derived properties or were limited by lack of both theoretical models and experimental data. Consequently PRE's Radiation Heat Transfer Laboratory (Radlab) came to life. The author commenced work on the Radlab in May 2006, at a time where the first big components of the initial set-up — namely the double-monochromator, the dual Xe-arc / Cesiwid lamp and the Si/MCT detector — began to arrive. What followed was an ongoing evolution of the optical design, measurements and evaluation. Next to the work on the Radlab the author pursued a number of other lengthier tasks (radiation flux measurement, website development and MC code maintenance) which are documented elsewhere.
A selection of important milestones in the course of the thesis are: The first simplified transmission mode optics (November 2006) combined with the measurements on reticulate porous ceramics (December 2006); The optics for angular measurements (May 2007);
xi Preface
The measurement and analysis of densely packed beds of ZnO powder (December 2007 ÷ March 2008); The SNF funded design and acquisition of components for upgrading the set-up for greater spectral range, sensitivity and measurement of radiative properties at temperatures up to 800°C (Spring ÷ Summer 2008 and January 2009); The angular measurements on three types of reticulate porous ceramics (February ÷ August 2009); Angular measurements on packed-beds of tire shreds (September ÷ October 2009); The work on the extended modelling code framework for the Radlab set-up required for inverse analysis (July 2009 ÷ tbc.); And finally the writing of the thesis (March ÷ April 2009).
Though much good was performed many important aspects of measurement and evaluation had to be treated in an incomplete way or left aside entirely. This includes issues such as matching the experimental set-up to the mathematical model, validating the model and set-up by a test medium of known properties, performing an uncertainty analysis of the set-up, assessing the consequence of sample alignment errors, building a better understanding of how to analyse the experimental data and assessing the uniqueness of the solutions obtained so far. Another important but — for reasons of time — neglected aspect lies in finalising the measurement hardware to include fully automated and computerised scanning of samples with on-line reference signal measurement, filter selection and lens adaptation. Investing time for automation was found to be extremely rewarding as every implementation of another automation step resulted in a significantly faster scanning of samples and a reduction in error caused by manual control. Consequently there still is a lot left to do for the
Preface xii
people taking over the Radlab and the author is committed to providing additional support well beyond the completion of his thesis. Successors and other interested persons are encouraged to contact the author in case anything is unclear.
The structure of this thesis document is according to: (1) Fundamentals in combination with background and motivation. (2) An overview of the present state of knowledge and methods with respect to approaching measurement and evaluation of radiative transport properties in combination with a discussion of important and critical issues. (3) The experimental set-ups as designed and used for this thesis. (4) A brief primer on data acquisition and evaluation as performed in the context of the present study. (5 & 6) Results obtained during experimental studies of participating media made of reticulate porous ceramics and packed-beds of zinc-oxide.
Acknowledgements
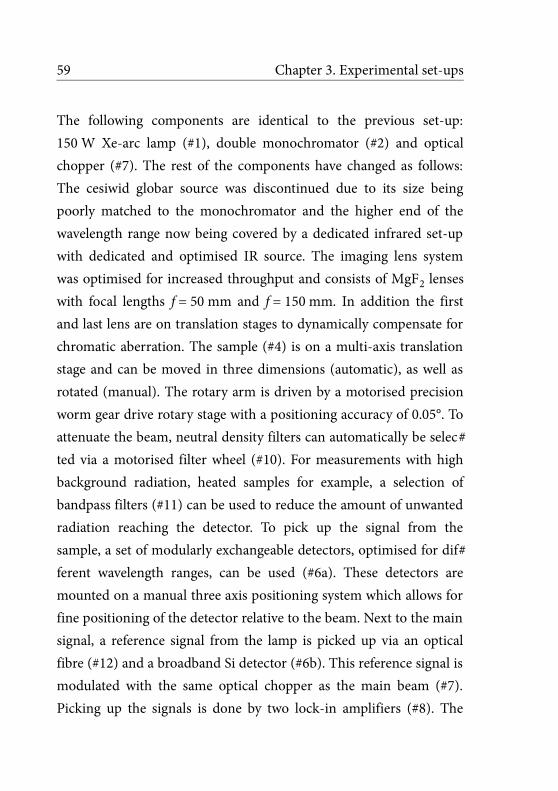
When looking back on my PhD — both the good and the not so good — the bottom line is, that I profited a lot. Profited not only in terms of gained knowledge and experience, but also — and this significantly — from a lot of help from my dissertation's environment as well as from my former education and workplaces. I will therefore use this opportunity to express my gratitude to a number of people who in one way or another contributed to making this PhD possible.
Prof. Dr. Aldo Steinfeld, not only for supervising this thesis, but especially for giving me the immense once in a lifetime opportunity of conducting doctoral studies at ETH Zurich and at the Paul Scherrer Institut.
Prof. Dr. PD Wojciech Lipiński for co-supervising this PhD, for his support, and for the discussions.
The Swiss National Science foundation (contract no. 206021-117372) and the Swiss Federal Office of Energy for partial funding.
I have tried to compile a longer list of people who I'd specifically like to thank — a daunting task, and I'm sure that many names will be missed. Nevertheless I believe that these people deserve to be named, and if anybody is missed out: Sorry, this wasn't done on purpose. There even are cases where I can no longer figure out the name, even though being able to remember the subject. You can also send
xv Acknowledgements
me an email ([email protected]), I'll amend by issuing an update of the extended and revised edition.
First a couple of friends: Lothar Schunk (for lots of disussions, invitations and help during my illness) and Daniela Gresch, Patrick Newman, the Comps family and the Müller-Waldner family.
All present and former staff of PSI's Solar Technology Laboratory (STL): Tony Meier (to whom I am indebted for the help during my illness), Daniel Wuillemin (the most important and most knowledgeable person for all kinds of technical matters at the STL), Tina Daum (for helping with and taking care of many administrative matters); STL's technical crew: Peter Häberling, Samuel Wepf (cycling discussions), Peter Schaller (kindly manufactured parts for me), Beni Jäggi (help with electronics), Marco Stricker (assembled the furnace), Alwin Frei, Max Brack, Daniel Meyer and Yvonne Bäuerle; STL's scientific crew: Drs Ivo Alxneit, Daniel Gstöhl (stories from Linus and Julian), Markus Hänchen (the man with a D3, a Hasselblad and a GF1), Stefan Kräupl (“viel hilft viel”), Christian Hutter, Christian Wieckert, Hansrudolf Tschudi, Marcel Sturzenegger; Doctoral students (incl. former): Frederik Rütten, Remo Felder, Lenny Winkel, Mattias Karlsson, Willy Villasmil.
The present and former staff of ETH's Professorship of Renewable Energy Carriers (PRE): Drs. Peter Loutzenhiser, Hyung Chul Yoon, Hansmartin Friess and Elena Gálvez; Technical- and engineering staff: Philipp Haueter and Laurenz Schlumpf; Doctoral students (incl. former): Tom Melchior, Viktoria Nikulshyna, Jörg Petrasch (VeGaS and scientific discussions), Dominic Trommer, Peter von Zedtwitz, Andreas Z'Graggen, Roman Bader, Christoph Gebald,
Sophia Haussener (thanks for the discussions), Illias Hischier, Gilles Maag, Nic Piatkowski, Anastasia Stamatiou, Clemens Suter, Jan Wurzbacher.
Visiting scientists: Leonid Dombrovsky and Michael Modest (especially for writing his outstanding textbook [93]).
Students who performed their Semester, Bachelor and Master theses under my supervision: Christoph Meier, Mikael Portmann, Luisa Burhenne, Roman Affolter, Pascal Leumann, Fabrizio Botta; All other students working either at STL or PRE, including Kevin Cuche and Tom Cooper.
The following institutions and people at PSI who supplied parts and infrastructure: ENE (with Prof. Wokaun), Bettina Möhrle (IT support — thanks for the RAM), mechanical workshop (incl. “Schnellwerkstatt” & AVOR), electricians, joinery (“Schreinerei”), tailors (“Schneiderei”), Zentralmagazin, AIT, library (great free book order), human resources (Ms Elke Baumann and others), all other services at PSI.
At ETH: The lecturers and teaching assistants of the lectures I've attended; The infrastructure people (Hausdienst, ID, IDES, Schreinerei).
The following former academic influences: — From the University of New South Wales, Sydney: Profs. and Drs. Eddie Leonardi, Tracie Barber, R.B. Randall, Brian Milton, Don Kelly, N. Ahmed, everyone I've missed, as well as the technical staff involved in my Masters degree (Mr. Alex Litvak), and ABB University Marketing for the scholarship. — From the then FH-Aargau (now FHNW): Profs. and Drs. Kurt Heiniger (for opening doors and providing academic
xvii Acknowledgements
and professional opportunities), Andreas Vogel, Karl Schöllhorn, Matthias Schärli, Herbert Looser, Hilary Bannister, Herbert Sager, Willi Berchtold and countless others who gave great care in preparing their lectures, conveying information and opening my mind for scientific and engineering work (sorry for not mentioning everyone from FHA / FHNW by name — this just is too exhaustive — Wiederkehr, Fritzsche, Heyck, Kühne, Munz, Donatsch, Schaber, Schmid, Piskoty, … just to name a few of the missing).
All my former and present classmates, teachers and friends and other involved people.
The doctors, health care professionals and all other involved people who helped me get back on track and fit for my dissertation work again after suffering from a longer illness.
My parents and sister.
Contents
Abstract ii
Zusammenfassung vi
Preface x
Acknowledgements xiv
Nomenclature xxiv
1 Introduction 21.1 Introduction .................................................................................. 21.2 Radiation heat transfer in participating media ......................... 3
1.2.1 Introduction .......................................................................... 31.2.2 Phenomenological description ........................................... 41.2.3 The concept of optical thickness ........................................ 71.2.4 On dropping the spectral subscript λ ................................ 81.2.5 On the scattering angle Θ ................................................... 8
1.3 The context of solar energy ......................................................... 91.4 Determination of radiative transport properties .................... 13
1.4.1 Theoretical and numerical predictive ............................. 131.4.2 The case for measurements .............................................. 161.4.3 Experimental determination ............................................ 191.4.4 Limiting assumptions and requirements ........................ 20
2.3 Important approximative models ............................................. 362.3.1 On the importance of approximative models ................ 362.3.2 Transport approximation .................................................. 362.3.3 Dirac delta approximations .............................................. 38
2.4 Measurement and evaluation .................................................... 402.4.1 Basic approach .................................................................... 402.4.2 The physical model — limitations to determining the
scattering phase function .................................................. 422.4.3 The mathematical solution — “inverse” analysis .......... 43
2.5 Notes ............................................................................................. 452.5.1 Uniqueness — radiative properties bound to their model
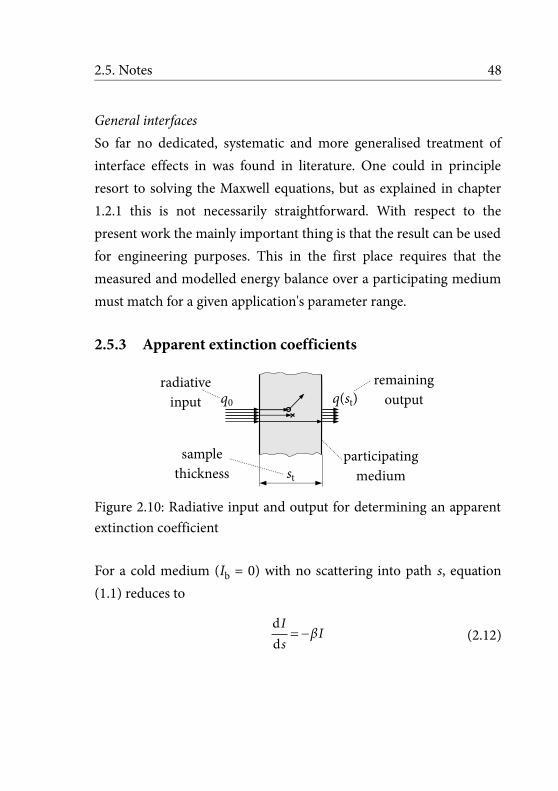
scattering phase function .................................................. 452.5.2 Awareness of the interface effect — a potential pitfall .. 452.5.3 Apparent extinction coefficients ...................................... 48
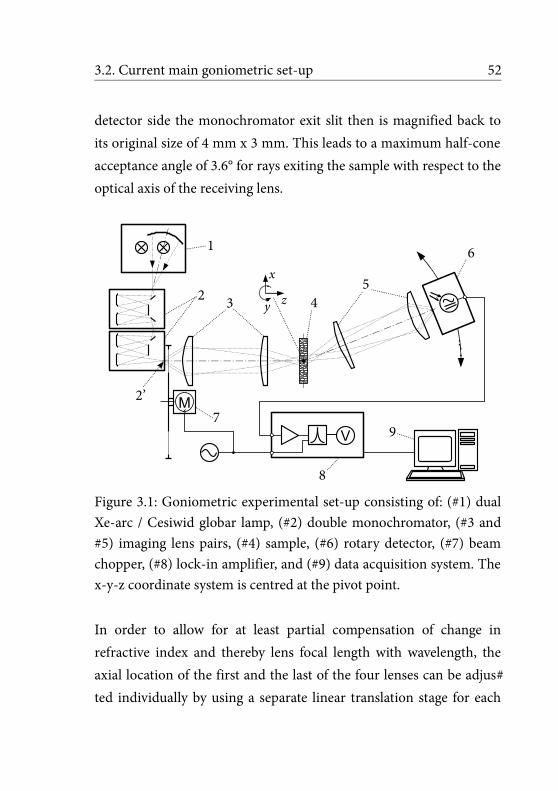
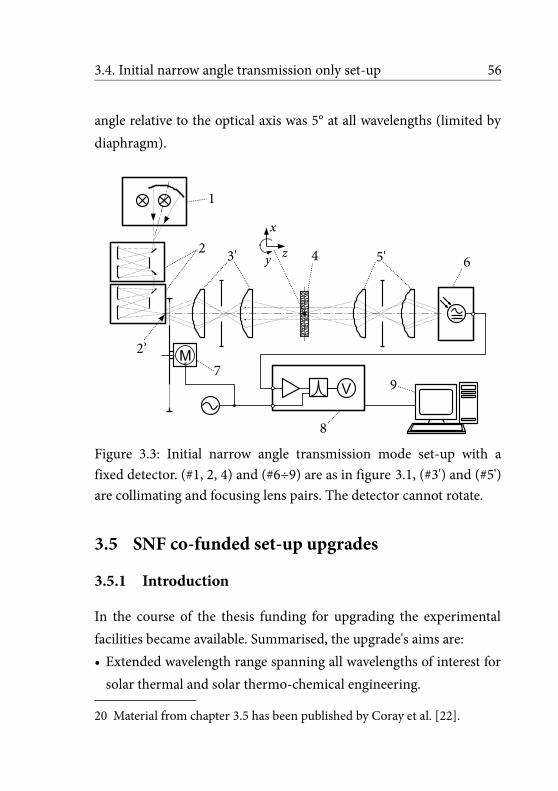
3 Experimental set-ups 503.1 Introduction ................................................................................ 503.2 Current main goniometric set-up ............................................ 503.3 Main set-up in wide-angle transmission mode ...................... 543.4 Initial narrow angle transmission only set-up ........................ 553.5 SNF co-funded set-up upgrades ............................................... 56
Contents xx
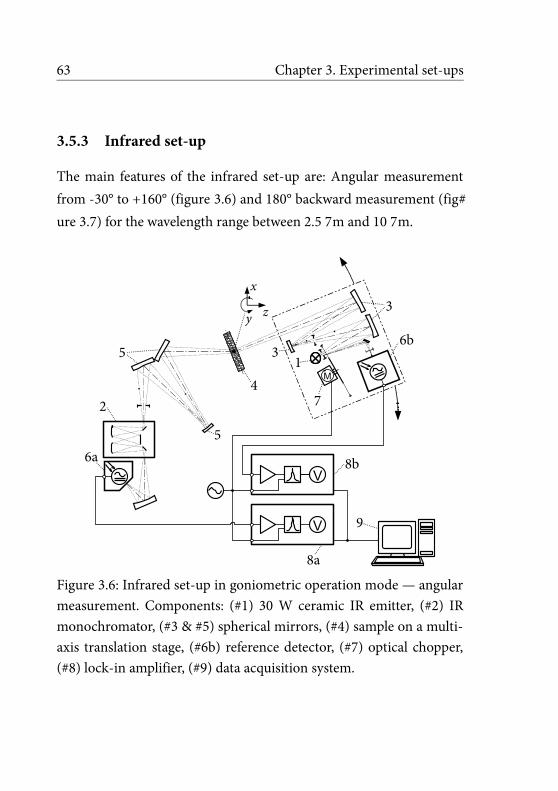
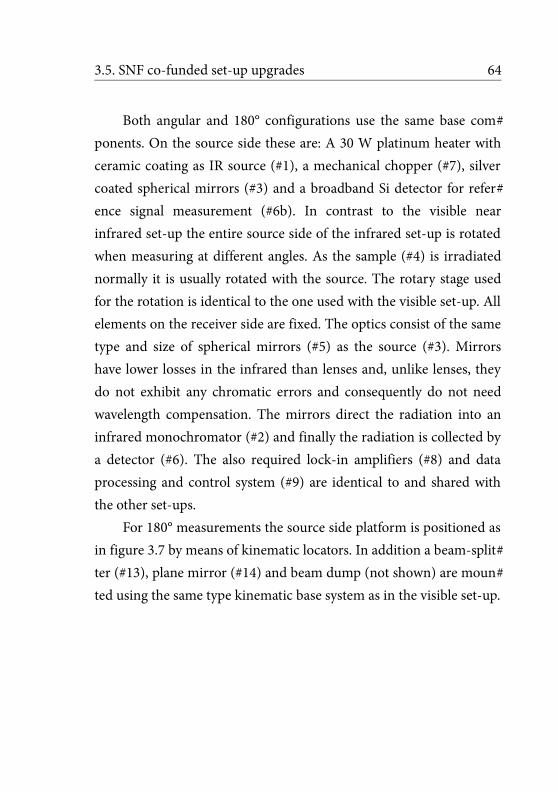
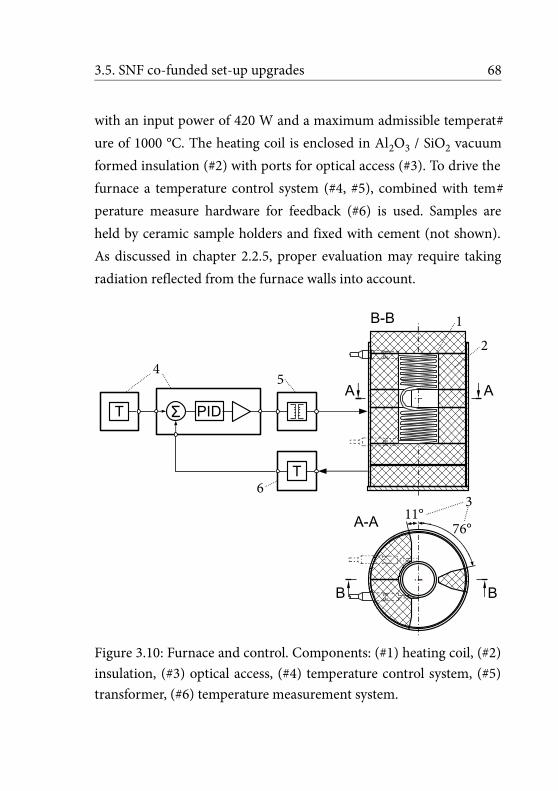
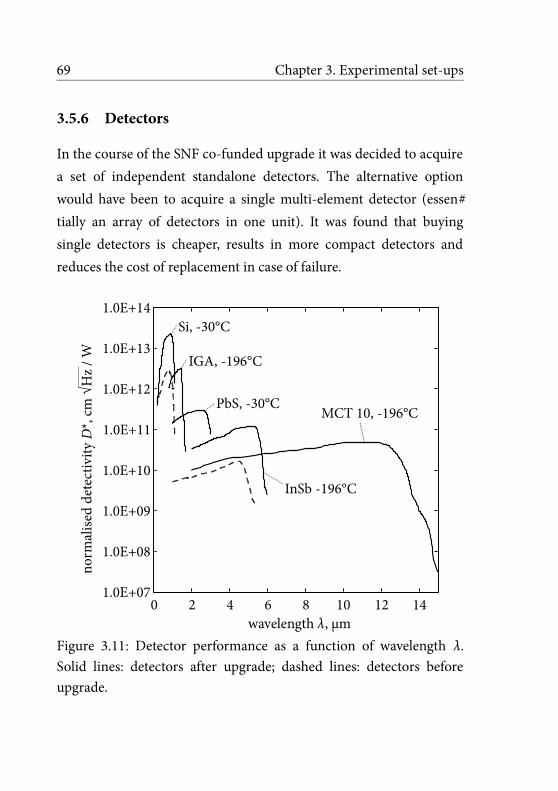
3.5.1 Introduction ........................................................................ 563.5.2 Optimised visible to near infrared set-up ....................... 583.5.3 Infrared set-up .................................................................... 633.5.4 Laser based set-up .............................................................. 653.5.5 Furnace ................................................................................ 673.5.6 Detectors ............................................................................. 69
4 Data acquisition and evaluation 724.1 Measurement procedure ............................................................ 724.2 Data evaluation ........................................................................... 73
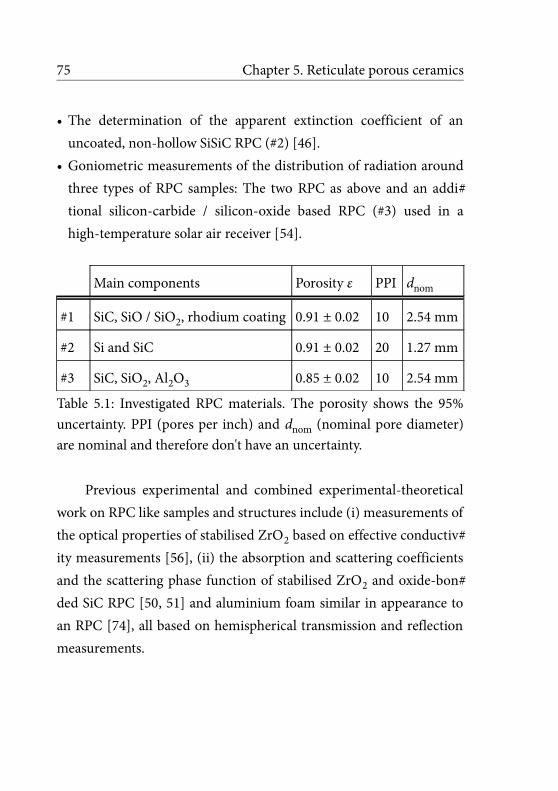
5 Reticulate porous ceramics 745.1 Introduction ................................................................................ 745.2 On normalising the signals by the porosity ............................ 765.3 Initial transmission only measurements ................................. 775.4 Goniometric measurements on 3 sets of RPC ........................ 80
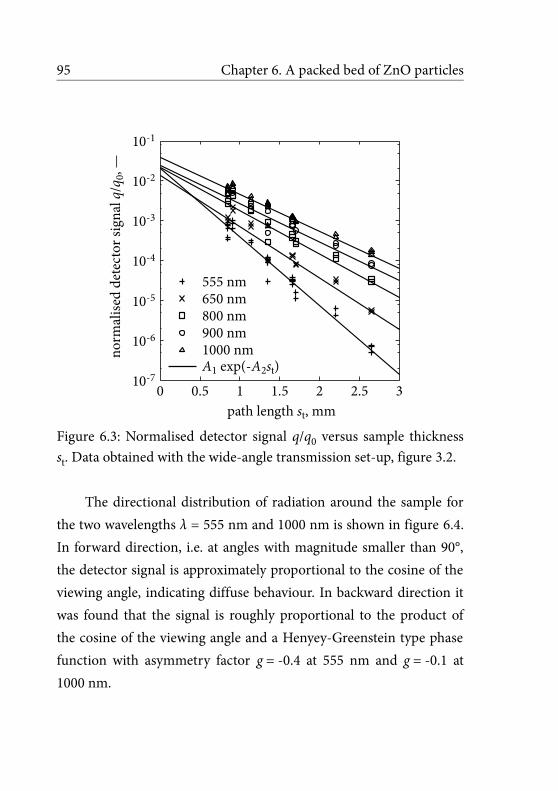
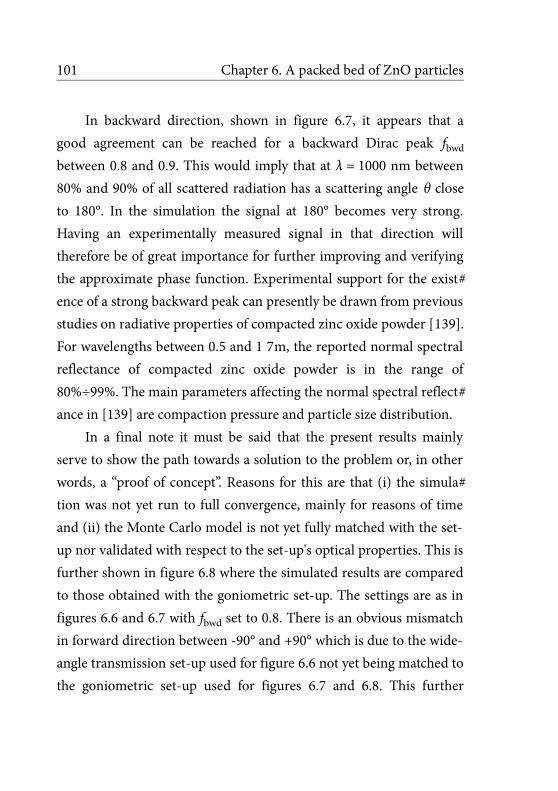
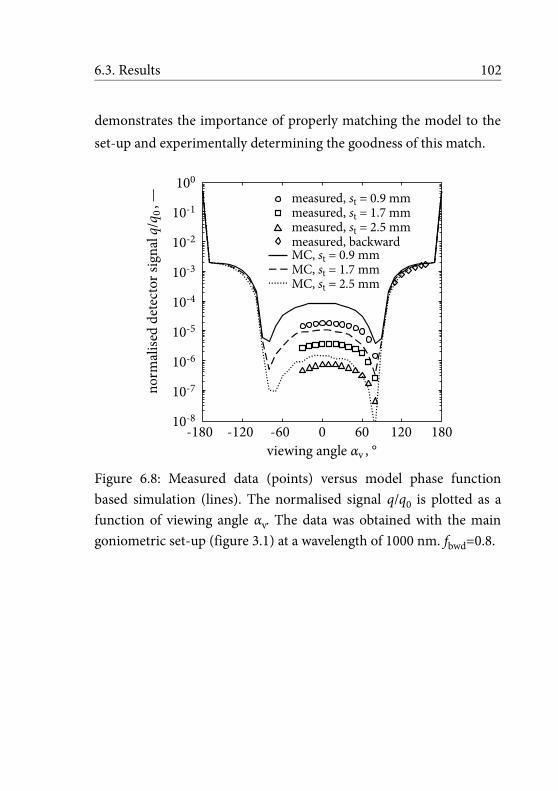
6 A packed bed of ZnO particles 866.1 Introduction ................................................................................ 866.2 Monte Carlo analysis .................................................................. 88
6.2.1 Ray generation .................................................................... 886.2.2 Ray-tracing in the participating medium ....................... 906.2.3 Participating medium properties for independent
scattering ............................................................................. 926.2.4 Empirical approximate scattering phase function
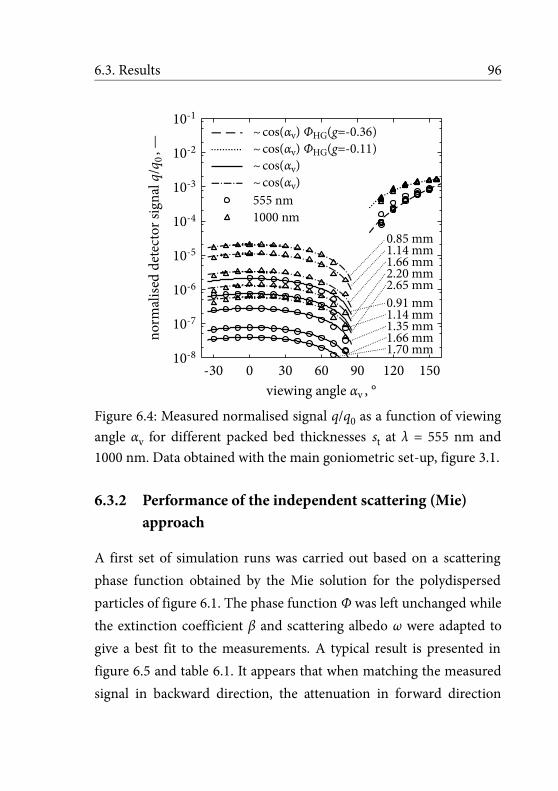
B On solving for radiative properties 112B.1 Introduction .............................................................................. 112B.2 Status in literature .................................................................... 113B.3 A summary of thoughts .......................................................... 113
B.3.1 Requirements .................................................................... 113B.3.2 Issues and trade-offs ........................................................ 114B.3.3 How solving was addressed for the ZnO beds ............. 115B.3.4 On the incomplete in house MC Radlab software ...... 116
C Notes 118C.1 On spectral resolution ............................................................. 118
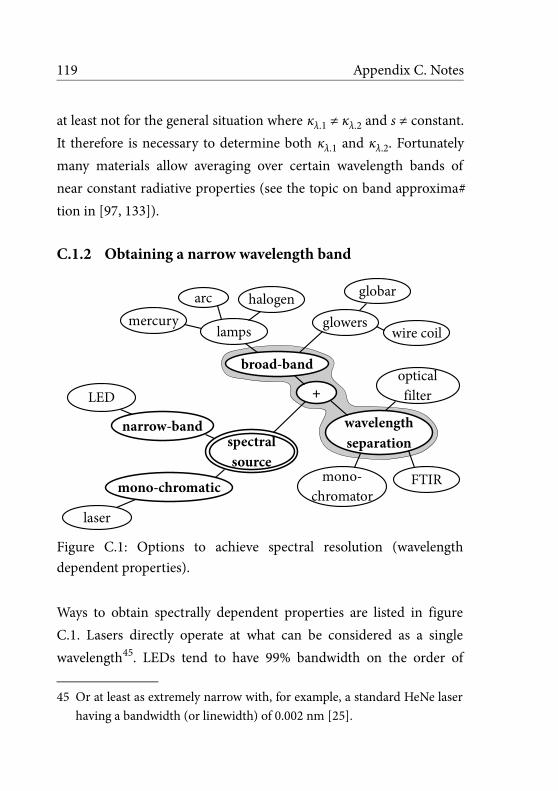
C.1.1 On the importance of spectral resolution .................... 118C.1.2 Obtaining a narrow wavelength band ........................... 119
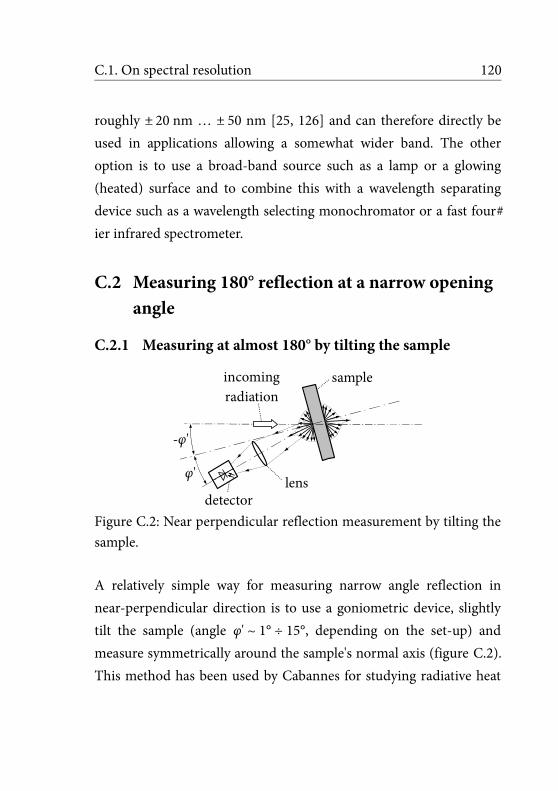
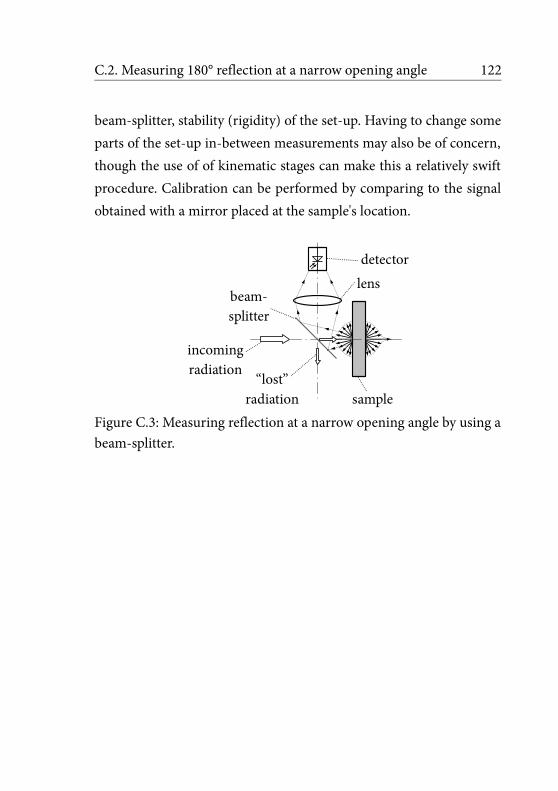
C.2 Measuring 180° reflection at a narrow opening angle ........ 120C.2.1 Measuring at almost 180° by tilting the sample ........... 120C.2.2 Measuring at 180° by using a beam-splitter ................. 121
Contents xxii
D Extended documentation 124
References 126
Curriculum Vitae 154
Nomenclature
The nomenclature used in this thesis largely adheres to the one chosen by Modest [97]. An exception lies in the formatting of mathematical symbols and physical units, which follows the ISO/IEC 80000 recommendations, the NIST Special Publications 330 and 881 [105, 106], the IUPAC Green Book [18], and the IUPAP Red Book [19]. An abridged version of the standards is given by Mills and Metanomski [92].
Acronyms
ETH Swiss Federal Institute of Technology ZurichFTIR Fourier transform infrared spectrometerIR infrared (λ > 700 nm)LED light emitting diodeMC Monte CarloMCRT Monte Carlo ray tracingMCT Mercury-Cadmium-Telluride (detector)PPI pores per inchPRE Professorship of Renewable Energy CarriersPSI Paul Scherrer InstituteRadlab Radiation Heat Transfer LaboratoryRPC reticulate porous ceramic
xxv Nomenclature
RTE radiative transfer equation (equation of rad. transfer)SNF Swiss National Science FoundationSTL Solar Technology LaboratoryUV ultraviolet (λ < 400 nm)VIS visible (400 nm < λ < 700 nm)
Non-dimensional derived units
rad angle (radian), rad = m / msr solid angle (steradian), sr = m2/m2
Latin Characters
a particle radius, mA area, m2
Ai fit coefficientD* normalised detectivity, m Hz0.5/Wd diameter, mdnom nominal pore diameter, mF cumulative distribution functionf distribution functionf focal length, mf Dirac scattered fraction. —fv volume fraction (“solid” fraction), —f# f-number, —g asymmetry factor, —I radiative intensity, W/(m2 sr)
Nomenclature xxvi
Iλ spectral radiative intensity, W/(m3 sr)p ray starting point, mQ efficiency factor, —q detector signal, Vq (radiative) heat flux, W/m2
q0 detector signal at 0° viewing angle without sample, VÂ uniformly distributed random number 0…1, —s distance along a path s, m
unity vector in direction of path s, —st sample thickness, mu ray direction, —
2 Scales with, ~, is similar to proportional, but not as strict.
Nomenclature xxviii
tr transportv viewingλ spectral (i.e. at a and / or per wavelength of λ)^ perpendicular
Superscripts
* reduced** apparent^ unit (e.g. unit vector)
Special scripts and symbols
' different parameter instance or parameter variation over-bar: average (spatial / volume)
Chapter 1
Introduction
1.1 Introduction
solar energy
processoptimisation
thermo-dynamics
heat transfer
chemistry
energy
radiativeheat transfer
participatingmedia
radiativeproperties
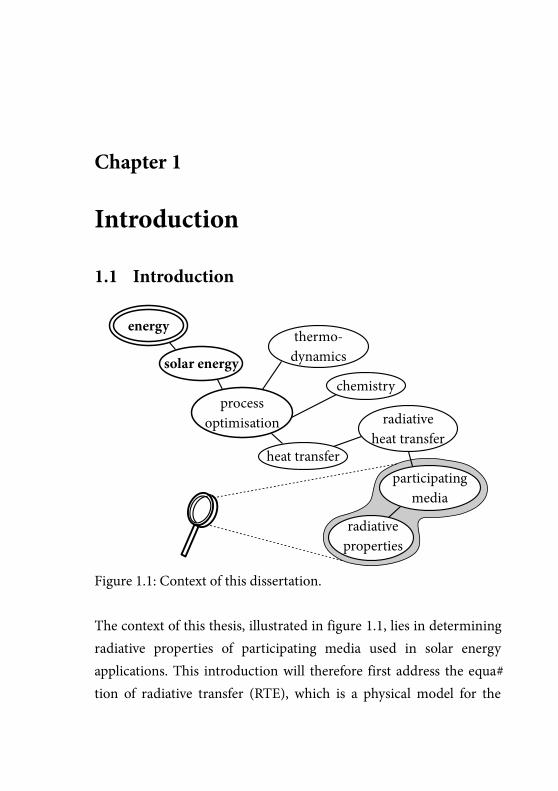
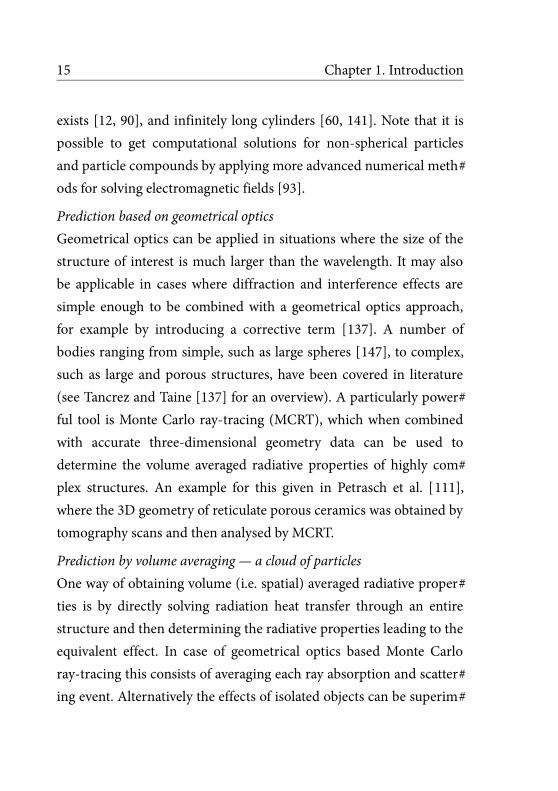
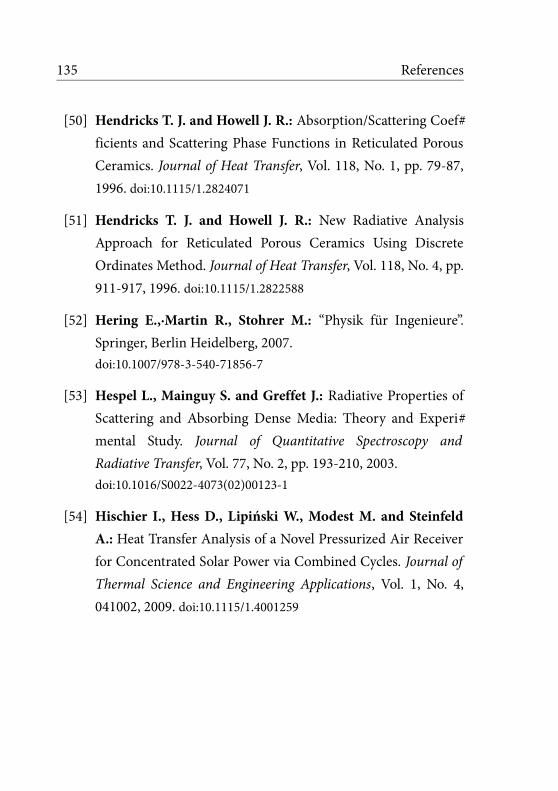
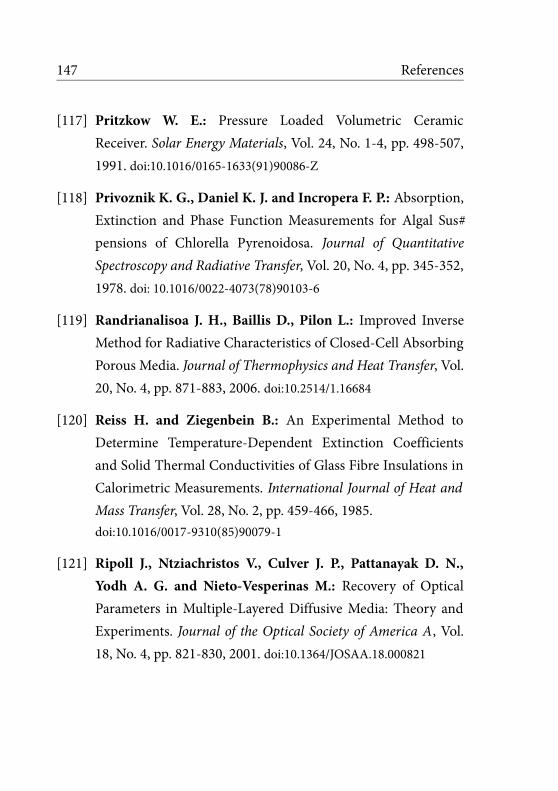
Figure 1.1: Context of this dissertation.
The context of this thesis, illustrated in figure 1.1, lies in determining radiative properties of participating media used in solar energy applications. This introduction will therefore first address the equation of radiative transfer (RTE), which is a physical model for the
3 Chapter 1. Introduction
transport of radiative energy in a medium that allows radiation to travel, albeit in a restricted — “participating” way. Subsequently a selection of relevant solar processes will be discussed in general and with respect to the RTE, and, lastly, the chapter closed by giving an initial introduction to the experimental approach.
1.2 Radiation heat transfer in participating media
1.2.1 Introduction
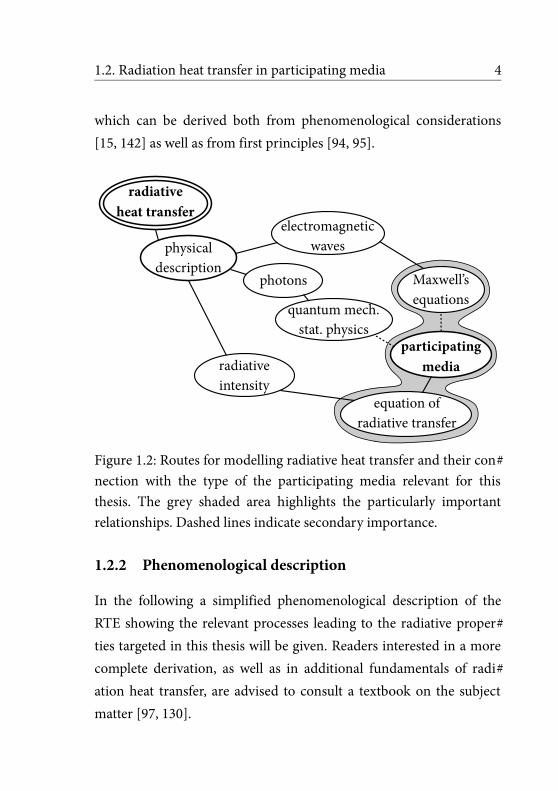
A participating medium is a substance which is capable of absorbing, emitting and scattering radiation [97]. Figure 1.2 outlines ways to address radiation heat transfer in participating media. The more fundamental and microscopic approach is to view thermal radiation as either discrete photons or electromagnetic waves. With respect to radiation heat transfer, it is especially the electromagnetic route with the Maxwell equations that is of particular importance in obtaining solutions for sufficiently simple bodies and media. However, as soon as more complex structures and a more macroscopic scale are involved both the Maxwell equations as well as the discrete photon approach tend to be impractical for engineering purposes, either due to insufficient scope (photons)3 or due to the equations becoming very tedious and computationally demanding to solve (Maxwell)4. A more practical way for modelling radiation heat transfer in complex participating systems is to use the radiative transfer equation (RTE),
3 This argument, albeit in slightly different form, is brought in chapter 8.18 of Mishchenko et al. [94].
4 See chapter 9.1 of Mishchenko et al. [93] for a detailed discussion.
1.2. Radiation heat transfer in participating media 4
which can be derived both from phenomenological considerations [15, 142] as well as from first principles [94, 95].
physicaldescription
electromagneticwaves
photons
participatingmedia
equation ofradiative transfer
radiativeintensity
Maxwell’sequations
radiativeheat transfer
quantum mech.stat. physics
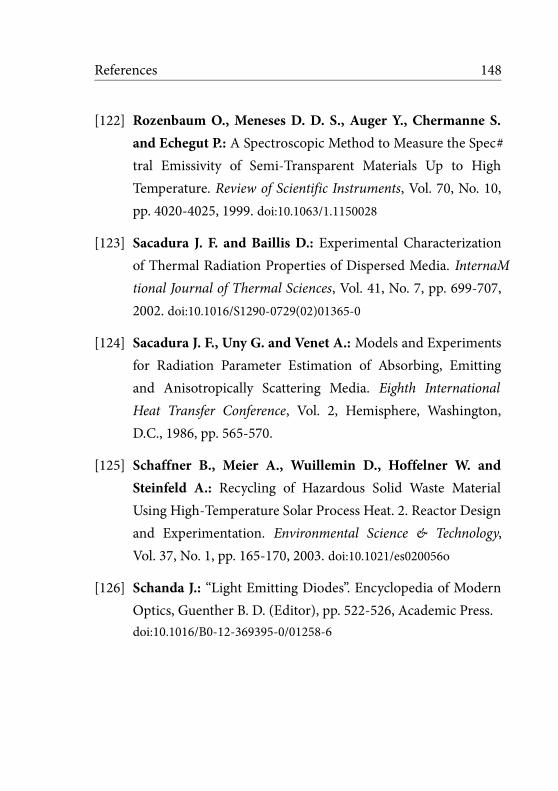
Figure 1.2: Routes for modelling radiative heat transfer and their connection with the type of the participating media relevant for this thesis. The grey shaded area highlights the particularly important relationships. Dashed lines indicate secondary importance.
1.2.2 Phenomenological description
In the following a simplified phenomenological description of the RTE showing the relevant processes leading to the radiative properties targeted in this thesis will be given. Readers interested in a more complete derivation, as well as in additional fundamentals of radiation heat transfer, are advised to consult a textbook on the subject matter [97, 130].
5 Chapter 1. Introduction
sd× òsλ
i4π
d ˆ(4π
λλ
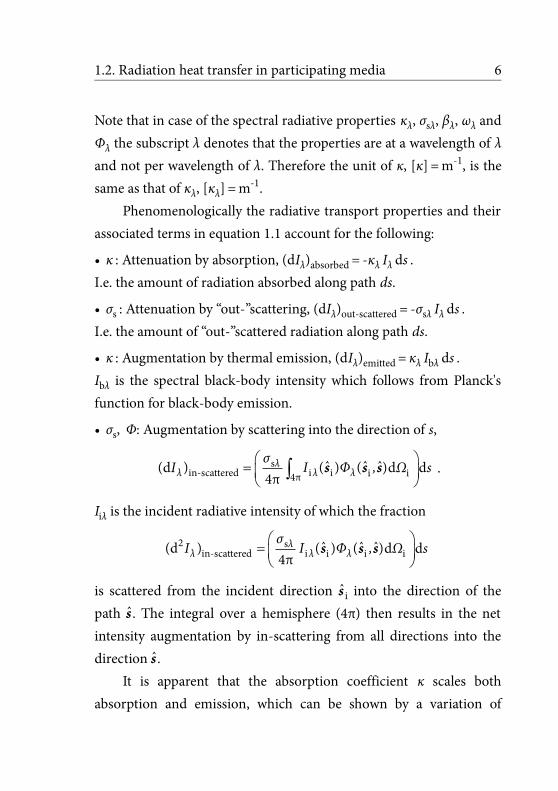
I σI I () )λ λ bλ ˆ ˆiiλ λ λ= =s s s s dΩΦIIβ- +ш κ ,i (1.1)
Equation 1.1 presents the radiative transfer equation in a basic, quasi-steady form showing only the terms relevant for the work performed in this thesis. The RTE describes the change of the spectral radiative intensity Iλ in direction of along the path s, i.e. dIλ/ds. I, the radiative intensity, is defined as the infinitesimal radiative power dP per unit solid angle dΩ per unit area dA normal to the direction of travel , as shown in equation 1.2. Its unit is therefore W/(m2 sr). Usually
the material properties depend on the radiation's wavelength, which is accounted for by using the spectral radiative intensity Iλ, equation 1.3, with units W/(m3 sr).
^=
2dd d
PIΩ A
(1.2)
= =
3d dd d d dλ
I PIλ Ω A λ
(1.3)
The right hand side of equation 1.1 contains the radiative properties, which are the absorption coefficient κ, the scattering coefficient σs
and the scattering phase function Φ. κ and σs can further be combined to give the extinction coefficient
β = κ + σs (1.4)
and the scattering albedoω = σs / β (1.5)
s
s
1.2. Radiation heat transfer in participating media 6
Note that in case of the spectral radiative properties κλ, σsλ, βλ, ωλ and Φλ the subscript λ denotes that the properties are at a wavelength of λ and not per wavelength of λ. Therefore the unit of κ, [κ] = m
-1, is the same as that of κλ, [κλ] = m
-1.Phenomenologically the radiative transport properties and their
associated terms in equation 1.1 account for the following:
• κ : Attenuation by absorption, (dIλ)absorbed = -κλ Iλ ds .I.e. the amount of radiation absorbed along path ds.
• σs : Attenuation by “out-”scattering, (dIλ)out-scattered = -σsλ Iλ ds .I.e. the amount of “out-”scattered radiation along path ds.
• κ : Augmentation by thermal emission, (dIλ)emitted = κλ Ibλ ds .Ibλ is the spectral black-body intensity which follows from Planck's function for black-body emission.
• σs, Φ: Augmentation by scattering into the direction of s,
sλin-scattered 4π
(dI4πσ
= æçè
òö÷ø
I s s sΦ dΩ dsi iλ λ i i) ( ( )) ,λ .
Iiλ is the incident radiative intensity of which the fraction
sλin-scattered(d
4πσ
= I s s sΦ dΩi iλ λ i i) ( ( )) ,λI2 dsæçè
ö÷ø
is scattered from the incident direction i into the direction of the path . The integral over a hemisphere (4π) then results in the net intensity augmentation by in-scattering from all directions into the direction .
It is apparent that the absorption coefficient κ scales both absorption and emission, which can be shown by a variation of
ss
s
7 Chapter 1. Introduction
Kirchhoff 's law [97]. It further is implicitly assumed that the scattering coefficient σs is independent of incoming direction.
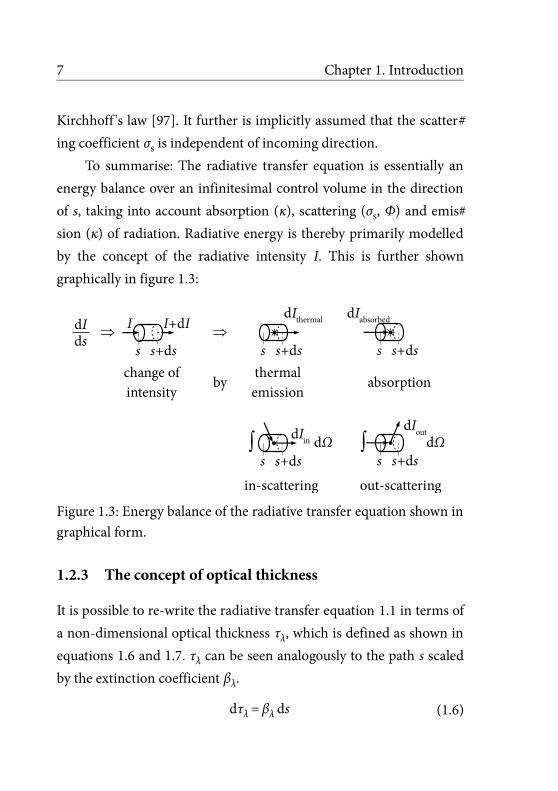
To summarise: The radiative transfer equation is essentially an energy balance over an infinitesimal control volume in the direction of s, taking into account absorption (κ), scattering (σs, Φ) and emission (κ) of radiation. Radiative energy is thereby primarily modelled by the concept of the radiative intensity I. This is further shown graphically in figure 1.3:
dIds I I+dI
s s+ds
s s+dschange ofintensity
thermalemission
by
dIthermal
s s+ds
absorption
s s+dsin-scattering
dIin
s s+dsout-scattering
dIout
dIabsorbed
ò dΩ ò dΩ
Figure 1.3: Energy balance of the radiative transfer equation shown in graphical form.
1.2.3 The concept of optical thickness
It is possible to re-write the radiative transfer equation 1.1 in terms of a non-dimensional optical thickness τλ, which is defined as shown in equations 1.6 and 1.7. τλ can be seen analogously to the path s scaled by the extinction coefficient βλ.
dτλ = βλ ds (1.6)
1.2. Radiation heat transfer in participating media 8
= ò0
ds
λ λτ β s (1.7)
The RTE then takes the following form:
òb i i i i4π
d ˆ ˆ ˆ(1 ) ( ) ( , )dd 4π
λ λλ λ λ λ λ
λ
I ωω I I I Φ Ωτ
s s s (1.8)
1.2.4 On dropping the spectral subscript λ
In the remainder of this thesis the spectral subscript λ will frequently be omitted for brevity. Radiative properties generally are spectrally dependent and thus the spectral subscript is implicitly assumed.
1.2.5 On the scattering angle Θ
For further brevity the remainder of this thesis will frequently use the scattering angle Θ, which is the angle between s and is , with
i ˆcos( )Θ s s . An implication of this is that scattering is, at least on average, assumed to be symmetric in azimuthal (“circumferential”) direction around s .
9 Chapter 1. Introduction
1.3 The context of solar energy
sun
concentrator(optional)
cavity receiver(optional)
participatingmedium
• reactant / absorber(ZnO, CaCO3, CxHy, …)• inert or catalytic
absorber (porousceramic, wire mesh, …)• …
solarradiation
thermalradiation
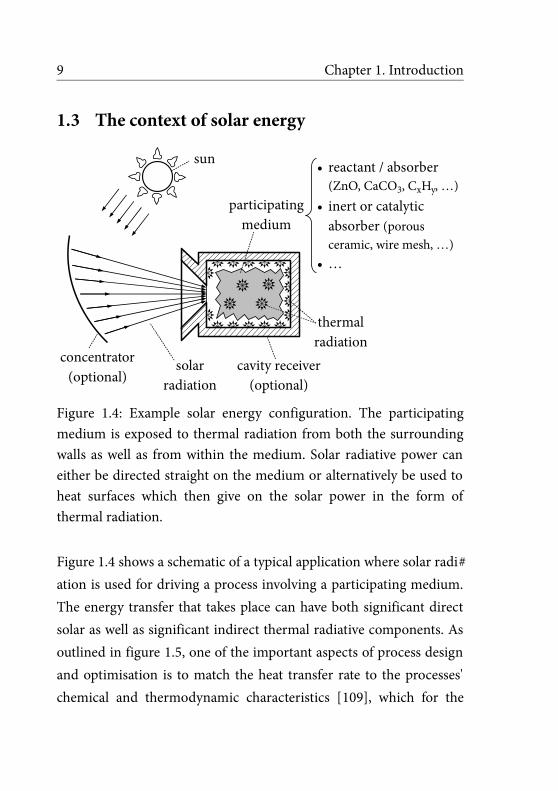
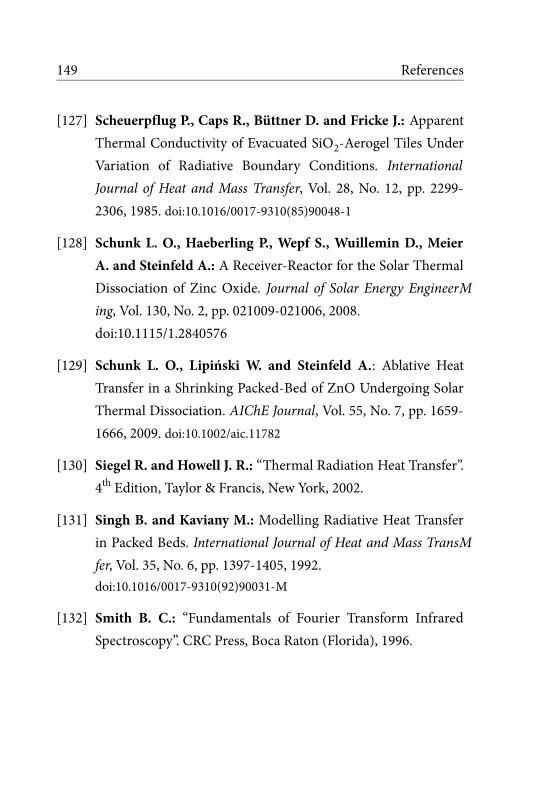
Figure 1.4: Example solar energy configuration. The participating medium is exposed to thermal radiation from both the surrounding walls as well as from within the medium. Solar radiative power can either be directed straight on the medium or alternatively be used to heat surfaces which then give on the solar power in the form of thermal radiation.
Figure 1.4 shows a schematic of a typical application where solar radiation is used for driving a process involving a participating medium. The energy transfer that takes place can have both significant direct solar as well as significant indirect thermal radiative components. As outlined in figure 1.5, one of the important aspects of process design and optimisation is to match the heat transfer rate to the processes' chemical and thermodynamic characteristics [109], which for the
1.3. The context of solar energy 10
part involving radiative heat transfer requires knowing the radiative transport properties described in chapter 1.2.
solarenergy
radiativeenergy
processparticipating
medium
radiative heat transfer route
task:
requiresradiative properties
κ, σs, β, ω, Φ
matchradiative heattransfer rate
processdynamics
Figure 1.5: The radiative heat transfer route showing that radiative properties are required for process design and optimisation.
As the solar energy applications involving participating media suitable for modelling with the radiative transfer equation (1.1, 1.8) are numerous and diverse, it will first be tried to give a unified generalised overview before moving on to a more specific review of applications. In this respect figure 1.6 is an attempt to highlight the core functions and components.
11 Chapter 1. Introduction
solar energy
receivers
participatingmedia
porousmaterials
reactants
semi-transparentmaterials
absorbers
for
• power generation• fuel production• production of
commodities• desalination• detoxification• …
Figure 1.6: Radiatively participating media and the context of solar energy applications.
Participating media typically are part of a receiver absorbing direct solar and indirect thermal energy — take the cavity in figure 1.4 for example. As such the absorber / receivers can be either inert bodies that get heated up and pass on the thermal energy or, alternatively, the absorbers themselves can be reactants or catalyst carriers used directly in chemical processes. The involved participating media can, in principle, consist of any sort of solid ÷ gas ÷ liquid material combination, provided that radiation is able to significantly penetrate the medium, which in turn requires that at least one phase is non-opaque, semi-transparent. The materials frequently constitute porous structures such as fluidised and packed beds, aerosol flows, foams, wire meshes, micro channels and other configurations.
1.3. The context of solar energy 12
In the following an overview of processes in the field of high-temperature solar thermo-chemistry, which are this thesis' primary target (figure 1.7), as well a selection of processes in additional fields will be given.
primary target
radiative properties ofmaterials used in high-temperature
solar thermo-chemical processes
Figure 1.7: This thesis' primary target.
As the name implies, high-temperature solar thermo-chemical processes involve running chemical reactions occurring at high temperatures in the range of 1000 K ÷ 2000 K and above, thereby using solar energy as a source of endothermic process heat [134]. While the production of solar fuels such as hydrogen and synthesis gas tends to be the most highlighted application, other uses, for example the production of general chemical commodities such as lime [86] or the recycling of waste [125], are possible as well and frequently occur in combination with producing fuels [38, 63, 133, 136].
Specific applications of radiation heat transfer modelling in participating media occurring in high-temperature solar thermo-chemistry include: Clouds and aerosols made of particles such as carbonaceous-compounds [26, 61, 75, 87] and metal-oxides [39, 40]; Packed beds of zinc-oxide [129] and carbon-based feedstocks [48,
13 Chapter 1. Introduction
113]; Fluidised beds made of calcium carbonate [103] and coal [62, 144]; Carbon slurries [149]; Porous foams as absorbers and catalyst carriers for the cracking of methane [111].
Examples of additional solar applications with radiatively participating media that are not limited to high-temperature thermochemistry are: The analysis of porous high-temperature insulating materials consisting of a semi-transparent solid phase [82]; Materials for volumetric receiver-absorbers such as foams [117], cellular structures [37], wire meshes [49] and gas-particle suspensions [91]; The study of radiation heat transfer in photobio- and photocatalytic reactors [4, 5], which have applications in the field of growing algae for producing solar fuels [98, 118], directly producing hydrogen [3, 11] or in the context of photocatalysis for wastewater treatment [3, 77].
1.4 Determination of radiative transport properties
In this sub-chapter a brief introduction to the methods for determining radiative transport properties will be given. An extensive treatment of the subject matter can be found in the reviews of Baillis and Sacadura [7], Viskanta and Mengüç [143] and in their respective citations.
1.4.1 Theoretical and numerical predictive
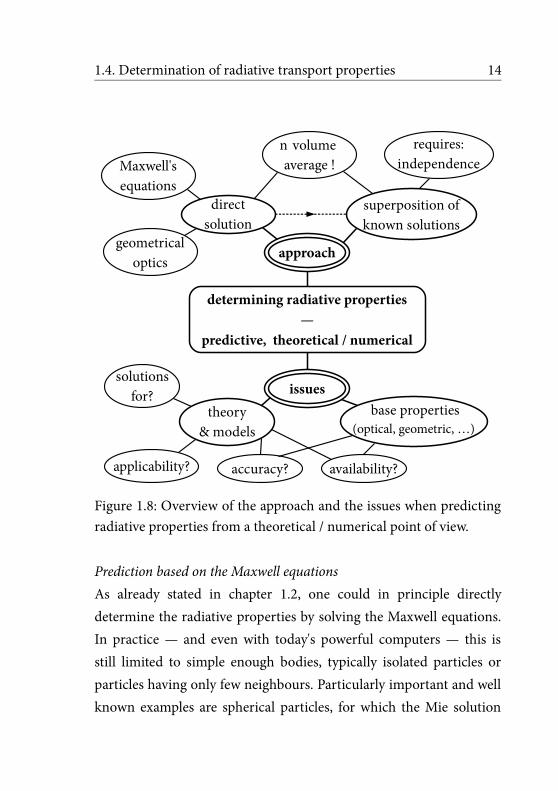
Figure 1.8 gives an overview of the main theoretical- / numerical approaches and their shortcomings.
1.4. Determination of radiative transport properties 14
accuracy?
determining radiative properties—
predictive, theoretical / numerical
issues
applicability?
solutionsfor?
theory& models
availability?
base properties(optical, geometric, …)
Maxwell'sequations
geometricaloptics
directsolution
requires:independence
approach
superposition ofknown solutions
→ volume average !
Figure 1.8: Overview of the approach and the issues when predicting radiative properties from a theoretical / numerical point of view.
Prediction based on the Maxwell equationsAs already stated in chapter 1.2, one could in principle directly determine the radiative properties by solving the Maxwell equations. In practice — and even with today's powerful computers — this is still limited to simple enough bodies, typically isolated particles or particles having only few neighbours. Particularly important and well known examples are spherical particles, for which the Mie solution
15 Chapter 1. Introduction
exists [12, 90], and infinitely long cylinders [60, 141]. Note that it is possible to get computational solutions for non-spherical particles and particle compounds by applying more advanced numerical methods for solving electromagnetic fields [93].
Prediction based on geometrical opticsGeometrical optics can be applied in situations where the size of the structure of interest is much larger than the wavelength. It may also be applicable in cases where diffraction and interference effects are simple enough to be combined with a geometrical optics approach, for example by introducing a corrective term [137]. A number of bodies ranging from simple, such as large spheres [147], to complex, such as large and porous structures, have been covered in literature (see Tancrez and Taine [137] for an overview). A particularly powerful tool is Monte Carlo ray-tracing (MCRT), which when combined with accurate three-dimensional geometry data can be used to determine the volume averaged radiative properties of highly complex structures. An example for this given in Petrasch et al. [111], where the 3D geometry of reticulate porous ceramics was obtained by tomography scans and then analysed by MCRT.
Prediction by volume averaging — a cloud of particlesOne way of obtaining volume (i.e. spatial) averaged radiative properties is by directly solving radiation heat transfer through an entire structure and then determining the radiative properties leading to the equivalent effect. In case of geometrical optics based Monte Carlo ray-tracing this consists of averaging each ray absorption and scattering event. Alternatively the effects of isolated objects can be superim
1.4. Determination of radiative transport properties 16
posed on a per volume basis. A textbook example for this is a cloud of non-uniformly sized particles (chapter 11.3 in Modest [97]). The main requirement is independent scattering, i.e. that the particles do not influence each other, which mainly depends on the inter-particle spacing and the particle size, both with respect to wavelength [138].
1.4.2 The case for measurements
Despite their capabilities, there still are a number of issues which limit the practical applicability of predictive models for radiative properties. In the following some of these limitations will be discussed as illustrated in the lower half of figure 1.8:
Lack of underlying (or “base”) material propertiesFor the the Maxwell based approaches such as the Mie solution this is mainly the complex index of refraction (or alternatively the magnetic permittivity and electric susceptibility). In case of the geometric optics approach both the complex index of refraction (→ fresnel laws) as well as surface properties such as the reflectivity can be of concern. Although fairly large collections of optical properties exist [108, 139] and sometimes can also be found in specific material data sheets, it often occurs that many properties either miss entirely, or, when available, lack scope, for example by being limited to certain wavelengths or restricted to certain surface roughnesses. Investigators are therefore often forced to make somewhat speculative assumptions and data extrapolations such as in Dombrovsky et al. [31].
17 Chapter 1. Introduction
Lack of and uncertainty in model scope, solutions and applicabilityWhen models are applied to real world engineering materials there frequently is a need for simplifying assumptions, for example with respect to a particle's shape or the effect of impurities in semi-transparent materials. There may also be cases where models either do not exist, are disputed or are at the limit of their applicability range. An example for a critical case is dependent scattering, a condition for which only few theoretical models exist, with most of them being rather narrow in scope [138]. One option is to resort to theoretical simplifications and extreme end idealisations, which can help in giving an understanding of where the true result might lie, especially when combining this with parameter studies as in Haussener et al. [47]. Although this can allow narrowing down the expected outcome it may still not always be possible nor straightforward to quantify the difference between the idealised and the real world's result.
Uncertainty in the material's geometry and constitutionInformation about a material's geometrical size, constitution (species), micro-pores, impurities, particle coagulation may not always be available, be incomplete or be burdened with a large uncertainty. A particular example for this are the particle size measurements performed in the framework of studying packed beds of ZnO [21]. There the particle size distribution was measured by a laser scattering / laser diffraction type device (Horiba LA-950), an instrument which does not necessarily return the true particle size distribution but rather an idealised derived one, suitable mainly for comparative studies and not for situations where quantitative accuracy is required [71, 89].
1.4. Determination of radiative transport properties 18
The case for measurementsThe case for measurements was made in both review papers of Baillis and Sacadura [7] / Viskanta and Mengüç [143], with the respective authors arguing along the lines of the above as well as highlighting additional points, most notably the lack of data at high temperatures and the need for further development of good inverse solution techniques for analysing measured data. It further was observed [7, 143], that while a lot of work had been done on the theoretical side, there still was a lack of good quality measurements covering a wide range of in- and output data that allows for determining reliable radiative properties and also for verifying mathematical models. Based on the present author's observations, the lack of good measurements and of good inverse solution approaches is a situation that, although new experimental contributions have been made, still hasn't changed much in the last ten years since [7] was published.5
As a last argument in favour of measurements: The experiment is an integral part in the knowledge building process of the physical and engineering sciences, and even the most sophisticated theoretical models and theories must be subjected to some form of experimental verification [52].
5 At least with respect to radiation heat transfer in very dense and complex media. It is to say that certain fields such as the study of radiation heat transfer in biological tissue appear to have established both large collections of experimental data as well as standard approaches to measurement and inverse solution [140].
19 Chapter 1. Introduction
In conclusion (figure 1.9) — There still is an ongoing need for:(a) measurements both at ambient and at high temperaturesand(b) development in the field of inverse solution techniques suitable
for practical measurement data.
need for
temperature
spectral radiativeproperties
ambient high
inverse solutiontechniques
measurementfacilities
Figure 1.9: On the still ongoing need for measurements and inverse solution techniques.
1.4.3 Experimental determination
Experimental determination of radiative properties usually consists of the two steps shown in figure 1.10. First the actual measurement in which input and output data is obtained by exposing a number of samples to radiation, typically a near-parallel beam, and then measuring a part of the emanating radiation. In a second step the measurement data must be analysed and the radiative properties extracted. A detailed discussion of both steps will follow in chapter 2.
1.4. Determination of radiative transport properties 20
participatingmedium
radiativeinput
radiative output
Step 1: Measurement Step 2: “Inverse” analysis
raw data
physicalmodel
mathematicalsolution
Figure 1.10: The two steps for experimental determination of radiative properties
1.4.4 Limiting assumptions and requirements
This thesis is in the first place concerned with obtaining radiative transport property data useful for engineering purposes. Therefore two main assumptions and a number of requirements are made with respect to the investigated materials:(a) Pseudo-homogeneous / pseudo-continuous samples
A given material's samples and the subsequent applications of the deduced radiative properties are required to allow for a volume averaged treatment. As a consequence the resulting properties will be constant throughout the medium and the medium can therefore be treated as pseudo-continuous / pseudo-homogeneous6. This in turn requires that the size, shape and composition
6 In this thesis pseudo-continuous is seen as equivalent to pseudo-homogeneous and therefore both terms will be used interchangeably.
21 Chapter 1. Introduction
of the material's local constituents (grains, cells, struts, …) do not systematically in- or decrease in any direction. Note that a periodic distribution of the constituents is not the same as a quasi monotone-systematic change and therefore is seen as valid for averaging. Varying properties are required to be modelled by splitting into different media.
(b) Applicability of the RTEIt is assumed that the radiative transfer equation as outlined in (1.1) and (1.8) is valid for the investigated materials, provided that the measurements were performed and averaged over a volume large enough to be considered pseudo-homogeneous.
(c) Existence of a volume (spatial) averageIt is further assumed that volume (spatial) average radiative properties do exist in a way that the average radiative transport behaviour can be calculated with the RTE. This is again provided that the material can on average be seen as pseudo-homogeneous.
Both assumptions are further assumed to be valid regardless of the material's local homogeneity and also regardless of the sample thickness st, at least as long as the latter is much larger than the wavelength st >> λ.
Note that the whens and abouts regarding the RTE's validity for different cases is a topic still discussed in literature [45, 53, 70, 81]. The assumptions and requirements made in this thesis mainly draw from what can be found in the works of Baillis and Sacadura [7], Kaviany [59], Viskanta and Mengüç [143], and the references therein.
Chapter 2
Measurement and evaluation strategies
2.1 Introduction
The intention of this chapter is to build an understanding of possible experimental paths by reflecting on strategies and approaches for determining radiative properties by measurement. This includes a discussion of selected types of measurement set-ups, the kind of data that is obtained, the data evaluation and the specifics as well as limitations of the resulting radiative properties. It is not the aim to give a complete review of all possible options but rather to set the emphasis on reflecting and understanding.
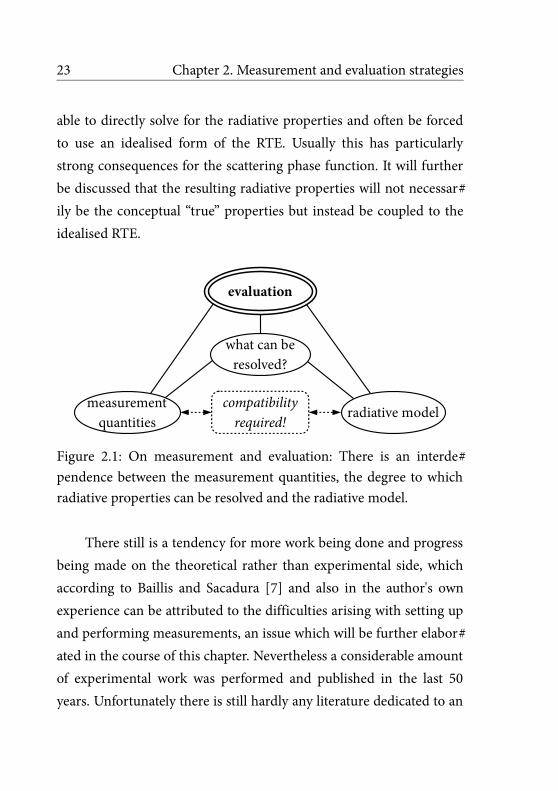
Figure 2.1 serves as an overview of the core aspects of measurement and evaluation which will be worked out in further detail in the course of this chapter. One of the important things to realise is that the measurement quantities dictate the degree to which radiative properties can be resolved. It will be shown, that the resolution not only depends on the measurement facilities, but also strongly depends on the investigated material and specifically its samples. A further consequence of this is that one will only in special cases be
23 Chapter 2. Measurement and evaluation strategies
able to directly solve for the radiative properties and often be forced to use an idealised form of the RTE. Usually this has particularly strong consequences for the scattering phase function. It will further be discussed that the resulting radiative properties will not necessarily be the conceptual “true” properties but instead be coupled to the idealised RTE.
measurement
quantitiesradiative model
evaluation
what can beresolved?
compatibilityrequired!
Figure 2.1: On measurement and evaluation: There is an interdependence between the measurement quantities, the degree to which radiative properties can be resolved and the radiative model.
There still is a tendency for more work being done and progress being made on the theoretical rather than experimental side, which according to Baillis and Sacadura [7] and also in the author's own experience can be attributed to the difficulties arising with setting up and performing measurements, an issue which will be further elaborated in the course of this chapter. Nevertheless a considerable amount of experimental work was performed and published in the last 50 years. Unfortunately there is still hardly any literature dedicated to an
2.1. Introduction 24
extensive yet concise and boiled down treatment of measuring radiative transport properties in participating media (i.e. an additional motivation for writing this chapter). In this respect the author found the work of Tuchin [140], who summarised the measurement methods for radiative properties of biological tissue in a dedicated chapter, to be a worthwhile and rewarding read. Although tissue is different from the more high-temperature oriented materials targeted both by this thesis and also by many researchers in the heat transfer community, most of the measurement and analysis methods used in radiation heat transfer are strikingly similar to the ones presented by Tuchin [140]. Other works giving information about experimental aspects that go beyond just the specific problem studied by the respective researchers are mainly associated with Sacadura, Baillis and co-workers [8, 99, 123, 124].
2.2 Measurement quantities
2.2.1 Spectral resolution
Spectral resolution is obtained by measuring the radiative power as a function of a single wavelength or a sufficiently narrow wavelength band. A selection of possible ways to achieve this are: (a) Directly use a laser operating at a single mode, which for most applications can be seen as perfectly monochromatic; (b) Use a narrow-band source, for example an LED with a 99% bandwidth of ± 50 nm; (c) Use a broad-band source and separate the wavelength by some sort of filter or spectral resolver.
25 Chapter 2. Measurement and evaluation strategies
An extended discussion on obtaining spectrally resolved data is given in appendix C.
2.2.2 Sample shape
Solid samples, including packed-beds, mostly tend to be shaped as plane-parallel slabs, while particulate clouds often are confined to a cylindrical shape. It is commonplace to vary the thickness of the plane-parallel slabs in order to have another measurement parameter. Certain sample materials require using a transparent supporting structure — glass windows for example. In some cases an index matching liquid is used in order to compensate for changes in refractive index (examples: [35, 148]).
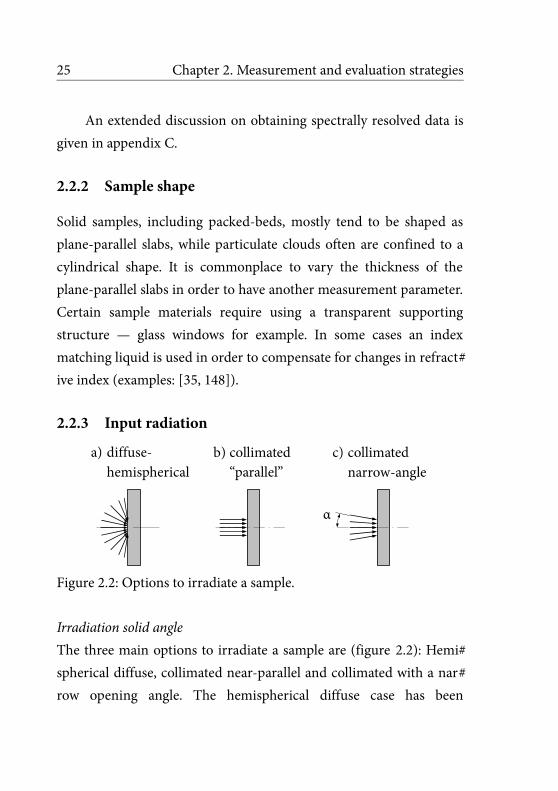
2.2.3 Input radiation
α
a) diffuse-hemispherical
b) collimated“parallel”
c) collimatednarrow-angle
Figure 2.2: Options to irradiate a sample.
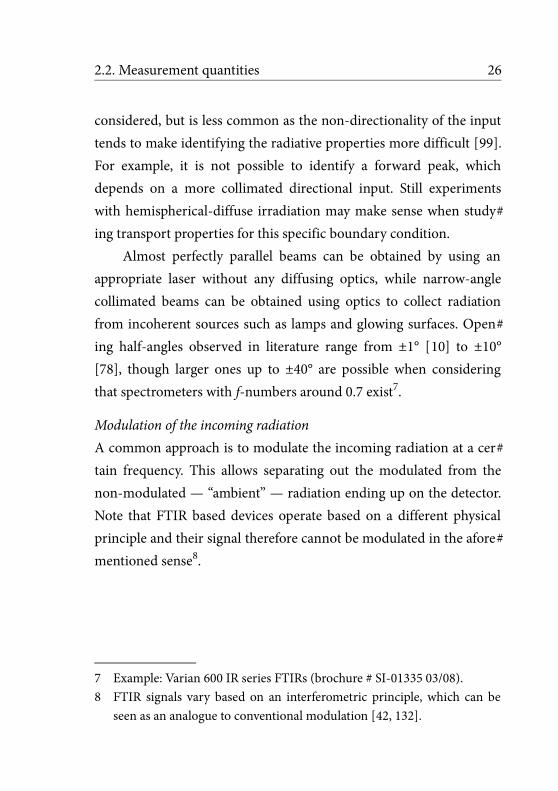
Irradiation solid angleThe three main options to irradiate a sample are (figure 2.2): Hemispherical diffuse, collimated near-parallel and collimated with a narrow opening angle. The hemispherical diffuse case has been
2.2. Measurement quantities 26
considered, but is less common as the non-directionality of the input tends to make identifying the radiative properties more difficult [99]. For example, it is not possible to identify a forward peak, which depends on a more collimated directional input. Still experiments with hemispherical-diffuse irradiation may make sense when studying transport properties for this specific boundary condition.
Almost perfectly parallel beams can be obtained by using an appropriate laser without any diffusing optics, while narrow-angle collimated beams can be obtained using optics to collect radiation from incoherent sources such as lamps and glowing surfaces. Opening half-angles observed in literature range from ±1° [10] to ±10° [78], though larger ones up to ±40° are possible when considering that spectrometers with f-numbers around 0.7 exist7.
Modulation of the incoming radiationA common approach is to modulate the incoming radiation at a certain frequency. This allows separating out the modulated from the non-modulated — “ambient” — radiation ending up on the detector. Note that FTIR based devices operate based on a different physical principle and their signal therefore cannot be modulated in the aforementioned sense8.
7 Example: Varian 600 IR series FTIRs (brochure # SI-01335 03/08).8 FTIR signals vary based on an interferometric principle, which can be
seen as an analogue to conventional modulation [42, 132].
27 Chapter 2. Measurement and evaluation strategies
2.2.4 Output radiation
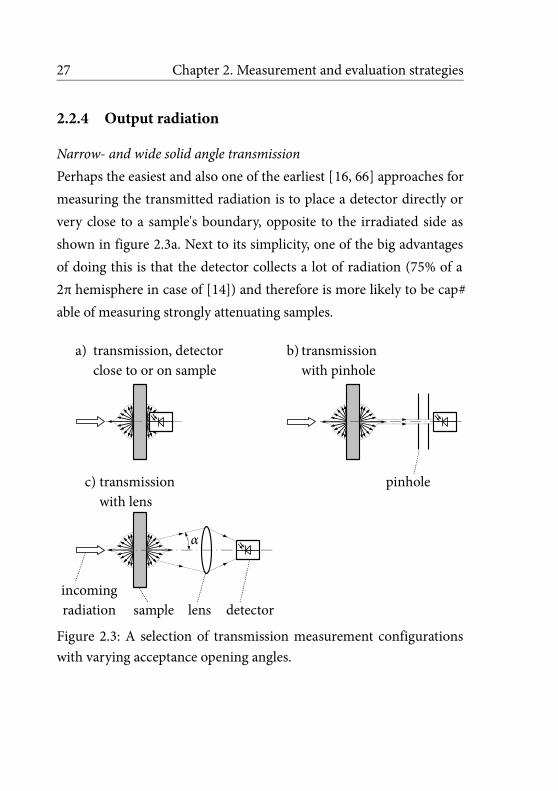
Narrow- and wide solid angle transmissionPerhaps the easiest and also one of the earliest [16, 66] approaches for measuring the transmitted radiation is to place a detector directly or very close to a sample's boundary, opposite to the irradiated side as shown in figure 2.3a. Next to its simplicity, one of the big advantages of doing this is that the detector collects a lot of radiation (75% of a 2π hemisphere in case of [14]) and therefore is more likely to be capable of measuring strongly attenuating samples.
c) transmissionwith lens
α
sample lens detector
pinhole
b) transmissionwith pinhole
a) transmission, detectorclose to or on sample
incomingradiation
Figure 2.3: A selection of transmission measurement configurations with varying acceptance opening angles.
2.2. Measurement quantities 28
The opposite case of a very narrow acceptance angle can be achieved by using pinhole arrangements, figure 2.3b. In this case very little radiation is collected and highly sensitive detectors such as photomultiplier tubes are often required (compare [104]). Due to the potentially very small acceptance angles such devices are often suited for measuring extinction coefficients [12, 79], though it must be noted that measuring extinction has its pitfalls (picked up in chapter 2.5.3).
Intermediate acceptance half-angles result when using collecting optics (lenses and spherical mirrors). It is common for the receiving and the irradiation optics to be arranged mirror-symmetrically around the samples and the acceptance angles in the receiving case, figure 2.3c, are therefore of similar order as in the irradiating case, figure 2.2c, which are around ±1° ÷ ±10° with extreme settings spanning up to ±40°. Note that various combinations of lenses, pinholes, diaphragms and other optical components are also possible. An advantage of transmission only measurements is that non-hemispherical, approximately collimated transmission is the standard mode of operation for most commercial spectrometers, with some even offering parallel beam accessories9.
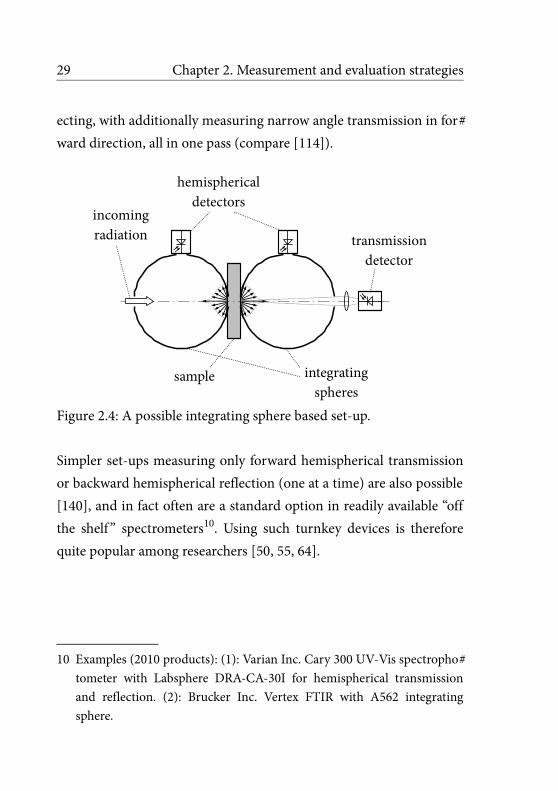
Hemispherical transmission and reflectionFigure 2.4 shows a typical integrating sphere set-up which allows simultaneous hemispherical measurements in forward and backward dir
9 Example (2010): Brucker Inc. A480 parallel beam transmission accessory.
29 Chapter 2. Measurement and evaluation strategies
ecting, with additionally measuring narrow angle transmission in forward direction, all in one pass (compare [114]).
sample
incomingradiation
hemisphericaldetectors
transmissiondetector
integratingspheres
Figure 2.4: A possible integrating sphere based set-up.
Simpler set-ups measuring only forward hemispherical transmission or backward hemispherical reflection (one at a time) are also possible [140], and in fact often are a standard option in readily available “off the shelf ” spectrometers10. Using such turnkey devices is therefore quite popular among researchers [50, 55, 64].
10 Examples (2010 products): (1): Varian Inc. Cary 300 UV-Vis spectrophotometer with Labsphere DRA-CA-30I for hemispherical transmission and reflection. (2): Brucker Inc. Vertex FTIR with A562 integrating sphere.
2.2. Measurement quantities 30
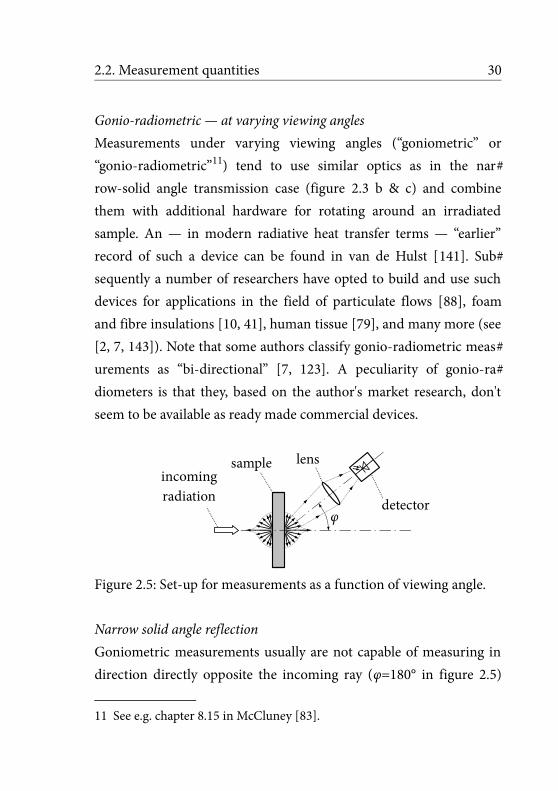
Gonio-radiometric — at varying viewing anglesMeasurements under varying viewing angles (“goniometric” or “gonio-radiometric”11) tend to use similar optics as in the narrow-solid angle transmission case (figure 2.3 b & c) and combine them with additional hardware for rotating around an irradiated sample. An — in modern radiative heat transfer terms — “earlier” record of such a device can be found in van de Hulst [141]. Subsequently a number of researchers have opted to build and use such devices for applications in the field of particulate flows [88], foam and fibre insulations [10, 41], human tissue [79], and many more (see [2, 7, 143]). Note that some authors classify gonio-radiometric measurements as “bi-directional” [7, 123]. A peculiarity of gonio-radiometers is that they, based on the author's market research, don't seem to be available as ready made commercial devices.
φ
sample lens
detector
incomingradiation
Figure 2.5: Set-up for measurements as a function of viewing angle.
Narrow solid angle reflectionGoniometric measurements usually are not capable of measuring in direction directly opposite the incoming ray (φ=180° in figure 2.5)
11 See e.g. chapter 8.15 in McCluney [83].
31 Chapter 2. Measurement and evaluation strategies
because the receiving optics will block out the incoming ray. There can be situations however, for which the 180° direction is important as it can contain a lot of energy which should be measured in order to be able to properly close the energy balance [21]. A discussion of ways to overcome this is given in appendix C.2.
Spatial distribution
sample
lens detector
incomingradiation
Δx
Figure 2.6: Measuring the signal as a function of spatial location.
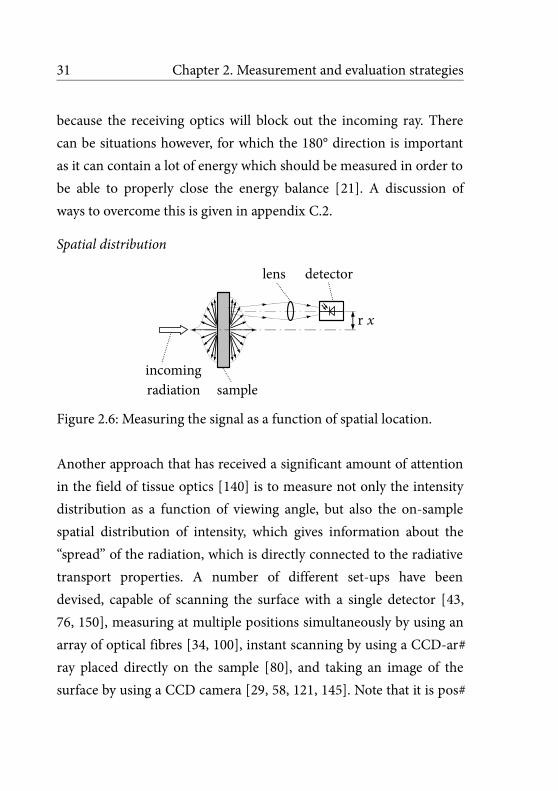
Another approach that has received a significant amount of attention in the field of tissue optics [140] is to measure not only the intensity distribution as a function of viewing angle, but also the on-sample spatial distribution of intensity, which gives information about the “spread” of the radiation, which is directly connected to the radiative transport properties. A number of different set-ups have been devised, capable of scanning the surface with a single detector [43, 76, 150], measuring at multiple positions simultaneously by using an array of optical fibres [34, 100], instant scanning by using a CCD-array placed directly on the sample [80], and taking an image of the surface by using a CCD camera [29, 58, 121, 145]. Note that it is pos
2.2. Measurement quantities 32
sible to measure on both the irradiated and the non-irradiated side of the sample.
2.2.5 Temperature dependence — Heated samples
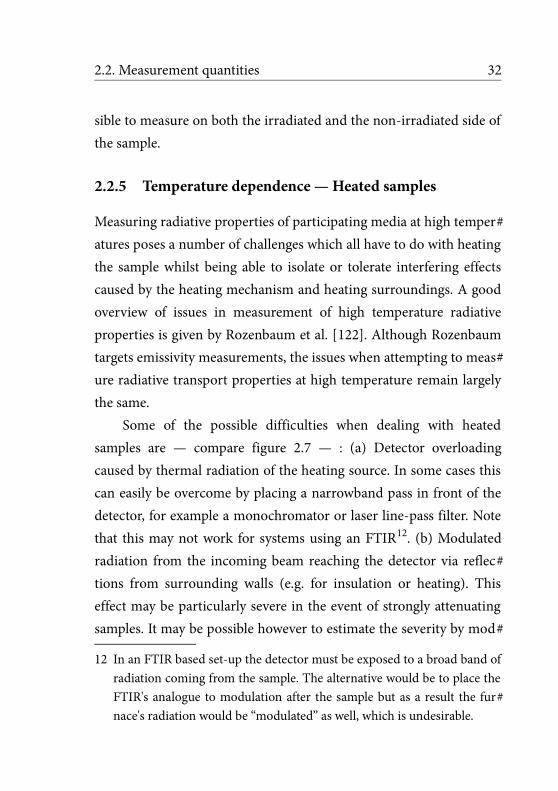
Measuring radiative properties of participating media at high temperatures poses a number of challenges which all have to do with heating the sample whilst being able to isolate or tolerate interfering effects caused by the heating mechanism and heating surroundings. A good overview of issues in measurement of high temperature radiative properties is given by Rozenbaum et al. [122]. Although Rozenbaum targets emissivity measurements, the issues when attempting to measure radiative transport properties at high temperature remain largely the same.
Some of the possible difficulties when dealing with heated samples are — compare figure 2.7 — : (a) Detector overloading caused by thermal radiation of the heating source. In some cases this can easily be overcome by placing a narrowband pass in front of the detector, for example a monochromator or laser line-pass filter. Note that this may not work for systems using an FTIR12. (b) Modulated radiation from the incoming beam reaching the detector via reflections from surrounding walls (e.g. for insulation or heating). This effect may be particularly severe in the event of strongly attenuating samples. It may be possible however to estimate the severity by mod
12 In an FTIR based set-up the detector must be exposed to a broad band of radiation coming from the sample. The alternative would be to place the FTIR's analogue to modulation after the sample but as a result the furnace's radiation would be “modulated” as well, which is undesirable.
33 Chapter 2. Measurement and evaluation strategies
elling the radiative heat transfer of the modulated beam in the furnace.
sample lens detectormodulatedradiation
reflectionat wall
thermalemission
(hot) wall
Figure 2.7: Possible issues when heating samples.
In the following the pros and cons of a number of approaches to get around the aforementioned issues will be presented in the context of work performed in literature. It will be said straight away that no truly satisfying, more universally applicable approach was found.
Heating with a CO2 laserThis approach was pursued by Baillis and Sacadura with co-workers Lopes, Delmas and Moura [72, 73]13. The big advantage is that there is no need for furnace walls and the sample can therefore stand freely in space without interfering wall reflections. An additional benefit is that the power from the CO2 laser heating source occurs at a single wavelength (typically 10.6 μm) and can be separated out by placing a narrow-band line filter in front of the detector, thereby avoiding
13 A number of other groups have used CO2 lasers as well, but not explicitly for radiative transport properties. See Rozenbaum [122] for an overview.
2.2. Measurement quantities 34
detector overloading from the surrounding radiation. Disadvantages are temperature gradients in the sample, a subsequent non-uniform temperature distribution, thermal stresses and safety issues caused by the high power laser beam.
Heating with a furnaceLinford et. al. [68] used a furnace to study whether the radiative properties of insulation were temperature dependent by measuring the change of amount transmitted as a function of temperature. No special measures to deal with unwanted effects caused by the furnace walls were taken, but the radiative properties were found to be independent of temperature.
Cabannes [13] determined the temperature dependent absorption though single crystals of metal-oxides based on reflection and transmission measurements by using an FTIR spectrometer. Radiation from the furnace was separated out by an FTIR alignment technique, though it remains unclear how the diffuse part of the furnace radiation was dealt with.
Mittal, Gore and Viskanta [96] studied radiation emitted from a cellular ceramic placed in a furnace. Radiation from the walls was avoided by using a sight-limiting tube.
One-sided heating or coolingJones et. al [57] got around the problems caused from heating surfaces by making the heating element an integral part of their analysis. In their work the radiation from a hot plate was seen as the radiative source. A packed bed of steel spheres was placed directly on the hot plate and the radiative properties of the packed bed analysed by
35 Chapter 2. Measurement and evaluation strategies
measuring the spectrally resolved angular distribution of radiation emitted from the top of the bed. Disadvantages of this approach are a non-uniform temperature distribution in the sample, the non-directionality of the thermally emitting source and the need to take conductive and convective effects into account as well.
Yamada et al [146] took a similar approach by having a heated fluidised bed of particles which on one side is exposed to a cold wall. Measuring the radiative power flowing from the fluidised bed to the cold wall then allowed deducing information about the bed's radiative properties.
Alternative: Calorimetric heat transfer / apparent thermal conductivityThe approach here is to measure the heat flux between a hot and a cold wall with an embedded participating medium and combine this with a heat transfer model that includes a radiative component. A well known model for this case is the Rosseland approximation (diffusion approximation) for optically thick media [97, 130], which uses an extinction coefficient as the radiative parameter. Limitations of the approach are that only few radiative properties are obtained — i.e. mainly the extinction coefficient β —, that there is little to no spectral information, and that the radiative properties represent a mean between the hot and cold wall temperature. Materials studied with the approach include SiO2 aerogels [127], glass fibre insulations [120] and reticulate porous zirconia [56].
2.3. Important approximative models 36
2.3 Important approximative models
2.3.1 On the importance of approximative models
Approximate models are important for the following reasons:(a) Measurements may not always be capable of revealing all neces
sary details to allow fully resolving all radiative properties. In particular the scattering phase function may in many cases only be resolvable for the special case of single scattering measurements (compare chapter 2.4.2).
(b) A good mathematical fit should ideally only result in a single unique, stable and well conditioned solution. Adding additional parameters may result in a better fit and greater degree of detail, but can in turn also lead to more than one solution to the system of equations or even destabilise the solution finding algorithm, both of which are undesirable. Approximations may help with stabilising the problem and reducing the number of fit parameters.
A more extensive discussion of the above will follow in chapter 2.4.
2.3.2 Transport approximation
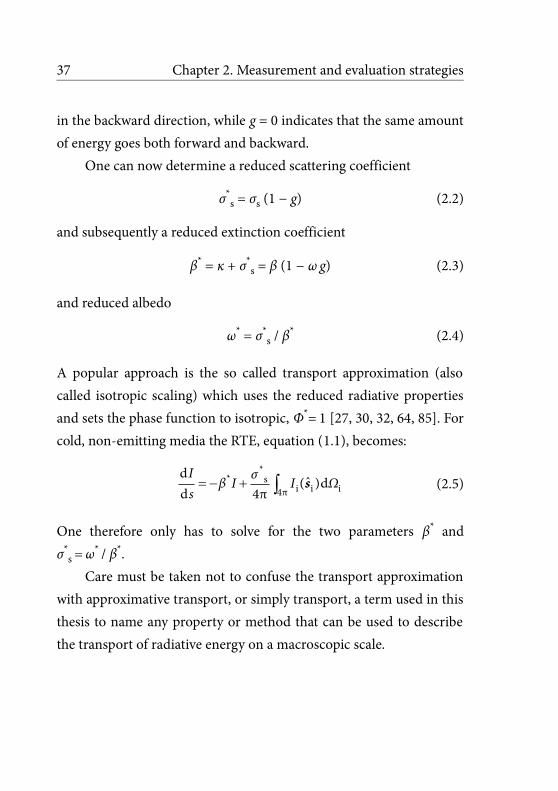
It is possible to define an asymmetry factor g [97],
4π1 )
4πg Φ(Θ)= ò=Θcos( ) cos(Θ dΩ (2.1)
with -1 ≤ g ≤ 1, and the sign if g indicating in which direction — forward or backward — the net transport of energy takes place. If positive non-zero, g > 0, then more energy is scattered in the forward than
37 Chapter 2. Measurement and evaluation strategies
in the backward direction, while g = 0 indicates that the same amount of energy goes both forward and backward.
One can now determine a reduced scattering coefficient
σ*s = σs (1 − g) (2.2)
and subsequently a reduced extinction coefficient
β* = κ + σ*s = β (1 − ω g) (2.3)
and reduced albedo
ω* = σ*s / β
* (2.4)
A popular approach is the so called transport approximation (also called isotropic scaling) which uses the reduced radiative properties and sets the phase function to isotropic, Φ*= 1 [27, 30, 32, 64, 85]. For cold, non-emitting media the RTE, equation (1.1), becomes:
= - + ò*
* si i i4π
d ˆ( )dd 4π
I σβ I I Ωs
s (2.5)
One therefore only has to solve for the two parameters β* and σ*
s = ω* / β
*.Care must be taken not to confuse the transport approximation
with approximative transport, or simply transport, a term used in this thesis to name any property or method that can be used to describe the transport of radiative energy on a macroscopic scale.
2.3. Important approximative models 38
2.3.3 Dirac delta approximations
A number of media can have distinct forward and backward peaks, a situation where the standard isotropic scaling approach can give considerable errors [97]. A way around this is to introduce Dirac delta phase function approximations, which when having both forward and backward peaks look as follows (compare chapter 11.9 in Modest [97]):
In equation (2.6) ffwd is the forward Dirac and fbwd is the backward Dirac scattered fraction. Note that the reduced scattering phase function Φ* does not necessarily have to be isotropic. Furthermore Φ*(0) and Φ*(π) need not be 0. The main condition is that
0 ≤ ffwd + fbwd ≤ 1 (2.7)
and
0 ≤ ffwd ≤ 1; 0 ≤ fbwd ≤ 1 (2.8)
An interesting feature of the forward Dirac peak is that it freely scales the scattering coefficient with no change in the resulting net transport of radiative energy. One can therefore introduce a forward Dirac reduced scattering coefficient,
σ*s = σ*
s.0 (1 − ffwd) (2.9)
39 Chapter 2. Measurement and evaluation strategies
with σ*s.0 being the solution for ffwd = 0. Using σ*
s as determined from equation (2.9) will give valid results for all ffwd fulfilling equation (2.7), provided Φ* and fbwd are kept as for the solution with ffwd = 0 .
In the course of the work in packed beds of zinc-oxide particles (chapter 6 and reference [21]) the author found the forward scattered Dirac fraction to be a potentially disturbing fit parameter as it will result in an infinite number of identical solutions when not balanced with Φ*. It is therefore suggested to only use the forward scattered fraction as a fit parameter when the measurement data allows resolving ffwd in combination with simplifying the scattering phase function Φ*. In other words ffwd must be balanced by Φ* — the two are not independent. In the absence of other means for determining the for ward scattered fraction, the suggestion is to set ffwd = 0, with the consequence that the resulting extinction and scattering coefficients will be forward fraction reduced. An example based discussion of this is given in chapter 6.3.3.
Given a Dirac reduced scattering phase function Φ*(Θ) and a forward Dirac fraction ffwd three fit parameters remain: fbwd, κ and σ*
s . For a cold, non-emitting medium the RTE becomes
ò*
* si i i bwd i4π
d ˆ ˆ ˆ( ) ( , , )dd 4π
I σβ I I Φ f Ωs
s s s (2.10)
with σ*s according to equation (2.9), β* = κ + σ*
s and Φ according to equation (2.6).
In the absence of more information on the scattering phase function setting Φ*=1 (isotropic) can already give acceptably good
2.3. Important approximative models 40
results. In some cases, such as in Coray [21], it may also make sense to force the Dirac reduced asymmetry factor g*=0, with
4π1 )
4πg* Φ*(Θ)ò= cos(Θ dΩ (2.11)
On another note: A setting of fbwd=0, ffwd= g and Φ*=1 is equivalent to the transport approximation (chapter 2.3.2) [59].
2.4 Measurement and evaluation
2.4.1 Basic approach
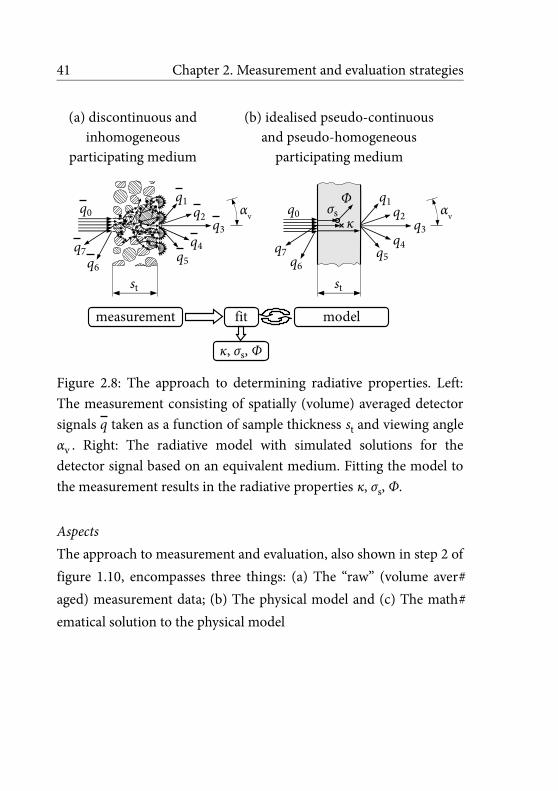
The basic approach to measurement and evaluation as pursued in the context of this thesis is, as outlined in figure 2.8: (a) Perform a measurement on what is locally a discontinuous and inhomogeneous medium; (b) Determine global average measurement signals q as a function of sample thickness st and viewing angle αv by scanning a large enough volume14; (c) Simulate radiative transfer through an idealised pseudo-continuous and pseudo-homogeneous participating medium of the same thicknesses st; (d) Determine the radiative properties from a best fit of the radiative model to the measurement data.
14 Ideally the criterion for large enough volume would be based on the resulting standard deviation of the mean values. In practice this ideal case may often be limited by the size and number of available samples as well as by the time available for taking measurements.
41 Chapter 2. Measurement and evaluation strategies
Figure 2.8: The approach to determining radiative properties. Left: The measurement consisting of spatially (volume) averaged detector signals q taken as a function of sample thickness st and viewing angle αv . Right: The radiative model with simulated solutions for the detector signal based on an equivalent medium. Fitting the model to the measurement results in the radiative properties κ, σs, Φ.
AspectsThe approach to measurement and evaluation, also shown in step 2 of figure 1.10, encompasses three things: (a) The “raw” (volume averaged) measurement data; (b) The physical model and (c) The mathematical solution to the physical model
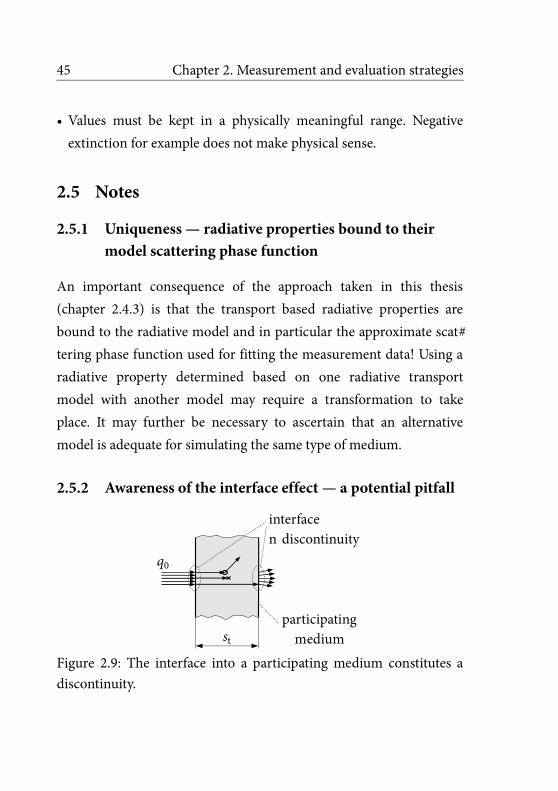
2.4. Measurement and evaluation 42
Measurement quantitiesThe base measurement quantities as used in this thesis are: The radiative input q0 and the volume averaged radiative output q(st, αv) as a function of sample thickness st and viewing angle αv .
2.4.2 The physical model — limitations to determining the scattering phase function
Experimental set-ups for measuring the scattering phase function have already been summarised in text books as early as van de Hulst's work from 1957 [141]. Further textbook summaries of a number of different approaches and variations to the measurement of scattering can be found in the works of Bohren and Huffman [12], Tuchin [140], Mishchenko and co-workers [93, 95], and Modest [97], just to name a few. It might seem therefore that measuring the scattering phase function should be a relatively straightforward and well established procedure. However, it is so only when the rays or electromagnetic waves reaching the detector are scattered just once — i.e. single scattering (first order scattering) must form the predominant part of the signal! Note that single scattering is not synonymous with a mono-disperse and homogeneous distribution of particles. Particles that do scatter may exhibit very different scattering patterns, which is perfectly valid for obtaining an average scattering phase function. The question of how many multiple scattering events can be tolerated in order to recover the scattering phase function is discussed and reviewed in Agarwal and Mengüç [2].
43 Chapter 2. Measurement and evaluation strategies
Once multiple scattering prevails angular (directional) measurements around a sample will no longer allow determining the scattering phase function from the measurement alone [2]. Quite contrary, an increasing number of scattering events will tend to lead to a decrease in directional information and an increase in isotropic distribution of radiation, which is why diffusion approximations tend to work well in the event of optically thick (highly scattering) samples [97]. It may therefore make sense to replace the scattering phase function with a radiative transport oriented approximation15, aiming at giving correct results for the net transport of radiative energy, rather than faithfully reproducing the scattering phase function (compare chapter 2.3). With respect to the materials investigated in this thesis, the main directional information observed by measurement consists of an occasional forward peak in direction of the incoming beam, with only little directional information being contained in the non forward and backward direction. This further explains why the integrating sphere based measurements outlined in chapter 2.2.4 can, in combination with forward and backward peak measurements, lead to very useful results.
2.4.3 The mathematical solution — “inverse” analysis
Inverse heat transfer problems in general [107] and inverse radiation heat transfer problems in particular [97] tend to be ridden with difficulties which have to do with their ill-posed nature. Ill-posed or ill-conditioned in this respect means that the problem does not neces
15 Not to be confused with the transport approximation (chapter 2.3.2).
2.4. Measurement and evaluation 44
sarily have a unique solution and that existing solutions are not necessarily stable. A review of inverse radiation heat transfer problems and methods relevant for this thesis is given by McCormick [84], with a particularly interesting and relevant investigation of the interplay of measurement quantities, analysis and numerical condition / well-posedness being given by Baillis, Sacadura and Moura [99, 123].
Due to the complexity of the subject matter this thesis takes a pragmatic approach based on the following principles:• The determined radiative properties and scattering phase function
must be capable of reproducing the net radiative energy transport on a macroscopic (“global”) over the sample scale, but not necessarily at the local microscopic level.◉ The resulting radiative properties and models will therefore be
called transport based properties.• The number of fit parameters should be kept at the bare minimum
that will allow resolving the measurement data.◉ Consequently complex scattering phase functions should be
avoided, except for the case where other reliable means to determine the scattering phase function exist.16
• “Competing” parameters that directly compensate each other are to be avoided by setting one of them to a fixed value. The main example for this is forward scattering, which competes with the scattering coefficient (explained in chapter 2.3.3).
16 For example: The Mie solution in combination with reliable particle size and complex refractive index information.
45 Chapter 2. Measurement and evaluation strategies
• Values must be kept in a physically meaningful range. Negative extinction for example does not make physical sense.
2.5 Notes
2.5.1 Uniqueness — radiative properties bound to their model scattering phase function
An important consequence of the approach taken in this thesis (chapter 2.4.3) is that the transport based radiative properties are bound to the radiative model and in particular the approximate scattering phase function used for fitting the measurement data! Using a radiative property determined based on one radiative transport model with another model may require a transformation to take place. It may further be necessary to ascertain that an alternative model is adequate for simulating the same type of medium.
2.5.2 Awareness of the interface effect — a potential pitfall
q0
participatingmediumst
interface→ discontinuity
Figure 2.9: The interface into a participating medium constitutes a discontinuity.
2.5. Notes 46
As outlined in chapter 2.4.1, the modelled participating medium is seen as pseudo-continuous and pseudo-homogeneous. The interface into the medium however represents a discontinuity. How this discontinuity has to be taken into account depends on the real world medium (figure 2.8a). As a rule of thumb, interface effect modelling should take into account how the input radiation q0 changes when passing into the medium and vice versa when passing out of the medium. In the following a number of approaches as used in literature and in this thesis will be presented.
Interface to an independently scattering medium with no change in the base refractive indexConditions: (i) scattering is independent and (ii) the index of refraction of the medium surrounding the scatterers is the same as the index of refraction outside the medium. Consequently scattering right at the boundary is identical to scattering inside the medium and radiation can directly pass in to and out of the medium without additional interface effects. An explicit mention of this assumption in literature can be found in the works of Baillis and co-workers [20, 64].
Interface to an independently scattering medium with a change in the base refractive index and a smooth surface of the mediumIn this case refraction and reflection at the smooth interface can be taken into account by using the Fresnel laws. Examples for the approach are the study of latex particles in a liquid suspension [2, 138], applications with biological tissue [17, 140] and slabs of glass or quartz containing bubbles [9].
47 Chapter 2. Measurement and evaluation strategies
Interface to a dependently scattering mediumIn the case of dependent scattering the scattering behaviour depends on a scatterer's surroundings. One could argue that the surroundings at the interface to the medium are different from the surroundings inside the medium. Scattering at the interface would therefore be dif ferent from inside the medium. For the case where no other means of determining this interface effect exists, the author's opinion is to judge where the dominant effect lies. If scattering inside the medium is predominant, for example due to a large optical thickness and high albedo, then any additional interface effect may well be negligible in comparison. The other question is whether the measurements would actually allow resolving additional parameters taking interface effects into account. If not, then measuring an interface effect is futile and the engineer better served by trying to approximate with a simpler model. Note that it may still make sense to apply the Fresnel laws in case passing the interface is also accompanied by a change in the host medium's refractive index.
Interface to a plane-cut medium consisting of an opaque and a void phase.An example for this are plane-cut reticulate porous ceramics (RPC) as studied by Coray et. al [24]. In the numerical analysis radiation is only allowed to start in the void phase. One can therefore argue, that for the experiment to be comparable, the radiation at the interface should be reduced by the fraction of the opaque phase. Note that the reducing fraction has a striking similarity to the parameter T0 used by Hendricks and Howell [51] in their work on RPCs.
2.5. Notes 48
General interfacesSo far no dedicated, systematic and more generalised treatment of interface effects in was found in literature. One could in principle resort to solving the Maxwell equations, but as explained in chapter 1.2.1 this is not necessarily straightforward. With respect to the present work the mainly important thing is that the result can be used for engineering purposes. This in the first place requires that the measured and modelled energy balance over a participating medium must match for a given application's parameter range.
2.5.3 Apparent extinction coefficients
q0
participatingmediumst
radiativeinput
remainingoutputq(st)
samplethickness
Figure 2.10: Radiative input and output for determining an apparent extinction coefficient
For a cold medium (Ib = 0) with no scattering into path s, equation (1.1) reduces to
= -dd
IβI
s (2.12)
49 Chapter 2. Measurement and evaluation strategies
Consequently the change in radiative intensity, which is approximately the change in radiative flux over a finite area and narrow solid angle becomes
I(s) = I0 exp(−β s) (2.13)
The flux q measured by a detector over a narrow solid angle is roughly proportional to the radiative intensity I, q ~ I. Therefore
q(st) ≈ q0 exp(−β** st) (2.14)
æ ö» - ç ÷
è ø
**
t 0
1 ln qβs q
(2.15)
with β** being an apparent extinction coefficient. It has already been noted by van de Hulst [141] that β** may also include in-scattering picked up by the detector. Consequently β** is not equivalent to a “true” extinction coefficient. Further note that β** is not necessarily constant for different thickness and it may therefore make sense to add an additional fit parameter such as T0 in q(st) / q0 ≈ T0 exp(−β**st) used by Hendricks and Howell [51] or a series of fit parameters Ai as used by Lipiński et al [69].
Chapter 3
Experimental set-ups
3.1 Introduction17
In the course of this thesis a number of different set-ups were developed and implemented. These are: (i) An initial transmission only set-up; (ii) The first “main” goniometric set-up used for the majority of the measurements; (iii) An adaptation of the “main” set-up for high-attenuation wide-angle transmission mode measurements; And (iv) a set of complementary, SNF co-funded, but not yet finalised set-ups capable of covering almost the entire spectral range of interest.
In the following chapters the set-ups will be presented in the order of their importance.
3.2 Current main goniometric set-up
The main experimental set-up as used for this thesis is shown in figure 3.1. It consists of: (#1) A dual Xenon-arc and Cesiwid globar lamp, with both sources rated at 150 W input power; (#2) An aspher
17 The material from chapter 3.2 has been submitted for publication [23] and used in a report [22], both by Coray et. al.
51 Chapter 3. Experimental set-ups
ical Czerny-Turner type double monochromator with 300 mm focal length and an aperture ratio of f/4, with (#2') the monochromator exit slit; (#3 and #5) Two symmetrically arranged plano-convex spherical lens pairs made of MgF2; (#4) A sample; (#6) A thermoelectrically cooled dual Si / MCT sandwich detector with a normalised peak detectivity of 2.8e+12 cm Hz0.5 W-1 (Si) and 1.66e+10 cm Hz0.5 W-1
(MCT); (#7) A mechanical beam chopper; (#8) A lock-in amplifier for measuring the modulated signal; (#9) A PC based data acquisition system.
The maximum spectral range and minimum bandwidth for the set-up shown in figure 3.1 are 0.3 μm ÷ 4.0 μm and 1 nm, respectively. In practice however, the participating media encountered in solar thermal and thermochemical applications frequently show such a strong attenuation of radiation that measurements can only be performed at much higher throughput settings. This typically limits the use of the double radiation source to the Xe-arc lamp only, and restricts the operation of the double monochromator to the 0.35 μm ÷ 2.5 μm range with the bandwidth increased to 15 nm ÷ 30 nm.
The first lens pair (#3 in figure 3.1), which is on the source side, forms a sharply focused image of the monochromator exit slit centred on the pivotal axis. The second lens pair (#5 in figure 3.1), located on the detector side, is exactly symmetric to the first lens pair mirrored around the pivotal axis, therefore forming an image of the monochromator exit slit #2' on the detector plane. The lens focal lengths are chosen to be f = 75 mm and f = 150 mm, thereby first magnifying the monochromator exit slit by a factor of two, which leads to an irradiated sample cross section of 8 mm height and 6 mm width. On the
3.2. Current main goniometric set-up 52
detector side the monochromator exit slit then is magnified back to its original size of 4 mm x 3 mm. This leads to a maximum half-cone acceptance angle of 3.6° for rays exiting the sample with respect to the optical axis of the receiving lens.
M
1
2 3 45
6
7
8
V 9
2’
z
x
y
Figure 3.1: Goniometric experimental set-up consisting of: (#1) dual Xe-arc / Cesiwid globar lamp, (#2) double monochromator, (#3 and #5) imaging lens pairs, (#4) sample, (#6) rotary detector, (#7) beam chopper, (#8) lock-in amplifier, and (#9) data acquisition system. The x-y-z coordinate system is centred at the pivot point.
In order to allow for at least partial compensation of change in refractive index and thereby lens focal length with wavelength, the axial location of the first and the last of the four lenses can be adjusted individually by using a separate linear translation stage for each
53 Chapter 3. Experimental set-ups
lens. The second lens pair and the detector are mounted on a rotary arm, which enables angular measurements in the range between -30° and 156°, with 0° being the direction of the incoming ray coinciding with the direction of the z-axis.
The sample is mounted on a three-axis linear translation stage aligned according to the x-y-z coordinate system. Automated sample positioning, monochromator operation, and data acquisition are performed by an in-house software application. Ambient radiation on the detector is minimised by shielding the set-up with an attenuating cover and restricting the detector acceptance solid angle by use of a view limiting tube equipped with two diaphragms. The detector further allows mounting neutral density filters, required to avoid detector overloading caused by too strong incoming radiation. In the region of the Xe-arc’s maximum output power, which is at wavelengths between 500 nm and 1000 nm, the dynamic addition and removal of calibrated neutral density filters according to the actual signal strength makes it possible to increase the dynamic range of the set-up by up to three orders of magnitude. The largest dynamic range of the set-up occurs at a wavelength of about (950 ± 50) nm, with the peak ratio between the strongest signal and the noise base being approximately 1:10-9.
3.3. Main set-up in wide-angle transmission mode 54
3.3 Main set-up in wide-angle transmission mode18
M
1
2 3 46'
7
8
V 9
2’
z
x
y
Figure 3.2: Experimental set-up with a fixed detector. (#1÷4) and (#7÷9) are as in figure 3.1, (#6') is a separate Si-detector.
The components used for the wide-angle set-up shown in figure 3.2 are almost identical to the ones in figure 3.1, with the only difference being a different make of Si-detector that can be placed directly behind the sample with no additional collecting optics between the sample and detector. This results in a ray acceptance half cone angle of 50° ÷ 60°, which in turn increases the detector signal, thus allowing measurements at sample optical thicknesses larger than with the goniometric set-up shown in figure 3.1.
18 The material in chapter 3.3 is from Coray et al. [21, 22].
55 Chapter 3. Experimental set-ups
3.4 Initial narrow angle transmission only set-up19
Figure 3.3 shows the initial spectroscopy measurement set-up as used before upgrading to the goniometric set-up covered in chapter 3.2. The only difference to figure 3.1 are the lens pairs #3 and #5, which both consist of plano-convex sapphire lenses, all having a focal length of f = 25 mm. In combination the lenses form an image of the monochromator exit slit #2' directly onto the detector, with no images being formed in-between. In terms of optics and collection of radiation, this is an important difference to the set-up in figure 3.1, as in figure 3.3 the sample is not imaged onto the detector, which results in a different response behaviour to rays originating from the sample. In this set-up wavelength dependent effects are stronger than for the set-up in figure 3.1 which is due to using sapphire instead of MgF2 as well as not having any wavelength compensation in form of being able to dynamically adapt the lens position with wavelength. The beam cross section area, the maximum cone angle of rays incident on the sample, and the maximum cone angle of rays exiting the sample and intercepted by the detector vary with wavelength because of the spectrally varying refractive index of the lenses. For λ = 0.5 μm, the beam cross section area was approximately 8 mm (vertically) × 8 mm (horizontally) and it increased to 13 mm × 13 mm at λ = 4 μm. The maximum angle relative to the optical axis for rays incident on the sample was 4.5° (4.4° at λ = 0.5 μm and 4.2° at λ = 4 μm). For rays exiting the sample and intercepted by the detector, the maximum acceptance
19 The material in chapter 3.4 is from Coray et al. [22, 24].
3.4. Initial narrow angle transmission only set-up 56
angle relative to the optical axis was 5° at all wavelengths (limited by diaphragm).
M
1
2 3' 4 5' 6
7
8
V 9
2’
z
x
y
Figure 3.3: Initial narrow angle transmission mode set-up with a fixed detector. (#1, 2, 4) and (#6÷9) are as in figure 3.1, (#3') and (#5') are collimating and focusing lens pairs. The detector cannot rotate.
3.5 SNF co-funded set-up upgrades20
3.5.1 Introduction
In the course of the thesis funding for upgrading the experimental facilities became available. Summarised, the upgrade's aims are:• Extended wavelength range spanning all wavelengths of interest for
solar thermal and solar thermo-chemical engineering.
20 Material from chapter 3.5 has been published by Coray et al. [22].
57 Chapter 3. Experimental set-ups
• Extended viewing angle range.• Higher power sources and more sensitive detectors to allow meas
uring at larger optical thicknesses.• Hardware for measuring at higher sample temperatures.• Increased productivity and precision by automation of measure
ments.The design consists of a total of three sub set-ups and additional shared hardware. It covers a wavelength range of 0.3 μm ÷10 μm and can be used to measure samples at temperatures between 20 °C and 800 °C. Having only one set-up with one set of optics, as suggested in the original proposal related to reference [22], would require limiting the upper end of the wavelength range to approximately 6.5 μm (using MgF2 lenses). Splitting the set-up has the additional advantage of higher optical efficiencies and further allows incorporating a laser as a high power source of radiation.
At this place only the designs will be presented. It must be noted that their implementation is still incomplete and will require design adaptations and optimisations. The reason for this is that no time was available for step by step engineering design, testing, implementation and refinement. Therefore many risks had to be taken during the design phase, mainly due to lack of knowledge about the mechanical stability and rigidity of the components, suitability of the parts for precision alignment, and whether the components in general would work as expected.
3.5. SNF co-funded set-up upgrades 58
3.5.2 Optimised visible to near infrared set-up
The upgraded optimised visible to near infrared set-up covers a wavelength range of 0.3 μm ÷ 2.5 μm (~3.0 μm)21 and operates in two modes: Angular measurement at viewing angles between -30° and +170° (figure 3.4) and backward measurement at 180° (figure 3.5).
2’
1
2
M7
V
V 9
6a
8b
8a
35
6b
10
1112
4z
x
y
Figure 3.4: Optimised visible to near infrared set-up in goniometric operation mode — angular measurement. Components: (#1) 150 W Xe-arc lamp, (#2) double monochromator, (#3 and #5) imaging lens pairs, (#4) sample on a multi-axis translation stage, (#6a) rotary detector, (#6b) reference detector, (#7) optical chopper (#8) lock-in amplifier, (#9) data acquisition system, (#10) neutral density filter on a motorised filter wheel, (#11) bandpass filter, (#12) fibre optic.
21 The upper end of the Xe-arc lamp's spectral range is fuzzy due to strong variations in the quartz envelopes' transmissivity.
59 Chapter 3. Experimental set-ups
The following components are identical to the previous set-up: 150 W Xe-arc lamp (#1), double monochromator (#2) and optical chopper (#7). The rest of the components have changed as follows: The cesiwid globar source was discontinued due to its size being poorly matched to the monochromator and the higher end of the wavelength range now being covered by a dedicated infrared set-up with dedicated and optimised IR source. The imaging lens system was optimised for increased throughput and consists of MgF2 lenses with focal lengths f = 50 mm and f = 150 mm. In addition the first and last lens are on translation stages to dynamically compensate for chromatic aberration. The sample (#4) is on a multi-axis translation stage and can be moved in three dimensions (automatic), as well as rotated (manual). The rotary arm is driven by a motorised precision worm gear drive rotary stage with a positioning accuracy of 0.05°. To attenuate the beam, neutral density filters can automatically be selected via a motorised filter wheel (#10). For measurements with high background radiation, heated samples for example, a selection of bandpass filters (#11) can be used to reduce the amount of unwanted radiation reaching the detector. To pick up the signal from the sample, a set of modularly exchangeable detectors, optimised for different wavelength ranges, can be used (#6a). These detectors are mounted on a manual three axis positioning system which allows for fine positioning of the detector relative to the beam. Next to the main signal, a reference signal from the lamp is picked up via an optical fibre (#12) and a broadband Si detector (#6b). This reference signal is modulated with the same optical chopper as the main beam (#7). Picking up the signals is done by two lock-in amplifiers (#8). The
3.5. SNF co-funded set-up upgrades 60
simultaneous measurement of the relative lamp power and the signal from the sample results in reduced uncertainty from lamp fluctuations. Finally the system is connected to a data processing and control system (#9).
2’
1
2
M7
V
V 9
8b
8a
3
6b
10
124
z
x
y
6a
5'
11
13
Figure 3.5: Optimised visible to near infrared set-up in 180° operation mode — backward measurement. Components: (#1÷12) as in Figure 7, (#13) beam splitter.
The 180° backward measurement mode, figure 3.5, allows to measure the amount of radiation reflected normal to a perpendicularly mounted sample. For many of the samples studied during this thesis this direction contains a large fraction of reflected energy and it therefore is important to be able to quantify it.
61 Chapter 3. Experimental set-ups
Switching to operation in the 180° backward measurement mode is done in two steps: Mounting of the beam splitter (#13) and mounting of the detector (#6a) in direction of the split beam. A kinematic base is used for rapid and highly repeatable positioning of the beam splitter, while fast positioning of the detector is achieved by the same three axis manual positioning system as on the rotary arm. The receiving pair of lenses (#5’) are permanently mounted and therefore do not have to be re-aligned. A beam dump (not shown) is used to trap the radiation reflected in the direction opposite the detector.
With respect to the visible to near infrared part of the spectrum there presently are two options for further set-up optimisation:• Lower wavelength range of 0.2 μm instead of 0.3 μm.• Lamp power of 450 W or even 1000 W instead of 150 W.The lower wavelength range is because the present lamp’s bulb is UV limiting. For terrestrial solar thermal energy applications the 0.2÷0.3 μm range is of minor importance, as less than 0.001 % of the incoming solar radiation is contained in that band (based on the standard ASTM air mass 1.5 spectrum). There therefore is no immediate need to measure in that wavelength range. However, enabling measurements in the 0.2÷0.3 μm range is easily achievable by replacing the present Xe-arc lamp with a UV enhanced one22. All other system components such as lamp power supply, lamp socket, housing, lenses and detector are directly compatible.
The motivation for increased lamp power originates from the need of a higher power source in situations with highly attenuating
22 I.e. just the core lamp or “bulb”. The lamp housing, optics and electronics remain the same. The only difference lies is the lamp's quartz envelope.
3.5. SNF co-funded set-up upgrades 62
samples or high background radiation (furnaces). Initial calculations23 have shown that, for the present constraint of constant monochromator optics, the amount of collected useful radiation scales with lamp power raised to (1/3), i.e. Pcollected ~ Plamp
1/3. Increasing the lamp power is therefore highly inefficient. Consequently it was decided to invest in a laser, as this is more beneficial than investing in a higher power lamp.
23 P. Coray, “PRE‘s Radiation Heat Transfer Laboratory − An Inside View”. Presentation, PRE Seminar, Arosa, 2007-02-12.
63 Chapter 3. Experimental set-ups
3.5.3 Infrared set-up
The main features of the infrared set-up are: Angular measurement from -30° to +160° (figure 3.6) and 180° backward measurement (figure 3.7) for the wavelength range between 2.5 μm and 10 μm.
4
V8b
V 9
8a
6a
2 7
M
6b1
5
3
3
5
z
x
y
Figure 3.6: Infrared set-up in goniometric operation mode — angular measurement. Components: (#1) 30 W ceramic IR emitter, (#2) IR monochromator, (#3 & #5) spherical mirrors, (#4) sample on a multi-axis translation stage, (#6b) reference detector, (#7) optical chopper, (#8) lock-in amplifier, (#9) data acquisition system.
3.5. SNF co-funded set-up upgrades 64
Both angular and 180° configurations use the same base components. On the source side these are: A 30 W platinum heater with ceramic coating as IR source (#1), a mechanical chopper (#7), silver coated spherical mirrors (#3) and a broadband Si detector for reference signal measurement (#6b). In contrast to the visible near infrared set-up the entire source side of the infrared set-up is rotated when measuring at different angles. As the sample (#4) is irradiated normally it is usually rotated with the source. The rotary stage used for the rotation is identical to the one used with the visible set-up. All elements on the receiver side are fixed. The optics consist of the same type and size of spherical mirrors (#5) as the source (#3). Mirrors have lower losses in the infrared than lenses and, unlike lenses, they do not exhibit any chromatic errors and consequently do not need wavelength compensation. The mirrors direct the radiation into an infrared monochromator (#2) and finally the radiation is collected by a detector (#6). The also required lock-in amplifiers (#8) and data processing and control system (#9) are identical to and shared with the other set-ups.
For 180° measurements the source side platform is positioned as in figure 3.7 by means of kinematic locators. In addition a beam-splitter (#13), plane mirror (#14) and beam dump (not shown) are mounted using the same type kinematic base system as in the visible set-up.
65 Chapter 3. Experimental set-ups
4
V8b
V 9
8a
6a
2
7M6b 1
5
3 3
5
13
14z
x
y
Figure 3.7: Infrared set-up in 180° reflection measurement mode. Components: (#1÷9) as in figure 3.6, (#13) IR beam splitter, (#14) plane mirror.
3.5.4 Laser based set-up
The operation of this set-up is very similar to the previously described visible to near infrared set-up. As a radiation source a 635 nm wavelength laser with 5 mW output power is used (#18). The laser is operated in modulated mode and therefore doesn’t require an external mechanical chopper. Unlike the previous visible and infrared set-ups, which use a separate frequency generator, one of the lock-in amplifiers (8a) is used as frequency source for the laser. The laser beam is fine aligned via a plane mirror (#14) and then expanded with
3.5. SNF co-funded set-up upgrades 66
a 3x beam expander (#16). A selection of neutral density filters held in a manual filter wheel (#10) are used for beam attenuation. For reference measurement ten percent of the beam is split by a beam sampler and measured with a broadband Si detector (#6b). Both detectors (#6a and #6b) are identical and both use a laser line filter (#11) to separate the laser radiation from other radiation.
Due to the high laser power extremely sensitive detectors are not required. In the original set-up design of figure 3.8 the receiver side optics consists of one lens only (#5), which is mainly to keep the set-up simple. Initial tests have shown however, that the high power and
67 Chapter 3. Experimental set-ups
high directionality of the beam makes the set-up very susceptible to even the slightest alignment errors. This could be improved by use of a laser beam diffuser24 to slightly diverge the beam and couple it to a dedicated beam shaping optic similar to the ones used in figure 3.4.
4
6a11
6b
11
V
V 9
8a
8b
1013
5'
14 1516 17
18
z
x
y
Figure 3.9: Laser based set-up in 180° reflection measurement mode. Components: (#1÷11, 14÷16, 18) as in figure 3.8, (#13) beam splitter, (#17) beam dump.
3.5.5 Furnace
The furnace shown in figure 3.10 has been designed to study temperature dependent effects at operating temperatures similar or at least close to those occurring with solar-thermal and solar-thermochemical applications. It consists of an inconel coated heating coil (#1)
24 An “engineered” laser beam diffuser diverges a collimated laser beam at a certain opening angle, for example 20°, but unlike a lens does this in an angularly confined diffuse way, similar to an incoherent source.
3.5. SNF co-funded set-up upgrades 68
with an input power of 420 W and a maximum admissible temperature of 1000 °C. The heating coil is enclosed in Al2O3 / SiO2 vacuum formed insulation (#2) with ports for optical access (#3). To drive the furnace a temperature control system (#4, #5), combined with temperature measure hardware for feedback (#6) is used. Samples are held by ceramic sample holders and fixed with cement (not shown). As discussed in chapter 2.2.5, proper evaluation may require taking radiation reflected from the furnace walls into account.
B-B
A-A 11°76°
B B
AAPIDΣ
T
T
12
3
45
6
Figure 3.10: Furnace and control. Components: (#1) heating coil, (#2) insulation, (#3) optical access, (#4) temperature control system, (#5) transformer, (#6) temperature measurement system.
69 Chapter 3. Experimental set-ups
3.5.6 Detectors
In the course of the SNF co-funded upgrade it was decided to acquire a set of independent standalone detectors. The alternative option would have been to acquire a single multi-element detector (essentially an array of detectors in one unit). It was found that buying single detectors is cheaper, results in more compact detectors and reduces the cost of replacement in case of failure.
0 2 4 6 8 10 12 14wavelength λ, µm
norm
alise
d de
tect
ivity
D*,
cm √
Hz /
W
1.0E+07
1.0E+08
1.0E+09
1.0E+10
1.0E+11
1.0E+12
1.0E+13
1.0E+14Si, -30°C
IGA, -196°C
PbS, -30°C
InSb -196°C
MCT 10, -196°C
Figure 3.11: Detector performance as a function of wavelength λ. Solid lines: detectors after upgrade; dashed lines: detectors before upgrade.
3.5. SNF co-funded set-up upgrades 70
Figure 3.11 shows the detector performance graph based on data from the manufacturer25 for a selection of acquired detectors. Solid lines show the new detectors while dashed lines show the previous detector combination (Si and MCT) as used in the current goniometric set-up (chapter 3.1). It is obvious that the detector performance, measured in normalised detectivity26 D*, has improved, though it must be noted that the uncertainty of the manufacturer data is unclear27. Next to choosing optimal normalized detectivity the active detector area was chosen to give a good match to the optics of the set-ups. With respect to monochromator based set-ups the optimal active detector area is typically given by the projected monochromator exit slit size.
25 Electro-Optical Systems Inc., detailed specifications and a list of data-sheets will be made available in appendix D.
26 The normalised detectivity D* is a measure for the smallest measureable signal normalised with respect to detector area and bandwidth. Higher values indicate better performance. [28]
27 Specifically the Si-detector in the old set-up (dashed line below Si) should be similar to the new one. A reason for the difference may be that the old set-up uses an Si detector with a smaller MCT planted on top of of it. This could cause additional noise and thereby decrease the performance.
Chapter 4
Data acquisition and evaluation
4.1 Measurement procedure28
In the majority of cases the measurement procedure consists of irradiating samples of varying thickness perpendicularly to their surface and then measuring the angular distribution of radiation around the sample. Samples are therefore usually cut or arranged into plane-parallel slabs, although other shapes, cylindrical for example, are also possible. Glass slides are used as a supporting structure in situations where the sample material cannot stand on its own, which is typical for packed beds of grains and powders. In case of angular measurements, it is of importance that the sample centre or alternatively edge is aligned flush with the pivot point. Any offset of the sample with respect to the pivot point would lead to a shift in the receiving detector’s response, which is an undesired effect and can result in a significant error when viewing at an angle. Once aligned, the sample is scanned over its entire cross section with one data-point (detector signal) being taken per sample spatial location. Before and after each cross sectional scan, the sample is moved outside the line of sight and the detector response at a viewing angle of 0° measured, resulting in a
28 The material in chapter 4 has been submitted for publication [23].
73 Chapter 4. Data acquisition and evaluation
reference signal used for normalising the measured data. This procedure of spatial scanning and recording is then repeated for each viewing angle.
4.2 Data evaluation
In a first step the raw measurement data is pre-conditioned by determining the spatially averaged normalised detector signal per viewing angle and per sample thickness. An uncertainty analysis is performed based on the scatter of the data. In the next step, the radiative properties are determined by fitting a suitable theoretical model to the measurement data as sketched schematically in figure 2.8. Depending on the sample and the required degree of detail, the theoretical model can range in complexity from a simple log-linear fit [24] right up to a detailed Monte Carlo ray-tracing model of the entire set-up [21].
Chapter 5
Reticulate porous ceramics
5.1 Introduction29
Reticulate porous ceramics (RPC) are ceramic structures, which are in their appearance similar to that of a large-pore sponge or foam [65]. Their porous structure combined with large specific surface area gives them favourable heat and mass transfer characteristics and therefore they are encountered in several energy-related applications such as gas burners, heat exchangers, regenerators, and recuperators [101]. Three campaigns involving RPC were undertaken in the course of this thesis. These are as listed in table 5.1:• The investigation of the apparent extinction coefficient of a rho
dium catalyst coated RPC (#1) made of silicon-carbide with silicon-oxide binder employed for solar steam reforming of hydrocarbons at above 1100 K [110]. This material's radiative properties were extensively analysed on a numerical-geometrical basis by Petrasch and co-workers [111, 112] who performed ray-tracing on RPC geometry data obtained by tomographic scans.
29 Material from chapter 5 has been published by Coray et. al. [23, 24], with additional information taken from Haussener, Coray and co-workers [46].
75 Chapter 5. Reticulate porous ceramics
• The determination of the apparent extinction coefficient of an uncoated, non-hollow SiSiC RPC (#2) [46].
• Goniometric measurements of the distribution of radiation around three types of RPC samples: The two RPC as above and an additional silicon-carbide / silicon-oxide based RPC (#3) used in a high-temperature solar air receiver [54].
Table 5.1: Investigated RPC materials. The porosity shows the 95% uncertainty. PPI (pores per inch) and dnom (nominal pore diameter) are nominal and therefore don't have an uncertainty.
Previous experimental and combined experimental-theoretical work on RPC like samples and structures include (i) measurements of the optical properties of stabilised ZrO2 based on effective conductivity measurements [56], (ii) the absorption and scattering coefficients and the scattering phase function of stabilised ZrO2 and oxide-bonded SiC RPC [50, 51] and aluminium foam similar in appearance to an RPC [74], all based on hemispherical transmission and reflection measurements.
5.2. On normalising the signals by the porosity 76
5.2 On normalising the signals by the porosity
In the tomography based analysis of RPC #1 [111, 112] the solid phase is seen as opaque. The rays used for determining the extinction coefficient can therefore only start in the void phase. Consequently it can be argued that an experimentally determined attenuation of radiation in transmission mode q/q0 should be normalised by the porosity ε to allow comparison, i.e. q/(ε q0), with q being the attenuated and q0 the unattenuated signal at a viewing angle of 0°. This can be interpreted in the following way: Rays immediately hitting the opaque phase at the sample interface, i.e. a fraction of ε, must drop out as this would be equivalent to starting in the opaque phase. The measure can be seen as an interface effect compensation (chapter 2.5.2). Note that this assumption is only valid when the geometry in question is much larger than the wavelength. Normalising by porosity won't work with fine structures due to diffraction effects causing scattering in the for ward direction.
With respect to RPCs the author has some reservations to normalising by porosity. RPCs #1 and #3 for instance have a discrete semitransparent phase (silicon oxide and aluminium oxide), therefore a fraction of radiation could be able to get into the medium even when immediately hitting the interface. The second reservation is that normalising by porosity doesn't make sense with respect to the signal in backward direction as reflection from the opaque phase is included.
77 Chapter 5. Reticulate porous ceramics
5.3 Initial transmission only measurements
In this campaign three samples made of the rhodium catalyst coated RPC #1 were investigated using the transmission only set-up documented in chapter 3.4. The samples, shown in figure 5.1, have a thickness st of 5.7, 10.1, and 16.0 mm and were scanned at wavelengths of λ = 0.3, 0.5, 0.7, 1, 2, 3 and 4 μm.
~36_~3
0_5.710.116.0
units: mm
Figure 5.1: The three rhodium catalyst coated RPC #1 type samples made of silicon-carbide mixed with silicon-oxide binder.
A total of 60 measurements per sample and wavelength were performed, whereas the sample position was resolved by 1 mm vertically and 4 mm horizontally. The measured relative detector signals qλ/qλ,0
were averaged over the 60 measurement locations for each measured wavelength λ and sample thickness st, and normalised by the porosity ε = 0.91 ± 0.02 30. The 95%-confidence based uncertainty in qλ/qλ,0
was then estimated by taking into account the variation of qλ across
30 Normalising by the porosity ε is done for improving the comparability to to the tomography based results.
5.3. Initial transmission only measurements 78
the samples, the uncertainty in the reference signal qλ,0 measured without any sample, the noise base of the system qλ,noise, and the uncertainty in the porosity ε,
22 2
λ,0λ
λ,0
δqq δq δεδq ε
æ æ=÷ø
ö÷ ç ç
èè
ö÷øε
+++q ö
÷ø
2ö÷ø
æçèç
è
æç ÷
ø
ö÷ç
è
æçq qε q q
qλ,noiseλ λ
λ,0 λ,0λ λ(5.1)
with δ denoting the uncertainty at 95%.The wavelength- and sample thickness-average relative signal
variation δqλ/qλ, uncertainty in reference signal δqλ,0/qλ,0, noise qλ,noise/qλ and uncertainty in porosity ε were 40, 2, 6 and 1%, respectively. In the worst case, corresponding to λ = 4 μm and st = 16 mm, δqλ/qλ = 71%, δqλ,0/qλ,0 = 2% and qλ,noise/qλ = 59%. The maximum relative 95%-confidence uncertainty in the sample thickness was 1.8% (0.1 mm at s = 5.7 mm), without including the systematic error due to non-parallel rays. When the latter was included, this uncertainty increased to 2.1%.
The porosity compensated apparent spectral extinction coefficient βλ.ε
**, equation (2.15) with additional compensation for porosity ε, was determined from a chi-square merit function based best fit [116] of exp(−βλ.ε
** st) ≈ qλ/(ε qλ,0). The resulting value of βλ.ε
** is practically constant for all wavelengths, with 220 m-1 < βλ.ε
** < 230 m-1. The uncertainties of the fitted βλ.ε
** were determined by the method of constant chi-square boundaries as 95% confidence limits [116]. They vary between ±20 m-1 and ±40 m-1, with the higher uncertainties tending to occur at higher wavelengths. The experimentally-determined wavelength-averaged apparent extinction coefficient is
79 Chapter 5. Reticulate porous ceramics
βε**= (230 ± 20) m-1. The contribution of the above-mentioned sys
tematic error in the sample thickness to the uncertainty in βε** was as
small as 1 m-1. The values of qλ/(εqλ,0) are plotted in figure 5.2 as a function of the normalised path length31.
1.0
0.1
0.010 82 4 6
normalised path length s/dnom, —
norm
alise
d sig
nal q
/ (ε q 0
), —
norm
alise
d M
C in
tens
ity I M
C / (I
MC.
0), —
IMC/IMC.0exp(−βMCs)
exp(−βε**s)
q / (ε q0)
Figure 5.2: Radiative intensity obtained numerically (squares) and detector signal obtained experimentally (circles) as a function of the normalised path length s 31. Also shown are the fitted exponential functions for determining βε
**= 230 m-1 and βMC= 210 m-1. The error bars are at 95%.
31 When comparing a measurement to a tomography-based analysis, the tomography path length s is implicitly seen as a length of travel equivalent to a sample thickness st. The requirements for this to hold are given by the assumptions stated in chapter 1.4.4.
5.3. Initial transmission only measurements 80
Figure 5.2 also shows the relative radiative intensity IMC(s)/IMC.0
computed by Monte Carlo ray-tracing on a tomography scan of the same RPC material before cutting into samples. The MC simulation was run for 107 rays and a grid resolution of 0.05 mm. Each MC data point has an estimated standard deviation of less than 50 μm in pathlength and 0.01 in normalised intensity. The MC data and grid convergence are reported in detail in [111]. The function exp(-βMC s) was fitted to the MC data, leading to the MC-determined extinction coefficient of βMC = (210±2) m-1 at 95% confidence.
Effects contributing to the relative difference in the fit parameters, (βε
**− βMC) / βMC, of 10% are local material anisotropy for finite and relatively small RPC samples and possible in-scattering. Furthermore, the experimental measurements of q/q0 are carried out along a single direction, while the function IMC/IMC.0 is integrated by MC over all solid angles. It was estimated [112] that the directional variation of βMC is of order ±20 m-1.
5.4 Goniometric measurements on 3 sets of RPC32
Goniometric measurements on the three types of RPC listed in table 5.1 and shown in figure 5.3 were performed in the framework of a master thesis [1]. It was not yet possible to perform an inverse analysis allowing to determine a set of radiative properties33 and con
32 The data presented in chapter 5.4 was acquired by R. Affolter [1].33 This is because the analysis software has not yet been completed. Further
information is given in appendix B.
81 Chapter 5. Reticulate porous ceramics
sequently only a selection of raw data with an additional determination of apparent extinction coefficients will be presented.
~30 mm
#2
#3
#1
Figure 5.3: The three types of RPC investigated by goniometric measurements (compare table 5.1). Note that RPC #2 has much finer pores and darker surface than RPC #3 and RPC #1. It is further apparent that RPC #1 and #2 have much sharper edges than RPC #3.
Figure 5.4 shows the results obtained by goniometric measurements on three samples of RPC #1 by using the set-up covered in chapter 3.1, figure 3.1. Qualitatively, the goniometric results from RPC #2 and #3 are very similar to those of RPC #1 and therefore their plots are not reproduced at this place. It is apparent that figure 5.4 shows a strong forward peak at 0°, followed by a steep drop of the signal between a viewing angle of 0° and 10°. Subsequently there is only a moderate signal decrease with angle between 10° and 60°. Phenomenologically and intuitively the strong peak at 0° can quite easily be understood on the basis of the sample's large open pores and
5.4. Goniometric measurements on 3 sets of RPC 82
sample thicknesses on the order of a few pore sizes, which lets one look through the sample by bare eye (compare figure 5.1). It therefore doesn't surprise when a lot of radiation can pass straight through the sample without being absorbed or scattered, hence the strong forward peak.
-30 0 30 60 90 120 150
10-6
viewing angle αv , °
norm
alise
d de
tect
or si
gnal
q/q
0 , —
st = 5.7 mmst = 10.1 mmst = 16.0 mm
10-4
10-2
100
Figure 5.4: Directional data obtained from measurements on three thicknesses st of reticulate porous ceramic sample #1. The wavelength is λ=500 nm and the error bars indicate the 95% uncertainty.
In backward direction, i.e. for angles between 120° and 156°, the signal in figure 5.4 also only shows a moderate change with angle and does not change with sample thickness. The independency of signal and sample thickness in backward direction can be partially attrib
83 Chapter 5. Reticulate porous ceramics
uted to the positioning of the RPC samples, which have the directly irradiated surface aligned flush with the rotary arm pivot point. If, for example, the sample centre had been aligned with the pivot point, then the subsequent additional blockage by sample material in viewing direction would have led to a change of signal with sample thickness at backward angles.
Note that figure 5.4, unlike figure 5.2, does not include compensation by the porosity ε. The reason for this is that the backward directed signal includes a component originating from reflection on the plane-cut interface having a fraction of ε. One could still normalise the forward directed part, but this would complicate the graph.
Figure 5.5 shows the normalised signal q/q0 versus sample thickness st for the three different types of RPC. The drawn lines represent equation (2.14), i.e. the function q ≈ q0 exp(-β**st), with β** being the apparent extinction given in the last column of table 5.2. It is apparent that RPC #1 and #3 exhibit a very similar attenuation behaviour, which can be explained by both having the same nominal pore diameter and almost the same porosity. As observed and summarised in Hendricks and Howell [50] the extinction coefficient β of RPCs with features (struts, pores, …) sized in the regime of geometrics optics mainly scales with the solid phase fraction 1− ε and inverse pore-size 1/dnom,
β ~ (1 − ε) / dnom (5.2)
hence the strong similarity between RPC #1 and #3.
5.4. Goniometric measurements on 3 sets of RPC 84
0 4 8 12 16 20
100
sample thickness st, mm
norm
alise
d sig
nal q
/q0,
— 10-1
10-2
10-3
10-4
10-5
RPC #1RPC #2RPC #3
Figure 5.5: Normalised signal in 0° forward direction as measured with the goniometric set-up figure 3.1. The error bars indicate 95% uncertainties. The uncertainty in sample thickness st is about the size of the symbols. The drawn lines are a best fit of equation (2.14).
Table 5.2 further shows the difference between porosity normalised and non-normalised apparent extinction coefficients βε
** and β**. Porosity normalisation decreases the apparent extinction coefficient, but the difference is small. Also shown is that the apparent extinction coefficient as determined with the transmission only set-up βε
**(a)
remains the same when determined with the goniometric set-up βε**.
Agreement between the tomography based and the measured values is also good. The reason for the tomography based extinction coefficient βMC of RPC #2 having a much higher standard deviation than
85 Chapter 5. Reticulate porous ceramics
that of RPC #1 lies in the poorer quality of both the sample and the associated tomography scan34.
βMC, m-1 βε**(a), m-1 βε
**, m-1 β**, m-1
RPC #1 210 ± 2 230 ± 20 230 ± 20 240 ± 20
RPC #2 630 ± 70 (b) — 680 ± 60 690 ± 60
RPC #3 — — 210 ± 10 220 ± 10
Table 5.2: Comparison of apparent extinction coefficients based on measurements with the goniometric set-up. β** is as described by equation (2.15), while βε
** additionally normalises by the porosity. (a)
denotes the value determined from the initial transmission only measurements (chapter 5.3). βMC is as determined by tomography. (b)
is from reference [46].
34 RPC #2 has finer pores and therefore less resolution per pore than RPC #1. Furthermore RPC #2 is partially contaminated with dirt-like residues.
Chapter 6
A packed bed of ZnO particles
6.1 Introduction35
With respect to high-temperature solar thermo-chemistry, the ZnO sample material considered in this chapter has its main application in the two-step water-splitting thermochemical cycle based on ZnO/Zn redox reactions considered for solar hydrogen generation [135]. It encompasses the endothermal dissociation of ZnO using concentrated solar radiation as the energy source of high-temperature process heat, followed by the non-solar exothermal hydrolysis of Zn. The solar chemical reactor features a packed bed of ZnO particles directly exposed to high-flux direct solar and thermal irradiation at temperatures above 1700 K. The ZnO particles thereby simultaneously serve the functions of radiant absorbers and chemical reactants [128].
The samples of 24 mm x 24 mm cross-section were prepared by pressing ZnO powder to a target volume fraction36 of fv = 40% ÷ 45% (the actual range was between 34% ÷ 51%). To support the packed bed of ZnO after pressing and prevent it from breaking, it was placed between two parallel ISO 8037/1 standard compliant microscopy
35 Material from chapter 6 has been published by Coray et al. [21].36 I.e. the fraction of volume occupied by ZnO.
87 Chapter 6. A packed bed of ZnO particles
slides. The normalised volume distribution density function f(a) and the corresponding cumulative volume distribution function F(a) of the ZnO particles,
( ) ( ) ( )= ¥ =ò * *
0d ; 1
aF a f a a F (6.1)
were obtained by laser scattering particle size analysis (Horiba LA-950) and are shown in figure 6.1, though it must be noted that the obtained values are more of qualitative “order of magnitude” rather than quantitative value37. The Sauter mean particle radius a32, volume median radius aVM, and the maximum radius amax are 0.95 μm, 1.21 μm, and 6.6 μm, respectively. At a wavelength of λ = 555 nm this corresponds to particle size parameters ξ º π d/λ of 4.6, 13.7, and 75 (with d=2a). For the present particle size and volume fraction range, the scattering regime is dependent [138], which considerably complicates theoretical prediction of the radiative properties.
The measurements were conducted with the goniometric set-up as covered in chapter 3.2. Initial tests indicated a high attenuation of the ZnO packed bed, and therefore the set-up was operated at maximum throughput in the wavelength range between 555 nm and 1 μm. To allow further measurements at very high sample optical thicknesses, additional measurements were also performed using the wide-angle transmission mode set-up covered in chapter 3.3.
37 Discussed in chapter 1.4.2's section on “Uncertainty in the material's geometry and constitution”.
6.1. Introduction 88
f, μm-1
F, —
0.1 1 10particle radius a, μm-1
1.0
0.8
0.6
0.4
0.2
0.0
Figure 6.1: Normalised volume distribution density function f(a) and the corresponding cumulative volume distribution function F(a) of ZnO particles as a function of particle radius a.
6.2 Monte Carlo analysis
6.2.1 Ray generation
Solving for the radiative fluxes measured by the two set-ups was done by a Monte-Carlo ray-tracing simulation [36], written in Fortran 2003. A large number of stochastic rays are launched at the rectangular exit slit of the second stage of the double monochromator. The starting points p are distributed uniformly over the slit38. A ray’s
38 Underlined variables (p, u) indicate local lens system coordinates. u contains the slopes with respect to the optical axis and is not a unit vector.
89 Chapter 6. A packed bed of ZnO particles
emission direction is expressed as a function of its distance from the optical axis and the monochromator f#. At the centre of the slit the ray emission direction is uniformly distributed over a cone with opening angle θ = ±atan(0.5/f#). For off centre rays the inward pointing half of this cone of emission becomes skewed to an elliptical base, which is sketched in figure 6.2.
θup
φ
lower half ofemission(skewed cone)
upper half ofemission (cone)
slit
emission fromcentre (cone)
θup
θup
θlow
Figure 6.2: Directions of emission from the monochromator exit slit. Left: Front view of the monochromator exit slit; Right: Cross section of the monochromator exit slit.
As indicated in figure 6.2 two characteristic opening angles, θup
and θlow , are used to determine the direction of emission. For all starting points p the outward pointing angle is θup = atan(0.5/f#). The inward pointing angle θlow is a linear function of distance from the slit centre (i.e. the magnitude of p). At the centre of the slit θlow = -atan(0.5/f#) and at the upper edge of the slit θlow = -atan(0.25/f#).
6.2. Monte Carlo analysis 90
Using θup and θlow and the starting point p, the ray circumferential angle φ and cone angle θ are determined by the following random number relation
θup
uplow
cos(φ)π
sin(φ)φθ
φ = θ θ - -Â, ( )1θ θ = (6.2)
The angles θ and φ resulting from equation (6.2) are aligned with respect to a radial coordinate system that is transformed into the lens coordinate system by using:
1
2
sin(φ) tan(θ),cos(φ)
pp
+=
-æççè
pp
u =p
sin(φ)cos(φ)
+p1 2
2 1pp
ö÷÷ø
æççè
ö÷÷ø
(6.3)
The lens system is modelled based on a paraxial approximation [44]. At each lens the ray direction is transformed from u to u’ as shown in equation (6.4). Rays with positions p exceeding the lens clear aperture are discarded from further ray tracing.
( ) ( )- æ ö= - ×ç ÷
è ø
1 211 2
1 2' ' 1
p pu u f
u u (6.4)
The microscopy slides (windows) containing the packed bed are treated as non-absorbing and modelled using the Fresnel equations.
6.2.2 Ray-tracing in the participating medium
The assumptions for modelling the medium are as outlined in chapter 1.4.4. In particular it is assumed that transition effects, which may occur when a ray passes the packed bed boundaries, are negli
91 Chapter 6. A packed bed of ZnO particles
gible in comparison to the absorption and scattering events occurring inside the medium.
The collision-based Monte Carlo method is used to solve for the radiative intensities described by the equation of radiative transfer [36, 97]. Hence, the attenuation path length s is computed via
1 ln( sλ
sβ
= )- Â (6.5)
At the location of attenuation, another random number condition is checked to decide whether absorption or scattering occur. If the condition
Âω ³ ωλ (6.6)
is satisfied, the history of the ray is terminated. Otherwise, the ray is scattered and the scattering direction is obtained from
sca
sca
*sca
0
12π2
Θ
φφ ò * *( ( )) sin d, =ÂΘscaΦ Θ= sca Θsca Θsca (6.7)
where θsca is the scattering cone angle, measured with respect to the direction of the incident ray and φsca is a circumferential angle.
Rays leaving the sample are traced until they either reach the detector surface or get lost. In case of the rotary detector lens system (figure 3.1), the rays are transformed into a local lens coordinate system and traced using equation (6.4).
6.2. Monte Carlo analysis 92
6.2.3 Participating medium properties for independent scattering
Although a number of models for the theoretical prediction of radiative properties in presence of dependent scattering have been presented in literature [7, 138], none of the existing methods was found to be ideal for the present case of polydisperse ZnO particles sized on the order of the radiation wavelength. In a more heuristic than theoretical attempt to get a first estimate for the effective radiative properties (βλ, ωλ and Φλ), a scaling approach similar to the one made by Singh and Kaviany [131] and later discussed and applied by Dombrovsky et al. [33] is taken. The approach consists of first obtaining the independent scattering properties of polydispersed ZnO particles by applying the Mie solutions [12, 30, 97, 138] and then individually scaling the absorption and scattering coefficients while leaving the phase function unchanged. Thus, the unscaled absorption, scattering and extinction coefficients, and the scattering phase function are calculated as
{ } { } ( )¥
= ò abs sca extsca,
0
, ,, , 0.75 dλ λ λ v
Q Q Qκ σ β f f a a
a (6.8)
sca
sca,λ 0
0.75 dλvλ
Q ΦfΦσ
¥
= ò f( ) ( ) ( )aΘ aa
a,Θ(6.9)
In equations (6.8) and (6.9), Qabs(a), Qsca(a), Qext(a) and Φλ(a,Θ) are obtained by using the BHMIE subroutine from Bohren and Huffman [12].
93 Chapter 6. A packed bed of ZnO particles
6.2.4 Empirical approximate scattering phase function approach
As shown in chapter 6.3.2, the aforementioned approach from chapter 6.2.3 based on scaling of independent properties without changing the scattering phase function gives results which are too inaccurate for using them for engineering design purposes. The option of getting better results by trying to perform a more sophisticated theoretical prediction of radiative properties is, due to the involved complexity, beyond the scope of this work. Therefore a more empirical approach is pursued. This empirical approach makes use of an approximate scattering phase function consisting of a variation of the double Dirac-delta approximation outlined by equation (2.6). The non Dirac part of equation (2.6), Φ*, is modelled as a forced symmetric Henyey-Greenstein shaped phase function
( )( )
2
3/22
1
1
gΦ'g
-=
é +ë
Θùû
'
- g' '2 sign cos(Θ) cos(Θ) (6.10)
= ò òπ
*
0 0( ) '( ')sin( ')d ' '( ')sin( ')d '
ΘΦ Θ Φ Θ Θ Θ Φ Θ Θ Θ (6.11)
The reason for not leaving Φ* isotropic is that using values of g’ between 0 and 0.5 leads to an improved agreement with the measurement results in backward direction. To keep the number of variable parameters as low as just necessary for a good fit, the asymmetry factor g, equation (2.1), of Φ* is set to g(Φ*) = 0 by forcing a symmetric shape. The extinction coefficient β, scattering albedo ω, for- and
6.2. Monte Carlo analysis 94
backward scattered fractions ffwd, fbwd and shape g’ are then determined by an iterative trial and error based best fit to the measurement results.
On a side note, the true Henyey-Greenstein phase function is written as [97]
2
HG 3/22
1(Θ)1
gΦg
-=
é +ëùûg2- cos(Θ)
(6.12)
The difference between equations (6.10) and (6.12) is, that (6.10) uses the sign function to force the results for angles in the interval [-90°,90°] to be the same as those between [90°,270°].
6.3 Results
6.3.1 Measured data
Eight packed beds of thickness between 0.85 mm and 2.65 mm were scanned at four wavelengths λ = 555 nm, 650 nm, 800 nm, 900 nm and 1000 nm. Figure 6.3 shows the detector signal with sample (i.e. packed bed and two windows), q, normalised by the signal without sample, q0, plotted against the packed bed thickness st. Within the region of measurements the signal is approximated by an exponential fit with coefficients A1 and A2. It can also be seen that the signal attenuation decreases with increasing wavelength, as expected from the decreasing absorption index of ZnO [31]. This is further reflected in the fit coefficient A2. At 555 nm A2 = (4000 ± 100) m-1 and at 1 µm A2 = (2100 ± 100) m-1.
95 Chapter 6. A packed bed of ZnO particles
0 0.5 1 1.5 2 2.5 3path length st, mm
10-1
10-2
10-3
10-4
10-5
10-6
10-7
norm
alise
d de
tect
or si
gnal
q/q
0, —
555 nm650 nm800 nm900 nm1000 nmA1 exp(-A2st)
Figure 6.3: Normalised detector signal q/q0 versus sample thickness st. Data obtained with the wide-angle transmission set-up, figure 3.2.
The directional distribution of radiation around the sample for the two wavelengths λ = 555 nm and 1000 nm is shown in figure 6.4. In forward direction, i.e. at angles with magnitude smaller than 90°, the detector signal is approximately proportional to the cosine of the viewing angle, indicating diffuse behaviour. In backward direction it was found that the signal is roughly proportional to the product of the cosine of the viewing angle and a Henyey-Greenstein type phase function with asymmetry factor g = -0.4 at 555 nm and g = -0.1 at 1000 nm.
Figure 6.4: Measured normalised signal q/q0 as a function of viewing angle αv for different packed bed thicknesses st at λ = 555 nm and 1000 nm. Data obtained with the main goniometric set-up, figure 3.1.
6.3.2 Performance of the independent scattering (Mie) approach
A first set of simulation runs was carried out based on a scattering phase function obtained by the Mie solution for the polydispersed particles of figure 6.1. The phase function Φ was left unchanged while the extinction coefficient β and scattering albedo ω were adapted to give a best fit to the measurements. A typical result is presented in figure 6.5 and table 6.1. It appears that when matching the measured signal in backward direction, the attenuation in forward direction
97 Chapter 6. A packed bed of ZnO particles
turns out higher than measured. However, the parameter study also revealed that an increased albedo leads to increased agreement in forward direction, at the cost of poorer agreement in backward direction.
st = 0.91 mmst = 1.7 mmCase 1Case 2Case 3Case 4
-180 -120 -60 0 60 120 180
100
10-2
10-4
10-6
10-8
10-10
viewing angle αv , °
norm
alise
d de
tect
or si
gnal
q/q
0 , —
Figure 6.5: Measured data (points) versus Mie phase function based simulation (lines). The normalised detector signal q/q0 is plotted as a function of viewing angle αv for two sample thicknesses st. The wavelength is λ=555 nm. Further details in table 6.1.
6.3. Results 98
β, m-1 ω, — st, mm
Case 1 25.0 × 10³ 0.85 0.91
Case 2 43.0 × 10³ 0.95 0.91
Case 3 25.0 × 10³ 0.85 1.7
Case 4 43.0 × 10³ 0.95 1.7
Table 6.1: Extinction coefficients β, scattering albedos ω, and sample thicknesses st for Cases 1÷4 shown in figure 6.5.
6.3.3 Performance of the empirical approximate scattering phase function approach
The results obtained by trying to scale independent scattering onto the measured dependent scattering results, figure 6.5, were judged to be unsatisfactory for further use in engineering design calculations. Therefore, simulation runs finding a best fit for the approximate double Dirac-delta phase function, equation (2.6), were performed. An initial parameter analysis showed, that in order to get a good solution with the existing measurement data, the forward scattered fraction must be artificially forced to zero, ffwd := 0. The main reason for this is that ffwd competes with σs, which is outlined in the second half of chapter 2.3.3. Another reason is that the employed sample preparation equipment does not allow manufacturing packed bed samples thin enough to measure a pronounced forward peak. Without such a peak resolving any pronounced forward directed behaviour of the scattering phase function is not possible. An important consequence of this is that the determined properties β, ω and fbwd are bound to
99 Chapter 6. A packed bed of ZnO particles
ffwd := 0 and the forced symmetric Henyey-Greenstein part of the phase function Φ*, which, in a sense, makes them apparent properties.
0 1 2 3
100
10-4
10-3
10-1
10-2
norm
alise
d de
tect
or si
gnal
q/q
0, —
sample thickness st , mm
A1 exp(-A2s)measuredMC, fbwd = 0.9MC, fbwd = 0.8
Figure 6.6: Measured data (points) versus model phase function based simulation (lines). The normalised signal q/q0 is plotted as a function of sample thickness st. The data was obtained with the wide-angle transmission set-up, figure 3.2, at a wavelength of 1000 nm.
An intermediate result for λ = 1000 nm, ffwd := 0, fbwd = 0.8 and 0.9, g’ = 0.25, β = 35'000 m-1 and ω = 0.999 is shown in figures 6.6 and 6.7. In figure 6.6 the signal in forward direction is observed as a function of thickness for one viewing angle only. It shows that there first is a steep decay of the signal before gradually taking on the log-linear
6.3. Results 100
slope of the measurement data points. This zone of initial steep decay is interpreted as the region where radiation is predominately attenuated by scattering with only little augmentation by incoming scattering. Once a sufficient amount of scattered radiation is available incoming scattering begins to contribute, which leads to the observed reduced slope.
MC, fbwd=0.8MC, fbwd=0.9
measured
viewing angle αv , °
norm
alise
d de
tect
or si
gnal
q/q
0 , —
100 120 140 160 180
10-2
10-3
10-4
Figure 6.7: Measured data (points) versus model phase function based simulation (lines). The normalised signal q/q0 is plotted as a function of viewing angle αv. The data was obtained with with the main goniometric set-up (figure 3.1 — backward direction) at a wavelength of 1000 nm.
101 Chapter 6. A packed bed of ZnO particles
In backward direction, shown in figure 6.7, it appears that a good agreement can be reached for a backward Dirac peak fbwd
between 0.8 and 0.9. This would imply that at λ = 1000 nm between 80% and 90% of all scattered radiation has a scattering angle θ close to 180°. In the simulation the signal at 180° becomes very strong. Having an experimentally measured signal in that direction will therefore be of great importance for further improving and verifying the approximate phase function. Experimental support for the existence of a strong backward peak can presently be drawn from previous studies on radiative properties of compacted zinc oxide powder [139]. For wavelengths between 0.5 and 1 μm, the reported normal spectral reflectance of compacted zinc oxide powder is in the range of 80%÷99%. The main parameters affecting the normal spectral reflectance in [139] are compaction pressure and particle size distribution.
In a final note it must be said that the present results mainly serve to show the path towards a solution to the problem or, in other words, a “proof of concept”. Reasons for this are that (i) the simulation was not yet run to full convergence, mainly for reasons of time and (ii) the Monte Carlo model is not yet fully matched with the set-up nor validated with respect to the set-up's optical properties. This is further shown in figure 6.8 where the simulated results are compared to those obtained with the goniometric set-up. The settings are as in figures 6.6 and 6.7 with fbwd set to 0.8. There is an obvious mismatch in forward direction between -90° and +90° which is due to the wide-angle transmission set-up used for figure 6.6 not yet being matched to the goniometric set-up used for figures 6.7 and 6.8. This further
6.3. Results 102
demonstrates the importance of properly matching the model to the set-up and experimentally determining the goodness of this match.
viewing angle αv , °
norm
alise
d de
tect
or si
gnal
q/q
0 , —
-180 -120 -60 0 60 120 180
100
10-1
10-8
10-7
10-6
10-5
10-4
10-3
10-2
measured, st = 0.9 mmmeasured, st = 1.7 mmmeasured, st = 2.5 mmmeasured, backwardMC, st = 0.9 mmMC, st = 1.7 mmMC, st = 2.5 mm
Figure 6.8: Measured data (points) versus model phase function based simulation (lines). The normalised signal q/q0 is plotted as a function of viewing angle αv. The data was obtained with the main goniometric set-up (figure 3.1) at a wavelength of 1000 nm. fbwd=0.8.
Chapter 7
Conclusions
The task of determining radiative properties is addressed in three steps: (i) Assessment and review of experimental methods, (ii) design and implementation of experimental set-ups and (iii) measurement and evaluation of reticulate porous ceramics and packed-beds of zinc-oxide.
All considered experimental methods are based on having a sample or samples of the material of interest, irradiating the samples (radiative input), measuring the radiative output and subsequently determining information about the radiative properties by a physical interpretation of the obtained data, mainly done by fitting a radiative model. Samples are predominately irradiated by some form of collimated beam, though hemispherical or near-hemispherical radiation is also possible. The measured quantities can include the overall transmission and reflection, as well as the spatial and directional variation of radiation. With respect to evaluation it is important to have a well defined radiative model that can be fitted to the experimental data without excessive ambiguity and poorly conditioned parameters. Simplified approximative models such as the transport approximation tend to be advantageous in this respect.
105 Chapter 7. Conclusions
In the course of the experimental work the set-up used for the measurements underwent a number of step by step design improvements and adaptations. The first measurements were made with a narrow angle transmission only set-up which was then extended to a goniometric set-up with a receiver that can be rotated around the sample of interest. The main source of radiation is a combined Xenon-arc and Cesiwid globar lamp coupled to a double monochromator, enabling measurements in the range between 0.3 μm and 4 μm. The monochromator is coupled to a chopper for modulation, a set of collecting and receiving lenses and a thermoelectrically cooled detector coupled to a lock-in amplifier and computer for detection and control. An extension of the set-up capabilities into the wider infra-red up to 10 μm with additional optimisation of the optics and the capability of incorporating a furnace was designed in the course of a set-up upgrade, though implementation is still incomplete at the time of writing.
Measurements were performed on a number of different sample materials, including reticulate porous ceramics, calcium carbonate, solid zinc-oxide ceramics, packed-beds of zinc-oxide powder, thin aluminium-oxide plates and packed-beds of tire shreds. Of these measurements the two extensively studied examples of reticulate porous ceramics and packed-beds of zinc-oxide are presented. The measurements on reticulate porous ceramics (RPC) give experimental support for numerically determined extinction coefficients which use geometric data based on tomographic scans. Additional goniometric measurements on RPCs further reveal a particularly strong forward peak which is a direct contrast to the smooth signals obtained with
Chapter 7. Conclusions 106
materials exhibiting a stronger scattering behaviour such as the zinc-oxide samples. Spectral and directional measurements on packed beds of μm sized zinc-oxide particles confirm the expected tendency of decreased attenuation with increasing wavelength. They further allow to experimentally verify the inapplicability of independent scattering for the case of dependently scattering ZnO materials — at least on an indicative basis with respect to that the theoretical and experimental data, as expected, do not agree. It further is shown on an indicative level that the packed bed of zinc-oxide can be modelled with an approximate Dirac based scattering phase function approach, giving good agreement with the experimental data. Perfect agreement has not yet been reached for reasons of incomplete numerical convergence and incomplete matching of the numerical model to the experimental set-up. It further is shown that enabling the measurement of a backward peak at 180° scattering direction is of importance for properly closing the energy balance. Consequently a design for implementing such measurements was made in the framework of the still to be completed set-up upgrade.
With respect to future work the author's recommendation is to first set the emphasis on numerical evaluation of the measurement data. A substantial amount of unevaluated experimental data has already been acquired but not yet evaluated with respect to the extraction of radiative properties. The evaluation approach taken with the packed-bed of zinc-oxide already goes in this direction, but it is still at a very basic level and suffers from low productivity due to the need for a lot of time consuming manual evaluation work. A Monte Carlo ray-tracing based framework to achieve a more flexible
107 Chapter 7. Conclusions
and productive evaluation tool was commenced but not yet completed. Additional options for numerical evaluation are methods based on spherical harmonics and discrete ordinates in combination with a numerical optimisation algorithm. Further work can then focus on obtaining experimental results at elevated sample temperatures. A furnace for this purpose has already been designed and assembled.
In a final conclusion it can be said that the results obtained by this thesis widen the previous understanding on radiatively participating media used in solar energy applications, extend the Professorship of Renewable Energy Carrier's experimental capabilities, and serve as a basis for future work, given in form of hardware, software and experimental experience.
Appendix A
Results from additional materials
A.1 Introduction
This appendix gives a brief overview of additionally investigated materials. All cases lack a full determination of radiative properties in the sense of what is outlined in appendix B, though there is an exception in that most materials allow to determine apparent extinction coefficients obtained from slopes of log-linear regressions (discussed in chapter 2.5.3). Where possible further documents and the measurement data will be made available as outlined in appendix D.
A.2 Tire shreds
Samples made of grainy particles from shredded tires were studied in the framework of the semester thesis Leumann [67]. Both unpyrolysed particles with mean diameters of 0.4 mm and 1.1 mm and porosities (void fraction) of 0.6, as well as pyrolysed particles with a mean diameter of 1.0 mm and porosity of 0.9 were used. The samples were supported by two glass windows and had thicknesses ranging between 2 mm and 6 mm.
109 Appendix A. Results from additional materials
The results were obtained using the main goniometric set-up as covered in chapter 3.2. As the samples have large pores and large porosities, a significant amount of radiation was able to travel through the sample without getting scattered or absorbed and therefore the qualitative behaviour of the results is identical to those obtained when studying reticulate porous ceramics (chapter 5.4).
A.3 Dense aluminium oxide plates
Dense plates made of sintered aluminium-oxide were studied in the framework of the PhD thesis Clemens Suter39. The plates of thickness between 0.2 mm and 1.0 mm were measured at wavelengths of 300 nm, 555 nm, 800 nm and 1000 nm using the main goniometric set-up covered in chapter 3.2. Due to the dense structure and the high transparency of the aluminium-oxide scattering was dominant and produced smooth angular distributions of radiation which are qualitatively identical to those obtained with the backed beds of zinc-oxide particles (chapter 6.3.1).
A.4 Calcium carbonate grains
Loosely packed beds made of Carrara marble grains40 used for the solar production of lime [86] and sized in the range of approximately
39 PhD performed at the Professorship of Renewable Energy Carriers, to be completed. The measurements were taken around April 2009.
40 The main constituent of Carrara marble is calcium carbonate (calcite, CaCO3), though the exact constitution of the material remains unclear.
A.4. Calcium carbonate grains 110
1 mm to 2 mm, with resulting bed thickesses between 5 mm and 13 mm were measured in the framework of the semester thesis Portmann [115]. At the time of the measurements the only available set-up was the narrow angle transmission only type device covered in chapter 3.4. This set-up was found to perform rather poorly for measurements on CaCO3. Three of the main reasons for the poor performance are: (i) Lack of directional data. Directional information is important for this kind of porous CaCO3 packed bed material as there is potential for significant amounts of both scattered as well as un-scattered radiation. Measurements in forward and near forward direction can contribute to getting a better understanding of which effect is dominant. (ii) Lower signal to noise ratio than in the succeeding set-ups (10-6 versus 10-9). (iii) A strong noise base marring the measurements at sample thicknesses above 5 mm.
The radiative properties of the CaCO3 grains were also studied in the PhD work of Sophia Haussener41, who took a tomographic approach similar to the one used for analysing the RPC but this time with also taking the semi-transparent phase into account [47]. A comparison between the tomographic results and the present measurements based on the (apparent) extinction coefficient was not possible, as the noise in the measured data didn't allow performing a log-linear regression.
41 Performed at the Professorship of Renewable Energy Carriers, to be completed in the second half of 2010.
111 Appendix A. Results from additional materials
A.5 Dense ZnO plates
Dense plates made of sintered zinc-oxide and used for lining the walls of a solar-thermal zinc-oxide dissociation reactor [128] were studied for their suitability of performing goniometric measurements. For this purpose a 7 mm × 18 mm wide section of the tile's tip was grinded to a thickness of 0.5 mm and then exposed to the initial transmission mode (chapter 3.4.) set-up's beam. At a wavelength of 550 nm the transmitted part of the radiation was clearly visible by eye and also gave a detector signal on the order of a millivolt, indicating that measurements with the goniometric set-up (chapter 5.4) should be possible.42
42 Further details can be found in the corresponding lab notes “2007-04-13_ZnO_Sintered.pdf ”, by P. Coray.
Appendix B
On solving for radiative properties
B.1 Introduction
During Patrick Coray's PhD most of the emphasis and focus was on acquiring measurement data with comparably little time being allocated to the subsequent step of extracting, i.e. solving for, the radiative properties. In order to make most out of the measurements and indeed obtain the actually desired set of radiative properties a significant amount future work will have to be dedicated to the issue of inverse solving.
The task is two-fold:1. Work up and get an understanding of the knowledge published in
literature.2. Establish or get hold of a code framework for solving.
An initial coverage of the topic is given in chapter 2.4, specifically with figure 2.8 and chapter 2.4.3. The following two sub-chapters will give a some more information.
113 Appendix B. On solving for radiative properties
B.2 Status in literature
The group with perhaps the most persistent activity in the last 25 years is the one associated with Sacadura, Baillis and coworkers. They basically follow a pattern consisting of a discrete ordinates approximation based solution (Sacadura, 1986 [124]) in combination with a least square optimisation based on Gauss linearisation (Nicolau, 1994 [102]). This principle then was more or less carried on into their further work [6, 8, 9, 10, 73, 119, 123].
Further, to some degree more general and different reflections on the inverse approach can be found in McCormik [84], Özisik [107], Modest [97] (chapter 22) and Agarwal [2].
Note that there are a number of other relevant works which, for reasons of time did not make it into this chapter. Much of this work is referenced in the literature mentioned above.
B.3 A summary of thoughts
B.3.1 Requirements
As outlined in figure 2.8, there are two main requirements for solving for radiative properties:
1. A solver for radiation heat transfer in participating media for the same input- / output conditions as the experimental set-up.
2. A solution finder for matching the radiative properties to the experimental results.
B.3. A summary of thoughts 114
B.3.2 Issues and trade-offs
The solver for radiation heat transfer should be able to represent both the sample, and the input- / output conditions of the experimental set-up. It furthermore should — ideally — be fast, as the iterative nature of the solution finding may require finding hundreds of solutions for different radiative properties, sample parameters (i.e. mainly sample thickness) and input conditions. A Monte-Carlo ray-tracing based solver is expected to be more accurate and may also be able to better account for the experimental set-up by including all, or alternatively a selection of, the optical components into the ray-tracing based model. However, Monte-Carlo solvers tend to be slow and therefore a discrete ordinates or spherical harmonics approximation based solution finder may offer a substantially faster alternative. One can also consider finding an initial solution with a fast solver and then refining with Monte-Carlo.
An important constraint arises from the amount of time available for coding, which should not be underestimated. Time is essentially a management issue, where one will have to make a trade-off between achieving a more complete, fast and universally applicable solver suited for long-running productivity and studying many different sample materials or, alternatively, focus on a quick and fast solution for a specific problem with less ability for long-term use and re-use.
The iterative solver can in the simplest case be a non-automated trial and error based approach consisting of manually setting radiative property values, running the participating media solver, and com
115 Appendix B. On solving for radiative properties
paring the simulated with the measured results, for example by visually assessing the agreement between plotted values. In a more sophisticated approach the iterative solution finding is automated, ideally allowing the iterative solver to automatically run and evaluate participating media simulations. Issues on the solver side are the comparison criterion, the stability and the uniqueness of the achieved solution (compare chapter 2.4.3).
Lastly a sound result will include an uncertainty analysis and a verification of the codes and algorithm as a whole. One option for verification is to evaluate one or multiple materials of known radiative properties. The uncertainty analysis should include topics such as the scatter in the measured data, the study of alignment effects and the positioning accuracy (both of the sample and optical set-up).
B.3.3 How solving was addressed for the ZnO beds
For evaluating the packed-bed of ZnO results (chapter 6) a Monte-Carlo ray-tracing code was written specifically for the set-up and sample as used in the ZnO experiments. This code had the advantage that it could be written in relatively short time, but it was never fully tested and also didn't have a great deal of flexibility other than allowing to vary the sample radiative properties and sample thickness via an input file. Changes in the optical set-up, the sample and the scattering phase function had to be hard coded, which cost a lot of time and resulted in many different code versions. Consequently the code ended up being rather messy, but it was very useful in getting some first results in relatively short time.
B.3. A summary of thoughts 116
Solving for the radiative properties was done by hand which was highly time-consuming and error prone as hundreds of solutions had to be managed. Still it did give a first result to start with.
B.3.4 On the incomplete in house MC Radlab software
Due to the experience gained from the ZnO evaluation (appendix B.3.3) the author attempted to write a highly flexible Monte-Carlo code base capable of organising and managing multiple simulations on a computing cluster such as PSI's Merlin43.
Specific aims of the code were to:• Automate hundreds of simulations with varying input parameters.• Allow parameter based implementation of possible changes in
optical components. • Be capable of coordinating, organising and managing hundreds of
calculations.
It turned out that there simply was not enough time to complete44 the rather ambitious code. The issue was not the programming of the core MC ray-tracing, as this is the easiest part. The difficult and tricky thing is trying to make vast parts of the code and the envisaged calculations parametrisable, manageable and flexible.
43 A computing cluster as used for the present work typically consists of multiple CPUs on which jobs may run within a given time limit. The time limit is an important constraint as it requires integrating time management and optimal use of the available resources into the code.
44 The code's documentation is still available but incomplete (appendix D).
117 Appendix B. On solving for radiative properties
In hindsight, the author made a major mistake in not properly taking into account the required time. As a result the code wasn't completed and the time invested (on the order of 3 to 6 months) was lost. Despite the complexity of the inverse analysis task, allocating between 6 and 12 months to get a first and relatively simple code-base and experience that one can build on, should be a reasonable amount of time, provided the focus is set on simplicity rather than achieving all requirements of a full featured solver.
Appendix C
Notes
C.1 On spectral resolution
C.1.1 On the importance of spectral resolution
The need for spectral resolution arises not only from spectrally dependent quantities, but also from the non-linear effect spectral dependence has on radiative transport. This will be explained in the following example:
Assume that a laser beam with two lines at wavelength λ1 and λ2
travels through a purely absorbing medium with absorption coefficients κλ.1 and κλ.2 . The total radiative intensity of the laser beam as a function of path length s then is
- - - -= +.1 0 .2 01 2
( ) ( )0 0( ) ( ) ( )λ λκ s s κ s s
λ λI s I s e I s e (C.1)
Due to the exponential function it is not possible to determine an equivalent absorption coefficient κ capable of directly allowing to express the total radiative intensity as a function of path-length s
- -¹ 0( )0( ) ( ) κ s sI s I s e (C.2)
119 Appendix C. Notes
at least not for the general situation where κλ.1 ≠ κλ.2 and s ≠ constant. It therefore is necessary to determine both κλ.1 and κλ.2. Fortunately many materials allow averaging over certain wavelength bands of near constant radiative properties (see the topic on band approximation in [97, 133]).
C.1.2 Obtaining a narrow wavelength band
spectralsource
laser
LED
broad-band
FTIRmono-chromator
opticalfilter
narrow-band wavelengthseparation
mono-chromatic
+
lamps
arc halogenglowers
globar
mercurywire coil
Figure C.1: Options to achieve spectral resolution (wavelength dependent properties).
Ways to obtain spectrally dependent properties are listed in figure C.1. Lasers directly operate at what can be considered as a single wavelength45. LEDs tend to have 99% bandwidth on the order of
45 Or at least as extremely narrow with, for example, a standard HeNe laser having a bandwidth (or linewidth) of 0.002 nm [25].
C.1. On spectral resolution 120
roughly ± 20 nm … ± 50 nm [25, 126] and can therefore directly be used in applications allowing a somewhat wider band. The other option is to use a broad-band source such as a lamp or a glowing (heated) surface and to combine this with a wavelength separating device such as a wavelength selecting monochromator or a fast fourier infrared spectrometer.
C.2 Measuring 180° reflection at a narrow opening angle
C.2.1 Measuring at almost 180° by tilting the sample
φ'
sample
lensdetector
incomingradiation
-φ'
Figure C.2: Near perpendicular reflection measurement by tilting the sample.
A relatively simple way for measuring narrow angle reflection in near-perpendicular direction is to use a goniometric device, slightly tilt the sample (angle φ' ~ 1° ÷ 15°, depending on the set-up) and measure symmetrically around the sample's normal axis (figure C.2). This method has been used by Cabannes for studying radiative heat
121 Appendix C. Notes
transfer in porous and fibrous materials [13], and is also available as an add-on for commercial devices46.
Critique:Measuring reflection at a narrow opening angle by tilting the sample as in figure C.2 has two major shortcomings: Firstly, if the sample's scattering behaviour is not or only insignificantly affected by tilting the sample, then the method outlined in appendix C.2.1 will reveal little to no information about the amount reflected at 180°. Secondly, a numerical model for solving the radiative output around the sample as a function of radiative input, as used for example by Coray [21], can be capable of returning the output at 180°. Knowing the output at 180° is therefore very useful, especially as otherwise an additional simulation for the tilted case (figure C.2) would have to be performed.
C.2.2 Measuring at 180° by using a beam-splitter
One way of performing a measurement that is truly at 180° is shown in figure C.3. The incoming radiation first has to pass a beam-splitter, thereby loosing a part of its radiation — typically 50% (losses neglected). In turn another 50% of the 180° reflected radiation will get reflected towards the detector, which thus measures at an angle that truly is 180°. The incorporation of this option into the Radlab set-ups has been devised in the course of the SNF sponsored upgrade. Difficulties observed so far lie in alignment, offsets caused by the
46 Example (2010): Brucker A510/Q-T 11° combined transmission and specular reflection accessory.
C.2. Measuring 180° reflection at a narrow opening angle 122
beam-splitter, stability (rigidity) of the set-up. Having to change some parts of the set-up in-between measurements may also be of concern, though the use of of kinematic stages can make this a relatively swift procedure. Calibration can be performed by comparing to the signal obtained with a mirror placed at the sample's location.
sample
lensdetector
incomingradiation
beam-splitter
“lost”radiation
Figure C.3: Measuring reflection at a narrow opening angle by using a beam-splitter.
Appendix D
Extended documentation
An extended documentation containing a technical documentation of the set-up and further material is available on the author's web-page and can also be downloaded as an independent html based cross-linked package.
● The download link is: http://www.yaroc.ch/diss_eth/
● As some of the non-thesis documentation is confidential, a password is required and must be requested from the author:○ [email protected]○ http://www.yaroc.ch/contact/
[1] Affolter R.: “Experimental Characterization of Radiative Properties of Reticulate Porous Ceramics”. Master Thesis, ETH Zurich, 2009.
[2] Agarwal B. M. and Mengüç M.: Forward and Inverse Analysis of Single and Multiple Scattering of Collimated Radiation in an Axisymmetric System. International Journal of Heat and Mass Transfer, Vol. 34, No. 3, pp. 633-647, 1991.doi:10.1016/0017-9310(91)90112-R
[3] Alfano O. M., Bahnemann D., Cassano A. E., Dillert R. and Goslich R.: Photocatalysis in Water Environments Using Artificial and Solar Light. Catalysis Today, Vol. 58, No. 2-3, pp. 199-230, 2000. doi:10.1016/S0920-5861(00)00252-2
[4] Alfano O. M., Romero R. L. and Cassano A. E.: Radiation Field Modelling in Photoreactors — I. Homogeneous Media. Chemical Engineering Science, Vol. 41, No. 3, pp. 421-444, 1986.doi:10.1016/0009-2509(86)87025-7
[5] Alfano O. M., Romero R. L. and Cassano A. E.: Radiation Field Modelling in Photoreactors — II. Heterogeneous Media. Chemical Engineering Science, Vol. 41, No. 5, pp. 1137-1153, 1986. doi:10.1016/0009-2509(86)87087-7
[6] Baillis D. and Sacadura J. F.: Identification of Polyurethane Foam Radiative Properties—Influence of Transmittance Measurements Number. Journal of Thermophysics and Heat Transfer, Vol. 16, No. 2, pp. 200-206, 2002. doi:10.2514/2.6685
[7] Baillis D. and Sacadura J.: Thermal Radiation Properties of Dispersed Media: Theoretical Prediction and Experimental Characterization. Journal of Quantitative Spectroscopy and Radiative Transfer, Vol. 67, No. 5, pp. 327-363, 2000.doi:10.1016/S0022-4073(99)00234-4
[8] Baillis D., Arduini-Schuster M. and Sacadura J. F.: Identification of Spectral Radiative Properties of Polyurethane Foam From Hemispherical and Bi-Directional Transmittance and Reflectance Measurements. Journal of Quantitative Spectroscopy and Radiative Transfer, Vol. 73, No. 2-5, pp. 297-306, 2002. doi:10.1016/S0022-4073(01)00199-6
[9] Baillis D., Pilon L., Randrianalisoa H., Gomez R. and Viskanta R.: Measurements of Radiation Characteristics of Fused Quartz Containing Bubbles. Journal of the Optical Society of America A, Vol. 21, No. 1, pp. 149-159, 2004. doi:10.1364/JOSAA.21.000149
[10] Baillis D., Raynaud M., Sacadura J. F.: Spectral Radiative Properties of Open-Cell Foam Insulation. Journal of Thermophysics and Heat Transfer, Vol. 13, No. 3, pp. 292-298, 1999.doi:10.2514/2.6457
[11] Berberoğlu H. and Pilon L.: Maximizing the Solar to H2
Energy Conversion Efficiency of Outdoor Photobioreactors Using Mixed Cultures. International Journal of Hydrogen Energy, Vol. 35, No. 2, pp. 500-510, 2010. doi:10.1016/j.ijhydene.2009.11.030
[12] Bohren C. F., Huffman D. R.: “Absorption and Scattering of Light by Small Particles”. Wiley, New York, 1983.
[13] Cabannes F., Billard D.: Measurement of Infrared Absorption of some Oxides in Connection with the Radiative Transfer in Porous and Fibrous Materials. International Journal of Thermophysics, Vol. 8, No. 1, pp. 97-118, 1987.doi:10.1007/BF00503227
[14] Caps R., Trunzer A., Büttner D., Fricke J. and Reiss H.: Spectral Transmission and Reflection Properties of High Temperature Insulation Materials. International Journal of Heat and Mass Transfer, Vol. 27, No. 10, pp. 1865-1872, 1984.doi:10.1016/0017-9310(84)90168-6
[15] Chandrasekhar S.: “Radiative Transfer”. Dover Publications, New York, 1960.
[16] Chen J. C. and Churchill S. W.: Radiant Heat Transfer in Packed Beds. AIChE Journal, Vol. 9, No. 1, pp. 35-41, 1963.doi:10.1002/aic.690090108
[17] Cheong W. F., Prahl S. A., Welch A. J.: A Review of the Optical Properties of Biological Tissues. IEEE Journal of Quantum Electronics, Vol. 26, No. 12, pp. 2166-2185, 1990.doi:10.1109/3.64354
[18] Cohen E.R., Cvitaš T., Frey J.G., Holmström B., Kuchitsu K., Marquardt R., Mills I., Pavese F., Quack M., Stohner J., Strauss H.L., Takami M. and Thor A.J.: “Quantities, Units and Symbols in Physical Chemistry — the IUPAC Green Book”. 3rd Edition, RSC Publishing, Cambridge, 2007.
[19] Cohen R. E. and Giacomo P.: “Symbols, Units, Nomenclature and Fundamental Constants in Physics”. Document I.U.P.A.P.-25 (SUNAMCO 87-1), 1987.
[20] Coquard R. and Baillis D.: Radiative Characteristics of Beds Made of Large Spheres Containing an Absorbing and Scattering Medium. International Journal of Thermal Sciences, Vol. 44, No. 10, pp. 926-932, 2005. doi:10.1016/j.ijthermalsci.2005.03.009
[21] Coray P., Lipiński W. and Steinfeld A.: Experimental and Numerical Determination of Thermal Radiative Properties of ZnO Particulate Media. Journal of Heat Transfer, Vol. 132, No. 1, 012701, 2010. doi:10.1115/1.3194763
[22] Coray P., Lipiński W. and Steinfeld A.: SNF project 206021-117372 — Final scientific report. ETH Zürich, February, 2009.
[23] Coray P., Lipiński W. and Steinfeld A.: Spectroscopic Goniometry System for Determining Thermal Radiative Properties of Participating Media. Submitted, 2010.
[24] Coray P., Petrasch J., Lipiński W. and Steinfeld A.: Determination of the Radiation Characteristics of Reticulate Porous Ceramics by Experimental Spectroscopy and by Tomography-based Monte Carlo. Proceedings of the 5th International Symposium on Radiative Transfer, Bodrum, Turkey, June 17-23, 2007.
[25] Csele M.: “Fundamentals of Light Sources and Lasers”. Wiley, Hoboken (New Jersey), 2004. doi:10.1002/0471675210
[26] Dahl J. K., Buechler K. J., Weimer A. W., Lewandowski A. and Bingham C.: Solar-Thermal Dissociation of Methane in a Fluid-Wall Aerosol Flow Reactor. International Journal of Hydrogen Energy, Vol. 29, No. 7, pp. 725-736, 2004.doi:10.1016/j.ijhydene.2003.08.009
[27] Davison B.: “Neutron Transport Theory”. Oxford University Press, London, 1957.
[28] Dereniak E. L. and Crowe D. G.: “Optical Radiation Detectors”. Wiley, New York, 1984.
[29] Di Rocco H., Iriarte D., Pomarico J., Ranea Sandoval H., Macdonald R. and Voigt J.: Determination of Optical Properties of Slices of Turbid Media by Diffuse CW Laser Light Scattering Profilometry. Journal of Quantitative Spectroscopy and Radiative Transfer, Vol. 105, No. 1, pp. 68-83, 2007.doi:10.1016/j.jqsrt.2006.10.003
[30] Dombrovsky L. A.: “Radiation Heat Transfer in Disperse Systems”. Begell House, New York, 1996.
[31] Dombrovsky L., Lipinski W. and Steinfeld A.: A Diffusion-Based Approximate Model for Radiation Heat Transfer in a Solar Thermochemical Reactor. Journal of Quantitative Spectroscopy and Radiative Transfer, Vol. 103, No. 3, pp. 601-610, 2007. doi:10.1016/j.jqsrt.2006.08.003
[32] Dombrovsky L., Randrianalisoa J. and Baillis D.: Modified Two-Flux Approximation for Identification of Radiative Properties of Absorbing and Scattering Media From Directional-Hemispherical Measurements. Journal of the Optical Society of America A, Vol. 23, No. 1, pp. 91-98, 2006.doi:10.1364/JOSAA.23.000091
[33] Dombrovsky L., Schunk L., Lipinski W. and Steinfeld A.: An Ablation Model for the Thermal Decomposition of Porous Zinc Oxide Layer Heated by Concentrated Solar Radiation. International Journal of Heat and Mass Transfer, Vol. 52, No. 11-12, pp. 2444-2452, 2009. doi:10.1016/j.ijheatmasstransfer.2008.12.025
[34] Doornbos R. M. P., Lang R., Aalders M. C., Cross F. W. and Sterenborg H. J. C. M.: The Determination of in Vivo Human Tissue Optical Properties and Absolute Chromophore Concentrations Using Spatially Resolved Steady-State Diffuse Reflectance Spectroscopy. Physics in Medicine and Biology, Vol. 44, No. 4, p. 967, 1999. doi:10.1088/0031-9155/44/4/012
[35] Drezek R., Dunn A. and Richards-Kortum R.: Light Scattering From Cells: Finite-Difference Time-Domain Simulations and Goniometric Measurements. Applied Optics, Vol. 38, No. 16, pp. 3651-3661, 1999. doi:10.1364/AO.38.003651
[36] Farmer J. T. and Howell J. R.: Comparison of Monte Carlo Strategies for Radiative Transfer in Participating Media. Advances in Heat Transfer, Vol. 31, No. , pp. 333-429, 1998.doi:10.1016/S0065-2717(08)70243-0
[37] Fend T., Pitz-Paal R., Reutter O., Bauer J. and Hoffschmidt B.: Two Novel High-Porosity Materials as Volumetric Receivers for Concentrated Solar Radiation. Solar Energy Materials and Solar Cells, Vol. 84, No. 1-4, pp. 291-304, 2004.doi:10.1016/j.solmat.2004.01.039
[38] Fletcher E. A.: Solarthermal Processing: A Review. Journal of Solar Energy Engineering, Vol. 123, No. 2, pp. 63-74, 2001.doi:10.1115/1.1349552
[39] Ganz J., Steiner E. and Sturzenegger M.: Powder Cloud reactors. An Attractive Concept to Run Solar High-Temperature Reactions. Journal de Physique IV France, Vol. 09, No. PR3, p. Pr3-361-Pr3-366, 1999. doi:10.1051/jp4:1999356
[40] Ganz J.: “Entwicklung von Gas-Feststoff-Reaktoren zur solarthermischen Metalloxid-Reduktion”. ETH Zurich Dissertation No. 11634, 1996. doi:10.3929/ethz-a-001616125
[41] Glicksman L., Schuetz M. and Sinofsky M.: Radiation Heat Transfer in Foam Insulation. International Journal of Heat and Mass Transfer, Vol. 30, No. 1, pp. 187-197, 1987.doi:10.1016/0017-9310(87)90071-8
[42] Griffiths P. R., de Haseth J. A.: “Fourier Transform Infrared Spectrometry”. Wiley, Hoboken (New Jersey), 2007.doi:10.1002/047010631X
[43] Groenhuis R. A. J., Bosch J. J. T. and Ferwerda H. A.: Scattering and Absorption of Turbid Materials Determined From Reflection Measurements. 2: Measuring Method and Calibration. Applied Optics, Vol. 22, No. 16, pp. 2463-2467, 1983.doi:10.1364/AO.22.002463
[44] Gross H.: “Handbook of Optical Systems, Volume 1, Fundamentals of Technical Optics”. Wiley, Weinheim (Germany), 2005.
[45] Gusarov A.: A Model of Averaged Radiation Transfer in Two-Phase Heterogeneous Medium. High Temperature, Vol. 47, No. 3, pp. 375-389, 2009. doi:10.1134/S0018151X09030110
[46] Haussener S., Coray P., Lipinski W., Wyss P. and Steinfeld A.: Tomography-Based Heat and Mass Transfer Characterization of Reticulate Porous Ceramics for High-Temperature Processing. Journal of Heat Transfer, Vol. 132, No. 2, pp. 023305-023309, 2010. doi:10.1115/1.4000226
[47] Haussener S., Lipinski W., Petrasch J., Wyss P. and Steinfeld A.: Tomographic Characterization of a Semitransparent-Particle Packed Bed and Determination of its Thermal Radiative Properties. Journal of Heat Transfer, Vol. 131, No. 7, 072701, 2009. doi:10.1115/1.3109261
[48] Haussener S., Lipinski W., Wyss P. and Steinfeld A.: Tomography-Based Analysis of Radiative Transfer in Reacting Packed Beds Undergoing a Solid-Gas Thermochemical Transformation. Journal of Heat Transfer, Vol. 132, No. 6, 061201, 2010. doi:10.1115/1.4000749
[49] Hellmuth T. E. and Matthews L. K.: Modeling and Optimum Design of a Wire Mesh Solar Volumetric Air Receiver. Journal of Solar Energy Engineering, Vol. 119, No. 3, pp. 208-213, 1997.doi:10.1115/1.2888020
[50] Hendricks T. J. and Howell J. R.: Absorption/Scattering Coefficients and Scattering Phase Functions in Reticulated Porous Ceramics. Journal of Heat Transfer, Vol. 118, No. 1, pp. 79-87, 1996. doi:10.1115/1.2824071
[51] Hendricks T. J. and Howell J. R.: New Radiative Analysis Approach for Reticulated Porous Ceramics Using Discrete Ordinates Method. Journal of Heat Transfer, Vol. 118, No. 4, pp. 911-917, 1996. doi:10.1115/1.2822588
[52] Hering E.,·Martin R., Stohrer M.: “Physik für Ingenieure”. Springer, Berlin Heidelberg, 2007.doi:10.1007/978-3-540-71856-7
[53] Hespel L., Mainguy S. and Greffet J.: Radiative Properties of Scattering and Absorbing Dense Media: Theory and Experimental Study. Journal of Quantitative Spectroscopy and Radiative Transfer, Vol. 77, No. 2, pp. 193-210, 2003.doi:10.1016/S0022-4073(02)00123-1
[54] Hischier I., Hess D., Lipiński W., Modest M. and Steinfeld A.: Heat Transfer Analysis of a Novel Pressurized Air Receiver for Concentrated Solar Power via Combined Cycles. Journal of Thermal Science and Engineering Applications, Vol. 1, No. 4, 041002, 2009. doi:10.1115/1.4001259
[55] Hogan R. E. and Skocypec R. D.: Analysis of Catalytically Enhanced Solar Absorption Chemical Reactors: Part i---Basic Concepts and Numerical Model Description. Journal of Solar Energy Engineering, Vol. 114, No. 2, pp. 106-111, 1992.doi:10.1115/1.2929987
[56] Hsu P. and Howell J. R.: Measurements of Thermal Conductivity and Optical Properties of Porous Partially Stabilized Zirconia. Experimental Heat Transfer, Vol. 5, No. 4, pp. 293-313, 1992. doi:10.1080/08916159208946446
[57] Jones P. D., McLeod D. G. and Dorai-Raj D. E.: Correlation of Measured and Computed Radiation Intensity Exiting a Packed Bed. Journal of Heat Transfer, Vol. 118, No. 1, pp. 94-102, 1996. doi:10.1115/1.2824073
[58] Joshi N., Donner C. and Jensen H. W.: Noninvasive Measurement of Scattering Anisotropy in Turbid Materials by Nonnormal Incident Illumination. Optics Letters, Vol. 31, No. 7, pp. 936-938, 2006. doi:10.1364/OL.31.000936
[59] Kaviany M.: “Principles of Heat Transfer in Porous Media”. Springer, New York, 1995.
[60] Kerker M.: “The Scattering of Light, and other Electromagnetic Radiation”. Academic Press, New York, 1969.
[61] Klein H. H., Karni J., Ben-Zvi R. and Bertocchi R.: Heat Transfer in a Directly Irradiated Solar Receiver/Reactor for Solid-Gas Reactions. Solar Energy, Vol. 81, No. 10, pp. 1227-1239, 2007. doi:10.1016/j.solener.2007.01.004
[62] Kodama T., Kondoh Y., Tamagawa T., Funatoh A., Shimizu K. and Kitayama Y.: Fluidized Bed Coal Gasification With CO2 Under Direct Irradiation With Concentrated Visible Light. Energy & Fuels, Vol. 16, No. 5, pp. 1264-1270, 2002.doi:10.1021/ef020053x
[63] Kodama T.: High-Temperature Solar Chemistry for Converting Solar Heat to Chemical Fuels. Progress in Energy and Combustion Science, Vol. 29, No. 6, pp. 567-597, 2003.doi:10.1016/S0360-1285(03)00059-5
[64] Lallich S., Enguehard F. and Baillis D.: Experimental Determination and Modeling of the Radiative Properties of Silica Nanoporous Matrices. Journal of Heat Transfer, Vol. 131, No. 8, pp. 082701-082712, 2009. doi:10.1115/1.3109999
[65] Lange F. F., Miller K. T.: Open-Cell, Low-Density Ceramics Fabricated from Reticulated Polymer Substrates. Advanced Ceramic Materials, Vol. 2, No. 4, pp. 827-831, 1987.
[66] Larkin B. K. and Churchill S. W.: Heat Transfer by Radiation Through Porous Insulations. AIChE Journal, Vol. 5, No. 4, pp. 467-474, 1959. doi:10.1002/aic.690050413
[67] Leumann P.: “Determination of thermal radiative characteristics of shredded waste tire particles.” Semester Thesis, ETH Zurich, 2009.
[68] Linford R. M. F., Schmitt R. J. and Hughes T. A.: “Radiative Contribution to the Thermal Conductivity of Fibrous Insulations”. ASTM Special Technical Publication 544, pp 68-84, 1974. doi:10.1520/STP34772S
[69] Lipiński W., Guillot E., Olalde G. and Steinfeld A.: Transmittance Enhancement of Packed-Bed Particulate Media. Experimental Heat Transfer, Vol. 21, No. 1, pp. 73-82, 2008.doi:10.1080/08916150701647843
[70] Lipiński W., Petrasch J. and Haussener S.: Application of the Spatial Averaging Theorem to Radiative Heat Transfer in Two-Phase Media. Journal of Quantitative Spectroscopy and Radiative Transfer, Vol. 111, No. 1, pp. 253-258, 2010.doi:10.1016/j.jqsrt.2009.08.001
[71] Lloyd P. J.: “Particle Size Analysis”. Encyclopedia of Physical Science and Technology, Meyers R. A. (Editor), pp. 649-654, Academic Press, New York, 2001.doi:10.1016/B0-12-227410-5/00549-4
[72] Lopes R., Delmas A. and Sacadura J.: A New Experimental Device to Measure Directional Spectral Emittance of Semitransparent Media at High Temperatures. High Temperatures • High Pressures, Vol. 32, No. 3, pp. 369-376, 2000.doi:10.1068/htwu133
[73] Lopes R., Moura L. M., Baillis D. and Sacadura J.: Directional Spectral Emittance of a Packed Bed: Correlation Between Theoretical Prediction and Experimental Data. Journal of Heat Transfer, Vol. 123, No. 2, pp. 240-248, 2001.doi:10.1115/1.1338134
[74] Loretz M., Coquard R., Baillis D. and Maire E.: Metallic Foams: Radiative Properties/Comparison Between Different Models. Journal of Quantitative Spectroscopy and Radiative Transfer, Vol. 109, No. 1, pp. 16-27, 2008. doi:10.1016/j.jqsrt.2007.05.007
[75] Maag G., Lipinski W. and Steinfeld A.: Particle-Gas Reacting Flow Under Concentrated Solar Irradiation. International Journal of Heat and Mass Transfer, Vol. 52, No. 21-22, pp. 4997-5004, 2009. doi:10.1016/j.ijheatmasstransfer.2009.02.049
[76] Maiorova A. M., Kotova S. P., Rakhmatulin M. A. and Yakutkin V. V.: Fiber-Optic Backscattering Profile Measurements for Determination of the Optical Coefficients of Turbid Media. Journal of Russian Laser Research, Vol. 24, No. 1, pp. 1-13.doi:10.1023/A:1022573206513
[77] Malato Rodríguez S., Blanco Gálvez J., Maldonado Rubio M. I., Fernández Ibáñez P., Alarcón Padilla D., Collares Pereira M., Farinha Mendes J. and Correia de Oliveira J.: Engineering of Solar Photocatalytic Collectors. Solar Energy, Vol. 77, No. 5, pp. 513-524, 2004. doi:10.1016/j.solener.2004.03.020
[78] Manickavasagam S. and Mengüç M. P.: Effective Optical Properties of Pulverized Coal Particles Determined From FT-IR Spectrometer Experiments. Energy & Fuels, Vol. 7, No. 6, pp. 860-869, 1993. doi:10.1021/ef00042a023
[79] Marchesini R., Bertoni A., Andreola S., Melloni E. and Sichirollo A. E.: Extinction and Absorption Coefficients and Scattering Phase Functions of Human Tissues in Vitro. Applied Optics, Vol. 28, No. 12, pp. 2318-2324, 1989.doi:10.1364/AO.28.002318
[80] Marquet P., Bevilacqua F. P., Depeursinge C. D. and Haller E. B. D.: Determination of Reduced Scattering and Absorption Coefficients by a Single Charge-Coupled-Device Array Measurement, Part I: Comparison Between Experiments and Simulations. Optical Engineering, Vol. 34, No. 7, pp. 2055-2063, 1995. doi:10.1117/12.204798
[81] Martí-López L., Bouza-Domínguez J., Hebden J. C., Arridge S. R. and Martínez-Celorio R. A.: Validity Conditions for the Radiative Transfer Equation. Journal of the Optical Society of America A, Vol. 20, No. 11, pp. 2046-2056, 2003.doi:10.1364/JOSAA.20.002046
[82] Matthews L. K., Viskanta R. and Incropera F. P.: Combined Conduction and Radiation Heat Transfer in Porous Materials Heated by Intense Solar Radiation. Journal of Solar Energy Engineering, Vol. 107, No. 1, pp. 29-34, 1985.doi:10.1115/1.3267649
[83] McCluney R.: “Introduction to Radiometry and Photometry”. Artech House, Boston, 1994.
[84] McCormick N.J.: Inverse Radiative Transfer Problems: A Review. Nuclear Science and Engineering, Vol. 112, pp. 185-198. 1992.
[85] McKellar B. H. J. and Box M. A.: The Scaling Group of the Radiative Transfer Equation. Journal of the Atmospheric Sciences, Vol. 38, No. 5, pp. 1063-1068, 1981.doi:10.1175/1520-0469(1981)038<1063:TSGOTR>2.0.CO;2
[86] Meier A., Gremaud N. and Steinfeld A.: Economic Evaluation of the Industrial Solar Production of Lime. Energy Conversion and Management, Vol. 46, No. 6, pp. 905-926, 2005.doi:j.enconman.2004.06.005
[87] Melchior T., Perkins C., Lichty P., Weimer A. W. and Steinfeld A.: Solar-Driven Biochar Gasification in a Particle-Flow Reactor. Chemical Engineering and Processing: Process Intensification, Vol. 48, No. 8, pp. 1279-1287, 2009.doi:10.1016/j.cep.2009.05.006
[88] Menart A., Lee H. S. and Buckius R. O.: Experimental Determination of Radiative Properties for Scattering Particulate. Experimental Heat Transfer, Vol. 2, No. 4, pp. 309-332, 1989. doi:10.1080/08916158908946371
[89] Merkus H. G.: “Particle Size Measurements”. Springer, 2009.doi:10.1007/978-1-4020-9016-5
[90] Mie G.: Beiträge zur Optik Trüber Medien, Speziell Kolloidaler Metallösungen. Annalen der Physik, Vol. 25, No. 3, pp. 377-445, 1908. doi:10.1002/andp.19083300302
[91] Miller F. and Koenigsdorff R.: Theoretical Analysis of a High-Temperature Small-Particle Solar Receiver. Solar Energy Materials, Vol. 24, No. 1-4, pp. 210-221, 1991.doi:10.1016/0165-1633(91)90061-O
[92] Mills I. M. and Metanomski W. V.: “On the Use of Italic and Roman Fonts for Symbols in Scientific Text”. Interdivisional Committee on Nomenclature and Symbols, IUPAC, December 1999.
[93] Mishchenko M. I., Hovenier J. W., Travis L. D.: “Light Scattering by Nonspherical Particles: Theory, Measurements, and Applications”. Academic Press, San Diego, 2000.
[94] Mishchenko M. I., Travis L. D. and Lacis A. A.: “Multiple Scattering of Light by Particles: Radiative Transfer and Coherent Backscattering”. Cambridge University Press, Cambridge, 2006.
[95] Mishchenko M. I.: Multiple Scattering by Particles Embedded in an Absorbing Medium. 2. Radiative Transfer Equation. Journal of Quantitative Spectroscopy and Radiative Transfer, Vol. 109, No. 14, pp. 2386-2390, 2008.doi:10.1016/j.jqsrt.2008.05.006
[96] Mital R., Gore J. P. and Viskanta R.: Measurements of Radiative Properties of Cellular Ceramics at High Temperatures. Journal of Thermophysics and Heat Transfer, Vol. 10, No. 1, pp. 33-38, 1996. doi:10.2514/3.749
[97] Modest M. F.: “Radiative Heat Transfer”. 2nd Edition, Academic Press, San Diego, 2003.http://dx.doi.org/10.1016/B978-012503163-9/50000-X
[98] Molina E., Fernández J., Acién F. G. and Chisti Y.: Tubular Photobioreactor Design for Algal Cultures. Journal of Biotechnology, Vol. 92, No. 2, pp. 113-131, 2001.doi:10.1016/S0168-1656(01)00353-4
[99] Moura L. M., Baillis D., Sacadura J.F.: Identification of Thermal Radiation Properties of Dispersed Media: Comparison of Different Strategies. Heat Transfer 1998: Proceedings of the Eleventh International Heat Transfer Conference, Kyongju, Korea, Lee J. S. (Editor), Vol. 7, pp. 409-414, 1998.
[100] Mourant J. R., Bigio I. J., Jack D. A., Johnson T. M. and Miller H. D.: Measuring Absorption Coefficients in Small Volumes of Highly Scattering Media: Source-Detector Separations for Which Path Lengths do Not Depend on Scattering Properties. Applied Optics, Vol. 36, No. 22, pp. 5655-5661, 1997. doi:10.1364/AO.36.005655
[101] Nettleship I.: Applications of Porous Ceramics. Key Engineering Materials, Vols. 122-124, pp. 305-324, 1996.doi:10.4028/www.scientific.net/KEM.122-124.305
[102] Nicolau V. P., Raynaud M. and Sacadura J. F.: Spectral Radiative Properties Identification of Fiber Insulating Materials. International Journal of Heat and Mass Transfer, Vol. 37, Supplement 1, pp. 311-324, 1994. doi:10.1016/0017-9310(94)90032-9
[103] Nikulshina V. and Steinfeld A.: CO2 Capture From Air via CaO-Carbonation Using a Solar-Driven Fluidized Bed Reactor — Effect of Temperature and Water Vapor Concentration. Chemical Engineering Journal, Vol. 155, No. 3, pp. 867-873, 2009. doi:10.1016/j.cej.2009.10.004
[104] Nilsson A. M. K., Lucassen G. W., Verkruysse W., Andersson-Engels S. and Gemert M. J. C.: Changes in Optical Properties of Human Whole Blood in Vitro Due to Slow Heating. Photochemistry and Photobiology, Vol. 65, No. 2, pp. 366-373, 1997. doi:10.1111/j.1751-1097.1997.tb08572.x
[105] NIST Special Publication 330: “The International System of Units (SI)”. Taylor B. N. and Thompson A. (Editors), 2008.
[106] NIST Special Publication 811: “Guide for the Use of the International System of Units (SI)”. Thompson A. and Taylor B. N. (Editors), 2008.
[107] Özişik M. N., Orlande H. R. B.: “Inverse Heat Transfer: Fundamentals and Applications”. Taylor & Francis, New York, 2000.
[108] Palik E.D.: “Handbook of Optical Constants of Solids”. Academic Press, San Diego, 1998.
[109] Palumbo R., Keunecke M., Möller S. and Steinfeld A.: Reflections on the Design of Solar Thermal Chemical Reactors: Thoughts in Transformation. Energy, Vol. 29, No. 5-6, pp. 727-744, 2004. doi:10.1016/S0360-5442(03)00180-4
[110] Petrasch J., Möller S. and Steinfeld A.: Solar steam-reforming of hydrocarbons — thermodynamic analysis and process simulation. Proceedings of the 18th International Conference on Efficiency, Cost, Optimization, Simulation and Environmental Impact of Energy Systems — ECOS 2005, pp. 1557-1564, Trondheim, June 20-22, 2005.
[111] Petrasch J., Wyss P. and Steinfeld A.: Tomography-Based Monte Carlo Determination of Radiative Properties of Reticulate Porous Ceramics. Journal of Quantitative Spectroscopy and Radiative Transfer, Vol. 105, No. 2, pp. 180-197, 2007.doi:10.1016/j.jqsrt.2006.11.002
[112] Petrasch J.: “Multi-Scale Analyses of Reactive Flow in Porous Media”. ETH Zurich Dissertation No. 17192, 2007.doi:10.3929/ethz-a-005397926
[113] Piatkowski N., Wieckert C. and Steinfeld A.: Experimental Investigation of a Packed-Bed Solar Reactor for the Steam-Gasification of Carbonaceous Feedstocks. Fuel Processing Technology, Vol. 90, No. 3, pp. 360-366, 2009. doi:10.1016/j.fuproc.2008.10.007
[114] Pickering J. W., Prahl S. A., Wieringen N. V., Beek J. F., Sterenborg H. J. C. M. and van Gemert M. J. C.: Double-Integrating-Sphere System for Measuring the Optical Properties of Tissue. Applied Optics, Vol. 32, No. 4, pp. 399-410, 1993. doi:10.1364/AO.32.000399
[115] Portmann M.: “Spectroscopic measurements of radiativeproperties of packed beds of CaCO3.” Semester Thesis, ETH Zurich, 2007.
[116] Press W. H., Teukolsky S. A., Vetterling W. T. and Flannery B. P.: “Numerical Recipes in Fortran 90: The Art of Parallel Scientific Computing”. Cambridge University Press, Cambridge, 1996.
[117] Pritzkow W. E.: Pressure Loaded Volumetric Ceramic Receiver. Solar Energy Materials, Vol. 24, No. 1-4, pp. 498-507, 1991. doi:10.1016/0165-1633(91)90086-Z
[118] Privoznik K. G., Daniel K. J. and Incropera F. P.: Absorption, Extinction and Phase Function Measurements for Algal Suspensions of Chlorella Pyrenoidosa. Journal of Quantitative Spectroscopy and Radiative Transfer, Vol. 20, No. 4, pp. 345-352, 1978. doi: 10.1016/0022-4073(78)90103-6
[119] Randrianalisoa J. H., Baillis D., Pilon L.: Improved Inverse Method for Radiative Characteristics of Closed-Cell Absorbing Porous Media. Journal of Thermophysics and Heat Transfer, Vol. 20, No. 4, pp. 871-883, 2006. doi:10.2514/1.16684
[120] Reiss H. and Ziegenbein B.: An Experimental Method to Determine Temperature-Dependent Extinction Coefficients and Solid Thermal Conductivities of Glass Fibre Insulations in Calorimetric Measurements. International Journal of Heat and Mass Transfer, Vol. 28, No. 2, pp. 459-466, 1985.doi:10.1016/0017-9310(85)90079-1
[121] Ripoll J., Ntziachristos V., Culver J. P., Pattanayak D. N., Yodh A. G. and Nieto-Vesperinas M.: Recovery of Optical Parameters in Multiple-Layered Diffusive Media: Theory and Experiments. Journal of the Optical Society of America A, Vol. 18, No. 4, pp. 821-830, 2001. doi:10.1364/JOSAA.18.000821
[122] Rozenbaum O., Meneses D. D. S., Auger Y., Chermanne S. and Echegut P.: A Spectroscopic Method to Measure the Spectral Emissivity of Semi-Transparent Materials Up to High Temperature. Review of Scientific Instruments, Vol. 70, No. 10, pp. 4020-4025, 1999. doi:10.1063/1.1150028
[123] Sacadura J. F. and Baillis D.: Experimental Characterization of Thermal Radiation Properties of Dispersed Media. International Journal of Thermal Sciences, Vol. 41, No. 7, pp. 699-707, 2002. doi:10.1016/S1290-0729(02)01365-0
[124] Sacadura J. F., Uny G. and Venet A.: Models and Experiments for Radiation Parameter Estimation of Absorbing, Emitting and Anisotropically Scattering Media. Eighth International Heat Transfer Conference, Vol. 2, Hemisphere, Washington, D.C., 1986, pp. 565-570.
[125] Schaffner B., Meier A., Wuillemin D., Hoffelner W. and Steinfeld A.: Recycling of Hazardous Solid Waste Material Using High-Temperature Solar Process Heat. 2. Reactor Design and Experimentation. Environmental Science & Technology, Vol. 37, No. 1, pp. 165-170, 2003. doi:10.1021/es020056o
[126] Schanda J.: “Light Emitting Diodes”. Encyclopedia of Modern Optics, Guenther B. D. (Editor), pp. 522-526, Academic Press.doi:10.1016/B0-12-369395-0/01258-6
[127] Scheuerpflug P., Caps R., Büttner D. and Fricke J.: Apparent Thermal Conductivity of Evacuated SiO2-Aerogel Tiles Under Variation of Radiative Boundary Conditions. International Journal of Heat and Mass Transfer, Vol. 28, No. 12, pp. 2299-2306, 1985. doi:10.1016/0017-9310(85)90048-1
[128] Schunk L. O., Haeberling P., Wepf S., Wuillemin D., Meier A. and Steinfeld A.: A Receiver-Reactor for the Solar Thermal Dissociation of Zinc Oxide. Journal of Solar Energy Engineering, Vol. 130, No. 2, pp. 021009-021006, 2008.doi:10.1115/1.2840576
[129] Schunk L. O., Lipiński W. and Steinfeld A.: Ablative Heat Transfer in a Shrinking Packed-Bed of ZnO Undergoing Solar Thermal Dissociation. AIChE Journal, Vol. 55, No. 7, pp. 1659-1666, 2009. doi:10.1002/aic.11782
[130] Siegel R. and Howell J. R.: “Thermal Radiation Heat Transfer”. 4th Edition, Taylor & Francis, New York, 2002.
[131] Singh B. and Kaviany M.: Modelling Radiative Heat Transfer in Packed Beds. International Journal of Heat and Mass Transfer, Vol. 35, No. 6, pp. 1397-1405, 1992.doi:10.1016/0017-9310(92)90031-M
[132] Smith B. C.: “Fundamentals of Fourier Transform Infrared Spectroscopy”. CRC Press, Boca Raton (Florida), 1996.
[133] Steinfeld A. and Meier A.: “Solar Fuels and Materials”. Encyclopedia of Energy, Cleveland C. J. (Editor), pp. 623-637, Elsevier, New York, 2004. doi:10.1016/B0-12-176480-X/00322-3
[134] Steinfeld A. and Palumbo R.: “Solar Thermochemical Process Technology”. Encyclopedia of Physical Science and Technology, Meyers R. A. (Editor), pp. 237-256, Academic Press, New York, 2001. doi:10.1016/B0-12-227410-5/00698-0
[135] Steinfeld A.: Solar Hydrogen Production via a Two-Step Water-Splitting Thermochemical Cycle Based on Zn/ZnO Redox Reactions. International Journal of Hydrogen Energy, Vol. 27, No. 6, pp. 611-619, 2002. doi:10.1016/S0360-3199(01)00177-X
[136] Steinfeld A.: Solar Thermochemical Production of Hydrogen — a Review. Solar Energy, Vol. 78, No. 5, pp. 603-615, 2005.doi:10.1016/j.solener.2003.12.012
[137] Tancrez M. and Taine J.: Direct Identification of Absorption and Scattering Coefficients and Phase Function of a Porous Medium by a Monte Carlo Technique. International Journal of Heat and Mass Transfer, Vol. 47, No. 2, pp. 373-383, 2004.doi:10.1016/S0017-9310(03)00146-7
[138] Tien C. L., Drolen B. L.: “Thermal Radiation in Particulate Media with Dependent and Independent Scattering”. Annual Review of Numerical Fluid Mechanics & Heat Transfer, Chawla T.C. (Editor), Vol. 1, pp. 1-32, Hemisphere, New York, 1987.
[139] Touloukian Y. S. and DeWitt D. P.: “Thermal Radiative Properties”. Vols. 7-9 of Thermophysical Properties of Matter, IFI / Plenum, New York, 1970.
[140] Tuchin V.: “Tissue Optics: Light Scattering Methods and Instruments for Medical Diagnosis”. SPIE Press, Bellingham, 1st Edition 2000 & 2nd Edition 2007.
[141] van de Hulst H. C.: “Light Scattering by Small Particles”.Wiley, New York, 1957.
[142] Viskanta R. and Mengüç M. P.: Radiation Heat Transfer in Combustion Systems. Progress in Energy and Combustion Science, Vol. 13, No. 2, pp. 97-160, 1987. doi:10.1016/0360-1285(87)90008-6
[143] Viskanta R. and Mengüç M. P.: Radiative Transfer in Dispersed Media. Applied Mechanics Reviews, Vol. 42, No. 9, pp. 241-259, 1989. doi:10.1115/1.3152430
[144] von Zedtwitz P., Lipinski W. and Steinfeld A.: Numerical and Experimental Study of Gas-Particle Radiative Heat Exchange in a Fluidized-Bed Reactor for Steam-Gasification of Coal. Chemical Engineering Science, Vol. 62, No. 1-2, pp. 599-607, 2007. doi:10.1016/j.ces.2006.09.027
[145] Wang L. and Jacques S. L.: Use of a Laser Beam With an Oblique Angle of Incidence to Measure the Reduced Scattering Coefficient of a Turbid Medium. Applied Optics, Vol. 34, No. 13, pp. 2362-2366, 1995. doi:10.1364/AO.34.002362
[146] Yamada J., Kurosaki Y. and Nagai T.: Radiation Heat Transfer Between Fluidizing Particles and a Heat Transfer Surface in a Fluidized Bed. Journal of Heat Transfer, Vol. 123, No. 3, pp. 458-465, 2001. doi:10.1115/1.1370503
[147] Yang Y. S., Howell J. R. and Klein D. E.: Radiative Heat Transfer Through a Randomly Packed Bed of Spheres by the Monte Carlo Method. Journal of Heat Transfer, Vol. 105, No. 2, pp. 325-332, 1983. doi:10.1115/1.3245582
[148] Yoon G., Welch A., Motamedi M. and Gemert M.: Development and Application of Three-Dimensional Light Distribution Model for Laser Irradiated Tissue. IEEE Journal of Quantum Electronics, Vol. 23, No. 10, pp. 1721-1733, Oct 1987.
[149] Z'Graggen A., Haueter P., Maag G., Vidal A., Romero M. and Steinfeld A.: Hydrogen Production by Steam-Gasification of Petroleum Coke Using Concentrated Solar Power — III. Reactor Experimentation With Slurry Feeding. International Journal of Hydrogen Energy, Vol. 32, No. 8, pp. 992-996, 2007.doi:10.1016/j.ijhydene.2006.10.001
[150] Zijp J. R. and Bosch J. J. T.: Anisotropy of Volume-Backscattered Light. Applied Optics, Vol. 36, No. 7, pp. 1671-1680, 1997. doi:10.1364/AO.36.001671