Macromol. Symp. 133, 11-20 (1998) 11 Determination of the Polymer Tacticity from Calculation of Infrared Spectra Based on Classical Molecular Simulations Armand Soldera CISI, CENISACLAY, Bit. 414, BP 28,91192-Gif-s-Yvette, FRANCE current address: CEA - LR, DMAT/CF/IMO, B.P. 16, 37260 - Monts, FRANCE email address: [email protected]Abstract: The idtared absorption spectra of poly(tetrafluoroethylene), PTFE, and poly(chlorotrifluoroethylene), PCTFE, are simulated using a method based on a combination of classisal molecular simulations of the amorphous polymer phase with Kramers-Kronig relations. The differences and the analogies between experimental and calculated spectra of the non-stereoregular fluoride polymer, PTFE, are first reported. The isotactic and syndiotactic configurations of PCTFE are then investigated. The comparison between experimental and simulated spectra is established on a vibrational analysis. It reveals the preferred syndiotactic configuration adopted by the PCTFE chain. INTRODUCTION Molecular modeling is nowadays a powe&l tool to approach industrial and academic problems. Associated with relevant force fields and the increased computer capacity, predictions of polymer properties become more and more accurate. This technique can thus be used to resolve specific experimental questions. Among properties of interest, polymer stereoregularity is a sensitive parameter since it influences polymer distributions in size and shape. Recently, a method based on a combination of classical molecular amorphous phase simulations with Kramers-Kronig relations has been proposed to determine the intiared spectra of amorphous polymers (Ref 1). The purpose ofthis paper is then to investigate the tacticity of an amorphous polymer by comparing experimental and simulated idtared spectra. The chosen polymer is the poly(chlorotrifluoroethylene), -(-CFzCFC1-),-, PCTFE. The intiared absorption spectrum of simulated poly(tetrafluoethylene), -(-CFz-CFz-), PTFE, is first calculated in order to take into account the differences and the analogies between experimental and calculated spectra of a non- 0 WILEY-VCH Verlag GmbH, D-69469 Weinheim, 1998 CCC 1022-1360/98/$ 17.50
Transcript
Macromol. Symp. 133, 11-20 (1998) 11
Determination of the Polymer Tacticity from Calculation of Infrared Spectra Based on Classical Molecular Simulations
Armand Soldera
CISI, CENISACLAY, Bit. 414, BP 28,91192-Gif-s-Yvette, FRANCE
current address: CEA - LR, DMAT/CF/IMO, B.P. 16, 37260 - Monts, FRANCE
Abstract: The idtared absorption spectra of poly(tetrafluoroethylene), PTFE, and poly(chlorotrifluoroethylene), PCTFE, are simulated using a method based on a combination of classisal molecular simulations of the amorphous polymer phase with Kramers-Kronig relations. The differences and the analogies between experimental and calculated spectra of the non-stereoregular fluoride polymer, PTFE, are first reported. The isotactic and syndiotactic configurations of PCTFE are then investigated. The comparison between experimental and simulated spectra is established on a vibrational analysis. It reveals the preferred syndiotactic configuration adopted by the PCTFE chain.
INTRODUCTION
Molecular modeling is nowadays a powe&l tool to approach industrial and academic problems. Associated with relevant force fields and the increased computer capacity, predictions of polymer properties become more and more accurate. This technique can thus be used to resolve specific experimental questions. Among properties of interest, polymer stereoregularity is a sensitive parameter since it influences polymer distributions in size and shape. Recently, a method based on a combination of classical molecular amorphous phase simulations with Kramers-Kronig relations has been proposed to determine the intiared spectra of amorphous polymers (Ref 1). The purpose ofthis paper is then to investigate the tacticity of an amorphous polymer by comparing experimental and simulated idtared spectra. The chosen polymer is the poly(chlorotrifluoroethylene), -(-CFzCFC1-),-, PCTFE. The intiared absorption spectrum of simulated poly(tetrafluoethylene), -(-CFz-CFz-), PTFE, is first calculated in order to take into account the differences and the analogies between experimental and calculated spectra of a non-
stereoregular fluoride polymer. Moreover, based on the analogy between the spectra of PTFE and PCTFE, already pointed out by Liang and Krimm, such a comparison is helpfd for the spectrum analysis of the two PCTFE confjgurations (Ref 2).
METHOD TO CALCULATE INFRARED ABSORPTION SPECTRA OF POLYMERS
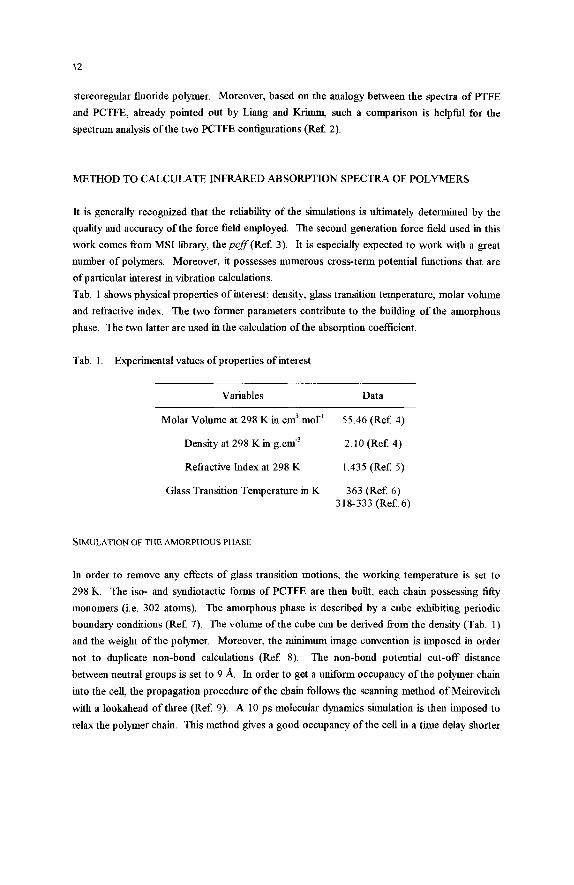
It is generally recognized that the reliability of the simulations is ultimately determined by the quality and accuracy of the force field employed. The second generation force field used in this work comes from MSI library, the pcff(Ref 3). It is especially expected to work with a great number of polymers. Moreover, it possesses numerous cross-term potential fimctions that are of particular interest in vibration calculations. Tab. 1 shows physical properties of interest: density, glass transition temperature, molar volume and refiactive index. The two former parameters contribute to the building of the amorphous phase. The two latter are used in the calculation of the absorption coefficient.
Tab. 1 . Experimental values of properties of interest
Variables Data
Molar Volume at 298 Kin cm3.mol-'
Density at 298 Kin g . ~ r n - ~
Refractive Index at 298 K
Glass Transition Temperature in K
55.46 (Ref 4)
2.10 (Ref 4)
1.435 (Ref 5)
363 (Ref 6) 318-333 (Ref.6)
SIMULATION OF THE AMORPHOUS PHASE
In order to remove any effects of glass transition motions, the working temperature is set to 298 K. The iso- and syndiotactic forms of PCTFE are then built, each chain possessing fiRy monomers (i.e. 302 atoms). The amorphous phase is described by a cube exhibiting periodic boundary conditions (Ref 7). The volume ofthe cube can be derived from the density (Tab. 1) and the weight of the polymer. Moreover, the minimum image convention is imposed in order not to duplicate non-bond calculations (Ref 8). The non-bond potential cut-off distance between neutral groups is set to 9 A. In order to get a uniform occupancy of the polymer chain into the cell, the propagation procedure of the chain follows the scanning method of Meirovitch with a lookahead of three (Ref. 9). A 10 ps molecular dynamics simulation is then imposed to relax the polymer chain. This method gives a good occupancy of the cell in a time delay shorter
13
than the previously proposed method derived fiom simulated annealing (Ref. 1). The dynamics is followed by a series of classical energy minimizations: Steepest Descent, Conjugate Gradient, Newton-Raphson (Ref. 10). The aim of this series is to neglect the first derivative potential in the Taylor series expansion of the potential function by considering very small displacements fiom the equilibrated nuclear position (Eq. 1) (Ref. 11).
,=1
where q, = &Axm are the mass-weighted Cartesian displacement coordinates; rn, corresponds to the mass of the atom a; Ax,, Aya, Az, are the infinitesimal displacements of the coordinates according
ois a subscript corresponding to the equilibrated nuclear position. to the equilibrated nuclear position of the atom a;
Actually, since terms of higher than second order can be dismissed (harmonic approximation), there remains in Eq.1 only the term containing the second derivative energy matrix. This Hessian matrix represents the matrix of force constants. Its diagonalization yields the vibrational modes of the molecule.
D E T E W A T I O N OF THE INFRARED ABSORPTION SPECTRA
The vibrations Pi, associated with the normal mode i, are extracted fiom the Hessian matrix. The associated integral intensity S, is computed fiom the dipole moment (Ref: 12). The vibration and integral intensity data are then introduced in a Lorentz derived function, the Ramsay function, to perform the calculation of the absorption coefficient K(V) (Ref, 13):
r 1
where Vm denotes the molar volume (Tab. 1); vi is the wavenumber of the normal mode i; A& parameter, assigned by the user, corresponds to the full width at half
-
maximum(FwHM).
The Kramers-Kronig relations l i i the real and imaginary parts of the complex refiactive index, n*, according to the wavenumber, C (Ref: 14). Since the imaginary part or extinction coefficient, k, depends linearly on the absorption coefficient, K, (Eq. 3), the real part, n, is computed using Eq. 4. From the Fresnel equations, the calculation of the absorption is then performed (Ref. 15).
14
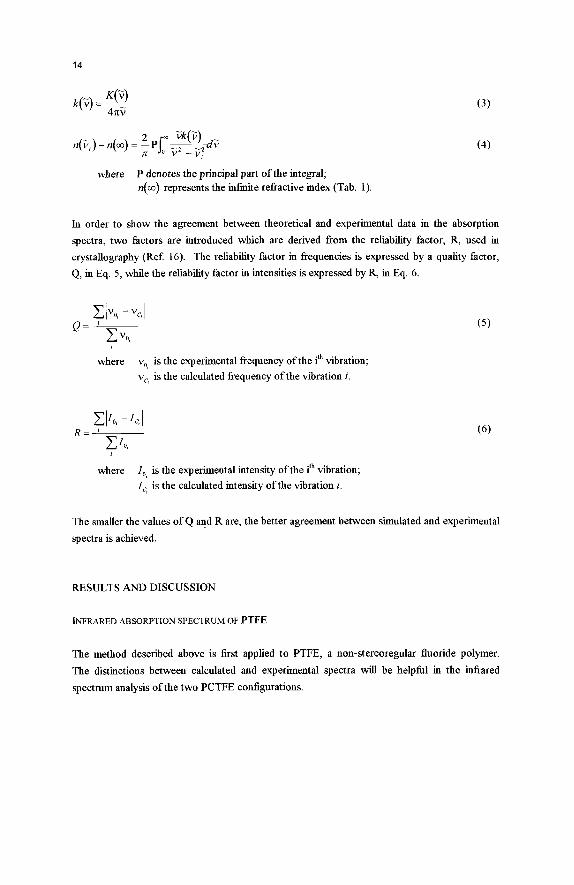
where P denotes the principal part ofthe integral; n(m) represents the in6nite refiactive index (Tab. 1)
In order to show the agreement between theoretical and experimental data in the absorption spectra, two factors are introduced which are derived fiom the reliability factor, R, used in crystallography (Ref. 16). The reliability factor in fiequencies is expressed by a quality factor, Q, in Eq. 5, while the reliability factor in intensities is expressed by R, in Eq. 6.
where vo, is the experimental fiequency of the ith vibration: vc, is the calculated fiequency of the vibration i.
c110, - I , I c 10, Rz '
where I , is the experimental intensity of the ith vibration; I , is the calculated intensity of the vibration 1.
The smaller the values of Q and R are, the better agreement between simulated and experimental spectra is achieved.
RESULTS AND DISCUSSION
INFRARED ABSORPTION SPECTRUM OF PTFE
The method described above is first applied to PTFE, a non-stereoregnlar fluoride polymer. The distinctions between calculated and experimental spectra wiU be helpl l in the in&ared spectrum analysis of the two PCTFE configurations.
15
Since the method concerns only amorphous polymers, crystallization sensitive bands and vibrations of helical conformations could not be predicted. Due to this limitation, simulated spectra have to be compared with the infrared spectra of an amorphous PTFE. The choosen PTFE is a commercial statistical copolymer fiom Dupont de Nemours, TEFLON-AF (Ref. 17). Its chemical structure is shown in Fig. I . It is a combination of tetrafluoroethylene and a fluorinated cyclic ether. This latter group embedded in the chain prevents any steric crystallization. Therefore, the infrared absorption spectrum of this fluoride copolymer will be similar to a poor crystalline PTFE. Simulated and experimental infrared absorption spectra can then be compared and are presented in Fig. 2. For clarity, the predominant infrared vibrations of highly crystalline PTFE are reported into the graphs.
Fig. 1. Chemical structure of TEFLON-AF fkom Dupont de Nemours
Fig. 2. A simulated infrared absorption spectrum of amorphous PTFE (B) is compared to the experimental spectrum of TEFLON-AF (A), a commercial amorphous-like PTFE. The principal vibrations of highly crystalline PTFE are depicted by dotted lines while the two stretching vibrations of amorphous PTFE are indicated by full lines
16
As mentioned in a previous article (Ref I), where the method was applied to PMMA, the calculated intensities in the low fiequency region, below 900 cm-', did not fit with the experimental ones. One explanation is that the full width at halfmaximwq FWHM, in Eq. 3 , is assumed to be constant; actually, this is not the case. We presently investigate the dependence of FWHM with regard to the kind of normal vibration, and the frequency region (Ref 18). The first results clearly show that the FWHM is greater in the low fiequency domain than in the high fiequency domain. This parameter can be compared to the damping value in the dispersion theory. The stretching vibrations, mainly located in the high frequency region, .are less restrained, i.e. possess less degree of fieedom, than rocking or wagging vibrations mainly located in the low frequency region. Therefore, rocking or wagging vibrations exhibit a higher value of FWHM than the stretching vibrations do. As a matter of fact, a higher value of FWHM in Eq. 3 reduces the absorption coefficient K(V) . Moreover, in the electric moment expanded
as a power series in terms of the coordinates of the atoms, terms higher than the first order are neglected (Ref 19). Since the absorption intensity is a fhction of the dipolar moment first derivatives (Eq. 2), the variation pf the dipolar moment in the rocking and wagging vibrations, accountable for low fiequency absorptions, is not adequately expressed. In the high fiequency region, the two antisymmetric vibrations associated with the CF2 stretching mode are represented. Their positions differ fiom highly crystalline PTFE vibrations, represented by the dotted lines in Fig. 2, by at least SO cm" (Refs. 20, 2), but fit with the two stretching vibrations of amorphous PTFE, TEFLON-AF, represented by full lines. Therefore, vibrations due to the helical form of PTFE are not considered in the calculation. This result was expected, since the calculations are accomplished in the amorphous phase of the polymer. PCTFE possesses a complicated crystalline structure composed of different kind of helices (Refs. 21-24) that could not actually be seen by the method. However due to its low crystallinity, approximately 20 % (Ref 25), the use of the method is allowed.
INFRARED ABSORPTION SPECTRUM OF PCTFE
The simulated idkared spectra of the two configurations of PCTFE are compared to the PCTFE experimental spectrum in Fig. 3 . The commercial PCTFE is an Aclar 22A fiom Allied Signal Inc. Since the intensity cannot be calculated quantitatively, the intensities of all the three spectra are normalized. Each major peak intensity in the three spectra is fixed to 100.
17
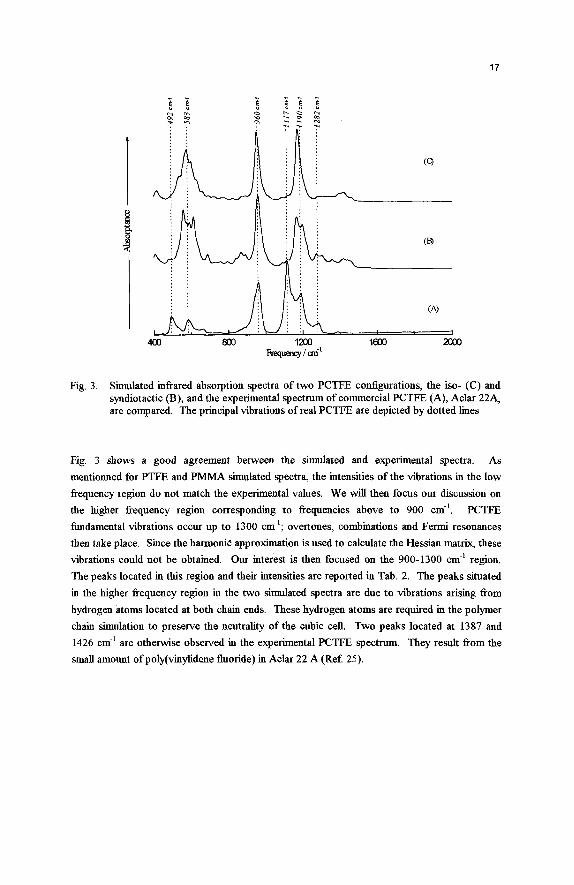
Fig. 3. Simulated infiared absorption spectra of two PCTFE configurations, the iso- (C) and syndiotactic (B), and the experimental spectrum of commercial PCTFE (A), Aclar 22A, are compared. The principal vibrations of real PCTFE are depicted by dotted lines
Fig. 3 shows a good agreement between the simulated and experimental spectra. As
mentionned for PTFE and PMMA simulated spectra, the intensities of the vibrations in the low fiequency region do not match the experimental values. We will then focus our discussion on the higher fiequency region corresponding to fiequencies above to 900 cm-'. PCTFE limdamental vibrations occur up to 1300 cm-'; overtones, combinations and Fermi resonances then take place. Since the harmonic approximation is used to calculate the Hessian matrix, these vibrations could not be obtained. Our interest is then focused on the 900-1300 cm-' region. The peaks located in this region and their intensities are reported in Tab. 2. The peaks situated in the higher fiequency region in the two simulated spectra are due to vibrations arising fiom hydrogen atoms located at both chain ends. These hydrogen atoms are required in the polymer chain simulation to preserve the neutrality of the cubic cell. Two peaks located at 1387 and
1426 cm-' are otherwise observed in the experimental PCTFE spectrum. They result &om the small amount of poly(vinylidene fluoride) in Aclar 22 A (Ref. 25).
Tab. 2. Vibrational modes and frequencies in the 900-1300 cm-l region for the experimental spectrum of PCTFE and the two simulated configurations
Vibrational Experimental Syndiotactic Isotactic Assignment Frequency Intensity Frequency Intensity Frequency Intensity
in cm-l in cm-' in cm-'
1282.4 23 1275 21 1285 8 CF stretching
CF2 antiqm stretching
stretching
c c 1 stretching
1190 60 1199 60 1175 100
CF2 SW. 1 1 17 100 1169 71 1175 100
960 74 960 100 955 96
From comparison between simulated and experimental data, the syndiotactic configuration seems to be the predominant configuration in PCTFE. To corroborate this result, a vibrational analysis based upon the detailed vibrational analysis of PCTFE by Liang and Krimm, is performed: the frequencies were assigned from vibrational analysis of PTFE, and are shown in Tab. 2. The antisymmetric and symmetric experimental stretching vibrations of CF2, are located at 1190 and 11 17 cm-l, respectively. The splitting of fiequencies is only seen in the simulated syndiotactic form of PCTFE. It has to be noted that Krimm mentioned that a characteristic spectral feature of a syndiotactic structure is the splitting in some of the bands (Ref 20). In the simulated PCTFE isotactic form, the difference between the two vibrations is less than 15 cm-l. This value corresponds to the FWHM of the Ramsay function used to simulate the spectrum (Ref. 13). Such a behavior is not in accordance with simulated PTFE spectrum results, where the two calculated stretching vibrations correctly fit the experimental ones. On the other hand, the syndiotactic contiguration spectrum exhibits the two CF2 stretching vibrations located at 1 199 and 1169 cm.'. Moreover, this spectrum clearly shows the CF stretching vibration at 1282 cm-'. Regarding the CCl vibration at 955 cm", the two simulated spectra adequately express it. The quality and reliability factors are now introduced to establish in a quantitative way the accuracy between simulated and experimental spectra. For their calculation in the isotactic form spectrum, the two experimental CF2 stretching vibrations are related to only one peak in the simulated spectrum. The values of the two configuration factors in the 900- 1300 cm.' region are shown in Tab. 3.
Tab. 3. Quality and reliability factors ofthe two simulated PCTFE configuration spectra
Factors Syndiotactic Isotactic Q 0.015 0.018
R 0.22 0.3
19
Tab. 3 indicates that the quality and reliability factors are better for the syndiotactic configuration than for the isotactic configuration as was expected fiom vibrational analysis. Therefore, the PCTFE syndiotactic infkared spectrum shows a better agreement with the experimental spectrum than the isotactic form. According to this analysis, the syndiotactic configuration is predominant in PCTFE. This predominance was confirmed experimentally by I3C NMR spectroscopy (Ref. 26). In fact, the stereochemical configuration of the chain is very irregular, although not strictly random or “atactic”. From a polymerization point of view, the higher activation entropy of a syndiotactic propagation compared to an isotactic propagation makes the chlorine altemance preferred (Ref. 27).
CONCLUSIONS
The analysis between simulated and experimental infi.ared spectra reveals that the syndiotactic form of PCTFE is predominant in real PCTFE. Such a chain behavior is con6rmed experimentally. Therefore, the procedure based on empirical methods associated with modeling and computational strategies, cap be used to determine the configurational characteristic of polymers. Nevertheless, the method has to be improved in the low fiequency region, where inconsistencies in the relative intensities between simulated and experimental spectra are observed. The dependence of the FWHM versus vibration modes and fiequencies is presently looked at in order to solve the problem (Ref. 18).
EXPERIMENTAL PART
The molecular simulation was performed using a Silicon Graphics Indigo 2 XZ. The simulation results were obtained using software programs fiom Molecular Simulation Inc. of San Diego. Estimation of physical properties of polymers were carried out with S’nthia@. Molecular mechanics and dynamics simulations were performed with the Dzscover-3@ program The amorphous polymer modeling was conducted with the Arnorphom-Celp program. The experimental absorption spectra were obtained with polymer fjlms of TEFLON-AF fiom Dupont de Nemours and Aclar 22A PCTFE fiom AUied Signal Inc. with a thickness of 50 and 38 p~m, respectively. They were measured on a BRUKER IFS88 FTIR-Spectrometer.
ACKNOWLEDGEMENTS
This work has been possible through the financial support and facilities of the CEA-LR. The author wishes to thank Dr I. Wartenberg and Mr. P. Coquard for the experimental measurements on PTFE and PCTFE lihns and, Dr P. Topart for the English corrections.
(2) C.Y. Liang, S. Krimm,J. Chem. Phys., 25(3), 563 (1956). (3) Discover-38 fiom Molecular Simulation Inc. fiom San Diego (4) J.D. H o h , Weeks J.J., J. Res. Nut. Bur. Stand., 60, 465 (1958). (5) C.A. Sperati, “Physical Constants of Fluoropolymers” in Polymer Handbook, 3rd edition,
J. Brandrup and E.H. Immergut Eds., J. Wiley & Sons, New York (1989), p. V/55. (6) A. J. Bur, ‘%electric Properties of Fluorine-Containing Polymers” in “Fluoropolymers”,
Wall L.A. Ed., Wiley Interscience, New York (1972), p. 490. (7) D.N. Theodorou, U.W. Suter, Macromolecules, 19, 139 (1986). (8) M.P. Allen, D.J. Tildesley, “Computer Simulation of Liquids”, Clarendon Press, Oxford
(1987). (9) H. Meirovitch, J. Chem. Phys., 79( I), 502 (1983); Macromolecules, 18, 569 (1985). (10) U. Burkert, N.L. AUinger, “Molecular Mechanics”, ACS Monograph 177, Washington
D.C. (1982). (1 1) P.C. Painter, M.M. Coleman, J.L. Koenig, “The Theory of Vibrational Spectroscopy and
zts Application to Polymeric Materials”, J. Wiley & Sons, New York (1982). (12) J. Overend, in “Znfrared Spectroscopy and Molecular Structure”, Ed. M. Davies, Elsevier
(1963), p. 345. (13) R.N. Jones, C. Sandorfy, “The application of Inl?ared and Raman Spectrometry to the
Elucidation of Molecular Structure” in “Chemical Applications of Spectroscopy -
Techniques of Organic Chemistry”, vol. IX, W. West Ed., J. Wiley & Sons, New York (1956), p. 247.
(14) Ohta Koji, Ishida Hatsuo, Appl. Spectrosc., 42,952 (1988). (15) A. Soldera, to be published. (16) L.E. Alexander, “X-Ray Dffiaction in Polymer Science”, J. Wiley & Sons, New York
(1969). (17) P. Korinek, Materzaux et Techniques, 03-04, 41 (1991). (18) A. Soldera, H. Mathis,-to be published. (19) P.C. Painter, M.M. Coleman, J.L. Koenig, “The Theory of Vibrational Spectroscopy and
its Application to Polymeric Materials”, J. Wiley & Sons, New York (1982), p. 175. (20) S. Krimm, Forschr. H0chpolym.-Forsch., Bd. 2, S.51 (1960). (21) H.S. K a u h n , J. Am. Chem. Soc., 75, 1477 (1953). (22) L.G. Roldan, H.S. Kaufinan, Norelco Reporter, 10, 11 (1963). (23) Z. Mencik,J. Polym. Sci., 11, 1585 (1973). (24) N.S. Murthy and H. Minor, Polymer, 36,2499 (1995). (25) Allied Signal Inc., brochure ofAclar. (26) G.V.D. Tiers, F.A. Bovey,J. Polym. Sci., Part. A, 1, 833 (1963). (27) S. Chandrasekaran, “Chlorotrifluoroethylene homopolymer” in “Encyclopedza of Polymer
Science andEngineering”, vol. 3, J. Wiley & Sons, New York (1987), p. 463.