Determination of Tolerable Transmitter EIRP Levels for High Precision GNSS Receivers 57th Meeting of the CGSIC at the ION GNSS+ 2017 Conference Portland, Oregon September 25, 2017 Advancing transportation innovation for the public good Hadi Wassaf, Stephen Mackey, Karen Van Dyke
Transcript
Determination of Tolerable Transmitter EIRP
Levels for High Precision GNSS Receivers
57th Meeting of the CGSIC at the ION GNSS+ 2017 Conference Portland, Oregon
September 25, 2017
Advancing transportation innovation for the public good
Hadi Wassaf, Stephen Mackey, Karen Van Dyke
Determination of Tolerable Transmitter EIRP
Levels for High Precision GNSS Receivers
57th Meeting of the CGSIC at the ION GNSS+ 2017 Conference Portland, Oregon
September 25, 2017
Advancing transportation innovation for the public good
Hadi Wassaf, Stephen Mackey, Karen Van Dyke
3
Acknowledgement
George Dimos
Pratik Gandhi
Chris Hegarty
Karl Shallberg
4
Outline
GPS Adjacent Band Compatibility Assessment Background
Technical approach
Receiver testing and results for high precision (HPR) receivers
HPR example use case
Transmit network and handset/mobile device parameters
Receive antenna patterns
Results and sensitivity analysis
Summary and Conclusion
5
GPS Adjacent Band Compatibility Assessment
Background
Propose adjacent band transmit power levels that can be tolerated by existing GNSS receivers for civil applications [excluding certified aviation applications - those are considered in a parallel FAA effort]
Accomplish this through: Seeking users, manufacturers, and other
stakeholders’ inputs and feedback throughout the planning, testing and analysis phases of this effort
Investigating use cases to determine practical limiting scenarios
GNSS receiver testing and antenna characterization
Data analysis to develop 1 dB CNR degradation interference tolerance masks (ITMs) for each GNSS receiver
Development of generic transmitter (base station and handheld) scenarios
Analysis and modeling to determine tolerable transmit power levels and regions of impact
6
Technical Approach
• Interference Criterion: 1-dB CNR degradation
• Anechoic chamber testing of receivers to determine the receive interference power (IP*) threshold level for each receiver according to the above criterion
• The minimum IP* threshold across a category of GNSS receivers is used to determine ITM(f) for that category
• Transmitter parameters, receiver parameters, and antenna characteristics are then used to determine tolerable transmit power levels for each category.
• This presentation addresses the HPR category *IP is referenced to the output of a hypothetical ideal isotropic antenna collocated with the receiver antenna, and having a
polarization matching that of the radiated interference signal. It is essentially a measure of the intensity of the electromagnetic wave impinging on the receiver antenna
7
Receiver Testing : Overview
GNSS receiver testing was carried out April 25-29, 2016 at the Army Research Laboratory's (ARL) Electromagnetic Vulnerability Assessment Facility (EMVAF), White Sands Missile Range (WSMR), NM
Participation included DOT’s federal partners/agencies (USCG, NASA, NOAA, USGS, and FAA) and GPS manufacturers Air Force/GPS Directorate conducted testing week of April 18th
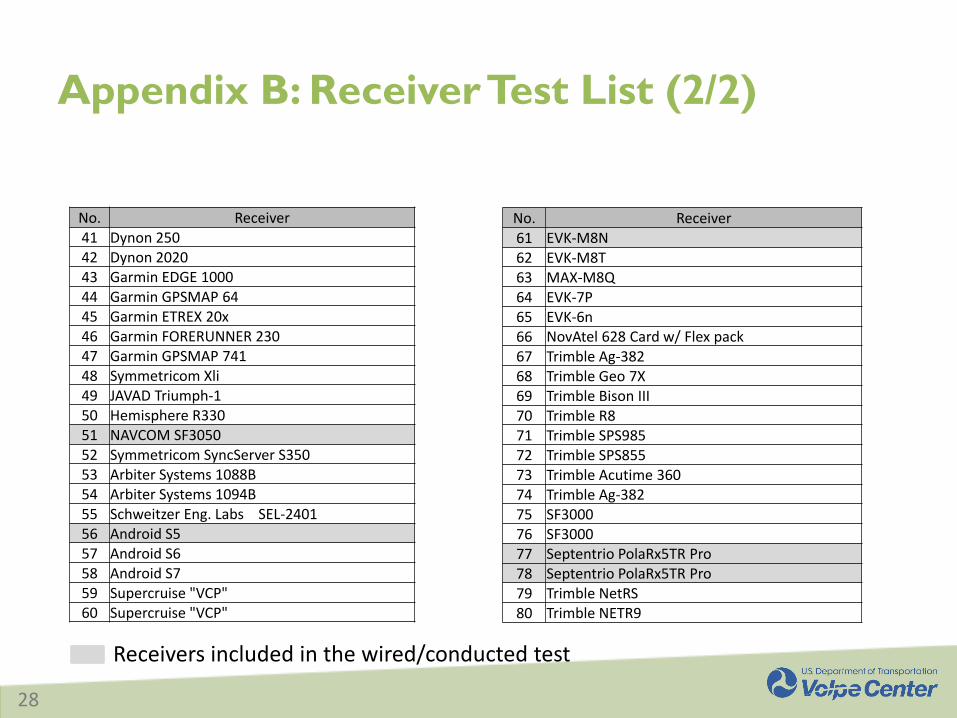
80 receivers were tested representing six categories of GPS/GNSS receivers: General Aviation (non certified), General Location/Navigation, High Precision & Networks, Timing, Space Based, and Cellular
Tests performed in the anechoic chamber: Linearity (receivers CNR estimators are operating in the linear region)
1 MHz Bandpass Noise (Type 1)
1 MHz In-Band Noise (Type 1)
10 MHz Long Term Evolution (LTE) (Type 2)
Intermodulation (effects of 3rd order intermodulation)
Example for determining ITM(f) for 1 frequency (f=1545) for PRN 31 for one of the Devices Under Test (DUT)
IP vs. Time
CNR vs. Time
1 (dB)
𝑰𝑻𝑴 𝒇
12
Receiver Testing: Determination of Tolerable
EIRP levels
It can be shown that the tolerable EIRP of a transmitter radiating a +/- 45o cross polarized interference signal can be determined according to the following equation
𝒅𝒔
Use case analysis region
TX antenna
Rx antenna
𝒓
𝑿
𝒓𝑻
𝒁
𝐸𝐼𝑅𝑃 𝑟 , 𝑓 =𝐼𝑇𝑀 𝑓
𝐿𝑝 𝑟 𝑇 , 𝑟 . 𝑔𝑇𝑑 𝑟 𝑇, 𝑟 .12
𝑔𝑅𝑑𝑣 𝑟 𝑇, 𝑟 , 𝑓 + 𝑔𝑅𝑑ℎ 𝑟 𝑇, 𝑟 , 𝑓
𝐸𝐼𝑅𝑃(𝑑𝑠, 𝑓) = 𝑀𝑖𝑛𝑟 𝜖𝑹𝒖𝒄 𝐸𝐼𝑅𝑃 𝑟 𝑇 , 𝑟 , 𝑓
Normalized H-pol and V-pol receiver antenna patterns
Free Space Path Loss (FSPL)
Normalized transmitter antenna pattern assumed to be the same for H an V polarized radiations
Transmit Network Parameters: ITU-R M.2292 Small Cell
Base Stations
Small cell outdoor/ Micro urban • 5 dBi antenna gain • Linear polarization • Single sector • No downtilt • EIRP: 40 dBm • 6 m height • 1 – 3 per Urban macro cell
• Azimuth pattern is omnidirectional • Plot above is an elevation cut
19
Handset/Mobile Device Parameters
23 dBm EIRP (assumes 0 dBi antenna gain and no body loss)
Isotropic transmit antenna gain
Vertical polarization
Assumed to be at 2 m height above ground
20
Receive Antenna Characteristics: VPOL and
HPOL Patterns
• Antenna patterns are generated by a parabolic fit to average gain patterns of a representative set of HPR antennas measured in an anechoic chamber
• Averaging across antenna patterns is performed separately for each frequency and polarization combination prior to fitting
• Below are example antenna patterns used in the tolerable EIRP analysis for one downlink frequency (1530 MHz) and one uplink frequency (1630 MHz)
21
Results: Tolerable EIRP Levels: Single Base Station
Transmitter, FSPL
For a 1530 MHz interference signal, the tolerable EIRP Levels are below 0.25 watts at a standoff distance of ½ km
At 10m stand-off distance the tolerable EIRP ranges from 1 𝜇𝑊 to 1 𝑚𝑊 for interference for an interference signal with center frequency in the 1500 to 1550 frequency range
For a 1675 MHz interference signal the tolerable EIRP is on the order of 30 𝑚𝑊 for the same 10m stand-off distance
22
Handset (2m height, 23 dBm EIRP)
Results: Region of Impact for ITU Recommended
Power Levels Discussed in Previous Slides
≥ 1 dB C/N0 degradation
Loss of lock of satellites with 10 dB attenuation
Loss of lock of all satellites with clear sky visibility
Micro urban base station (6m height, 40 dBm EIRP)
Macro urban base station (25m height, 59 dBm EIRP)
Due to the periodicity of transmitter placement, the vertical analysis plane (y=0) need to extend only up to X=ISD/2.
Interference is dominated by a single transmitter for standoff distances less than 20m
The aggregate tolerable EIRP decreases monotonically relative to the single transmitter case to a maximum reduction of 6 dB at the mid-point location between two consecutive transmitters
𝑿
𝐼𝑆𝐷
2
* Inter-site distance (ISD) Based on ITU-R M.2292 TABLE-3 typical cell radius/cell density to be used in sharing studies. See appendix B
24
Sensitivity Analysis: Sensitivity to Propagation Loss
Models
Two-ray path loss model* reduces the tolerable EIRP levels by up to 6 dB
Difference is less significant for small distances due to the combined effects of transmit/receive (T/R) antenna patterns
* See appendix C for two-ray path loss model equations
25
Summary and Conclusion
Inverse modeling allows determination of tolerable EIRP levels when the receiver tolerable IP levels are known
Model takes into account the polarization dependent gain pattern of T/R antennas and is capable of considering aggregation and propagation model effects from multiple transmitters
For a micro-urban base station radiating a 10 MHz LTE signal, the tolerable transmit EIRP levels ranges from 1𝜇𝑊 𝑡𝑜 1𝑚𝑊 for center frequencies between 1500 and 1550, and is 30 𝑚𝑊 for the 1675 center frequency
Sensitivity analysis results for micro urban network configuration: Aggregation effects will limit the maximum tolerable power at larger distances up to the maximum
distance of ISD/2
Two ray path loss model results in a reduction of up to 6 dB at the maximum distance of ISD/2
When the recommended ITU power levels for transmitters are used, the maximum extent of the impact regions are