Page 1
DETERMINATION OF TOTAL AND D-AMINO ACID CONTENT IN MICE BRAIN TISSUE
BY ACHIRAL-CHIRAL HEART-CUTTING TWO-DIMENSIONAL LIQUID
CHROMATOGRAPHY: DIAGNOSTIC AND CLINICAL RELEVANCE AND A
COMPARISON BETWEEN NON-PERFUSED AND PERFUSED TISSUE
by
CURRAN PARPIA
Presented to the Faculty of the Graduate School of
The University of Texas at Arlington in Partial Fulfillment
of the Requirements for the Degree of
MASTER OF SCIENCE IN CHEMISTRY
THE UNIVERSITY OF TEXAS AT ARLINGTON
December 2015
Page 2
ii
Copyright © by Curran Parpia 2015
All Rights Reserved
Page 3
iii
Acknowledgements
I would like to acknowledge our collaborators from Johns Hopkins, Dr. Adam
Hartman and Polan Santos for turning to us for the analytical work presented here.
Additionally, Polan sacrificed and dissected the mice, sent the tissue to analyze, and
provided a detailed method summarized in the experimental section. My colleague,
Choyce Weatherly was instrumental in this work and assisted me tremendously
throughout the project.
Now, to acknowledge in one page the persons without whom completion of my
Master’s Thesis would have been impossible is itself impossible. First and foremost, I
would like to thank my parents for instilling in me the value that a good education is
irreplaceable and for opening every door for me, even when I slammed them shut. Their
unwavering support and belief provided me with endless possibilities throughout my life. I
would like to thank my sister, Nina, for always loving me even when I did not love myself.
Additionally, I would like to thank my committee members, Dr. Mandal and Dr. Dasgupta
both of whom have continually given me nothing but support. Their faith in my abilities
tethered me to the path to success when I pulled hardest. I have gained a great deal of
knowledge from both professors and one day hope to know a fraction of the chemistry
they have forgotten. I would like to thank my friends who were just that when I was not. I
would like to thank Genesia Rivera for providing a light in dark places when all others
went out. Finally, to Dr. Armstrong: thank you for sticking with me through the hardest
period in my life and for giving me a place to practice chemistry when it was all I had and
still tried to throw away.
August 24, 2015
Page 4
iv
Abstract
DETERMINATION OF TOTAL AND D-AMINO ACID CONTENT IN MICE BRAIN TISSUE
BY ACHIRAL-CHIRAL HEART-CUTTING TWO-DIMENSIONAL LIQUID
CHROMATOGRAPHY: DIAGNOSTIC AND CLINICAL RELEVANCE AND A
COMPARISON BETWEEN NON-PERFUSED AND PERFUSED TISSUE
Curran Parpia, MS
The University of Texas at Arlington, 2015
Supervising Professor: Daniel W. Armstrong
A heart-cutting two dimensional liquid chromatographic method for the
quantification of free amino acid enantiomers from mouse brain tissue is demonstrated.
Evidence to support the occurrence of D-amino acids in significant concentrations in
physiological samples has spurred studies toward the elucidation of their importance and
function. In this work, the level and regional distribution of select amino acids were
determined by achiral-chiral LC/LC. Additionally, the effect of tissue perfusion on these
levels was investigated. The free amino acid extracts were analyzed as their 9-
fluorenylmethyloxycarbonyl derivatives and separated in the reverse phase mode on
superficially porous C18. In the second dimension, enantiomers of selected amino acids
were separated using a house prepared column featuring superficially porous silica
derivatized with teicoplanin, a chiral selector known to exhibit excellent selectivity toward
isomers of native and N-blocked amino acids. Total concentrations of free amino acids
were determined through the use of an internal standard and enantiomeric ratios for 11
standard amino acids were determined with high sensitivity using fluorometric detection.
Page 5
v
Because some D-amino acids have been suggested to play a role in neurodevelopment
and neurotransmission, and may have potential as disease biomarkers, the interest in
their occurrence and disposition has recently grown.
Page 6
vi
Table of Contents
Acknowledgements .............................................................................................................iii
Abstract .............................................................................................................................. iv
List of Illustrations ..............................................................................................................iix
List of Tables ...................................................................................................................... ix
Chapter 1. AMINO ACIDS: EMERGENCE AND RELEVANCY……………………………..1
1.1 Introduction to Amino Acids…………...………………………………...………...1
1.1.1 Amino acid......…………….………………………………………………..1
1.1.2 Optical isomerism and nomenclature…..…………………………….…..2
1.2 D-amino acids……………………………………………………………………….2
1.2.1 Paradigm shift………………………...…..…………………………….…..2
1.2.2 Occurrence in nature………………...…..…………………………….…..4
1.2.3 Amino acid racemization for geological dating…..………………….…..5
Chapter 2. D-AMINO ACIDS IN MAMMALS…………………………………………………..7
2.1 Techniques in the determination of D-amino acids……………..………………7
2.1.1 One dimensional techniques….………………...………………………...7
2.1.2 Two dimensional HPLC methods ………………..…..…………………10
2.1.3 Column technology: superficially porous particles …………..………..12
2.2 Physiology of D-amino acids...……………………………………………….….14
2.2.1 D-serine........................................................................................…...14
2.2.2 D-Leucine………………...…..…………………………….……………...15
Page 7
vii
Chapter 3. DETERMINATION OF TOTAL AND D-AMINO ACID CONCENTRATION BY
ACHIRAL-CHIRAL HEART CUTTING TWO-DIMENSIONAL LIQUID
CHROMATOGRAPHY………………………………………………………………………….16
3.1 Experimental……………..……………………………………………………..…16
3.1.1 Materials….………………...……………………………………………...16
3.1.2 Derivatization of amino acid standards…………..…..………………...16
3.1.3 Mice brain non-perfused tissue…………………….…………..………..17
3.1.4 Mice brain perfused tissue…………………….………………..………..18
3.1.5 Free amino acid extraction…………………….…………..…………….19
3.1.6 HPLC instrumentation and method….…………….…………..………..19
3.2 Results and Discussion....……………………………………………………..…24
3.2.1 Results........................................................................................…....24
3.2.2 Discussion……………...…..…………………………….………………..28
3.2.3 Future work……………...…..…………………………….……………....29
References ........................................................................................................................ 43
Biographical Information ................................................................................................... 48
Page 8
viii
List of Illustrations
Figure 1-1 General amino acid structure ............................................................................ 1
Figure 1-2 Primary structure of peptidoglycan .................................................................... 3
Figure 1-3 Base and acid catalyzed racemization………………..……………………...…...4 Figure 2-1 Chiral derivatizing agents…………………………………………………………...9 Figure 3-1 Sagittal plane view mouse brain………………………………….……………....18 Figure 3-2 Achiral separation methods……………………………………………………….22 Figure 3-3 Column switching valve flow diagram……………………………………………23 Figure 3-4 Two dimensional heart-cutting separation of standards…………………...…..25 Figure 3-5 Two dimensional analysis non-perfused cortex…………………………...……26 Figure 3-6 Two dimensional analysis perfused cortex………………………………..…….30 Figure 3-7 Comprehensive average total free amino acid content……………………...…34 Figure 3-8 Effect of tissue perfusion hippocampus………………………………………….35 Figure 3-9 Effect of tissue perfusion cortex…………………………………………………..36 Figure 3-10 %D values for hippocampus samples…………………………………….…….37 Figure 3-11 %D values for cortex samples…………………………………………………...38 Figure 3-12 Total D-amino acid vs. total amino acid non-perfused hippocampus……….39 Figure 3-13 Total D-amino acid vs. total amino acid non-perfused cortex………………..40 Figure 3-14 Total D-amino acid vs. total amino acid perfused hippocampus…………….41 Figure 3-15 Total D-amino acid vs. total amino acid perfused cortex……………………..42
Page 9
ix
List of Tables
Table 3-1 Second dimension chromatographic parameters ............................................. 31
Table 3-2 Total amino acid data for non-perfused tissue ................................................. 32
Table 3-3 Total amino acid data for perfused tissue……………………………...…………33
Page 10
1
Chapter 1
AMINO ACIDS: EMERGENCE AND RELEVANCY
1.1 Introduction to Amino Acids
1.1.1 Amino acid
Amino acids comprise a class of organic molecules of paramount biological
importance. Though there exist many hundreds of compounds that conform to the
structural requirements of amino acids, only a select few are biologically relevant in
mammals. In fact, triplet codon sequences intrinsically encode merely twenty amino acids
universally designated as standard amino acids. Predictably, the common structural
elements include an amine (-NH2) and a carboxylic acid (-COOH). The final feature of the
amino acid is a characteristic side chain (-R), the moiety ultimately forecasting its
function. The most prevalent orientation of these substituents is one where amine,
carboxylic acid, and side chain groups are bound to a common carbon, the α-carbon
(Figure 1-1). These twenty genetically coded small molecules abound primarily in
polymeric form as proteins, macromolecules with an extraordinary scope of responsibility.
Nonetheless, there is recent unequivocal evidence that free and non-proteinogenic amino
acids, however less abundant, prove no less vital.
Figure 1-1 General amino acid structure
Page 11
2
1.1.2 Optical isomerism and current nomenclature
The history of amino acids began with the aptly named asparagine, isolated from
an extract of asparagus in 1806.1 Over ensuing years, discoveries of this sort amassed to
reveal a list of common protein hydrolysates deemed amino acids.2 Concurrently, Louis
Pasteur would demonstrate the unprecedented enantioseparation of (+/-) tartaric acid
and establish the correlation between asymmetry and optical activity.3 His impact
extended to amino acid chemistry in 1851 as he revealed the optical activity of naturally
occurring asparagine and the related aspartic acid.4 Accordingly, the common amino
acids, with the exception of glycine, occur as optical isomers as a result of their opposing
orientation around the α-carbon.5 The criterion for assignment of relative configuration to
natural amino acids is based on the parallelism between the orientation of an asymmetric
carbon for the amino acid isomer and that of a known reference. Thus, the L- and D-
terminology is one of many contributions to protein chemistry credited to Emil Fischer,
who established such a reference when he determined the configurations of asymmetric
carbons in various sugars and aldehydes.4 The accrual of these relevant observations
ultimately led to the definitive assertion that naturally occurring amino acids were
exclusively of the L-configuration. D-amino acids were simply considered unnatural.
1.2 D-Amino Acids: Early Interest
1.2.1 Paradigm shift
Proteins of living organisms generally incorporate standard L-amino acids almost
exclusively. Nonetheless, in the early to mid-20th century, reports emerged describing the
isolation of D-amino acids from a variety of antibiotics, including penicillin, and the
capsular component of bacterial cells.6 A representation of this component,
peptidoglycan, is characterized by repeating structural units of N-acetylglucosamine
Page 12
3
(NAG) and N-acetylmuramic acid (NAM) cross-linked with D-amino acid containing
peptides (Figure 1-2).7 This polymeric macromolecule is an integral component of the
bacterial cell wall to provide structural rigidity, and reports leading to the elucidation of its
composition provided the first unambiguous proof that D-amino acids were naturally
present and necessary.8
Figure 1-2 Primary structure of peptidoglycan9
Evidence then continued to accumulate supporting the natural occurrence of D-
amino acids, albeit in a limited and sometimes capricious sense, and by 1969, J.
Corrigan published a review describing this accrual of approximately 50 D-amino acids
(nonstandard and standard) extant in particular invertebrate species.10 This work assured
the chemical community that biological occurrence of D-amino acids was veritable fact,
naturally posing questions regarding their significance. Nevertheless, several years and
Page 13
4
numerous analytical innovations proved requisite for a more comprehensive
understanding of D-amino acid presence and functionality in mammals.
1.2.2 Occurrence in Nature
Though considerable attention to mammalian production and metabolism of D-
amino acids had already been garnered, an explanation regarding their mere presence in
nature needed to be addressed. The fundamental concept of nature’s asymmetry,
specifically with respect to amino acids, had been violated. To this point, D-amino acids
were considered laboratory artifacts and deemed unnatural.10 While it may remain true
that life with chiral parity could not exist (e.g. DNA replication would not be possible in a
heterochiral system), misguided scientists to this day proclaim that D-amino acids are
non-existent in nature.11 On the contrary, an intrinsic feature of molecules containing a
carbonyl group with a stereogenic α-carbon is their ability to undergo base or acid
catalyzed racemization (Figure 1-3). This occurs as a cell external process in nature and
is dependent on such variables as temperature and pH.12 Consequently, the “unnatural”
variant of amino acids finds itself present in environmental samples, ultimately
incorporated into the diet of various organisms.13
Figure 1-3 Cell external base and acid catalyzed amino acid racemization12
Page 14
5
Racemization also occurs in vivo as evidenced by the occurrence of D-asp
residues in metabolically inert protein from various tissues of the elderly.14 These
phenomena outlining the natural occurrence of D-amino acids explains the necessity for
the evolution of D-amino acid oxidases and D-amino acid dehydrogenases for the
respective eukaryotic and prokaryotic catabolic elimination of D-amino acids. Very
recently, D-amino acid racemases have also been identified and credited with the de
novo production of various free D-amino acids in prokaryotes and eukaryotes.15 While D-
amino acid enzymology is beyond the scope of this discussion, a more extensive
description of the physiological importance of free D-amino acids in mammals will be
presented in Chapter 2.
1.2.3 Amino Acid Racemization for Geological Dating
When a living organism dies, proteins begin their natural diagenetic breakdown.
Peptide bonds hydrolyze and free and proteinogenic amino acids racemize at rates
dependent on environmental factors including temperature and pH.16 Proteins with a
greater level of exposure to the environment will typically undergo more rapid and
unpredictable diagenesis, whereas intact proteins well preserved in more stable matrices
(i.e. carbonate) will undergo the same processes at a slow and predictable rate.17 The
racemization rate of proteinogenic amino acids can thus be derived for a particular
environment after calibration with a secondary dating method to determine the
appropriate rate constant.18 In the mid-20th century, this knowledge piqued the interest of
chemistry inclined archeologists and spurred the most exciting attention D-amino acids
had so far enjoyed. A novel geochronological dating method was born that could
accurately date materials too young or too old for the traditionally and more often used
radiocarbon method.19 The amino acid racemization technique and its pioneering
scientist, Dr. Jeffrey Bada, would later have their names tarnished after the antiquity of
Page 15
6
the Del Mar skull was hugely overestimated due to a faulty calibration and poorly
estimated temperature history.20
Page 16
7
Chapter 2
D-AMINO ACIDS IN MAMMALS
2.1 Advancing Techniques in the Determination of D-amino acids
2.1.1 One dimensional techniques
The sensitive and selective determination of free D-amino acids in biological
samples is challenging for several reasons: trace detection of D-amino acids is hindered
by high concentrations of L-amino acids, other biologically important amines, peptides,
and a variety of small molecules present in such complex matrices. Limitations of the
analytical method are therefore magnified due to such inherent difficulties. In the 1980’s,
D-aspartyl residues were confirmed present in long-lived proteins of the elderly and
recently deceased patients where they arise in situ.21,22,23 The results of this work were
somewhat fickle due to the harsh conditions with which these proteins were hydrolyzed,
undoubtedly inducing racemization to some extent.24 In 1986, Dunlop et al. applied some
of the advancing analytical methods for which the field had waited to determine the
concentration of free D-aspartic acid (D-asp) in human and animal tissue.25 To the day’s
scientific community, these results were truly unanticipated, for D-amino acids to this
point were found only sparingly in tissue of the elderly, and this was the first document
confirming free, non-proteinogenic D-amino acid presence in tissue.25 Methodologies in
this work and future investigations were typically performed using a one dimensional high
performance liquid chromatography (HPLC) technique via application a chiral derivatizing
agent, in this case, (+)-1-(1-naphthyl)ethyl isocyanate. Under alkaline conditions, the
isocyanate reacts with the amino acid to yield the corresponding napthyethylcarbamoyl
amino acid. Using an enantiomerically pure derivatizing reagent, the separation of the
resulting diasteromers can then be favorably achieved using a reverse phase (C18)
format. To eliminate ambiguity, Dunlop et al. then applied the (-)-1-(1-naphthyl)ethyl
Page 17
8
isocyanate to ensure reversal of the elution order, and the identity of the D-aspartate was
somewhat effectively verified. The findings of this work were impactful; high
concentrations of D-asp were reported in the young rat cerebral hemisphere (100
nmol/g), kidney, spinal cord, and cerebellum.25 The regional distribution of free D-asp in
tissue of older rats was different from that for young rats, a continual decrease in
concentration with increasing age. This was the first implication that free D-asp may have
a definitive role in mammalian developmental processes. Six years later, in 1992,
Hashimoto et al. reported high concentrations of free D-serine (D-ser) in rat brain tissue
using a similar method; to the free amino acid extract was applied pentafluoropropionic
anhydride and isopropanol to yield the corresponding N,O-pentafluoropropionylisopropyl
amino acid diasteromer. The free D-ser was separated using a gas chromatographic
method where problems were encountered due to co-eluting impurities. GC-MS data did
however support the occurrence of free D-ser.26 Acknowledging the shortcomings of this
method, the same group applied an HPLC method, again using chiral derivatizing agents;
perhaps the most commonly used fluorescent reagent, o-phthalaldehyde (OPA) in
conjunction with a chiral thiol, N-tert-butyloxycarbonyl-L-cysteine (Boc-L-Cys), were
applied and the resulting diasteromers were separated on an octadecylsilyl (ODS)
reverse phase column.27 In these studies, approximately 30% of the total free serine was
found to be of the D-configuration. After the discovery of large concentrations of D-asp
and D-ser, naturally occurring free D-amino acids truly garnered increased attention from
the scientific community. The popular approach was still to apply a chiral derivatizing
agent (e.g. OPA in conjunction with chiral thiol; Figure 2-1), the impetus for this being the
stark efficiency gains over an enantioselective column.
Page 18
9
Figure 2-1 Amino acid derivatization with OPA and chiral thiols
This should facilitate trace detection by virtue of the high theoretical plate numbers for
individual analytes. Such methods, however, are not practical due to the inherent
enantiomeric impurity of the chiral derivatizing agents and have proven effective only for
large concentrations of D-amino acids. Still, it is arguably useful to some extent and these
methods are historically most popular and to this day are utilized for the investigation of
free D-amino acids in animal tissue.28,29,30,31
One-dimensional methods that instead employ chiral stationary phases have also
been applied for the determination of free D-amino acids in mammals. Limited reports
have determined high concentrations of D-asp and D-ser in mammalian tissues.32,33 In
these reports, amino acids were derivatized with fluorescent reagents and analyzed on
π-complex type stationary phases (i.e. dinitrobenzoyl phenylglycine ionically bonded to
aminopropyl silica), a method found suitable for the two aforementioned analytes.
Recently, Desai et al. reported a method employing one chromatographic chiral
dimension in conjunction with atmospheric pressure chemical ionization mass
spectrometry for the selective enantioseparation of 19 pure amino acids.34 One
Page 19
10
dimensional techniques involving chiral stationary phases typically lack the separation
efficiency to effectively determine low concentrations. Additionally, the one dimensional
techniques discussed here do nothing to minimize the inherent interferences of complex
biological matrices.
2.1.2 Two dimensional HPLC methods
As an alternative, two-dimensional HPLC (LC/LC) methods have been
preferentially implemented for trace determination of free amino acids. Various two
dimensional methods have been established as highly selective and sensitive techniques
capable of overcoming the complications associated with real biological matrices
containing innumerable interferences. Multidimensional methods can be categorized into
three general classes: directly coupled columns, comprehensive column switching, and
heart-cutting.35 As the name suggests, directly coupled column chromatography employs
orthogonal phases, but one mobile phase must provide the desired separation on both
columns, an inherent disadvantage.35 Heart-cutting LC/LC allows the user to selectively
resolve components of a specific effluent band from the first dimension on an orthogonal
phase in the second dimension, whereas in comprehensive LC/LC the entire sample
passes through both phases in succession. An essential advantage of these systems
over one dimensional methods is the exponential increase in peak capacity, a hugely
important feature in the analysis of biological samples. Heart-cutting instrumentation for
biological samples proves immensely valuable when coupling an achiral dimension to a
chiral dimension for subsequent separation of important enantiomers. Additionally, heart-
cutting techniques allow users to individually optimize separation conditions in each
dimension before joining them to work in succession (of course, the operating modes
must be compatible). Finally, heart-cutting intrinsically preserves the integrity of the chiral
column because only relatively pure effluent bands are directed to the second dimension.
Page 20
11
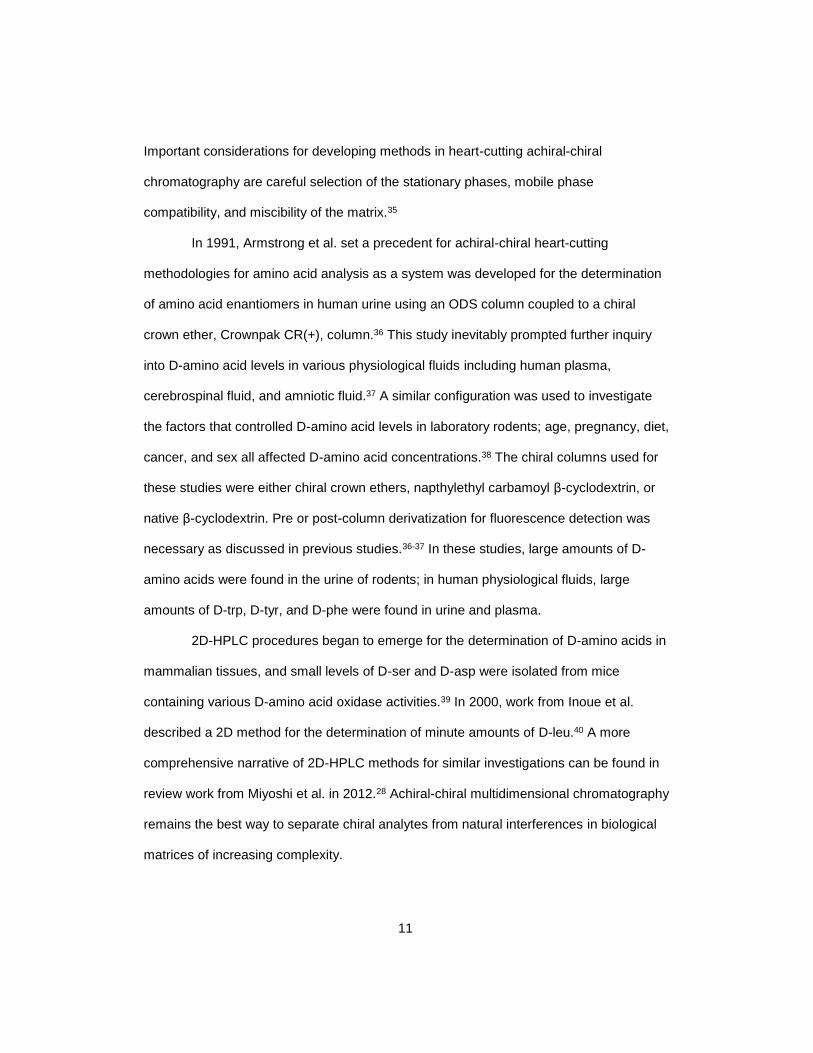
Important considerations for developing methods in heart-cutting achiral-chiral
chromatography are careful selection of the stationary phases, mobile phase
compatibility, and miscibility of the matrix.35
In 1991, Armstrong et al. set a precedent for achiral-chiral heart-cutting
methodologies for amino acid analysis as a system was developed for the determination
of amino acid enantiomers in human urine using an ODS column coupled to a chiral
crown ether, Crownpak CR(+), column.36 This study inevitably prompted further inquiry
into D-amino acid levels in various physiological fluids including human plasma,
cerebrospinal fluid, and amniotic fluid.37 A similar configuration was used to investigate
the factors that controlled D-amino acid levels in laboratory rodents; age, pregnancy, diet,
cancer, and sex all affected D-amino acid concentrations.38 The chiral columns used for
these studies were either chiral crown ethers, napthylethyl carbamoyl β-cyclodextrin, or
native β-cyclodextrin. Pre or post-column derivatization for fluorescence detection was
necessary as discussed in previous studies.36-37 In these studies, large amounts of D-
amino acids were found in the urine of rodents; in human physiological fluids, large
amounts of D-trp, D-tyr, and D-phe were found in urine and plasma.
2D-HPLC procedures began to emerge for the determination of D-amino acids in
mammalian tissues, and small levels of D-ser and D-asp were isolated from mice
containing various D-amino acid oxidase activities.39 In 2000, work from Inoue et al.
described a 2D method for the determination of minute amounts of D-leu.40 A more
comprehensive narrative of 2D-HPLC methods for similar investigations can be found in
review work from Miyoshi et al. in 2012.28 Achiral-chiral multidimensional chromatography
remains the best way to separate chiral analytes from natural interferences in biological
matrices of increasing complexity.
Page 21
12
2.1.3 Column technology: superficially porous particles
The search for improved separation methods has also included the recent
development of superficially porous particles (SPP) for HPLC stationary phases. The
advent of SPP’s for achiral separations demonstrated efficiencies comparable to sub-2
µm fully porous particles (FPP) without the need for modified instrumentation to
accommodate the ultrahigh pressures associated with smaller FPP’s.41-42 The
performance of SPP columns in reverse phase separations has been evaluated
extensively in empirical and theoretical studies.43-44 For a typical C18 SPP separation,
vastly improved efficiencies can be attributed to measurable reductions in all
contributions to band broadening (i.e. eddy diffusion, longitudinal diffusion, and stationary
phase mass transfer).44-45 The manifestation of the decreased eddy diffusion contribution
can generally be attributed to improved packing of the stationary phase as SPP particles
tend to exhibit greater bed homogeneity from wall to center for a typical well packed
column.45-46 Additionally, the porous shell surrounding the solid core intrinsically limits
trans-particle diffusion, lowering the mass transfer contributions to band broadening for
large analytes with small diffusion coefficients and small analytes with slow adsorption-
desorption kinetics.41,43,45,47-48
In more specialized branches of chromatography, namely chiral chromatography,
the benefits of SPPs are only more recently explored. Initial applications of chiral
stationary phases (CSPs) revealed a significant decrease in selectivity for polysaccharide
coated SPPs compared with the analogous FPP columns.49-50 More recently, Spudeit et
al. presented brush type chiral selectors covalently bonded to SPPs with higher selector
load per unit surface area; this along with substantial improvement in column efficiency
for the CSP on SPP resulted in improved chiral separations with no loss in enantiomeric
selectivity.51 Perhaps the most comprehensive empirical examination of brush-type CSPs
Page 22
13
on SPPs was recently demonstrated by Patel et al. in work presenting remarkably
successful ultrafast chiral separations with efficiencies comparable to those typically seen
for capillary electrophoretic separations.45 The application of novel SPP column
technology presented in this work serves two foremost points: (1) greatly enhanced
detection of trace amino acids in the first dimension and (2) decreased analysis time in
the second dimension without sacrificing enantiomeric selectivity, thus reducing band
broadening and facilitating trace detection of the more retained D-enantiomer.
By virtue of the early investigations into D-amino acids in mammalian samples,
the scientific community had unambiguous proof that these isomers were present.
Questions regarding their ubiquity and physiological function were prompted; inquiries
probing their biological activity elucidated the role of certain free D-amino acids, creating
increased demand for a more comprehensive catalog as their importance was realized.
More advanced methodologies for their isolation and detection naturally must be
addressed. The work presented in this thesis provides an unambiguous method for the
baseline determination of D-amino acids using advanced achiral-chiral heart-cutting two
dimensional liquid chromatography. Superficially porous phases were applied to resolve
the naturally occurring amino acids in the first dimension and the enantiomers of 11
selected amino acids in the second. Regional amino acid distributions were examined for
the hippocampus and cortex of six laboratory mice. Additionally, here is presented the
first comparison of total amino acid levels and D-isomer levels between non-perfused and
perfused brain tissue (i.e. tissue for which the blood has been completely flushed).
Page 23
14
2.2 Physiological Importance of D-Amino Acids
2.2.1 D-serine
Naturally, as detection of D-amino acids became feasible after maturation of
pertinent analytical methods, the question of why they were relevant needed to be
addressed. Techniques to distinguish the formerly overlooked D-isomers of amino acids
initially revealed substantial quantities of D-serine and D-aspartate in particular. Now,
these two amino acids are certainly the most thoroughly investigated and their regional
distribution and biological activity are fairly well understood.52 D-serine in particular has
been most extensively studied. Free D-serine localizes predominantly in the mammalian
forebrain, specifically in the cerebral cortex, hippocampus, and striatum with highest
concentrations found in regions enriched in N-methyl-D-aspartate receptors.26,30,53-54 D-
serine, like other free D-amino acids, is acquired through diet, gastrointestinal bacteria,
and liberation from metabolically stable proteins.52 One implication of D-serine’s immense
importance in CNS function is the recent elucidation of its biosynthesis via enzymatic
conversion of L-serine by serine racemase.55 The close correlation between anatomical
distribution of D-serine and the regional variation of the N-methyl-D-aspartate receptor
(NMDAr) suggests a functional relationship. In fact, it is now well known that D-serine is
an intrinsic co-agonist of the NMDAr, occupying the binding site once believed to be
activated strictly by glycine.56 In 2000, Mothet et al. demonstrated that D-serine is an
endogenous ligand for the glycine binding site of the receptor with an even greater affinity
than glycine.56 Depletion of endogenous D-serine greatly attenuates functionality of the
receptor, diminishing synaptic transmission and potentiating development of associated
neurodegenerative disorders, namely schizophrenia and epilepsy.57 As such, D-amino
acids become clinically relevant as potential drugs. In fact, D-serine as a drug for
Page 24
15
schizophrenia has had some success in clinical trials.58 The importance of developing a
more comprehensive catalog for D-amino acids in mammals is evident yet far from
completion. Discoveries in this capacity provide clinicians and diagnosticians new insight
into the implication of D-amino acid biomarkers in disease with potential treatment
options.
2.2.2 D-Leucine
Accordingly, the investigation probed in this thesis work arose from the idea that
D-leucine could be used as a suitable drug for epilepsy. Because there are so many
cases of recurrent seizures that are not appropriately treated, a metabolism based
therapy utilizing ketogenic diets has recently been revisited as a viable option.59 L-leucine
is a ketogenic amino acid; its degradation products include acetoacetate and β-
hydroxybutarate, both of which fall into the class of anticonvulsants.60 The issue with L-
leucine as a treatment option is not in its inability to protect against seizure activity.61
Elevated L-leucine and other branched chain amino acids have been linked to abnormal
development and can actually induce seizures.61 Alternatively, D-leucine remarkably has
shown potent anti-seizure effects in clinical research conducted by Hartman, et al.61 D-
leucine is attained through diet and gastrointestinal bacteria and currently has no known
physiological role in mammals. The fact that it shows remarkable anti-seizure effects in
patients clearly demonstrates the importance of finding trends in D-amino acid levels in
normal and diseased tissue. Thus, here we present an unambiguous method for the
determination of D-amino acid levels in neurological tissue; work undertaken towards the
advancement of a more comprehensive understanding of free amino acids in mammals.
Page 25
16
Chapter 3
DETERMINATION OF TOTAL AND D-AMINO ACID CONCENTRATION BY ACHIRAL-
CHIRAL TWO DIMENSIONAL LIQUID CHROMATOGRAPHY
3.1 Experimental
3.1.1 Materials
Natural amino acid racemates and all derivatization reagents,
fluorenylmethyloxycarbonyl chloride, adamantadine hydrochloride, and boric acid, were
purchased from Sigma-Aldrich (St. Louis, MO). HPLC grade acetonitrile and methanol
were from Sigma-Aldrich. A Milli-Q water system (Millipore, Bedford, MA) was used to
prepare ultrapure deionized water (18.2 MΩcm) for HPLC buffers. The 2.7 µm
superficially porous silica particles were provided by Agilent Technologies (Wilmington,
DE), as were the first dimension C18 columns (Poroshell 120 EC-C18, 4.6 x 150 mm i.d.
2.7 µm particles). Teicoplanin was covalently attached to the provided silica particles as
described by Armstrong et al.62 and the stationary phase was slurry packed into a 4.6 x
100 mm i.d stainless steel column (IDEX Health and Science, Oak Harbor, WA) as
described by Patel et al.45
3.1.2 Derivatization of amino acid standards
Stock solutions of DL-amino acid standards were prepared with deionized water
at concentrations of 0.03 M, with the exception of tryptophan and tyrosine which were
prepared at concentrations of 0.01 M and 0.0025 M respectively. The standards were
stored at 4°C while not in use. Borate buffer was prepared by mixing 25 mL 0.8 M boric
acid in 0.8 M potassium chloride, adjusting the pH to 9 with 0.8 M NaOH, and thereafter
diluting to 50 mL with deionized water. The stock FMOC solution was prepared by
Page 26
17
dissolving 0.13 g in 5 mL acetonitrile (0.1 M). The stock adamantadine solution was
prepared by dissolving 0.6 g in 5 mL of 1:1 acetonitrile: water (0.8 M). Amino acid
standards were derivatized by adding directly to the autosampler vial, reagents in the
following order: 50 µL amino acid stock solution, 400 µL borate buffer, 500 µL
acetonitrile, 50 µL FMOC reagent. After twenty minutes, the reaction was stopped
through the addition of 50 µL adamantadine reagent.
3.1.3 Mice brain non-perfused tissue
Male FVB/NJ mice (Jackson Laboratory, Bar Harbor, ME) aged 5-6 weeks old,
weighing 25-30 g were used in all experiments. Mice were housed in groups of 4-5 in a
cage under strictly controlled laboratory conditions with an artificial 12 hour light/dark
cycle. A nutritionally-balanced rodent chow diet (Teklad Global 2018SX, Madison, WI)
and tap water were continuously available. Animals were used in the study after at least
one week of acclimatization. The study was carried out under experimental protocols
approved by the ACUC. All efforts were made to minimize animal suffering.
Mice were sacrificed by cervical dislocation (to prevent pre and postsynaptic
effects of anesthesia). Surgical scissors were used to remove the head. Using the
scissors to make a midline incision, the skin was flipped over the eyes to free the skull
and a small incision was made on the top of the skull from the caudal part at the point of
the parietal bone, being careful to not cut through the brain. A firm cut was made through
the most anterior part of skull. One side of the parietal bone was shifted before being
separated from the remainder of the skull and this process was repeated bilaterally. Once
the brain was released from the meninges, the curved pattern forceps were moved under
the anterior part of the brain, which was then tilted smoothly upward. The forceps were
used to incise the cranial and optic nerves, and the brain was then lightly lifted out of the
skull. The brain was placed dorsal side up. The hindbrain was identified and a sagittal
Page 27
18
incision was made to separate the two hemispheres (Figure 3-1). The hippocampus and
cortex were then separated under a dissecting microscope.
Figure 3-1 Sagittal plane view of mouse brain63
3.1.4 Mice brain perfused tissue
Mice were deeply anesthetized with carbon dioxide. A midline incision was made
at the thoracic costal margin, followed by exposure of the peritoneal contents. A small
incision was made at the xyphoid process and continued caudally. The sternum was
opened broadly to visualize the heart and to incise the right atrium. Heparin/saline (APP
Pharmaceuticals, LLC 1,000 USP Units/mL, Schaumburg, IL) and a blood collection
set (BD Vacutainer, Four Oaks, NC) were injected using a 25 gauge butterfly needle into
the apex of the left ventricle until a swelling of the heart was observed. The injection was
thereafter continued at a low rate. The proximal end of the collection set was removed
from the flush syringe when the fluid exiting the mouse was clear. A 20 mL syringe was
used to slowly inject a 10% neutral buffered formalin (NBF) solution (Sigma Life Science,
St. Louis, MO) and when cardiac muscle contraction stopped, perfusion was complete. A
Page 28
19
3 mL syringe and 25 gauge one inch needle were used to infuse the intestines and lungs
with 10% NBF, working from the proximal to distal end. Mice were then dissected
according to the aforementioned procedure.
3.1.5 Free amino acid extraction
To all hippocampus and cortex samples was added 100 µL of an internal
standard solution of norleucine (8.38 mM in DI water). The samples were homogenized in
1 mL of 0.1 N perchloric acid for 10 seconds (3 pulses) using a Q-Sonica CL-18 probe
(Newtown, CT). The samples were maintained around 4 °C during ultrasonication. The
homogenate was centrifuged at 13,000 RPM for 20 minutes at 4 °C and the supernatant
was removed. 100 µL aliquots of the extract were subsequently derivatized in
autosampler vials according to the procedure described for amino acid standards (vide
supra). Brain material and extract were stored at -80 °C when not in immediate use.
3.1.6 HPLC instrumentation and method
The two dimensional chromatographic system used in the analysis was
constructed through the conjunction of an Agilent 1200 HPLC system (Santa Clara, CA)
and an LC system consisting of a Shimadzu LC-6A pump, RF-10A fluorescence detector,
and CR-6A integrator (Kyoto, Japan). The system was equipped with heart-cutting
capability through the incorporation of a Rheodyne 7000 six port stream switching valve
(Rohnert Park, CA). A C18 column supplied by Agilent was used in combination with a
chiral column synthesized and packed in-house. First dimension signal monitoring was
done using ChemStation software from Agilent.
The first and second dimension conditions for separations were developed
independently and thereafter tuned to work in series. The reverse phase HPLC gradient
for individual amino acid isolation was performed on the Poroshell 120 EC-C18 with
dimensions of 4.6 x 150 mm packed with 2.7 µm superficially porous particles. Mobile
Page 29
20
phase A was 20 mM H2PO4- buffer adjusted to pH 2.5 with H3PO4; mobile phase B was
acetonitrile. The gradient method began with 5% B (0-2 min) followed by a linear ramp
from 15-80% B (2.01-35 min) then 80-95%B (35-38 min). Finally, the gradient concluded
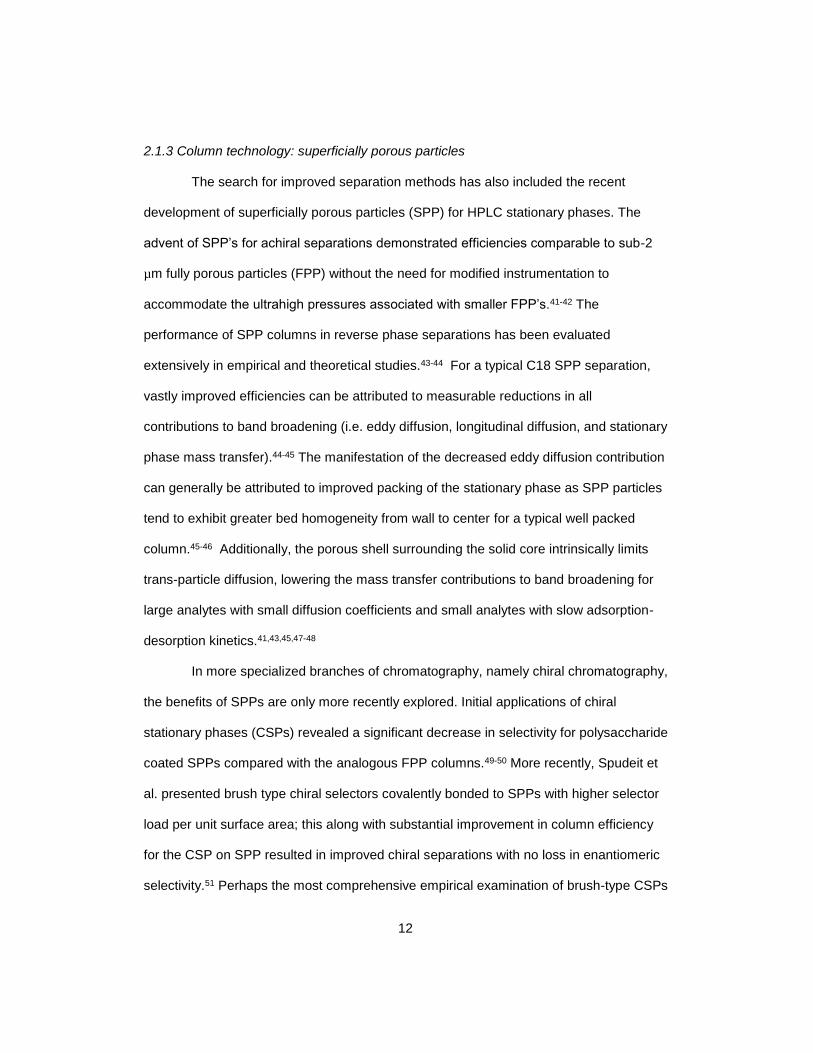
with a 2 minute ramp down to 5% B. The flow rate was 0.75 mL/min. With the exception
of the co-eluting asparagine/glutamine peak and isoleucine/phenylalanine peak, this
method successfully resolved the remaining amino acids of interest. A second achiral
method was employed for the resolution of these four co-eluting amino acids. The two
achiral reverse phase methods are shown comparatively in Figure 3-2. For the second
reverse phase gradient, mobile phase A was 0.05 M sodium acetate; mobile phase B
was a 23/22 (v/v) mixture of 0.1 M sodium acetate/acetonitrile. The gradient method
began with a ramp from 30-37% B (0-3.75 min) followed by a ramp from 37-73% B (3.75-
26.25 min) and finally brought to 100% B over the concluding 5 min. The diode array
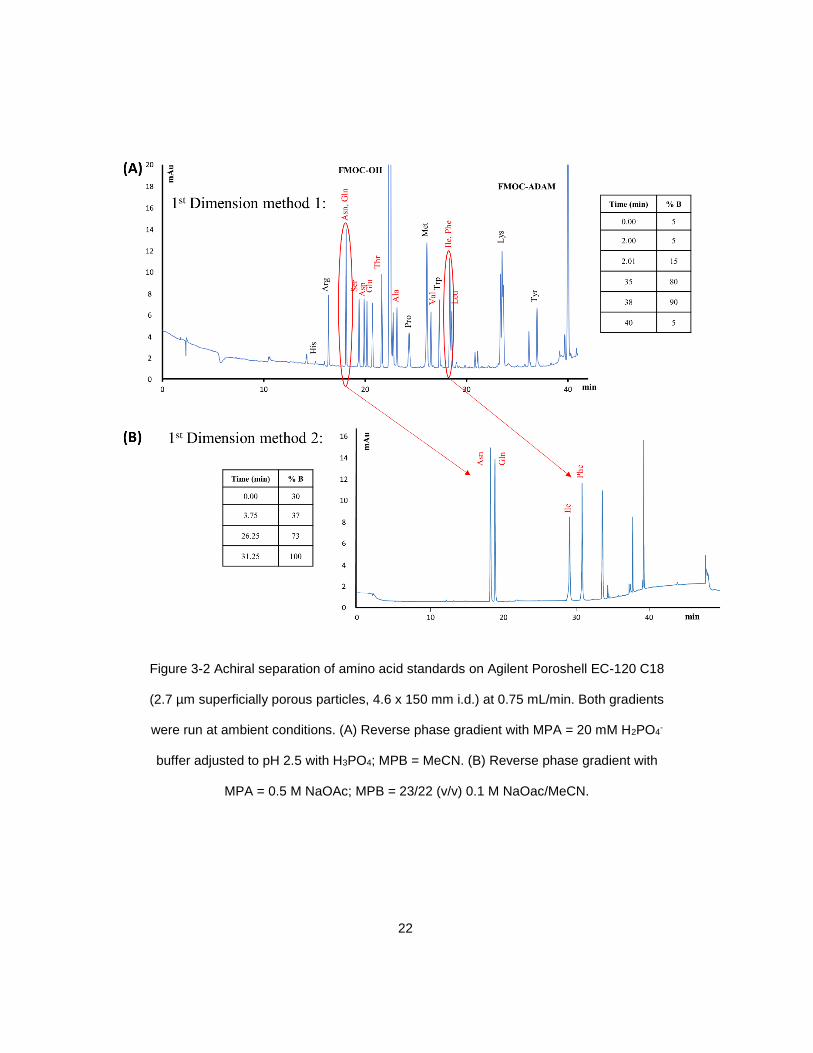
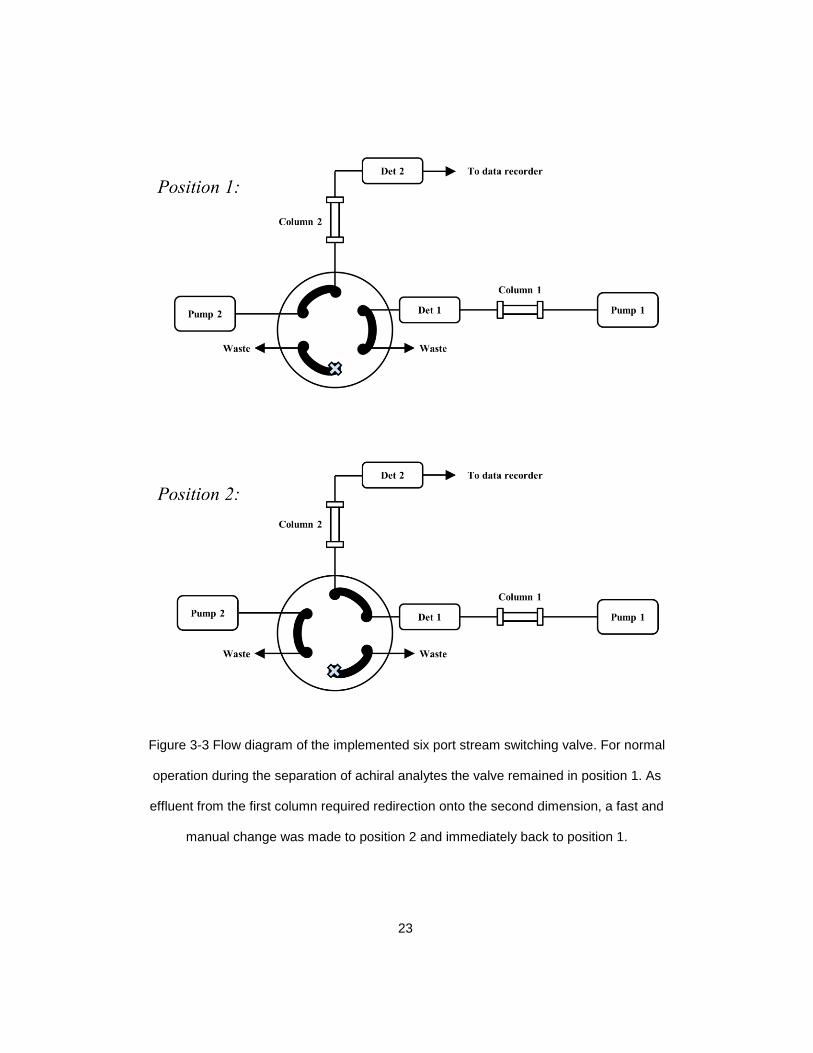
detector (DAD) monitored signals at 254 nm and the detector outlet was connected to the
six port switching valve. Selected effluent bands could then be manually redirected to the
second dimension column with a stream switch injection, typically lasting approximately
0.1 seconds (Figure 3-3). The resolution of the amino acid enantiomers was achieved on
the teicoplanin column prepared in-house using an isocratic reverse phase method
specific to the amino acid of interest.
Offline derivatization of amino acids was carried out using a well-studied and
reliable method utilizing 9-fluorenylmehtlyoxycarbonyl chloride,64 a reactive fluorescent
tag for potentiation of detection signals, a particularly important feature for trace detection
in the both dimensions. The fluorometric detection of FMOC-amino acids was conducted
at an excitation wavelength of 254 nm and an emission wavelength of 313 nm. A
representative separation of derivatized standards in the first dimension as well as the
resolution of L and D enantiomers from heart-cut effluent bands is depicted in Figure 3-4.
Page 30
21
Fractions of the eluting peak were manually introduced onto the enantioselective
teicoplanin column for rapid chiral resolution. The chromatographic parameters for the
enantioseparation of amino acid standards are outlined in Table 3-1. All chiral
separations were easily achieved using the aforementioned house prepared teicoplanin
column. The greatest advantage of implementing a SPP based CSP for this work proved
to be the short analysis time and high efficiency gains without a sacrifice in selectivity
between enantiomers; a comprehensive characterization of the column efficiency and
performance can be found described by Patel et al.45
Page 31
22
Figure 3-2 Achiral separation of amino acid standards on Agilent Poroshell EC-120 C18
(2.7 µm superficially porous particles, 4.6 x 150 mm i.d.) at 0.75 mL/min. Both gradients
were run at ambient conditions. (A) Reverse phase gradient with MPA = 20 mM H2PO4-
buffer adjusted to pH 2.5 with H3PO4; MPB = MeCN. (B) Reverse phase gradient with
MPA = 0.5 M NaOAc; MPB = 23/22 (v/v) 0.1 M NaOac/MeCN.
Page 32
23
Figure 3-3 Flow diagram of the implemented six port stream switching valve. For normal
operation during the separation of achiral analytes the valve remained in position 1. As
effluent from the first column required redirection onto the second dimension, a fast and
manual change was made to position 2 and immediately back to position 1.
Page 33
24
3.2 Results and Discussion
3.2.1 Results
The total amino acid concentrations and D-amino acid percentages were
examined separately from 12 specimens (i.e. the cortex and hippocampus of six mice).
The ability to separate and quantify all of the naturally occurring amino acids in the first
dimension was particularly challenging due to the inherent difficulties of dealing with
biological samples. Extraction of the free amino acids using the outlined method
sufficiently aided our efforts to accurately identify amino acid bands. Additionally, the first
direct comparison of values from non-perfused and perfused brain tissue was here made.
For accurate quantitation of total amino acid values, norleucine was added as an internal
standard prior to homogenization of brain tissue and extraction of the free amino acid
containing fluid. For each specimen, the extract was derivatized in triplicate and HPLC
analysis was again done in triplicate. Figures 3-5 and 3-6 show representative two
dimensional separations of brain extract samples.
Page 34
25
Figure 3-5 Representative two dimensional analysis of brain extract. Indicated threonine
effluent band from a non-perfused cortex sample (NPC1) was redirected onto the second
dimension column for enantiomeric resolution
Page 35
26
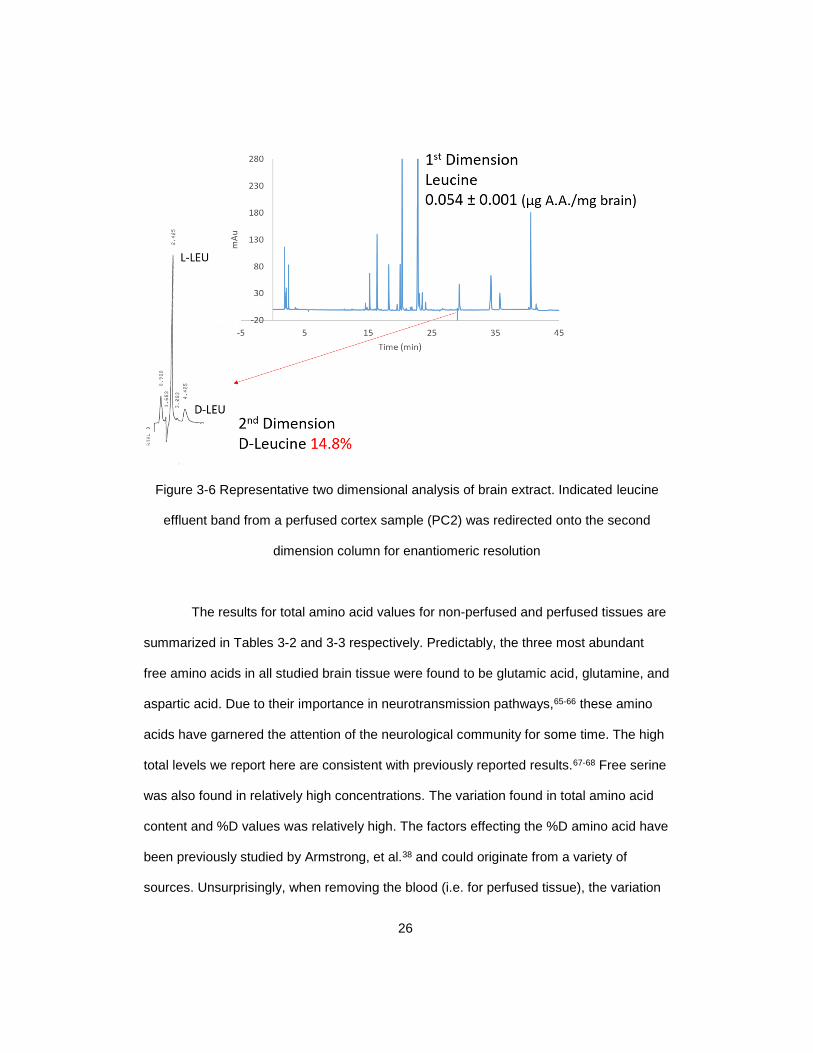
Figure 3-6 Representative two dimensional analysis of brain extract. Indicated leucine
effluent band from a perfused cortex sample (PC2) was redirected onto the second
dimension column for enantiomeric resolution
The results for total amino acid values for non-perfused and perfused tissues are
summarized in Tables 3-2 and 3-3 respectively. Predictably, the three most abundant
free amino acids in all studied brain tissue were found to be glutamic acid, glutamine, and
aspartic acid. Due to their importance in neurotransmission pathways,65-66 these amino
acids have garnered the attention of the neurological community for some time. The high
total levels we report here are consistent with previously reported results.67-68 Free serine
was also found in relatively high concentrations. The variation found in total amino acid
content and %D values was relatively high. The factors effecting the %D amino acid have
been previously studied by Armstrong, et al.38 and could originate from a variety of
sources. Unsurprisingly, when removing the blood (i.e. for perfused tissue), the variation
Page 36
27
in total content was much lower. Generally, for a given amino acid, the total content found
was greater for the hippocampus than for the cortex, with few exceptions (Figure 3-7).
For both non-perfused tissue and perfused tissue, the amino acids occurring in the lowest
total concentrations were leucine, asparagine, phenylalanine, and valine. Additionally, we
found that the change in total amino acid content after tissue perfusion is relatively
predictable, as seen from an examination of Figures 3-8 and 3-9. These plots show the
average value for each amino acid in perfused tissue vs. the average value in non-
perfused tissue. The fact that these scatter points fall on a straight line is rather
interesting. Additionally, these plots also depict the vast improvement in variability when
removing the blood from tissue samples. Individual %D values are presented in Figures
3-10 and 3-11. As a percentage, serine, asparagine, isoleucine, and phenylalanine were
the most highly represented in their D isomeric form. However, as you convert these to
total D concentration, the most abundant was serine in every case, with the exception of
the perfused hippocampus. Glutamate was present only as the L-isomer in all cases. It is
evident from a careful evaluation of Figures 3-12 through 3-15 that the blood introduces a
variable that makes prediction of total free D-amino acid concentration relatively difficult.
It also allows us to assess the importance of the D-amino acid as a neurological
necessity: as this study presents the first direct comparison between tissue containing
blood and tissue flushed of its blood, it is reasonable to assume that the D-amino acids
seeing diminished occurrence with removal of the blood were, obviously, present in the
blood itself rather than the neurological tissue. This could suggest that these were
destined for excretion or metabolic processes rather than collection as neurotransmitters
or developmental agents. The increased regularity and predictability of the free amino
acid content and D-amino acid content for perfused tissues is in accordance with this
inference. The five most highly represented D-amino acids in the perfused hippocampus
Page 37
28
and perfused cortex were in both cases serine, asparagine, glutamine, alanine, and
aspartic acid (Figures 3-10 and 3-11). D-leucine was not highly represented in the tissue
from the examined mice, but as our collaborators have demonstrated, offers a potential
treatment option for epileptic test subjects.
3.2.2 Discussion
L-glutamate was the most abundant amino acid for all tissue samples examined.
I has been suggested that L-glutamate, L-aspartate, and D-serine are important
neuromodulators of the NMDA glutamate receptor.69 As previously mentioned,
simultaneous binding of the agonist and co-agonist are required for its activity. The role of
D-aspartate is not clarified, however it occurs in high concentrations in the nerve tissue of
mammals during embryonic and fetal stages, in some cases exceeding the concentration
of its enantiomer, suggesting its importance in neurogenesis and growth. D-aspartic acid
also binds to the glutamate site of the NMDA receptor, an indication of its roll in
neurotransmission. Glutamine, glutamate, and aspartate are also intimately involved in
the γ-aminobutyric acid (GABA) neurotransmission system. Glial cells that receive
glutamate released by pyramidal neurons convert the neurotransmitter to glutamine with
the enzyme glutamine synthetase.70 Subsequent release back to the neuron results in
hydrolysis of the glutamine back to glutamate to replenish the pool. Glutamine is also a
precursor to GABA itself.71 D-alanine does not have such an elucidated role in mammals,
though its presence in healthy and Alzheimer diseased neurological tissue has been
evaluated.72-73 Similarly, as yet, D-asparagine and D-leucine (along with the other amino
acids quantified in this study) have no known physiological function in mammals. The
necessity for advancement of physiological knowledge is evident and the diagnostic
values of D-amino acids is surely recognized by neurological scientists and clinicians.
The work provided here represents the first highly advanced analytical method for the
Page 38
29
determination of trace amino acids and their D-isomers, and will surely prove useful in the
field. Additionally, the data presented represents the first investigation into non-perfused
brain tissue, providing neuroscientists a more informative account of the localization of
amino acids. Thus, the contribution is fourfold: analytically, a progressive and
unambiguous heart cutting method for the determination of D-amino acids was
successfully implemented; more amino acids were analyzed in this work than have been
so far investigated in a single study, and valuable base line concentration values have
been presented for healthy laboratory mice; clinically, the human life sciences gained a
valuable tool for elucidation of the physiological importance of the studied amino acids;
finally, tissue for which the blood has been removed has been compared directly to tissue
containing blood, an insightful advancement in amino acid neurochemistry.
3.2.3 Future Work
The total amino acid content and D-amino acid content were successfully
determined for 11 analytes from the neurological tissue of 6 mice (each separated into
hippocampus and cortex; 3 mice non-perfused and 3 mice perfused) and thus 12
samples. The statistical significance of the findings here require validation by an
increased sample size. Thus, work is ongoing to double n by examining the neurological
contents of an 6 additional mice.
Page 39
30
Figure 3-4 Reverse phase separation of derivatized amino acid standards in the first dimension with resolution of amino acid
enantiomers from indicated effluent bands in the second dimension
Page 40
31
Table 3-1 Chromatographic data and mobile phase conditions for FMOC-amino acid
standards in second dimension
FMOC-Amino Acid k1 α Rs Mobile Phase
Leucine 2.02 2.18 2.7 60/40 0.1% TEAA (pH=4.1)/MeOH
Serine 2.01 1.60 1.8 70/30 0.1% TEAA (pH=4.1)/MeOH
Alanine 2.87 2.51 3.7 70/30 0.1% TEAA (pH=4.1)/MeOH
Aspartic Acid 2.34 1.49 1.4 70/30 0.1% TEAA (pH=4.1)/MeOH
Glutamic Acid 2.42 2.79 3.2 70/30 0.1% TEAA (pH=4.1)/MeOH
Threonine 1.29 1.57 1.4 70/30 0.1% TEAA (pH=4.1)/MeOH
Valine 1.78 1.93 2.5 60/40 0.1% TEAA (pH=4.1)/MeOH
Asparagine 1.36 1.61 1.5 60/40 0.1% TEAA (pH=4.1)/MeOH
Glutamine 1.37 2.48 2.4 60/40 0.1% TEAA (pH=4.1)/MeOH
Isoleucine 1.25 2.25 2.2 55/45 0.1% TEAA (pH=4.1)/MeOH
Phenylalanine 1.53 2.48 2.4 55/45 0.1% TEAA (pH=4.1)/MeOH
Page 41
32
Table 3-2 Total amino acid content for non-perfused brain tissue
NPC 1 NPH 1 NPC 2 NPH 2 NPC 3 NPH 3
A.A. (µg/mg) A.A. (µg/mg) A.A. (µg/mg) A.A. (µg/mg) A.A. (µg/mg) A.A. (µg/mg)
Leu 0.0320 ± 0.0004 0.14 ± 0.01 0.043 ± 0.001 0.20 ± 0.03 0.053 ± 0.001 0.059 ± 0.001
Ser 0.4860 ± 0.0002 0.602 ± 0.001 0.4480 ± 0.0001 0.519 ± 0.001 0.34 ± 0.02 0.339 ± 0.002
Ala 0.30 ± 0.01 0.5 ± 0.1 0.34 ± 0.01 0.45 ± 0.01 0.34 ± 0.01 0.51 ± 0.01
Asp 1.82 ± 0.02 1.58 ± 0.05 1.461 ± 0.002 1.07 ± 0.04 1.4 ± 0.1 0.97 ± 0.01
Thr 0.185 ± 0.004 0.227 ± 0.001 0.199 ± 0.002 0.31 ± 0.01 0.12 ± 0.01 0.238 ± 0.002
Glu 8.1 ± 0.8 9 ± 2 7.6 ± 0.1 5.8 ± 0.5 4.3 ± 0.2 4.0 ± 0.1
Val 0.12 ± 0.03 0.20 ± 0.01 0.087 ± 0.002 0.22 ± 0.01 0.034 ± 0.001 0.142 ± 0.001
Asn 0.062 ± 0.001 0.25 ± 0.03 0.091 ± 0.002 0.33 ± 0.01 0.033 ± 0.001 0.089 ± 0.001
Gln 2.51 ± 0.03 3.1 ± 0.4 2.22 ± 0.04 2.1 ± 0.1 2.1 ± 0.1 1.71 ± 0.01
Ile 0.025 ± 0.003 0.12 ± 0.02 0.029 ± 0.004 0.08 ± 0.01 0.0220 ± 0.0003 0.0330 ± 0.0003
Phe 0.05 ± 0.01 0.19 ± 0.04 0.05 ± 0.01 0.30 ± 0.02 0.054 ± 0.001 0.072 ± 0.001
Page 42
33
Table 3-3 Total amino acid content for perfused tissue
PC 1 PH 1 PC 2 PH 2 PC 3 PH 3
A.A. (µg/mg) A.A. (µg/mg) A.A. (µg/mg) A.A. (µg/mg) A.A. (µg/mg) A.A. (µg/mg)
Leu 0.048 ± 0.001 0.078 ± 0.001 0.054 ± 0.001 0.059 ± 0.001 0.054 ± 0.001 0.051 ± 0.001
Ser 0.18 ± 0.02 0.25 ± 0.01 0.237 ± 0.002 0.281 ± 0.002 0.25 ± 0.01 0.266 ± 0.003
Ala 0.29 ± 0.01 0.34 ± 0.02 0.313 ± 0.002 0.353 ± 0.001 0.377 ± 0.001 0.37 ± 0.01
Asp 1.11 ± 0.04 0.84 ± 0.01 1.22 ± 0.02 1.11 ± 0.01 1.40 ± 0.01 1.19 ± 0.01
Thr 0.063 ± 0.004 0.083 ± 0.003 0.08 ± 0.002 0.170 ± 0.002 0.104 ± 0.004 0.126 ± 0.001
Glu 4.8 ± 0.2 4.27 ± 0.03 5.0 ± 0.1 4.40 ± 0.05 4.98 ± 0.02 4.32 ± 0.03
Val 0.019 ± 0.001 0.048 ± 0.003 0.025 ± 0.001 0.114 ± 0.001 0.026 ± 0.001 0.0420 ± 0.0002
Asn 0.033 ± 0.001 0.099 ± 0.001 0.032 ± 0.001 0.0300 ± 0.0003 0.0330 ± 0.0003 0.1080 ± 0.0004
Gln 1.8 ± 0.1 1.584 ± 0.02 1.75 ± 0.03 1.68 ± 0.02 1.86 ± 0.02 1.73 ± 0.01
Ile 0.012 ± 0.001 0.0200 ± 0.0002 0.0120 ± 0.0002 0.019 ± 0.001 0.0220 ± 0.0004 0.0090 ± 0.0001
Phe 0.041 ± 0.002 0.0350 ± 0.0004 0.045 ± 0.001 0.042 ± 0.003 0.049 ± 0.001 0.0370 ± 0.0002
Page 43
34
Figure 3-7 Comparison of average total amino acid content for each tissue type
0.0
1.0
2.0
3.0
4.0
5.0
6.0
7.0
8.0
9.0
Leu Ser Ala Asp Thr Glu Val Asn Gln Ile Phe
Tota
l AA
(μ
g/m
g)
Total AA content
Non-perfused Cortex
Non-perfused Hippocampus
Perfused Cortex
Perfused Hippocampus
Page 44
35
35
Figure 3-8 Effect of tissue perfusion on hippocampus. Each data point represents an
individual amino acid.
y = 0.7152x - 0.0295R² = 0.9962
0.0
0.5
1.0
1.5
2.0
2.5
3.0
3.5
4.0
4.5
5.0
0.0 1.0 2.0 3.0 4.0 5.0 6.0 7.0 8.0 9.0
Pe
rfu
sed
(µ
g/m
g)
Unperfused (µg/mg)
Effect of Perfusion on Hippocampus
Page 45
36
36
Figure 3-9 Effect of tissue perfusion on cortex. Each data point represents an individual amino
acid.
y = 0.7472x + 0.0065R² = 0.9982
0.0
1.0
2.0
3.0
4.0
5.0
6.0
0.0 1.0 2.0 3.0 4.0 5.0 6.0 7.0 8.0 9.0
Pe
rfu
sed
(µ
g/m
g)
Unperfused (µg/mg)
Effect of Perfusion on Cortex
Page 46
37
Figure 3-10 %D values for each amino acid from all hippocampus samples.
0
10
20
30
40
50
60
70
80
Leu Ser Ala Asp Thr Glu Val Asn Gln Ile Phe
%D
Hippocampus %D
Unperfused Hippocampus 1
Unperfused hippocampus 2
Unperfused hippocampus 3
Perfused hippocampus 1
Perfused hippocampus 2
Perfused hippocampus 3
Page 47
38
Figure 3-11 %D values for each amino acid from all cortex samples
0
5
10
15
20
25
30
35
40
45
50
Leu Ser Ala Asp Thr Glu Val Asn Gln Ile Phe
%D
Cortex %D
Unperfused cortex 1
Unperfused cortex 2
Unperfused cortex 3
Perfused cortex 1
Perfused cortex 2
Perfused cortex 3
Page 48
39
Figure 3-12 Average free D-amino acid concentration vs. average total free amino acid
concentration for the non-perfused hippocampus samples
leu
ser
ala
asp
thr
glu
val
asn
glnile
phe
0.000
0.020
0.040
0.060
0.080
0.100
0.120
0.140
0.00 1.00 2.00 3.00 4.00 5.00 6.00 7.00
Tota
l D A
min
o A
cid
(µ
g/m
g)
Total Amino Acid (µg/mg)
Unperfused Hippocampus
Page 49
40
Figure 3-13 Average free D-amino acid concentration vs. average total free amino acid
concentration for the non-perfused cortex samples
leuala
thr
val
asn
ile
phe
0.000
0.005
0.010
0.015
0.020
0.00 0.05 0.10 0.15 0.20 0.25 0.30 0.35 0.40
Tota
l D A
min
o A
cid
(µ
g/m
g)
Total Amino Acid (µg/mg)
ser
asp
glugln
0.000
0.020
0.040
0.060
0.080
0.100
0.120
0.00 1.00 2.00 3.00 4.00 5.00 6.00 7.00 8.00
Tota
l D A
min
o A
cid
(µ
g/m
g)
Total Amino Acid (µg/mg)
Unperfused cortex
Page 50
41
Figure 3-14 Average free D-amino acid concentration vs. average total free amino acid
concentration for the perfused hippocampus samples
leu
ser
ala
asp
thr
gluval
asn
gln
ile
phe
0.000
0.020
0.040
0.060
0.080
0.100
0.120
0.00 0.50 1.00 1.50 2.00 2.50 3.00 3.50 4.00 4.50 5.00
Tota
l D A
min
o A
cid
(µ
g/m
g)
Total Amino Acid (µg/mg)
Perfused Hippocampus
Page 51
42
Figure 3-15 Average free D-amino acid concentration vs. average total free amino acid
concentration for the perfused cortex samples
ser
ala
asp
glu
gln
0.000
0.010
0.020
0.030
0.040
0.050
0.060
0.070
0.00 1.00 2.00 3.00 4.00 5.00 6.00
Tota
l D A
min
o A
cid
(µ
g/m
g)
Total Amino Acid (µg/mg)
Perfused Cortex
leu
thr
val
asn
ile
phe
0.000
0.005
0.010
0.015
0.020
0.00 0.02 0.04 0.06 0.08 0.10 0.12 0.14 0.16 0.18 0.20
Tota
l D A
min
o A
cid
(µ
g/m
g)
Total Amino Acid (µg/mg)
Page 52
43
References
1. Vauquelin, L.-N.; Robiquet, P. J., The discovery of a new plant principle in Asparagus sativus. Ann. Chim.(Paris) 1806, 57 (2), 1. 2. Vickery, H. B.; Schmidt, C. L. A., The History of the Discovery of the Amino Acids. Chemical Reviews 1931, 9 (2), 169-318. 3. Langford, C. H.; Beebe, R. A., The Development of Chemical Principles. Dover: 1995. 4. Meurant, G., ADVANCES IN PROTEIN CHEMISTRY. Elsevier Science: 1948. 5. Greenstein, J. P.; Birnbaum, S. M.; Otey, M. C., Optical and enzymatic characterization of amino acids. The Journal of biological chemistry 1953, 204 (1), 307. 6. Stevens, C. M.; Halpern, P. E.; Gigger, R. P., Occurrence of D-amino acids in some natural materials. The Journal of biological chemistry 1951, 190 (2), 705. 7. Young, K. D., Peptidoglycan. In eLS, John Wiley & Sons, Ltd: 2001. 8. Higashi, Y.; Strominger, J. L.; Sweeley, C. C., Structure of a lipid intermediate in cell wall peptidoglycan synthesis: a derivative of a C55 isoprenoid alcohol. Proceedings of the National Academy of Sciences of the United States of America 1967, 57 (6), 1878-1884. 9. Labischinski, H., Bacterial peptidoglycan: overview and evolving concepts. 1994; pp 23-38. 10. Corrigan, J. J., D-Amino Acids in Animals. Science 1969, 164 (3876), 142-149. 11. CLINE, D. B., On the physical origin of the homochirality of life. European Review 2005, 13 (SupplementS2), 49-59. 12. Martínez-Rodríguez, S.; Martínez-Gómez, A. I.; Rodríguez-Vico, F.; Clemente-Jiménez, J. M.; Las Heras-Vázquez, F. J., Natural Occurrence and Industrial Applications of d-Amino Acids: An Overview. Chemistry & Biodiversity 2010, 7 (6), 1531-1548. 13. Friedman, M., Chemistry, Nutrition, and Microbiology of d-Amino Acids. Journal of Agricultural and Food Chemistry 1999, 47 (9), 3457-3479. 14. Fujii, N.; Saito, T., Homochirality and life. The Chemical Record 2004, 4 (5), 267-278. 15. Yoshimura, T.; Goto, M., d-Amino acids in the brain: structure and function of pyridoxal phosphate-dependent amino acid racemases. FEBS Journal 2008, 275 (14), 3527-3537. 16. Taylor, R. E.; Aitken, M. J., Chronometric Dating in Archaeology. Springer US: 1997. 17. Walker, M., Quaternary Dating Methods. Wiley: 2013. 18. Bada, J. L.; Schroeder, R. A.; Protsch, R.; Berger, R., Concordance of Collagen-Based Radiocarbon and Aspartic-Acid Racemization Ages. Proceedings of the National Academy of Sciences of the United States of America 1974, 71 (3), 914-917. 19. Bada, J. L.; Luyendyk, B. P.; Maynard, J. B., Marine Sediments: Dating by the Racemization of Amino Acids. Science 1970, 170 (3959), 730-732. 20. Taylor, R. E., Non-concordance of radiocarbon and amino acid racemization; deduced age estimates on human bone; implications for the dating of the earliest Homo sapiens in the New World. Radiocarbon 1983, 25 (2), 647-654. 21. Helfman, P. M.; Bada, J. L.; Shou, M. Y., Considerations on the Role of Aspartic Acid Racemization in the Aging Process. Gerontology 1977, 23 (6), 419-425. 22. Man, E. H.; Sandhouse, M. E.; Burg, J.; Fisher, G. H., Accumulation of D-Aspartic Acid with Age in the Human Brain. Science 1983, 220 (4604), 1407-1408.
Page 53
44
23. Fisher, G. H.; Garcia, N. M.; Payan, I. L.; Cadilla-Perezrios, R.; Sheremata, W. A.; Man, E. H., D-Aspartic acid in purified myelin and myelin basic protein. Biochemical and Biophysical Research Communications 1986, 135 (2), 683-687. 24. Payan, I. L.; Cadilla-Perezrios, R.; Fisher, G. H.; Man, E. H., Analysis of problems encountered in the determination of amino acid enantiomeric ratios by gas chromatography. Analytical Biochemistry 1985, 149 (2), 484-491. 25. Dunlop, D. S.; Neidle, A.; McHale, D.; Dunlop, D. M.; Lajtha, A., The presence of free D-aspartic acid in rodents and man. Biochemical and Biophysical Research Communications 1986, 141 (1), 27-32. 26. Hashimoto, A.; Nishikawa, T.; Hayashi, T.; Fujii, N.; Harada, K.; Oka, T.; Takahashi, K., The presence of free D-serine in rat brain. FEBS Letters 1992, 296 (1), 33-36. 27. Hashimoto, A.; Nishikawa, T.; Oka, T.; Takahashi, K.; Hayashi, T., Determination of free amino acid enantiomers in rat brain and serum by high-performance liquid chromatography after derivatization with N-tert.-butyloxycarbonyl-l-cysteine and o-phthaldialdehyde. Journal of Chromatography B: Biomedical Sciences and Applications 1992, 582 (1–2), 41-48. 28. Miyoshi, Y.; Koga, R.; Oyama, T.; Han, H.; Ueno, K.; Masuyama, K.; Itoh, Y.; Hamase, K., HPLC analysis of naturally occurring free d-amino acids in mammals. Journal of Pharmaceutical and Biomedical Analysis 2012, 69 (0), 42-49. 29. Aswad, D. W., Determination of d- and l-aspartate in amino acid mixtures by high-performance liquid chromatography after derivatization with a chiral adduct of o-phthaldialdehyde. Analytical Biochemistry 1984, 137 (2), 405-409. 30. Hamase, K.; Homma, H.; Takigawa, Y.; Fukushima, T.; Santa, T.; Imai, K., Regional distribution and postnatal changes of d-amino acids in rat brain. Biochimica et Biophysica Acta (BBA) - General Subjects 1997, 1334 (2–3), 214-222. 31. Morikawa, A.; Hamase, K.; Inoue, T.; Konno, R.; Niwa, A.; Zaitsu, K., Determination of free d-aspartic acid, d-serine and d-alanine in the brain of mutant mice lacking d-amino-acid oxidase activity. Journal of Chromatography B: Biomedical Sciences and Applications 2001, 757 (1), 119-125. 32. Imai, K.; Fukushima, T.; Hagiwara, K.; Santa, T., Occurrence of D-aspartic acid in rat brain pineal gland. Biomedical chromatography : BMC 1995, 9 (2), 106. 33. Fukushima, T.; Kato, M.; Santa, T.; Imai, K., Enantiomeric separation and sensitive determination of D,L-amino acids derivatized with fluorogenic benzofurazan reagents on Pirkle type stationary phases. Biomedical chromatography : BMC 1995, 9 (1), 10. 34. Desai, M. J.; Armstrong, D. W., Analysis of native amino acid and peptide enantiomers by high-performance liquid chromatography/atmospheric pressure chemical ionization mass spectrometry. Journal of Mass Spectrometry 2004, 39 (2), 177-187. 35. Cohen, S. A.; Schure, M. R., Multidimensional Liquid Chromatography: Theory and Applications in Industrial Chemistry and the Life Sciences. Wiley: 2008. 36. Armstrong, D. W.; Duncan, J. D.; Lee, S. H., Evaluation of D-amino acid levels in human urine and in commercial L-amino acid samples. Amino acids 1991, 1 (1), 97. 37. Armstrong, D. W.; Gasper, M.; Lee, S. H.; Zukowski, J.; Ercal, N., D-amino acid levels in human physiological fluids. Chirality 1993, 5 (5), 375-8. 38. Armstrong, D. W.; Gasper, M. P.; Lee, S. H.; Ercal, N.; Zukowski, J., Factors controlling the level and determination of D-amino acids in the urine and plasma of laboratory rodents. Amino Acids 1993, 5 (2), 299-315. 39. Miyoshi, Y.; Hamase, K.; Tojo, Y.; Mita, M.; Konno, R.; Zaitsu, K., Determination of d-serine and d-alanine in the tissues and physiological fluids of mice with various d-
Page 54
45
amino-acid oxidase activities using two-dimensional high-performance liquid chromatography with fluorescence detection. Journal of Chromatography B 2009, 877 (24), 2506-2512. 40. Inoue, T.; Hamase, K.; Morikawa, A.; Zaitsu, K., Determination of minute amounts of d-leucine in various brain regions of rat and mouse using column-switching high-performance liquid chromatography. Journal of Chromatography B: Biomedical Sciences and Applications 2000, 744 (1), 213-219. 41. Horváth, K.; Gritti, F.; Fairchild, J. N.; Guiochon, G., On the optimization of the shell thickness of superficially porous particles. Journal of Chromatography A 2010, 1217 (41), 6373-6381. 42. Gritti, F.; Guiochon, G., Facts and Legends on Columns Packed with Sub-3-µm Core-Shell Particles. LC-GC N. Am. 2012, 586-597. 43. Gritti, F.; Guiochon, G., Theoretical investigation of diffusion along columns packed with fully and superficially porous particles. Journal of Chromatography A 2011, 1218 (22), 3476-3488. 44. Broeckhoven, K.; Cabooter, D.; Desmet, G., Kinetic performance comparison of fully and superficially porous particles with sizes ranging between 2.7 μm and 5 μm: Intrinsic evaluation and application to a pharmaceutical test compound. Journal of Pharmaceutical Analysis 2013, 3 (5), 313-323. 45. Patel, D. C.; Breitbach, Z. S.; Wahab, M. F.; Barhate, C. L.; Armstrong, D. W., Gone in Seconds: Praxis, Performance, and Peculiarities of Ultrafast Chiral Liquid Chromatography with Superficially Porous Particles. Analytical Chemistry 2015. 46. Bruns, S.; Stoeckel, D.; Smarsly, B. M.; Tallarek, U., Influence of particle properties on the wall region in packed capillaries. Journal of Chromatography A 2012, 1268, 53-63. 47. Dolzan, M. D.; Spudeit, D. A.; Breitbach, Z. S.; Barber, W. E.; Micke, G. A.; Armstrong, D. W., Comparison of superficially porous and fully porous silica supports used for a cyclofructan 6 hydrophilic interaction liquid chromatographic stationary phase. Journal of Chromatography A 2014, 1365, 124-130. 48. Gritti, F.; Guiochon, G., The mass transfer kinetics in columns packed with Halo-ES shell particles. Journal of Chromatography A 2011, 1218 (7), 907-921. 49. Fanali, S.; D’Orazio, G.; Farkas, T.; Chankvetadze, B., Comparative performance of capillary columns made with totally porous and core–shell particles coated with a polysaccharide-based chiral selector in nano-liquid chromatography and capillary electrochromatography. Journal of Chromatography A 2012, 1269, 136-142. 50. Lomsadze, K.; Jibuti, G.; Farkas, T.; Chankvetadze, B., Comparative high-performance liquid chromatography enantioseparations on polysaccharide based chiral stationary phases prepared by coating totally porous and core–shell silica particles. Journal of Chromatography A 2012, 1234, 50-55. 51. Spudeit, D. A.; Dolzan, M. D.; Breitbach, Z. S.; Barber, W. E.; Micke, G. A.; Armstrong, D. W., Superficially porous particles vs. fully porous particles for bonded high performance liquid chromatographic chiral stationary phases: Isopropyl cyclofructan 6. Journal of Chromatography A 2014, 1363, 89-95. 52. Fuchs, S. A.; Berger, R.; Klomp, L. W. J.; de Koning, T. J., d-Amino acids in the central nervous system in health and disease. Molecular Genetics and Metabolism 2005, 85 (3), 168-180. 53. Nagata, Y.; Horiike, K.; Maeda, T., Distribution of freed-serine in vertebrate brains. Brain Research 1994, 634 (2), 291-295. 54. Hashimoto, A.; Kumashiro, S.; Nishikawa, T.; Oka, T.; Takahashi, K.; Mito, T.; Takashima, S.; Doi, N.; Mizutani, Y.; Yamazaki, T.; Kaneko, T.; Ootomo, E., Embryonic
Page 55
46
Development and Postnatal Changes in Free d-Aspartate and d-Serine in the Human Prefrontal Cortex. Journal of Neurochemistry 1993, 61 (1), 348-351. 55. Wolosker, H.; Blackshaw, S.; Snyder, S. H., Serine racemase: A glial enzyme synthesizing d-serine to regulate glutamate-N-methyl-d-aspartate neurotransmission. Proceedings of the National Academy of Sciences 1999, 96 (23), 13409-13414. 56. Mothet, J.-P.; Parent, A. T.; Wolosker, H.; Brady, R. O.; Linden, D. J.; Ferris, C. D.; Rogawski, M. A.; Snyder, S. H., d-Serine is an endogenous ligand for the glycine site of the N-methyl-d-aspartate receptor. Proceedings of the National Academy of Sciences of the United States of America 2000, 97 (9), 4926-4931. 57. de Koning, T. J.; Klomp, L. W., Serine-deficiency syndromes. Current Opinion in Neurology 2004, 17 (2), 197-204. 58. Kantrowitz, J. T.; Malhotra, A. K.; Cornblatt, B.; Silipo, G.; Balla, A.; Suckow, R. F.; D'Souza, C.; Saksa, J.; Woods, S. W.; Javitt, D. C., High dose D-serine in the treatment of schizophrenia. Schizophrenia Research 2010, 121 (1–3), 125-130. 59. Hartman, A. L.; Stafstrom, C. E., Harnessing the power of metabolism for seizure prevention: Focus on dietary treatments. Epilepsy & Behavior 26 (3), 266-272. 60. Masino, S. A.; Rho, J. M., Mechanisms of ketogenic diet action. Epilepsia 2010, 51, 85-85. 61. Hartman, A. L.; Santos, P.; O'Riordan, K. J.; Stafstrom, C. E.; Marie Hardwick, J., Potent anti-seizure effects of D-leucine. Neurobiology of Disease 2015, 82, 46-53. 62. Armstrong, D. W.; Tang, Y.; Chen, S.; Zhou, Y.; Bagwill, C.; Chen, J.-R., Macrocyclic Antibiotics as a New Class of Chiral Selectors for Liquid Chromatography. Analytical Chemistry 1994, 66 (9), 1473-1484. 63. Lein, E. S.; Hawrylycz, M. J.; Ao, N.; Ayres, M.; Bensinger, A.; Bernard, A.; Boe, A. F.; Boguski, M. S.; Brockway, K. S.; Byrnes, E. J.; Chen, L.; Chen, L.; Chen, T.-M.; Chi Chin, M.; Chong, J.; Crook, B. E.; Czaplinska, A.; Dang, C. N.; Datta, S.; Dee, N. R.; Desaki, A. L.; Desta, T.; Diep, E.; Dolbeare, T. A.; Donelan, M. J.; Dong, H.-W.; Dougherty, J. G.; Duncan, B. J.; Ebbert, A. J.; Eichele, G.; Estin, L. K.; Faber, C.; Facer, B. A.; Fields, R.; Fischer, S. R.; Fliss, T. P.; Frensley, C.; Gates, S. N.; Glattfelder, K. J.; Halverson, K. R.; Hart, M. R.; Hohmann, J. G.; Howell, M. P.; Jeung, D. P.; Johnson, R. A.; Karr, P. T.; Kawal, R.; Kidney, J. M.; Knapik, R. H.; Kuan, C. L.; Lake, J. H.; Laramee, A. R.; Larsen, K. D.; Lau, C.; Lemon, T. A.; Liang, A. J.; Liu, Y.; Luong, L. T.; Michaels, J.; Morgan, J. J.; Morgan, R. J.; Mortrud, M. T.; Mosqueda, N. F.; Ng, L. L.; Ng, R.; Orta, G. J.; Overly, C. C.; Pak, T. H.; Parry, S. E.; Pathak, S. D.; Pearson, O. C.; Puchalski, R. B.; Riley, Z. L.; Rockett, H. R.; Rowland, S. A.; Royall, J. J.; Ruiz, M. J.; Sarno, N. R.; Schaffnit, K.; Shapovalova, N. V.; Sivisay, T.; Slaughterbeck, C. R.; Smith, S. C.; Smith, K. A.; Smith, B. I.; Sodt, A. J.; Stewart, N. N.; Stumpf, K.-R.; Sunkin, S. M.; Sutram, M.; Tam, A.; Teemer, C. D.; Thaller, C.; Thompson, C. L.; Varnam, L. R.; Visel, A.; Whitlock, R. M.; Wohnoutka, P. E.; Wolkey, C. K.; Wong, V. Y.; Wood, M.; Yaylaoglu, M. B.; Young, R. C.; Youngstrom, B. L.; Feng Yuan, X.; Zhang, B.; Zwingman, T. A.; Jones, A. R., Genome-wide atlas of gene expression in the adult mouse brain. Nature 2007, 445 (7124), 168-176. 64. Jámbor, A.; Molnár-Perl, I., Amino acid analysis by high-performance liquid chromatography after derivatization with 9-fluorenylmethyloxycarbonyl chloride: Literature overview and further study. Journal of Chromatography A 2009, 1216 (15), 3064-3077. 65. Moghaddam, B.; Javitt, D., From Revolution to Evolution: The Glutamate Hypothesis of Schizophrenia and its Implication for Treatment. NEUROPSYCHOPHARMACOLOGY 2012, 37 (1), 4-15. 66. D'Aniello, A., d-Aspartic acid: An endogenous amino acid with an important neuroendocrine role. Brain Research Reviews 2007, 53 (2), 215-234.
Page 56
47
67. Farooqui, A.; Ong, W.-Y.; Horrocks, L., Glutamate and Aspartate in Brain. In Neurochemical Aspects of Excitotoxicity, Springer New York: 2008; pp 3-20. 68. Zhou, Y.; Danbolt, N. C., Glutamate as a neurotransmitter in the healthy brain. J Neural Transm 2014, 121 (8), 799-817. 69. Jakó, T.; Szabó, E.; Tábi, T.; Zachar, G.; Csillag, A.; Szökő, É., Chiral analysis of amino acid neurotransmitters and neuromodulators in mouse brain by CE-LIF. ELECTROPHORESIS 2014, 35 (19), 2870-2876. 70. Price, J. L.; Drevets, W. C., Neurocircuitry of Mood Disorders. Neuropsychopharmacology 2010, 35 (1), 192-216. 71. Salvadore, G.; van der Veen, J. W.; Zhang, Y.; Marenco, S.; Machado-Vieira, R.; Baumann, J.; Ibrahim, L. A.; Luckenbaugh, D. A.; Shen, J.; Drevets, W. C.; Zarate, C. A., An investigation of amino-acid neurotransmitters as potential predictors of clinical improvement to ketamine in depression. INTERNATIONAL JOURNAL OF NEUROPSYCHOPHARMACOLOGY 2012, 15 (8), 1063-1072. 72. Fisher, G. H.; D'Aniello, A.; Vetere, A.; Padula, L.; Cusano, G. P.; Man, E. H., Free D-aspartate and D-alanine in normal and Alzheimer brain. Brain Research Bulletin 1991, 26 (6), 983-985. 73. D'Aniello, A.; Vetere, A.; Fisher, G. H.; Cusano, G.; Chavez, M.; Petrucelli, L., Presence of d-alanine in proteins of normal and Alzheimer human brain. Brain Research 1992, 592 (1), 44-48.
Page 57
48
Biographical Information
Curran Parpia was born in 1990 in Bedford, Texas into a family of scholars. In
2008, after graduating from Trinity HS in Euless, Texas, Curran left the state to pursue a
degree in Biomedical Engineering at Purdue University. After one year attending Purdue,
Curran returned to Texas despite seeing academic success, realizing that his heart was
neither in his degree plan nor in West Lafayette, Indiana. In 2010, after his first year
attending the University of Texas at Arlington as a chemistry major, Curran was awarded
the Honors Undergraduate Research and Creative Activity grant for one summer of paid
research in the Foss Laboratory, where he was exposed to organic synthesis. Curran
graduated from the University of Texas at Arlington with a Bachelor’s of Science in
Biochemistry in May, 2012. After a direct transition into the graduate program, Curran still
believed organic synthesis was the route he wished to pursue. However, as a Master’s
student, Curran found passion in analytical chemistry after topping the class of his future
advisor, Dr. Daniel Armstrong. Curran greatly enjoyed the field of chromatography and
separation science, with a tremendous admiration for his advisor Dr. Armstrong. In good
health, Curran hopes to remain on the path to success and complete his PhD in
Analytical Chemistry.