87
F 4 Determinationof Asphalt Content by Ignition Method *

F 4
Determinationof Asphalt Content by Ignition Method *


--------- ---------
--------
--------
1 . Report No. L! .
RmPR - 96/30 .I--I------4 Title and Subtitle
DETERMINATION OF ASPHALT CONTENT BY IGNITION METHOD
.--------_I 7. Aufhor(s)
Wei Zhang---_---___ .----------9. Performing Organization Name and Address
Minnesota Department of Transportation Office of Construction and Materials Engineering 1400 Gervds Avenue Maplewood, IvDJ 5 5 109
12:. Sponsoring Orypization Name and Address
Miimesota Departnient of Transportation 3!35John Ireland Boulevard Mail Stop 3 0 St.Pau1 Minnesota, 55155
15. Supplementary No&es
16. Abstract (Limit: 200 words)
Technical Repoirt Docnmemitation Page-----_I-.--- .----I_-
3. Recipient’s Accession No.
----_ 10. Projec:(/TasMWork Unit No.
~
Lhis report presents the results of a four-nionth research project on the use of the ignition method for determining the asphalt content and aggregate gradation of a hot-mix asphalt concrete mixture. The report includes a review oE the available meithods on asphalt content determination and the development of ignition1 method. ‘Thisresearch xpanded the knowledge in this area by fclcusing on Recycled Asphalt f’awment (RAP) mixtures and providing ways to estimate the combined weight loss factor of RAP mixes and virgiitx mixw made from midtiple sources of fggregate.
rlhe conclusions drawn from this research are based on the laboratory results of 36 M I ’ and 36 virgin mixes. resting showed that regardless of R A P or virgin mix, as long as apprqniae procedures are followed, the ignition method can accurately determine asphalt content and aggregate graduation of a mixture. The easy-to-use spreadsheet program written for estimating the combined weight loss factor can save the operator from repeating laboratory calibration on mixes made from identical aggregates but different proportions.
L 7. Document Analysi!;lDescriptors 18. Availability Statement
[pitionMethod Weight Loss Factor No reslrrictioitis. Document available from: Recycled Asphalt Pavement (RAP) Indirect Calibration National Technical Information Services, Hot Mix Asphalt ( E r n )- - -~- -19. Security Class (this report)
Unclassified
_-_-----20. Security Class ( th is page)TLlnclassified
Springfie:ld,Virginia122 161 -.----__.--2%.Pricer- - _ - - _ - - - . ~
21. No. of Rages


DETERR/IINATION OF ASPHA 11'T CIONrEN'IIY BY NGNITION METI-IOD
Final Report
Prepared by
Wei Zhang, Ph.D., P,E.
Minnesota Department of Transportation Office of Construction and Materials Engineering
1400 Gervais Avenue Maplewood, MN 55109
September 1996
Published by
Minnesota Department of 'Transportation Office of Research Adrninistraticrn 200 Ford Building Mail Stop 338
117 University Avenue St. Paul, M[N55155
The contents of' this report reflect the views of the author who is responsblt: for the facts and accuracy of lhe data presented ht:reiln. The contents do not 1ir:cessarily reflect the views or pdicres of the Minnesota Department of Transportation at the time of publication. 'I7nis report does not constitute a standard, specification, or regulation.
The author and the Minnesota Departmenl of Transportation do not endorse products or manufamrers. 'Trade or manufacturers' names appear herein solely because they are considered essential to this report.


The Minnesota Department of Tramporlation (Mn/lDOT) IPitumhious Office at the
Maplevvood Materials Lab provided the necessary equipment arid laboratory space for this
research. Thanks are due to Mr. Richard Nelson, for installing tlhe exhaust system; Mr. Steve
Persons, for sampling and delivering the aggregates; Commercial Asplhalt In(:. for dlonathg the
Recycled Asphalt Pavement; Mr. Pmdrew Frank Ilale, for coriduciing some tests; Mr. Thomas
Hunt, for directing his staff to split ithe aggregates; and to Mr. John Garrity, MroKicliiard Evans,
arid Mr. John Nelson, for providing helpful suggestions in fimalizirig this reporl..


Chapter 1 INTRODUCTION ...................................................... :1
13ackgroundi .................................................... X Objectives . . . . . . . . . . . . . . . . . . . . . . . . . . . . . . . . . . . . . . . . . . . . . . . . . . . . . 2
Chapter 2 LITERATURE RE'C'IIEW . . . . . . . . . . . . . . . . . . . . . . . . . . . . . . . . . . . . . . . . . . . . . . 3
Ilevelopment of Ignition Method . . . . . . . . . . . a . . ~ . . . . . . . . . .~ . . :3 Ignition Method Test Pr0cedure.s . ~ . . I . . . . . . . . . . . ~ . . . . . .~ . .. . . 3 Correction of.M[easuredAsphalt Content . ~ . . . . . . . . . . . . . . . . . . . 4
Chapter 3 PROPOSED TEST IPKOCI3DUREi ~ ...a . . . . . . . . . . . .. . ~ . . . . . . I . . . . . . '7
Definition of Weight LdossFactor . . . . . . . . . . .. . . . . . . . . ~ . . . ~ . . . '7 Estimation of Combined Weight Loss Factor . . . . . . . . . .~ . . . ~ . ~ '7
Chapter 4 LABORATORY EXPERIMENT . . ~ . . * . . . .. a a . . I . . ~ . ~ 1/ . ~ . . 9
Equipment and .Material Selectiton . . . . . . . . . . . . . . . . . . . . . . . . . . . . . . . .!2 SpecimenPn:paration .......................................... !J Testing Program .............................................. 10 Analysis ofl'est Results ........................................ 1:1
Chapter 5 CONCLUSIONS AN11 RECOMMENDATIONS . . ~ . . . ~ , ~ . . ~ . ~ . . ~ ~ 13
Conclusions . . . . . . . . . . . . . . . . . . . . . . . . . . . . . . . . . . . . . . . . . . . . . . . 13 Recornmendations . . . . . . . . . . . . . . . . . . . . . . . . . . . . . . . . . . . . . . . . . . . 13
R E E E ~ N C E. . . . . . . . . . . . . . . . . . . . . . . . . . . . . . . . . . . . . . . . . . . . . . . . . . . . . . . . . . . . . . . . 15
APPENDIX A ILLUSTMT'NE EXAMPLE
APPENDIIX B COMPLETE TIiST AND (XLC'CJL.AT I ON RE!WLTS

1
3
5
7
2
4
6
8
llJISTOF TABLIES
Table 1 Minimum sample weight (afte.rVDOT VTh4 10%.1995) . . . . . . . . .. . . . .~ . . .
Table 2 Lithological summary . . . . . ~ . . . . . . . . . . . . . . ~ . . . . ~ . . . . a . . . . . Table 3 Aggregate gradation ~ . . . . . . . . . . . . . . . . . . . . a . . . .~ ... . . . .
Table 4 RAP gradation .. I . ~ + . . . . . . I . .. . I a (I . . . . . .~ a . . . . . . . . I .
Table5 KAPrnixes .. ~a a * . " . * . " . . . . + . . ... . . . . . . . . .. . . . . . . D " . . .
Table6Virginimixes . . . . .(I ..l...D....... " . s . . r . . . . . . . . . . . . . l . . . . . O . .. . . . .
Table 7 Measured asphalt conteirit of RAP, ignition method ~ . . . . . . . . . .a . . . . . . . ... Table 8 'Weight loss factor, compaJison between mixture and aggregate only calibratioin
Table 9 Weight loss factor of virgin mix, comparison between test:result: and prediction
Table 10 Weight loss factor of M P mix, comparison between test result and prediction
Table 13 Corrected asphalt content of"virgin mix . . . . ~ .. .. ~ . . . . . ...I . I ~ ~ I . . . .
Table 12, Corrected asphalt content of IIWP mix . . . . . . . ." . , . . . .a .... . . . . - I . . . .
LIST OF FIGURES
Fig. Decomposition of ��MAsample . . . . . . . . . . . . . . . . . . . . . . . . . . . . . . . . . . . . . . . . . . . .
Fig. Removal of moisture in samiple at 110OC (2310 9). . . . . . . . . . . . . . . . . . . . . . . . . . . . . . . Fig. Temperature history (luring ignition test .........................................
Fig. Griradation of AGG1 before and after ignition test . . . . . . . . . . . . . . . . . . . . . . . . . . . . . . . . Fig Grradation of AGG2 before and after ignition test . . . . . . . . . . . . . . . . . . . . . . . . . . . . . . .
Fig. Gcadatim of AGG3 before and after ignition test . . . . . . . . . . . . . . . . . . . . . . . . . . . . . . . Fig. Gkadation of AGG4 before and after ignition test . . . . . . . . . . . . . . . . . . . . . . . . . . . . . .
Fig. Confidence level of correcteld asphalt content . . . . . . . . . . . . . . . . . . . . . . . . . . . . . . . . . .
o * 17
. . 17
. 18
. . 18
. . 19
. . 19
. 20
. . 20
~~ 21
~ ~ 21
. . 22 22
23
24 25
26
2'7
28 29
30

NOTATION
cA
P
PC
Pm
PR
Pkn
PRmn P
r
-= calibration Fdctor, ASTM test procedure
== calibration factor, VDO'T' test procedure
== true asphalt content in a mixture
== corrected a.sphaltcontent of a mixture
== measured.asphalt content.of a mixture
== true asphalt content in the RAP
2: measured aisphalt content of RAP by Ignition method
=I measured aisphalt content of RAP m by ignition method
=: proportion of aggregate in the blend
=: proportion of aggregate n in the blend
=: proportion of RAE' in the blend
=I proportion of RAP n in the blend
=: weight Xoss, factor, proposed test procedure
=: weight loss factor of aggregate:n, pro.oposetltest: ,procedure
=: combined weight loss factor, proposed tt:st. procedure
=: weight loss factor of aggregate:in 114i13n
=: weight of fresh asphalt cement.
=: weight of IFLAP
=: weight of asphalt cement in the mixture
=: weight of mineral aggregate in the mixture
=: weight of mineral aggregate loss during ignition
=: weight of nlineral aggregate remain after ignition


EXECUTIVE SIJMMARY
Determinationof asphalt coriterrt and aggregategradation of a mixture is crucial to the quality
control (QC) of the production of hot mix asphalt (HMA). 'The test is traditionally done by the
solvent extraction method, in which chlorinated solvents are used to dissollve the asphalt, the
remainmg aggregate can be used for gradation analysis. The chlorjnatetY sslve~titsare carcinogeriic
and have been discouraged for use in the Minnesota Deprtrnent of 'Tran!qrrtatxon(MdIIOT) labs.
A breed of lqiol-degradable solvents were developed as substitute. Generally speaking, the bjo
tlegraclablt: solvents are not as eflfici~entas the chlorinated solvents, and the disposal cost (currently
at about $4513harrel) is relatively higlh.
The ignition method detemnt:s the asphalt content of a mixture by burning off the asphalt
at a high temperature (540 "('I). This method was first investigated in the llate 1960s m d
reinvestigated in 1990. After 5 years of research and development, the fust successful ignition oven
was produced by the Barnsteaflrhernnolyne Co. If used properlly, the ignition method cain exceed
the solvent extraction method in buth accuracy and speed. So far this is the only method that can
effectively replace the solvent extraction method.
The iisphalt content determined by the ignitioin method is alwniy!, higher thaii the actual
amount of asphdt in the mix because off the loss of aggregate during ignition, The currmt research
arid test procedures deal mainly with vilrgin mixes, and require calibration of all mixtures. Currently,
about 3500 extraction tests are performed in Mn/I407' annwalPy. Extraiction test is done only on
recycled asplialt pavement (RAP) mixtures, and nearly all hot mix asplhalt concrete mixtures iire
produced from inultiple sources of agregate. In order for Mn/lDO'II'to implement this method, we
must make sure that the asphalt content of a RAP mixture can biz: determined accurately by ihe
ignition method. Additionally, if the correction factors of all indiivitlixal inggregates are h a w n , and
differentmixes are produced by conmbjning the aggregates in different proportions, is it possibly to
estimate the combined correction f<acctorof the mix?
Four poor quality aggregates firom southwestern Minnesota and three RAPS from the Twin
Cities area wiere obtained for this research. A total of 36 RAP and 36 virgin miixes were produced
by cornbinjng the three RAPS and four aggregates and adding diffixent amount of asphalt to the
blends. 4 1 samples were produced according to the current Mn/DO'l' specificabons for bituminous

materials. The issues addressed in this research irnclude
0 Accuracy of ignition niethod on KA13 mix
0 ]Estimationof the ccbmbined correction factor
0 Equivalency betvveen mixture calibration and aggrega1e only calibration
0 Effect of ignition on(aggregate gradation
0 Time required to remove the moisture in the sample
'The laboratory test results show
0 The ignition metlhod can be used to determine the A(1 content of both virgin and
IL4P mixes, the degree of accuracy is about +.0.11%at a 90% confidence level.
The correction factor of a composite mixture ca i be: estiirialed accurately.4)
a)
0
0
Mixture calibration at 538 OC is not equivalent to) aggregate only calibration at
578 'C for the materials tested in this study.
Ignition lest does not significantlyaffect the aggireega1.c: gradation.
Moisture in the simple can be removed in 40 minutes when heated in a Despatch
V series oven at 1 10 'C (230 9).
Based on the results of h i s study, it is recommended t h t
a) Training in the uise of the ignition oven should be included in the Tl'echnical
Certification classes for the 1997 constructitrn season
Projects should be designated to irnplement the iginiition test method in the 199'7(I)
a1
construction season.
A databa:;e of aggregate correction factors be establlished and start to ;icccumulate
on a regional and statewide basis.

CHAPTER 1.
I:NTRODUC'I'ION
IkACMGROUND
Detennimticon of asphalt content (AC) and aggregate gradation in a mixture i s critical in the
quality control (QC) and quality assurance (Q.A) of hot mix asphalt concrete (HMA) piroduct:ion.
The methods developed so far for db:tmnbing the AC (contentinclude solvent extraction, nuclear
asphalt content gauge (NAC),pycnorneter method, automatic remrdation, ariid ignition method.
'The slolvent extraction methods (centrifuge, refliux, and va.cicI1tun exbaction) use chlorinated
solvents to dissolve the asphalt cement in the mixture:, the remaining aggregate can be uisetl. to
determine aggregate gradation. The traditional solvents uisetl in extraction, such as 1, :l,1-.
trichloroethane and Trichloroethylene, are carcinogenic, and haw been discouraged. for use in
the Minnesota Department of Transportation (MdDOT) labs A breed of bio-tiegradalt)lesolveirnts
(Biocat and Zecol plus, etc.) derived primarily fFom citrus c1.r pivie tree processing, were
d.eveloped as substitutes. Although comparable accuracy can be achieved with bio-degradaible
solvents, the test becomes more clmnplicated and time consumitig (I.). The disposal of used
biodegratiabl'esolvents is by no means cheaper.
Tlhe PJAC gauges emit high ,velocity "fast" neutrons from a. radioactive source, and csunt
the neutrons slowed-down by the hydrogen which present primarily in asphalt cement., ELS a
measuire of the AC content of the nljixture. The NAC gauges measure the AC cmtmt with
accuracy and speed, usually within 1.6minutes after the sample is placed.hthe gauge. :Itis i3 good
quick method of spot check, however, aggregate gradlation camnot be detemidnecl following the
determination of asphalt content. If recycled asphalt pavement. (W)is; used, the only acceptable
method of determining the AG content of RAP is so1ve:ntextract.ion.. Special trainjing and 1ice:nse
is required to operate the NAC gauges; and individual calibratioin of the NAC gauge (about four
to six hours) is needed whenever there is a change in the NAC: g,au.ge'soperathq; environment,
mix design proportions, aggregate :source, asphalt cement grade, or asphalt cement s;ouirce (2) ~
Tlhe pycinometer method iis a modified version o'f the theoire.tj~:d:maximumspecific gravity
test. The specific gravities of the aggregate, asphalt cement, and. a.sphaltic concrete imixhrre are
P

determined first, then a theoretic formula is used to calculate the AC content. This method
assumes constant specific gravities of all ingredients in the mixture. Error can result when using
samples that are not properly batched or aggregate sources wHth variable specific gravities. It shares the same drawbacks of the NAC gauges of unable to detenrnine the aggregate gradatilon
and mandatory use of solvent extraction when I W i s invo1ve:tj.(I).
The automatic recordation method determines the ACI cont:ent by monitoring the toxal
amount of aggregate and asphalt cement used in a given t.imc: period of production. It: is a
valuable tool of quality control, bul. it does not provide a spot check of the AC content of the
end product-asphalt concrete mixture, and gratla.tioncheck mixst be done through other means.
The ignition method determines the AC:I content of an HIMA mixture by burning off t;he
asphalt cement at elevated tenipr:rah.ire (540 OC), the remaining aggregate can be ust:d to check
gradation. Recent im1provemci:nt in quipment. have significaintly .reducedthe: effect o f aggregate
type on AC content result, the: ttstirng time also has been reduced from more than two hours to
30-40 minutes, depending on the sample size (I), making it a hvorite alternative of the solvent.
extraction method. The roimcl robin study clonducted by the National Center of Asphalt
Technology (NCAT) indicated that, when the aggregate contri'bution was known, Ithe corrected
AC content was within +O. 1% of the actual AC content at a 9.596 confidence level (3). Further
research is underway 'to improve the method such that a calibratiolr~hctor would not be required
for ignition testing.
OBJECTmS
Most research results published so far on the ignition method have dealt with virgin asphalt
concrete mixes. At MdDO?', extraction tests are conducted only on R A P mixes, and most
mixes are produced from multi~plesources of aggregate. To effecf ively replace the solvent
extraction method with ignition method, comparable accuracy of AC content determination must
be achieved on RAP mixes.
The objectives of this research are:
0 Assess the suitability of ignition nnethotl to mixes
Develop suitable metlnods for estimating the combined correction factor for U P
mixes and mixes made from multiiple sources of aggregate
0 Develop a test procedure for use in the state of Minrlesota.
2

CHAPTER 2
LITIERATURE IREYIltW
I)EVI,LOI'MESNT OF ZGNITXOIV METHOD
The fust attempt at determining thc AC content of HMA by ignilion method was made. by hitnlm
and Wischhg in 1969 (5) , in wlhich HMA samples were burned at 843 OC (1550OF) in a special
furnace rasing Butane as a fuel, and with an excess of oxygen. Eksults; obtained from tkan study
revealed that for some types of Ximestone, the measureld A@coritei[ntcoiuldi deviate up lo 1 percent
from the tm: AC content.
In 1990, the National Center of Asphalt Technology (NCAT) conducted a similar study
using a muffle furnace. Initially, HMA samples were put into a shallow porcelain dish, and
bwnecl at, 593 'C (1100 OF). It was found that the concave shape of the porce:lain dislh tended to
catch a thick layer of irnelted asphalt and it could take up to 4.5 hours to burn off the aspkalt
cement Laiter, the container was clhanged to a flat, stainless steel pan, and then two stacked
stainless steel p m , eaclh containing half of the sample, the test h e was reduced to I .75 hours.
I;inally, two stacked stainless steel )basketwith 4.75 mn (No. 4.) screen mesh and a sdxd flat pan
underneath were used, the test time of a 1200 g sample was, reduced to about 30 minutes by
pulling air through the lurnace. Further study at NCAT shown that the test temperature could be
lowered to 5138,OC to reduce the 1m:akdswn of some types of aggregate without significaintly
iincreasing Ihe test time (4). The round robin study coordinated by NCAT showed that iigni~tionof HMA miixture at
538 OC woulcl not cause notable changes in aggregate giradation, and after correction foir aggregate
loss, accurale result of AC content could be obtained. In lB%, this method was offici,ally
accepted as ,an alternative to the slolvent extraction method, and standard tcst procedures and
commercially available furnaces began to appear.
IGNITHON MIETHOD TEST PKOCEDBTRES
Currently, tlhe ASTM "Standard test method for asphalt cointent of hot mix asphalt by ithe
ignition inetliod" (6), and the "Viirghia test method for dett:miination of asphalt content from
asphalt paving imixtures by the ignition method" (7) are the two widely known test procedures

of ignition tests. In both procedures, the test temperature is spt:cxfied at 538 OC for HMA and
578 OC for aggregate only calibration, and the sample size is determined by the nominal
maxmum size (defined as one size smaller ihan the: first sieve that retains aggregate) of the
aggregate according to Tablc 1.
In the ASTM procedure, two samples are required per c;ali'hration, no specific guideline
of the calibration of RAP mixes is provided. In the Qirgiria DO'T procedure, a total of six
samples (two at design AC content, two at 0. 5 percent below, arid two at 0. 5 percent above
the design AC content) are required for mixlure calibration. Four samples are: required for
aggregate only calibration. The method provides a guidelirir: for the calibration of RAP
mixtures
CORWCTXON OF MIEAS~LII;LED ASPHALT CoNirENr
'The measured AC content obLained from igrlition test is always higher than the actual AC
content in the mixture, due to the combustion of the minerall aggregate, and the loss of fine
particles caused by convection during ignition Calihration is nec:t:ssary to correct the mioixnt
of weight loss that is not due tcb the:: asphalt cerrient.
A dry HMA sample can be clonsidered of consisting of three components: asphalt (WAS,),
aggregate that will be lost during ignition (WAL),and aggregane that will remain after ignition
(WAF)(Fig" I). The initial weight of aggregate and the total weight of mixture are denoted as
WASsand W, in Fig. 1, respectively.
In the ASTM Procedure, the calibration factor is defined ,as the ratio of aggregate weight
loss over tht: initial weight of aggregate
where
cA: calibration factor, ASTM test pirocedure
and the corrected AC content is determined as
4

where
pc: the corrected AC content
pm: the measured AC content by ignition neth hod
v: the tme AC contcnt of the mixture
Since for ii field sample, the tnie AC content. p is uiknown, it has 10 be assumed that p equals
the correcled AC content pc, solving Eq. 2 for pc gives
In the Virginia DOT procedure, the calibration factor is defined as the ratio of aggregate
weight loss over the total weight of the mixture
where
G,: calibration factor, VDOT procedure
For a field sample, the corrected AC content is calculated from
5


--
CHAPTER 3
DEFINITION OF WEIGHT 1,OSS FACTOR
Referring to Fig. 1, the corrected AC content of a mixture is
the tliffereincr: between the ASTM and VDOT procedures lies in the way to calculated the
amount of aggregate weight loss WALo In twlc: ASTM procdurc:, W,,=~~W~i(:l,-p),which
contains the unknown true AC content p for a field sample, and the assumption of' p :=:pchas to
be made. In the Virginia DOT' procedure, WAL=cVWT,the ca:librat.on factor c , ~(Eq. 4) is
dependent on the AC content of' the mixture, which. is inhei:entl:y not a suitable de:fi:'inition.
Another way to correct the measured AC coitent is to htrod.uce a weight loss factor, ir,
as the ratio off aggregate weight loss over the final .weight of aggrej;ate
and accordmg,ly, the corrected AC content is
:rW,P, = l?m '-
WT
The advantage of this definition (Eq. 7) is thal. when cur.rt:cring the measured AC content,
all terns Xn Eq. 8 are measured directly from test, 130 assumptiion is needed. For mixes made
from mulriple aggregate sources, and RAP mixes, this defiiiitxon nalurally leads to a method of
estimating the combined weight loss factor from the individual weight loss factor!;.
ESTmA'I"0N OF COMBINED WEIGHT LOSS FACTOR,
For rnixes made from multiple aggregate sources and RAPS,the cornhined weight loss factor can
be estbialed if the weight loss factors of individual aggregates are known. By defimtion, the
combined weight loss factor for mixes made from rnultiple sourc:es of aggregate IIS
7

rcomb: combined weight loss factor
T,: weight loss factor of aggregate n
P,: proportion of aggregate n in thc: blend
and for ]RAE' mix, the combined wcight loss factor is
where
pKmn:measured AC contenl: of RAP n by ignition r n e h d
PIh: proportion of RAP n in the blend
Equation 10 provides a lower estimate of the t iue combined weight loss factor, because
the loss of aggrega.te in the RAE' is ignored. :I[f the weight loss factor of' the aggregate in the
RAP is known, the true combined weight loss factor will be
(:11)
where
rR,: weight loss factor of aggregate in RAP n
The indirect method (Eqs. 9 to ill) offers the flexibil ity of quickly estimating the
combined weight loss factor or calibration factor in any proportion of the aggregates without
running more tests. Since the calibration factor defined in the Virginia DOT procedure is A(3
contenf dependent, it is not convmient for estimating the combined calibrdtion factor.
8
CHAPTIER 4
LABORATORY EXPEN KMENI'
EQUIPMENT AND MATERIILAL,
To verify the accuracy of ignit'non method and the analysis pre:sented in Chapter 3 , a series of
laboratory tests were conducted. The tests were done using a Banistead/Therr.iolyrie Model
F85938 asphalt content tester. 1:t has a chamber temperature rating (of 100 "C-650 "C, an im'ternal
balance with 8000 g capacity, and a maximum load capacity of 3000 g in addition t o the sample
holder ~
Four types of aggregates, from southwestern Minnesota. (District S), and three types of
RAPS,from three metro plants of Commercial Asphalt Inc., were sellected for this study. The
aggregates; have rela.tively high porosities, and are considered poor quality aggregates. The
RAPSare considered representative in the Minneapolis-St. Paul metro area. The sources of
aggregates and RAPSare:
Aggregate :l (BA950401:):
Aggregate 2 (BA9.50403:):
Aggregate 3 (BA950405):
Aggregate 4 (BA950407:):
RAP1 (BR95013):
RAP2 (BR95014):
RAP3 (BR95015):
Robbenal fines
Ringos fines
Kalloff fines
Gergen fines
St. Paul, Conlmercial Asphalt, 3/4 inch mi~iius
Red Rock, conmercial A.sphale, 1/2 iinch minus
Maple Grove, Commercial Asphalt, .3/4inch minus
The lithological summary and gradation of the aggregates and ' W s are listed in Tables
2, 3!,and 4.
SPECIMEN PREPARATION
'The aggregates and RAPS were sieved into individual fractions and recombined into the original
gradation. Mixtures were prepared according to the cunent IVIDO'I' specificatxons for
bitummous materials. For virgin n ix specknens, the recombined aggregate was dried in an oven
at 135 'C (275 OF) foI at least 10 hours, for RAP mix specimens, the: reconibined aggregate and
RAP were dried in oven at 135OC:: (275 O:F) for 2 to 3 hours. Prior to1 mixing, the asphalt cement
9
was heated at 135 OC (2'75 'E') for itbout 3 hours, and ahe mixing bowl and spoons were heated
at the same temperature for 30 minutes. 'TWO samples were prepared each time usin!: a
mechanical mixer. The asphaltic concrete mixhlre was cured in the oven at 135OC (275 OF) for
45 minutes.
TES'ITNG PRO(;RNM
The laboratory tests were planned to address and clarify the fclllowing issues a Time required to remove the moisture in the sample 0 Equivalency between mixture calibration andl aggregate only calibration 0 Effect of ignition on aggregate giradatioxi
0 Accuracy of ignir.ion method on ] U P mix 0 Verification of the formulae for estimating the combined weight loss factor
'I'o eliminate the effect of moisture on the accuracy of' test result., samples need to be
dried ,inoven first. Two HMA slamples(2000 $;/each) with a 0. 5% xnoistclre content (by weight
of dry sample) and two aggregate samples (2000 g/each) with a. 3 . 0% moisture contents were
prepared and let dry in a Despatch V series oven at 110°C (230 'IF). The samples were weighed
periodically until constant weight was reached. The results art: shown in Fig,,2, and it can be
seen that for 'both HMA and aggregate samples, moisture can be 1-emoved almost c;ompletely in
40 minutes. 'This time was ad.opted as the minim.um drying tlIYie in the following ignition tests.
'To examine the equivalency between nnj.xture and aggregate only calibration, and the
effect of ignition on aggregate gradation, 8 aggregate specimens (2 specimens from each
aggregate source), and 16 HMA. specimens (2 AC contents, 4 specirnens from ea.ch aggregate
source) were prepared. The aggregate spechnens were tested at 578 O C , and the mixture
specimens were tested ait 538 OC:. The aggregate salvaged afkr ignition. tests were used f'or
gradation analysis and the result was compared to the original gradaaion.
To check the accuracy of ignition method on RAP mi:~e:sand verify the formulae fior
estimating the combined weight ~ O S Sfactor, 12 1UP mix blends ('Table 5, IM950014-950025)
and 12 v'lrgin mix blends (Table 6, 1M950026-950037) were produced by combining the RAl?s
and aggregates. A. total of 14.4 !;am:ples were prleparecl and tested (Tables 5 and 6) - For RAP
mixes, the AC content j.n the IUI:'was detewnnined by ignition method (Table 7) , and the
10
following folrmula was used to calculate the amount of asphall cenneat to be addctl to bring the
mixture to the desired AC content.
where
New: weight of fresh asphalt cementWASP. w,,,: weight of aggregate
WRAP: weight of RAP
P R : AC content in the RAP
P: desired AC content in the mixture
ANALYSIS OF TEST FtESUI.,TS
The weight loss factors determined from mixtblre c(a1ibrationand aggregate o r ~ ycalibration are
listed in Table 8. It can be seen that except Agg3, the weight loss factor detmnined from
mixture c;tlibration is usually higher than that determined from aggregate o@y calibration.
Figure 3 shows the temperature history of a HMA sample and an aggreg;i.te sample during the
ignitim test. For the HMA sample, the temperature reached over 600 '(2 after 10 minutes of
ignition test, much higher than the 538 "Cset te1npe:rature. If the te:rnperalnre spilce is regarded
as a sign of the intensity of combustion, it is obvious That the ig;nit.ionof a 'HMA sample is mc9re
violent than an aggregate sample.
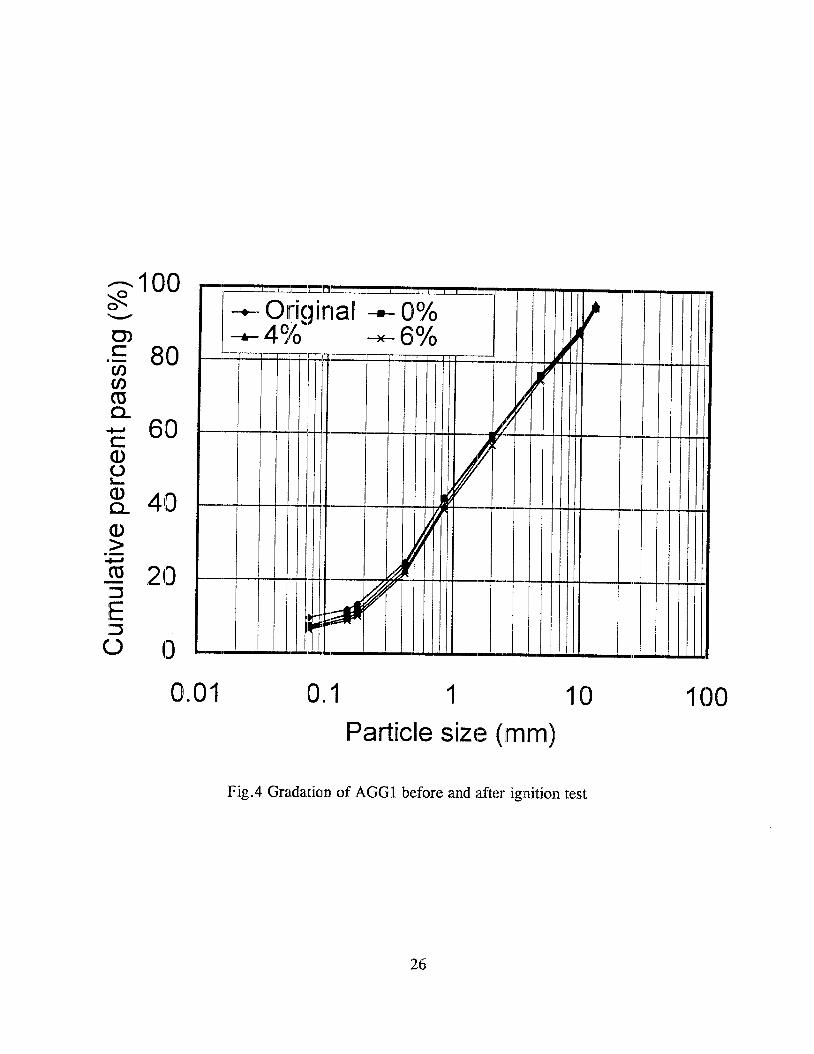
The aggregate gradation:; before and after the ignition test are plotted in Figs. 4. to 7.
On the avexage, the gradation after ignition test deviates less than 5 % from the original. It can
be co.ncludedthat the: current ignition test procedure does noii significantly affect .the a.ggregate
gradation.
Tatrleis 9 and 10 list the ,weight loss factors deternaimll from experimt:nt ;ind predicted
from Elq. 8 (virgin mixes) and Eq. 9 (RAP mixes). The t:xpe:rimentall,y determined weight
losses :factor represent the averaged result of 4 samples for .the.virgin mixes, and 6 samples for
the RAP mixes. It can be seen hat for most of the mixes:, the absolute differencci: between tihe
experimentally determined weight loss factors and the predicted ones,is less than 0.05 % .. Except
mix IIL1[95002,0,the absolute difference between the predicted ; m l nhc: experirnentallly detenniined

weight loss factors for all mixes are less than 0.1 96. This means E q . 8 and 9 pirovide an accurate
estimate of the comblined weight loss factor.
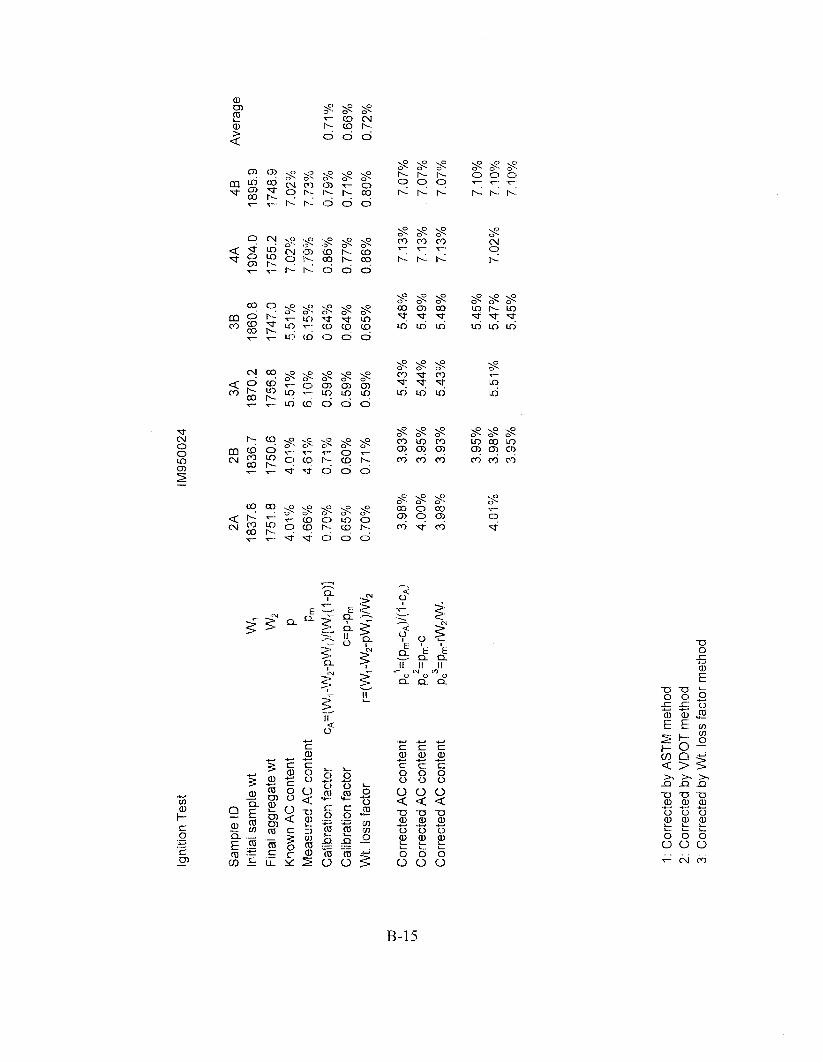
‘l’ables 11 and 12 show the true AC contents amd the ones coirrected using IEq. 7, in which the
experimentally detemlined average loss factor was usled. The conEi(lienceIlevel oF absolute difference
between the true and corrected AC contents, based on the results shown in Tables 1 1 arid 12, is
plotted 1111 Fig. 8, which indicates the accuracy of ignition test is almut 0 .I 1% at a 90% confidence
level, and 0.15% at a 97% confidence level.
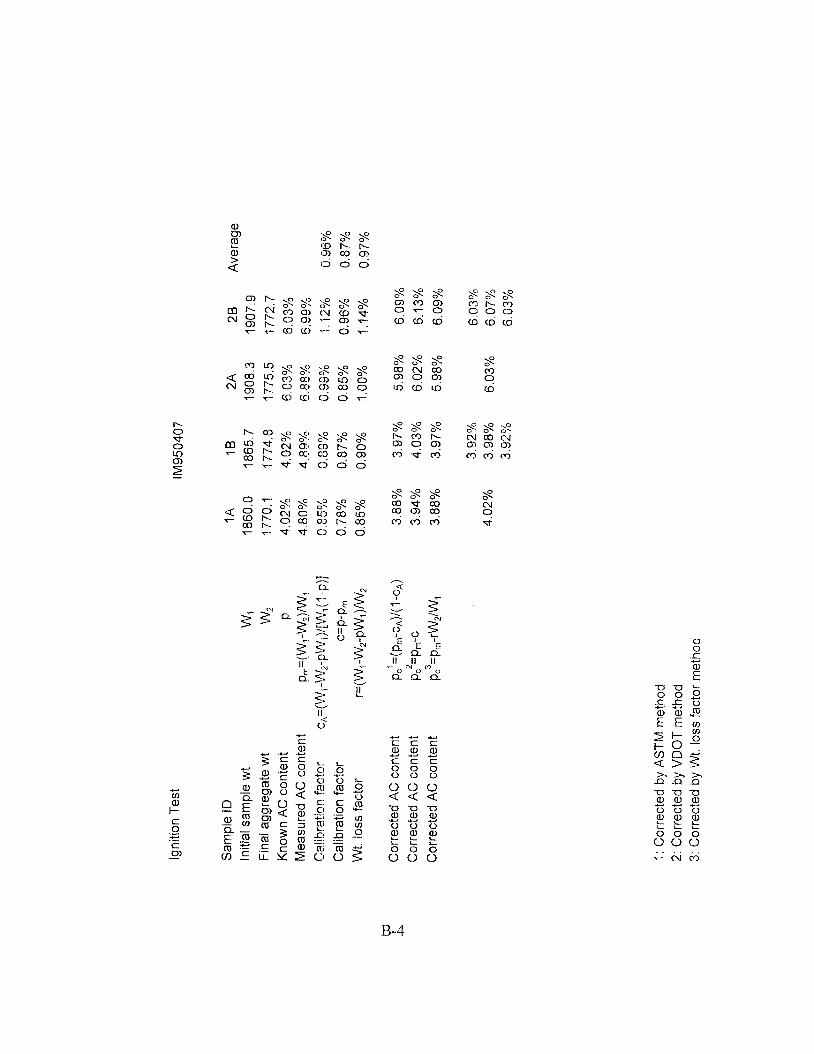
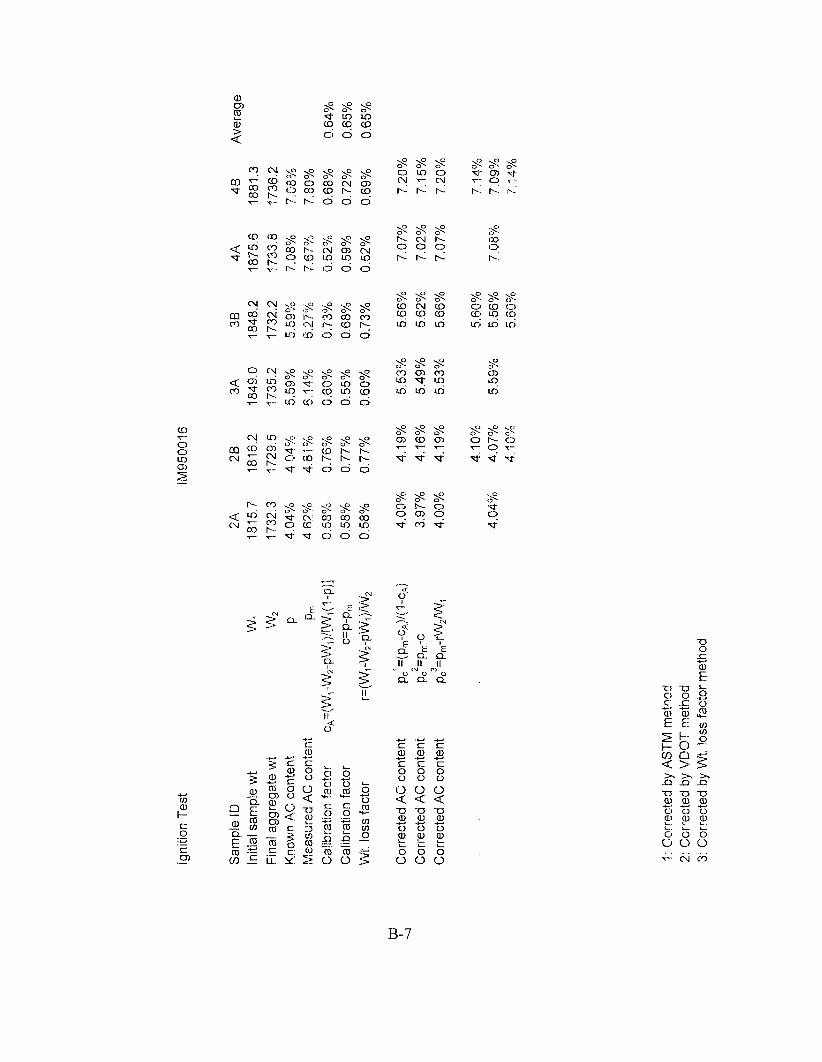
Sample worksheets and suipuit of the sprcadsheet program for estimating the combined
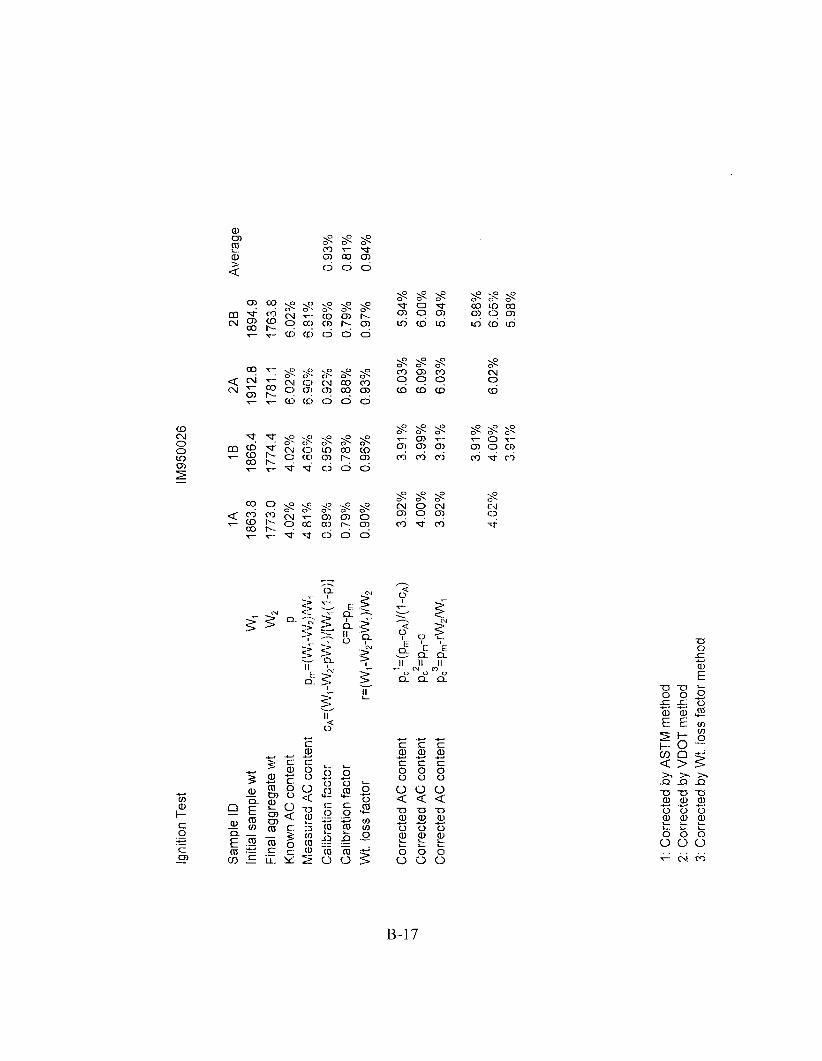
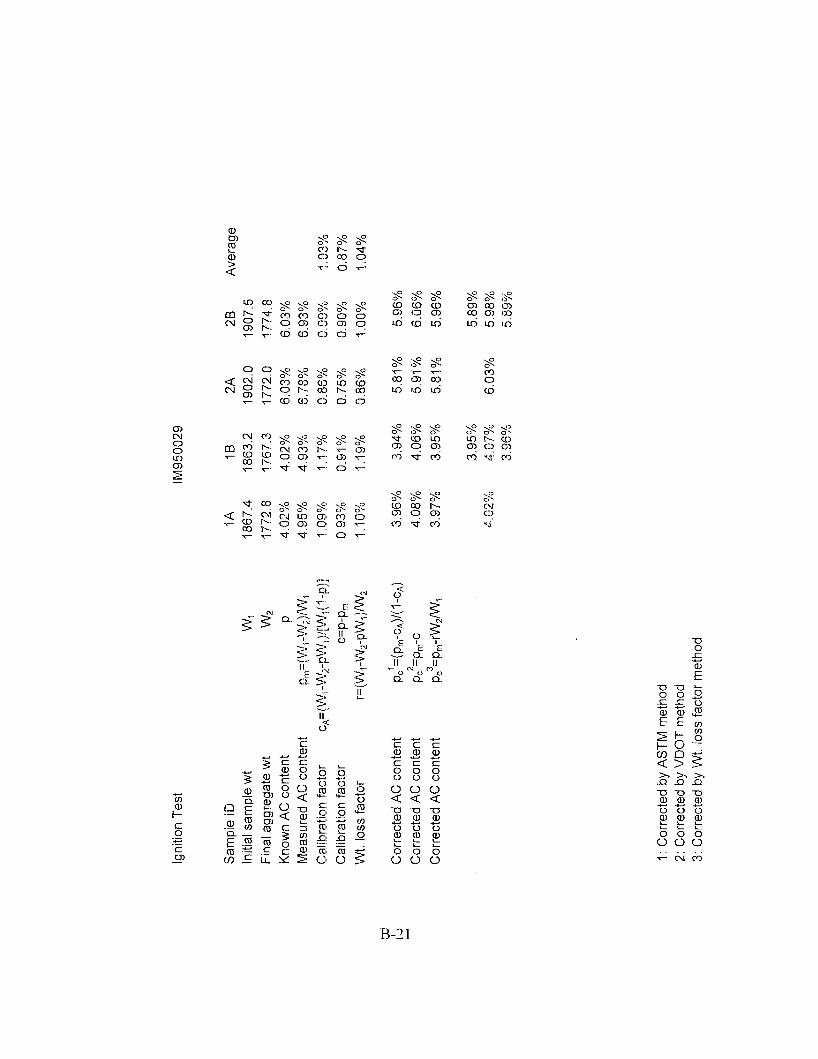
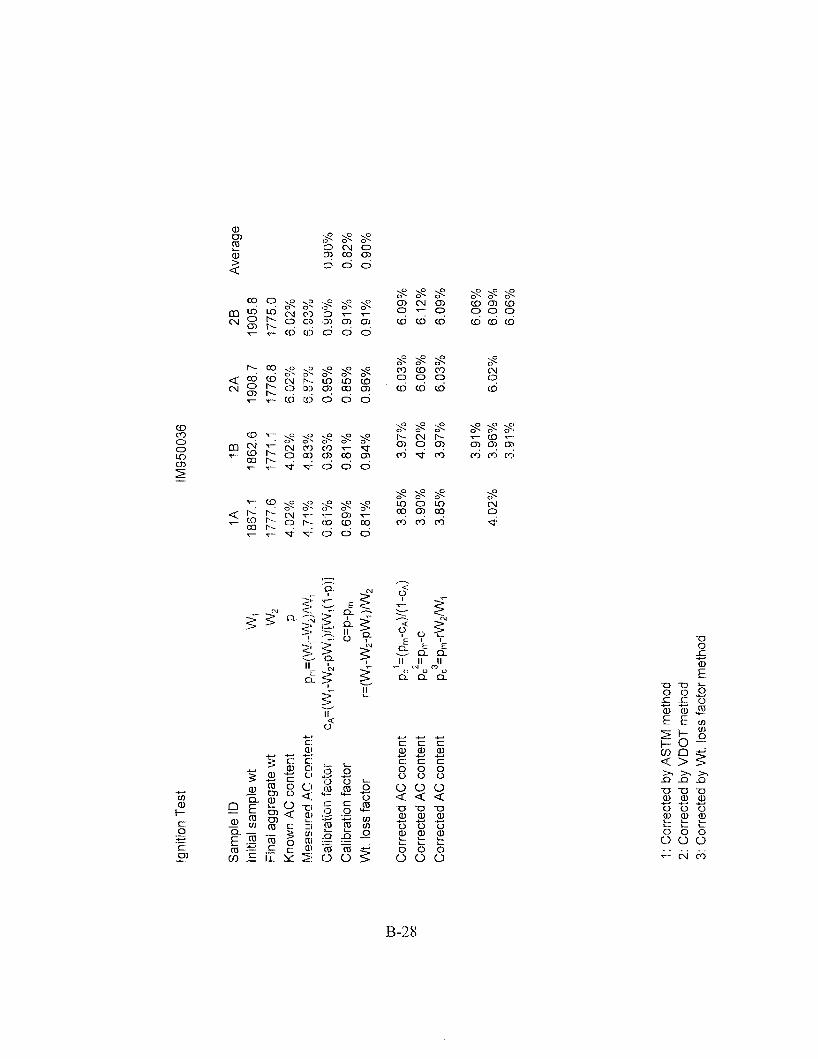
weight loss factor are provided in Appeii’dix A. The complete test and cdnlculation resulls are listed
in Appestdix B, in whiich correction of the measured AC content per A!31’M and VDOT procedures
also are iincludetl.
12

CHAPTER 5
CONCXUSIOWS a 'The ignition method can he used to determine the AC content of both virgin and 1.Wmixes,
the degree of accuracy is about aO.11% ai a 90% confidence Xevd.
Equations 8 and 9 can be used to estimate of the combined ~wcigltitJloss ffackorox' virgin and
RAP imixes to a satisfactory degree of accumcy.
0 Results of this study showed that mixture calibration a1t 538 'C is not equivalent to
aggregate only calibration a1 578 O C . 8 Ignition test does not signifilcantly affect 1he aggregate gradation.
8 Moisture in the sample can Ibe removed in 44)minutes when heated in a Despatch V series
oven iit ]I I O OC (230 9).
RECOMMENDATIOIVS @ Training in the use of"the ignition oven should be ixrcludrxl in the Teclinicd Certification
(:Lasses fior the 1997 constniction season.
o Projects should be designatexi to implement the ignition tesl riicthod in the 1997 construction
season.
0 A datab,ase of aggregate corrc:ction factors be established and start to accumiulate on a
regional and statewide basis.
13

REFERENCES
11
2.
3.
4.
5 .
6 .
7.
Brown, E.R. aind Murphy, E. Asphalt content detemiination by the ignition method.
Nation Center for Asphalt 'Technology, 1994~
Carpentler, S.H.,Mueller, AL. and Stanley, M.B. Asphti conlent determination manual.
:FHWA Publication No. IFFIWA-IP-90-008, 1990.
Brown, E.R. and Mager, S. Asphalt conten2 by ignilion round robin study. :National
Center for Asphalt Techollogy, 1995
Brown, E.R., Murphy NIL, Uu, L. and Mager, S. Yiixtorical devcelopmenr' of asp.halt
content determination by the ignition method. National Cfenterfor Asphalt Technology,
199.5.
Antrim, J.D. md Buschhg, H.W. Asphalt conEent de&?mimtic.mby the ignition method.
Bituminous Materials and Mixes, Highway Research Record, No. 273, 1969.
ASTM Draft No. 2 Standard method of testfor asphukt content cpf hot mh asphalt by the
ignition method. To be approved, 1995.
1Designa.tionVTM102I Virginia test method ifor detemi,ruztioivr of aFphalt content jkom
asphalt paving mixtures by the ignition method. 1995
15

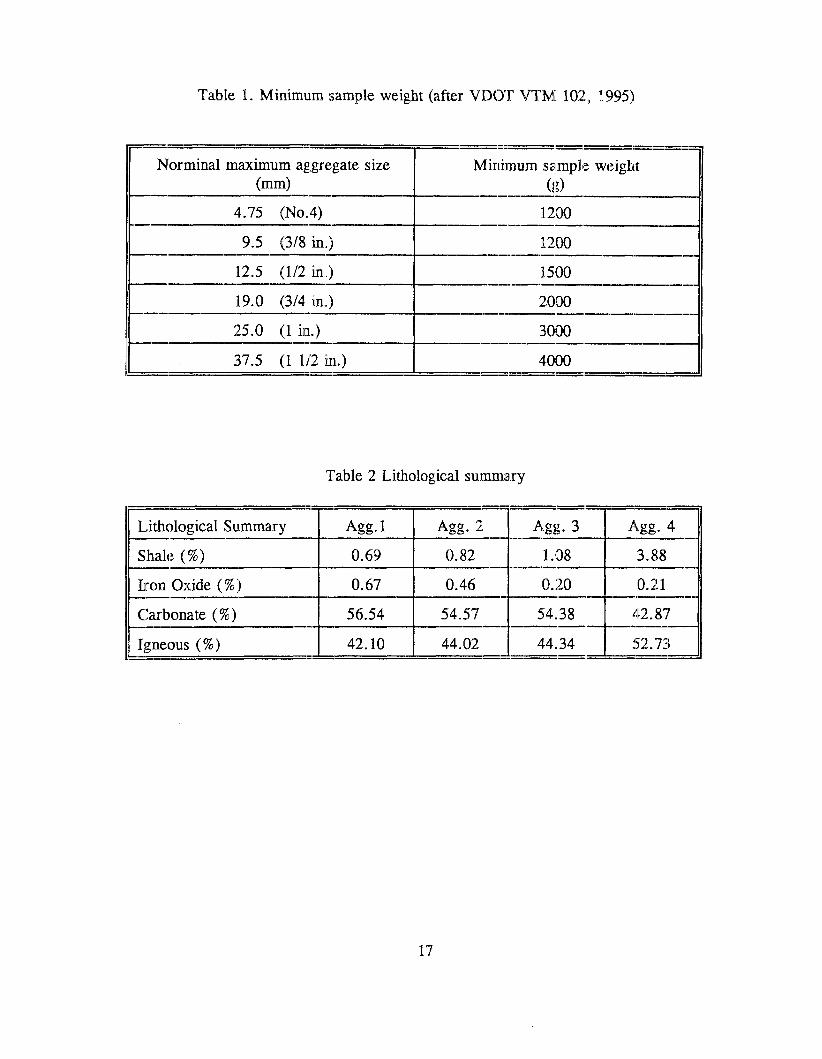
Table 1. Minimum sample weight (after WD(YX' VTM 102, It9951
12.5 (1/2 h,,) I 1500
19.0 (314, h,,) I :2000
Table 2 Lithological summaxy
17

---
.--- ------------
Table 3 Aggregate gradation
Table 4 RAP Gradation
---.--- --.- ---I-------- .--- =il---.----Sieve size (mm) Cumulative perct:nt passing (%)
I I 1a:)
16.0 (5/8") 99 x (XI I 98.15
12.5 (1/2")
18

---
---
---
---
-.-
70 70 AGGi 1 30%
RAP 1 (131R95013)
RA,P2 (BR9.5014)
.-------RAP3
(HR95015)
I--
45%
AGG3 (BA950405)
A G(34 (BA950407)
I-
--.--IM95oO1.4 4.0% x 2 5.5% x 2
t7.0% x 2
IM950018 4.0% x 2 5.5% x 2 7.0% x 2 --.--IM950022 4.0% >( 2 5.5% >< 2 7.0% >( 2
-.--
Table 5 RAP mixes
AGG2 AGG3
IM950015 I M850816 4.0% x 2 5.5% x 2 5 . 5 % x 2 7.0% x 2 7.0% x 2
IM950024 4.0% >< 2 5.5% >c 2 7.0% >( 2
Table 6 Virgin mixes
' 4 % x 2 6% X 2
IM950403 0% x 2 4% X 2 6% x 2

Table 7 Measured asphalt content of RAP, ignition method
Table 8 Weight loss factor Comparison between mixture and aggregate only calibration
20

Table 9 Weight loss factor of virgin mix Comparison between test result and prediction
Table 10 Weight loss factor of lKAP mix Comparison between test result and prediction
Note 011typeface Boldface: measured weight loss factor of individual aggregate Normal: measured weight loss factor of combined ag,gIegateand/or RAP bWr:ncl Unclerline: predicted weight loss factor of conibined aggregate and/or RAP blend

-----
Table 11 CorrectecY asphalt content of virgin mix
55 % 45 %
AGGl (HA.950401)
-----.-AGG2
(BA950403) ----.-
AGG3 (HA950405)
----.-AGG4 IM950407
(HA950407) 4.02 lj.92 6.03 480
Table 12 Correcxed asphalt content of RAP mix
AGG2 (BA9.50403)
IM950015 4.08 4.02 5.63 5.56 4.07 7.12 IMS3iOO 19 4.07 4 2 3 5.57 5.50 7.09 7.10
IM950023 4.m 3.90 5.50 5.49 7-01 7.05.
Note OIL typeface Normal: known asphalt ccmtent. Underline: corrected asphalt. content
22

WAL
W A F
Fig. 1 Decomposition of � M A , sample
23

0.60
0.40
0.20
0.00
0 20 40
Time 4MimA
3.(>8
2.00
I.oo
0.00
0 20 40
Time (WIiin)
Fig. 2 ]Removalof moisture in sample: ,at 110 OC: (230 OF> a. MMA sample, b. aggreg,atesample
24
la
60
60

600
500
400
20 40 60 Time (mirn:)
Fig- 3 Temperature history during ignition test
25

-\ I 00
803
60
40
20
0 -I
0.01
i0.I ‘1
Particle size (rnrn)
Fig.5 Gradation of AGG2 before and after ignition test
27
I

-100s 80
60
40
20
0
-Oriqirial -0% -A- 4%. *6%
.-rTIL 0.01 o,,1 I
Particle size (mm>
-t
I 0 100
Fig.6 Gradation of AGG3 before and after ignition test
28

80
60
40
20i 3 0 C)
0.01 0.1 I 10 II00 Particle size (rnrn)
Fig.7 Gradation of AGG4 before and after jgnitisn test
29

100
80
60
40
20
0
0 0.0!5 0.1 0.15 0.2 AlbsoIute deviatiori (1%)
Fig. 8 Confidence level of corrected asphalt content
30


'Two aggregates and one RAP is available, the gradations are shown below:
Four mixes are produced: mix 1 i s made from Agg. 1 only mix 2 is made from agg. 2 only mix 3 i s made from 45% Agg. 1 and 55 % Agg.2 mix 4 i s made from 70% Agg.1 and 30% RAP
Determine the weight loss factor of all four mixes assuming the design asphalt confent it; 4 % ~
Solution: First calculate the pel-cent retained on each sieve size
Sieve size (mm) I- Percent retained (%) I-------
According to Table 1 in ~e test procedure, the sample size of all mixes is between 1500 to 2000 g. Assuming 1800 g aggregate is needed to make one sarxiple, for each mix, 3600 i; aggregate should be batched to prepare two samples.
A- 1

Batch weight:
Assuming all aggregates have been split into the individual, in the following: W1: batch weight of Agg.1 W,: batch weight of Agg.2 WR:batch weight of RAP
Total weight of aggregate W==3600g (for two samples)
Mix 1: w1=3400
Size (mm) 13a.tch Wt. (8) 16.0 (5/8") 3600 . 1%:=36 12.5 (1/2") 3600 '. 4% =144 9.5 (3/8") 3600 '* '7 % :=252 4.75 (No.4.) 3600 * l 3% ~ 4 6 8 .-4.75 NO.^) 3600 .. '75 %I -2700
Mix 2: w.,:=:3600
Size (m) Batch Wt. (9) 9.S (3/8") 34100 ' 3 % =108 4.75 (No.4) 34100 * 13% =468 '. 4-75 (--NO.4) 341ClO 1 84% =3024.
Size (xnm) Batch Wt. (g) 16.0 ( 5 / 8 " ) 1620 * 1% 16.2 12.5 (1/2") :K6:20-4%=64.8 9.5 (318") 1620,, 7 % =113.4 4.75 (:No.4) :I620~,13% =:21O.4 I. 4.75 (-NO.4) 'X6:20'*75%-1215
Mix 4: W, :=:3600- 70 % ~ ~ 2 5 2 0
Size (mm) Eiatch Wt. (8) 16.0 ( 5 / 8 " ) 25:20 y 1. % =25.2 12.5 (1/2") 2,5:20" 4%=100.8 9.5 (3/8") 25:20 I 7% =1.76.4 4.75 (No.4) 25:20-13%=327.6 - 4.75 (-NO.4) 2x20 " 75%= 1890.0
'W2=:3600.. 55 % :=: 1980
:Batch Wt., (8)
1980 - 3%~ 5 9 . 4 1980-13%=257.4 1980-84%=16613.2
W,=:3600 - 30% =~lO80
BatcXa Wt, (g)
1080 * 33 % =356.4 1080 - 67 % ~ 7 2 3 . 6
A-2

Estimation of fresh asphalt cement needed for each mix:
For Mixes 11, 2, and 3, the annoumt of asphalt needed to bring the mix the 4 percent AG content is
For Mix 4,first two representive RAI’ samples (2000 g each) were txmed to determine the AC content of the RAP, the rt:su;ult is 5.29% (with no correct:ion for aggregate lo!js), the amourit of asphalt in the RAP is
w,, = 10800.0529 = 57.1. g
the total weight of aggregate is
W,, = 3600-5’7.1 = 3542.91 g
the fresh asphalt needed to bring the mix fo 4 percent .AC: content is
Sample preparation:
The aggregate blends were heated in oven at 290-t 10OF for three hours, the asphalt (120/150 Pen grade) was heated to 290-t:2OoF, the mixing bowl antl whip were also heated to about 290 OF before mixing. The acihid aggregate weight of the blertds, the actual amount of asphalt added to each mix, and Ithc actual AC content of each mix art: shown below:
Samples were cured in ovei~iat 290rt_I.OoFfor 45 minutes acotsrdirig to MnDOT Lab Manual D 1805.5. Before being tested, the mixlures in eaclh pan were mixed thoroughly antl split evenly into two samples.

The weight lloss factors determined directly from tests are (see worksheets):
r, =0.96% r2=0.81% r, =0.93 % r4 =o.77 %
Knowing the measured asphalt coiutent of RAP as pR,,,==5.2!9%,the combined weight loss factors of Mixes 3 and 4 can also be estimated using Eqs. 9 and 10.
For Mix 3
For Mix 4
Sumaqy of Result
Note: It was mentioned in the report (pg. 10) that Eq. 10 gives a lower estimate of the true combined weight 10:;s factor. If thc loss of aggregate in the ]RAP is accounted for, the difference between the test result anti estimation will decrease.
A-4

-- ---
Date 12/15/9."j
1 AVERAGE 1
Remarks:
*:.pmcan be taken from the printed ticket, or calculated from (WTWAF)/WT,the latter should be used whenever the value shown on the ticket is questionable.
A-5

-- Operator wz
Date .---- 12/18/93
Remarks:
'Ic: pm can be taken from the printed ticket, or calculated from (W1-WA~)/WT,the llarrer should be used whenever the value shown on I he ticket is questionable.
A-6

1GNI'~~IONTEST WORK SHEET
Operator WZ I_-
Date 12/8/95
----,I-I----.-r--r--- 2
Rerrtarks:
.*: pm can be talcen from the printed ticket, or calculated from (W.rWAF)/WT,the latter should be used whenever the value shown on the ticket i s questionable.
A-7

IGNI"I'IC)1V TEST WORM SHEET
Operator #I-
wz -. Date 11/1/95
I I I
ICorrected asphalt content pc=pxn--rA,,WM/WT 3.95% I 4.21 %I
Remarks:
:+? pmcan be caken from the printed ticket, or calculated from (W,, WA~)/WT,the latter should be used whenever the value shown on ~.htticker is questionable.
A-8

APPENDIX BI
COMPLETE TEST' AND CALCULATION RESlLJILTS


B-l

+.A*-
B-:2
L

p- Igni
tion
Test
iM
9504
05
SaK
ple
iD
Ik
iB
2A
28
A
vera
ge
Initi
al s
ampl
e w
t W
l 18
62.9
18
61.5
18
94.7
18
94.2
Fi
nal a
ggre
gate
wt
W2
1772
.3
1770
.8
1766
.4
1762
.7
Kno
wn
AC
con
tent
?
4.02
%
4.02
%
6.03
%
6.03
%
Mea
sure
d A
C c
onte
nt
pm=(
'W;-.w
2yw
-; 4.
8704
4.
92%
6.
76%
6.
94%
-p
)]C
alib
ratio
n fa
ctor
c,
~,=
(W~
-W~
-~W
~)!
[W~
(? 0
.88!
12 0,
8p/.
0.
73?$
o.97y2
o.gg
%
CaI
ibra
tion
fact
or
C=P-
?, 0.
85%
0.
90%
0.
73%
0.
91%
0.
85%
!
AH
I-
--L
rr
ba
-i=
<:.nv;,
p3v
y, )/y$*
0.89
%
0.90
%
8.80
%
6.98
%
0.89
%V
VL
. iu
aa i
ab
tui
m
-c*j
4.
G2%
4.
07%
5.
93%
6.
11%
k)
Cor
rect
ed A
6 co
nten
t Pc
1'~Pr
n-~,
4Y(1
u
u,I
rr-
A+
cLLe
dAC
csi
itent
p:=
pm-c
4.02
%
4.07
%
5.91
%
6.09
%
Cor
rect
ed A
C c
onte
nt
Pc3=
?,-rW
2W
4.02
%
4.07
%
5.93
%
6.11
%
'I:C
orre
cted
by
AS
TM m
etho
d 2:
Cor
rect
ed b
y V
DO
T m
etho
d 3:
Cor
rect
ed b
y W
t. lo
ss fa
ctor
met
hod
a,m mL
4a,
1:; 0 0
+d
TI
B-4

igni
tion
Test
I M
9500
14
2A
26
3A
3B
4A
4B
A
vera
ge
1845
.2
1792
.8
1853
.5
1854
.6
1875
.0
1865
.8
1758
.2
I704
.0
7 735
.1
1735
.5
1729
.2
1722
.8
4.10
%
4 7O
Yo
5.63
%
5.63
?:
7 06
%
7.06
%
7
?A
n,
-_A,.,
hh
Vn
4.71
76
4.95
%
6.23
%
6 26
%
1.
I ,I
.--
*"
0.64W
Q,82?&
0.62
0h
0,67
$$
p: -
7c
/w
. ii 70
0,65
.y; 0,
:;/;
0.61
%
0.85
%
0.60
%
0.63
%
0.72
%
0.60
%
0.67
%
0.65
%
0.90
%
0.64
%
0.67
%
0.78
%
0.65
%
0.71
%
w
b7
C
orre
cted
AC
con
tent
pc
!=(p
m-c
.A)i( 1
-cb)
4.
04%
4.
27%
5.
56%
5.
59?/
. 7.
1204
7.
01%
Cor
rect
ed A
C c
onte
nt
P:=Prn
-c 4.
05%
4.
28%
5.
56%
5.
59%
7.
11%
7.
00%
C
orre
cted
AC
con
tent
p
c3
=p
,-r~
~~
~~
4.
03%
4.2
7'/0
5.56
%
5.59
%
7.12
%
7.01
%
1: C
orre
cted
by
AS
TM m
etho
d 2:
Cor
rect
ed b
y V
DO
T m
etho
d 3:
Cor
rect
ed b
y W
t. lo
ss fa
ctor
met
hod

B-6
igni
tion
Test
2A
2B
4A
4B
Ave
rage
18
15.7
18
16.2
18
75.6
18
81.3
17
32.3
17
23.5
17
33.8
17
36.2
4.
04?4
4.
04%
7.
%3%
7.
28%
1 n
nn
,4 n
/:n,
4.Eq
:lc
7.67
%
7,g$
?$
2.58
"io
n -?
.ma.,
o,
52.~
/o
D 68
%
0.64
%u.
i D
I0
0.58
%
0.77
%
0.59
%
0.72
%
0.65
%
8.58
%
0.77
%
0.52
%
0.69
%
0.65
%
w C
orre
cted
AC
con
tent
pc
1=(p
m-c
J(1
-cA
) 4.Q
Qoh
4.19
%
5.53
%
5.66
%
7.07
%
7.20
%
Cor
rect
ed A
C c
onte
nt
Pc2=
Prn-
C 3.9
7'YO
4.
16%
5.
49%
5.
62%
7.
02%
7.
15%
C
orre
cted
AC
con
tent
p:=p,-rv
v,.w
~ 4.
00%
4..I9
%
5.53
%
5.66
%
7.07
%
7.20
%
1: C
orre
cted
by
,AST
M m
sthg
n"
2: C
orre
cted
by
VD
OT
me
thd
3:
Cor
rect
ed b
y W
t. lo
ss fa
ctor
met
hod
.L

a,rn $2 $ $!! OD m 03
4a, (I:? (9 (9
c::> 0 0
B-8

Igni
tion
Test
lM
9500
18
2A
2B
3A
3B
4A
4B
Ave
rage
18
10.0
18
27.0
18
60.0
18
62.7
18
94.7
18
83.1
17
23.4
?7
39.8
17
45.1
17
47.0
17
47.9
17
37.4
4.
04%
4.
04%
5.
56?4
5.
56%
7.
09C
h 7.
g90/
e ,-.A",
-a-",
----,
n I
vc
1.[
?y&
4.78
%
4.66
%
6 $
2%
0
.L ! 70
.I .-.
0,
7g%
h:
I "
,u
n C
-coi
0.
89c7;
0.7j
yo
0,70
c/o
3, "c70
V, 7f
ior
.u.u
u 10
0.74
%
0.62
%
0.56
%
0.65
%
0.58
%
Q.6
4?40
0.
63%
0.
78%
8.
37%
0.
66%
0.
69%
0.
71%
0.
70%
0.
72%
w
&
Cor
rect
ed A
C c
onte
nt
pc'=
(pm
-CA,
)/(l
4.10
%
3.97
%
5.44
%
5.53
%
7.01
%
7.97
%
Cor
rect
ed A
@co
nten
t Pc2
=Pm
-C
4.15
%
4.03
Yo
5.49
%
5.58
%
7.04
%
7.10
%
Cor
rect
ed A
C c
onte
nt
pc3=
piii-
rW,/W
1 4.
10%
3.
97%
5.
44%
5.
53%
?.G
AY0
7.07
%
2 : C
orre
cted
by
AS
TM m
etho
d 2:
Cor
rect
ed b
y V
DO
T m
etho
d
3: C
orre
cted
by
Wt.
loss
fact
or m
etho
d

Igni
tion
Test
!M
950C
!?9
Sam
ple
ID
2A
25
3A
38
4A
46
A
vera
ge
Initi
al s
ampl
e w
t W
1 18
36.2
18
26.0
18
57.0
18
60.6
18
98.6
18
77.8
Fi
nal a
ggre
gate
wt
'VV>
1752
.4
1740
.2
1746
.0
1745
.4
1750
.7
1733
.8
f -Y
J /n
/ .~
-l~
:/o
Kno
wn
AC
con
tent
9
4.37
%
4.O?%
5,57
75
5,57
96
7 n
nw
3;
An
n,
11
A
FC
OL
A
C
PO
(.
K n
coL
c m
nn
i -7
i.iL
70
--A,
.,
iijie
esllr
ed .+
.C c
-eni
eni
rm
7.u-,u
?.V
ii I
d
u.a.u
iu
U
.LU
70
i.
D i7
o -
:Cal
ibra
tionfzcio
r-I(
:!
I I
,
i;A
-(vv
i-vv
(.& I,-p
!vy,
,_
-
VI i
4 I -
p)j
o,51
c/o
o,66
c70
0.43
%
0.68
%
0.75
%
0.62
%
0.67
%
Cal
ibra
tion
fact
or
c=P-
Pm
0.48
%
0.61
%
0.39
%
0.63
%
0.63
%
0.52
%
0.54
%
Wt.
loss
fact
or
r=(W
l-W,-p
Wl)N
V2
0.52
%
0.66
%
0.43
%
0.68
%
0.76
%
0.63
%
0.61
%
7
4r
n2 07%
4,1!-jo
/o 5.
38%
5.
63%
I
. 13
.A
7.04
%+y
Cor
rect
ed .A
C co
nten
t pc
;=(p
m-c
,)!(?
-C
AI
V."
,
Cor
rect
ed A
C c
onte
nt
p:=p,-c
4.01
%
4.14
%
5.42
%
5.66
%
7.18
%
7.07
%
Csr
rect
ed A
C c
cnte
nt
p:= 9,-
rW2f
l4
3.97
%
4.10
%
5.38
%
5.63
%
7.16
%
7.04
%
4.03
%
4.07
%
4 07
%
1: C
erre
ctec
! by
AS
TM n
ethc
d
2: C
exec
ted
by V
DG
T m
etho
d 3:
Cor
rect
ed b
y W
t. lo
ss fa
ctor
met
hod
0

Igni
tion
Test
lM
9500
20
2A
2B
3A
44
4B
A
vera
ge
1826
.9
1818
.4
1851
.1
1865
.9
1881
.5
1738
.7
1731
.6
1736
.C
1722
.7
7731
.8
4.05
%
4.05
?4
5.55
0/;
7.
7.7p
,/-
---",
7.84
%n I
4.80
5'0
4.78
%
6.16
%;
.I ._
I
--"~
g.
g1%
.n
7f0
1.
.-. 7
:qw
o,6
2?/;
0,92G
/O
u,(y
y0
ii. i u i
u
'U.
I u 10
0.75
%
0.73
%
0.60%
0.57
%
0.74
%
0.70
%
0.82
%
0.76
%
0.70
%
0.62
%
0.93
%
0.80
%
4.04
%
4 02
'/o 5.
41%
5.
6404
6.
93%
7.
10%
4.
10%
4.
08%
5.
46%
5.
69%
6.
97%
7.
14%
4.
04%
4.
02%
5.
41%
5.
64%
6.
93%
7.
10%
4.03
04
7.02
04
4,n
s;c?
i_
n C
GO
' -
ino
' 7
nr
n
"U
I"
7
.U
d 13
i.
IU/O
I .v
3A
1: C
orre
cted
by
AS
TM m
etho
d
2: C
orre
cted
by
VD
OT
met
hod
3:
Cor
rect
ed b
y W
t. lo
ss fa
ctor
met
hod

u.
4.-u) a,l-

w n
Igni
tion
Test
lM
9500
22
Sam
ple
ID
2A
3A
3B
4A
48
A
vera
ge
Initi
alsa
mpl
e w
t W
1 18
32.5
18
14.9
18
09.5
18
91.9
18
96.0
Fi
nal a
ggre
gate
wt
LV,
1746
.9
1706
.1
1694
,7
1746
.6
1750
.6
7
'-.-r
e,
-^^
^I
I lL
"/aK"
C)W
R A
C c
on?e
r,t
P 4.
0174
5.
52%
5.
52%
!.
L!L
%
5I ."
A
C
4%
e n
nn
i ---
A>
ivie
asllr
ed A
C c
onie
nt
Pm
-7
.V i
ii.U
ii7
0
6.30
%
I .o
u"/o
/.
ijZ"
/O
:Cai
ibra
tion
fact
cr
cA"(!V
?V',
->va
v'2-p
yi?
j;[:v5$t
(j
-p)j
o,69
0io
0.50
%
!!. 87
%
0.71
%
G.7
0%
0.71
%
Cal
ibra
tion
fact
or
c=P-
Pm
0.60
%
0.48
%
0.78
%
0.66
%
0.60
%
0.62
%
Wt.
loss
fact
or
r=(W
,-W2-
pW,)W
2 0.
69%
0.
51%
0.
88%
0.
72%
0.
70%
0.
71%
-C
orre
cted
AC
cnn
!ent
r
c'=(p
m-c
A)/
(l-cA
) 3.
93%
3.
95%
5.
33%
5.
63%
7.
02%
6.
96%
w
Cor
rect
ed A
C c
onte
nt
pc2=
p,-c
3.99
%
4.01
%
5.38
%
5.68
%
7.06
%
7.00
%
Cor
rect
ed A
C c
mtm
t p;=
prn-
rW2!
?~i!,,
3.
93%
3.
95%
5.
33%
5.
63%
7.
02%
6.
96%
4.01
%
7.02
%
!: C
orre
c!ed
by
AST,
h?lm
eths
c!
2: C
crre
cted
by
L/D
OT
met
hod
3: C
orre
cted
by
Wt.
loss
fact
or m
etho
d

Igni
tion
Test
lM
9500
23
Sam
pie
iD
2A
28
3A
3B
4
A
48
A
vera
ge
initi
ai s
ampl
e w
t W
I 18
38.9
18
30.9
18
69.3
18
68.5
18
89.2
18
67.4
Fi
nai a
ggre
gate
wi
vv*
i755
.2
1747
.7
1757
.5
1753
.6
1745
.8
1726
.0
Kno
wn
AC c
onte
nt
P 4.
00%
4.
00%
5.
50%
5.
50%
7.
01%
7.
01%
FA
easu
rerl
,AC
con
tent
P
rn
4.48
%
4.48
%
5.95
%
6.16
%
7.65
%
7.56
%
Calib
ratio
n f&
n r
'7A=
(\?v:
-\=~,
-p\;/
\/:!/[
?/v:(I-p
)j 0.5
7O/c
0.53
%
0.51
?/.
0.72
0/r
0,62
04
Q.6
py2
g,C
g%
Cal
ibra
tion
fact
or
c=P-
Prn
0.48
%
0.48
%
0.45
%
0.66
%
0.64
%
0.55
%
0.54
%
Wt.
loss
fact
or
r=(W
,-W,-p
W,
jlw,
G.5
8%
0.57
%
0.51
%
0.73
%
0.63
%
0.61
%
0.60
%
w r-rrrrr.rrir.~
r P
rrr.l..irrl..i
w
bW
I IG
LL
CU
Ab
LW
l ll
Gl IL
Pc
'=clPm
-%:i:i:
-c.A'i
3.
9C;%
3.
90%
5.
38%
5.
59%
7.
G9%
7.
00%
c
rn
P
Cor
rect
ed A
C c
onte
nt
p L
p -c
3.
94%
3.
94%
5.
41%
5.
62%
7.
11%
7.
02%
C
orre
cted
AC
con
tent
pc
3=pr
n-rW
2n/v
! 3.
90%
3.
90%
5.
38%
5.
59%
7.
09%
7.
00%
2: C
orre
cted
by
AS
TM m
etho
d 2:
Cor
rect
ed b
y V
DQ
T m
etho
d
3: C
orre
cted
by
Wt.
loss
fact
or m
etho
d

>!? $ $ ';f 0 LO CI? '4 '4 c:> 0 0
w I - - .,--b- r. d o o
>> x x a a n
B-16
Ave
rage
0.81
%
0.94
%
.o,.s
3c70
5.94
%
6.00
%
5.94
%
~,.
~6
";
1894
.9
1763
.8
6.02
?/.
6.8?
:%
0.79
%
0.97
%
2B
6.09
%
6.03
%
6.03
%
2A
2781
.1
6.02
%
,.,.A",
Q.y
.1L'"
0,s-
p7;
0.88
%
0.96
%
0.93
%
1912
.8
3.91%0
3.91
%
3.99
%
lM95
0026
1866
.4
1774
.4
0,.g5
yo
0.78
%
4.02
%
1
nn
n,
u.nl
_l:/:
1B
3.92
Oh
4.00
%
3.92
%
1863
.8
1773
.0
4.02
06
C.8S
"i0
0.79
%
0.90
%
4 a<.
/:,
1A
1: C
orre
cted
by
AS
TM m
etho
d 2:
Cor
rect
ed b
y V
DQ
T m
etho
d 3:
Cor
rect
ed b
y W
t. io
ss fa
ctor
met
hod
igni
tion
Test

0 u)
E
B-18

e WKn
a,
2
h
B-19

a, F a
a,k
h >> x a o n CI V, a,I-
B-20
Igni
tion
Test
lM
9500
29
1B
2A
2B
Ave
rage
18
63.2
19
02.0
19
07.5
17
67.3
q7
72.0
17
74.e
4.
02%
6.
03%
6,
03%
n
07
0L
c n
qo
/7
.""
IU
6.
78%
u
.aJ
/o
1.:7:/
$ 0.
86%
fi "GO/-.
7.23
%V
."
"
iu
0.91
%
0.75
%
0.90
%
0.87
%
'1.4
9%
0.86
%
i.OO
%
I .W
YO
Cor
rect
ed A
C c
onte
nt
Pcl
=(P
m-C
Ail(
l-CA
I 3.
96Yo
3.
94%
5.
81%
5.
96%
C
orre
cted
AC
con
tent
p:=
pm-c
4.08
%
4.06
%
5.9
i%
6.06
%
Cor
rect
ed A
C c
onte
nt
pc3=
p,,-rW
2NvI
3.97
%
3,95
0/0
5.8?
0/0
5.96
%
1' C
orre
cted
by
AS
TM m
etho
d 2.
Cor
rect
ed b
y V
DO
T m
etho
d 3:
Cor
rect
ed b
y W
t. lo
ss fa
ctor
met
hod

a,cn ?! e,k
i... IIJt:
C.II:

W CT)
F a,k 6 0 0
c. cnW I-
B-23

c: : j o o
N 0 0 0
c ln
P S .-0 .-c I= a-
B-24

a,0)
9 a,
k
m p70 0 In m E
.:< Cli
B-25

dm 0 0 m 0-3
5
N5 IS u 0
I.- II3:
13-26

a,m 2! a,2
C!
>\ >. x n n n
B-27
V,
~,
Igni
tion
Test
1.4
18
2B
A
vera
ge
1867
.1
1862
.6
1905
.8
1777
.6
1771
.; 17
75.0
4.
02Yo
4.
02%
&
9y
0
A
g?O
ii,
c n
2w
. l
i4.
7?%
?
.-i
."..a
.2I"
-^^^..
0.6'icy
o u ,.yJ"i0
,y u
0,g0
y9
0.69
%
0.81
?Lo
0.91
%
0.82
%
0.81
%
0.94
%
0.91
%
0.90
%
2 El
KO/!!
".U
U ,"
2 07%
6.03
%
S.Q
9%
3.90
%
4.02
%
6.06
%
6.12
%
3.85
%
3.97
%
6.03
%
6.09
%
3.91
Oh 6.
0604
4.02
%
nn
3.~
6%
6.
02%
6.
09%
1: S
xect
ed
by
AS
TM ,
reth
~d
2:
Cor
rect
ed by
; \'D
OT
met
hod
3: C
orre
cted
by
Wt.
loss
fact
or m
etho
d


., . . i:


