Katsushi Ikeuchi Determining a Depth Carnegie-Mcllon University Department of Computer Science Pittsburgh. Pennsylvania 152 13 Map Using a Dual Photometric Stereo I I Abstract 1. Introduction Vision is one of the most important subsystems of an intelligent robot. Without vision, a robot can repeat only one predetermined job sequence where objects are espectcd to be at predetermined places. Moreover, slight disturbances can cause unpredictable circum- stances in the robot environment which might prevent the robot from continuing its job scquence. Such a robot system lacks flcxibility and robustness. The lntcrnational Journal of Robotics Rescarch, Vol. 6. No. I. Spring 1987. “i 1YK7 hlassachusstts Institute of Technology. Robot vision has been explored from various direc- tions. including the binocular stereo method. the shape-from-shading method, the shape-from-texture method, and the shape-from-line-drawings method (Brady 1981). We have focused on the binocular stereo method and the photometric stereo method (part of the shape-from-shading method) because these methods can obtain the depth information robustly. The binocular stereo method has been explored since the early days of robot vision research. because binocular stereo plays an important role in the human visual system. This area has been esplored by Marr and Poggio ( 1979); Moravec ( 1979): Baker ( 198 1 ): Grimson ( 198 1): Barnard and Fishler ( 1981): Nishi- hara (1 984); Thorpe (1984): and Ohta and Kanade (1985). UinoLdrir sliwo tri~~11iocIs are divided into tivo classes: one uses brightness correlation, and the other is based on feature matching. Thc f~riglr~ti~~.s.~ c~)rrc!(i- lion rw//iods divide thc left and the right imagcs into small windows and compare the brightness distribu- tion in a window of the right image \\.ith distributions over candidate windows of the left image. The windolv pair with the highest correlation is declared to be a corrcsponding pair, and the horizontal difference bc- tween thc windows gives the depth valuc. This correla- tion method is suitable for hardwarc implementation. It has, howevcr. the following two defects: I. 2. If a window contains an occluding boundary. the apparent brightness distribution depends heavily on the viewer dircction. Thus. it is difficult to determine a good match for such a window. Depth values can be measured only at the center of the windows. In order to have robust matching, a larger window size is better. On the other hand, if the window sizc is large. sampling of the image is coarse. Thc./iwitrr-e tna/c*/iirig rtic>ilrod searches for correspond- ing features in the left and the right images and re- Ikciiclii 15
Transcript
Katsushi Ikeuchi Determining a Depth Carnegie-Mcllon University Department of Computer Science
Pittsburgh. Pennsylvania 152 13 Map Using a Dual Photometric Stereo
I I
Abstract
1. Introduction
Vision is one of the most important subsystems of an intelligent robot. Without vision, a robot can repeat only one predetermined job sequence where objects are espectcd to be at predetermined places. Moreover, slight disturbances can cause unpredictable circum- stances in the robot environment which might prevent the robot from continuing its job scquence. Such a robot system lacks flcxibility and robustness.
The lntcrnational Journal of Robotics Rescarch, Vol. 6. No. I . Spring 1987. “i 1YK7 hlassachusstts Institute of Technology.
Robot vision has been explored from various direc- tions. including the binocular stereo method. the shape-from-shading method, the shape-from-texture method, and the shape-from-line-drawings method (Brady 1981). We have focused on the binocular stereo method and the photometric stereo method (part of the shape-from-shading method) because these methods can obtain the depth information robustly.
The binocular stereo method has been explored since the early days of robot vision research. because binocular stereo plays an important role in the human visual system. This area has been esplored by Marr and Poggio ( 1979); Moravec ( 1979): Baker ( 198 1 ): Grimson ( 198 1): Barnard and Fishler ( 1981): Nishi- hara ( 1 984); Thorpe (1984): and Ohta and Kanade (1985).
UinoLdrir s l i w o t r i ~ ~ 1 1 i o c I s are divided into tivo classes: one uses brightness correlation, and the other is based on feature matching. Thc f ~ r i g l r ~ t i ~ ~ . s . ~ c~)rrc!(i- lion rw//iods divide thc left and the right imagcs into small windows and compare the brightness distribu- tion in a window of the right image \\.ith distributions over candidate windows of the left image. The windolv pair with the highest correlation is declared to be a corrcsponding pair, and the horizontal difference bc- tween thc windows gives the depth valuc. This correla- tion method is suitable for hardwarc implementation. It has, howevcr. the following two defects:
I .
2.
I f a window contains an occluding boundary. the apparent brightness distribution depends heavily on the viewer dircction. Thus. it is difficult to determine a good match for such a window. Depth values can be measured only at the center of the windows. In order to have robust matching, a larger window size is better. On the other hand, if the window sizc is large. sampling of the image is coarse.
Thc./iwitrr-e tna/c*/iirig rtic>ilrod searches for correspond- ing features in the left and the right images and re-
Ikciiclii 15
quires that feature points be extracted before match- ing. Depth information can be determined directly only at places where feature points exist. Many kinds of operators for extracting features have been pro- posed, including the so-called interest operator (Mora- vec 1979), the DOG filter (Marr and Hildreth 1980), and the Roberts operator (Roberts 1965). Since depth information can be determined only at feature points, it is desirable to have many such points. In this sense, the output of the DOG filter and the output of the Sobel operator are better than the output of the interest operator because output is produced by the DOG filter or by the Sobel in many more places in the images than by the interest operator. On the other hand. since the number of feature points is increased, i t takes more time to compare all the candidate fea- tures. Thus, from the point of view of matching com- plesity. the output of the interest operator is better than the output of the DOG filter or the Sobel operator.
Although the binocular stereo method is robust and \yell esplored. i t takes a long time to compute depth with this method. Also the binocular stereo method determines depth only at the place where matching features are obtained; it requires an interpolation to get a continuous depth map. The photometric stereo method bypasses these problems. A phoIoi?wlric .slcrrlo ~??c~ihod determines surface orientations from three images of the same scene from the same point under three different light conditions (Horn, Woodham, and Silver 1978: Woodham 1970; lkcuchi I98 I ; Ikeuchi, et al. 1986). Since the spatial configuration between the T V camera and the object is the same for all three images. there is no disparity between the images. Therefore. no matching operations are needed and surface orientation can be determined very rapidly. Also the photometric stereo systeni can determine surface orientation at each pixel and can compute a dense surface-orientation map. Unfortunately, how- ever. the photometric stereo system cannot produce an absolute depth.
This paper proposes a method to determine an ab- solute depth map based on the binocular use of two photometric stereo systems. A pair of surface-orienta- tion maps can be determined by a dual photometric stereo. The surface-orientation maps obtained are segmented into isolated regions of the constant surface orientations using a geodesic dome. Comparing the
left regions with the right regions gives pairs of corre- sponding regions. Matching depends on the size of the regions, average surfiice orientations. and mass-center positions of the regions. Finally. differences in mass- center positions of corresponding regions give the depths of the regions.
This system has the following features:
1. Since the features for the matching operations are the mass centers of regions, the number of matching operations is small. Thus. the sptem can determine a depth map rapidly.
2. Since the distributions of the surface orienta- tions within each region are known from the surface-orientation map, we can convert the discrete depth information at the mass-center positions into a continuous depth map over the image using a simple integration operation.
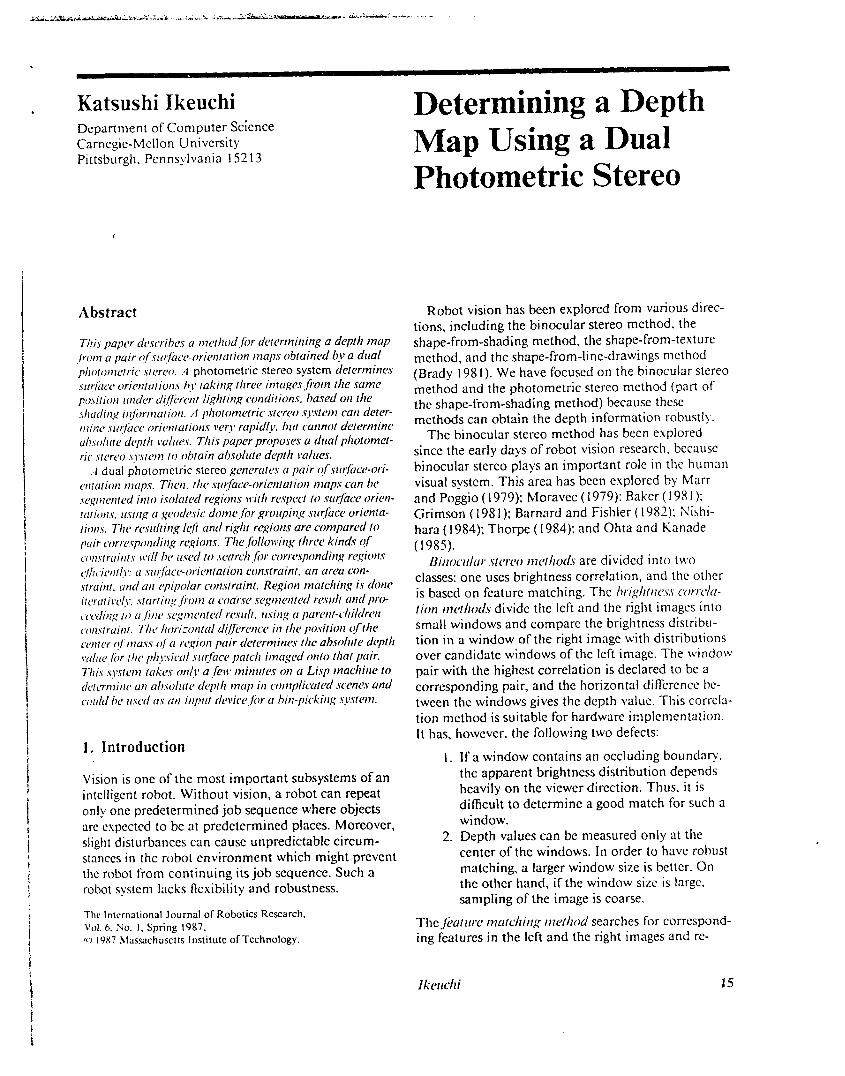
Figure I shows the setup of our dual photometric stereo. A pair of TV cameras is surrounded by three light sources. The left T V camera's image plane is parallel to the ground plane and the right TV camera's image plane is inclined so that the optical axes of the T V cameras intersect at the origin of t h e spatial coor- dinate system, where the spatial origin is under the left T V camera. The objects are located ncar the spatial origin.
2. Segmentation on Surface Orientations
Segmentation is necessary for our stereo system, but segmentations of images based on brightness values are not suitable for our region-based stereo system for the following reasons:
1. Since the brightness value of a pixel depends on the viewer direction, a brightness value at a pixel in the left image is usually different from a brightness value at the corresponding pixel in the right image. The difference between two observing directions causes the difference be- tween two brightness values at the correspond- ing pixels. Thus, a region obtained using brightness segmentation in the left image does not usually overlap with the corresponding region in the right image.
2. It is impossible to have two T V cameras with identical characteristics. A gray value observed always depends on the characteristics of the T V camera. Thus, it makes little sense to com- pare absolute values observed by the one cam- era with absolute values observed by another camera. For example, a region in the left image based on an absolute threshold will be different from a region in the right image, even though the two regions correspond roughly to the same physical surface patch, and the threshold value used is the same.
Thc above two dcfccts of brightness-based segmen- tation occur because observed brightness is not a characteristic of an object surface but is a measure depending on both the viewer direction and the char- acteristics of the observing system. Thus, even though a pair of pixels in the left and the right images corre- sponds to the same physical point on an object, they may not have the same brightness values. Therefore, brightness-based segmentation is not a suitable basis for the binocular stereo.
We propose instead to segment an image into re- gions based on intrinsic characteristics of object sur- faces. lntrinsic characteristics, such as surface onenta- tions. are properties of the object surface itself (Barrow and Tenenbaum 1978). Intrinsic characteristics are independent of both the viewer direction and charac- teristics of the observing system. We should estimate
the same value of intrinsic characteristics, provided that the pair of observing pixels on the left and right images correspond to the same physical point. A seg- mentation method based on an intrinsic characteristic is stable and has high reliability.
Images are segmented into isolated regions based on surface orientations. There are several kinds of intrin- sic characteristics, such as surface orientation, albedo, and color. Surface orientation is the most easily ob- tained among the intrinsic characteristics. We propose to segment images into isolated regions based on sur- face orientations obtained by the photometric stereo method for our region-based stereo. The segmentation consists of three steps: ( I ) segmentation based on shadows, (2) segmentation based on orientation dis- continuities, and ( 3 ) segmentation based on orienta- tion classification.
2. I. S H A D O W S (COARSE SEGMENTA-TION)
Self-shadows, projected shadows. and mutual illumi- nation disable the photometric stereo system in places around objects:
Projecfcd sjiudowp A 3-D object projects shadows onto other objects
below it. The photometric stereo system cannot determine surface orientations in the projected shadow regions of any one of the three lights. Since our three light sourccs are arranged in a triangle, undetectable regions due to the pro- jected shadows exist entirely around the upper object.
SdJIshudow The photometric stereo system also cannot deter-
mine surface orientations of steep surface re- gions. Steep surface areas are self-shadowed. In any place where any one of the three light sources casts a self-shadow, the system cannot determine surface orientations. Self-shadow often occur near the object boundaries. The limiting angle of detectable surface orientation can be controlled. A photometric stereo uses a 3-D lookup table to convert a triple of bright- ness values into surface orientation. I f we blank out entries of the lookup steeper than some
limiting angle. the system cannot determine surface orientations steeper than the limit angle. Since steep areas exist near the object bounda- ries. then the system cannot determine surface orientations near the object boundaries.
,2lflrlral i l l l l H l i l l ( t l l 0 l l
Mutual illumination occurs due to the light re- flected by a near object. This indirect illumina- tion changes the lighting condition at the re- gion. The brightness triple obtained has no surface orientation at the corresponding entry of the 3-D lookup table, because the triple does not occur under the usual lighting conditions. The photometric stereo system cannot deter- mine surface orientation of mutually illumi- nated surface regions. This mutual illumination occurs at the peripheral area of an object, which is a convenient characteristic for segmen- tation.
A surface-orientation niap obtained by a photometric stereo system can be easily segmented into isolated regions corresponding to objects using the disabled re- gions around objects. Consider the following binary image. Each pixel is a 1 if the surface orientation can be determined at the pixel. Each pixel is a 0 if the surface orientation cannot be determined at that pixel. Regions of 1’s correspond to object regions, and re- gions of o’s correspond to disabled regions in thc scene. Thus. we can easily segment the map into isolated object rcgions to check the conncctcdness of regions of I ‘s.
7.1.
otherwise be a connected region into two divided re- gions.
Orientation discontinuity may be measured by the following formula:
where ( J g) denotes a surface orientation using the stereographic plane a n d j i is a partial derivative of./ with respect to the x direction of the image plane and so on. Regions where s is larger than some threshold are considered to be places of orientation discontinuity.
2.3 . ORIENTATION CLASSIFICATION (FINE S E G M E N T A l i O N )
A finer segmentation is necessary for more precise depth maps. Our stereo system can determine depth values at the mass centers of regions. Determining depth values inside an object requires finer regions. Thus, a finer segmentation is necessary to extract liner candidate regions.
A tessellated sphere may divide surFxe oricntations into classes. Since surface orientation has two degrees of freedom, surface orientation can be represented by a point on the Gaussian sphere. We can divide the Gaussian sphere into cells using a tessellated sphere. A surface orientation can be assigned to a class. based on the cell that contains the point corresponding to the surface orientation.
A labelling operation can be applied to the ccll- number map, after a surface orientation niap is con- verted into a cell-number map. Each pixel of an image has a cell number on a tessellated sphere correspond- ing to the surface orientation there. Then, a labelling operation is applied to the cell-number map to extract
ORIENTATION DISCONTINUITY (COARSE SEGMENTATION)
Orientation discontinuities arc also used for more stable segmentation. If two objects overlap each other and surface orientations are determined near the oc- cluding boundaries (usually surface orientations can- not be determined there due to self-shadowing or a projcctcd shadow). surface orientations are not contin- uous over the occluding boundaries. It rarely occurs that t\vo o\wlapping objects have the same surface orientation on both sides of an occluding boundary. Thus. the orientation discontinuity divides what might
connected regions. Each isolated region consists of surface patches having the same cell number.
A geodesic dome will be used for tcsselating a sphere. A geodesic dome is obtained by projecting edges of a polyhedron to the surface of the circum- scribing sphere with respect to the center. For example. a geodesic dome having 12 cells is obtained from a dodecahedron. Regular tessellation methods on the sphere only exist for 4, 6, 8, 12, 20 divisions, because tetrahedra, hexahedra, octahedra, dodecahedra. icosa-
hedra are the only regular polyhedra. Finer tessella- tions are obtained by division of the regular tessellation into smaller triangles (Wenninger 1979). We will use geodesic domes obtained by division of a dodecahedral geodesic dome for finer segmentation.
done hicrarchically. At the first stage, regions obtained by coarse segmentation using shadows and orientation discontinuity regions are divided into subregions using a dodecahedral geodesic dome. Figure 2A shows a hyperbolic surface and an elliptic surface. Figure 2B shows a needle map of a hyperbolic surface and a needle map of an elliptic surface. Figure 2C shows the segmcntcd result using a dodecahedral geodesic dome. Each pixel on a connected region has the same cell number over the region. The resulting region map is again divided using a one-frequency, dodecahedral, geodesic dome. (See Fig. 2D.) This refining operation is applied iteratively using a higher geodesic dome until the necessary resolution is achieved. Fig. 2E gives the segmented result using a two-frequency, dodecahe- dral. geodesic dome.
There may bc accidental errors due to mutual illu- mination or shadows, causing incorrect surface orien- tations at that area. but this does not cause errors in matching regions. This error does not occur randomly on the left and right needle maps, but occurs in the same way on the maps. because both maps are ob- tained under the same light source conditions. Note that the two T V cameras share the common light sources in Fig. I . Thus. that area will be segmented in the same way in both the left and right images. This will give the correct matching at the area. even though the surface orientations obtained there are not correct.
This finer segmentation using geodesic domes is
far compared with the size of the TV camera's field of view. we will use the orthographic projection instead of the perspective projection as the camera model. Disparity between images is due only to the angle be- tween two image planes. For example. the images of a physical point at the spatial origin have the same coor- dinates in the left and the right image planes. If the point moves towards the viewer. the image of the point on the left image plane keeps the same position while the right image of the point moves to the left on the right image plane, This gives the disparity with this orthographic projection.
For the left TV camera
where f'is a conversion constant from the spatial co- ordinate into the left camera coordinate; (x, j-) is the spatial coordinate system; (d, o l ) is the left camera coordinate system whose origin exists at the center of the camera plane; and e"/, cL'/are error terms (see Fig. 3 ) .
The right T V camera gives
where a, b are trigonometric constants determined from the angle between two image planes and c"'. P''
arc error terms. Thus, the relationship between image coordinates
and depth : is
.: = a'ti' + britr + c'. (4)
where 3. Camera Model (Orthographic Projection)
A camera model is necessary to convert a disparity value between two images into a depth value. Figure 3 shows our camera configuration. The left image plane is perpendicular to the spatial z axis, while the right image plane is inclined with respect to the z axis, so that the two optical axes intersect with each other at the origin of the spatial coordinate systcrn. Ortho- graphic projection is used as the camera model. Since thc distance between the T V camera and the object is
a' = -a/( f'b), b' = l/(f'b), c' = ((e"'a)/f') - (c"'/f')/b.
The constants a', b', c' may be determined by means of a calibration. Note that the two optical axes of the two T V cameras intersect with each other at the origin of the spatial coordinates.
This camera model is used for two purposes. First. it converts a disparity value into a depth value. A hori-
Fig. 2. Segtnetilalion IiypcrSolic siriface and a &>sic doinc. D. S q y i a i t d iising N ~~c.o~/r~~qirctic~,, do- schema. ..i. A Iryperbolic sirr/acc atid an elliplic sirr- face. B. A needle inap of a
nccdk tnap of an elliptic siir- juce. C. Scgtnenlcd rcsiill iising a dodecahedral, gee
rmilt usiiig a onc-Jkpency, dodecahedral, gcwdosic dorne. E. Seginetited result
clcdrcdral. gcodL>sic c h i n e .
A
B
20
C
The International Journal oJRobotic.7 Rcseurch
D
E
zontal difference in a region's mass-center positions gives a disparity value. This disparity value can be converted into a depth value-using the camera model. Second, it constrains the possible area within which a candidate match can exist. Under this orthographic projection, two corresponding regions have the same y coordinate values in the left and right images. This constraint is the epipolar-line constraint (Barnard and Fishler 1982).
4. Region Matching
Matching of regions depends on characteristics of the regions. Since corresponding regions in images are projections of the same physical surface patch. corre- sponding regions have similar physical characteristics. Our system uses the following three characteristics to constrain possible candidate pairs: vertical mass-center
Ikeuchi 21
Y
t
Ur
positions, average surface-orientation directions, and area.
The matching operation also follows the coarse-to- fine strategy. At first, coarse-segmented regions, which have been obtained using the smoothness filter, are matched. Then, fine segmented regions using a geo- desic dome are matched, based on the result of the coarse matching. The coarse-segmented result gives the disparity limits for the fine-segmented regions.
4.1. CONSTRAINTS ON REGION MATCHING
The following four constraints are used to reduce the search space for matching efficiency: ( I ) surface orien- tation constraint, (2) area constraint, (3) epipolar-line constraint, and (4) parent-children constraint. The first three constraints reduce the search space between the left and right regions, and the fourth constraint reduces the search space in the coarse-to-fine direction.
Siiifucc. orientution construin1 If a region in the left image corresponds to a re-
gion in the right image, then the average surface orientation of the region in the left image should be similar to the average surface orienta- tion of the region in the right image. Note that this criterion is based on the global coordinate system. Namely, each surface orientation in an image coordinate system is converted into the
surface orientation in the global coordinate system. This is possible because our camera model is the orthographic projection.
Areu construint I f two regions correspond to each other, the two
regions should have similar areas. Again this criterion is based on the global coordinate sys- tem. Since we know the average surface orien- tation of the region, we can convert the area size on the image plane into the area size on the plane perpendicular to the average surface on- entation. This converted area size is indepen- dent of the local coordinate system. The result- ing area size will be used for comparison.
Epipolur-line constraint Our camera model projects a physical point onto
the left and right image planes so that js coordi- nates of the two corresponding image pixels are the same. Thus, the corresponding mass-centers should have the same 1' coordinate in the image planes. Usually segmentation results and cam- era positions contain noise. Thus , the corre- sponding mass centers do not always have the same y coordinate. However, they have nearly the same JJ coordinate. The search process searches the corresponding mass center around the y coordinate within some limits.
Purenl-children construint Regions are divided into finer subregions as we go
along. We will call a region the parent rc>gion and the subregions the children rc>gioiis. If a left parent region and a right parent region corre- spond to each other, a left child region from the left parent region should correspond to one of the right children regions from the right parent region: that is, a subregion's search area for matching is limited to the subregions of the parent's partner.
4.2. MATCHING OPERATION
Roughly speaking, the matching operation compares left and right region lists using ( I ) oricntution ( v n - slruinl, ( 2 ) ureu (*on.y(ruitil, ( 3 ) ~~~) i~~o l ( i i . - l i t i (~ construint. First, left region lists and right region lists are gener-
ated so that each list consists of regions having a com- mon surface orientation (common cell number on the geodesic dome). Second, list pairs between left lists and right lists are generated so that each list pair has left and right lists whose regions have the same surface orientation (common cell number on the geodesic dome). Third. a matching algorithm establishes a re- gion pair among regions in a list pair so that the left region and the right region of the region pair have the similar area size and position of mass-center.
This matching algorithm follows the coarse-to-fine strategy. At the coarsest stage, region matches will be established between the left and the right region maps using the smoothness filter. Then, region matches will be refined between the left and the right region maps by a dodecahedral geodesic dome using a parent-chi/- dren con st ruin^. These region matches will be refined iteratively between region maps obtained by a one-fre- quency. dodecahedral. geodesic dome; by region maps obtained by a two-frequency, dodecahedral, geodesic dome: and so on , unt i l the desired accuracy is ob- tained. The following nine steps show the region- matching procedure.
I . Alukirig diild-cw grotips Children groups will be generated from region maps. Each children group consists of regions sharing a common parent region. In particular, thc first stage has only one children group. which consists of all regions segmented by the snioothness filter. This is a preparation step for utilizing rlic purerir-children constraint.
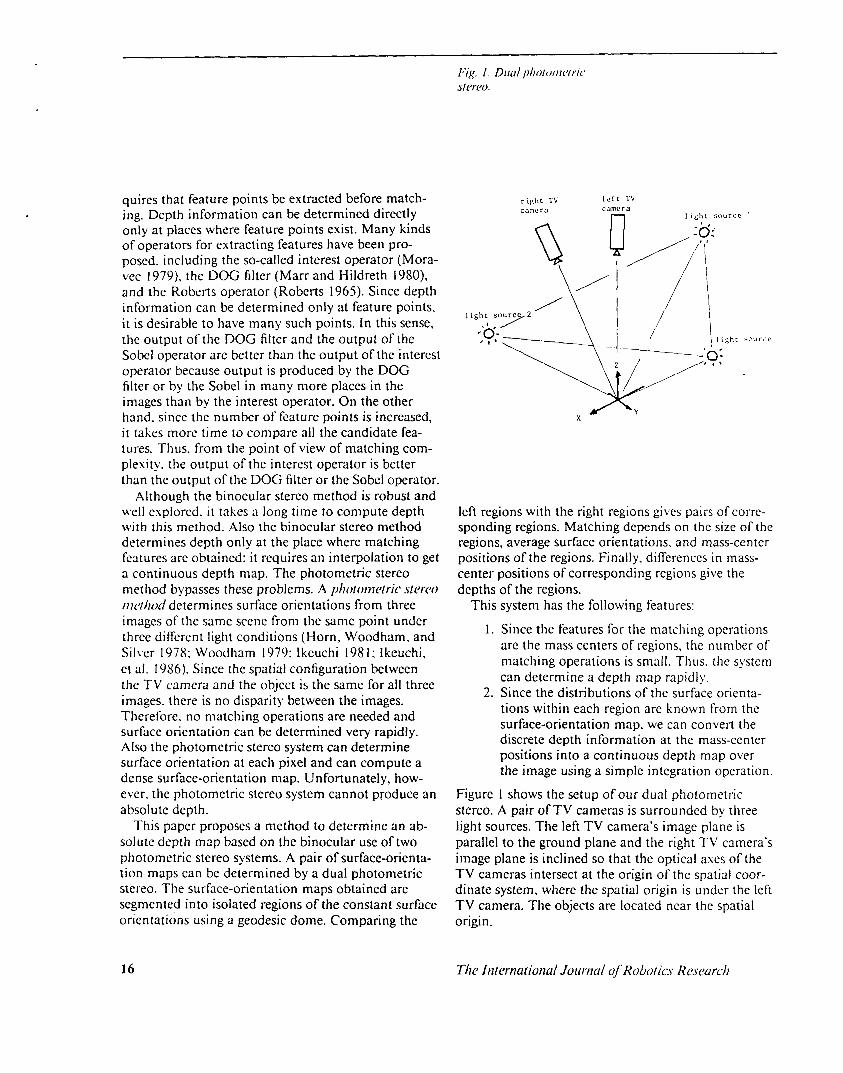
2. Muking comtnon sii~facc.-orientation subgroups Each children group will be divided into com- mon surface-orientation subgroups (CSO sub- groups) so that each CSO subgroup consists of regions having common surface orientation: that is. each region in a CSO subgroup shares both the same parent and the same surface orientation. This step is due to the siit$ace ori- cwur ioti const mint.
CSO subgroup pairs are searched among the left CSO subgroups and the right CSO sub- groups whose parents arc known to be corre- sponding regions from the previous iteration. (At the very beginning, all the regions are re-
-
3. Gencruring CSO siibgroiip pairs
garded as sharing the same parent. See Step I .) If a left CSO subgroup and a right CSO sub- group have the same surface orientation, these two subgroups are registered as a subgroup pair. See Fig. 4.
One subgroup pair is selected for matching. Note that one subgroup pair contains a left CSO subgroup and a right CSO subgroup.
The subgroup having fewer regions is selected for matching between the left CSO subgroup and the right CSO subgroup of the target sub- group pair. For the sake of explanation, let the left CSO subgroup contain fewer regions than the right CSO subgroup.
6 . Deciding a target region The largest region among the left CSO sub- group is selected for matching. This region is called the target region.
7. Matching rhe target r q i o t i with cundidutc rc- gions Each region keeps the following five properties for matching: surface orientation, parent re- gion, area size, horizontal disparity, and verti- cal disparity. Surface orientation, parent re- gion, and horizontal disparity reduce candidate regions. Area and vertical disparity give a crite- rion to determine the most likely region.
A region corresponding to the target region is searched among the right CSO subgroups. Note that the regions in the right CSO sub- group have the same surface orientation and the same parent region as the target region. Thus, this stage can be regarded as applying the surface-orientation constraint and the parent- children constraint to the search process.
Only regions in the right CSO having horizon- tal disparity within some limit are considered as candidates. Since our cameras have optical axes intersecting at the ground level, the nega- tive horizontal disparity never occurs. This gives the negative limit E , of horizontal dispar- ity. Also our system has a height limit in mea- surement. Namely, a region that is too high cannot be observed by the photometric stereo
4. Deciding u large[ siibgroiip pair
5. Ilcciding u turget CSO siihgroiip
Ikcirclri 23
COMMON-SURFACE SUBGROUP
L
CORRESPONDING
ARENT REGION
LEFT
system due to distortion of the orthographic camera model. Thus, this height limit gives the positive horizontal disparity E ~ .
Since a previous coarse stage gives depth infor- mation over a region, a disparity value d can be predictable. This d may contain an error term c3, where c3 can be determined as a func- tion of the angular difference between the pre- vious segmentational dome cell and the present cell. Regions whose horizontal dispar- ity satisfies the following condition are consid- ered as candidates.
(xl(max x, - E,, s, + d - E ~ )
< x < (min x, + E ~ , x, + d + EJ), where x, is the mass center of the target region and c l is the observed disparity obtained in the previous stage along the coarse-to-fine strategy. (In the coarsest stage, d is set to zero and c3 is set to infinity.)
T h NI'PU corisiruitii u t d itre epipolar. conslraitit are used to measure similarity between the target region and a candidate region among the
RIGHT
right CSO subgroups. The evaluation function is as follows:
Ajq dist - limit
where urca is the area size of the target region, A ureu is the difference between the area size of the target region and that of the candidate region; 1 7 disl - lirnif is the limit of allowable vertical disparity, and A y is the vertical dispar- ity between the mass-center position of the target region and that of a candidate region.
If a region corresponding to the target region is found among the regions of the right CSO subgroup, the region pair is registered. Then. the target region is deleted from the left CSO subgroup and the corresponding region is de- leted from the right CSO subgroup.
If a corresponding region cannot be found in the right CSO subgroup, only t h e target region is deleted from the left CSO subgroup.
7.1 . s11ccess.
7.2 Failure.
24 The Internuliotiul Joiirriul oJ' RoDolics R~~sc~rrrcli
8. AppljYtig all the lcji region Operations 6 - 7 will be applied to all the re- gions of the left common surface-orientation subgroups until the left subgroups are ex- hausted.
Operations 5-8 will be applied to all the sub- group pairs until the subgroup pairs are ex- hausted.
9. Applying all [he region pairs
5. Iterative Smoothing Operation
An it m i l iw si I io01 11 ittg opcr~ictl ioti ob t ai ns a precise depth map. A coarse depth map by the region match- ing method will be smoothed into a precise depth map obtained by this iterative method. This iterative method is not a simple integration but a smoothing operation based on surface orientations and differences in surface orientations between corresponding pixels.
An iterative equation is constructed to satisfy the following conditions:
1. Observed ( p . q) should agree with the first
.
derivative of z with respect to the image axis, x, j*. respectively. This is the definition of ( p , q). Thus.
should be zero everywhere in the resulting precise depth map.
2. A pair of corresponding pixels on the left and right images should have the same surface orientation, because the pixels must represent the same physical point. Thus,
should be zero, where (p', q'), (p: q') are the surface orientations on the left and right sur- face-orientation maps. Here a, b, c are parame- ters determined from the spatial relationship between the two cameras.
By using Eqs. 5 and 6, the following equation is ob- tained.
We will find the functional z that minimizes e. From the Euler-Lagrange equation.
Using these approximation equations.
we have
where I., p, b are constants.
6. Experiment
6.1. SYSTEM SET-UP
In our system, the left TV camera is roughly 2 m above the ground, and the TV camera's image plane is parallel to the ground plane. The right TV camera is located 30 cm to the right of the left TV camera, and that T V camera's image plane is inclined by 7 degrees so that the optical axes of these TV cameras intersect at the origin of the spatial coordinate system. where the spatial origin is under the left TV camera. See Fig. I .
Parameters for conversion from disparity values into depth values will be determined experimentally. Namely, parameters a', b'; c' in Eq. 4 will be deter- mined by the least-squares method. A checkerboard pattern is observed by the T V cameras. The addresses of feature points (intersection points) on the T V images will give 11' and d, while the checkerboard's height is substituted into :. The least-squares fitting gives a', b', c' from these observed values.
Ikeiichi 25
The lookup tables of the left and the right photo- metric stereo are obtained using a calibration sphere. The following operations will be executed in both the left and the right cameras so that the left and right lookup tables are obtained. First, the occluding boundary of the sphere is extracted after turning on all three light sources. Second, three pictures of the sphere after turning on one of the three light sources are taken from the camera. Third, a brightness triple at each pixel is sampled. Fourth, the surface orientation at the pixel is registered at a boxel, corresponding to the triple, of the 3-D lookup table. These Operations give the lcft and right lookup tables.
(17, 4)’s on the lcft camera coordinate system. Since surface orientation of the right lookup table is ex- pressed on the right camera’s coordinate system, it is converted into the surface orientation in the left cam- era’s coordinate system. This conversion constant is obtained by the angle between the left and right image planes.
The visible area from the left camera is always visi- ble from the right camera. A photometric stereo sys- tem can observe areas where three brightness values are higher than some threshold. The limiting angle is the radius of the spherical circle circumscribing this area. The limiting angle of the left photometric stereo
( p , 4)’s on the right lookup table are converted into
1 2 A 3 4 5 A 6 7 - a X - d i s p a r i t 3
is less than 50 degrees, while the angle between thc left and right image planes is 7 degrees. Thus, the visiblc area from the left camera is always visible from the right camera. Note that the left and right cameras share the same lighting system.
6.2. ACCURACY OF THIS S Y S T E M
The accuracy of this system depends on the accuracy of the photometric stereo system, because our segnien- tation is based on surface orientations by the photo- metric stereo system. The accuracy of the photometric stereo system is measured by determining surface ori- entations of a white board inclined at various angles. Figure 5 shows both the angles obtained csperimen- tally and the true angles. It also shows that the photo- metric stereo system can determine surface orienta- tions within a 3-degree error.
The accuracy i n depth is measured by determining the known height of blocks. Figure 6 shows the mea- sured disparity values and the real disparity values. The horizontal axis denotes A- disparity and the vertical axis denotes y disparity. The s disparity gives depth information. Even though the ideal case gives 0 dis- parity in y direction, our system gives 4. I mean dis- parity due to a vertical tilt between the two TV cam- eras. A 0.7 pixel disparity error occurs in both directions. This error corresponds to I cm error in depth. Note that since a mass-center position is deter-
26
mined by a subpixcl resolution, a disparity is also determined by a subpixcl rcsolution.
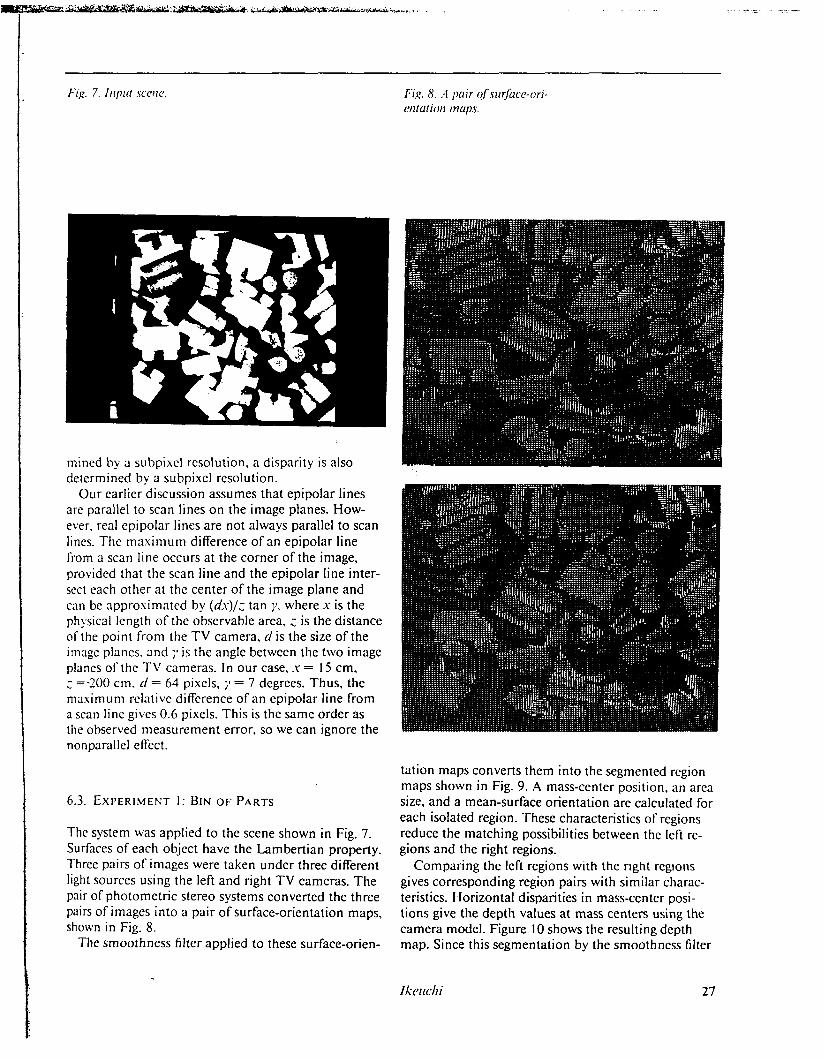
Our earlier discussion assumes that epipolar lines arc parallel to scan lines on the image planes. How- ever, real epipolar lines are not always parallel to scan lines. The maximum difference of an epipolar line from a scan line occurs at the corner of the image, provided that the scan line and the epipolar line inter- sect each other at the center of the image plane and can be approximated by (d*v)/z tan I!, where s is the physical length of the observable area, c is the distance of the point from the T V camera, d is the size of the imagc plancs. and is the angle between the two image planes of the T V cameras. In our case, x = I5 cm, : =-IO0 cm. d = 64 pixels, y = 7 degrees. Thus, the maximum rclativc difference of an epipolar line from a scan line gives 0.6 pixels. This is the same order as the observed measurement error, so we can ignore the nonparallel effect.
6.3. E X P E R I M E N T 1: BIN OF PARTS
The system was applied to the scene shown in Fig. 7. Surfaces of each object have the Lambertian property. Three pairs of images were taken under three different light sources using the left and right T V cameras. The pair of photometric stereo systems converted the three pairs of images into a pair of surface-orientation maps, shown in Fig. 8.
The smoothness filter applied to these surface-orien-
tation maps converts them into the segmented region maps shown in Fig. 9. A mass-center position, an area size, and a mean-surface orientation are calculated for each isolated region. These characteristics of regions reduce the matching possibilities between the left re- gions and the right regions.
Comparing the left regions with the right regions gives corresponding region pairs with similar charac- teristics. Horizontal disparities in mass-center posi- tions give the depth values at mass centers using the camera model. Figure 10 shows the resulting depth map. Since this segmentation by the smoothness filter
lkci ichi 27
Fig. 9. A pair of srgriicnted rrgioti maps.
Fig. 10. .4 d q l h tnap.
Fig. 11. A pair of siirfucc-ori- etitutioti riiups of u splicre.
gives precise enough regions for this scene, the system is stopped at this stage of iteration.
This system runs on a Symbolics 3600 and takes roughly 10 s to get the surface-orientation map, 20 s to get the region map, and 5 s to get the depth map comparing the left and right segmented regions. Over- all, about 1 min is necessary to get the final depth map from the three pairs of 128 X 128 brightness images.
6.4. EXPERIMENT 2: S P H E R E
The next example is a sphere. The pair of photometric stereo systems gives a pair of surface-orientation maps
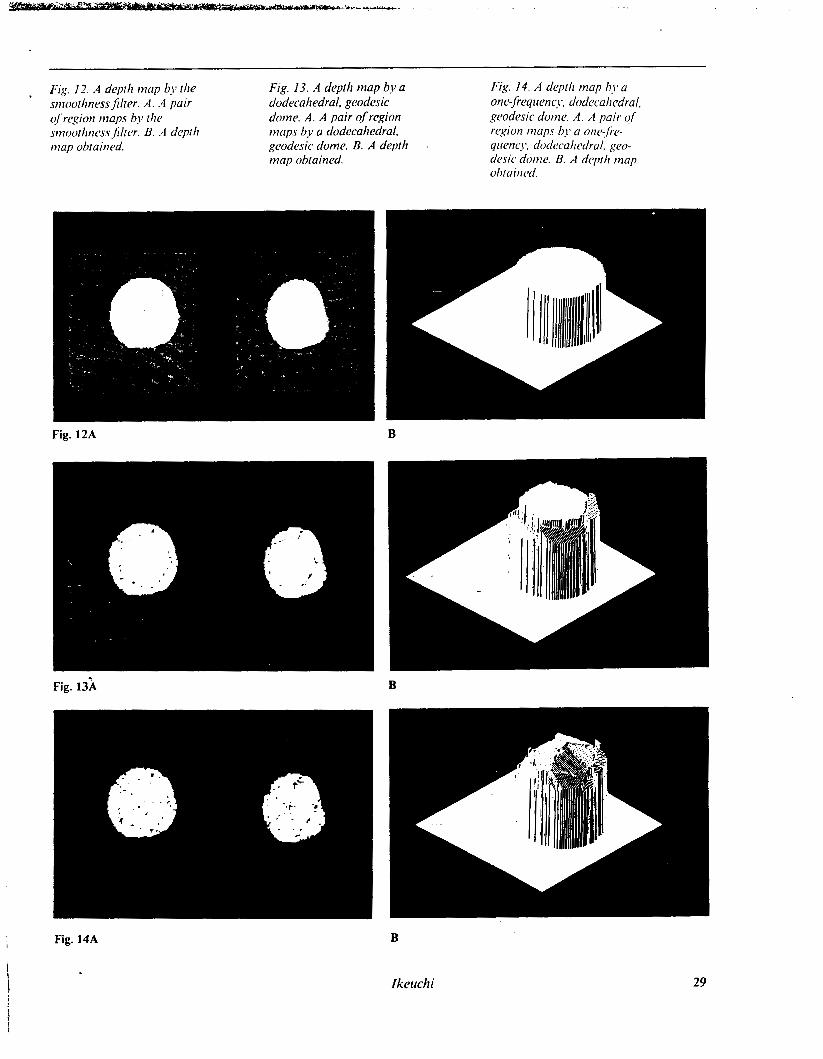
(Fig. 11). The smoothness filter converts these surface- orientation maps into a pair of region maps (Fig. 12A). The matching operation between these region maps gives the depth map (Fig. 12B). The segmenta- tion by a dodecahedral geodesic dome gives the region maps as shown in Fig. 13A from the pair of surface- orientation maps and the pair of previous region maps. Using both these segmented results and the coarse depth map in the previous stage, the region matching operation gives the finer depth map shown in Fig. 13B. The same operation is repeated using a one-fre- quency, dodecahedral, geodesic dome and gives the result as shown in Fig. 14. A two-frequency. dodeca- hedral, geodesic dome gives Fig. 15.
The iterative smoothing operation described in Sec- tion 5 gives the results as shown in Fig. 16 after 300 iterations, starting from the depth map shown in Fig.
28 The Iiit erriut ional Jo i m a l of R o D o [ ics R C?WU riA
niap obtained.
Fig. 12A B
Fig. 13k B
Fig. 14A B
Ikeitchi 29
Fig. 15A
Fig. 16.4
15. Figure 16B contains two diagrams: the upper shape is the one obtained by this operation and the lower shape is the one obtained by directly integrating sur- face orientations of the left needle map. The vertical difference is the absolute depth determined by this iterative algorithm. The upper shape's distortion is due to the error by this iterative algorithm.
7. Conclusion
This paper describes a region-based stereo method using a pair of surface-orientation maps. This algo- rithm consists of the following components:
B
B
1.
7 -.
3.
4.
5 .
A pair of surface-orientation maps is obtained from a pair of photometric stereo systems. A pair of surface-orientation maps is seg- mented into a pair of isolated region maps on surface orientations using a geodesic dome. Feature points for stereo matching are mass centers of isolated regions. The area constraint, the mean surface-orienta- tion constraint, and the epipolar constraint improve the efficiency of search operations. The process follows the coarse-to-fine strategy. At the beginning stage, coarsely segmented regions are compared and a coarse depth map is generated. This coarse depth map is used as the input to the next stage. The parent-chil-
30
dren constraint is applied to make the search operation efficient using this strategy.
We do not segment images using brightness thresh- olds. Segmentation for binocular stereo should use an intrinsic property of the object surface, such as surface orientation: the segmentation should not be based on a property such as apparent brightness, which depends on the viewer direction. Only an intrinsic property gives a segmentation result independent of the viewer direction. Other possible intrinsic properties suitable for region-based stereo would be color and albedo.
A c k n ow 1 ed g m e n t s
B. K. P. Horn. Takeo Kanade, S . A. Shafer, and the referees pro\ided many useful comments, which have improved the readability of this paper.
REFERENCES
Baker. H. 198 1 . 1 Vancouver, B.C.). Edge-based stereo corre- lation. Proc. IJC:I1-7:631 -636.
Barnard. S. T.. and Fishler, M. A. 1982. Computational stcrco. AC'.l/ C'ott?pii/itig Sirrvc~ I4(4):553-572.
Barrow. H. G.. and Tcnenbaum, J. M. 1978. Recovering intrinsic scene characteristics from images. Compir/er rixioti S j . . s / ( w i . ~ , eds. A. Hanson and E. Riscman, pp. 3- 26. New York: Academic Press.
Holland.
bridge: MIT Press.
Brady. J. M. I98 I . Cumpiifer vi.sion. Amsterdam: North-
Grimson. W. E. L. I98 1. From images io .sit$aces. Cam-
Horn. B. K. P., Woodham. R. J.. and Silver. W. M. 1978. Determining shape and reflectancc using multiple images. AI memo 490. Cambridge: Massachusetts Institute of Tcchnology Artificial Intelligence Laboratory.
Ikcuchi, K. I98 I . Dcterniining surface orientations of spccu- lar surfaces by using the photometric stereo system. IEEE Trut1.s. P A M I , PAMI 2(6):66 1 -669.
Ikeuchi, K., et al. 1986. Determining grasp configurations using photometric stereo and the PRISM binocular stereo system. In[. J. Robofics Res. 5( 1):46-65.
Marr, D., and Hildreth, E. 1980. Theory of cdge dctection. Proc. Royal Sociefy ($Lotidon B. 207: I87 -2 17.
Marr, D., and Poggio, T. 1979. A computational theory of human stereo vision. A I Memo 45 I . Cambridge: Massa- chusetts Institute of Technology Artificial Intelligence Laboratory.
Moravec. H. 1979 (Tokyo). Visual mapping by a robot rover. Proc. IJCAI 6.595-600.
Nishihara. H. K. 1984. PRISM: a practical realtinie imaging stereo matcher. AI Memo 780. Cambridge: Massachusetts Institute of Technology Artificial lntelligencc Laboratory.
sional solids. Oprical and clcctro-opiical ii?fi)rtmtiun pro- ccwing ed J. T. Tippett. pp. I59 - 197. Cambridge: MIT Press.
Thorpe, C. E. 1984 (April 30-May 2 . Annapolis. Md.). A n analysis of interest operators for FIDO. Proc I I y E l Il'ork- sliop on Cot I ?pi if ('I' I 'ision: R c~prmvi/o/ iot i (i t id Coii 1 r( 11:
Wenninger, M. J . 1979. Splicricat IiioddT. New York: Cam-
Woodham, R. J. 1979. Reflectance map techniques for
Ohta, Y.. and Kanade. T. 1985. Stereo by intra- and inter-
Roberts, L. G . 1965. Machine perception of thrce-dimen-
135- 140.
bridge University Press.
analyzing surface defects in metal casting. AI-TR-457. Cambridge: Massachusetts Institute of Technology Artifi- cial Intelligence Laboratory.


![Surface Enhancement Using Real-time Photometric Stereo …wilburn/Papers/RealTimePhotometric... · The field of image enhancement [Rus02] ... operation. 2.1 Photometric Stereo ...](https://static.documents.pub/doc/80x56/5af1d2c47f8b9ac62b90743e/surface-enhancement-using-real-time-photometric-stereo-wilburnpapersrealtimephotometricthe.jpg)


![Haptic Texture Modeling Using Photometric Stereo · 2020. 7. 14. · B. Photometric Stereo Algorithm We use the photometric stereo algorithm presented in [10] to construct the height](https://static.documents.pub/doc/80x56/610118fcbfa54e55cf05e413/haptic-texture-modeling-using-photometric-stereo-2020-7-14-b-photometric-stereo.jpg)


