Page 1
Determining Farmers’ Willingness-To-Grow Cellulosic Biofuel Feedstocks on
Agricultural Land
Melissa K. Lynes, Jason S. Bergtold, Jeffery R. Williams, and Jason E. Fewell
The authors are Graduate Research Assistant, Associate Professor, Professor, and
Graduate Research Assistant, respectively, Department of Agricultural Economics,
Kansas State University, Manhattan, KS, 66506.
________________________________________________________________________
Selected paper prepared for presentation at the Agricultural and Applied Economics
Association’s 2012 AAEA Annual Conference, Seattle, Washington, August 12-14, 2012.
Copyright 2012 by Lynes, Bergtold, Williams, and Fewell. All rights reserved. Readers may
make verbatim copies of this document for non-commercial purposes by any means,
provided this copyright notice appears on all such copies.
Page 2
Determining Farmers’ Willingness-To-Grow Cellulosic Biofuel Feedstocks on
Agricultural Land
Abstract
The levels of cellulosic biofuel feedstocks that are being produced continue to fall short
of standards set by the Environmental Protection Agency (EPA). Technical feasibility
studies have been conducted to determine if the levels of production the EPA has
mandated are obtainable; and breakeven farmgate studies have shown the costs of
growing cellulosic feedstocks. However, very few studies have been conducted on
farmers’ willingness to grow these feedstocks. This study examines farmers’ willingness
to harvest crop residue, or grow a dedicated annual, or perennial bioenergy crop. A
Heckman selection model is used to account for selection bias, estimate the probability of
a farmer growing a particular feedstock, and to determine how many initial acres farmers
would be willing to plant of a dedicated annual or perennial bioenergy crop. We find that,
due to the variation in the type of crops and feedstocks considered different variables are
significant in the farmers’ decision-making process.
JEL Codes: Q12, Q15, Q16
Keywords: acreage allocation, annual bioenergy crop, cellulosic biofuel feedstock, crop
residue, Heckman selection model, perennial bioenergy crops, willingness to grow
Page 3
1
Determining Farmers’ Willingness-To-Grow Cellulosic Biofuel Feedstocks on
Agricultural Land
Despite yearly standards set by the Environmental Protection Agency (EPA), the
production of biofuels from cellulosic biofuel feedstocks continues to fall short of
mandated levels. In 2010, the EPA revised yearly production requirements for cellulosic
biofuels: biomass-based diesel, advanced biofuels, and total renewable fuels. Originally,
the goal was 0.10 billion gallons of cellulosic biofuel. This was to increase to 0.25 billion
in 2011 and 0.50 billion in 2012. By 2022, 16 billion gallons of cellulosic biofuel was to
be produced (U.S. Environmental Protection Agency 2010). However, a 2011 study
conducted by the Energy Information Administration (EIA) in conjunction with the EPA,
projected that only 8.65 million gallons of cellulosic biofuel will be produced in 2012
(U.S. Environmental Protection Agency 2011). This is approximately 1/60 of the original
goal of 0.50 billion gallons of biofuel production by 2012. So far, the short-fall in
production has not jeopardized the goal of 16 billion gallons by 2022, but soon could.
According to the “EPA Finalized 2012 Renewable Fuel Standards” it is believed that 15.2
billion gallons of renewable fuel in 2012 is still attainable (U.S. Environmental Protection
Agency 2011). According to the standards set by the Energy Independence and Security
Act of 2007, by 2016 any new biofuels produced must originate from cellulosic
feedstocks (U.S. Congress, House of Representatives 2007).
Given the drastic short fall in cellulosic biofuel production, it is important to
know if farmers are willing to produce the alternative cellulosic biofuels feedstocks
needed for advanced biofuels production. The purpose of this study is to estimate the
Page 4
2
probability of and examine factors affecting farmers’ willingness to produce different
types of cellulosic biofuel feedstocks. In addition, the paper estimates farmers’ potential
initial acreage allocation decisions for dedicated annual and perennial biofuel crops. The
study examines three sources of cellulosic biofuel feedstocks. The first source is
agricultural residue (e.g. corn stover), which represents a value-added product for farmers.
The other two types are dedicated annual bioenergy crops (e.g. energy or sweet sorghum)
and perennial bioenergy crops (e.g. switchgrass or miscanthus).
Technical feasibility studies have estimated the breakeven price at which farmers
should be willing to produce cellulosic biofuel feedstocks, as well as the effects on soil
integrity, water quality, and water quantity of biofuel production. While these studies
examine the technical conditions under which farmers may produce cellulosic energy
feedstocks, there is relatively little literature that examines farmers’ willingness to adopt
these enterprises.
This study contributes to the existing literature by examining the effect of farm,
farm manager, and socioeconomic characteristics on Kansas farmers’ willingness to
produce alternative cellulosic biofuel feedstocks. Using the data from the study we go a
step further to analyze the potential initial acreage allocation decisions for dedicated
annual and perennial feedstock production, providing an initial estimate of the potential
supply at the farm level. We use a probit model to determine farmers’ willingness to
harvest their crop residue. We then use a two-stage Heckman selection model to examine
farmers’ willingness to grow dedicated bioenergy crops. The first stage examines a farm
managers’ willingness to produce, while the second stage determines how many acres the
farm manager would be willing to initially plant of the bioenergy crop. There have been
Page 5
3
numerous studies conducted on farmers’ willingness to grow perennial and herbaceous
crops as bioenergy feedstocks and harvest crop residues. This paper extends these initial
efforts to consider a dedicated annual bioenergy crop and how many acres they are
initially willing to grow of both the annual and perennial bioenergy crops.
Literature Review
Technical Feasibility and Logistics
There has been a great deal of research conducted on the technical feasibility of
growing cellulosic biofuels and farmgate pricing (Bangsund, DeVuyst, and Leistritz 2008;
P. Gallagher, et al. 2003; Graham, et al. 2007; Graham 1994; Rajagopal, et al. 2007;
Walsh, et al. 2003). Graham (1994) found that most of the 158.6 million hectares of land
that are suitable for growing bioenergy crops are already being used to produce
traditional crops.
Other studies have looked at biomass yield and production potential (Graham, et
al. 2007; McLaughlin, et al. 2002; Nelson 2002; Perlack, et al. 2005; Propheter, et al.
2010). Perlack, et al. (2005) estimated that biomass production could reach one billion
dry tons per year. Of this total, 75% of the biomass produced would be from agricultural
land, using up to 55 million acres, assuming that dedicated perennial bioenergy crops are
grown simultaneously with existing biomass sources and technology continues to
increase crop yields.
With high enough prices there will likely be an increase in the amount of biomass
produced, displacing agricultural land that has typically been used for traditional crop and
livestock production (de la Torre Ugarte, English, and Jensen 2009; Gallagher, et al.
Page 6
4
2003). An increase in the production of dedicated bioenergy crops will lead to a decrease
in land allocated for traditional crop and livestock production, which will likely increase
commodity prices, further increasing competition among dedicated energy crops (Walsh,
et al. 2003).
Other studies have projected what biorefineries or other immediate processors
will have to pay farmers to supply biomass. A farmgate study in South Central North
Dakota found that costs, including opportunity costs, for producing switchgrass were
$47.14, $67.02, and $76.16 per ton on poor, average and high productivity soil,
respectively (Bangsund, DeVuyst and Leistritz 2008). A study by Perrin, et al. (2008)
found that between 2001 and 2005 the average total production cost of switchgrass was
$70 per ton on ten different plots ranging from North Dakota to Nebraska. Other studies
include P. Gallagher, et al. (2003), Larson, English and He (2008), Mapemba and Epplin
(2004), and Turhollow (1994).
It is important to keep in mind that biorefineries and farmers will value bioenergy
crops differently. Biorefineries consider biomass as an input and value it according to the
price they receive for selling biofuel produced from it. Famers view the biomass as an
output and consider returns from other crops, machinery requirements, input costs, labor,
commodity market, prices, and government policy, to determine the profitability and risk
of growing a bioenergy crop (Mapemba and Epplin 2004; Paine, et al. 1996). According
to Mapemba and Epplin (2004) there are 19 different types of machinery required to
harvest biomass. This plays a significant role in determining farm level breakeven prices.
Breakeven pricing for switchgrass can be thought of as the price that covers production
costs as well as replacing the returns from traditional crops which include returns to
Page 7
5
operator labor, management, equity, and land (Babcock, et al. 2007; Bangsund, DeVuyst
and Leistritz 2008).
Mapemba and Epplin (2004) found that harvest time constraints are another
important factor when determining breakeven biomass prices. Optimal harvest of
different types of biomass occurs at various times during the year. Epplin et al. (2007)
report that an eight-month harvest system costs $36.88 per dry ton to harvest switchgrass
compared to using a two-month harvest system, which costs $52.75 per dry ton, ignoring
transportation costs. This implies that farmers would be able to supply the biomass in a
less costly way to biorefineries if they could supply it when labor for harvesting was
available and weather was suitable. If biorefineries utilize multiple feedstocks for a year
round supply (e.g. switchgrass and crop residues), this situation may allow farmers a
choice to produce feedstocks that provide a better fit for their on-farm production systems,
potentially reducing costs for both parties and increasing supplies (Epplin, et al. 2007).
Other costs need to be considered as well. Due to the bulky nature of biomass
produced from bioenergy crops, transportation costs are high. Biomass should be grown
close to the processing plant to reduce costs (Epplin, et al. 2007; P. Gallagher, et al. 2003;
Larson, et al. 2005; Paine, et al. 1996). Furthermore, the potential value of carbon
sequestration credits gained from perennial bioenergy crop production should be
considered. Such information would be needed to help determine the optimal prices that
farmers may receive for growing these crops. However, there is still much that needs to
be determined before relying on these types of credits (Bangsund, DeVuyst and Leistritz
2008).
Page 8
6
Bioenergy Crop Production
There have been several studies that have examined the opportunity costs of
growing bioenergy crops or removing residue for biomass as an alternative to traditional
cropping practices. Leaving corn residue on the soil as opposed to harvesting it has
several values. It can be valued as organic matter, because it can add to the nitrogen,
phosphorous, and potassium in the soil, which means less need for commercial fertilizers
(Hess, et al. 2009). Leaving the residue on the ground can also retain and recycle
nutrients, improve soil structure, and help maintain soil water levels (Wilhelm, et al.
2007). Several issues arise when crop residue is removed including increased soil erosion,
increased levels of chemical run off, reduced efficiency of water absorption, and reduced
levels of soil organic matter (Blanco-Canqui and Lal 2009). The cost of harvesting the
residue also needs to be considered (P. Gallagher, et al. 2003). An advantage gained from
removing the residue before planting is that herbicides will work more effectively due to
more direct contact with the soil resulting in a reduction in the amount of herbicides
needed (Hess, et al. 2009).
There are several environmental concerns associated with increased bioenergy
crop production. Farmers may consider removing marginal land from Conservation
Reserve Program (CRP) acres, using them for biomass production to make a higher profit
(Paine, et al. 1996). McLaughlin et al. (2002) found that if feedstock prices reached
$47.50 per ton for switchgrass, 13.3 million acres would be removed from the CRP and
used for switchgrass production instead. If these acres are removed from CRP and put
into perennial bioenergy crop production the conservation benefits that were present with
CRP production will likely be reduced (Baker and Galik 2009).
Page 9
7
Planting of perennial bioenergy crops (e.g. switchgrass and miscanthus) can
provide environmental and production benefits. McLaughlin and Walsh (1998) found that
planting switchgrass decreases soil erosion, uses half as much fertilizer as corn, only
requires one herbicide application during its establishment year, and is more flood and
drought tolerant than traditional crops, making it a viable and potentially attractive
bioenergy crop option. Perennial crops also encourage wildlife proliferation and improve
water quality over traditional annual crops due to their natural filtration system (Paine, et
al. 1996). Research has shown net energy gains of 343% from producing a perennial crop
which far exceeds the 21% energy gained when using corn grain for ethanol (McLaughlin
and Walsh, 1996). However, due to production risks and high establishment costs, many
farmers are disinclined to plant perennial crops (Pannell, et al. 2006).
Farmers’ Willingness to Grow
Despite the significant value these previous studies have provided for farmgate
pricing, opportunity costs, and feasibility, these studies may be of little relevance if
farmers are not willing to grow bioenergy crops or harvest crop residues for biofuel
production. There have only been a few studies that have examined the willingness of
farmers to grow cellulosic biofuels. Via survey methods, Jensen, et al. (2006) found
among Tennessee farmers, those farms that are smaller in size, plant soybeans, have
younger and more highly educated operators, and utilize conservation practices (e.g.no-
till) were more willing to grow bioenergy crops. They found that farmers who own or
have access to equipment for hay production were more willing to plant switchgrass,
indicating they have the capability to cut, bale, and handle switchgrass without additional
capital investment. However, livestock operators were less likely to adopt switchgrass
Page 10
8
(Jensen, et al. 2006), potentially given the opportunity cost of converting land from
pasture or hay production to bioenergy crop production.
Sherrington, Bartley and Moran (2008) used focus groups of farmers in the
United Kingdom to determine whether or not farmers are willing to grow an energy crop.
They found the main factors affecting adoption are perception of financial returns and
uncertainty in financial returns (at least) in the short-run. The study also found that
farmers, especially older farmers, would be willing to contract out bioenergy crop
production on their operation to a third party.
A choice experiment conducted by Paulrud and Laitila (2010) examined farm and
farmer characteristics that may have significant influence on farmers’ willingness to grow
bioenergy crops, especially herbaceous and perennial crop options. The study found that
production on leased or rented land, share of land set-aside for production, and the type
of farming had no significant effect on farmers’ willingness to grow. The age of the
farmer, farm size, income, cultivating on set-aside land, and geographical location had
negative effects on farmers’ willingness to grow.
Pannell et al. (2006) found that the level of education has less to do with adoption
than training courses related to the particular technology being adopted. They found that
crops with long time lags between planting and harvesting have increased production risk
which could act as a disincentive for farmers to plant perennial bioenergy crops.
Data and Methods
Probit and Heckman selection models are used with survey data collected from
farm mangers by enumerators to examine factors that affect farmers’ willingness to
Page 11
9
supply bioenergy crops and to determine the minimum initial acres they will plant of
annual or perennial bioenergy crops.
Survey Data
A survey was administered from November 2010 to February 2011 by Kansas
State University and the USDA, National Agricultural Statistics Service (NASS) to assess
Kansas farmers’ willingness to produce alternative cellulosic biomass feedstocks for
bioenergy production under different contractual arrangements. A total of 485 farmers
where contacted in northeastern, central, and western Kansas to participate in the survey.
These regions of Kansas were selected based on the number of farms growing corn
and/or sorghum; mix of irrigated and dryland production; geographical and climate
differences; and proximity to existing grain-based and future cellulosic-based
biorefineries. The particular locations were chosen because western Kansas has the most
irrigation out of the three areas in the study, providing a means to capture behavior by
farmers who irrigate crops, especially corn. The central part of the state has less irrigation
than the west, but is the largest producer of sorghum in the state. A significant dedicated
annual bioenergy crop suited to Kansas is energy sorghum. The northeastern part of the
state is on the boundary of the western corn belt. This area relies less on irrigation than
the other two areas, but has more rainfall. The main crops produced in the northeastern
part of the state are corn and soybeans.
For each region of Kansas surveyed, a random sample of approximately 160
farms with more than 260 acres and $50,000 in annual gross farm sales were obtained
from the USDA-NASS farmer list. In addition, the percentage of dryland versus irrigated
Page 12
10
farms surveyed was selected to match the existing distribution of the percentage of
dryland versus irrigated farms for each region. Farmers already participating in USDA-
NASS enumerated surveys (e.g. ARMS) were removed from the sample and replaced
with another randomly drawn farmer. The survey was tested using face-to-face interviews
with farmers in the targeted study areas of the state. The survey consisted of seven
sections. The sections were farm characteristics; a stated choice section on farmers
willingness to grow biofuel crops and contracting; bioenergy crop contracting conditions;
conservation practices; marketing strategies; risk perceptions; and demographics.
Potential participants were mailed a four page flier asking for their participation in
the survey and providing information about cellulosic biofuel feedstock production one
week prior to being contacted by USDA-NASS enumerators. USDA-NASS enumerators
then scheduled one hour interviews with the farmers to complete the survey and stated
choice experiments. Interviews, on average took 57 minutes to complete. Upon
completion of the survey and receipt at the USDA-NASS office in Topeka, farmers were
compensated for their time with a $15 gift card. Of the 485 farmers contacted, 290
completed the survey and 38 were out-of-business, did not farm, or could not be located.
Thus, the final survey response rate was 65%. Of the 290 respondents who completed the
survey 238, 215, and 216 responses were usable for analysis examining value-added,
annual crops, and perennial crops respectively. The lower numbers of responses for this
analysis was due to a lack of response or refusal to answer all relevant questions.
Farmer demographics taken from the 2007 U.S. Census of Agriculture (NASS,
2009) were used to determine whether the survey respondents are representative of
Kansas farmers. Table 1 compares some of the demographics as reported by farmers in
Page 13
11
the survey to statewide numbers as recorded in the 2007 Census of Agriculture. A
slightly lower average age is reasonable given our survey sampled larger farms that are
likely operated by younger farmers. Average farm size, amount of land leased, amount of
permanent pasture, and amount of land owned are considerably larger for our survey. The
larger farm sizes we found stems from the fact that we chose farms over 260 acres in our
sample, which eliminates many small, or hobby farms. The survey asked respondents to
choose a category in which their value of agricultural product sales occurred, and the
Census of Agriculture figure of $219,944 fell within the most often selected category of
$200,000 to $399,999.
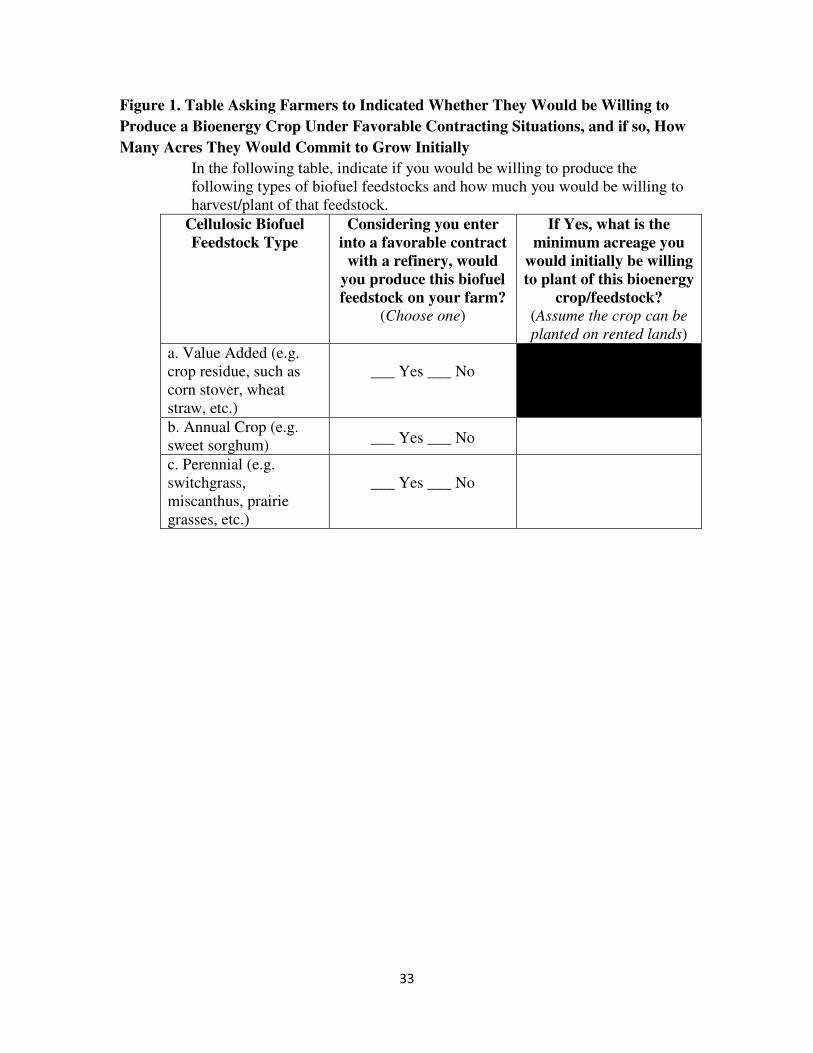
The survey was used to find out if farmers are willing to produce any combination
of three different bioenergy crops: crop residues (e.g. corn stover) as a value-added
product; a dedicated annual bioenergy crop option (e.g. sweet sorghum); and a dedicated
perennial bioenergy crop (e.g. switchgrass). Figure 1 contains the question asked in the
survey. It should be noted that several assumptions were made to assist respondents in
answering the questions. The first was that respondents were to answer as if a favorable
contract would be offered. The second assumption was made in regards to the initial
acreage component of the question. Respondents were to assume that the annual or
perennial bioenergy crop (found in table 2) could be planted on leased or rented land.
Table 2 provides descriptions of the variables from the survey that are used in our
analysis. The dependent variables are: would a farmer be willing to harvest their value-
added crop residue (VA); would a farmer be willing to plant a dedicated annual
bioenergy crop (AC); would a farmer be willing to plant a dedicated perennial bioenergy
crop bioenergy crop (PC); and how many initial acres of the annual (ACIA) and perennial
Page 14
12
(PCIA) bioenergy crops would a farmer be willing to plant. The independent variables
are described by categories. These are farm characteristics, farm practices, bioenergy
custom farming and land use options, and farmer characteristics. The factors in each of
these categories are the hypothesized variables that would affect a farmers adoption and
initial acreage allocation decision for each type of cellulosic biofuel feedstock being
considered based on previous studies examined in the literature and economic theory.
Model
An expected utility model framework is used to determine the factors affecting
farmers’ willingness to harvest crop residue and/or grow a dedicated annual or perennial
bioenergy crop. Let ��,�,�(��,�) be an expected utility function for farmer i where =
�, �, and � = 1,0. The index c represents the cellulosic biofuel feedstock being adopted,
where r is harvesting of crop residue; a is a dedicated annual bioenergy crop; and p is a
dedicated perennial energy crop. ��,� is the set of explanatory variables associated with
the decision to harvest cellulosic biofuel feedstock c for individual i. The index j
represents two different states and is equal to “1” if crop residue is harvested or a
dedicated energy crop is grown, and “0” otherwise. For the remainder of this section, the
index i representing the individual under consideration is suppressed to ease notational
burden.
A farmer will harvest crop residue or grow a dedicated energy crop if ∆�� =
��,�(��) − ��,�(��) > 0. That is, if the expected utility from producing a cellulosic
biofuel feedstock is greater than if it is not grown. Given the nature of utility, ∆�� cannot
actually be observed. Instead, the binary response from a farmer willing to harvest crop
Page 15
13
residue or grow a dedicated bioenergy crop is. Let �� = 1 if ∆�� > 0 and “0” otherwise.
The model for a particular farmer willing to produce a given cellulosic biofuel feedstock
is given by:
(1) ∆V� = �’��� + ε�withε�~NI(0, σε$) and
(2) �� = %1&'∆V� > 00()ℎ+�,&-+
.
where �� is a vector of parameters. Given that ε� is normally distributed and �� is
observed, the model given in equations (1) and (2) can be estimated as a probit model.
The probit models in this paper are estimated with STATA® version 11.2 using the
“probit” command. Marginal effects were calculated at the means of the explanatory
variables and the associated asymptotic standard errors were estimated using the delta
method (Greene 2008) with the “mfx” command in STATA®.
Many of the same variables are used to estimate farm managers’ willingness to
harvest crop residue or grow a dedicated annual or perennial bioenergy crop. The
variables that are used in all three models are the farm characteristics including West,
Central, Total Acres, Percent Lease, and Percent CRP. A majority of the farm practices’
variables are also included in all three models. The farm practice variables include Graze
Residue, Bale Reside, Use Baler, have livestock (Livestock), and have a conservation plan
(Plan). Two of the bioenergy custom farming and land use variables are included in all
three models: Custom Harvester and Store Biomass. All of the demographic variables are
included in all three models. These variables include Off-Farm, Experience, Age, College,
Risk Avoider, and Rely on Market. The value-added crop residue model also includes the
following additional covariates: Remove Biomass, Rotate Crops, and CV Till. Rotate
Page 16
14
Crops and Lease AC are included in the dedicated annual bioenergy crop model and
Lease PC is included in the dedicated perennial bioenergy crop model.
The three types of cellulosic feedstocks examined are fundamentally different,
given the differences in production practices and investments needed to produce them.
When crop residue is harvested following grain harvest a value-added enterprise is
created. An annual bioenergy crop can replace a traditional crop in a rotation. A perennial
bioenergy crop requires replacing a traditional annual crop or hay crop for five to ten
years and it takes two to three years to establish. This is the reason why some variables
are included in some models but not others.
Based on previous studies (Jensen, et al. 2006; Pannell, et al. 2006; Paulrud and
Laitila 2010; Sherrington, Bartley and Moran 2008), farmers who are willing to lease
their land for the production of a bioenergy crop, farmers with more acres, younger
farmers, famers with a college education, farmers who currently practice conservation
tillage, and farmers who have used a baler will be more likely to grow a cellulosic
feedstock. Farmers who have livestock, already harvest biomass for other uses, and are
risk avoiders will be less likely to grow a bioenergy feedstock. It is hypothesized that
farmers who are willing to allow a custom harvester to harvest their bioenergy crop,
willing to store biomass for six months or more, and who have a conservation plan will
be more willing to harvest their crop residue and/or grow a dedicated bioenergy crop.
Furthermore, it is hypothesized that farmers who already bale or graze their crop residue
will be less likely to harvest their crop residue and/or grow a dedicated bioenergy crop.
Finally, it is conjectured that farmers who currently have CRP land will be more willing
to grow a dedicated perennial bioenergy crop, if allowed under the current CRP
Page 17
15
regulations. We assume here that the perennial crop for bioenergy production would be a
value-added enterprise on top of the CRP rental payment received (even if reduced).
A two-part question was asked for the dedicated annual and perennial bioenergy
crop options. A farmer was asked if they would be willing to produce a bioenergy crop
assuming favorable contractual terms, and if so, how many initial acres would they be
willing to plant, assuming they could plant the crop on leased and/or rented acres (figure
1). As a result, the model used to examine the initial acreage allocation for each dedicated
bioenergy crop in question must take into account possible self-selection bias given the
conditional two-part nature of the question asked. That is, respondents are self-selecting
themselves into the group of respondents who are willing to grow dedicated bioenergy
crops, which could bias parameter estimates and inference if not taken into account
(Heckman 1979; Maddala 1983). To accommodate this, a Heckman selection model is
used to jointly examine the adoption and initial acreage allocation decisions.
The first stage of the model examines farmers’ willingness to grow a dedicated
bioenergy crop, which is given by equations (1) and (2) and can be estimated as a probit
model. The second stage of the model examines a farmers initial acreage allocation for
each crop type conditional on their willingness to produce a dedicated annual or perennial
bioenergy crop. The set-up for the two bioenergy crop options examined follows the set-
up in Fuglie and Bosch (1995). Let /� represent the initial number of acres a farm
manager will be willing to plant of a dedicated annual or perennial bioenergy crop. Then,
let the initial acreage allocation decision be represented by the following equation:
(3) /� = 0′123 + 4� with 4�~NI(0, σ5$)
Page 18
16
where 01 is a vector of parameters and �3 is the vector of variables associated with
producing feedstock c. Remember, that /� will only occur if �� = 1, which means that a
farm manager has to be willing to grow a dedicated bioenergy crop in order to allocate
acreage to the planting of the crop. Thus, the conditional mean of /� is
6(/�|28 , �� = 1) = 0′123 + 6(4�|28 , �� = 1) (Heckman 1979). This means that the
conditional mean represented by the model equation (3) must be adjusted for potential
self-selection bias by taking into account the adoption decision given by equations (1)
and (2).
The vector of explanatory variables �8 in the initial allocation model given by
equation (3) are similar to those included in the probit models for the dedicated annual
and perennial bioenergy crops. The variables removed from the initial acreage allocation
model are the bioenergy custom farming and land use variables which includes Custom
Harvester, Store Biomass, Lease AC, and Lease PC. The variable Rotate Crops is
removed from the dedicated annual bioenergy crop model as well. It is assumed that
these factors influence a farmers’ willingness to produce, but not necessarily how many
initial acres they are willing to allocate for production.
There is a lack of research (to the authors’ knowledge) examining how many
acres farmers may be willing to commit to the production of a dedicated annual
bioenergy crops. Farms in the western or central part of the state are more willing to
allocate more acres to bioenergy crop production than farms in the northeast. Recall,
much of the sorghum produced in Kansas is done in the central part of the state. We
hypothesize that larger farms and farms with a high percent of leased land and/or CRP
Page 19
17
land are willing to grow more acres initially. Graze Residue and Bale Residue should
decrease the amount of initial acres a farmer is willing to plant.
The Heckman Selection models of dedicated bioenergy crop adoption and initial
acreage allocation are estimated with STATA® using the “heckman” command. The
procedure estimates both the binary choice model given by equations (1) and (2) and the
acreage allocation model given by equation (3) simultaneously to account for the self
selection bias (Puhani 2000). The approach adjusts for any potential self-selection by
taking account of the fact that 6�4�|�8 , �� = 1) = 9:5 ;<=>?@>AB<=>?@>A
where 9 is the correlation
between C� and 4�; :5 is the standard deviation of 4� and ϕ and Φ are the standard
normal probability and cumulative density functions, respectively. If the parameter 9 is
equal to zero, then no selectivity bias exists (Gourieroux 2000).
Results
Results for each model are presented by each cellulosic biofuel feedstock
examined.
Crop Residues
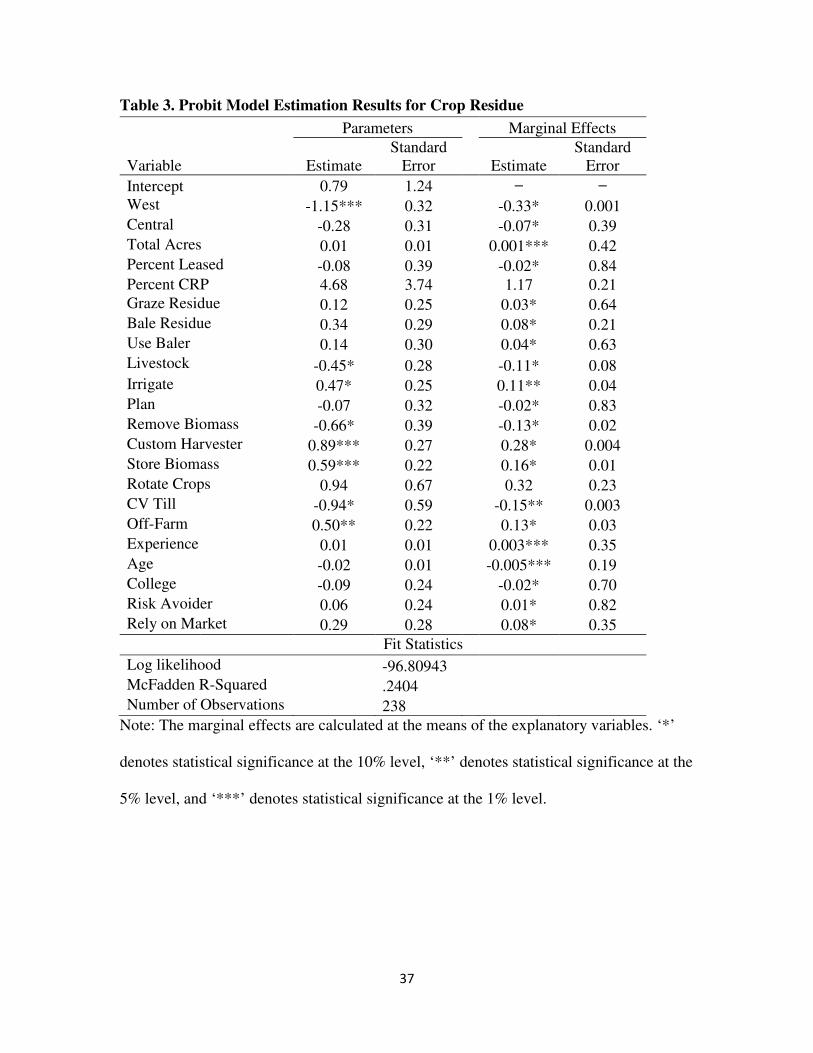
Table 3 reports the results from the probit model used to estimate the effects of
willingness to harvest crop residue. The McFadden pseudo R2 indicated a relatively good
fit of the model to the observed data. The results indicate, with statistical significance,
that farmers who reside in western Kansas (West), who raise livestock (Livestock), have
already removed biomass (Remove Biomass), and practice conservation tillage (CV Till)
are less likely to remove crop residue than other farmers. These results make intuitive
Page 20
18
sense. Farmers who raise livestock may already graze their livestock on crop residues
making them less likely to sell the residue. The crop residue may be a cheaper source of
feed compared to buying other feed rations for their livestock. Similar logic applies to
farmers who already remove biomass. They may be harvesting the biomass for livestock
feed for their use or for sale to other producers. In either case, since they have already
established a use for their crop biomass they are less likely to seek an alternative unless it
pays substantially more, which can be uncertain in a market that does not exist.
Farmers in western Kansas on average receive less rain fall than farmers in central
and northeastern Kansas. Leaving crop residue on the soil surface through the use of
conservative tillage practices can help to capture additional moisture in the soil that is
needed for future cash crops. Conservation tillage also reduces soil erosion, maintains
soil quality, and reduces the amount of fertilizer needed (Reicosky 2008). If farm
managers are accustomed to leaving their crop residue on the ground for one of these
reasons, they are likely less inclined to remove their residue. Finding conservation tillage
to have a negative impact on a farmers’ willingness to switch is contradictory to what
Jensen et al. (2006) found. This is probably due to the fact that their study focused on
growing switchgrass, not harvesting crop residue.
Other factors are found to be positive and statistically significant on farmers’
decisions to harvest crop residue (table 3). These include irrigation of crops (Irrigate),
allowing a custom harvester access to harvest crop residue (Custom Harvest), storing
biomass on-farm (Store Biomass), and off-farm employment (Off-Farm). Irrigation
increases soil moisture, but significant amounts of reside reduces irrigation efficiency.
Thus, the manager may want to remove some biomass from irrigated land. If a farmer is
Page 21
19
willing to allow a custom harvester to remove the crop residue (e.g. per a contract with a
biorefinery or intermediate processor), then the farmer may be more willing to have their
crop residue removed. This implies that farmers are interested in selling the residue, but
would like someone else to harvest their crop residue to reduce critical on-farm time or
machinery constraints. Farmers who are willing to hold biomass on their farm for longer
than six months are more likely to harvest their crop residue, as well. These farmers are
willing to allocate some of their land to the storage of biomass as long as they know the
biorefinery is going to purchase the residue, which will most likely occur under some
form of contract (Rajagopal, et al. 2007).
Two interesting, yet insignificant variables are worth discussing. We find as
Paulrud and Laitila (2010) did that leased land (Percent Leased) is insignificant in
determining whether farmers are willing to harvest crop residue. This implies that
farmers are indifferent between using owned or leased land for biomass removal for
bioenergy feedstocks. In addition, being risk adverse (Risk Avoider) is also insignificant.
This may imply that farmers do not see removing crop residue, under an optimal
contractual agreement, as a risk increasing or decreasing activity.
Table 3 also contains some interesting marginal effects. The marginal effects for
Livestock, Remove Biomass, and CV Till are all negative and statistically significant. This
means that if a farmer owns livestock, removes biomass for other reasons, or uses
conservation tillage, then they would be 11%, 13%, and 15% less likely to harvest crop
residue and sell it to a biorefinery, respectively. However, if a farmer decides they would
allow a custom harvester to harvest the crop residue (Custom Harvester), are willing to
store biomass on farm (Store Biomass), or rely on market information (Rely on Market)
Page 22
20
they would be 28%, 16%, and 8% more likely to harvest their crop residue and sell it to a
biorefinery, respectively.
Dedicated Annual Bioenergy Crop
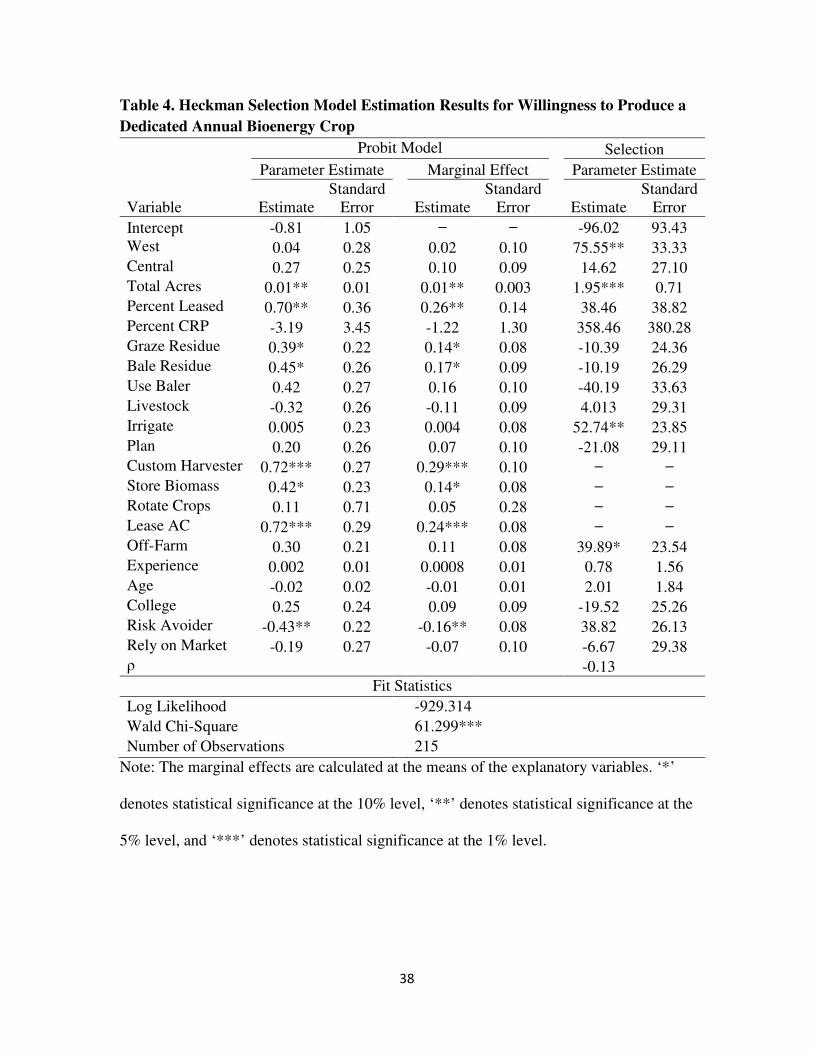
Table 4 reports the results from the Heckman selection model for a dedicated
annual bioenergy crop used to examine the effects of different factors on the likelihood of
producing an annual bioenergy crop and a farmers initial land allocation if they decided
to do so.
The probit model results show that if farmers are willing to grow an annual
bioenergy crop, there are several variables that are statistically significant and positive.
These variables include farm size (Total Acres), percent of land leased (Percent Leased),
grazing of crop residue (Graze Residue), baling of crop residue (Bale Residue), willing to
use a custom harvester (Custom Harvester), willing to store biomass (Store Biomass), and
willing to lease land to grow an annual crop (Lease AC). The more land a farmer
manages, the more willing and able the farmer may be to diversify his or her crop
portfolio. The positive effect of Total Acres on the farmers’ willingness to grow a
dedicated bioenergy crop conflicts with the findings of Jensen et al. (2006) and Paulard
and Laitila (2010). Percent Leased indicates farmers are more likely to produce annual
bioenergy crops if they lease land. This may occur because landlords might show less
resistance to an annual bioenergy crop option that can be grown in rotation with other
cash crops. It is also worth noting that summary statistics show that farms, on average,
typically rent more than half the acres. Graze Residue is positive,
indicating farm managers who have livestock and graze residue are still willing to
produce an annual bioenergy crop because it does not interfere with their grazing regime.
Page 23
21
Farmers who currently bale their residue have more experience using the equipment
required to harvest an annual bioenergy crop, which implies that they do not have to
invest in new equipment for crop harvest. A positive sign on Lease AC follows what
Sherrington, Bartley, and Moran (2008) found, farmers are willing to lease land to
someone else to grow a bioenergy crop.
The only negative and significant variable is Risk Avoider (table 4). This implies
that growing an annual crop has risk involved and someone who is a risk avoider is less
likely to grow the bioenergy crop. No markets for dedicated bioenergy crops currently
exist, making it a highly uncertain and risky decision for farmers, who may be less likely
to adopt an enterprise that increases on-farm risk (Pannell, et al. 2006; Rajagopal, et al.
2007). According to the marginal effects in table 4, if someone is a risk avoider they are
16% less likely to grow a dedicated annual crop.
Percent Leased, Graze Residue, Bale Residue, and Lease AC all have statistically
significant and positive marginal effects (table 4). If the percentage of land leased
increases by 1%, then a farmer would be 0.26% more likely to grow a dedicated annual
bioenergy crop. If a farmer started grazing or baling their residue (Graze Residue and
Bale Residue) they would be 14% and 17% more likely to grow an annual bioenergy crop,
respectively. If a farmer decides they are willing to lease land to someone else for
production of an annual bioenergy crop they are 24% more likely to allow a third party to
grow an annual bioenergy crop.
The mean number of acres farmers are initially willing to plant of a dedicated
annual bioenergy crop is 121.22 acres. This initial allocation is positively and
significantly affected by the variables West, Total Acres, Irrigate, and Off-Farm income
Page 24
22
(table 4). Farmers located in the western part of the state are willing to plant 75.55 more
acres then farmers in the Northeast. This is expected given farms in the western part of
the state are typically larger than farms in the other regions studied. A positive
relationship with Total Acres is also expected. As acreage increases, farmers can reduce
on-farm risk by diversifying their enterprises, which would include growing a bioenergy
crop. As farmers increase their farm size by one acre, they are willing to plant 1.95 more
acres of a dedicated annual bioenergy crop. Farms with irrigation will plant 52.74 more
acres initially than farms that are non-irrigated. Having off-farm income is another way
that farmers are able to reduce their financial risk and buffer any potential loss from
planting an annual bioenergy crop. Farmers with a source of off-farm income, are likely
to plant 39.89 more acres initially than farmers who have no source of off-farm income.
Dedicated Perennial Bioenergy Crop
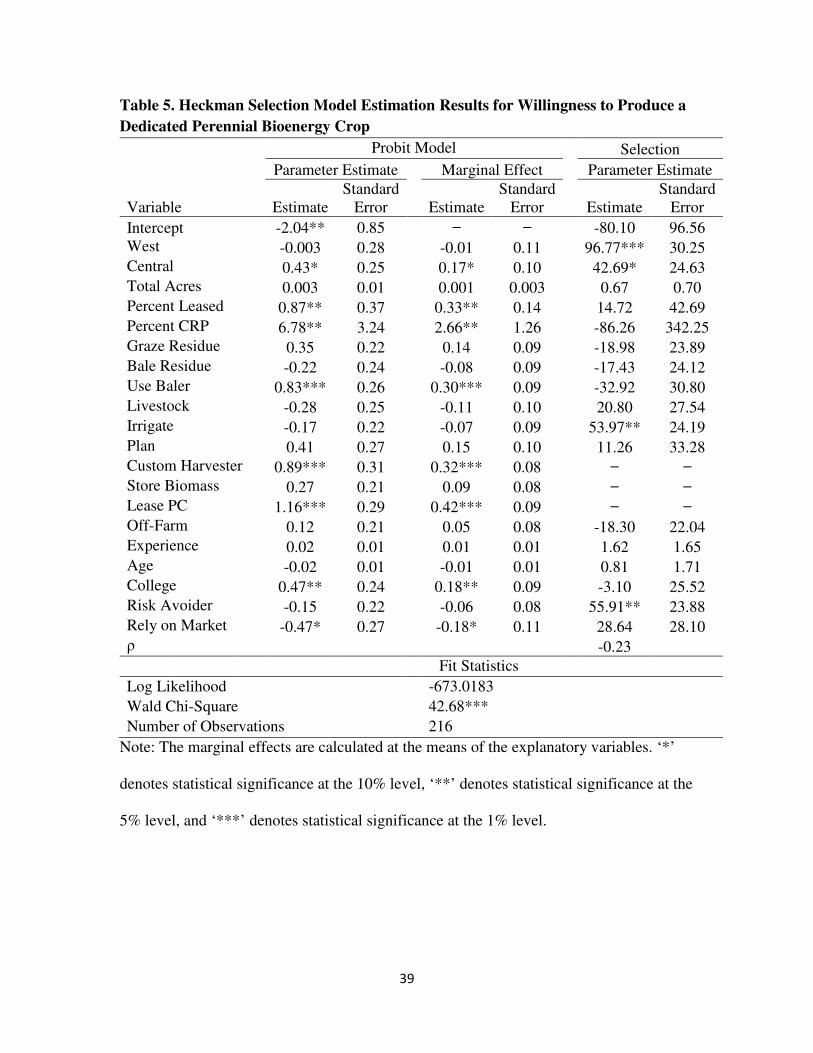
The Heckman selection model results for farmers’ willingness to grow a
dedicated perennial bioenergy crop (e.g. switchgrass) and the initial acreage they are
willing to plant is reported in table 5.
The variables Central, Percent Leased, Percent CRP, Use Baler, Custom
Harvester, Lease PC, and College all have positive effects on willingness to grow and are
statistically significant. Perennial crops, like switchgrass, are viable crops for growing on
marginal land, similar to CRP land. Managers with larger amounts of acres in CRP may
be able to increase their income by growing a perennial bioenergy crop on marginal land
rather than leaving it idle or putting it into CRP. Of course, this will be influenced by
CRP rental rates. Farmers who have used a baler before have the skill set and access to
Page 25
23
the equipment that would be required to harvest the biomass from a perennial bioenergy
crop, implying they would not have to spend the time or money investing in or learning
about new equipment. The positive impact of previously using a baler supports what
Jensen et al. (2006) reported. Jensen et al. (2006) found that college was positive, as well.
Relying on market information has a negative effect on farmers’ willingness to grow a
perennial bioenergy crop option. This implies that market information is currently
informing farmers that growing a perennial bioenergy crop is not advantageous and may
be highly uncertain.
Marginal effects reported in table 5, indicate that if a farmer increases the
percentage of CRP land by 1% the marginal effect of this increase would be that the
farmer is 2.66% more likely to be willing to grow a dedicated perennial bioenergy crop
(table 5). The marginal effects for Use Baler, Custom Harvester, Lease PC, and College
are all positive and statistically significant, as well. If a manager begins using a baler, is
willing to use a custom harvester, is willing to lease their land for production, or if they
are a college graduate, then the farmer would be more likely to grow a dedicated
perennial bioenergy crop by 30%, 32%, 42%, and 18% respectively. However if a farmer
relies heavily on market information to make decisions (Rely on Market), then they are
18% less likely to grow a dedicated perennial bioenergy crop.
The mean number of acres a farmer is willing to plant of a dedicated perennial
bioenergy crop is 97.04. The initial allocation of land a farmer is willing to commit for
the production of a perennial bioenergy crop is positively affected by a number of
variables, including: West, Central, Irrigate, and Risk Avoider (table 5). Farmers located
in the western region are willing to plant 96.77 more acres initially than farmers located
Page 26
24
in the northeast region. Farmers in the central part of the state are willing to plant 42.69
more initial acres than those located in the northeast. A dedicated perennial bioenergy
crop will not likely be planted on irrigated land unless the returns are expected to be
higher than traditionally irrigated crops. An increase of 53.97 acres for farms that have
irrigation could be based on the fact that a perennial crop is an easy crop to plant on the
corners of an irrigated field, which may be marginal land. Risk aversion has an
interesting effect. If a manager is a risk avoider, they are willing to plant 55.91 more
acres initially than someone who is not. This may imply that farmers perceive having
more acres of a perennial crop on marginal lands will reduce their exposure to risk by
providing an economically viable alternative for less productive or marginal lands.
Summary and Conclusions
This paper examines Kansas’ farmers’ willingness to harvest crop residue and
grow dedicated bioenergy crops. Three different types of cellulosic bioenergy crops were
considered. The first type was harvesting of crop residue like corn stover, a value-added
enterprise. The second type was a dedicated annual bioenergy crop like energy or sweet
sorghum. The third type was a dedicated perennial bioenergy crop like switchgrass. The
study data came from in-person interviews conducted in three regions of Kansas. An
expected utility framework was utilized to examine farmers willingness to harvest a crop
residue or grow a bioenergy crop. The corresponding empirical model was estimated as a
probit model. For the two bioenergy crop options, an initial acreage allocation model was
estimated as well. In order to account for the self-selection bias, a Heckman selection
model was used to simultaneously estimate the binary adoption decision and the initial
acreage allocation model.
Page 27
25
The study found that 77% of survey respondents were willing to harvest crop
residue, while 61% were willing to grow an annual bioenergy crop, and 44% of
respondents were willing to grow a perennial bioenergy crop. The survey also revealed
that the average number of initial acres a farmer would be willing to devote to growing an
annual bioenergy crop was 121 acres while they were only willing to devote 97 acres to
growing a perennial bioenergy crop.
We found little consistency between what variables were significant in the three
willingness to produce models. One variable that was consistently positive and
statistically significant between all three models was Custom Harvester. This implies that
in every model if a farmer would allow a custom harvester to harvest their biomass, they
would be more likely to harvest their crop residue or grow a dedicated bioenergy crop.
Storage of biomass (Store Biomass) on-farm was positive in all three models, but only
statistically significant in two of the models. Lease AC and Lease PC were also positive
and statically significant in their respective models. Except for Store Biomass in the
annual crop model, all of the bioenergy custom farming and land use variables were
positive and statistically significant. To our knowledge, these variables have not been
previously examined. They are important variables to consider when considering farmers
willingness to produce bioenergy crops in other parts of the country in conjunction with
favorable contracting options.
In the models that estimated factors affecting the initial acres of bioenergy crop
production, West and Irrigate were positive and statistically significant in both models.
Page 28
26
Inconsistencies between which variables are significant and which are not implies
that farmers are taking into account different things when they are trying to decide if they
would be willing to grow a particular type of cellulosic bioenergy crop. This paper
reveals that farmers are willing to grow cellulosic bioenergy crops under favorable
contract conditions. However, more research needs to be done to determine what those
favorable contract conditions are.
Page 29
27
References
Babcock, Bruce A, Philip W Gassman, Manoj Jha, and Catherine L Kling. Adoption
Subsidies and Environmental Impacts of Alternative Energy Crops. Briefing
Paper 07-BP 50, Center for Agricultural and Rural Development, Iowa State
University, Agricultural Marketing Resource Center, 2007.
Baker, Justin S., and Christopher S Galik. "Policy Options for the Conservation Reserve
Program in a Low-Carbon Economy." Working Paper - Climate Change Policy
Partnership Duke University, 2009.
Bangsund, Dean A, Eric A DeVuyst, and F Larry Leistritz. Evaluation of Breakeven
Farmgate Switchgrass Prices in South Central North Dakota. Agribusiness and
Applied Economics Report No. 632, Dept. of Agribusiness and Applied
Economics, North Dakota State University, 2008.
Blanco-Canqui, Humberto, and R Lal. "Crop Residue Removal Impacts on Soil
Productivity and Environmental Quality." Critical Reviews in Plant Sciences 28,
no. 3 (2009): 139-163.
De La Torre Ugarte, Daniel G, Burton C English, and Kim Jensen. "Sixty Billion Gallons
by 2030: Economic and Agricultural Impacts of Ethanol and Biodiesel
Expansion." American Journal of Agricultural Economics 89, no. 5 (2009): 1290-
1295.
Epplin, Francis M, Christopher D Clark, Roland K Roberts, and Seonghuyk Hwang.
"Challenges to the Development of a Dedicated Energy Crop." American Journal
of Agricultural Economics 89, no. 5 (2007): 1296-1302.
Page 30
28
Fuglie, K O, and D J Bosch. "Economic and Environmental Implications of Soil Nitrogen
Testing: A Switching Regression Analysis." American Journal of Agricultural
Economics 77, no. 4 (1995): 891-900.
Gallagher, Paul W, Mark Dikeman, John Fritz, Eric Wailes, Wayne Gauthier, and Hosein
Shapouri. "Supply and Social Cost Estimates for Biomass from Crop Residues in
the United States." Environmental and Resource Economics 24, no. 2003 (2003):
335-358.
Gallagher, Paul, Mark Dikeman, John Fritz, Eric Wailes, Wayne Gauther, and Hosein
Shapouri. "Biomass from Crop Residues: Cost and Supply Estimates." AER 819,
Washington, D.C.: USDA-Economic Research Service, Office of Energy Policy
and New Uses, 2003.
Gourieroux, C. Econometrics of Qualitative Dependent Variables. Cambridge:
Cambridge University Press, 2000.
Graham, R L, R Nelson, J Sheehan, R D Perlack, and L L Wright. "Current and Potential
U.S. Corn Stover Supplies." Agronomy Journal 99, no. January-February (2007):
1-11.
Graham, Robin L. "An Analysis of the Potential Land Base for Energy Crops in the
Conterminous United States." Biomass and Bioenergy 1994, no. 3 (1994): 175-
189.
Greene, William H. Econometric Analysis. Vol. 6. New Jersey: Pearson Prentice Hall,
2008.
Heckman, J J. "Sample Selection Bias as a Specification Error." Econometrica 47 (1979):
153-161.
Page 31
29
Hess, Richard J, Kevin L Kenney, Christopher T Wright, Robert Perlack, and Anthony
Turhollow. "Corn Stover Availability for Biomass Conversion: Situation
Analysis." Cellulose 16 (2009): 599-619.
Jensen, Kimberly, Christopher D Clark, Pamela Ellis, Burton English, Jamey Menard,
and Marie Walsh. "Farmer Willingness to Grow Switchgrass for Energy
Production." Paper presented at the American Agricultural Economics
Association Annual Meeting, July 23-26. Long Beach, CA, 2006.
Larson, James A, Burton C English, and Lixia He. "Risk and Return for Bioenergy Crops
Under Alternative Contracting Arrangements." Paper presented at the Southern
Agricultural Economics Association Annual Meeting February 2-6. Dallas, 2008.
Larson, James A, Burton C English, Chad Hellwinkel, Daniel G De La Torre Ugarte, and
Marie Walsh. "A Farm-Level Evaluation of Conditions Under Which Farmers
will Supply Biomass Feedstocks for Energy Production." Paper presented at
American Agricultural Economics Association Annual Meeting. Providence, RI,
2005.
Maddala, G S. Limited-Dependent and Qualitative Variables in Econometrics. New York:
Cambridge University Press, 1983.
Mapemba, Lawrence, and Francis M Epplin. "Lignocellulosic Biomass Harvest and
Delivery Cost." Paper presented at the Southern Agricultural Economics
Association Annual Meetings February 14-18. Tulsa, OK, 2004.
McLaughlin, S B, and M E Walsh. "Evaluating Environmental Consequences of
Producing Herbaceous Crops for Bioenergy." Biomass and Bioenergy 10, no. 4
(1996): 317-324.
Page 32
30
McLaughlin, S B, et al. "High-Value Renewable Energy from Prairie Grasses."
Environmental Science and Technology 36, no. 10 (2002): 2122-2129.
National Agricultural Statistics Service. 2007 Census Publication. USDA National
Agricultural Statistics Service, February 3, 2009.
Nelson, R G. "Resource Assessment and Removal Analysis for Corn Stover and Wheat
Straw in the Eastern and Midwestern United States - Rainfall and Wind-Induced
Soil Erosion Methodology." Biomass and Bioenergy 22, no. 5 (2002): 349-363.
Paine, Laura K, et al. "Some Ecological and Socio-Economic Considerations for Biomass
Energy Crop Production." Biomass and Bioenergy 10, no. 4 (1996): 231- 242.
Pannell, D J, G R Marshall, N Barr, A Curtis, F Vanclay, and R Wilkinson.
"Understanding and Promoting Adoption of Conservation Practices by Rural
Landholders." Australian Journal of Experimental Agriculture 46 (2006): 1407-
1424.
Paulrud, Susanne, and Thomas Laitila. "Farmers' Attitudes About Growing Energy Crops:
A Choice Experiment Approach." Biomass and Bioenergy, 2010: 1-10.
Perlack, Robert D, Lynn L Wright, Anthony F Turhollow, Robin L Graham, Bryce J
Stokes, and Donald C Erbach. Biomass as Feedstock for a Bioenergy and
Bioproducts Industry: The Technical Feasibility of a Billion-Ton Annual Supply.
Technical Report, Oak Ridge National Laboratories, 2005.
Perrin, R K, K P Vogel, M Schmer, and R B Mitchell. Farm-Scale Production Cost of
Switchgrass for Biomass. Agronomy-Faculty Publications, Agronomy and
Horticulture Department, University of Nebraska-Lincoln, 2008.
Page 33
31
Propheter, J L, S A Staggenborg, S Wu, and D Wang. "Performance of Annual and
Perennial Biofuel Crops: Yields During the First Two Years." Agronomy Journal
102, no. 2 (2010): 806-814.
Puhani, P A. "The Heckman Correction for Sample Selection and Its Critique." Journal
of Economic Surveys 14 (2000): 53-68.
Rajagopal, D, S E Sexton, D Roland-Holst, and D Zilberman. "Challenge of Biofuel:
Filling the Tank Without Emptying the Stomach?" Environmental Research
Letters, 2007.
Reicosky, D C. "Carbon Sequestration and environmental Benefits of No-Till Systems."
No-Till Farming Systems. Edited by T Goddarard, M Zoebisch, Y Gan, W Ellis, A
Watson and S Sombatpanit. Bangkok, 2008. 43-58.
Sherrington, Chris, Justin Bartley, and Dominic Moran. "Farm-Level Constraints on the
Domestic Supply of Perennial Energy Crops in the UK." Energy Policy 36 (2008):
2504-2512.
StataCorp. Stata Statistical Software: Release 11. College Station, TX: StataCorp LP,
209.
Turhollow, Anthony. "The Economics of Energy Crop Production." Biomass and
Bioenergy 6, no. 3 (1994): 229-241.
U.S. Congress, House of Representatives. Energy Independence and Security Act of 2007.
Title II-Energy Security Through Increased Production of Biofuels; Subtitle A -
Renewable Fuel Standard. Government Printing Office December, 2007.
Page 34
32
U.S. Environmental Protection Agency. Regulatory Announcement: EPA Finalizes 2012
Renewable Fuel Standards. EPA-420-F11-044, U.S. Office of Transportation and
Air Quality December, 2011.
U.S. Environmental Protection Agency. Regulatory Announcement: EPA Finalizes
Regulations for the National Renewable Fuel Standard Program for 2010 and
Beyond. EPA-420-F10-007, U.S. Office of Transportation and Air Quality
December, 2010.
Walsh, Marie E, Daniel G De La Torre Ugarte, Hosein Shapouri, and Stephen P Slinsky.
"Bioenergy Crop Production in the United States." Environmental and Resource
Economics 24 (2003): 313-333.
Wilhelm, W W, Jane M. F. Johnson, Douglas L Karlen, and David T Lightle. "Corn
Stover to Sustain Soil Organic Carbon Further Constrains Biomass Supply."
Agronomy Journal 99 (2007): 1665-1667.
Page 35
33
Figure 1. Table Asking Farmers to Indicated Whether They Would be Willing to
Produce a Bioenergy Crop Under Favorable Contracting Situations, and if so, How
Many Acres They Would Commit to Grow Initially
In the following table, indicate if you would be willing to produce the following types of biofuel feedstocks and how much you would be willing to harvest/plant of that feedstock.
Cellulosic Biofuel
Feedstock Type
Considering you enter
into a favorable contract
with a refinery, would
you produce this biofuel
feedstock on your farm?
(Choose one)
If Yes, what is the
minimum acreage you
would initially be willing
to plant of this bioenergy
crop/feedstock?
(Assume the crop can be
planted on rented lands)
a. Value Added (e.g. crop residue, such as corn stover, wheat straw, etc.)
___ Yes ___ No
b. Annual Crop (e.g. sweet sorghum)
___ Yes ___ No
c. Perennial (e.g. switchgrass, miscanthus, prairie grasses, etc.)
___ Yes ___ No
Page 36
34
Table 1. Comparison of Kansas Farmer Demographics to Survey Respondents
2007 Census of Agriculturea Survey
Age 57.7 years 55.1 years Average size of farm 707 acres 2172 acres Average amount of rented land on farm Average amount of owned land on farm Average amount of permanent pasture land on farm
863 acres
381 acres
398 acres
1271 acres
900 acres
594 acres
Average market value of agricultural products
$219,944 $200,000 to $399,999b
a Source: USDA, National Agricultural Statistics Service, 2007
b Category represents the one chosen with the highest frequency by respondents.
Page 37
35
Table 2. Variable Definitions and Summary Statistics
Variable Description Mean
(Standard Error)a (N=242)
Dependent Variables
VA Equal to “1” if the farmer would be willing to harvest residue from a value added crop, “0” otherwise
.77
AC Equal to “1” if the farmer would be willing to grow an annual bioenergy crop, “0” otherwise
.61
ACIA The initial acreage a farmer would be willing to plant for an annual bioenergy crop (truncated at 0)
121.22 (141.48)
PC Equal to “1” is the farmer would be willing to grow a perennial bioenergy crop, “0” otherwise
.44
PCIA The initial acreage a farmer would be willing to plant for a perennial bioenergy crop (truncated at 0)
97.04 (112.29)
Farm Characteristics
West Equal to “1” if the farm is located in the western region of Kansas, “0” otherwise
.33
Central Equal to “1” if the farm is located in the central region of Kansas, “0” otherwise
.33
Total Acres Total number of acres the farmer operates (000s of acres)
21.72 (16.97)
Percent Leased Fraction of total acreage that is leased .58 (.32)
Percent CRP Fraction of total acreage that is enrolled in CRP .01 (.03)
Farm Practices
Graze Residue Equal to “1” if the farmer grazes the residue, “0” otherwise
.50
Bale Residue Equal to “1” if the farmer bales the residue, “0” otherwise
.30
Use Baler Equal to “1” if the farmer currently uses a baler, “0” otherwise
.59
Livestock Equal to “1” if the farmer owns livestock, “0” otherwise
.60
Irrigate Equal to “1” if any crop is irrigated, “0” otherwise .33 Plan Equal to “1” if the farm has a conservation plan,
“0” otherwise .82
Remove Biomass Equal to “1” if the farmer removes any biomass, “0” otherwise
.87
Rotate Crops Equal to “1” if the farmer rotates the crops, “0” otherwise
.98
CV Till Equal to “1” if the farmer uses conservation tillage practices on corn, sorghum and/or wheat, “0” otherwise
.92
Page 38
36
Table 2. Variable Definitions and Summary Statistics (continued)
Variable Description Mean
(Standard Error)a (N=242)
Bioenergy Custom Farming and Land Use
Custom Harvester Equal to “1” if the farmer would allow a biorefinery to hire a custom harvester to harvest the biomass, “0” otherwise
.83
Store Biomass Equal to “1” if the farmer would be willing to store biomass bales on farm for more than 6 months, “0” otherwise
.59
Lease AC Equal to “1” if the farmer would be willing to lease their land to someone to grow an annual bioenergy crop, “0” otherwise
.17
Lease PC Equal to “1” if the farmer would be willing to lease their land to someone to grow a perennial bioenergy crop, “0” otherwise
.15
Farm Manager Characteristics
Off-Farm Equal to “1” if any member of the household brings home off-farm income, “0” otherwise
.53
Experience The number of years the farmer has operated the farm
33.77 (12.65)
Age Famers age 55.12 (11.72)
College Equal to “1” if the farmer graduated from college, “0” otherwise
.31
Risk Avoider Equal to “1” if farmer avoids taking risks, “0” otherwise
.38
Rely on Market Equal to “1” is the farmer relies on market information to make decisions, “0” otherwise
.82
a Standard Errors are only provided for continuous variates. The standard error for a
binary is equal to the square root of p(1-p), where p is the mean of the response or
probability that the varaite is equal to 1.
Page 39
37
Table 3. Probit Model Estimation Results for Crop Residue
Parameters Marginal Effects
Variable Estimate Standard
Error
Estimate Standard
Error
Intercept 0.79 1.24 ̶ ̶ West -1.15*** 0.32 -0.33* 0.001 Central -0.28 0.31 -0.07* 0.39 Total Acres 0.01 0.01 0.001*** 0.42 Percent Leased -0.08 0.39 -0.02* 0.84 Percent CRP 4.68 3.74 1.17 0.21 Graze Residue 0.12 0.25 0.03* 0.64 Bale Residue 0.34 0.29 0.08* 0.21 Use Baler 0.14 0.30 0.04* 0.63 Livestock -0.45* 0.28 -0.11* 0.08 Irrigate 0.47* 0.25 0.11** 0.04 Plan -0.07 0.32 -0.02* 0.83 Remove Biomass -0.66* 0.39 -0.13* 0.02 Custom Harvester 0.89*** 0.27 0.28* 0.004 Store Biomass 0.59*** 0.22 0.16* 0.01 Rotate Crops 0.94 0.67 0.32 0.23 CV Till -0.94* 0.59 -0.15** 0.003 Off-Farm 0.50** 0.22 0.13* 0.03 Experience 0.01 0.01 0.003*** 0.35 Age -0.02 0.01 -0.005*** 0.19 College -0.09 0.24 -0.02* 0.70 Risk Avoider 0.06 0.24 0.01* 0.82 Rely on Market 0.29 0.28 0.08* 0.35
Fit Statistics
Log likelihood -96.80943 McFadden R-Squared .2404 Number of Observations 238
Note: The marginal effects are calculated at the means of the explanatory variables. ‘*’
denotes statistical significance at the 10% level, ‘**’ denotes statistical significance at the
5% level, and ‘***’ denotes statistical significance at the 1% level.
Page 40
38
Table 4. Heckman Selection Model Estimation Results for Willingness to Produce a
Dedicated Annual Bioenergy Crop
Probit Model Selection
Parameter Estimate Marginal Effect Parameter Estimate
Variable Estimate Standard
Error
Estimate Standard
Error
Estimate Standard
Error
Intercept -0.81 1.05 ̶ ̶ -96.02 93.43 West 0.04 0.28 0.02 0.10 75.55** 33.33 Central 0.27 0.25 0.10 0.09 14.62 27.10 Total Acres 0.01** 0.01 0.01** 0.003 1.95*** 0.71 Percent Leased 0.70** 0.36 0.26** 0.14 38.46 38.82 Percent CRP -3.19 3.45 -1.22 1.30 358.46 380.28 Graze Residue 0.39* 0.22 0.14* 0.08 -10.39 24.36 Bale Residue 0.45* 0.26 0.17* 0.09 -10.19 26.29 Use Baler 0.42 0.27 0.16 0.10 -40.19 33.63 Livestock -0.32 0.26 -0.11 0.09 4.013 29.31 Irrigate 0.005 0.23 0.004 0.08 52.74** 23.85 Plan 0.20 0.26 0.07 0.10 -21.08 29.11 Custom Harvester 0.72*** 0.27 0.29*** 0.10 ̶ ̶ Store Biomass 0.42* 0.23 0.14* 0.08 ̶ ̶ Rotate Crops 0.11 0.71 0.05 0.28 ̶ ̶ Lease AC 0.72*** 0.29 0.24*** 0.08 ̶ ̶ Off-Farm 0.30 0.21 0.11 0.08 39.89* 23.54 Experience 0.002 0.01 0.0008 0.01 0.78 1.56 Age -0.02 0.02 -0.01 0.01 2.01 1.84 College 0.25 0.24 0.09 0.09 -19.52 25.26 Risk Avoider -0.43** 0.22 -0.16** 0.08 38.82 26.13 Rely on Market -0.19 0.27 -0.07 0.10 -6.67 29.38 ρ -0.13
Fit Statistics
Log Likelihood -929.314
Wald Chi-Square 61.299***
Number of Observations 215
Note: The marginal effects are calculated at the means of the explanatory variables. ‘*’
denotes statistical significance at the 10% level, ‘**’ denotes statistical significance at the
5% level, and ‘***’ denotes statistical significance at the 1% level.
Page 41
39
Table 5. Heckman Selection Model Estimation Results for Willingness to Produce a
Dedicated Perennial Bioenergy Crop
Probit Model Selection
Parameter Estimate Marginal Effect Parameter Estimate
Variable Estimate Standard
Error
Estimate Standard
Error
Estimate Standard
Error
Intercept -2.04** 0.85 ̶ ̶ -80.10 96.56 West -0.003 0.28 -0.01 0.11 96.77*** 30.25 Central 0.43* 0.25 0.17* 0.10 42.69* 24.63 Total Acres 0.003 0.01 0.001 0.003 0.67 0.70 Percent Leased 0.87** 0.37 0.33** 0.14 14.72 42.69 Percent CRP 6.78** 3.24 2.66** 1.26 -86.26 342.25 Graze Residue 0.35 0.22 0.14 0.09 -18.98 23.89 Bale Residue -0.22 0.24 -0.08 0.09 -17.43 24.12 Use Baler 0.83*** 0.26 0.30*** 0.09 -32.92 30.80 Livestock -0.28 0.25 -0.11 0.10 20.80 27.54 Irrigate -0.17 0.22 -0.07 0.09 53.97** 24.19 Plan 0.41 0.27 0.15 0.10 11.26 33.28 Custom Harvester 0.89*** 0.31 0.32*** 0.08 ̶ ̶ Store Biomass 0.27 0.21 0.09 0.08 ̶ ̶ Lease PC 1.16*** 0.29 0.42*** 0.09 ̶ ̶ Off-Farm 0.12 0.21 0.05 0.08 -18.30 22.04 Experience 0.02 0.01 0.01 0.01 1.62 1.65 Age -0.02 0.01 -0.01 0.01 0.81 1.71 College 0.47** 0.24 0.18** 0.09 -3.10 25.52 Risk Avoider -0.15 0.22 -0.06 0.08 55.91** 23.88 Rely on Market -0.47* 0.27 -0.18* 0.11 28.64 28.10 ρ -0.23
Fit Statistics
Log Likelihood -673.0183
Wald Chi-Square 42.68***
Number of Observations 216
Note: The marginal effects are calculated at the means of the explanatory variables. ‘*’
denotes statistical significance at the 10% level, ‘**’ denotes statistical significance at the
5% level, and ‘***’ denotes statistical significance at the 1% level.