Defence Research and Development Canada Recherche et de ´ veloppement pour la de ´ fense Canada Determining Fleet Size for a Modernized Canadian Maritime Patrol Aircraft Sean Bourdon Matthew R. MacLeod Rick McCourt Prepared for: Directorate of Aerospace Requirements Defence Research and Development Canada Scientific Report DRDC-RDDC-2014-R2 February 2014 This report is not a statement of endorsement of its contents by the Department of National Defence of Canada or Her Majesty the Queen in right of Canada.
Transcript
Defence Research andDevelopment Canada
Recherche et developpementpour la defense Canada
Determining Fleet Size for a Modernized Canadian MaritimePatrol Aircraft
Sean BourdonMatthew R. MacLeodRick McCourt
Prepared for:
Directorate of Aerospace Requirements
Defence Research and Development Canada
Scientific ReportDRDC-RDDC-2014-R2February 2014
This report is not a statement of endorsement of its contents by the Department of National Defence of Canada or Her Majesty the Queen in right of Canada.
Determining Fleet Size for a Modernized CanadianMaritime Patrol Aircraft
Sean BourdonMatthew R. MacLeodRick McCourt
Prepared for:
Directorate of Aerospace Requirements
This report is not a statement of endorsement of its contents by the Department of National Defence of Canada orHer Majesty the Queen in right of Canada.
Defence Research and Development CanadaScientific ReportDRDC-RDDC-2014-R2February 2014
The Canada First Defence Strategy announced that the CP-140 Aurora, Canada’s long-range maritime patrol aircraft, will be replaced by a fleet of Canadian Multi-Mission Air-craft (CMA). This report details analyses provided in support of developing requirementson speed, endurance, and fleet size to enable the CMA to fulfill surveillance and patrolmissions. The analysis was repeated to determine the number of Auroras that would re-quire modernization if the acquisition of the CMA were to be delayed, as was announcedin February 2014.
Significance for defence and security
Given the serviceability/operational availability rates expected for a new aircraft, theCanada First Defence Strategy’s proposed fleet size for CMA of 10 to 12 appears to bea bare minimum for sustaining surveillance on two coasts simultaneously. It is recom-mended that if the CP-140 is modernized at least 14 should be maintained to meet thesurveillance requirements as described in this study, a course of action that was followedby the Government of Canada with the announcement in February 2014 that the lifespanof 14 CP-140 would be extended. Finally, it is strongly recommended to define the speedand endurance requirements for the CMA as a trade-off curve, as setting hard minima onboth would overly restrict the potential options.
DRDC-RDDC-2014-R2 i
Résumé
La Stratégie de défense Le Canada d’abord prévoyait le remplacement du CP-140 Aurora,l’aéronef de patrouille maritime à long rayon d’action des Forces canadiennes, par une flotted’avions multi mission canadiens (CMA). Ce rapport fournit une description détaillé desanalyses appuyant l’établissement de critères comme la vitesse, l’endurance et la taille dela flotte pour permettre au CMA de remplir ses missions de surveillance et de patrouille.On a procédé à une nouvelle analyse afin de déterminer le nombre d’avions Aurora quinécessiteraient une mise à jour si on devait retarder l’acquisition des CMA, comme onl’annonçait en février 2014.
Importance pour la défense et la sécurité
Compte tenu du taux de bon fonctionnement/disponibilité opérationnelle auquel on est endroit de s’attendre de la part d’un nouvel aéronef, une flotte de 10 à 12 constituerait le strictminimum pour assurer la surveillance simultanée des deux côtes selon la Stratégie de défenseLe Canada d’abord. Si on procède à la mise à jour du CP-140, cette étude conclue qu’il enfaudra au moins 14 pour satisfaire aux critères de surveillance énoncés. C’est l’option que legouvernement du Canada privilégie dans sa décision annoncée en février 2014 de prolongerla durée de vie de 14 CP-140. Enfin, l’utilisation d’une courbe d’arbitrage afin de déterminerles critères de vitesse et d’endurance du CMA est fortement recommandée, car en fixant unminimum absolu à ces deux critères les options envisageables seraient restreintes.
Special thanks are due to Maj Bob Trerice and Maj Pete Burrell for their initial supportand guidance in defining the work, and in shepherding the results up their chain of com-mand. The authors would like to acknowledge their current clients (the Canadian ForcesMaritime Warfare Centre, Director General Naval Force Development and the CanadianForces Warfare Centre) for allowing them the time to complete the formal write-up of thiswork. Alex Bourque and Andrew Wind provided valuable feedback which improved thefinal version of the report.
vi DRDC-RDDC-2014-R2
1 Introduction
The Canada First Defence Strategy (CFDS) provides a roadmap for the modernizationof the Canadian Armed Forces (CAF) [1]. An important part of this effort consists of arecapitalization of several key pieces of equipment that deliver capability directly to theCanadian warfighter. Among the platforms slated for replacement is Canada’s long-rangeMaritime Patrol Aircraft (MPA), the CP-140 Aurora. The Canadian Multi-Mission Aircraft(CMA) is the name being used to designate this follow-on capability, with a projected fleetsize of 10 to 12 aircraft [1].
The Directorate of Aerospace Requirements (DAR) is responsible for writing a Statement ofOperational Requirement (SOR) which outlines the specifications that the CMA must fulfillin order to provide sufficient capability to enable the aircraft to accomplish its intendedmission set. DAR requested the assistance of the Directorate of Air Staff OperationalResearch (DASOR) in setting some of these requirements on a more rigorous analyticalfooting. Specifically, DAR is interested in establishing performance benchmarks to enablesurveillance and patrol missions for, e.g., Anti-Submarine Warfare (ASW) and Anti-SurfaceWarfare (ASuW). During the course of the study, interest also arose in modernizing theCP-140 Aurora as a stop-gap for acquiring a new aircraft; this course of action was in facttaken by the Government of Canada in February 2014 as this report was in the final stagesof editing [2]. This document provides the analytical background for the advice previouslydelivered and briefed in support of these two decisions [3, 4].
1.1 Problem statement
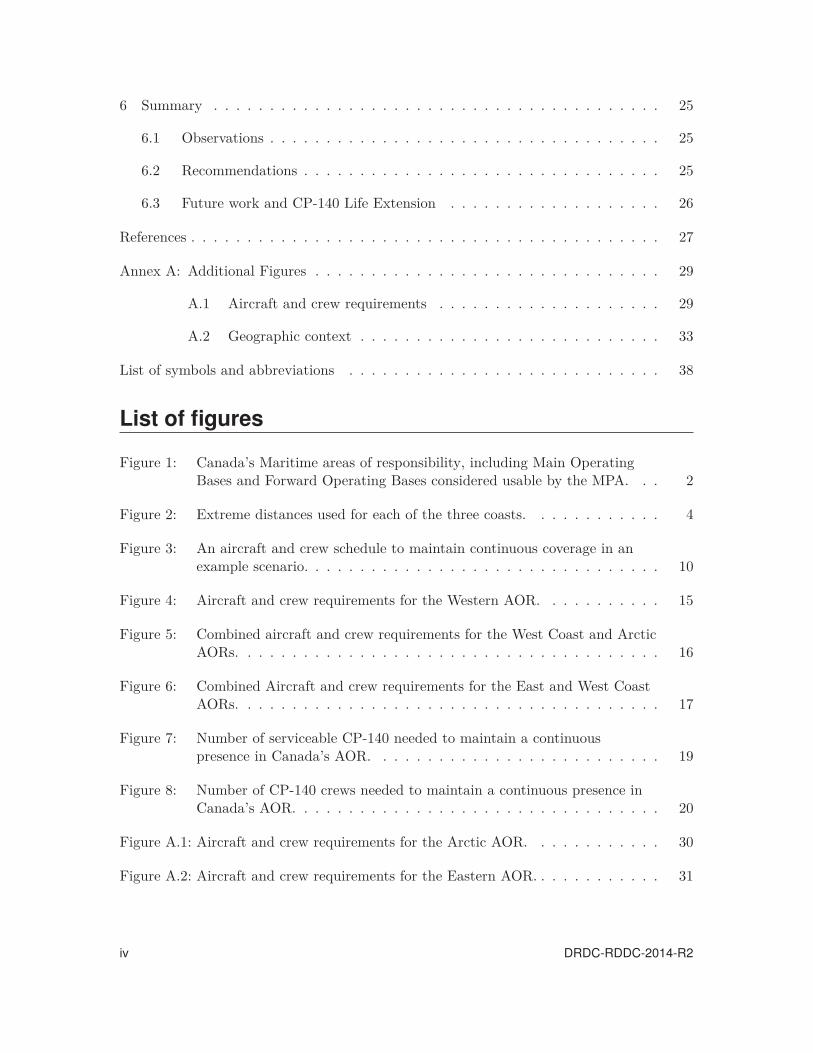
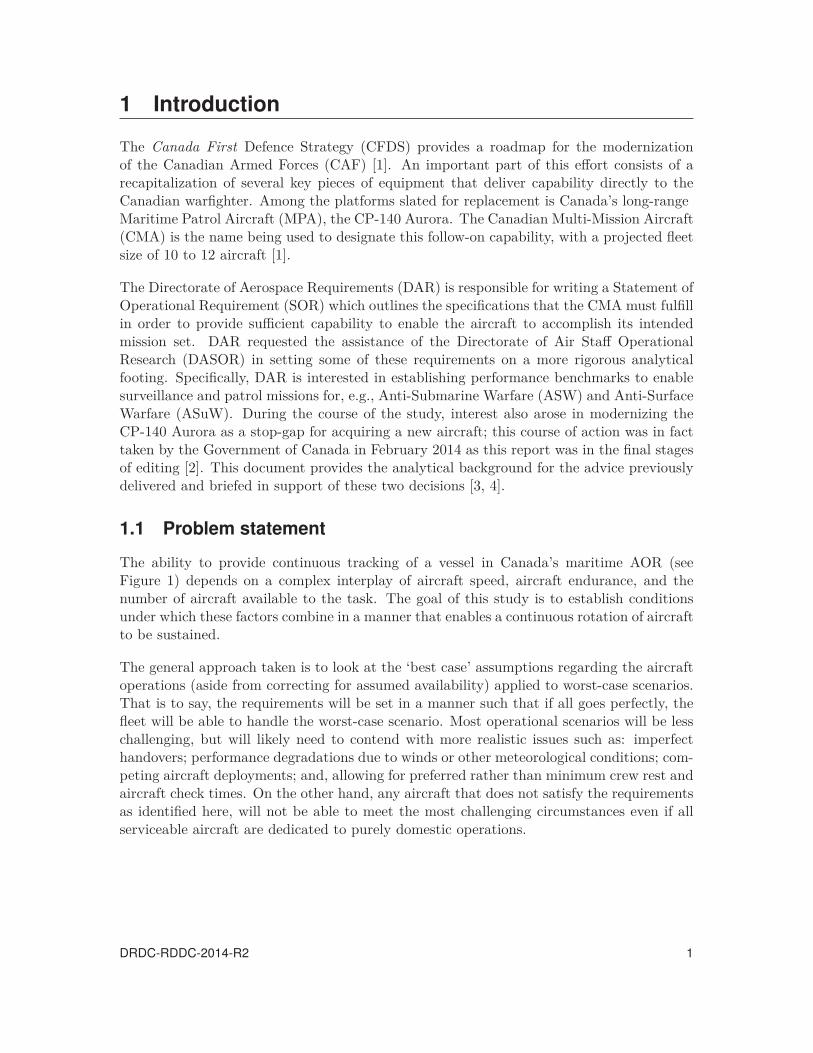
The ability to provide continuous tracking of a vessel in Canada’s maritime AOR (seeFigure 1) depends on a complex interplay of aircraft speed, aircraft endurance, and thenumber of aircraft available to the task. The goal of this study is to establish conditionsunder which these factors combine in a manner that enables a continuous rotation of aircraftto be sustained.
The general approach taken is to look at the ‘best case’ assumptions regarding the aircraftoperations (aside from correcting for assumed availability) applied to worst-case scenarios.That is to say, the requirements will be set in a manner such that if all goes perfectly, thefleet will be able to handle the worst-case scenario. Most operational scenarios will be lesschallenging, but will likely need to contend with more realistic issues such as: imperfecthandovers; performance degradations due to winds or other meteorological conditions; com-peting aircraft deployments; and, allowing for preferred rather than minimum crew rest andaircraft check times. On the other hand, any aircraft that does not satisfy the requirementsas identified here, will not be able to meet the most challenging circumstances even if allserviceable aircraft are dedicated to purely domestic operations.
DRDC-RDDC-2014-R2 1
Yel
low
knife
Iqal
uit
St.
John
’s
Gre
enw
ood
Com
ox 16
0 W
140
W
120
W
100
W
80
W
60
W
40
W
20 W
40
N
60
N
80
N
Figu
re1:
Can
ada’
sM
arit
ime
area
sof
resp
onsi
bilit
y,in
clud
ing
Mai
nO
pera
ting
Bas
esan
dFo
rwar
dO
pera
ting
Bas
esco
nsid
ered
usab
leby
the
MPA
.
2 DRDC-RDDC-2014-R2
2 Assumptions and background
The plain language problem stated in the introduction is constrained both by externalfactors – e.g., the maximum crew day allowed for air crew, the size and shape of Canada’sAOR – and by the objectives specified by the requirement developers. These foundationalassumptions are described immediately below. The following subsection then derives somefurther implications that result from those assumptions and givens, which are fundamentalto the approach taken to analyzing the problem.
2.1 Assumptions and givens
In order to render the analysis tractable within the allotted timeframe,1 several assumptionswere necessary. Some of these were made solely to limit the number of options underconsideration, while others were used to simplify the problem space. Many of these weregiven by the client. The most significant of these assumptions and givens are:
1. The remit from DAR was to look at the number of aircraft required to sustain con-tinuous coverage of (i.e., to track) a vessel moving through one or more AORs.
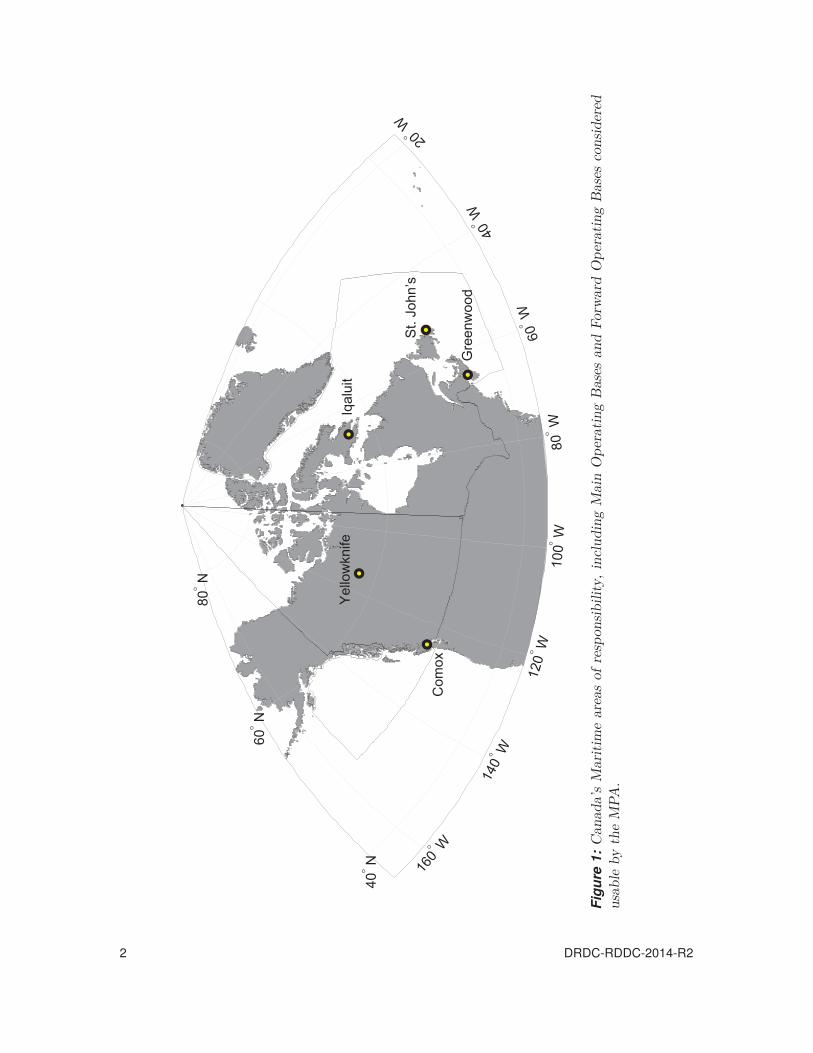
2. The mission always takes place entirely within Canada’s maritime AOR, as shown inFigure 1. A vessel transiting this zone at regular speeds may easily spend many dayswithin the AOR (see Table 1 and Figure 2(a)).
3. Vessels of interest are under no obligation to transit the zone of surveillance with anyparticular haste, and may even hold their position for extended periods. All countrieshave freedom of navigation in the Exclusive Economic Zone (EEZ), and the AORbeing considered extends well beyond into purely international waters.
4. Handover of surveillance from one on-station aircraft to the next can happen duringthe transit of the incoming aircraft.
5. Fuel consumption is close to uniform throughout all phases of flight. This means thanan hour of transit time can be traded off against an hour on station.2 This assumptionwas found to be reasonable when checked against aircraft performance models in asimilar study done in Australia [5].
1The initial analysis was undertaken over the course of several weeks, specifically for the CMA. The anal-ysis was extended over the course of the following year, as assumptions were tweaked and the modernizationof CP-140 also entered as a possibility.
2In particular, on the flight to and from the surveillance area, the aircraft is assumed to fly at optimalcruising altitude and speed. Given the relatively slow speed of the vessels they are assumed to be surveilling,it is further assumed that once on station they can fly at an optimal speed for whatever altitude from whichthey must observe. It would be difficult to refine this assumption without dealing with specific aircraftperformance characteristics, which would be more appropriate during the development of acquisition criteria.
DRDC-RDDC-2014-R2 3
1145 nmi
1224 nmi
1084 nmi
160 W
140 W
120 W 100 W 80 W
60 W
40 W
20 W
40 N
60 N
80 N
(a) Sample challenging transit paths through the Canadian AOR.
1178 nmi
1146 nmi848 nmi
539 nmi
887 nmi
302 nmi
960 nmi
832 nmi849 nmi
591 nmi
160 W
140 W
120 W 100 W 80 W
60 W
40 W
20 W
40 N
60 N
80 N
(b) Distances to extreme points in the Canadian AOR.
Figure 2: Extreme distances used for each of the three coasts.
4 DRDC-RDDC-2014-R2
Table 1: Potential transit times through the Canadian AOR (see Figure 2(a)).
6. All flight operations occur under no wind conditions. This eliminates the need toevaluate the complex effects on cruise altitude and aircraft endurance that are inducedwith the introduction of winds. Under more realistic flight conditions, pilots can adjusttheir speed and altitude in an effort to optimize their flight plans based on factorssuch as aircraft endurance or fuel consumption. Regardless, it is possible to definefuel reserves in a way that allows the pilot to achieve desired flight performance inthe face of unfavourable weather conditions, including winds, provided these are notunrealistically extreme in nature.
7. In addition to the two Main Operating Bases (MOBs) in Comox, BC and Greenwood,NS, the aircraft and their crews can avail themselves of three Forward OperatingBases (FOBs): Iqaluit, NU; St. John’s, NL; and Yellowknife, NT (see Figure 1). All ofthese bases can be used indefinitely to support operations within the AOR. Handoverissues (including recovery at a different site) in which the Vessel of Interest (VOI)moves closer to a different FOB are not considered.
8. Solutions with more than 16 crews were considered inadmissible by DAR.
9. DAR requested that 50% of the aircraft be considered serviceable at any given timewhen calculating overall fleet size for the CP-140 Aurora and 70% for the CMA(the subtly different term ‘operational availability’ was used for the CMA – theseterms will be applied to the two fleets as needed). Section 3.4 will expand on thisassumption. It is further assumed that in the demanding conditions considered here –i.e., maintaining continuous coverage on two of Canada’s coasts – any aircraft allocatedto an operational training unit would be reallocated to meet the demand.
2.2 Implications
The assumptions and givens above have several important consequences, specifically:
1. Due to Assumption 1, a probabilistic, reconnaissance type approach (see e.g., [6, 7])to coverage was not appropriate.
2. Due to Assumptions 2 and 3, the patrol aircraft must be able to maintain a continuoushandover essentially indefinitely, potentially at a worst-case point in the AOR. Theanalysis will therefore consider the number of aircraft and crews needed to maintain
DRDC-RDDC-2014-R2 5
continuous surveillance at these points in steady-state. In this manner, the results ob-tained herein are mission-agnostic; in other words they apply to any mission wherebya continuous on-station presence is required at an arbitrary point in the AOR. Thisobviates the need to search for optimal rostering over a set of possible missions (seee.g., [8]), as a closed form solution can be calculated. The worst-case distances usedare as shown in Figure 2(b). Notably, the distances used for the West and East coastsare those to the furthest point in the AOR (making the analysis independent of thesample paths), whereas for the Arctic the distance used is the worst-case point onthe sample path. The Subject Matter Experts (SMEs) did not judge coverage to theextreme Northern point of the Arctic AOR to be reasonable, so instead the furthestpoint on the most northerly of the various ‘North West Passage’ routes likely to betaken by a vessel was used.
3. Similarly, the requirement to maintain a steady-state operation over days or weeks im-plied by Assumptions 2 and 3 makes it impractical to consider in detail the schedulingimplications of using alternate landing sites (see [7] for an example of this schedulingproblem). Although the use of FOBs is considered, it is tacitly assumed that the en-tire force (aircraft and crews) conducting the surveillance is operating from whicheverbase is optimal for a given point.
4. Due to Assumption 3, it cannot be assumed that the track of the vessel of interestwill be known. Therefore, it is not in general appropriate to try to optimize the patrolschedule for a specific pathway (as in, e.g., [5, 9, 10]). It is assumed simply that thefirst aircraft will have sufficient cueing to be able to fly out to meet the vessel at ornear its entry to the AOR, and further aircraft can only plan to rendezvous with theaircraft already on station.
5. Due to Assumption 4, it can be assumed that exactly one aircraft is ‘on-station’ atany time – i.e., a buffer does not need to be added to the time-on-station to allow forhandover.
6 DRDC-RDDC-2014-R2
3 Method
This section will describe the calculations used to develop the results in the following sec-tion. Although the calculations themselves are relatively straightforward, care must betaken to ensure the definitions of the terms are clear. The main complicating factor is therequirement that the number of aircraft be integer on each coast. The form of the equationsare very similar to those developed in a recent Australian study, although they were onlyapplied to aircraft [5, 11].
3.1 Definitions
Endurance (E) – is the time that an aircraft can remain airborne. Specifically, it isassumed that the aircraft will be flown as close as possible to its most fuel efficientspeed and altitude both in transit and when orbiting on station, in order to maximizeendurance; given an assumed equal fuel flow in both circumstances, this can thenbe treated simply as the time the engine can be run. Although in reality this isdependent on a number of factors such as cruising altitude, the speed at which theaircraft is flown, aircraft loading, and environmental factors, it is assumed that thiscan be reasonably approximated by a constant value (see Assumption 5).
Speed (S) – is the average ground speed at which the aircraft can most efficiently transit,which for simplicity is assumed to be the same as the average airspeed an aircraft canmaintain. This is in reality quite variable due to winds and other factors.
Distance (D) – is the distance to the point to be surveilled.
Transit Time (TT ) – is the time the aircraft spends flying to the location being surveilledfrom its base. It is assumed that this is equal to the time spent returning from thepoint to its base (see Implication 3). It is assumed the aircraft will fly at its mostefficient altitude and speed.
Time on Station (TOS) – is the time an aircraft spends surveilling a given location. Itis assumed that the aircraft will fly at the most efficient speed for the altitude it mustmaintain to effectively conduct surveillance (see Assumption 5). TOSD is the timeon station an aircraft can maintain at distance D from its base.
Cycle Time (CT ) or Turn-around Time – is the time needed for the aircraft or crewto be mission ready again after having completed a sortie. Note that these willgenerally be different lengths for crew, meaning that crews will not necessarily remainpaired with a specific aircraft in each cycle. Cycle time – crew (CT crew) and Cycletime – aircraft (CT ac) will be used to disambiguate as necessary.
DRDC-RDDC-2014-R2 7
3.2 Endurance calculations
Given Assumption 5 that the fuel flow is the same while on station as it is during transit,the endurance of the aircraft can be stated as:
E = 2 × TT + TOSD =2D
S+ TOSD, (1)
from which it can easily be seen that:
TOSD2 = TOSD1 +2(D1 − D2)
S(2)
for two different distances D1 and D2.
Equation 2 can be used to convert the maximum estimated TOS at one distance to anotherfor the same aircraft. This was judged to be useful to the client, as many aircraft designedfor this mission report their range and endurance as being capable of maintaining x hoursof on-station time at a range of y nmi, where y is not necessarily one of the distances ofinterest for this study. In particular, DAR was often interested in knowing the effectiveTOS at 1000 nmi.
3.3 Crew and aircraft calculations
Recall that multiple aircraft are being used to form a continuous rotation at a given locationof interest. The amount of time it takes for an aircraft to complete one cycle through therotation is simply 2 × TT + TOS + CT , that is the sum of the time spent in transit to andfrom the location or vessel of interest, the time spent on station, and the turn-around time.By considering the time between that aircraft leaving the scene and returning, the numberof additional aircraft n that are sufficient to provide continuous surveillance must satisfy:
n × TOS ≥ 2 × TT + CT. (3)
That is to say n additional aircraft must each provide a block of coverage of length TOS,to allow time for the original aircraft to return to the station point without allowing a gapin coverage. The overall cycle can then repeat.
From this last equation, it is easy to see that N , the minimum number of aircraft requiredto maintain continuous coverage, is simply equal to n + 1 and must therefore be the lowestinteger that satisfies:
N ≥ 2 × TT + CT
TOS+ 1, (4)
which is to sayN =
⌈2 × TT + CT
TOS
⌉+ 1, (5)
where �·� denotes rounding up to the nearest whole number. As mentioned above, thedefinition of cycle time is different for the aircraft and the crew, and the calculations foreach will be elaborated separately below. Notwithstanding this, the calculation for both
8 DRDC-RDDC-2014-R2
the number of crews and the number of aircraft needed to maintain continuous coveragetakes the same general form; the crew must spend the same time in all the phases offlight as the aircraft and so those factors remain the same, but the crew will generally takelonger to be ready to fly again than the aircraft, necessitating more crews than aircraft.Structuring both requirements around expected transit time and time on station ensuresthat the calculations do not consider crew changeovers in mid-flight.
The relevant reference for determining CT crew is the 1 Canadian Air Division Orders:Volume 2: Flying Orders [12], which states:
Crew Rest – A minimum of 12 hours of rest must be taken between crew days. For crewdays exceeding 14 hours a minimum of 14 hours of crew rest should be attained. Atemporary period of lower rest may be declared, although in no case should it belower than 8 hours.
Brief/Debrief – Duty time commences either two hours before planned departure time,or at brief time. Duty time ends approximately one hour after arrival.
Noting the ‘should’ in the 14 hour crew rest requirement, a minimum of 15 hours of timebetween landing and take-off was used: accounting for a fixed one-hour value for the debrief,the minimum 12 hour rest period,3 and a two-hour pre-flight brief (i.e., CT crew= 15).
The Flying Orders further state that “the maximum Crew Duty Day shall be 18 hours andthe maximum planned itinerary time shall be 14 hours. Planned itinerary times should notnormally exceed 12 hours” [12]. Allowing that the scenarios contemplated herein would notbe ‘normal,’ 14 hours is considered to be the maximum itinerary for the crew on each sortie:which necessarily implies that aircraft endurance of greater than 14 hours is irrelevant.
SME guidance was relied upon to approximate CT ac, and includes:
A-check – The ‘after’ check performed on return of the aircraft. Estimated to last twohours.
B-check – The ‘before’ check performed prior to pre-flight. Estimated to last two hours.
Pre-flight – The pre-flight work-up of the aircraft. Estimated to last two hours.
Of note, whether these periods occur ‘before’ or ‘after’ each flight is essentially irrelevant;they must all happen once between two consecutive flights to achieve minimum turn-around,for an overall estimate of six hours (i.e., CT ac= 6).
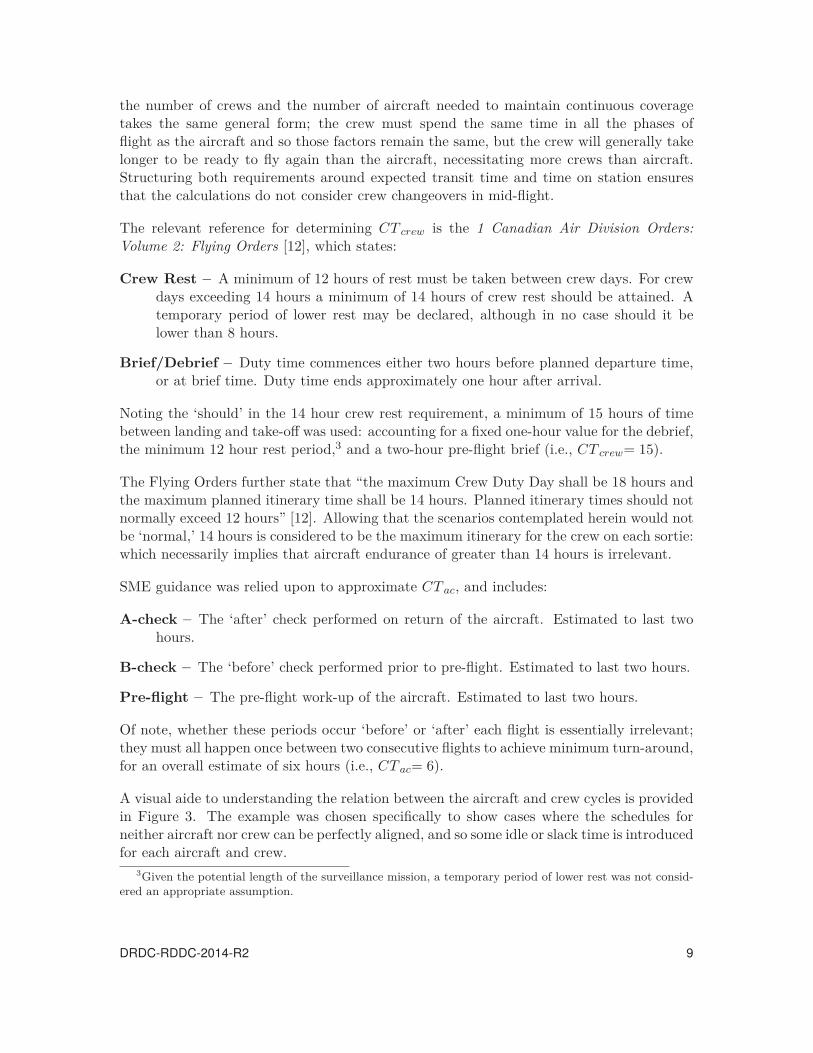
A visual aide to understanding the relation between the aircraft and crew cycles is providedin Figure 3. The example was chosen specifically to show cases where the schedules forneither aircraft nor crew can be perfectly aligned, and so some idle or slack time is introducedfor each aircraft and crew.
3Given the potential length of the surveillance mission, a temporary period of lower rest was not consid-ered an appropriate assumption.
DRDC-RDDC-2014-R2 9
Crew
1
Crew
2
Crew
3
Crew
4
Crew
5
Airc
raft
1
Airc
raft
2
Airc
raft
3
Hour
s
Pre-
Brie
f / D
ebrie
f
Pre-
/ Po
st-C
heck
Tran
sit
On
Stat
ion
Crew
Res
t
Idle
Figu
re3:
An
airc
raft
and
crew
sche
dule
tom
aint
ain
cont
inuo
usco
vera
gein
anex
ampl
esc
enar
io.
10 DRDC-RDDC-2014-R2
One can see that in order to be able to replace Aircraft 1 on station, Aircraft 3 must startits pre-check before Aircraft 2 has completed its post-check; i.e., two aircraft would beinsufficient to achieve continuous coverage in this scenario. Similarly, Crew 1 is still in itsrest period when Crew 5 must start pre-briefing in time to be on station to relieve Crew 4,and so four crews would be insufficient. We can also see that due to CT crew being two anda half times longer than CT ac, more crews than aircraft will generally be necessary, andcrews will not normally be paired with a specific aircraft in the cycle.
3.4 A note on serviceability
As noted in Assumption 9, the authors were asked to assume a serviceability rate of 50 %for a modernized Aurora fleet and 70 % for the CMA.4 A simplistic viewpoint of theimplications of these values was taken for this study, which will be justified following a briefdiscussion of previous work. An aircraft will be declared unserviceable if it fails any of itschecks. It is clear that if an aircraft does not pass either its pre-flight or B-check, anotheraircraft must then be found and those checks commenced anew – leading to additional timein the cycle. In [6], an average aircraft unserviceability time of 22.3 h over and above theA- and B-checks was extracted for the CP-140 fleet for FY01.
Instead of modelling this per aircraft, the approach taken here treats unavailable aircraft asa fixed percentage of the fleet at each base. The authors considered that the time required tomodel this with greater precision would not be worth the effort, particularly given that theactual serviceability of an arbitrary to-be-acquired aircraft cannot be forecast accurately.
To briefly elaborate on the difficulties created by considering a target serviceability per-centage for an integer number of aircraft, one can consider two coastal squadrons usinga CFDS-sized fleet of 10 to 12. With fleets of 5 or 6 on each coast, the possible valuesof serviceable aircraft at each squadron are restricted to {0, 20%, 40%, 60%, 80%, 100%} or{0, 17%, 33%, 50%, 67%, 83%, 100%}, respectively. For an overall fleet size of 10, for in-stance, if the requirement was to guarantee greater than 50 % availability at all times ateach squadron, a fleet of 10 aircraft would actually need to be at least 60 % available. Ifthe requirement is stated a bit more flexibly, e.g., at least 50 % available 90 % of the time,there are still multiple ways to round.
Given the above, the key point to consider is that if one wants to guarantee that they willmeet a specific serviceability target with a small fleet, one will generally not be able tomeet it exactly. Conventionally one wants to at least meet that target, so one will actually
4Recent economic analyses on fleet replacement have noted that overall CP-140 fleet Operational Avail-ability has suffered in recent times [13, 14]. It was between 40 % to 50 % from the period of 1995 to 2000,dropped below 40 % in 2001, below 30 % in 2003, and finally remained below 20 % from 2005 to 2007. How-ever it is important to note that the denominator used for those calculations was the entire fleet size of 18,which included aircraft that were off the flight line for extended periods undergoing modernization. Whenonly those aircraft that were actually available to the operational squadrons are considered, OperationalAvailability was above 50 % from 1998 to 2001, and only fell below 40 % once in the period from 1998 to2008. The expectation is that once all aircraft undergoing modernization have been returned to the flightline, 50 % Operational Availability is achievable.
DRDC-RDDC-2014-R2 11
need to exceed the goal; i.e., one will have to ‘round up’ a decimal number of aircraft to aninteger. By only dealing with 50 % availability for the Aurora this problem is avoided. Itis important to note this is actually an optimistic assumption in the sense that it is quitebrittle – if serviceability were to drop at all (e.g., to 49.5 %), two additional aircraft wouldneed to be added to the fleet (one on each coast). For 70 % serviceability generally the fleetwill be fractionally larger than it would need to be if aircraft were divisible; put anotherway a fleet that can provide the required number of aircraft with a serviceability rate of70 % will generally still be able to operate if it drops somewhat lower (anywhere from 60 %to 67 % for the fleet sizes of interest).
The authors also note that using a probabilistic serviceability metric would also likelyincrease the number of aircraft required; i.e., that the simplistic approach taken here isoptimistic. For instance, if one wanted to guarantee that the squadrons were at least 50 %serviceable 75 % or 90 % of the time, the average serviceability would almost certainlyhave to be higher than 50 % (unless the underlying distribution has an unusual degree ofskewness).
As will be seen later in the report, even the most stringent requirements considered gen-erate fleets that are at the high end of what the CFDS assumes. Given that using a morecomplicated approach to serviceability would if anything increase the size of each hypothet-ical fleet, the authors determined that using average serviceability allows decision makersenough resolution to draw useful comparisons within the range of feasible fleet size, whileintroducing an implicit risk that the required fleet may not successfully accomplish the moststringent of scenarios if serviceability is below target.
12 DRDC-RDDC-2014-R2
4 Results
Using the formulæ developed in the previous section, the authors calculated the requiredminimum fleet and crew sizes to support the mission as described in the introduction.The primary difficulty is in visually summarizing the results in an easy-to-understand yetcomplete manner; the interplay between speed and endurance cannot be captured well ina single value, which impedes direct representation on an already two-dimensional map.5If one is willing to abandon the geographical implications, the trade-offs in speed andendurance can be better captured in a two-dimensional chart; for these a single value (orset of values) for the range from base of the vessels being surveilled must be fixed.
Given those limitations, a reasonable set of fixed values must be selected for which to presentmaps and charts when one or more of the data dimensions cannot be directly incorporated.6Ranges of interest are directly motivated by the problem definition; the worst-case pointsfor each coastal AOR were shown in Figure 2(b) and are summarized in Table 2 for ease ofreference.
Selecting representative values for speed and range is somewhat more subjective. Giventhat it is both currently utilized, and being considered for modernization, it makes senseto include the capabilities of the CP-140 Aurora as one of the points [15].7 Also consideredas part of this analysis are a “jet-powered” aircraft (faster with lower endurance8), and a“light” aircraft (slower with longer endurance). The values used are in Table 3.
Part of the intent of this study was to determine minimum requirements for endurance andspeed, to allow the consideration of the widest array of possible aircraft for acquisition.It will be shown that setting independent minima for either is overly restrictive, as theycan be traded-off when minimizing the number of aircraft required to sustain continuoussurveillance.
4.1 Aircraft and crew requirements
Section 3 succinctly lays out a series of equations for calculating the number of aircraft andcrews required to maintain continuous surveillance at a given point.9 Although Equation 4can be used to calculate both, separate charts are needed for each; best-case cycle time forair crews is more than double that for aircraft.
5It is here that the analysis departs significantly from the Australian study cited earlier [5, 11]. For ASWmissions, that study used three fixed values for aircraft performance (two Unmanned Aerial Vehicles (UAVs)and one MPA) and produced a single plot of distance to station versus number of aircraft required. It thenproceeds to consider the impact of distance to station on the classic area search and barrier patrol problems.
6This is simply to make the presentation herein tractable, there is no fundamental constraint preventingthe production of a very large number maps and charts for other values.
7The value used was chosen in consultation with SMEs in DAR and is consistent with those provided inthe CP-140/CP-140A Statement of Operating Intent (SOI).
8Examples of jet-powered MPA include the recently retired Nimrod and the in-development P-8 Poseidon.9See Section 2.2 regarding reducing the tracking problem to maintaining continuous coverage at the worst
case point in each AOR.
DRDC-RDDC-2014-R2 13
Table 2: Maximum distance from a MOB/FOB to the edge of the AOR in each surveillancescenario.
Surveillance Scenario Maximum Distance (nmi)
East Coast 848West Coast 1178
Arctic 960
Table 3: Speed and endurance of representative aircraft. Endurance is expressed as theTime on Station of the aircraft at 1000 nmi
Aircraft Type Speed (knots) TOSD (hrs)
CP-140 350 6Jet-powered 400 5
Light 300 6
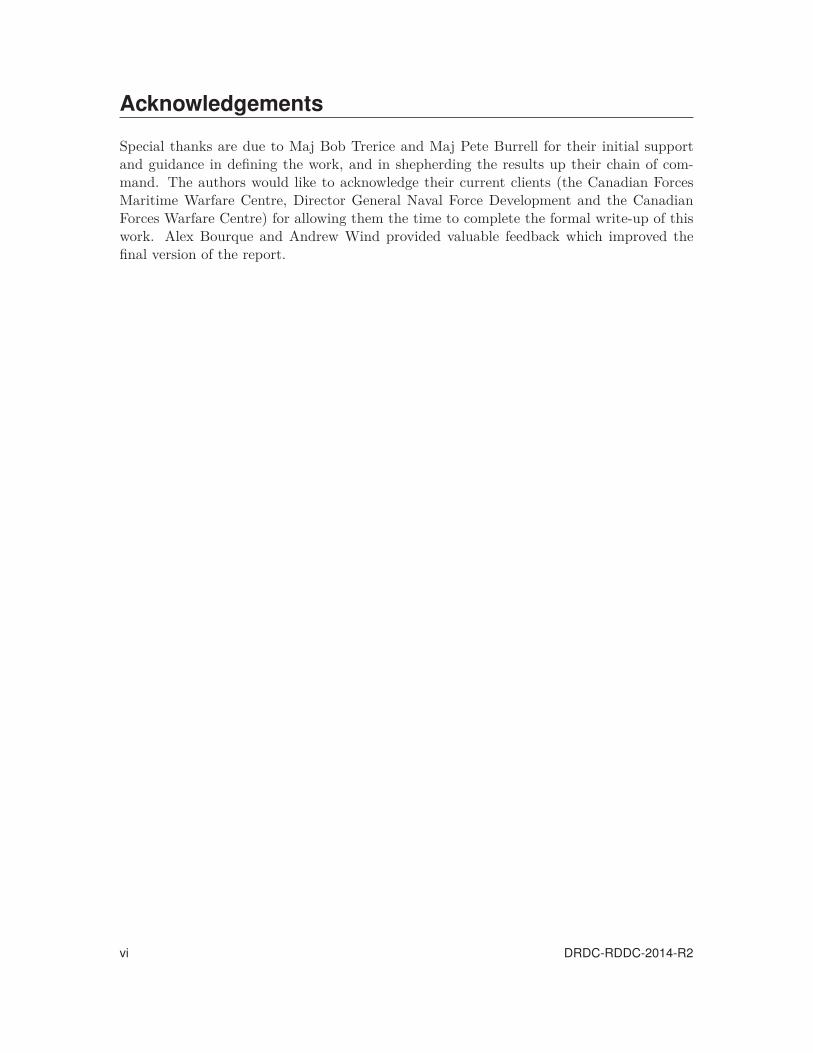
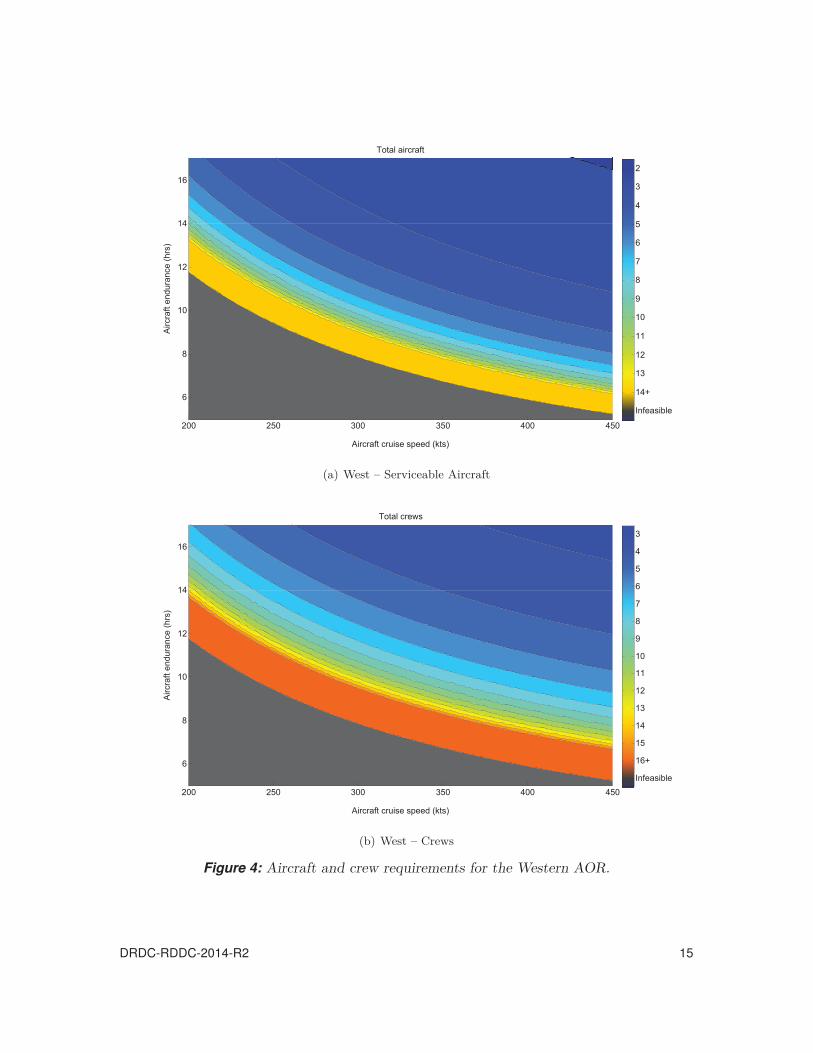
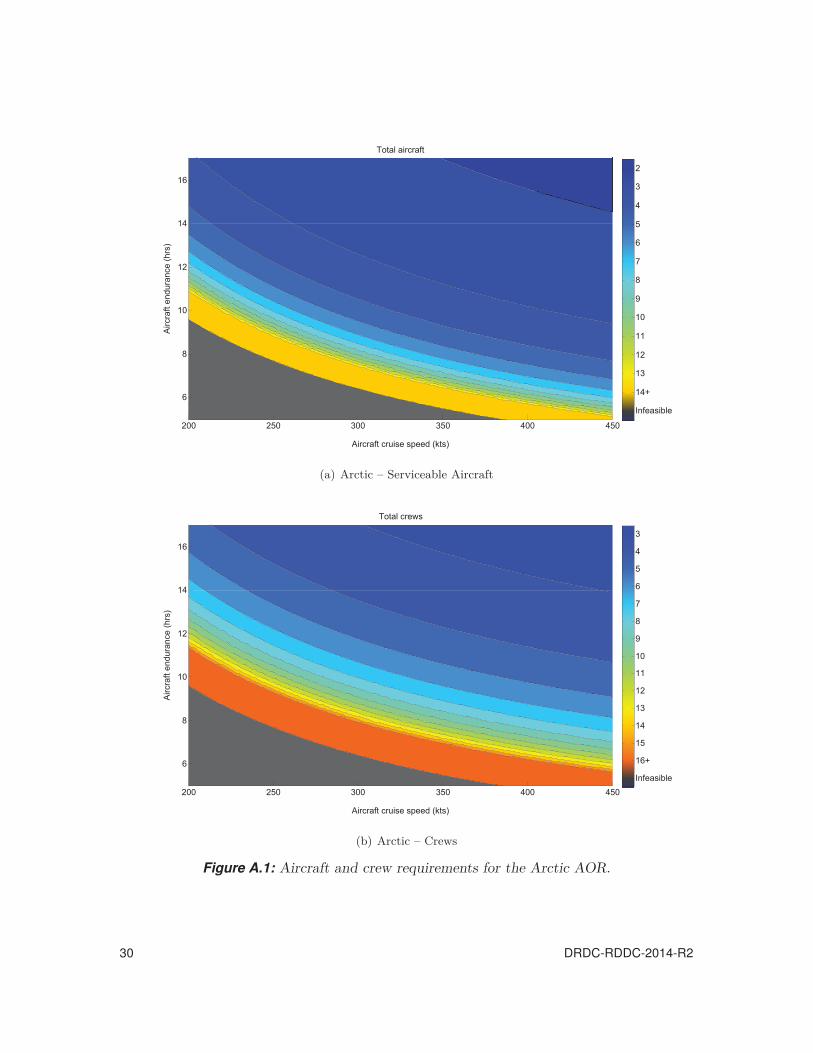
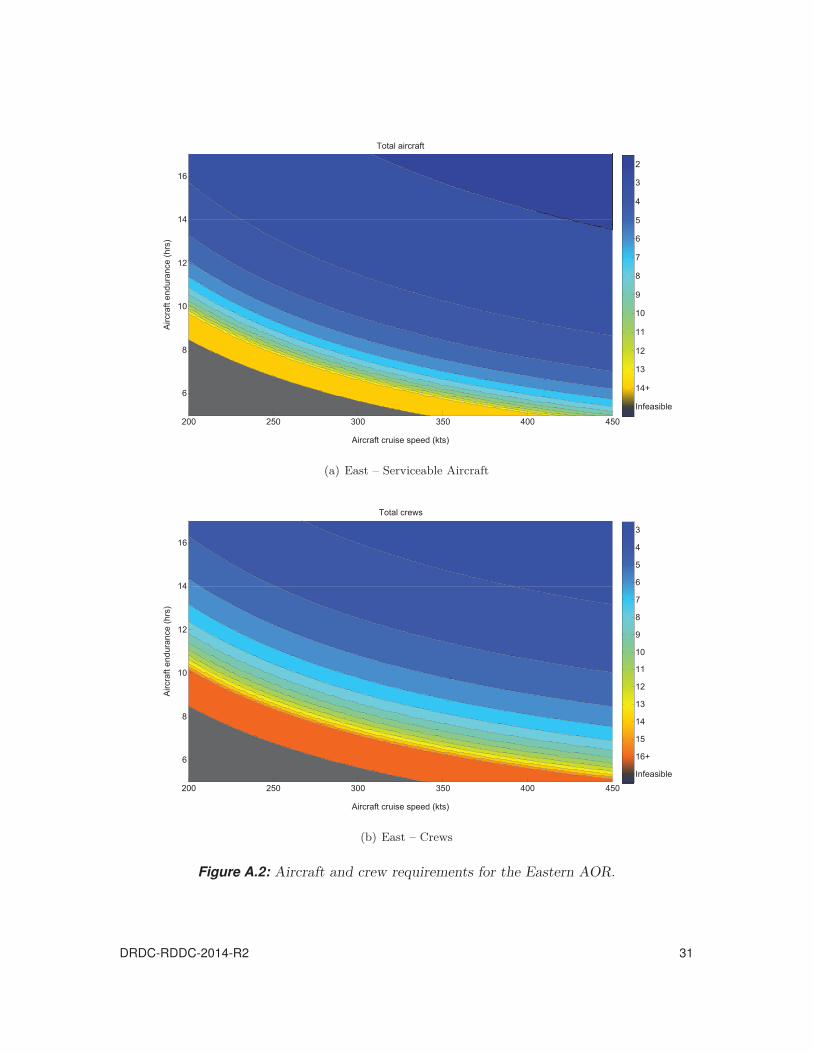
The results for the West Coast (the most challenging of the three) are shown in Figure 4,with the other two coasts presented in Annex A. Interpretation of the two types of charts isessentially the same. At or beyond the upper-right region of a chart is a region where onlytwo aircraft are needed; if the aircraft fleet is fast enough and has sufficient endurance, oneaircraft can return to base, be ‘turned around,’ and fly back to the station in time to relievethe other. Generally three is the lowest feasible number for crews; as the required restperiod combined with briefing time is longer than the maximum duty day, a crew cannotbe rested and ready in time to replace the crew which immediately followed them. In thelower left is an infeasible region wherein an aircraft cannot even make it to the station andback with the given combination of speed and endurance. In between are several colouredregions, each of which represents an area where aircraft performance figures require anequivalent number of aircraft or crew. The 14 hour constraint on crew day length noted inSection 3.3 is also indicated on the figures. As one approaches the infeasible region fromthe right or top of the chart, in general the number of aircraft or crews begins to rapidlyapproach infinity; where regions would be too thin to easily distinguish a region of ‘N+’ isindicated on the legend.
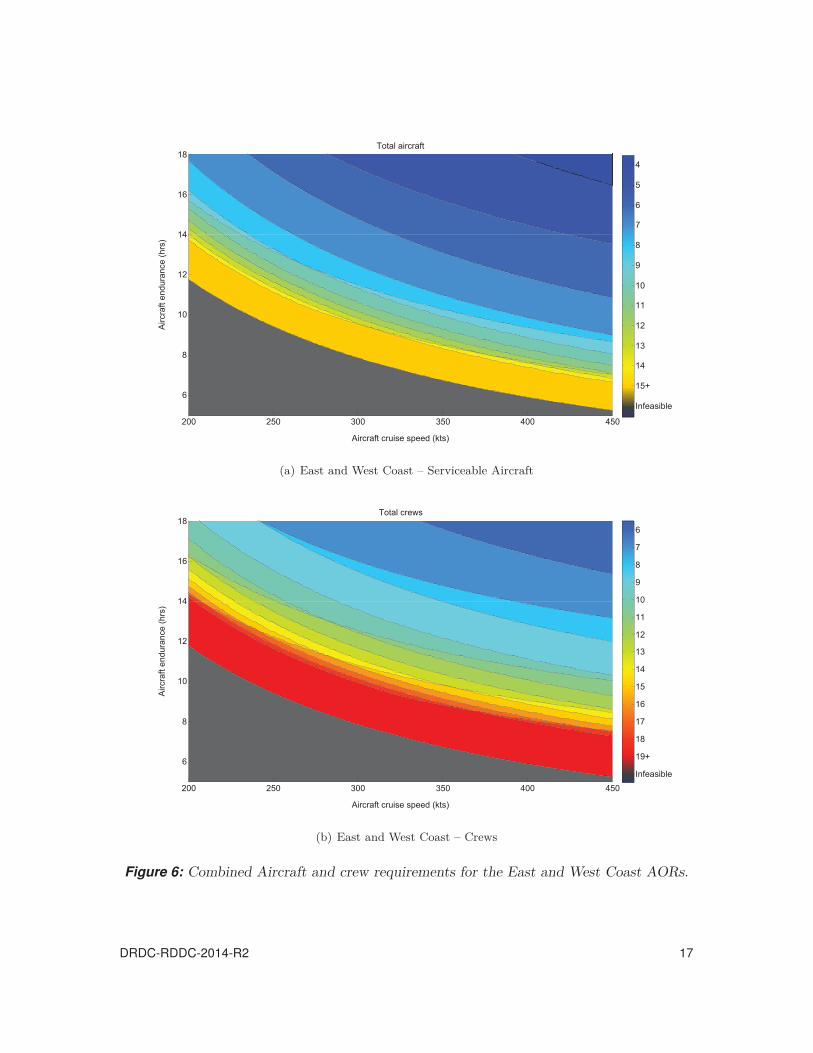
While considering the coasts individually provides valuable information and context, theremit of the study was to examine the requirement to conduct surveillance options on twocoasts simultaneously. Data for two coasts can be combined on one chart (see Figures 5 and 6as examples), although the effect can be jarring (if not deceiving) to the eye. Where theborders between regions on the individual charts cross when overlaid, the result is lines thatseem to ‘bounce’ off each other (note e.g., the point near 260 kts and 13 h in Figure 6(a)).These intersections are due to differing slopes on the two source charts, indicating thatthere is a different trade-off between speed and endurance for different coasts. Regionsaround these points are where the calculations are the most sensitive to small changes inaircraft capability, where a small decrease in either endurance or speed may require anextra aircraft on both coasts in order to maintain continuous coverage. For the modernizedAurora’s assumed serviceability of 50 %, the total fleet required would then jump by four.
14 DRDC-RDDC-2014-R2
Airc
raft
endu
ranc
e (h
rs)
Aircraft cruise speed (kts)
Total aircraft
200 250 300 350 400 450
6
8
10
12
14
16
Infeasible
14+
13
12
11
10
9
8
7
6
5
4
3
2
(a) West – Serviceable Aircraft
Airc
raft
endu
ranc
e (h
rs)
Aircraft cruise speed (kts)
Total crews
200 250 300 350 400 450
6
8
10
12
14
16
Infeasible
16+
15
14
13
12
11
10
9
8
7
6
5
4
3
(b) West – Crews
Figure 4: Aircraft and crew requirements for the Western AOR.
DRDC-RDDC-2014-R2 15
Airc
raft
endu
ranc
e (h
rs)
Aircraft cruise speed (kts)
Total aircraft
200 250 300 350 400 450
6
8
10
12
14
16
18
Infeasible
15+
14
13
12
11
10
9
8
7
6
5
4
(a) West Coast and Arctic – Serviceable Aircraft
Airc
raft
endu
ranc
e (h
rs)
Aircraft cruise speed (kts)
Total crews
200 250 300 350 400 450
6
8
10
12
14
16
18
Infeasible
19+
18
17
16
15
14
13
12
11
10
9
8
7
6
(b) West Coast and Arctic – Crews
Figure 5: Combined aircraft and crew requirements for the West Coast and Arctic AORs.
16 DRDC-RDDC-2014-R2
Airc
raft
endu
ranc
e (h
rs)
Aircraft cruise speed (kts)
Total aircraft
200 250 300 350 400 450
6
8
10
12
14
16
18
Infeasible
15+
14
13
12
11
10
9
8
7
6
5
4
(a) East and West Coast – Serviceable Aircraft
Airc
raft
endu
ranc
e (h
rs)
Aircraft cruise speed (kts)
Total crews
200 250 300 350 400 450
6
8
10
12
14
16
18
Infeasible
19+
18
17
16
15
14
13
12
11
10
9
8
7
6
(b) East and West Coast – Crews
Figure 6: Combined Aircraft and crew requirements for the East and West Coast AORs.
DRDC-RDDC-2014-R2 17
This sensitivity calls for consideration of the impact of setting requirements such thatcapability proposals right on one these lines are considered as acceptable as those furtheraway.
4.2 Geographic context
While the figures in the previous subsection are useful for directly reading off minimumvalues for the required missions, they are less useful for understanding the impact of beingjust below the requirement or having fewer aircraft; in other words to understand how muchof the AOR would go uncovered if fewer aircraft or crews were available than necessary.The authors judged that plotting the geographic area various fleet sizes could cover (as de-termined by combining Equations 1 and 5) was useful for conveying risk to decision-makerswhen they were considering various fleet sizes, particularly as throughout the procurementprocess questions would likely be raised about the impact of a smaller fleet. The figurescan also be used to visualize the impact of degraded availability in a real-world setting, dueto e.g., extended repairs or upgrades.
Figure 7 gives an example for an aircraft with similar speed and endurance to the CP-140.The scale is the number of serviceable aircraft required at that MOB or FOB to create thedepicted coverage, and so conversion to recommended fleet size requires further calculation(adding up coasts, dividing by serviceability rate, and rounding up).
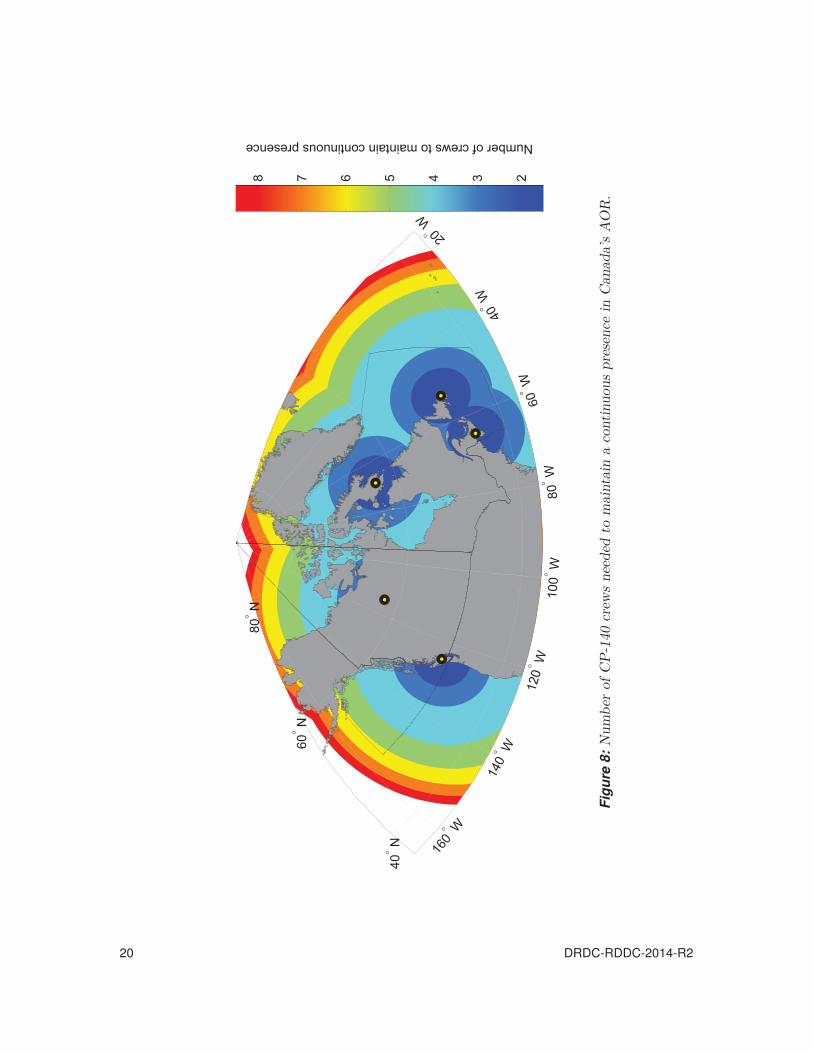
Several features are notable. Although the Eastern AOR looks larger and more challenging,the placement of the MOB and FOB on this coast allows coverage to be extended out furtherwith fewer aircraft than on the West Coast, where the single MOB is located essentially inone of the corners of the AOR. On the East Coast, it is worth remembering Assumption 7,in that these figures (and all calculations in this paper) assume away the problem of handingover control from one MOB/FOB to another. Looking at the area mid-way between Iqaluitand St. John’s in Figure 7 where three aircraft are required to maintain coverage, oneshould keep in mind the logistical hurdles of handing control, aircraft and crews over fromSt. John’s to Iqaluit if a VOI was transiting North towards the Davis Strait. It is also clearthat there are areas to the North of the typical Arctic transit considered for this studythat are extremely difficult to cover with the current operating bases, yet still well withinCanada’s AOR – particularly as Canada submits claims to extend its EEZ in this area.
Figure 8 is similar to Figure 7, instead showing how many crews are required to providecoverage of the AOR rather than the number of aircraft. Unlike aircraft calculations, thetotal number of crews needed to provide a continuous presence on two coasts simultaneouslycan be obtained by simply adding the required number of crews from each of the individualcoasts.
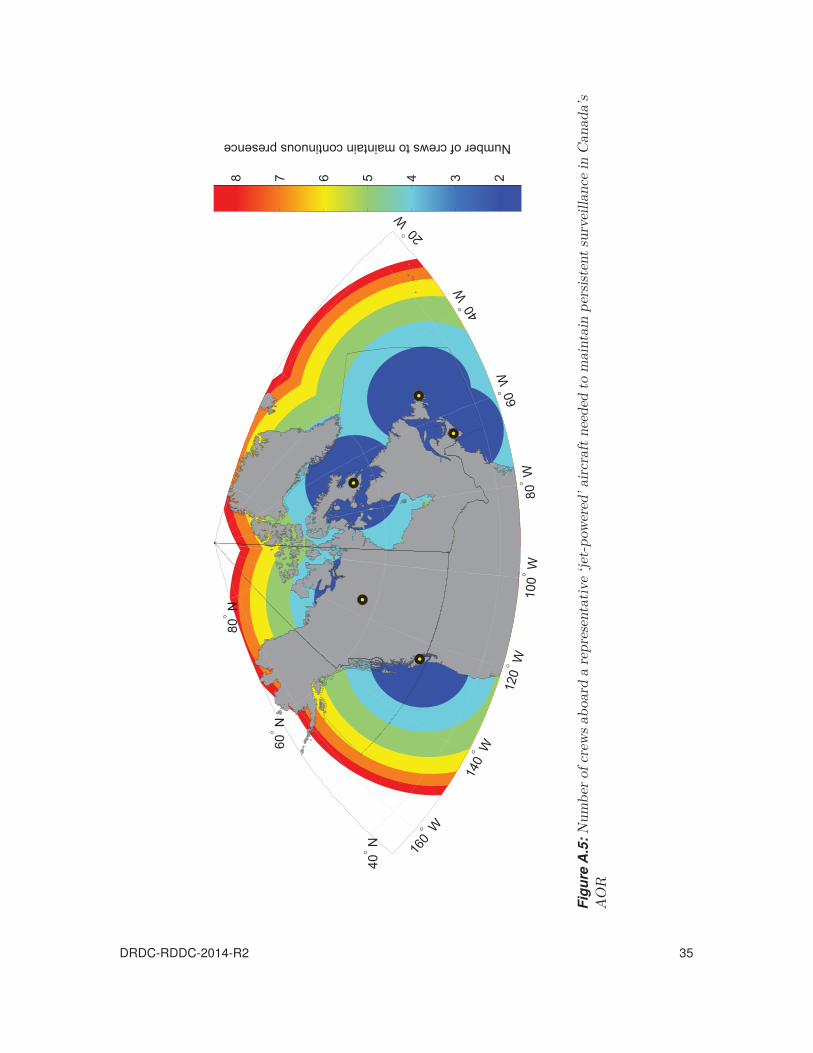
Maps for the other two representative aircraft types are provided in Annex A. One areato note in Figure A.4 for the ‘jet-powered’ aircraft is that the Southwestern corner of theAOR is quite close to the boundary between four and five aircraft, suggesting sensitivity tothese figures. Additionally, two aircraft operating out of Comox cannot even operate outto the edge of Haida Gwaii.
18 DRDC-RDDC-2014-R2
Number of aircraft to maintain continuous presence
160
W
140
W
120
W
100
W
80
W
60
W
40
W
20 W
40
N
60
N
80
N
2345
Figu
re7:
Num
ber
ofse
rvic
eabl
eC
P-1
40ne
eded
tom
aint
ain
aco
ntin
uous
pres
ence
inC
anad
a’s
AO
R.
DRDC-RDDC-2014-R2 19
Number of crews to maintain continuous presence
160
W
140
W
120
W
100
W
80
W
60
W
40
W
20 W
40
N
60
N
80
N
2345678
Figu
re8:
Num
ber
ofC
P-1
40cr
ews
need
edto
mai
ntai
na
cont
inuo
uspr
esen
cein
Can
ada’
sA
OR
.
20 DRDC-RDDC-2014-R2
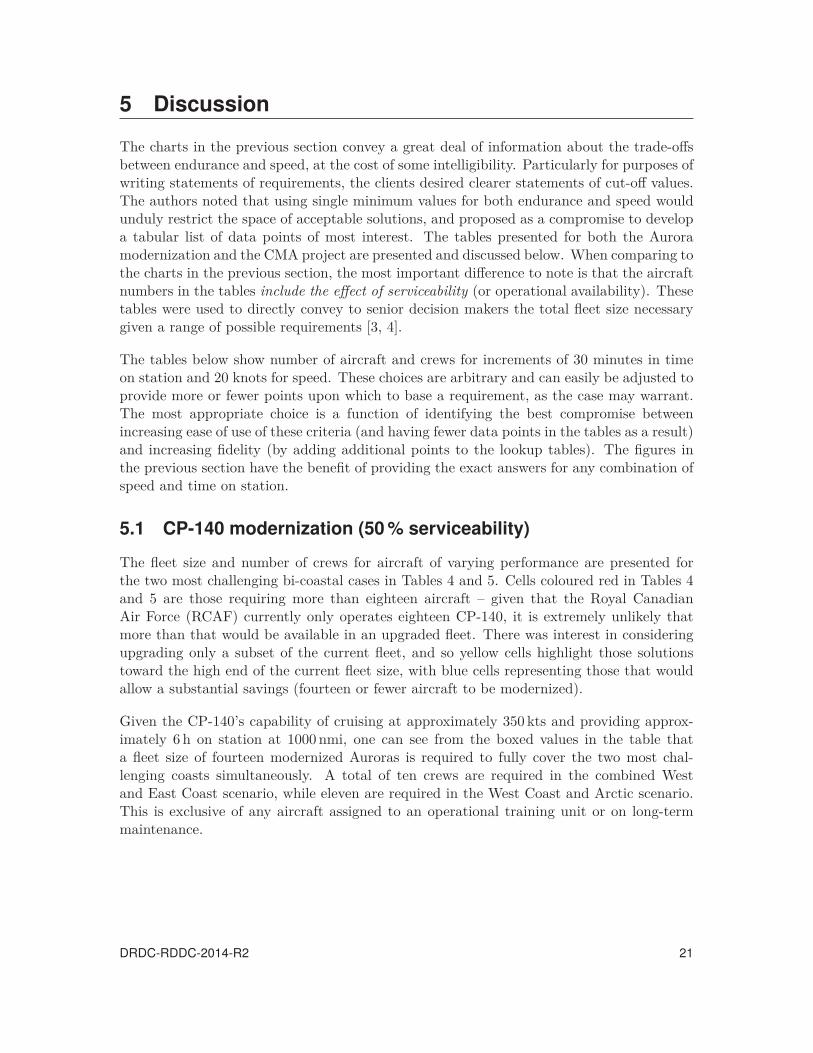
5 Discussion
The charts in the previous section convey a great deal of information about the trade-offsbetween endurance and speed, at the cost of some intelligibility. Particularly for purposes ofwriting statements of requirements, the clients desired clearer statements of cut-off values.The authors noted that using single minimum values for both endurance and speed wouldunduly restrict the space of acceptable solutions, and proposed as a compromise to developa tabular list of data points of most interest. The tables presented for both the Auroramodernization and the CMA project are presented and discussed below. When comparing tothe charts in the previous section, the most important difference to note is that the aircraftnumbers in the tables include the effect of serviceability (or operational availability). Thesetables were used to directly convey to senior decision makers the total fleet size necessarygiven a range of possible requirements [3, 4].
The tables below show number of aircraft and crews for increments of 30 minutes in timeon station and 20 knots for speed. These choices are arbitrary and can easily be adjusted toprovide more or fewer points upon which to base a requirement, as the case may warrant.The most appropriate choice is a function of identifying the best compromise betweenincreasing ease of use of these criteria (and having fewer data points in the tables as a result)and increasing fidelity (by adding additional points to the lookup tables). The figures inthe previous section have the benefit of providing the exact answers for any combination ofspeed and time on station.
5.1 CP-140 modernization (50 % serviceability)
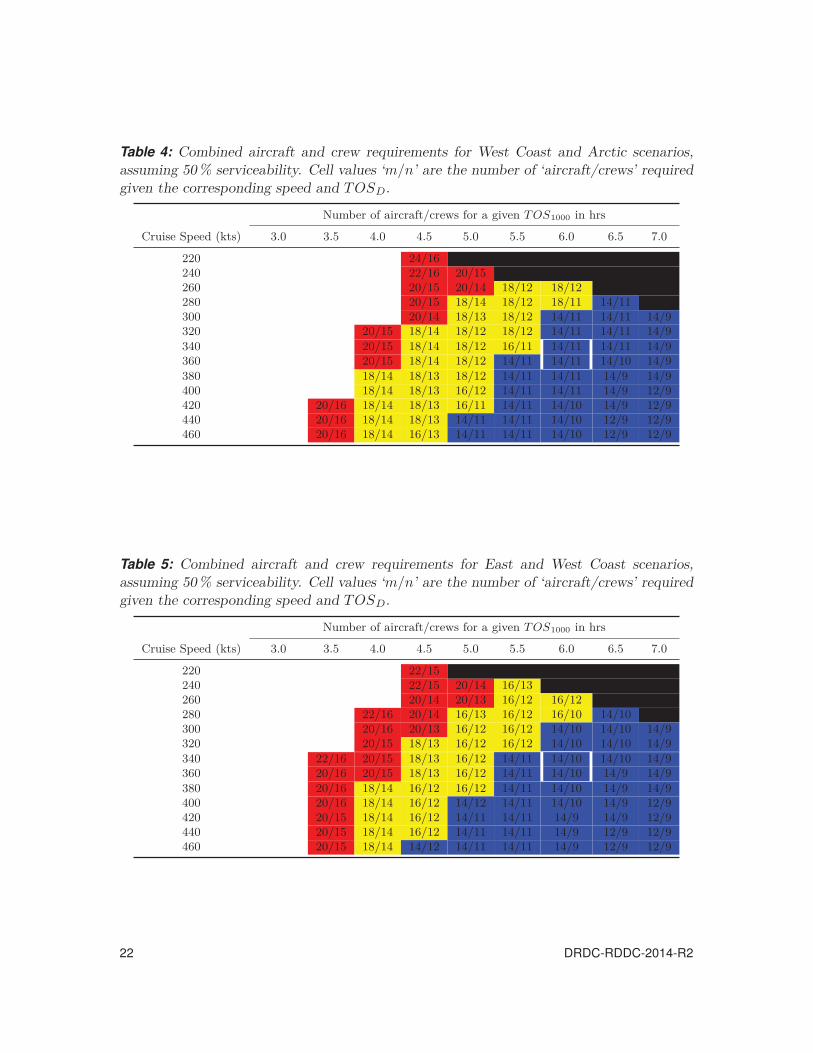
The fleet size and number of crews for aircraft of varying performance are presented forthe two most challenging bi-coastal cases in Tables 4 and 5. Cells coloured red in Tables 4and 5 are those requiring more than eighteen aircraft – given that the Royal CanadianAir Force (RCAF) currently only operates eighteen CP-140, it is extremely unlikely thatmore than that would be available in an upgraded fleet. There was interest in consideringupgrading only a subset of the current fleet, and so yellow cells highlight those solutionstoward the high end of the current fleet size, with blue cells representing those that wouldallow a substantial savings (fourteen or fewer aircraft to be modernized).
Given the CP-140’s capability of cruising at approximately 350 kts and providing approx-imately 6 h on station at 1000 nmi, one can see from the boxed values in the table thata fleet size of fourteen modernized Auroras is required to fully cover the two most chal-lenging coasts simultaneously. A total of ten crews are required in the combined Westand East Coast scenario, while eleven are required in the West Coast and Arctic scenario.This is exclusive of any aircraft assigned to an operational training unit or on long-termmaintenance.
DRDC-RDDC-2014-R2 21
Table 4: Combined aircraft and crew requirements for West Coast and Arctic scenarios,assuming 50 % serviceability. Cell values ‘m/n’ are the number of ‘aircraft/crews’ requiredgiven the corresponding speed and TOSD.
Number of aircraft/crews for a given T OS1000 in hrs
Table 5: Combined aircraft and crew requirements for East and West Coast scenarios,assuming 50 % serviceability. Cell values ‘m/n’ are the number of ‘aircraft/crews’ requiredgiven the corresponding speed and TOSD.
Number of aircraft/crews for a given T OS1000 in hrs
5.2 Canadian Multi-Mission Aircraft (70 % operational availability)
For the CMA fleet, the authors were asked to assume that 70 % operational availability canbe attained. This has no effect on the number of crews required to sustain surveillance ona coast, but it does reduce the number of aircraft needed. The authors were asked to focuson the most challenging scenario for the CMA, and so only Table 6 is provided for the WestCoast and Arctic combination.
The colour code for Table 6 is different than that presented above for the CP-140, and isas follows: cells coloured blue have fleets within the CFDS specified range of 10 to 12; cellscoloured green are for those with smaller fleets; yellow cells are those slightly above theCFDS range (13 to 15); and red cells are anything above that. Yellow cells in particularwere of interest, as recent experience with Fixed Wing SAR (FWSAR) has suggested thatquestions will be asked about whether a less capable (and presumably cheaper) aircraftcould meet the requirements if the fleet size was allowed to expand (presumably still for acheaper overall price).
The boxed values in Table 6 show the positions of the two non-CP-140 representative aircraftfrom Table 3. Even with the relatively generous assumption of 70 % operational availability,aircraft with these characteristics are right on the edge of the area within the CFDS fleetsize. That is to say any fleet of similar aircraft that were either a little bit slower, or had alittle bit lower TOS1000,10 would require greater numbers of aircraft. Those same cells inTable 4 have a fleet size of fourteen, meaning that if operational availability were to dropto a value that is still above today’s observed value (50 %), sustaining these missions wouldrequire extra aircraft.
It is also worth considering the impact of trying to establish a hard lower limit on eitherendurance, speed, or both. If one wanted to be sure to stay within a CFDS fleet range,one could use a minimum of 6.5 hours for TOS1000. This excludes all likely candidates,however. There is no single speed value that would be sufficient to exclude all fleets of sizegreater than twelve. If one used both together, there is no combination of values that wouldinclude both the ‘light’ and ‘jet-powered’ aircraft, without also allowing fleets of at leastthirteen; this can be visualized as the region including cells below and to the right of theyellow cell at 300 kts and 5.0 h. Hard limits would have to bias the requirements to eitherone type or the other. This makes clear the importance of writing the requirements suchthat the limit is defined as a trade-off (whether in a table or by a function), regardless ofwhether a hard limit is set and/or a rated requirement is developed.
10It is important to note here that speed is not independent of T OS1000. An aircraft with a lower speedbut the same T OS1000 must have greater overall endurance, as it will take it longer to reach 1000 nmi.
DRDC-RDDC-2014-R2 23
Table 6: Combined aircraft and crew requirements for West Coast and Arctic scenarios,assuming 70 % operational availability. Cell values ‘m/n’ are the number of ‘aircraft/crews’required given the corresponding speed and TOSD.
Number of aircraft/crews for a given T OS1000 in hrs
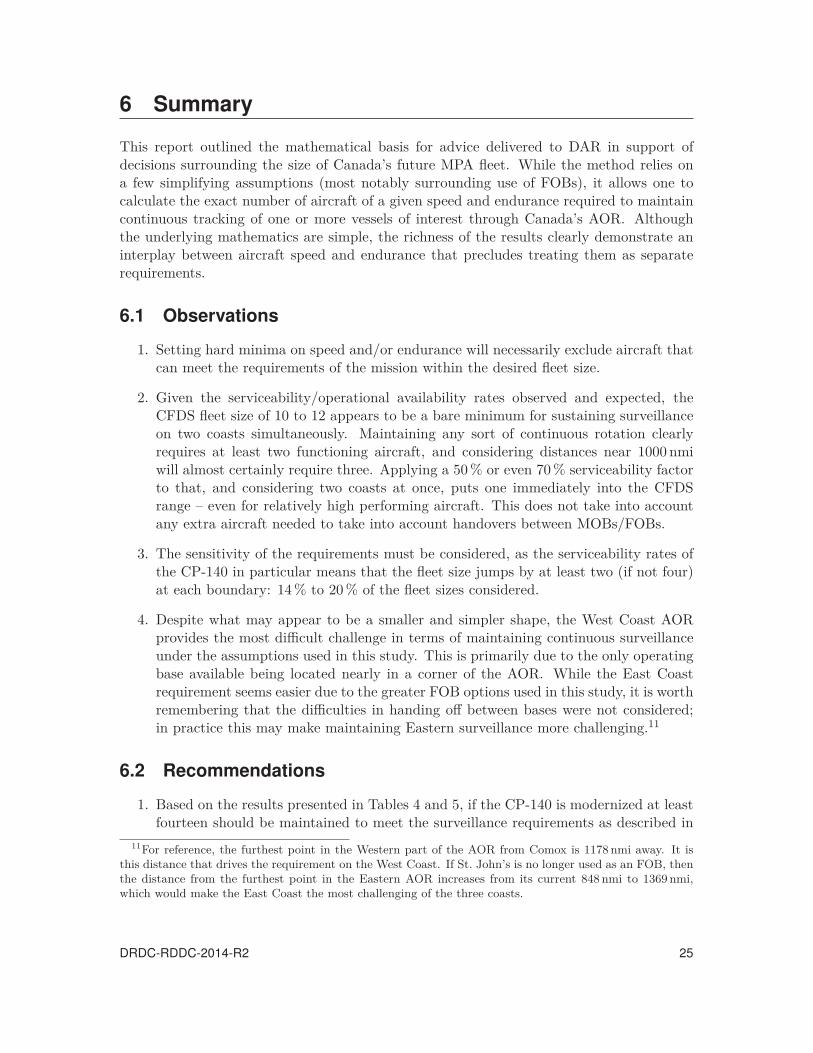
This report outlined the mathematical basis for advice delivered to DAR in support ofdecisions surrounding the size of Canada’s future MPA fleet. While the method relies ona few simplifying assumptions (most notably surrounding use of FOBs), it allows one tocalculate the exact number of aircraft of a given speed and endurance required to maintaincontinuous tracking of one or more vessels of interest through Canada’s AOR. Althoughthe underlying mathematics are simple, the richness of the results clearly demonstrate aninterplay between aircraft speed and endurance that precludes treating them as separaterequirements.
6.1 Observations
1. Setting hard minima on speed and/or endurance will necessarily exclude aircraft thatcan meet the requirements of the mission within the desired fleet size.
2. Given the serviceability/operational availability rates observed and expected, theCFDS fleet size of 10 to 12 appears to be a bare minimum for sustaining surveillanceon two coasts simultaneously. Maintaining any sort of continuous rotation clearlyrequires at least two functioning aircraft, and considering distances near 1000 nmiwill almost certainly require three. Applying a 50 % or even 70 % serviceability factorto that, and considering two coasts at once, puts one immediately into the CFDSrange – even for relatively high performing aircraft. This does not take into accountany extra aircraft needed to take into account handovers between MOBs/FOBs.
3. The sensitivity of the requirements must be considered, as the serviceability rates ofthe CP-140 in particular means that the fleet size jumps by at least two (if not four)at each boundary: 14 % to 20 % of the fleet sizes considered.
4. Despite what may appear to be a smaller and simpler shape, the West Coast AORprovides the most difficult challenge in terms of maintaining continuous surveillanceunder the assumptions used in this study. This is primarily due to the only operatingbase available being located nearly in a corner of the AOR. While the East Coastrequirement seems easier due to the greater FOB options used in this study, it is worthremembering that the difficulties in handing off between bases were not considered;in practice this may make maintaining Eastern surveillance more challenging.11
6.2 Recommendations
1. Based on the results presented in Tables 4 and 5, if the CP-140 is modernized at leastfourteen should be maintained to meet the surveillance requirements as described in
11For reference, the furthest point in the Western part of the AOR from Comox is 1178 nmi away. It isthis distance that drives the requirement on the West Coast. If St. John’s is no longer used as an FOB, thenthe distance from the furthest point in the Eastern AOR increases from its current 848 nmi to 1369 nmi,which would make the East Coast the most challenging of the three coasts.
DRDC-RDDC-2014-R2 25
this study. Depending on the coasts considered, a minimum complement of either ten(Arctic/West) or eleven (East/West) crews should be maintained.
2. Observation 1 necessitates a strong recommendation that the speed and endurancerequirements for any future CMA be defined as a trade-off, rather than as two hardminima.
3. Given the sensitivity noted in Observation 3, it is worth considering setting the min-imum requirement curve slightly above the values calculated – particularly as meteo-rological conditions in the given AORs can easily eat into an aircraft’s best case speedand endurance.
6.3 Future work and CP-140 Life Extension
The results of the work show that speed and endurance can be traded off by an aircraft inmeeting the requirements of the surveillance mission described herein. While the methodol-ogy herein can be used to develop a curve delineating the minimum acceptable combinationsof these requirements, it can be naturally extended to comparing options that exceed thatminimum – particularly if they enable a lower fleet size. Although the remit of DASORis to help DAR establishing requirements for aerospace assets, DRDC – Centre for Oper-ational Research and Analysis analysts in the Directorate of Materiel Group OperationalResearch (DMGOR) may pick up the work in supporting generation of future CMA bidevaluation criteria.
In the final stages of the finalization of this report, the Government of Canada announcedthat it would add another four aircraft to the ten already being updated under the AuroraIncremental Modernization Project, and extend the lifespan of those fourteen aircraft to2030 under the Aurora Structural Life Extension Project [2]. This is in line with Recom-mendation 1 above.
26 DRDC-RDDC-2014-R2
References
[1] National Defence (2008), Canada First Defence Strategy.
[2] Treasury Board Secretariat (2014), Supplementary Estimates (C), 2013–14: For theFiscal Year ending March 31, 2014.
[3] Bourdon, S., MacLeod, M. R., and McCourt, R. (2012), Analysis of Fleet SizeRequirement for CP-140 Aurora Modernization, (LR 2012-234) DRDC – Centre forOperational Research and Analysis.
[4] Leis, G. and Trerice, R. (2012), Canadian Multi-Mission Aircraft Project: AnnualBriefing to the Senior Review Board.
[5] Bocquet, S. (2009), Analysis of Maritime Patrol and Response Missions, (TechnicalReport DSTO-TR-2346) Defence Science and Technology Organization.
[6] Desmier, P. E. and Roggenkamp, N. (2002), CP-140 Force Structure Analysis,(PR2002/05) Operational Research Division.
[7] Fisher, M. J. (1993), An Analysis of Coastal Patrol Aircraft SurveillanceRequirements, (ORA Project Report PR655) Operational Research Division.
[8] Asiedu, Y. (2010), Optimal Crew Rostering for the Arctic/Offshore Patrol Ship, (TM2010-173) DRDC – Centre for Operational Research and Analysis.
[9] Carson, N. and Caron, J.-D. (2010), The Maritime Timeline Analysis andRequirements Tooslet (M-TART), MORS Phalanx, 43(4).
[10] Arbour, B. (2013), Analysis of JUSTAS Domestic Requirements – Update, (LR2013-097) DRDC – Centre for Operational Research and Analysis.
[11] Bocquet, S. and Tri, N. (2009), Analysis Methods used in the AIR 7000 Force MixStudy, (Technical Report DSTO-TR-2286) Defence Science and TechnologyOrganization.
[12] 1 Canadian Air Division (1999), 1 Canadian Air Division Orders, Volume 2: FlyingOrders. Amended version current as of September 2012.
[13] Maybury, D. W. (2009), Economic Forecasting with Optimal Replacement for theCP-140 Fleet Under the Aurora Incremental Modernization Program, (TM 2009-023)DRDC – Centre for Operational Research and Analysis.
[14] Sokri, A. (2009), An Economic Evaluation for CP-140 Aircraft Replacement, (TM2009-027) DRDC – Centre for Operational Research and Analysis.
[15] 1 Canadian Air Division (2006), CP140/CP140A Statement of Operating Intent(SOI).
DRDC-RDDC-2014-R2 27
This page intentionally left blank.
28 DRDC-RDDC-2014-R2
Annex A: Additional Figures
This Annex contains several additional variants of the figures presented in the main bodyof the report. They are presented separately here in order to help maintain the overall flowof the document.
A.1 Aircraft and crew requirements
The first set of figures shows how many aircraft and crews are needed to provide a continuouspresence on the Arctic and East Coasts individually. Figure A.3 shows the requirementswhen these two coasts are patrolled simultaneously.
DRDC-RDDC-2014-R2 29
Airc
raft
endu
ranc
e (h
rs)
Aircraft cruise speed (kts)
Total aircraft
200 250 300 350 400 450
6
8
10
12
14
16
Infeasible
14+
13
12
11
10
9
8
7
6
5
4
3
2
(a) Arctic – Serviceable Aircraft
Airc
raft
endu
ranc
e (h
rs)
Aircraft cruise speed (kts)
Total crews
200 250 300 350 400 450
6
8
10
12
14
16
Infeasible
16+
15
14
13
12
11
10
9
8
7
6
5
4
3
(b) Arctic – Crews
Figure A.1: Aircraft and crew requirements for the Arctic AOR.
30 DRDC-RDDC-2014-R2
Airc
raft
endu
ranc
e (h
rs)
Aircraft cruise speed (kts)
Total aircraft
200 250 300 350 400 450
6
8
10
12
14
16
Infeasible
14+
13
12
11
10
9
8
7
6
5
4
3
2
(a) East – Serviceable Aircraft
Airc
raft
endu
ranc
e (h
rs)
Aircraft cruise speed (kts)
Total crews
200 250 300 350 400 450
6
8
10
12
14
16
Infeasible
16+
15
14
13
12
11
10
9
8
7
6
5
4
3
(b) East – Crews
Figure A.2: Aircraft and crew requirements for the Eastern AOR.
DRDC-RDDC-2014-R2 31
Airc
raft
endu
ranc
e (h
rs)
Aircraft cruise speed (kts)
Total aircraft
200 250 300 350 400 450
6
8
10
12
14
16
18
Infeasible
15+
14
13
12
11
10
9
8
7
6
5
4
(a) East Coast and Arctic – Serviceable Aircraft
Airc
raft
endu
ranc
e (h
rs)
Aircraft cruise speed (kts)
Total crews
200 250 300 350 400 450
6
8
10
12
14
16
18
Infeasible
19+
18
17
16
15
14
13
12
11
10
9
8
7
6
(b) East Coast and Arctic – Crews
Figure A.3: Combined aircraft and crew requirements for the Arctic and Eastern AORs.
32 DRDC-RDDC-2014-R2
A.2 Geographic context
The figures in this part of the annex present the requirements for the ‘jet-powered’ and‘light’ aircraft in a geographical context. The requirements for both aircraft and crews arepresented.
DRDC-RDDC-2014-R2 33
Number of aircraft to maintain continuous presence
160
W
140
W
120
W
100
W
80
W
60
W
40
W
20 W
40
N
60
N
80
N
2345
Figu
reA
.4:
Num
ber
ofre
pres
enta
tive
‘jet-
pow
ered
’air
craf
tne
eded
tom
aint
ain
pers
iste
ntsu
rvei
llanc
ein
Can
ada’
sA
OR
34 DRDC-RDDC-2014-R2
Number of crews to maintain continuous presence
160
W
140
W
120
W
100
W
80
W
60
W
40
W
20 W
40
N
60
N
80
N
2345678
Figu
reA
.5:N
umbe
rof
crew
sab
oard
are
pres
enta
tive
‘jet-
pow
ered
’air
craf
tnee
ded
tom
aint
ain
pers
iste
ntsu
rvei
llanc
ein
Can
ada’
sA
OR
DRDC-RDDC-2014-R2 35
Number of aircraft to maintain continuous presence
160
W
140
W
120
W
100
W
80
W
60
W
40
W
20 W
40
N
60
N
80
N
2345
Figu
reA
.6:
Num
ber
ofre
pres
enta
tive
‘ligh
t’ai
rcra
ftne
eded
tom
aint
ain
pers
iste
ntsu
rvei
llanc
ein
Can
ada’
sA
OR
36 DRDC-RDDC-2014-R2
Number of crews to maintain continuous presence
160
W
140
W
120
W
100
W
80
W
60
W
40
W
20 W
40
N
60
N
80
N
2345678
Figu
reA
.7:
Num
ber
ofcr
ews
aboa
rda
repr
esen
tati
ve‘li
ght’
airc
raft
need
edto
mai
ntai
npe
rsis
tent
surv
eilla
nce
inC
anad
a’s
AO
R
DRDC-RDDC-2014-R2 37
List of symbols and abbreviations
AOR Area of Responsibility
ASuW Anti-Surface Warfare
ASW Anti-Submarine Warfare
CAF Canadian Armed Forces
CFDS Canada First Defence Strategy
CMA Canadian Multi-Mission Aircraft
CT Cycle Time
CT ac Cycle time – aircraft
CT crew Cycle time – crew
D Distance
DAR Directorate of Aerospace Requirements
DASOR Directorate of Air Staff Operational Research
DMGOR Directorate of Materiel Group Operational Research
E Endurance
EEZ Exclusive Economic Zone
FOB Forward Operating Base
FWSAR Fixed Wing SAR
MOB Main Operating Base
MPA Maritime Patrol Aircraft
RCAF Royal Canadian Air Force
S Speed
SAR Search and Rescue
SME Subject Matter Expert
SOI Statement of Operating Intent
SOR Statement of Operational Requirement
TOS Time on Station
38 DRDC-RDDC-2014-R2
TOSD Time on Station at D nmi
TT Transit Time
UAV Unmanned Aerial Vehicle
VOI Vessel of Interest
DRDC-RDDC-2014-R2 39
This page intentionally left blank.
40 DRDC-RDDC-2014-R2
DOCUMENT CONTROL DATA(Security markings for the title, abstract and indexing annotation must be entered when the document is Classified or Designated.)
1. ORIGINATOR (The name and address of the organization preparing thedocument. Organizations for whom the document was prepared, e.g. Centresponsoring a contractor’s report, or tasking agency, are entered in section 8.)
DRDC – Centre for Operational Research andAnalysisDept. of National Defence, MGen G. R. Pearkes Bldg.,101 Colonel By Drive, 6CBS, Ottawa ON K1A 0K2,Canada
2a. SECURITY MARKING (Overall securitymarking of the document, includingsupplemental markings if applicable.)
UNCLASSIFIED
2b. CONTROLLED GOODS
(NON-CONTROLLEDGOODS)DMC AREVIEW: GCEC APRIL 2011
3. TITLE (The complete document title as indicated on the title page. Its classification should be indicated by the appropriateabbreviation (S, C or U) in parentheses after the title.)
Determining Fleet Size for a Modernized Canadian Maritime Patrol Aircraft
4. AUTHORS (Last name, followed by initials – ranks, titles, etc. not to be used.)
Bourdon, S.; MacLeod, M. R.; McCourt, R.
5. DATE OF PUBLICATION (Month and year of publication ofdocument.)
February 2014
6a. NO. OF PAGES (Totalcontaining information.Include Annexes,Appendices, etc.)
50
6b. NO. OF REFS (Totalcited in document.)
15
7. DESCRIPTIVE NOTES (The category of the document, e.g. technical report, technical note or memorandum. If appropriate, enterthe type of report, e.g. interim, progress, summary, annual or final. Give the inclusive dates when a specific reporting period iscovered.)
Scientific Report
8. SPONSORING ACTIVITY (The name of the department project office or laboratory sponsoring the research and development –include address.)
Directorate of Aerospace Requirements
9a. PROJECT OR GRANT NO. (If appropriate, the applicableresearch and development project or grant number underwhich the document was written. Please specify whetherproject or grant.)
13ri
9b. CONTRACT NO. (If appropriate, the applicable number underwhich the document was written.)
10a. ORIGINATOR’S DOCUMENT NUMBER (The officialdocument number by which the document is identified by theoriginating activity. This number must be unique to thisdocument.)
DRDC-RDDC-2014-R2
10b. OTHER DOCUMENT NO(s). (Any other numbers which maybe assigned this document either by the originator or by thesponsor.)
11. DOCUMENT AVAILABILITY (Any limitations on further dissemination of the document, other than those imposed by securityclassification.)( X ) Unlimited distribution( ) Defence departments and defence contractors; further distribution only as approved( ) Defence departments and Canadian defence contractors; further distribution only as approved( ) Government departments and agencies; further distribution only as approved( ) Defence departments; further distribution only as approved( ) Other (please specify):
12. DOCUMENT ANNOUNCEMENT (Any limitation to the bibliographic announcement of this document. This will normally correspondto the Document Availability (11). However, where further distribution (beyond the audience specified in (11)) is possible, a widerannouncement audience may be selected.)
13. ABSTRACT (A brief and factual summary of the document. It may also appear elsewhere in the body of the document itself. It is highlydesirable that the abstract of classified documents be unclassified. Each paragraph of the abstract shall begin with an indication of thesecurity classification of the information in the paragraph (unless the document itself is unclassified) represented as (S), (C), or (U). It isnot necessary to include here abstracts in both official languages unless the text is bilingual.)
The Canada First Defence Strategy announced that the CP-140 Aurora, Canada’s long-rangemaritime patrol aircraft, will be replaced by a fleet of Canadian Multi-Mission Aircraft (CMA). Thisreport details analyses provided in support of developing requirements on speed, endurance,and fleet size to enable the CMA to fulfill surveillance and patrol missions. The analysis wasrepeated to determine the number of Auroras that would require modernization if the acquisitionof the CMA were to be delayed, as was announced in February 2014.
14. KEYWORDS, DESCRIPTORS or IDENTIFIERS (Technically meaningful terms or short phrases that characterize a document and couldbe helpful in cataloguing the document. They should be selected so that no security classification is required. Identifiers, such asequipment model designation, trade name, military project code name, geographic location may also be included. If possible keywordsshould be selected from a published thesaurus. e.g. Thesaurus of Engineering and Scientific Terms (TEST) and that thesaurus identified.If it is not possible to select indexing terms which are Unclassified, the classification of each should be indicated as with the title.)