Determining the Best Time to Remove a Ventilator from an Apneic Baby Based on Graphs of Biophysical Signal Data vs. Time Tom Lever 30 April 2013 A thesis submitted in partial fulfillment of the requirements for the degree of Bachelor of Science in Physics from the College of William & Mary in Virginia. Advisor: John Delos Senior Research Coordinator: Henry Krakauer 1
Transcript
Determining the Best Time to Remove a Ventilatorfrom an Apneic Baby Based on Graphs of Biophysical
Signal Data vs. Time
Tom Lever
30 April 2013
A thesis submitted in partial fulfillment of the requirements for the degree of Bachelor ofScience in Physics from the College of William & Mary in Virginia.
Advisor: John Delos
Senior Research Coordinator: Henry Krakauer
1
1 Introduction
Neo-natal apnea is the seemingly spontaneous cessation of breathing in premature infants.In hospitals these babies are monitored and supported by ventilators. For her own safety, apremature, apneic baby should be on a ventilator as long as is necessary, but no longer. Wewant to avoid removing a baby’s ventilator before she is ready: If we remove the ventilatortoo early, the baby might suffocate and at best need to have the ventilator reintubated (i.e.,reinserted). Intubation is painful, risks damaging sensitive tissue, and increases the risk ofinfection. If we keep the ventilator in too long, at best we prolong the risk of infectionand at worst the baby’s respiratory system might fail to develop properly. The research ofJohn Delos, Mary Mohr, I, and others focuses on quantitatively determining when the besttime to remove a ventilator from a premature, apneic baby is, to make ventilator removalmore successful. To determine the best time to remove a ventilator, we study, after the fact,behaviors of the baby in the day before extubation. These behaviors include:
1. whether extubation (i.e., ventilator removal) was successful (i.e., whether the babybreathed naturally for the forty-eight hours following extubation);
2. the frequency and nature of apnea events and natural breathing; and3. interactions of baby and ventilator.
These baby behaviors are exhibited in graphs of electronic biophysical signals vs. time for theday before extubation (e.g., heart-rate, electrocardiogram, respiration-rate, chest-impedance,oxygen pulse, and probability of apnea signals). My research focused on generating thesegraphs, organizing these graphs into packages for analysis, and analyzing these graphs. Usingmy research, we can determine that a baby is not ready for extubation (i.e., ventilatorremoval). Using my research, it seems we might be able to determine that a baby is readyfor extubation. I’d like to explore these conclusions and how we came to these conclusions.
2 Our research conclusions
Our research team has developed a method to determine whether a baby MIGHT be readyto be taken off a ventilator. More specifically, we CAN determine that a baby is NOT readyfor extubation. With more data, it seems we MIGHT be able to determine that a baby ISready for extubation. How did we come to these conclusions?
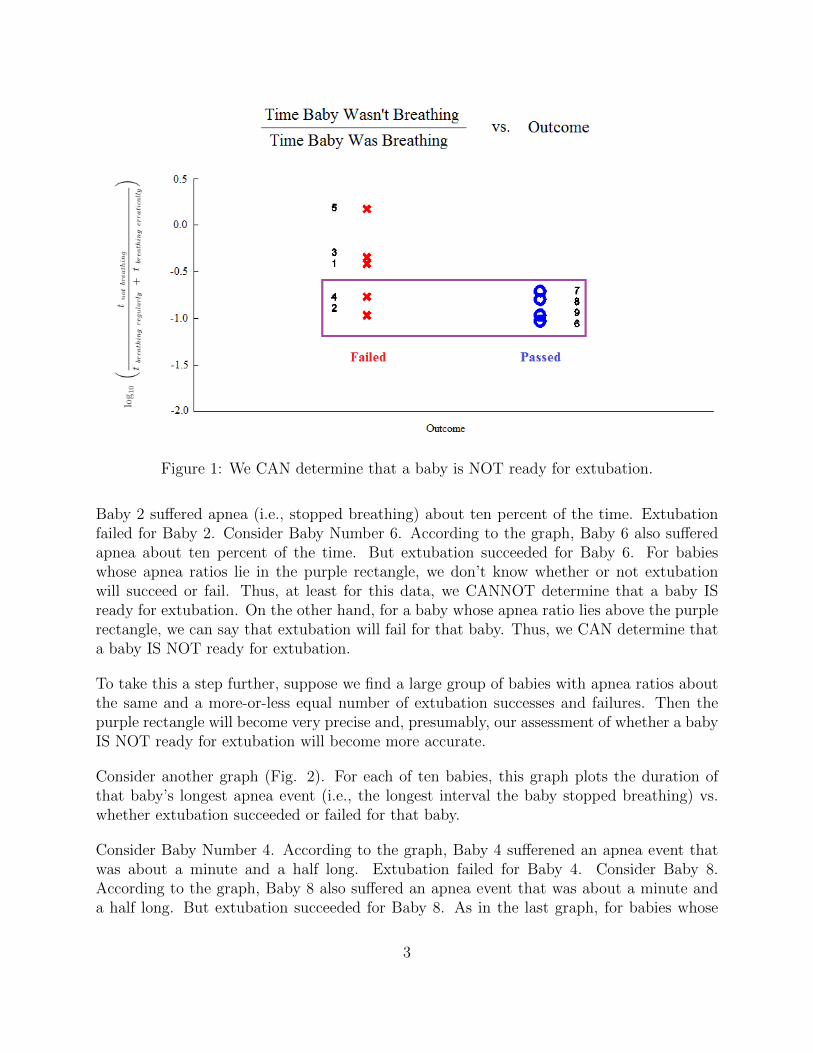
Consider the following graph (Fig. 1). For each of ten babies, this graph plots the ratiobetween the time that baby was not breathing and the time the baby was breathing, vs.whether extubation succeeded or failed for that baby.
To understand this graph more clearly, consider Baby Number 2. According to the graph,
2
Figure 1: We CAN determine that a baby is NOT ready for extubation.
Baby 2 suffered apnea (i.e., stopped breathing) about ten percent of the time. Extubationfailed for Baby 2. Consider Baby Number 6. According to the graph, Baby 6 also sufferedapnea about ten percent of the time. But extubation succeeded for Baby 6. For babieswhose apnea ratios lie in the purple rectangle, we don’t know whether or not extubationwill succeed or fail. Thus, at least for this data, we CANNOT determine that a baby ISready for extubation. On the other hand, for a baby whose apnea ratio lies above the purplerectangle, we can say that extubation will fail for that baby. Thus, we CAN determine thata baby IS NOT ready for extubation.
To take this a step further, suppose we find a large group of babies with apnea ratios aboutthe same and a more-or-less equal number of extubation successes and failures. Then thepurple rectangle will become very precise and, presumably, our assessment of whether a babyIS NOT ready for extubation will become more accurate.
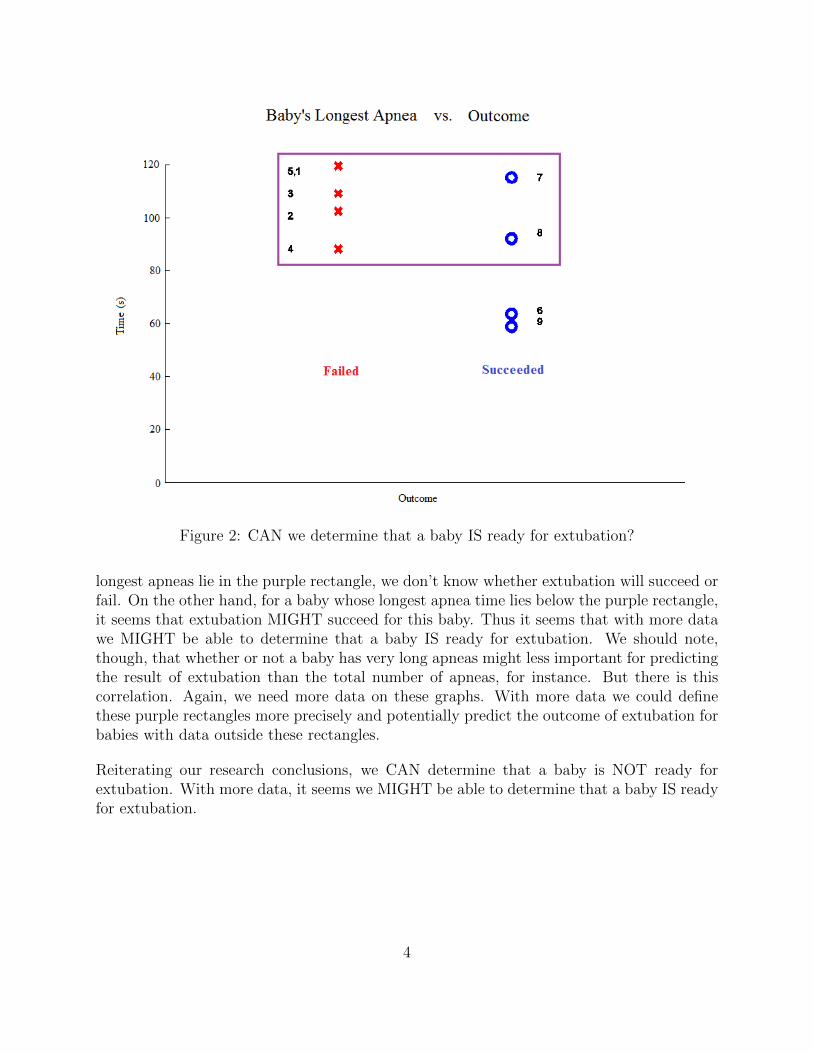
Consider another graph (Fig. 2). For each of ten babies, this graph plots the duration ofthat baby’s longest apnea event (i.e., the longest interval the baby stopped breathing) vs.whether extubation succeeded or failed for that baby.
Consider Baby Number 4. According to the graph, Baby 4 sufferened an apnea event thatwas about a minute and a half long. Extubation failed for Baby 4. Consider Baby 8.According to the graph, Baby 8 also suffered an apnea event that was about a minute anda half long. But extubation succeeded for Baby 8. As in the last graph, for babies whose
3
Figure 2: CAN we determine that a baby IS ready for extubation?
longest apneas lie in the purple rectangle, we don’t know whether extubation will succeed orfail. On the other hand, for a baby whose longest apnea time lies below the purple rectangle,it seems that extubation MIGHT succeed for this baby. Thus it seems that with more datawe MIGHT be able to determine that a baby IS ready for extubation. We should note,though, that whether or not a baby has very long apneas might less important for predictingthe result of extubation than the total number of apneas, for instance. But there is thiscorrelation. Again, we need more data on these graphs. With more data we could definethese purple rectangles more precisely and potentially predict the outcome of extubation forbabies with data outside these rectangles.
Reiterating our research conclusions, we CAN determine that a baby is NOT ready forextubation. With more data, it seems we MIGHT be able to determine that a baby IS readyfor extubation.
4
3 Collecting data for these conclusions
These conclusions depend on graphs involving five different data for each baby; namely:
1. the length of time the baby wasn’t breathing;2. the length of time the baby was breathing regularly;3. the length of time the baby was breathing erratically;4. the duration of the longest time interval in which the baby wasn’t breathing; and5. whether extubation succeeded or failed for the baby.
We determined the first four data from our analysis of sets of graphs of biophysical signaldata vs. time for each baby. Each graph corresponded to a two-minute time interval in theday before extubation for a baby; each set of graphs corresponded to the entire day beforeextubation. Hospitals let us know directly whether extubation succeeded or failed for eachbaby.
4 My research
In August 2012 our research team had lots of biophysical signal data. I wrote code togenerate 720 graphs of biophysical signal data vs. time for each of ten babies. These graphscorrespond to all two minute time intervals in the day before extubation for that baby. Iwrote code to organize our 7200 graphs and 1440 redundant copies into 72 packages of 120graphs each for volunteers to analyze. I analyzed one package of graphs.
I analyzed individual graphs of biophysical signal data vs. time for each baby; Dr. Delosused our work to analyze entire sets of graphs for each baby and to come up with the fivedata above and the graphs from which we drew our conclusions. I’d like to talk about how Ianalyzed individual graphs. You can talk to Dr. Delos about how exactly he used my workto come up with our conclusions.
5 Graphical analysis for a baby
Let’s study the behavior of a premature, apneic baby supported by a ventilator during a fewtwo-minute time intervals in the day before extubation. To study the behavior of this babyI will ask and answer a series of questions.
5
Did extubation succeed or fail for this baby? For this baby extubation succeeded.
What signals vs. time do the graphs for this baby present? All graphs present, vs. time,from top to bottom: heart rate, the ”best” electrocardiogram for this baby, respiration rate,raw chest impedance, oxygen pulse, singly filtered chest impedance, doubly filtered chestimpedance, and probability of apnea. There are 720 graphs for this baby for the day beforeextubation: each graph spans two minutes in the day before extubation.
What are all the signals graphed? A baby’s heart rate is the number of heart beats perunit time (beats per minute). An electrocardiogram is a graph of the electrical potential vs.time between two points on a baby’s chest (volts). The electrocardiogram signal varies withthe electrical activity of the heart. A baby’s respiration rate is the number of times a babyinhales per unit time (inhalations per minute). A baby’s chest impedance is the electricalresistance between two points on the baby’s chest (ohms). A baby’s oxygen pulse, while notdirectly measurable, is the volume of oxygen consumed by the body per heartbeat (liters perheartbeat). We monitor the color of a baby’s blood to determine this signal. The probabilityof apnea for a baby at any given time is a signal calculated by an algorithm of Lee et al. Itis used in hospitals to determine whether a baby is suffering apnea and to sound an alarm.
How do we interpret a graph? To the right of all graphs is a list of possible interpretations,including:
1. ”Uninterpretable” (graph exhibits chaotic behavior);2. ”Baby and vent together” (baby and ventilator breathing are in phase and periodic);3. ”Unsynchronized” (baby and ventilator breathing are out of phase or are chaotic and
show no phase relationship yet seem to have an overall envelope);4. ”Apnea” (ventilator breathes for baby or there is no breathing).
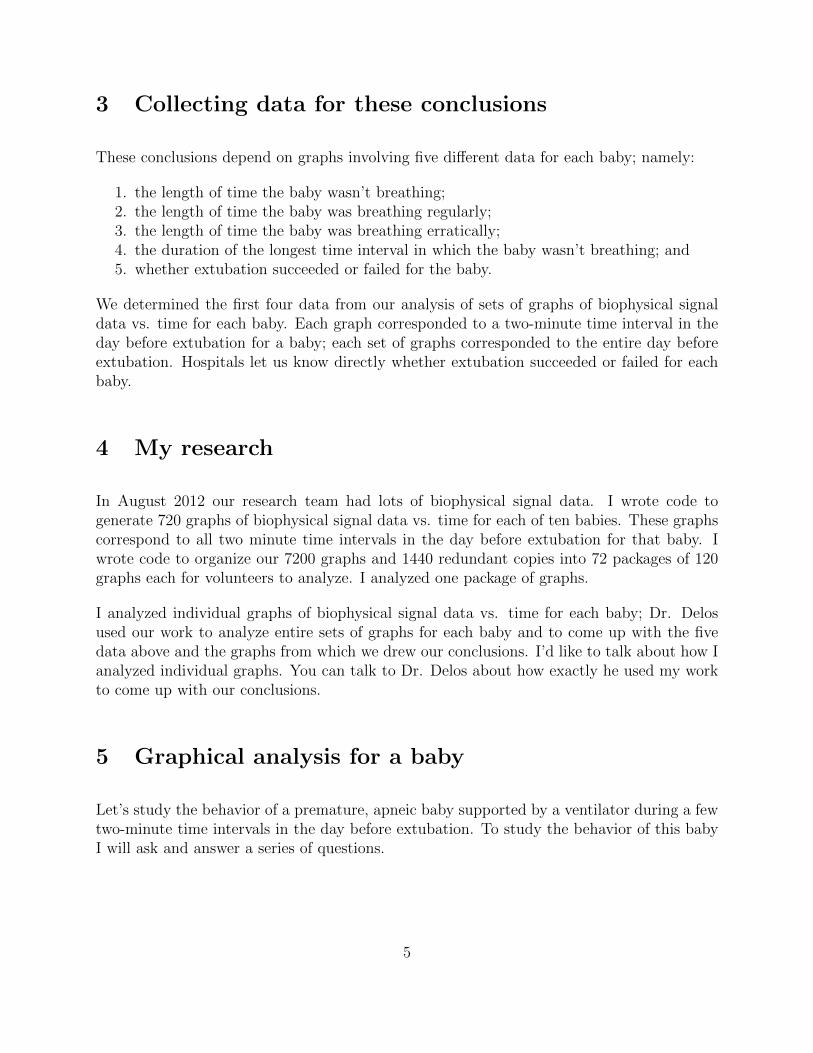
Let’s consider a graph (Fig. 3). Which of the 720 graphs for this baby are we looking at?We are looking at graph 251 of 720, beginning fifteen hours and twenty-eight minutes beforeextubation. How do we interpret this graph? The baby’s filtered chest impedance signalsvary directly with natural and ventilator breathing. Reading these signals, we concludethat most of the time, the babys breathing is erratic and out of sync with her ventilator.Sometimes the babys breathing becomes regular and the ventilator supports her breathing.
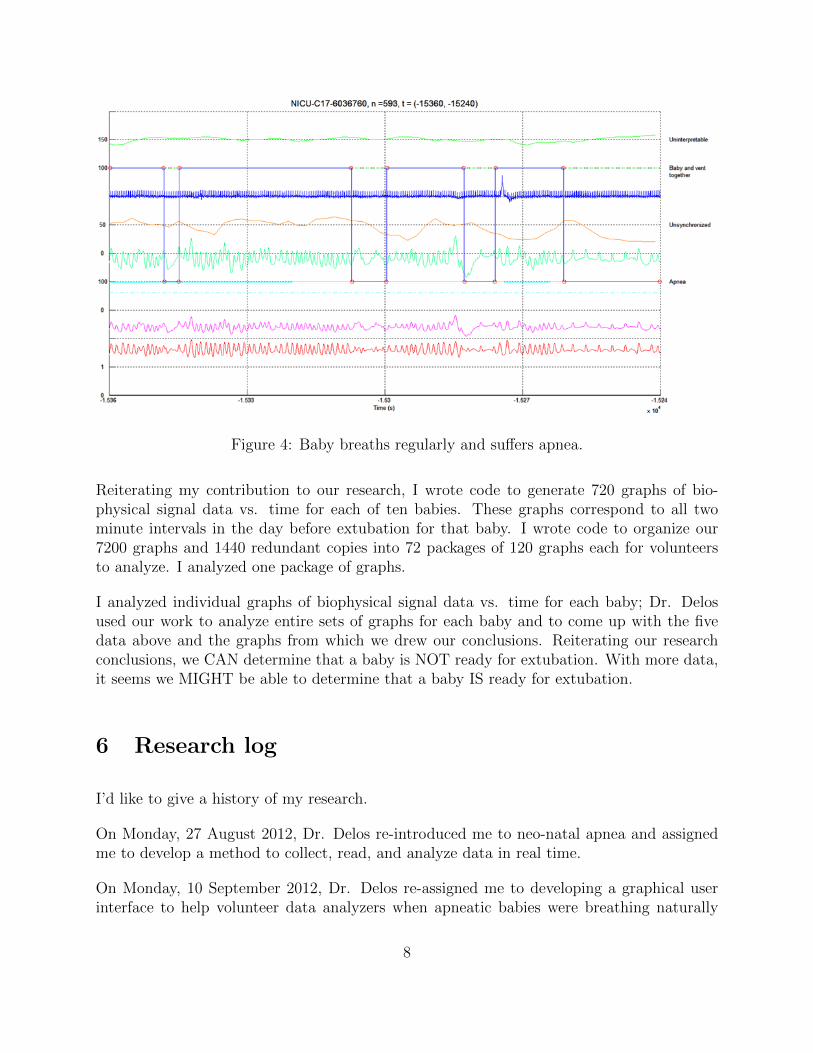
Let’s consider another graph (Fig. 4). Which of the 720 graphs are we looking at? We arelooking at graph 593 of 720, beginning four hours and fourteen minutes before extubation.How do we interpret this graph? In this case the baby’s breathing is regular, and theventilator supports her breathing most of the time. Yet the baby stops breathing (i.e.,suffers apnea events) four times over this two-minute time period. Note that the probabilityof apnea signal is zero for these apnea events: the algorithm of Lee et al. fails to filterventilator signals and identify flat lines in our chest impedance signals.
6
Figure 3: Baby breaths erratically and regularly.
Let’s consider another graph (Fig. 5). Which of the 720 graphs are we looking at? We arelooking at graph 400 of 720, beginning ten hours and forty minutes before extubation. Howdo we interpret this graph? For the first minute or so the babys breathing is erratic and outof sync with her ventilator. After a minute or so the babys breathing becomes regular andthe ventilator supports her breathing.
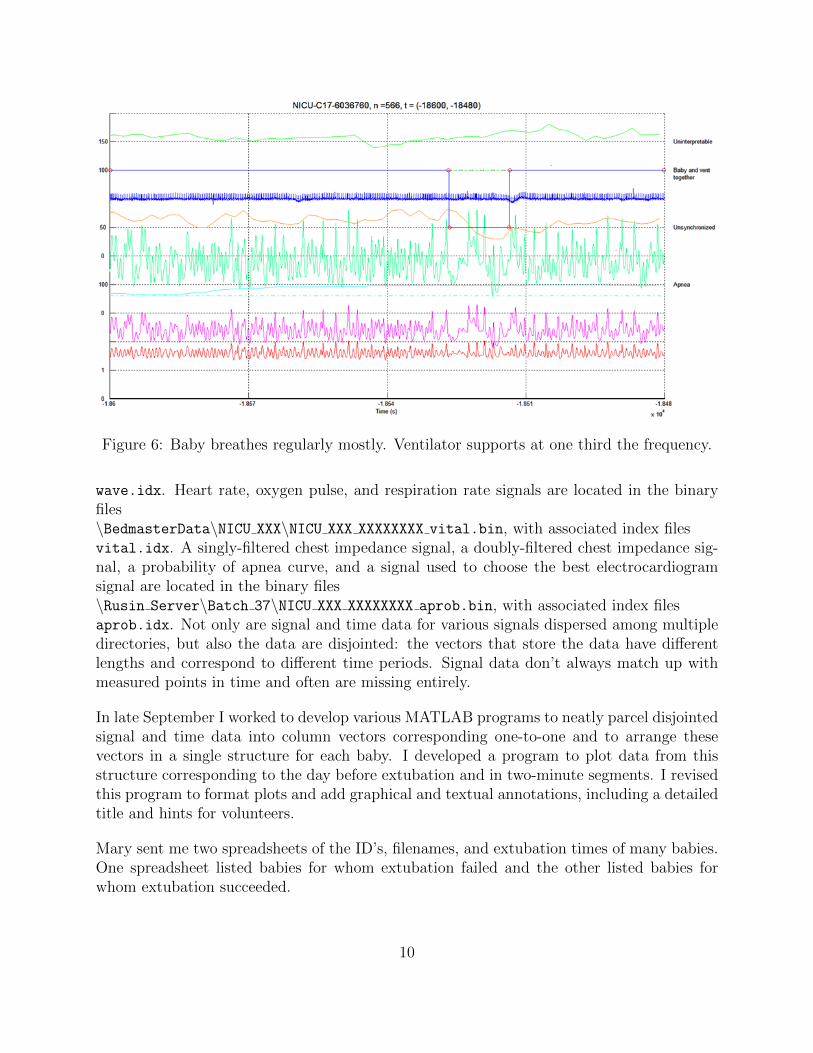
Let’s consider another graph (Fig. 6). Which of the 720 graphs are we looking at? Weare looking at graph 566 of 720, beginning five hours and eight minutes before extubation.How do we interpret this graph? Most of the time the babys breathing is regular and theventilator supports her breathing. For about ten seconds the babys breathing is erratic andout of sync with her ventilator. In this case, it seems we can distinguish baby and ventilatorbreathing: the ventilator breathes abruptly and at about one third the frequency of thebabys natural breathing.
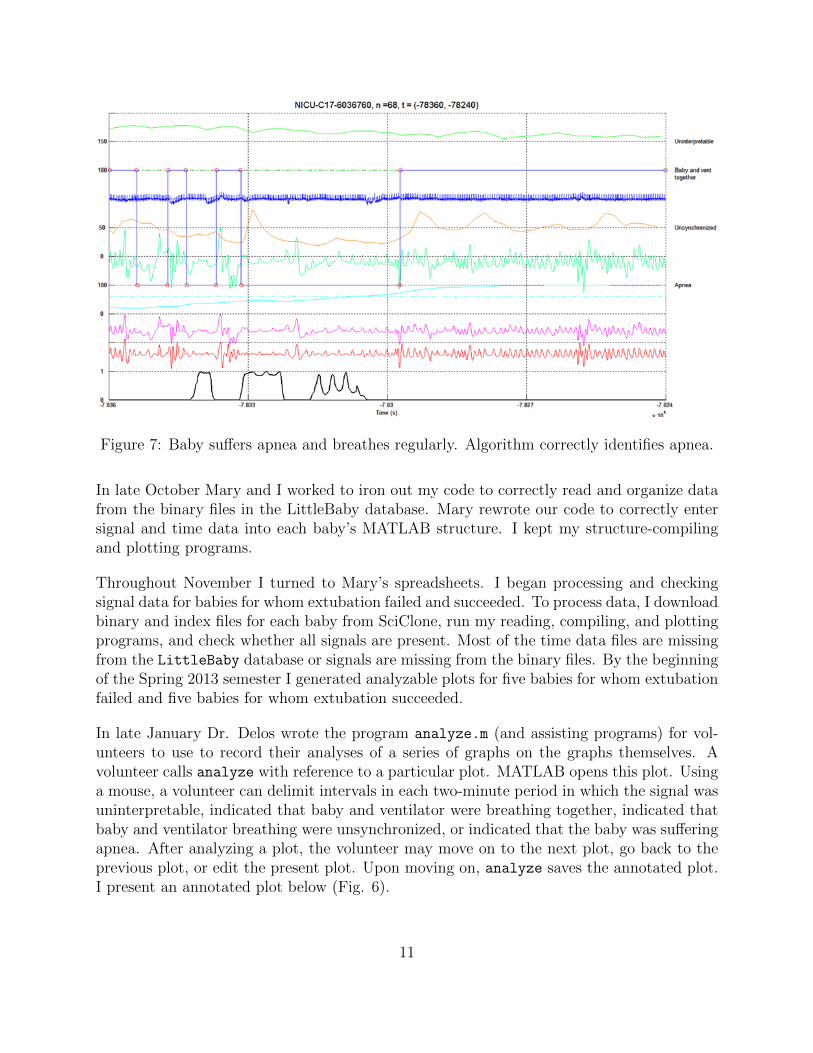
Let’s consider a final graph (Fig. 7). Which of the 720 graphs are we looking at? Weare looking at graph 68 of 720, beginning twenty-one hours and forty-four minutes beforeextubation. How do we interpret this graph? For the first minute or so the baby suffersfrequent apnea events. After a minute or so the babys breathing becomes regular andthe ventilator supports her breathing. I present this graph in part to demonstrate that ourprobability-of-apnea algorithm sometimes correctly recognizes apnea. Of course, in the othergraphs I showed you, our algorithm failed to recognize apnea. We need to develop a methodto filter ventilator signals and identify flat lines in our chest impedance signals.
7
Figure 4: Baby breaths regularly and suffers apnea.
Reiterating my contribution to our research, I wrote code to generate 720 graphs of bio-physical signal data vs. time for each of ten babies. These graphs correspond to all twominute intervals in the day before extubation for that baby. I wrote code to organize our7200 graphs and 1440 redundant copies into 72 packages of 120 graphs each for volunteersto analyze. I analyzed one package of graphs.
I analyzed individual graphs of biophysical signal data vs. time for each baby; Dr. Delosused our work to analyze entire sets of graphs for each baby and to come up with the fivedata above and the graphs from which we drew our conclusions. Reiterating our researchconclusions, we CAN determine that a baby is NOT ready for extubation. With more data,it seems we MIGHT be able to determine that a baby IS ready for extubation.
6 Research log
I’d like to give a history of my research.
On Monday, 27 August 2012, Dr. Delos re-introduced me to neo-natal apnea and assignedme to develop a method to collect, read, and analyze data in real time.
On Monday, 10 September 2012, Dr. Delos re-assigned me to developing a graphical userinterface to help volunteer data analyzers when apneatic babies were breathing naturally
8
Figure 5: Baby breathes erratically and regularly.
and when their respiration was assisted by a ventilator.
On Wednesday, 12 September 2012, I met Mary Mohr, a graduate student at William &Mary and a leader in data analysis for this research. Dr. Delos and Mary agreed that Iwould create graphs of biophysical-signal vs. time data for many babies over the twenty-fourhours before extubation (i.e., ventilator removal). These graphs would represent two-minuteintervals, to zoom in on signals and make analyzing graphs more manageable.
On Friday, 14 September 2012, Dr. Delos and I met to find me access to SciClone’sLittleBaby database. Up to this point I was unable to contact Mike Tighe, the custo-dian of my password to SciClone. I also did not know how to download large sets of datafrom LittleBaby or how to run Mary’s analyzing and graphing programs to process dataon SciClone.
On Monday, 17 September 2012, I met with Mary to learn to navigate SciClone.
On Tuesday, 18 September 2012, Dr. Delos granted me permission to access the LittleBabydatabase. I downloaded WinSCP, a file-transfer protocol, to download binary data filesfrom SciClone. The LittleBaby database is located at \sciclone\data20\LittleBaby\.The biophysical signal data I’m interested in is located in multiple directories within theLittleBaby database. Three electrocardiograms and a raw chest impedance signal are lo-cated in the binary files\BedmasterData\NICU XXX\NICU XXX XXXXXXXX wave.bin, with associated index files
9
Figure 6: Baby breathes regularly mostly. Ventilator supports at one third the frequency.
wave.idx. Heart rate, oxygen pulse, and respiration rate signals are located in the binaryfiles\BedmasterData\NICU XXX\NICU XXX XXXXXXXX vital.bin, with associated index filesvital.idx. A singly-filtered chest impedance signal, a doubly-filtered chest impedance sig-nal, a probability of apnea curve, and a signal used to choose the best electrocardiogramsignal are located in the binary files\Rusin Server\Batch 37\NICU XXX XXXXXXXX aprob.bin, with associated index filesaprob.idx. Not only are signal and time data for various signals dispersed among multipledirectories, but also the data are disjointed: the vectors that store the data have differentlengths and correspond to different time periods. Signal data don’t always match up withmeasured points in time and often are missing entirely.
In late September I worked to develop various MATLAB programs to neatly parcel disjointedsignal and time data into column vectors corresponding one-to-one and to arrange thesevectors in a single structure for each baby. I developed a program to plot data from thisstructure corresponding to the day before extubation and in two-minute segments. I revisedthis program to format plots and add graphical and textual annotations, including a detailedtitle and hints for volunteers.
Mary sent me two spreadsheets of the ID’s, filenames, and extubation times of many babies.One spreadsheet listed babies for whom extubation failed and the other listed babies forwhom extubation succeeded.
In late October Mary and I worked to iron out my code to correctly read and organize datafrom the binary files in the LittleBaby database. Mary rewrote our code to correctly entersignal and time data into each baby’s MATLAB structure. I kept my structure-compilingand plotting programs.
Throughout November I turned to Mary’s spreadsheets. I began processing and checkingsignal data for babies for whom extubation failed and succeeded. To process data, I downloadbinary and index files for each baby from SciClone, run my reading, compiling, and plottingprograms, and check whether all signals are present. Most of the time data files are missingfrom the LittleBaby database or signals are missing from the binary files. By the beginningof the Spring 2013 semester I generated analyzable plots for five babies for whom extubationfailed and five babies for whom extubation succeeded.
In late January Dr. Delos wrote the program analyze.m (and assisting programs) for vol-unteers to use to record their analyses of a series of graphs on the graphs themselves. Avolunteer calls analyze with reference to a particular plot. MATLAB opens this plot. Usinga mouse, a volunteer can delimit intervals in each two-minute period in which the signal wasuninterpretable, indicated that baby and ventilator were breathing together, indicated thatbaby and ventilator breathing were unsynchronized, or indicated that the baby was sufferingapnea. After analyzing a plot, the volunteer may move on to the next plot, go back to theprevious plot, or edit the present plot. Upon moving on, analyze saves the annotated plot.I present an annotated plot below (Fig. 6).
11
Figure 8: This graph indicates that a baby and ventilator breathed together, that baby andventilator breathing were unsynchronized, and that the baby suffered apnea.
On 18 and 19 February 2013 I wrote PackagePlots.m, CheckListOfPlotNamesForRedundancy.m,and ListPlotNamesInVolunteerPackages.m to provide ten volunteers each with a seriesof graphs to analyze using Dr. Delos’s analyze. First, for each of ten babies I orga-nized the data structure and folder of 720 plots for the day before extubation in a foldercorresponding to that baby. I organized these ten baby folders in two parent folders:BabiesForWhomExtubationFailed and BabiesForWhomExtubationSucceeded. In PackagePlots,I assembled a list of all 7,200 plots in these two folders. I randomized this list. I made asmaller list of the first 1,440 plots on this randomized master list. I randomized this smallerlist. I randomly distributed these 7,200 plots and 1,440 redundant copies into 72 packages of120 plots each for volunteers to analyze. I organized these 72 packages into one large folder.InCheckListOfPlotNamesForRedundancy, I checked to see whether a plot and its redundantcopy were in the same package; if so, I manually swapped the copy out for a plot in anotherpackage. In ListPlotNamesInVolunteerPackages, I saved lists of the plots in each packageand a master list to .mat files.
In late February, Dr. Delos, I, and three volunteers met to begin analysis. We discoveredthat all the plots from one baby were too noisy to analyze. I submitted about 108 plots thatI had analyzed to Dr. Delos in late-March.
In March, Dr. Delos began to share data with medical doctors in the University of VirginiaHealth System. By graphing on a logarithmic scale the ratio of the total apnea time to the
12
total breathing time for all ten babies vs. whether extubation succeeded or failed, Dr. Delosdetermined that the babies with the highest apnea ratios consistently failed extubation.Dr. Delos discovered a correlation between babies having short apnea times and passingextubation.
7 Mechanics of processing data
What do I do to process data? I open WinSCP, connect to SciClone, and download binaryand index files from the above directories into my local directoryC:\NeoNatalApnea\BabiesForWhomExtubationSucceeded\babyXXXX\. I run my programsin this directory. These programs generate \Plots babyXXXX\ containing 720 plots (e.g.,NICU XXX XXXXXXX 1.fig), each presenting signal data for two minutes in the day beforeextubation. These programs also generate babyXXXX.mat, a MATLAB data file containingthe structure containing all the signal and time data for babyXXXX. I examine this structureand the plots to determine whether sufficient data is presented for volunteers to analyze. Isubmit satisfactory plots to the office PC of our research team.
How do my programs work? I present them all below. ProcessData is a managing programfor my other programs. It takes the names of the binary and index files I downloaded, usingthem for reading the files and titling the plots. It takes start time and end time, twointegers from Mary’s spreadsheets delimiting the day before extubation for which to processdata, corresponding to one day before extubation and extubation, respectively. ProcessDataoutputs the folder of plots, structure of signal and time data, and .mat file, all mentionedabove.
GetData reads data from one set of binary files and combines it into a structure of signaland time data. Mary wrote it: I updated it to provide the structure and contents I wanted.
The data for some babies listed in Mary’s spreadsheets is spread out over multiple setsof wave, vital, and aprob binary files. GetData reads data from one set of binary filesand generates one structure of signal and time data. CompileData calls GetData multipletimes and combines the single structures into one large structure. It chooses the ”best”electrocardiogram signal to use, looking at the whole, combined structure. It saves thecompiled structure to a .mat file.
Read Data Segment From BIN File is used by GetData. I don’t know who wrote it or howit works. I can’t even read the file.
PlotData plots signal vs. time data for all two-minute intervals in the twenty-four hoursbefore extubation. It formats, annotates, and organizes the plots.
13
To process data I call, for example,baby6991 = ProcessData( {’NICU A4-6350663’}, 9104400-86400, 9104400 );
8 Summary
One more summary. I wrote code to generate 720 graphs of biophysical signal data vs. timefor each of ten babies. These graphs correspond to all two minute intervals in the day beforeextubation for that baby. I wrote code to organize our 7200 graphs and 1440 redundantcopies into 72 packages of 120 graphs each for volunteers to analyze. I analyzed one packageof graphs.
I analyzed individual graphs of biophysical signal data vs. time for each baby; Dr. Delosused our work to analyze entire sets of graphs for each baby and to come up with the fivedata above and the graphs from which we drew our conclusions. Reiterating our researchconclusions, we CAN determine that a baby is NOT ready for extubation. With more data,it seems we MIGHT be able to determine that a baby IS ready for extubation. We have manymore babies to study to make these conclusions more rigorous. We should consider improvingour probability of apnea algorithm, baby breathing categories, and human analyses.


![Pneumonia (Ventilator-associated [VAP] and non-ventilator ...](https://static.documents.pub/doc/80x56/61c3dfa934191a172140c0d5/pneumonia-ventilator-associated-vap-and-non-ventilator-.jpg)