Determining the Cost of VA Care with the Average Cost Method for the 1993-1997 Fiscal Years Paul G. Barnett, PhD, Shuo Chen, PhD, and Todd H. Wagner, PhD October 3, 2000 VA Health Economics Resource Center Working Paper #1 The support of the VA Health Services Research and Development Service and the VA Cooperative Studies Program is gratefully acknowledged. We also wish to acknowledge the contribution of John H. Rodgers, MA, to the early stages of this project. 1
Transcript
Determining the Cost of VA Care with the Average Cost Method for the 1993-1997 Fiscal Years
Paul G. Barnett, PhD, Shuo Chen, PhD,
and Todd H. Wagner, PhD
October 3, 2000
VA Health Economics Resource Center Working Paper #1
The support of the VA Health Services Research and Development Service and the VA Cooperative Studies Program is gratefully acknowledged. We also wish to acknowledge the contribution of John H. Rodgers, MA, to the early stages of this project.
1
Determining the Cost of VA Care with the Average Cost Method for the 1993-1997 Fiscal Years
Table of Contents 1. Overview ..................................................................................................................3 2. Cost Distribution Report ..........................................................................................4 3. Overview of Merger of Cost and Utilization Databases ..........................................9 4. Unit Cost of Outpatient Care .................................................................................13 5. VA Inpatient Databases .........................................................................................18 6. Daily Cost of Mental Health, Rehabilitation and Long-Term Care Stays ............25 7. Cost of Acute Hospital Care Stays.........................................................................26 8. References ..............................................................................................................34
Tables
1. Cost Distribution Accounts in the Cost Distribution Report, Inpatient Services 2. Cost Distribution Accounts in the Cost Distribution Report, Outpatient Services 3. Excluded Facilities 4. Facility Consolidations and the Year of their Occurrence 5. Categories of Outpatient Care 6. Median Facility Cost per Clinic Stop Visited 7. Categories of Inpatient Care 8. Median Facility Cost per Day of Stay for Mental Health, Rehabilitation, Long Term Care,
and Other Inpatient Care
2
1. Overview
The U.S. Department of Veterans Affairs (VA) provides health care to veterans at some
150 medical centers. VA does not routinely bill patients for their care. As result, VA economics
researchers have not had billing data to estimate the cost of health care encounters. This working
paper describes a method of estimating the cost of health care encounters using centralized VA
cost and utilization data bases and relative value units obtained from non-VA databases.
We used VA cost and utilization data to estimate the cost of VA patient care encounters.
Our estimates are based on the cost of patient care departments reported in the VA Cost
Distribution Report (CDR) and the detailed utilization data reported in the Patient Treatment File
(PTF) and the Outpatient Care File (OPC). This document describes methods we used for the
federal fiscal years ending in 1993 through 1997.1
We have called this the “average cost” method, as it assumes that every health care
encounter has the average cost of all encounters that share its same characteristics. While this
assumption limits the accuracy of the cost estimates, this method is the only available method of
generating a comprehensive set of encounter-level estimates of all patient care provided by VA
prior to the 1998 fiscal year. This average cost method relied on the following assumptions:
Χ To find the cost of outpatient visits, we found the average cost per clinic location that was
visited for each of 12 different types of outpatient care. We assumed that all visits within
each category have the same cost.
Χ To find the cost of long-term, rehabilitation, and psychiatric hospital stays, we found the
average cost of a day of stay, and applied it to estimate the cost of care. This makes the
assumption that every day of stay has the same cost, that is, that costs are proportionate to
the length of stay.
1. The federal fiscal year begins on October 1 and ends on September 30 of the following year. We follow the convention of referring to a federal fiscal year (FY) by the year it ends, thus FY97 represents the period October 1, 1996 to September 30, 1997.
3
Χ To find the cost of acute hospital care, we used relative value units (RVUs) from the non-
VA sector. These RVUs are the Diagnosis Related Group (DRG) weights used by the
Health Care Financing Administration to reimburse U.S. hospitals for the care they
provide to Medicare patients. The RVUs reflect the effect of diagnosis on the relative
quantity of resources used in a hospital stay. We used these RVUs so that our cost
estimates would reflect the effect of diagnosis on resource use. The method we
employed makes the following assumptions: (1) that the non-VA relative value units, the
Medicare DRG weights, reflect the relative costs of VA hospital stays, (2) that all stays
with the same characteristics have the same cost, (3) that costs are exactly proportional to
the DRG weight when the length of stay is equal to the mean for that DRG, (4) and that
when a stay is different from the mean, the difference in length of stay has a constant
proportional effect on costs.
This paper begins with a description of the VA Cost Distribution Report (CDR), our
source of cost information. It then provides an overview of our method of combining the CDR
with the VA utilization files.
Section 4 describes how these data were used to estimate the unit costs for outpatient
care. Section 5 describes VA inpatient databases, and how we tabulated them to find the costs of
hospital stays. Section 6 describes our method of determining the daily cost of mental health,
rehabilitation, and long-term care stays. The final section of this working paper describes our
method of finding the cost of acute hospital stays.
The paper includes comments to indicate our plans for improvements in the costing
method that we plan to adopt for FY98 and subsequent fiscal years.
2. Cost Distribution Report
The Cost Distribution Report (CDR), also called report RCS 10-0141, is routinely
prepared by all VA medical centers. The CDR represents an estimate of the costs expended by
each VA patient care department.
VA expenditures are recorded in its general ledger, the Financial Management System
4
(FMS). The FMS system tracks expenditures by cost center, a budget entity which corresponds
to a VA service. Examples of VA cost-centers are Medical and Plant Operations. Cost centers
do not correspond to a specific patient care department.
The CDR is created by distributing costs reported in the FMS cost centers to the “cost
distribution accounts” (CDA) of the CDR. The CDAs include patient care departments, such as
Medical Intensive Care, or Medical Ambulatory Care. CDAs also include indirect cost
departments.
The distribution of costs is based on estimates prepared by the service chiefs in each
medical center. They estimate the amount of time staff spend on different activities. The cost of
staff time, as reported in FMS, is then assigned to each CDA. At the end of each fiscal year, a
cumulative CDR is prepared, and it is reconciled to the costs reported in FMS.
Table 1 lists the inpatient cost distribution accounts in the CDR, Table 2 lists the
outpatient cost distribution accounts. (There are additional cost accounts, such as cost of contract
providers, home care programs, and benefits, which are not included in either table).
Table 1 Cost Distribution Accounts (CDAs) in the Cost Distribution Report
Inpatient Services
COST DISTRIBUTION ACCOUNT DEPARTMENT DIRECT COST INDIRECT COST GENERAL MEDICINE 1110 NEUROLOGY 1111 REHABILITATION 1113 EPILEPSY CENTER 1114 BLIND REHAB 1115 SPINAL CORD INJ 1116 1100 MED INT CARE UNIT 1117 INPATIENT DIALYSIS 1118 INPATIENT AIDS 1119 GEM UNIT - MED BEDS 1120 PRIMARY CARE – MED 1130 SURGICAL WARD COST 1210 SURG INTENSIVE UNITS 1211 OPERATING ROOM SUITE 1212 1200 OPEN HEART SURGERY 1213 PRIMARY CARE – SURG 1230
5
Table 1 (continued)
PSYCHIATRIC WD COST 1310 GEN INTERMEDIATE PSY 1311 S/A INTERMED CARE 1312 1300 S/A TREAT PROG – HI 1313 SPEC INPAT PTSD UNIT 1314 EVAL/BRIEF TRMT PTSD 1315 STAR I, II & III 1316 S/A STAR I, II & III 1317 GEM UNIT - PSYCH BED 1320 PRIMARY CARE – PSYCH 1330 NURSING HOME OVERHEAD 1400 VA NURSING HOME CARE 1410 1400 GEM UNIT - NH BEDS 1420 DOMICILIARY BED SECT 1510 DOM SUBSTANCE ABUSE 1511 1500 PTSD RESID REHAB DOM 1512 GEM UNIT - DOM BEDS 1520 INTERMEDIATE CARE 1610 1600 GEM UNIT - INT BEDS 1620 PRRTP 1711 PRRP 1712 SARRTP 1713 1700 HCMI CWT/TR 1714 SA CWT/TR 1715 GENERAL CWT/TR 1717
Tables 1 and 2 also explain the correspondence between direct and indirect costs in the
CDR. The middle column lists the direct costs CDAs. These represent costs directly attributed
to patient CDAs, such as the cost of physician services, nursing staff, laboratory services,
supplies, etc. The right column provides the indirect CDAs. The CDR does not distribute these
indirect costs to each department; however, they are only distributed to a group of departments.
Although there are more than 40 direct cost accounts, there are just 7 corresponding indirect cost
accounts. There is just one indirect CDA to correspond to the 31 direct CDAs for outpatient
care.
Each of these indirect CDA accounts include as many as eleven different types of indirect
costs, each distinguished by numbers to the right of the decimal place. The types of indirect
costs include education (.11, .12, .13, .14), research (.21 and .22), administrative support (.30),
6
building management (.40), engineering (.50), equipment depreciation (.70), building
depreciation (.80). Thus the indirect cost account “medical research support” for medical bed
section is designated as 1100.21, and includes the costs of medical research associated with the
eleven CDAs numbered between 1100 and 1118. We used the CDR detail file as our source of
data, as it includes indirect cost CDAs for equipment and building depreciation that are not
included in the CDR jurisdictional file.
Table 2 Cost Distribution Accounts in the Cost Distribution Report
Outpatient Services
DEPARTMENT DIRECT COST INDIRECT COST MEDICINE - SOC 2110 ADMITTING/SCREENING 2111 HIV/AIDS OP CLINICS 2119 OP PRIMARY CARE MED 2130 SYRGERY - CBC 2210 AMB OPERATING ROOM 2211 OP PRIM CARE SURG 2230 SPEC PSYCH - SOC 2310 GEN PSYCH - SOC 2311 HCHV/HMI SOC 2312 2800 PTSD CLINICAL TEAM 2313 PSYSOCIAL-GRP SOC 2314 PSYSOC-IND SOC 2315 SUBSTANCE ABUSE (OP) 2316 SUBSTANCE USE DISORD 2317 HUD/VASH SOC 2318 COMMUNITY OUTREACH 2319 OP PRIM CARE SPT SOC 2330 OP PRIM CARE GEN SOC 2331 DIALYSIS - SOC 2410 CANCER TREATMENT 2420 ADULT DAY HLTH CARE 2510 ANCILLARY SVC - SOC 2610 REHAB-SUPT SVCS 2611 DIAGNOSTIC SVC - SOC 2612 PHARMACY - SOC 2613 PROSTHETICS/ORTHOT 2614 SCI SUBS ABUSE OP 2616 DENTAL PROCEDURES 2710 DOM AFTERCARE - VA 2750 TELEPHONE CONTACTS 2780
7
Distribution of Indirect Costs. Our average cost estimate required information about
each CDA, including its share of indirect costs. The CDR distributes indirect costs only to
groups of patient care departments, but we needed to distribute them to each CDA. We assigned
indirect costs to each CDA in proportion to its share of the total direct costs of its group of
CDAs. For example, the indirect cost of the inpatient mental health bed sections was distributed
to the component departments of psychiatry, substance abuse, and PTSD according to each
CDA’s share of their total direct cost. At a facility where the psychiatry CDA had 55% of the
direct cost in the group of inpatient mental health CDAs, we assigned 55% of the indirect cost to
psychiatry.
We considered using quantity of utilization as the basis to allocate indirect costs. This
would have required us to assume that indirect costs are incurred in proportion to the quantity of
service provided, such as the number of inpatient days or the number of clinic visits. We
decided that this assumption was unwarranted, as services are heterogeneous. For example,
since some clinic visits have much greater direct cost, it is not reasonable to assume that they use
the same indirect cost. We are unaware of any available data to distribute VA indirect costs on
another basis, e.g., to distribute facility maintenance costs based on square footage of space.
CDR Units and Unit Costs. We did not use the units of service or the unit costs
reported in the CDR because of our lack of confidence in the accuracy of these data. Utilization
is sometimes excluded. This occurs when a cost distribution account has no cost; any
utilitization in the corresponding bed section or clinic stop is not included in the CDR. Costs are
sometimes excluded from the calculation of unit costs. This occurs when the CDR reports costs
but has no matching utilization, since unit costs would otherwise be a “divide by zero” error, the
computer program that creates the CDR calculates the unit costs for that department to be zero;
in this way, the cost is effectively dropped from consideration. Instead, we used the VA
discharge (the Patient Treatment File) and ambulatory care data bases (the Outpatient Care File)
as our source of utilization data in order to find the per unit cost of services.
8
3. Overview of Merger of Cost and Utilization Databases
This section describes how we merged the CDR with VA utilization data bases. The VA
database of hospital stays is called the Patient Treatment File (PTF); its database of outpatient
visits is called the outpatient care file (OPC).
We excluded the cost of facilities that do not provide patient care. Over time, facilities
have consolidated, but these consolidations were not necessarily implemented at the same time in
the cost and utilization databases. We recoded data to keep a common definition of facility in
the databases. Since patient care departments are sometimes defined differently in the cost data
than in the utilization data, we aggregated departments to find a common denominator.
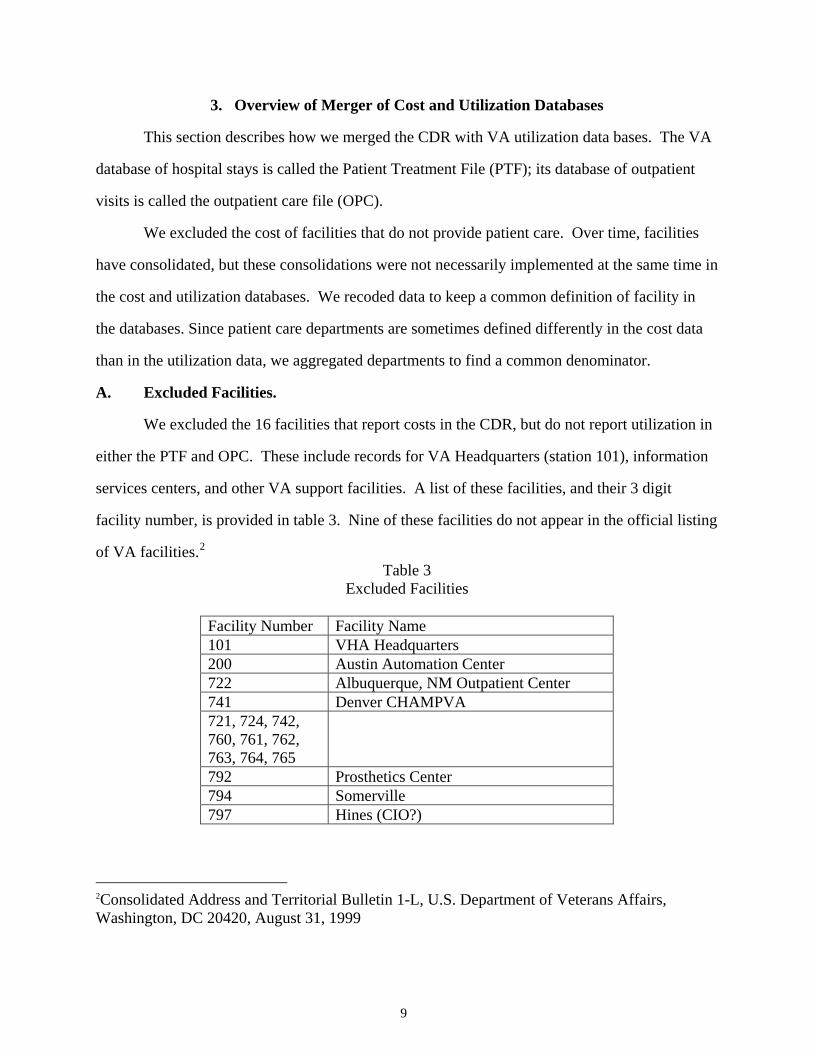
A. Excluded Facilities.
We excluded the 16 facilities that report costs in the CDR, but do not report utilization in
either the PTF and OPC. These include records for VA Headquarters (station 101), information
services centers, and other VA support facilities. A list of these facilities, and their 3 digit
facility number, is provided in table 3. Nine of these facilities do not appear in the official listing
of VA facilities.2 Table 3
Excluded Facilities
Facility Number Facility Name 101 VHA Headquarters 200 Austin Automation Center 722 Albuquerque, NM Outpatient Center 741 Denver CHAMPVA 721, 724, 742, 760, 761, 762, 763, 764, 765
792 Prosthetics Center 794 Somerville 797 Hines (CIO?)
2Consolidated Address and Territorial Bulletin 1-L, U.S. Department of Veterans Affairs, Washington, DC 20420, August 31, 1999
9
We felt that central administration may involve activities that are more characteristic of a
health care payer, rather than a health care provider. For this reason, we decided not to count
these facilities as overhead cost to be distributed to patient care departments.
B. Facility Mergers
VA has been consolidating facilities. When one facility merges with another, they both
take on a single identification number (See Table 4). This change is sometimes implemented at
different times in the different data systems. We wished to maintain the distinction between
facilities as long as it was possible. We also wished to work with observations that consisted of
facility level data for an entire fiscal year. We consolidated all data into the new facility number
in the first fiscal year that the CDR or the utilization databases no longer maintained a distinction
between the facilities. Table 4
Facility Consolidations and the Year of their Occurrence
VHA Integrated Health Care Systems Date of Merger
Old facility number
New facility number
VA Palo Alto Health Care System (Palo Alto/Livermore) April 1995 599 640 VA Puget Sound Health Care System (Seattle/Tacoma) July 1995 505 663 VA Connecticut Health Care System (West Haven/Newington) July 1995 627 689 VA Maryland Health Care System (Baltimore/Fort Howard/Perry Point) October 1995 641, 566 512 VA Central Texas Health Care System (Temple/Marlin/Waco) October 1995 611, 685 674 VA South Texas Health Care System (San Antonio/Kerrville) October 1995 591 671 VA Northern Indiana Health Care System (Marion/Fort Wayne) October 1995 569 610 VA Western New York Health Care System (Buffalo/Batavia) January 1996 513 528 VA New Jersey Health Care System (East Orange/Lyons) July 1996 604 561 VA Black Hills Health Care System (Fort Meade/Hot Springs) July 1996 579 568 VA Pittsburgh Health Care System (University Drive/Highland Drive) October 1996 645 646 VA Chicago Health Care System (Westside/Lakeside) January 1997 535 537 VA Central Alabama Health Care System (Montgomery/Tuskegee) January 1997 680 619 VA North Texas Health Care System (Dallas/Bonham) January 1997 522 549 Southern California System of Clinics (Sepulveda/Los Angeles/Santa Barbara)
July 1997 665 691
Hudson Valley VA Health Care System (Montrose/Castle Point) July 1997 533 620 VA Central Iowa Health Care System (Des Moines/Knoxville) October 1997 592 555 VA Greater Nebraska Health Care System (Lincoln/Grand Island) October 1997 574 597 VA Eastern Kansas Health Care System (Topeka/Leavenworth) January 1998 686 677 VA Montana Health Care System (Fort Harrison/Miles City) July 1998 617 436 North Florida/South Georgia Veterans Health Care System (Gainesville/Lake City)
October 1998 594 573
VA Greater Los Angeles Health Care System (West Los Angeles/Southern California System of Clinics)
October 1998 752 691
10
VA Boston Health Care System (Boston/Brockton/West Roxbury) July 1999 525,690 523 New York Harbor Health Care System (New York/Brooklyn) October 1999 527 630 VA Health Care Network Upstate New York System (VA Western New York Health Care System/Canandaigua)
October 1999 532 528
C. Definition of patient care unit.
Patient care units are defined differently in the CDR and the utilization databases. In the
CDR, care is characterized by the cost distribution account. The Cost Distribution Report
Handbook (U.S. Department of Veterans Affairs, 1996) maps the correspondence between Cost
Distribution Accounts and the utilization databases. It does not include the Cost Distribution
Accounts and utilization codes created since 1996, so the handbook is now out of date.
The Patient Treatment File (PTF) characterizes inpatient care by the “bed section.”3 The
bed section is the type of ward where the patient received care, such as medical intensive care
unit, or nursing home unit. Each inpatient Cost Distribution Account in the CDR reports the
costs of operating a group of several different bed sections. To learn about the correspondence
between new bedsection codes and new cost distribution accounts, we examined the variable
“BEDCDR” in the PTF bedsection file. This variable has the value of the CDA that corresponds
to the bedsection. Only one CDA is assigned to each bedsection. As a result, the exact
correspondence between “BEDCDR” and “BEDSECN” (the variable for bed section) in the PTF
represents a statement of the CDA associated with each bedsection.
The OPC characterizes care using the “clinic stop”, the location where care was
delivered. Each outpatient Cost Distribution Account reports the costs of operating a group of
outpatient clinic stops. The CDA associated with new clinic stops is provided in a policy that
3. The bed section is the “treating specialty” assigned to the physician who is responsible for the patient’s care. It roughly corresponds to the location where care is delivered. We used this variable from the PTF, called BEDSECN, to characterize inpatient care. PTF includes another variable, PLBED, to denote the location where care was provided. We did not use this variable to characterize the location of care because many records have missing values for PLBED, whereas all records have a value for BEDSECN.
11
defines clinic stops (U.S. Department of Veterans Affairs, 1998). 4
Our review of CDR data suggested that many medical centers do not consistently use the
definitions given in the CDR handbook and these supplemental sources. The cost of providing
care in a particular bed section or clinic stop is not always assigned to the corresponding CDA
specified in the CDR handbook. Some facilities have utilization in bed sections or clinic stops
without assigning any costs to the corresponding CDA. In other cases, costs are assigned to a
CDA, but no utilization appears in the corresponding bed sections or clinic stops.
One cause of this problem is the addition of new CDAs to the CDR, new bed sections to
the PTF, and new clinic stops to the OPC. Facilities may implement new utilization codes and
CDAs at different times.
We dealt with these issues by defining aggregate “patient care categories.” These
categories represent our judgment about what constitutes the smallest common denominator
between cost and utilization. A patient care category represents a group of related cost
distribution accounts, and their associated utilization.
We defined patient care categories for each year. We compared cost and utilization data
for each year for each medical center. We aggregated CDAs into categories, and ascertained that
for almost every medical center, if the category had costs, it also had utilization; and if it had
utilization, it also had costs. We also examined the mean cost of care, examining outliers that
suggested mismatch of cost and utilization data.
For some categories of care at some medical centers, there were still mismatches between
cost and utilization data. When there was no apparent way to match data, and the mismatched
data were small, we simply dropped the observation. For FY97, a total of $3.2 million in cost,
4. In 1998, outpatient stops were renamed DSS identifiers, and changes were made to the codes that are used. The reference between DSS identifiers and Cost Distribution Accounts is found in VHA Directive 96-057 "Ambulatory Care Data Capture FY98 Decision Support System.” Identifiers (DSS ID's),” <http://www.va.gov/publ/direc/health/direct/196057c3.htm>, which also provides a sentence description of each DSS Identifier.
12
6,600 days of stay, and 29,309 visits were dropped from further analysis because there was no
apparent way to match them into a single category of care.
Most mismatches were handled by assigning the costs and utilization to a similar
department, creating a higher level of data aggregation. Examples of this aggregation include the
grouping of inpatient substance abuse care with inpatient psychiatric care, outpatient substance
abuse care with outpatient psychiatric care, intermediate care with long-term care, spinal cord
injury and blind rehabilitation care with rehabilitation care, and rehabilitation care with
medicine. The most prevalent problem handled this way was the lack of correspondence
between cost and utilization for inpatient substance abuse care. In FY97, there were 20 medical
centers with mismatched data. We combined substance abuse treatment with the inpatient
psychiatry category at all but two sites; at these two sites, the mismatch involved less than 5 days
of stay, and the observations were dropped.
Intermediate care was another category that had cost and utilization data that were
inconsistent. In FY97, 9 sites had data mismatches; at 6 sites, we reassigned the data to the long-
term care category of care; care was assigned to medicine at two sites which did not provide
long-term care, and at one site, 4 days of stay were simply dropped.
4. Unit Cost of Outpatient Stops
Outpatient Care File. Information on outpatient visits is maintained in the outpatient
care file (OPC). Clinical encounters are characterized by a “stop code,” a three-digit code that
corresponds to a location where care was provided.
For FY 1996 and earlier years, the OPC was organized so that a single record represented
all outpatient care received by a single patient on a given day. As many as 15 different clinic
"stops" were reported in each record. VA used either one or two stop codes to characterize each
scheduled clinical encounter. Approximately one-third of patient care encounters were
characterized with a secondary stop code, called a “credit stop.” It was not possible to
distinguish credit stops from the principal stop code in the OPC for FY96, or for earlier years.
As a consequence, it was not possible to tell the exact number of outpatient encounters that
13
14
occurred on days represented in the OPC with a record with two or more stop codes. For
example, two stop codes might have represented two distinct encounters, or they may have
represented the primary and credit stop for a single encounter.
VA reorganized the outpatient file beginning with FY97. The new file is known as the
outpatient extract of the National Patient Care Database (NPCD). Primary and credit stops were
recorded as distinct fields in a new file, with one record per clinical encounter. At the same time,
the use of credit (secondary) stops was limited; for a given primary stop code, only certain credit
stops could be used, and only for the specific purpose of providing further identifying the
location of care. This change took place October 1, 1996, affecting utilization for FY97 and
subsequent years. The new outpatient data also includes up to 12 different Current Procedures
Terminology (CPT) codes to characterize the services that were provided during the visit.
Comment: For FY98 and subsequent years, we plan to consider only the primary stops.
Outpatient care categories. Outpatients clinics were grouped into 12 categories based
on the similarity of services provided and the personnel providing them (see Table 5). For
example, all types of physical and occupational therapy were grouped together; medical clinics
were grouped together, but kept distinct from visits to surgery clinics.
Outpatient Adult Day Health 2510,2800* 190 2510,2800* 190 2510,2800* 190 NOTES: “^” indicates that the costs in the telephone care account were allocated by proportional utilization to the care categories and “*” indicates an overhead account whose costs were allocated proportionally across more than one care category.
15
16
Table 5. (continued)
CATEGORY OF CARE FY96
CDR ACCT FY96
STOP CODE FY97
CDR ACCT FY97
STOP CODE Outpatient Medicine 2110,2111,
2130,2780^, 2800*
101-103,301-326, 328,330-332,428
2110,2111, 2130,2780^, 2800*
101-103,290,293, 301-326,328,330-332,428
Outpatient Dialysis 2410,2780^, 2800*
602-604,606-609, 611
2410,2780^, 2800*
602-604,606-609, 611
Outpatient Ancillary Services 2610,2780^, 2800*
117,120,122,123- 125,147,160,165-169,999
2610,2780^, 2800*
117,120,122,123- 125,147,160,165-169,999
Outpatient Rehabilitation 2611,2780^, 2800*
201-214,216 2611,2780^, 2800*
201-214,216
Outpatient Diagnostic 2612,2780^, 2800*
104-109,115,126- 128,144-146,148- 153
2612,2780^, 2800*
104-109,115,126- 128,144-146,148- 153
Outpatient Pharmacy 2613,2800* Not applicable 2613,2800* Not applicable Outpatient Prosthetics 2614,2780^,
Outpatient Adult Day Health 2510,2800* 190 2510,2800* 190 NOTES: “^” indicates that the costs in the telephone care account were allocated by proportional utilization to the care categories and “*” indicates an overhead account whose costs were allocated proportionally across more than one care category.
Telephone care. We did not rely on the CDA for telephone care, as we think that it is
unlikely that the CDR can be used to gauge the cost of this service. We distributed the costs
assigned to the telephone care Cost Distribution Account back to the component clinics which
provided telephone care. Each clinic was assigned costs on the basis of its share of the total
number of telephone "visits."
Pharmacy costs. The CDR identifies the cost of outpatient pharmacy as cost distribution
account 2613. In FY97, $1.091 billion was reported under this CDA.
There is no easily accessible, centralized source of data with information on VA
pharmacy utilization, however. In the absence of data on how to assign pharmacy costs, our
estimates of outpatient costs do not include this cost. We assume that the analyst will obtain
micro-cost information to estimate the pharmacy costs incurred by individual patients. Potential
sources of pharmacy data include the pharmacy files in the VA VISTA clinical data base. Since
FY98, the DSS system, or the National Pharmacy Benefits Management data system, may
provide this information.
Calculation of Unit Cost of Outpatient Care. We distributed the indirect costs of
ambulatory care to the 12 categories of outpatient care based on each category’s share of the total
direct cost. We tallied the number of clinic stops in each category, and divided the total cost by
the number of stops to find the average cost per clinic stop. For each category, the average cost
per clinic stop was calculated for each medical center. We found the median cost of VA medical
centers. Table 6 presents this median of facility cost stop in each of the 12 categories, excluding
pharmacy cost.
17
Table 6. Median Facility Cost per Clinic Stop Visited by Outpatient Category of Care
Comment: We assumed that all visits within each category have the same cost. This is a
strong assumption that is unlikely to be true. Prior to October 1, 1996, however, the only way
that outpatient encounters were characterized was by the stop code. After this date, VA began to
use CPT codes. Future work can use the system of relative value units associated with CPT
codes, and estimate the average cost per relative value unit for each category of care. Future
work must also address the stops that are not assigned to any cost distribution account in the
CDR handbook.
5. VA Inpatient Databases
Data sources. The VA maintains a database of hospital stays called the Patient
Treatment File (PTF). Although this database contains neither cost nor charge data, it includes
data such as patient demographics, length of stay, and the Diagnosis Related Group (DRG) for
the hospitalization.
Patient Treatment File Main and Bed-Section Files. The PTF records information on
hospital stays in two different files. It is important to understand how this information is
organized, because VA defines a hospital stay somewhat differently than the non-VA sector.
The PTF main file reports on all hospital stays that ended in a particular year. This file
18
contains one record for each hospital stay. In addition, there is another file that has multiple
records per stay. This is the bed section file. It divides hospital stays into sequential segments,
with one record for each portion of the stay spent in a different "bed section." A bed section is a
hospital ward such as medicine, intensive care, rehabilitation, or long-term care. This view
provides information on the number of days the patient spent in each bed section.
Neither the main file nor the bed section file uses a definition of a hospital stay that is
strictly comparable to the non-VA sector. In the non-VA sector, an acute hospitalization
followed by a long-term care stay would be recorded as two different stays. In the PTF main
file, this is a single stay; in the PTF bed section, it is represented by two records, analogous to the
way the non-VA sector records these as two separate stays.
In other cases, it is the PTF main that is more analogous to the non-VA sector. For
example, an acute hospital stay that began in the Intensive Care Unit and ended in a medicine
ward would be regarded as a single stay in the non-VA sector. This would be recorded as a
single record in the PTF main file, and with two records in the PTF bed section file.
We wished to apply relative value units from acute stays in non-VA hospitals to estimate
the cost of acute VA hospital stays. This required us to develop a definition of what is an acute
hospital stay. We used information from both the main and bed-section files to define an acute
inpatient stay, as described below in part 7, which describes our method of finding the cost of
acute hospital stay.
PTF Discharge and Census Files. The principal files in the PTF include information on
all stays that ended during a given fiscal year, regardless of when they began. The PTF Census
Files includes information on patients who are in a VA hospital at the end of the fiscal year.
Since cost data are reported by fiscal year, we needed data on utilization that occurred in the
fiscal year. We used the census files to obtain information on hospital care provided to patients
who had not been discharged by the end of the fiscal year.
PTF Extended Care and Non-Extended Care Files. The PTF is divided into two
components, a set of files pertaining to extended care, and another set of files pertaining to other
19
inpatient care. Most stays that are predominantly nursing home care are recorded in the
“extended care” file. Most other inpatient stays are recorded in the acute care file.5 Since stays
may be made up of both acute and long-term care, both of these files contain information on
stays that involve acute and long-term care bed-sections. The assignment of stays to one set of
files or the other did not affect our treatment of data, we merely used all data from both sets of
files for our calculations.
Merger of Cost and Inpatient Utilization Data by Time Frame
The CDR reports on expenditures in a federal fiscal year, which runs from October 1
until September 30. To find average cost, we wished to find the amount of care provided during
that fiscal year. Since hospital stays may span fiscal years, so we developed a method to divide
hospital utilization between fiscal years.6
We included days spent during the current fiscal year by patients not discharged.
We included days of stay that occurred during the fiscal year, but did not appear in the PTF
discharge file because the patient had not been discharged by the end of the fiscal year. We
obtained these days of stay from the PTF census files, which report on the stays of patients who
remain in the hospital on the last day of the fiscal year.
We excluded days prior to the current fiscal year. We excluded days of stay that
occurred before the beginning of the fiscal year. For stays that began before the beginning of the
fiscal year, we found the length of stay during the current fiscal year by finding the number of
days between the discharge date and the beginning of the fiscal year. We did not include in this
5. Beginning in FY98, a third set of files, the observation files, were created to hold information on stays on observation bed sections. 6. A possible alternative would be to simply count the days of stay spent by patients who were discharged during the fiscal year. This would assume that the days care from stays that occurred prior to the current fiscal year were equal to the days of stay of patients who were in the hospital at the year’s end. This assumption is not warranted however; because of the decline in hospital use, adopting this assumption would overstate the amount of care provided in during the fiscal year.
20
tally “leave” days, that is, days that patient was absent from hospital, though not yet discharged.7
The PTF records leave days, but does not indicate when they occurred. We assumed that leave
days are uniformly distributed throughout the stay.
Count of discharges. We also determined a count of hospital discharges, to be used in
models that considered the effect of department size on cost. The count was adjusted using the
proportion of the stay that occurred during the current fiscal year. We adopted this method to
determine the number of discharges in a way that was consistent with our method for
determining days of stay.
Inpatient care categories. We identified 10 categories of inpatient care (see Table 7).
Note that the groupings are different in different years. The definitions were changed so that the
new bed section and cost distribution accounts that were added in recent years were used as soon
as they appear to be reliably implemented.
Comment: For future years, we plan to create an additional category of residential
rehabilitation programs.
Definition of Acute Hospital Stay
We defined an acute hospital stay as all days in a single hospital stay that were spent in
the medicine and surgical bed sections (bed sections in groups 1 and group 4 in Table 7). For
each hospital stay, we summed the days of stay in the PTF bed section file that were in these
categories of care; the total of these days represented the acute hospital stay. The remaining
days were considered “non-acute” days of hospital stay.
Comment: We will improve this definition in the future. We will define an acute hospital
stay as all segments of stay in an acute bed section that are contiguous. With this change,
transfers that occur between acute bed sections will be considered part of the same stay, but
7. Leave days are also called Absent Bed Occupant Days and are given the variable name LVB in the PTF.
21
22
transfers from an acute bed-section to another bed section (e.g., for rehabilitation, mental health,
or long-term care) will be considered to end the acute stay. If the patient is later transferred back
to an acute ward, this will be considered a new admission. Although such transfers occur
infrequently, ignoring them understates the costs of a readmission to an acute hospital bed
Includes overhead costs * We do not recommend estimating the cost of medical and surgical care based on the cost per day reported in this table. Costs vary substantially, depending on the DRG assigned to the stay. Cost estimates will be more accurate if they reflect the relative resource profile associated with the DRG.
Comment: VA long-term care patients are evaluated using the Resource Utilization
Group (RUG) assessment method. These assessments are performed at admission, transfer, and
discharge. The assessment assigns Weighted Work Units to the patient. The Weighted Work
Unit represents an estimate of the relative quantity of resources used to care for long-term care
patients (Schneider, Fries, Foley, Desmond, & Gormley, 1988). In future years, we plan to use
the relative values from the RUG assessments so that our estimates of VA long-term care costs
reflect patient acuity as measured under this system.
6. Cost of Acute Hospital Care Stays
The cost of acute medical and surgical hospital care in VA can be more accurately
estimated by applying information on the effect of diagnosis on cost (Barnett, 1997). This
method overcomes limitations inherent in assuming that every day of stay is of equal cost. We
describe two methods for estimating the cost of acute hospital stays. The first method was an
econometric method, with parameters estimated from data on the mean characteristics of stays
in VA hospitals. The second method was based on Medicare payment rates for hospital cares.
26
Both methods rely on the weights that Medicare assigns to estimate the relative cost of
providing care to patients in different Diagnosis Related Groups (DRGs). These weights were
developed by the Health Care Financing Administration (HCFA) to determine Medicare
payments to hospitals.
This section describes which VA DRG we used, how we determined the DRG weight,
and how we characterized length of stay. Then we present our econometric method of
estimating costs, an alternative cost method, based on Medicare data; finally, we present our
plans for improving our estimates of acute VA hospital cost.
A. Selecting the DRG and the relative value associated with a DRG.
A DRG is assigned to a hospital stay using the principal diagnosis, the condition that is
responsible for the patients’ admission to the hospital.8 VA assigns a DRG to each bed section
segment of the hospital stay, and another DRG to the PTF main file, representing the DRG for
the entire stay. We used the DRG assigned to the entire stay from the PTF main file.
We assigned the relative value weight published by HCFA to each stay based on the
DRG. We considered but did not use other relative value systems. We decided that the weights
developed by states to pay for care provided to Medicaid and other patients are likely to reflect
the patterns of practice in a specific state and that it would not be an appropriate to apply them to
the VA’s national system of hospitals. Some relative values systems, such as the Severity of
Illness Index, may provide some additional measure of relative cost (Averill et al., 1992), but
they are not feasible for us to implement, as they require data that are not available in centralized
VA utilization data. Patient Management Categories and Disease Staging are case-mix methods
that can be applied to standard datasets, but they have been found to explain only 1-2% more
8. Prior to October 1, 1994, VA used the primary diagnosis to define DRGs. The primary diagnosis is the most important condition treated in the stay (as opposed to the principal diagnosis, which is the diagnosis responsible for the patient’s admission to the hospital). VA DRGs from stays that ended prior to this date are thus not strictly comparable to non-VA DRGs from that time period, which have always used principal diagnosis.
27
variation than DRGs used alone (Calore & Iezzoni, 1987).
Comment: In the future, we will characterize the DRG for the acute stay as that DRG
reported in the bed section segments that make up the acute stay that has the highest Medicare
DRG relative value weight. This is essentially the method that non-VA hospitals use to identify
DRGs; they evaluate the stay and assign the DRG that will garner the maximum reimbursement
allowed under Medicare rules.
B. Length of Acute Stay
We found length of stay as the total number of days that the patient spent in acute care
bed sections during the stay. We calculated the VA national average length of acute stay for
each DRG. For each acute VA hospital stay, we calculated its deviation from the national
average length of stay for that DRG. For each facility, we then found the mean of this value.
This value was the facility level mean of deviations from DRG-specific mean length of stay.
Note that we examined only those records of patients discharged during the fiscal year
under study. We included days of stay in acute bed sections, even if they occurred in previous
fiscal years, and excluded data from stays that were not complete by the end of the fiscal year.
This is distinct from the rest of our method, which considered only the days of stay that occurred
during the fiscal year under study.
We also calculated the length of stay in Intensive Care bed sections. For each acute
hospital stay, we found the number of days spent in the medical and surgical Intensive Care bed
sections. As before, we found the national mean for each DRG, and each facility’s mean
deviation from the DRG mean. We also used a discharge view for the calculation.
C. Method 1: Estimate Based on Econometric Technique
The econometric method of estimating VA acute care costs is discussed elsewhere
(Barnett, 1997). We had information on the total cost incurred in operating the acute care bed
sections at each VA, and information on the services provided. We used the mean value for a
single VA hospital as an observation. We used the mean cost per discharge as the dependent
variable. Independent variables included the mean DRG relative value weight, the mean
28
deviations from expected length of stay, and the mean deviation from expected number of days
spent in intensive care. These “expected” values for these variables represent the national VA
average length of stay for the DRG.
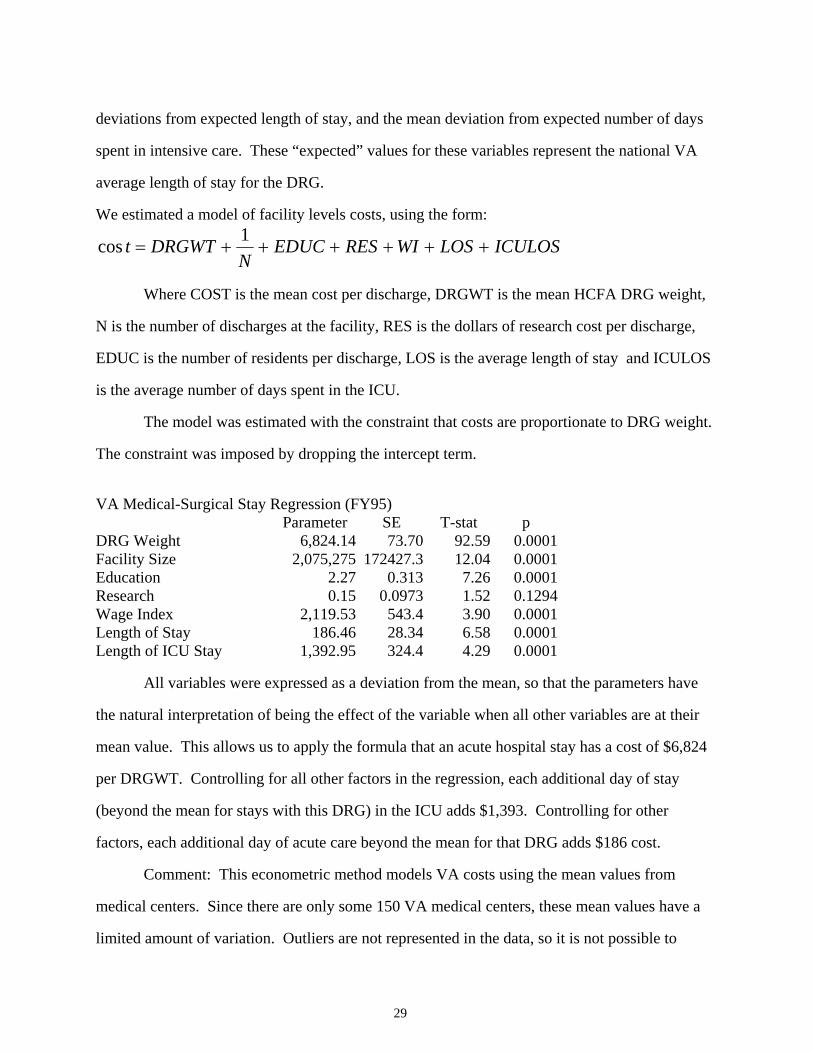
We estimated a model of facility levels costs, using the form:
ICULOSLOSWIRESEDUCN
DRGWTt ++++++=1cos
Where COST is the mean cost per discharge, DRGWT is the mean HCFA DRG weight,
N is the number of discharges at the facility, RES is the dollars of research cost per discharge,
EDUC is the number of residents per discharge, LOS is the average length of stay and ICULOS
is the average number of days spent in the ICU.
The model was estimated with the constraint that costs are proportionate to DRG weight.
The constraint was imposed by dropping the intercept term.
VA Medical-Surgical Stay Regression (FY95)
Parameter SE T-stat p DRG Weight 6,824.14 73.70 92.59 0.0001Facility Size 2,075,275 172427.3 12.04 0.0001Education 2.27 0.313 7.26 0.0001Research 0.15 0.0973 1.52 0.1294Wage Index 2,119.53 543.4 3.90 0.0001Length of Stay 186.46 28.34 6.58 0.0001Length of ICU Stay 1,392.95 324.4 4.29 0.0001
All variables were expressed as a deviation from the mean, so that the parameters have
the natural interpretation of being the effect of the variable when all other variables are at their
mean value. This allows us to apply the formula that an acute hospital stay has a cost of $6,824
per DRGWT. Controlling for all other factors in the regression, each additional day of stay
(beyond the mean for stays with this DRG) in the ICU adds $1,393. Controlling for other
factors, each additional day of acute care beyond the mean for that DRG adds $186 cost.
Comment: This econometric method models VA costs using the mean values from
medical centers. Since there are only some 150 VA medical centers, these mean values have a
limited amount of variation. Outliers are not represented in the data, so it is not possible to
29
provide a model that represents the effect of extremes values on cost.
The HCFA DRG weights are based on hospital charges, exclusive of physician services.
These weights don’t reflect physician costs, so we are assuming that relative cost of physician
services for a given DRG is the same as the relative cost of hospital services for that DRG.
The estimates could be substantially improved with a model based stay-level
observations, as discussed below.
D. Method 2: Estimate based on Medicare payment rules.
We developed an alternative method of estimating VA acute care costs using the rules
developed by HCFA to reimburse hospitals for acute care. This method employs national
average payment rates for DRGs, applying separate weights to the hospital and physician costs
of providing acute hospital care.
Hospital component. For 1996, we estimated that Medicare paid $5,267 per DRG
relative value weight, and that hospital stays cost an additional $2,050 for each day of stay
deviation from the mean length of stay for that DRG.
Our estimate of cost per DRG is based on Medicare payment rules and information from
the Prospective Payment Commission (ProPAC).9,10 We included the standard payment per
DRG weight, and additional amounts for the capital reimbursement, outlier payments, indirect
and direct medical education, and for assistance to disproportionate share providers.
We estimated that the standard payment was $3,808 per DRG weight. This represents an
average of the standard payment rates for large urban and other areas published in the Federal
Register. We used DRG relative value units produced by hospitals in large urban areas and
9. Federal Register / Vol. 60, No. 170 / Friday, September 1, 1995 / Rules and Regulations, “Medicare Program; Changes to the Hospital Inpatient Prospective Payment Systems and Fiscal Year 1996 Rates; Final Rule”. 10. Medicare and the American Health Care System: Report to the Congress. Prospective Payment Assessment Commission, June 1997.
30
hospitals in other areas to weigh the standard rates. The estimate of DRG relative value units
was reported by ProPAC.
We added to this standard payment rate the following costs:
• $194.22 for outlier payments, which were expected to be 5.1% of the standard payment,
according to the regulation.
• $512.15 for capital costs. The regulation projected 1996 capital payments would be
$727.26 per discharge. We did not wish to assume that every hospital stay would have
exactly the same capital cost; we decided to assign capital costs in proportion to DRG
weight. As there was an average of 1.42 DRG weights per discharge in FY96, this yields
$512.15 per DRG weight.11
• $298.43 for Indirect Medical Education payments, reflecting a 7.84% rate.
• $291.94 for Disproportionate Share Provider payments, or 7.67%.12
• $162.19 for Direct Medical Education payments, or 4.26%
These payment rates were calculated from the 1997 projected data published by ProPAC.
We estimated the total amount paid on the basis of standard payments by taking “operating
payments” and subtracting outlier, IME, and DSH payments. Capital and direct GME were
assumed not to be operating payments.
We validated this Medicare cost estimate using an independent means of estimating
costs. HCFA reported $87.5 billion in payments to acute hospitals for inpatient care in FY95,
and that inpatient costs grew at an annual rate of 5.2% during the period 1990-1996. According
to HCFA Medpars data, Medicare paid for 11.7 million discharges; these had an average DRG
weight of 1.422, yielding a total of 16.7 million DRG weights. These data suggest an average
11. Using the $8 billion capital estimate in the ProPAC report gives a 13.63% capital cost, or $519.00 per DRG weight, a very similar value. 12. Using the 5.28% outlier payments implied in the ProPAC report suggests a $201.11 outlier payment cost. These are quite similar to the original estimate.
31
payment of $5,509 per DRG weight in FY96. Since some discharges are excluded from the
Medpars report (to avoid disclosing patient data), this figure represents an upper bound of the
cost.
Cost per Marginal Day. We wished to develop a method that captures the effect of both
DRG and differences in length of stay. We wanted estimates to reflect the higher cost for stays
that are longer than average for their DRG, and the lower cost of days that are shorter than
average. We wished to avoid the assumption that all stays in the same DRG have exactly the
same cost, regardless of the length of stay.
We used an econometric technique to estimate the marginal cost of stays that are longer
(or shorter) than average for their DRG. Using Medicare MEDPARS hospital discharge data of
the stays of veterans in non-VA hospitals, we estimated a model with cost-adjusted charges as
the dependent variable, and DRG weight and length of stay as the independent variables. We
used a simple model, which assumed that the cost of a marginal day of stay was constant, that is,
that the first day of additional stay has the same cost as the 2nd additional day, and all subsequent
days.
Comment: An econometric technique can be used to estimate the marginal cost of stays
that are longer (or shorter) than average for their DRG. The model could use cost-adjusted
charges as the dependent variable, and DRG weight and length of stay as the independent
variable.
Physician component. We estimated the cost of physician services provided to
inpatients based on the DRG and the length of stay. We took advantage of a previous study
which found the average reimbursement provided for inpatient physician services for Medicare
patients in each DRG (Miller & Welch, 1993). We used these data to assign a cost of physician
services based on the DRG. We adjusted this amount by the $51 cost of physician daily visit to
an inpatient for every day that the stay deviated from the VA mean length of stay for that DRG.
This was the Medicare reimbursement for a physician visit to an inpatient.
32
E. Plan for Improved Estimates of Acute Hospital Cost
We are developing improved relative value weights by analyzing data on non-VA
hospital stays. We are estimating a cost-function based on data that uses the hospital stay as the
unit of analysis. The use of the stay (rather than the average stay) as the unit of analysis provides
much more variation, including observations with high DRG weights and long lengths of stay.
This allows construction of a more complex model that better simulates the cost of stays with
characteristics that are very different from the mean.
We are constructing this estimate with two different sources of data: the HCUP sample of
U.S. hospitals in 22 states, and the data on Part A Medicare claims of a sample of veterans. We
are testing models that relax the constraints of our earlier estimates, allowing the cost of marginal
days of stay to vary, depending on the length of stay. In future work, we hope to estimate a
separate set of relative value weights for the physician component of hospital care (e.g., the Part
B reimbursement of Medicare).
33
34
References
Averill, R. F., McGuire, T. E., Manning, B. E., Fowler, D. A., Horn, S. D., Dickson, P. S., Coye,
M. J., Knowlton, D. L., & Bender, J. A. (1992). A study of the relationship between
severity of illness and hospital cost in New Jersey hospitals. Health Serv Res, 27(5), 587-
606; discussion 607-12.
Barnett, P. G. (1997). Research without billing data. Econometric estimation of patient-specific
costs. Med Care, 35(6), 553-63.
Calore, K. A., & Iezzoni, L. (1987). Disease staging and PMCs. Can they improve DRGs? Med
Care, 25(8), 724-37.
Miller, M. E., & Welch, W. P. (1993). Analysis of Hospital Medical Staff Volume Performance
Standards: Technical Report (6210-01). Washington D.C.: The Urban Institute.
Schneider, D. P., Fries, B. E., Foley, W. J., Desmond, M., & Gormley, W. J. (1988). Case mix
for nursing home payment: resource utilization groups, version II. Health Care Financ
Rev, Spec No, 39-52.
U.S. Department of Veterans Affairs. (1996). CDR Handbook: A Guide for Preparing the Cost
Distribution Report .
U.S. Department of Veterans Affairs. (1998). Ambulatory Data Capture: DSS Identifiers