Work Assignment 4-12 under EPA Contract No. 68-D-01-073 Evaluation of PM 2.5 Emissions and Controls at Two Michigan Steel Mills and a Coke Oven Battery Final Report Submitted to Amy Vasu Air Quality Strategies and Standards Division Office of Air Quality Planning and Standards U.S. Environmental Protection Agency Research Triangle Park, NC 27709 Submitted by RTI International 3040 Cornwallis Road Research Triangle Park, NC 27709-2194 February 7, 2006
Transcript
Work Assignment 4-12 under EPA Contract No. 68-D-01-073
Evaluation of PM2.5 Emissions and Controls at Two Michigan Steel Mills
and a Coke Oven Battery
Final Report
Submitted to
Amy Vasu Air Quality Strategies and Standards Division
Office of Air Quality Planning and Standards U.S. Environmental Protection Agency
Research Triangle Park, NC 27709
Submitted by
RTI International 3040 Cornwallis Road
Research Triangle Park, NC 27709-2194
February 7, 2006
Evaluation of PM2.5 Emissions and Controls at Two Michigan Steel Mills and a Coke Oven Battery
Work Assignment 4-12 under EPA Contract No. 68-D-01-073
Evaluation of PM2.5 Emissions and Controls at Two Michigan Steel Mills and a Coke Oven Battery
Final Report
Submitted to
Amy Vasu Air Quality Strategies and Standards Division Office of Air Quality Planning and Standards
U.S. Environmental Protection Agency Research Triangle Park, NC 27709
Submitted by
RTI International1 3040 Cornwallis Road
Research Triangle Park, NC 27709-2194
February 7, 2006
1 RTI International is a trade name of Research Triangle Institute.
Evaluation of PM2.5 Emissions and Controls at Two Michigan Steel Mills and a Coke Oven Battery
ii
[This page intentionally left blank.]
Evaluation of PM2.5 Emissions and Controls at Two Michigan Steel Mills and a Coke Oven Battery
iii
Table of Contents Section Page
List of Figures ................................................................................................................................ iv List of Tables ................................................................................................................................. iv Acronyms and Abbreviations ..........................................................................................................v Executive Summary .........................................................................................................................1 1.0 Introduction.............................................................................................................................1 2.0 Facility Descriptions ...............................................................................................................1
2.1 Severstal.........................................................................................................................1 2.2 U.S. Steel and EES Coke ...............................................................................................2
3.0 Descriptions of Processes, Emissions, and Controls ..............................................................2 3.1 Ironmaking.....................................................................................................................4
3.1.1 Process Description............................................................................................4 3.1.2 Emissions and Controls......................................................................................5
3.2 Hot Metal Transfer, Desulfurization, and Slag Skimming ............................................8 3.3 Steelmaking....................................................................................................................8
3.3.1 Process Description............................................................................................8 3.3.2 Emissions and Controls....................................................................................10
3.4 Coke Ovens..................................................................................................................12 3.4.1 Process Description..........................................................................................12 3.4.2 Emissions and Controls....................................................................................13
4.0 Permit Limits and Performance ............................................................................................16 4.1 Limits and Conditions..................................................................................................16 4.2 Performance .................................................................................................................17
4.2.1 USSGLW .........................................................................................................17 4.2.2 Severstal...........................................................................................................17 4.2.3 EES Coke .........................................................................................................17
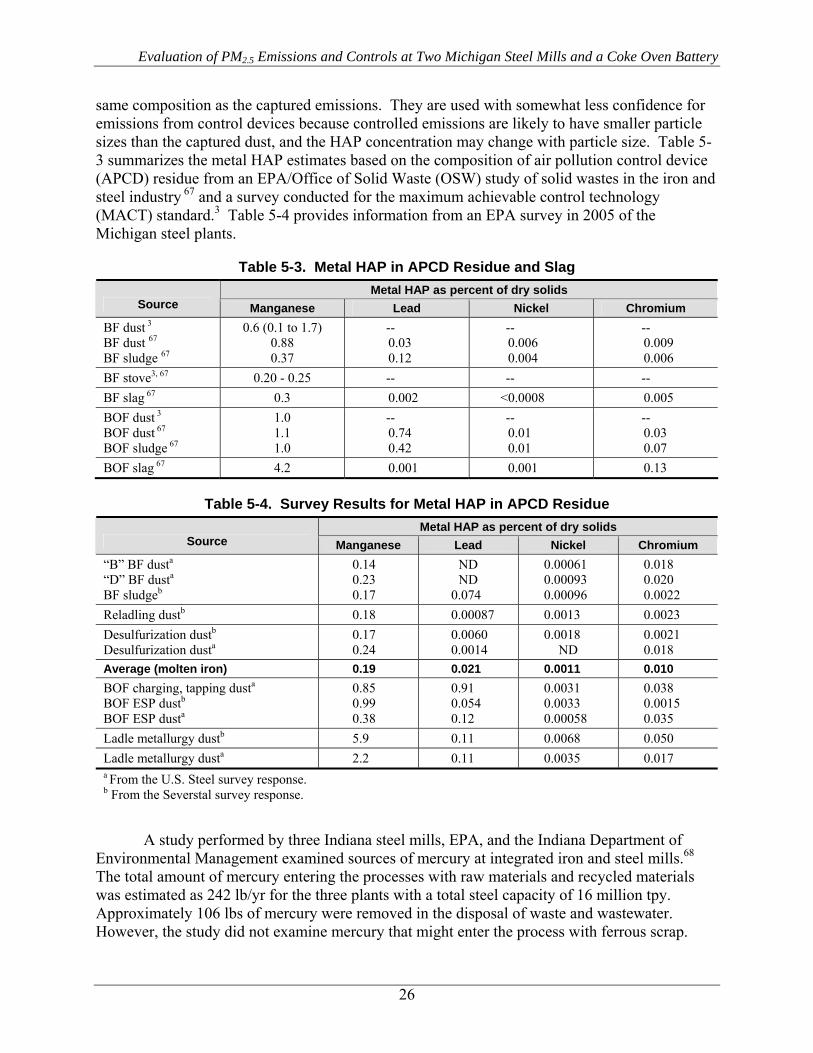
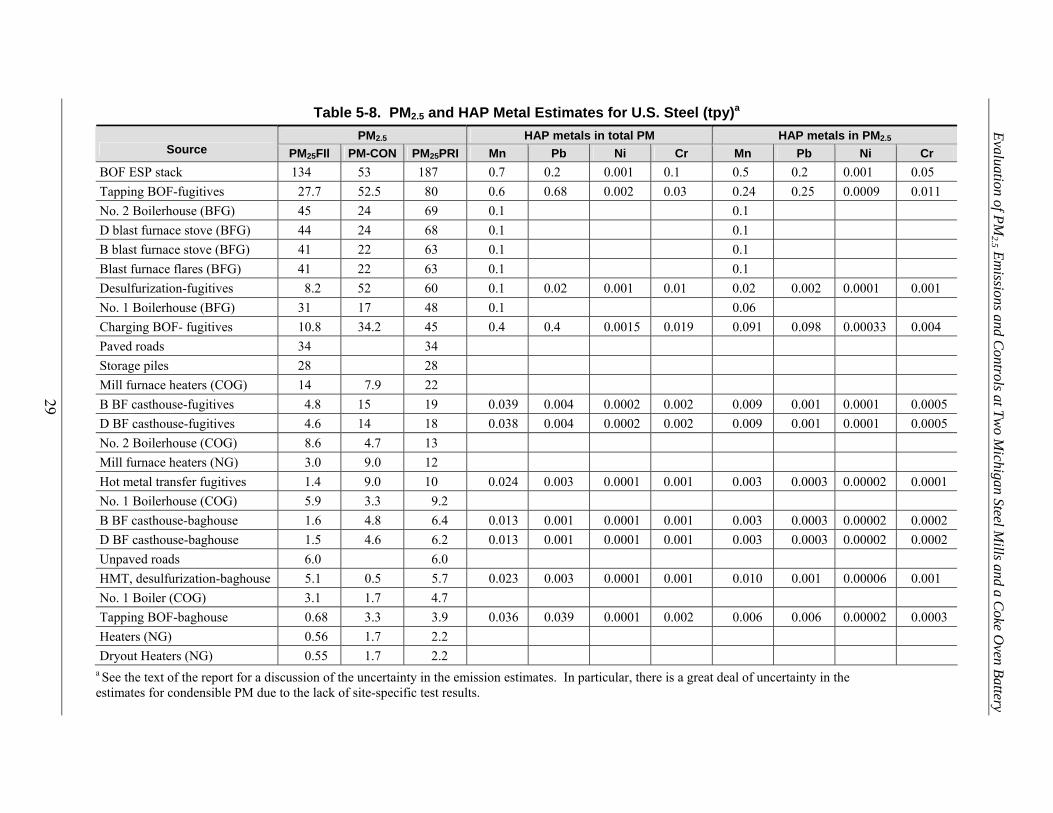
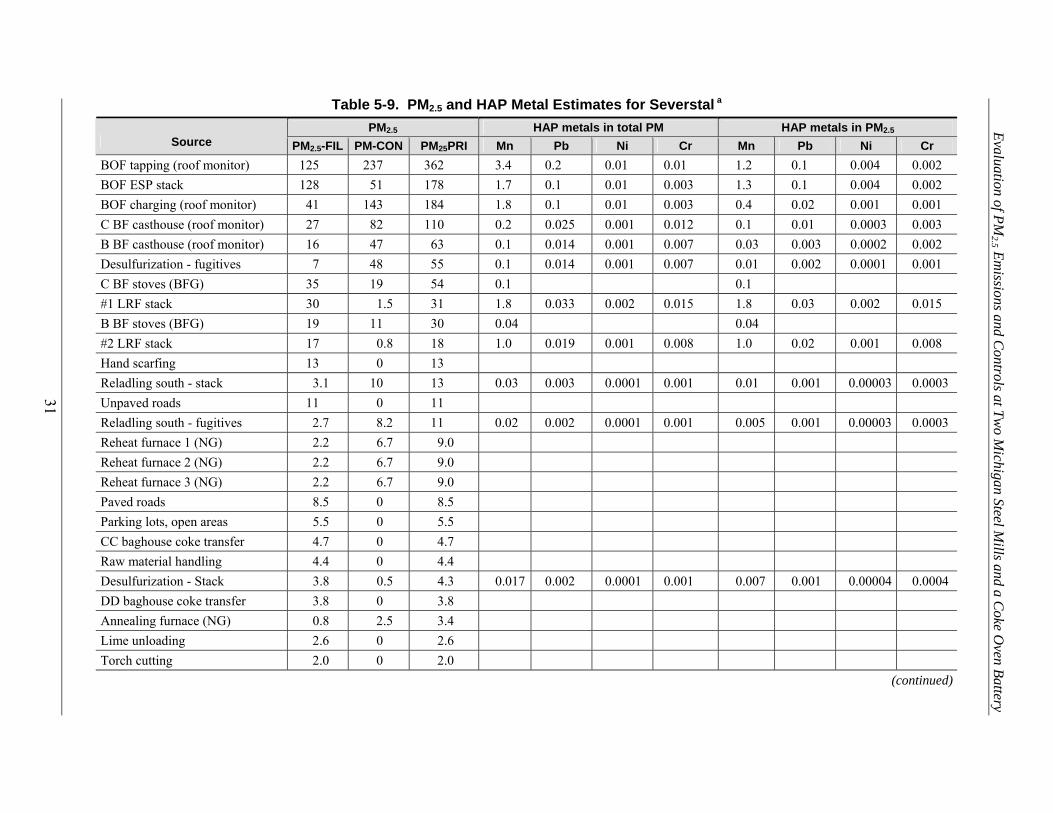
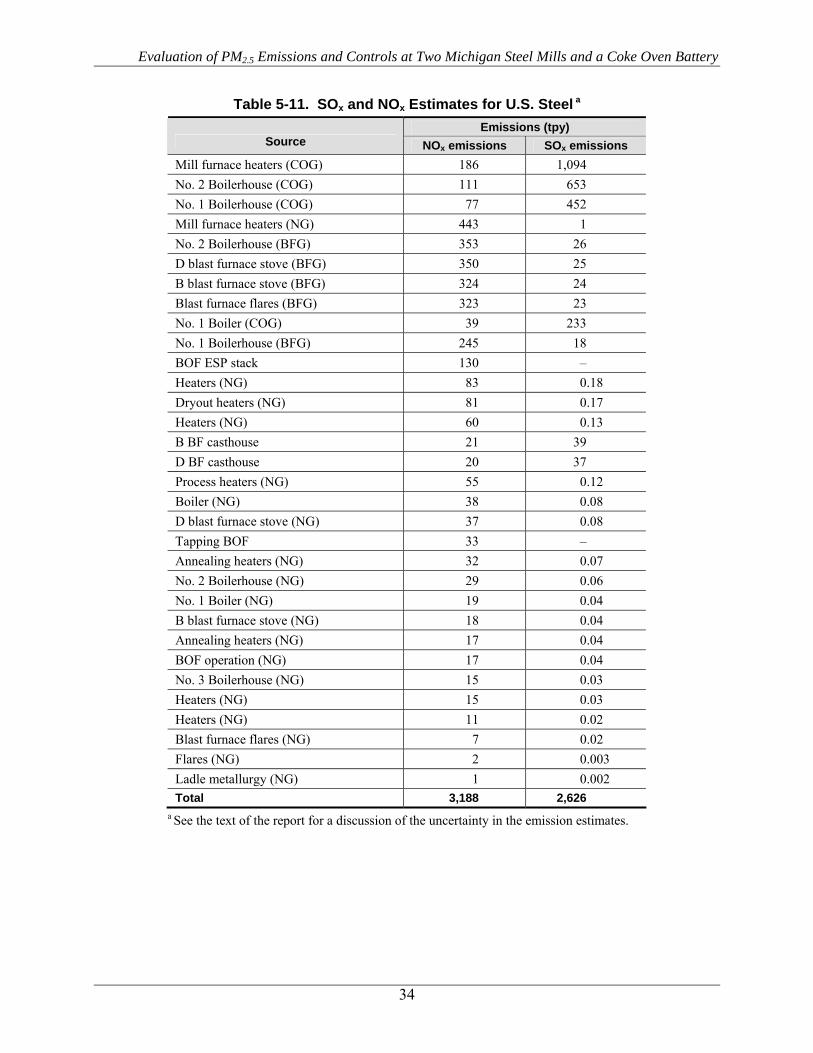
5.0 Emission Estimates ...............................................................................................................18 5.1 Development of Emission Estimates ...........................................................................18 5.2 Emission Factors for PM, NOx, and SOx .....................................................................19 5.3 Emission Factors for PM2.5 and Condensibles.............................................................23 5.4 Emission Factors for HAP Metals ...............................................................................25 5.5 Site-Specific Estimates of Emissions...........................................................................27
6.0 Control Options.....................................................................................................................36 6.1 Coke Oven Gas Desulfurization ..................................................................................39 6.2 Flue Gas Desulfurization .............................................................................................41 6.3 NOx Emission Control Options....................................................................................42 6.4 Control of Casthouse Emissions ..................................................................................43 6.5 Fugitive Emissions from BOF Charging and Tapping ................................................43 6.6 ESP Upgrade................................................................................................................44 6.7 Upgraded Controls for Miscellaneous Operations.......................................................46 6.8 Coke Oven Charging and Leaks on Doors, Lids, and Offtakes...................................47 6.9 Coke Oven Pushing and Quenching ............................................................................47
Evaluation of PM2.5 Emissions and Controls at Two Michigan Steel Mills and a Coke Oven Battery
iv
6.10 Emerging Technologies and Innovative Controls........................................................48 6.11 Improved or Increased Monitoring ..............................................................................48 6.12 Exhaust Gas Cooling....................................................................................................49 6.13 Storage Piles and Roads...............................................................................................49 6.14 Mercury........................................................................................................................50
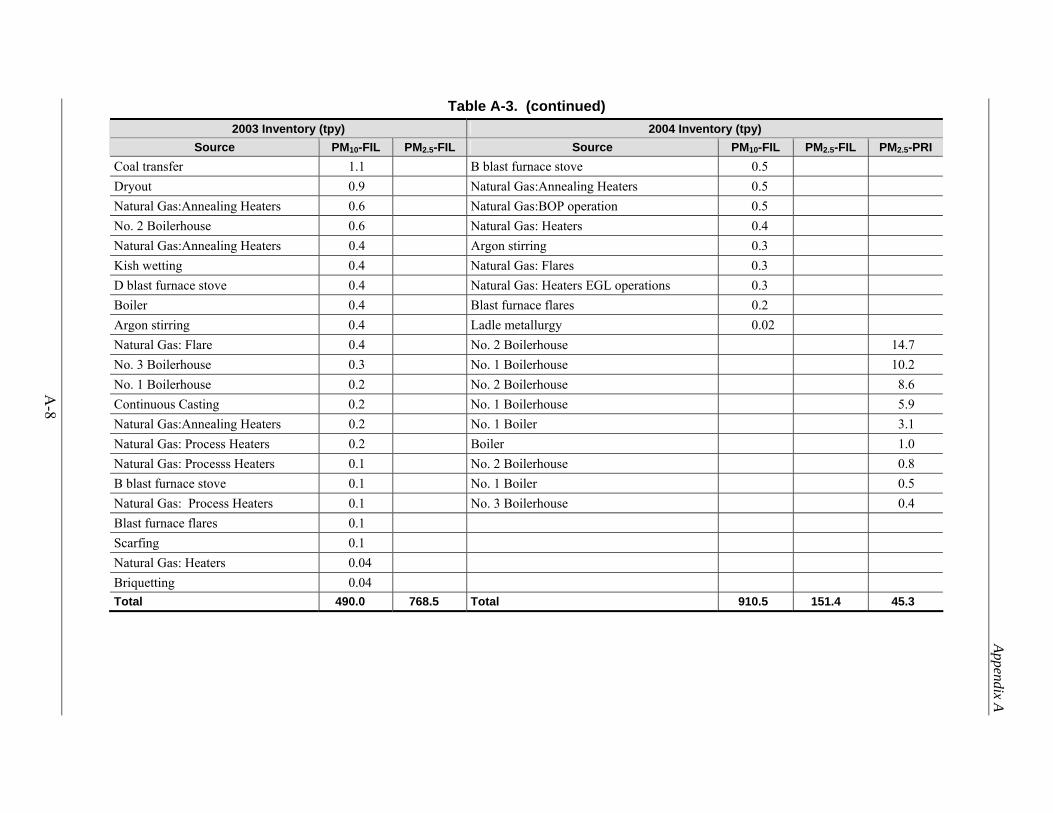
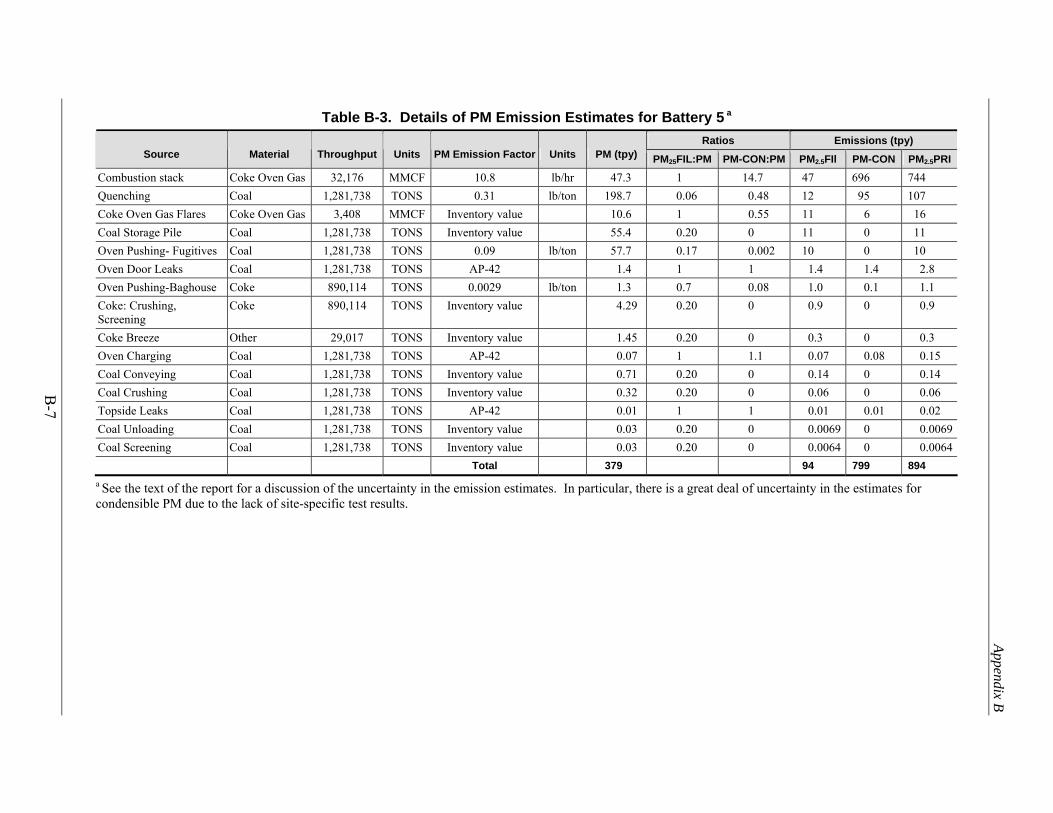
7.0 References.............................................................................................................................51 Appendix A Details of the Emission Inventories Submitted by the Companies to DEQ.......... A-1 Appendix B Details of the Emission Estimates Developed in this Report .................................B-1
List of Figures Figure Page
3-1 Simplified schematic of integrated iron and steel processes. ............................................. 3 3-2 Schematic of emission points and controls for ironmaking................................................ 6 3-3 Schematic of emission points and controls for the BOF shop. ......................................... 11 3-4 Schematic of emission points on a coke oven battery. ..................................................... 14
List of Tables Table Page
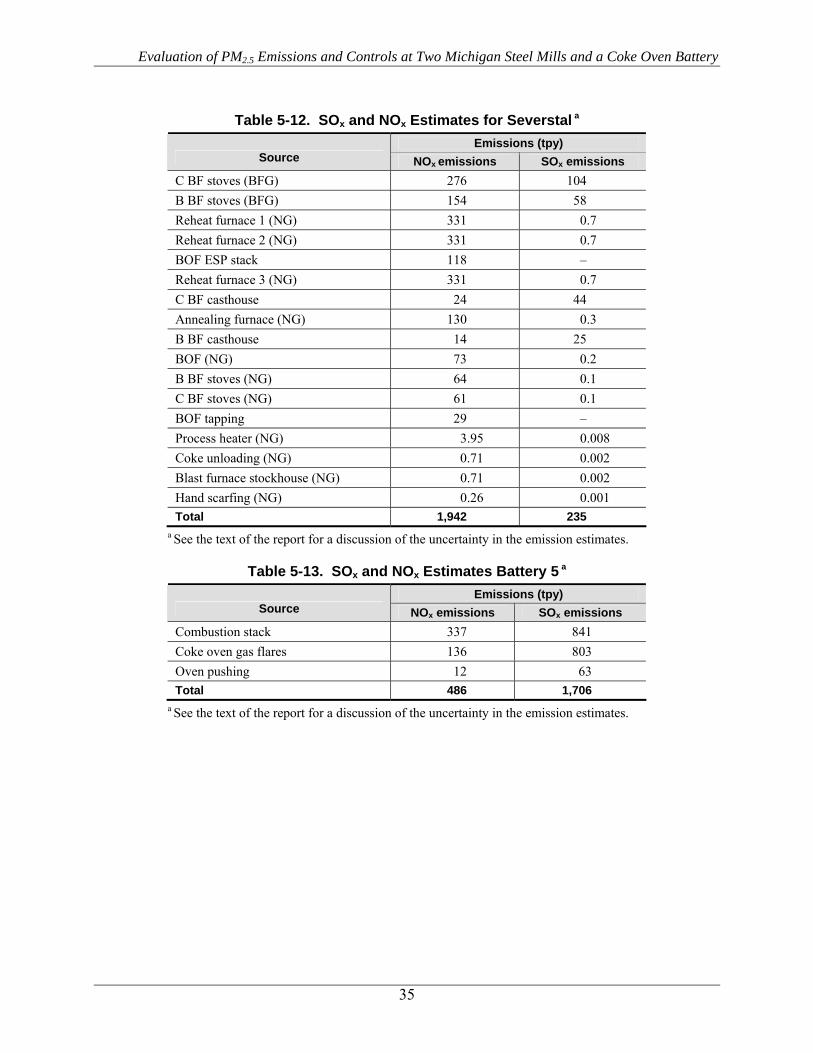
ES-1. Estimates of Total Emissions from the Three Facilities ....................................................... 1 ES-2. Estimates for Total HAP Emissions for the Three Facilities............................................... 2 4-1. Permit Limits for Major Emission Points............................................................................. 16 4-2. PM Test Results for BOF ESPs............................................................................................ 16 5-1. Development of Emission Factors........................................................................................ 20 5-2. PM2.5 Filterables and Condensibles (ratios to PM-FIL) ....................................................... 24 5-3. Metal HAP in APCD Residue and Slag ............................................................................... 26 5-4. Survey Results for Metal HAP in APCD Residue ............................................................... 26 5-5. Test Results for Metals from the Battery Combustion Stack ............................................... 27 5-6. Test Results for Metals from Pushing Fugitive Emissions................................................... 27 5-7. Summary of the Emission Estimates .................................................................................... 28 5-8. PM2.5 and HAP Metal Estimates for U.S. Steel (tpy)........................................................... 29 5-9. PM2.5 and HAP Metal Estimates for Severstal .................................................................... 31 5-10. PM2.5 Estimates for Battery 5 ............................................................................................. 33 5-11. SOx and NOx Estimates for U.S. Steel................................................................................ 34 5-12. SOx and NOx Estimates for Severstal ...........................................................................................................................35 5-13. SOx and NOx Estimates Battery 5....................................................................................... 35 6-1. Summary of Demonstrated and Feasible Control Options................................................... 37 6-2. Summary of Technologies Evaluated for BART ................................................................. 38 6-3. PM Test Results for BOF ESPs............................................................................................ 44
Evaluation of PM2.5 Emissions and Controls at Two Michigan Steel Mills and a Coke Oven Battery
v
Acronyms and Abbreviations °C degrees centigrade °F degrees Fahrenheit acfm actual cubic feet per minute APCD air pollution control device AQD Air Quality Division, Michigan Department of Environmental Quality BART best available retrofit technology BF blast furnace BFG blast furnace gas BOF basic oxygen furnace BSO benzene soluble organics COG coke oven gas COHPAC Compact Hybrid Particulate Collector COM continuous opacity monitor DEQ Michigan Department of Environmental Quality dscfm dry standard cubic feet per minute EAF electric arc furnace EES Coke EES Coke Battery, LLC ESP electrostatic precipitator ft feet ft2 square feet gr grains gr/dscf grains per dry standard cubic foot HAP hazardous air pollutant lb pound LMF ladle metallurgy facility (same process as LRF) LNB low-NOx burner LOV letter of violation LRF ladle refining facility MACT maximum achievable control technology MAERS Michigan Air Emissions Reporting System MCSO methylene chloride soluble organics MEA monoethanolamine MMCF million cubic feet of gas MMSCF million standard cubic feet of gas ND not detected NESHAP National Emission Standards for Hazardous Air Pollutants
Evaluation of PM2.5 Emissions and Controls at Two Michigan Steel Mills and a Coke Oven Battery
vi
NG natural gas NOx nitrogen oxides NSPS New Source Performance Standards PAH polycyclic aromatic hydrocarbons PLD percent leaking doors PLL percent leaking lids PLO percent leaking offtakes PM, PM10, PM2.5 particulate matter (number indicates particle diameter in microns) PM2.5-PRI Primary PM2.5 (PM2.5-FIL plus PM-CON) PM-CON condensible PM2.5 (all condensible PM is included in PM2.5) PM-FIL filterable PM PM2.5-FIL filterable PM2.5 POM polycyclic organic matter ppm parts per million ROPs Renewable Operating Permits s/charge seconds of emissions per charge SCA specific collection area scf standard cubic foot SDA spray dryer absorption Severstal Severstal North America, Inc. SIP state implementation plan SNCR selective non-catalytic reduction SOx sulfur oxides TDS total dissolved solids tpy tons per year ULNB ultra low-NOx burners USSGLW U.S. Steel’s Great Lakes Works
Evaluation of PM2.5 Emissions and Controls at Two Michigan Steel Mills and a Coke Oven Battery
ES-1
Executive Summary
Introduction Detroit has been designated as an area that does not attain the PM2.5 (particulate matter
2.5 microns or less in aerodynamic diameter) national ambient air quality standard (NAAQS). Consequently, the Michigan Department of Environmental Quality (DEQ) is developing a state implementation plan (SIP) to address PM2.5 non-attainment in the Detroit area. A control strategy is a necessary part of this SIP.
The control strategy is likely to consider emission controls at local sources that contribute to high PM2.5 levels. These local sources include two integrated iron and steel mills, one operated by Severstal North America, Inc. (Severstal) and one operated by U.S. Steel, and an associated cokemaking operation operated by EES Coke Battery, LLC (EES Coke), a subsidiary of DTE Energy. Since these facilities also emit toxic metals, including manganese, co-control of manganese and other toxic metals is a goal of the control strategy development.
The objectives of this report are to characterize the PM2.5 and metals emissions from all of the processes at the two steel plants and the one coke oven battery, to identify technically feasible control measures (including increased or improved monitoring for PM2.5 and metals emissions), and to estimate potential costs of additional control.
Summary of Emission Estimates Emissions inventories for PM2.5 and precursors for the three plants were developed
independently in this report using test results, emission factors, and other sources of data. Estimates of annual emissions of sulfur oxides (SOx), nitrogen oxides (NOx), condensible PM (PM-CON), and filterable PM2.5 (PM2.5-FIL) for the three facilities are shown in Table ES-1. Table ES-2 shows estimated annual emissions of hazardous air pollutant (HAP) metals were dominated by manganese at 13 tons per year (tpy) (84 percent of the metal HAP) with smaller quantities of lead, nickel, and chromium. Mercury emissions were estimated to be as high as 400 lb/year from steelmaking from each of the two steel mills (if they melt types of ferrous scrap similar to that used in electric arc furnaces).2
Table ES-1. Estimates of Total Emissions from the Three Facilities Pollutant Emissions (tpy) Percent SOx 4,567 35 NOx 5,616 43 PM-CON 1,876 14 PM2.5-FIL 1,130 8 Total 13,189 100
2 The uncertainty associated with these estimates is discussed in Chapter 5 of this report. In particular, there is a significant amount of uncertainty associated with the estimates for PM-CON because of the lack of actual test data. Similarly, the uncertainty associated with the estimates of mercury emissions is high because no test data are available for the processes at the three plants and the scrap mix may be different from that used in electric arc furnaces.
Evaluation of PM2.5 Emissions and Controls at Two Michigan Steel Mills and a Coke Oven Battery
ES-2
Table ES-2. Estimates for Total HAP Emissions for the Three Facilities HAP Total emissions (tpy) HAP in PM2.5 (tpy) Manganese 13 7.2 Lead 1.9 0.7 Nickel 0.04 0.01 Chromium 0.2 0.1 Mercury 0.4 0.4 Total 15.5 8.4
SOx Emissions and Controls The primary source of SOx emissions (89 percent) is combustion of coke oven gas that
has not been desulfurized and contains hydrogen sulfide (H2S) and other sulfur compounds. This estimate is expressed as equivalent SO2 and is based on the H2S content of the gas and the quantity of coke oven gas produced because the H2S is converted primarily to SO2 during combustion. A cost-effective and feasible control option may be to desulfurize the coke oven gas before it is used as fuel for the coke battery, flared, and burned in boilers and furnaces at one of the steel mills. (A total of 11 of the 16 by-product coke batteries that are currently operating in the United States desulfurize their coke oven gas.) Coke oven gas desulfurization could reduce SOx emissions from the combustion of coke oven gas at the coke plant and steel mill from 4,100 tpy to about 410 tpy. The combustion processes that burn blast furnace gas and natural gas are relatively small contributors to the total SOx emissions; consequently, flue gas desulfurization is not likely to be cost-effective for these smaller miscellaneous sources.
NOx Emissions and Controls The NOx emissions result from the combustion of three fuels used at the plants: coke
oven gas, blast furnace gas, and natural gas. There are several demonstrated technologies available for reducing NOx emissions that can be applied at these plants. The primary contributors are the largest fuel users: battery underfiring, blast furnace stoves, reheat furnaces, and boilers. The plants have installed or plan to install NOx controls on certain processes. EES Coke installed NOx controls on the battery’s underfiring system when the battery was reconstructed in 1992. The technology uses both staged heating and recirculation flow to reduce emissions. U.S. Steel uses selective catalytic reduction on their continuous galvanizing line. Severstal plans to install low-NOx burners on their blast furnace stoves.
Condensible PM Emissions and Controls This study identified the coke oven battery’s combustion stack as the largest source of
condensible PM (700 tpy or 37 percent of the total); however, this estimate is based on only one test, and the test method that was used produces results that are biased high. Additional testing and research are needed to determine if this estimate is representative. If condensible emissions are found to be significant, research should focus on the origin of condensible emissions, their constituents, and factors affecting their formation (e.g., H2S content, combustion conditions, fuel quality, and organic compounds in the coke oven gas).
Evaluation of PM2.5 Emissions and Controls at Two Michigan Steel Mills and a Coke Oven Battery
ES-3
The emission estimates for PM condensibles for other iron and steel processes are the most uncertain of the estimates because of the general lack of direct measurements. PM control devices have been designed for removal of filterable PM, and there is little information on the feasibility of modifying these existing controls to improve effectiveness for condensibles. Theoretically, gas cooling could aid in condensing and capturing the emissions; however, there is insufficient information to estimate what level of reductions might be achieved and whether operating problems might develop (e.g., water condensation on fabric filters). This study could not identify any commercially available add-on controls that have been demonstrated to reduce emissions of condensibles from these plants. Techniques other than add-on controls have already been implemented at the coke plant to reduce emissions of organic condensibles, such as controlling leaks from doors, lids, and offtakes during coking; preventing leakage of coke oven gas through oven walls into the flue gas system; and minimizing the frequency of green pushes.
Emissions and Controls for Filterable PM and HAP Metals The PM2.5 filterable emissions originate primarily from ironmaking and steelmaking:
fugitive emissions from the blast furnace casthouse, fugitive emissions from basic oxygen furnace (BOF) during charging and tapping, and the electrostatic precipitator (ESP) stack on the BOF. These same emission points are also the primary sources of metal HAP emissions. Consequently, reducing the filterable PM emissions from these sources would result in co-control of HAP metals. Feasible controls have been demonstrated at several steel mills in this country and Canada, the United Kingdom and other parts of Europe, and Japan. These mills use hoods exhausted to baghouses to capture emissions that occur when the blast furnace is tapped and when the BOF is charged and tapped. A well designed and operated capture and control system can achieve a reduction of 95 percent or more (from the uncontrolled case) in filterable PM and HAP metal emissions from these sources. The U.S. Steel plant already has dedicated capture and control systems for the casthouses and BOF shop. Severstal has a local hood for BOF charging emissions that is directed to the primary control system, and some tapping emissions are captured by the open hood of the primary control system. However, Severstal plans to install dedicated capture systems for fugitive emissions from one casthouse and the BOF shop, and these emissions will be directed to new baghouses. These installations will result in a significant improvement in emission control. For the other casthouse, the company expects that there will be a commitment to install similar controls unless a decision is made to shut down the blast furnace.
One of the largest sources of filterable PM and HAP metals is the BOF ESP during the oxygen blow, and a feasible option for reducing these emissions is to upgrade the ESPs to improve emission control performance. Both plants use a continuous opacity monitor on the ESP, and high opacity readings are an indicator of deteriorating control performance. In their survey response, U.S. Steel indicated it had ongoing projects to improve ESP performance to address high opacity events. Severstal indicated it had made repairs to the ESP primary control system in the past year, and additional improvements are planned. It is difficult to determine how much additional emission reduction can be achieved. However, a review of the historical test data indicates that, if variability is decreased and if the ESPs perform consistently at their lowest measured emission rates, emissions could be reduced by 50 percent or more from their peak levels.
Evaluation of PM2.5 Emissions and Controls at Two Michigan Steel Mills and a Coke Oven Battery
ES-4
Another feasible option is to upgrade existing capture hoods and baghouses to reduce fugitive emissions escaping capture and to ensure that any problems with the baghouses are quickly identified and corrected. U.S. Steel reported that it had several projects underway to improve capture and control in order to reduce fugitive emissions. These projects include improving the capture systems for fugitive emissions from BOF charging and tapping; increasing the capture of emissions from hot metal transfer, desulfurization, and slag skimming; and enlarging the baghouses for these processes. The potential for improved control is site-specific and can be assessed by evaluating visible emissions escaping capture (e.g., opacity) and by testing baghouses to measure their control performance. However, there are few test data available to assess the current performance and potential for improvement to capture systems and baghouses. If testing indicates a PM control level of 0.01 grain per dry standard cubic foot (gr/dscf) or more, baghouse upgrades can achieve levels less than 0.005 gr/dscf. Both plants indicated in their survey response that they planned to install bag leak detection systems as a result of the maximum achievable control technology (MACT) standard. These monitoring systems, coupled with prompt corrective actions when the system alarm sounds, should reduce emissions from bag failure and other operating problems that can result in excess emissions.
Improved capture and control of metal HAP emissions are especially important for BOF tapping and the ladle refining facility (LRF) where alloys are added. For example, ferromanganese and ferrochrome are often added during tapping or at the LRF to adjust the steel’s composition. These operations produce emissions with more metal HAP than those from the casthouse and other operations in the BOF shop. The analysis of dust captured from tapping and the LRF shows that it is enriched with manganese and chromium at higher levels than those found in other ironmaking and steelmaking operations.
Mercury Emissions and Controls The EPA’s recent information gathering for the area source standard for electric arc
furnaces indicates that mercury is emitted when scrap contaminated with mercury is melted. The primary contributor to mercury in scrap is convenience light switches in end-of-life vehicles. Many states have programs that require or encourage the removal of mercury switches before the automobiles are dismantled, crushed, shredded, and melted in steel mill furnaces. This pollution prevention approach has been shown by several states to be cost-effective, and studies in New Jersey and Ohio indicate a reduction of 50 percent or more in mercury emissions can be achieved. A control option for mercury would require the plants to purchase scrap only from suppliers that know the mercury switches have been removed, or to discontinue the use scrap from end-of-life vehicles. For example, Severstal plans to limit their use of shredded (fragmented) automobile scrap to 2 percent of the total scrap, and their scrap management plan commits the company to purchase scrap from suppliers who reduce or eliminate mercury switches from their scrap.
Data submitted by the companies show that mercury has been detected in the air pollution control device (APCD) dust collected from different processes (blast furnace, BOF ESP, desulfurization, BOF charging and tapping). The presence of mercury indicates the PM control devices provide co-control of particulate mercury. There are also add-on controls for vapor phase mercury emissions that have been applied to other industrial processes (such as injection of powdered activated carbon). However, there are insufficient data to assess their cost or feasibility. There are no mercury emission test data for these plants, and information on mercury
Evaluation of PM2.5 Emissions and Controls at Two Michigan Steel Mills and a Coke Oven Battery
ES-5
loading, mercury concentrations, and speciation (particulate vs. vapor phase) is needed to assess feasibility and cost.
The limited test data show no detectable levels of mercury emissions from the combustion of coke oven gas at by-product recovery coke plants. A European study found that most of the mercury distilled from the coal during coking was captured in the by-product recovery process and was removed with the tar.
Non-Process Fugitive Emissions and Controls Fugitive emissions occur from wind-blown dust, storage piles, raw material transfer, and
paved and unpaved surfaces. Estimates of these emissions have been included in the inventory and are based on a 1993 submittal by the companies and the emission control practices in place. Control measures include watering, chemical stabilization, reducing surface wind speed with windbreaks or source enclosures, clean up of spillage, vehicle restrictions (limiting speed, weight, number of vehicles), and surface improvements such as paving or adding gravel or slag to a dirt road. The steel plants have detailed control requirements for these fugitive emissions in their operating permits. For example, storage piles, open areas, and unpaved roads at Severstal must be treated with a chemical suppressant at least once per month from March through October. There are also provisions for wet sweeping of paved areas and street flushing. U.S. Steel has similar detailed requirements for vacuum sweeping, use of dust suppressants, and loading/unloading at storage piles. No additional control measures have been identified in this study. However, increased monitoring of fugitive emissions (e.g., monitoring on days when there is no precipitation) might be useful in providing additional control if control measures are applied when dusty conditions are observed (in addition to the regularly scheduled controls required by the permit).
Improved Monitoring The emission control equipment at these plants is monitored to ensure proper operation
and is required in their operating permits. For example, continuous opacity monitors are used on the battery combustion stack and the ESP on the BOF. Other requirements include periodic emission testing, inspections and preventative maintenance, and adherence to work practices. In addition, newly promulgated National Emissions Standard for Hazardous Air Pollutants (NESHAP) for coke ovens (40 CFR Part 63, Subpart CCCCC) and steel mills (40 CFR Part 63, Subpart FFFFF) will increase the monitoring requirements. For example, operating limits are established for the existing continuous opacity monitors on the coke oven battery combustion stack and the ESP on the BOF. Bag leak detectors are required for baghouses. These devices will detect an increase in PM emissions. Damper settings and volumetric flow rate must be monitored for capture systems. Each plant will be required to have an operation and maintenance plan and a startup, shutdown, and malfunction plan. A monitoring plan that includes prompt corrective actions when a monitoring parameter is exceeded is critical for maintaining good emission control. One example of effective increased monitoring, beyond what is required by the NESHAP, is performing daily Method 9 observations of fugitive emissions from the casthouses and BOF shops. When spikes in opacities are observed (e.g., 20 percent or more), the cause of the event should be investigated and corrective actions taken.
Evaluation of PM2.5 Emissions and Controls at Two Michigan Steel Mills and a Coke Oven Battery
ES-6
[This page intentionally left blank.]
Evaluation of PM2.5 Emissions and Controls at Two Michigan Steel Mills and a Coke Oven Battery
1
1.0 Introduction Detroit is one of approximately 16 areas that may not reach PM2.5 (particulate matter 2.5
microns or less in aerodynamic diameter) attainment by 2010, and steel mills have been identified as potentially significant local contributors. Consequently, the Air Quality Division (AQD) of the Michigan Department of Environmental Quality (DEQ) is developing a state implementation plan (SIP) revision to address PM2.5 non-attainment in Wayne County. A control strategy is a necessary part of this revision.
The control strategy is likely to consider emission controls at local facilities that can be shown to contribute to high PM2.5 levels. These include two integrated iron and steel mills, one operated by Severstal North America, Inc. (Severstal) and one operated by U.S. Steel, and an associated cokemaking operation operated by EES Coke Battery, LLC (EES Coke), a subsidiary of DTE Energy. These facilities may be contributors because of their proximity to the PM2.5 monitors showing non-attainment. Control of manganese is also of interest because of high readings of manganese from four monitors in the Detroit area. Therefore, co-control of PM2.5, manganese, mercury, and other toxic metals of concern from these three facilities is a goal of the control strategy development.
The objectives of this report are to characterize the PM2.5 and metals emissions from all of the processes at the two steel plants and one coke oven battery, identify technically feasible control measures (including increased or improved monitoring for PM2.5 and metals emissions), and estimate potential costs of additional control.
2.0 Facility Descriptions This section provides a description of the three facilities including location, size, and a
summary of operations. Severstal and U.S. Steel are both integrated iron and steel producers and use similar production processes and emission controls. EES Coke produces coke from coal (blended with 3 percent petroleum coke) for use in ironmaking.
2.1 Severstal 1 Severstal operates an integrated steel mill at the Rouge Industrial Complex in Dearborn,
Michigan, that was formerly owned and operated by Rouge Steel. The Rouge Industrial Complex is located at 3001 Miller Road in Dearborn, Michigan (Wayne County). The complex is bounded by Rotunda Drive on the north, Miller Road on the east, Dix Avenue and Rouge River on the south, and Schaefer Road on the west. The area is mainly industrial, and the nearest residence is approximately 1,500 feet east of Miller Road. Severstal operations encompass approximately 500 acres and occupy the southern half of the complex.
The primary operations include two operating blast furnaces, iron desulfurization, a basic oxygen furnace (BOF) shop with two furnaces, two continuous casters, a hot-strip mill, cold mill operations, and a waste oxides reclamation facility (currently shutdown). Other processes include vacuum degassing, a ladle metallurgical facility (LMF), reheat furnaces, and annealing furnaces. The plant produces sheet steel that is used in a variety of manufacturing applications. The plant has the capacity to produce approximately 2.6 million tons per year (tpy) of iron and 3.1 million tpy of raw steel.
Evaluation of PM2.5 Emissions and Controls at Two Michigan Steel Mills and a Coke Oven Battery
2
2.2 U.S. Steel and EES Coke 2 U.S. Steel’s Great Lakes Works (USSGLW) is an integrated steel mill that has been in
operation since August 1930 and was previously owned and operated by National Steel. National Steel sold the associated coke plant to DTE Energy in 1997, and EES Coke became the coke plant operator in 2004. The coke plant is just south of the city of Detroit and is colocated with the ironmaking operations (blast furnaces). The two plants consist of approximately 1,100 acres that span along the Detroit River through the cities of Ecorse and River Rouge. The U.S. Steel facility includes the main plant area, the 80-inch hot strip mill, and the ironmaking operations on Zug Island.
The main plant area is a 682-acre site located in the city of Ecorse. It is bordered by the Detroit River on the east, the 80-inch hot strip mill facility on the north, the Edw. C. Levy Plant No. 3 on the south, and Jefferson Avenue to the west. The main plant includes a BOF shop with two furnaces, a vacuum degasser, an LMF, argon-oxygen decarburization, two continuous slab casting machines, a pickling line (where HCl is used to remove iron oxide scale from the steel’s surface), an electrogalvanizing line, a hot-dip galvanizing line, a tandem cold mill, batch annealing furnaces, a temper mill, and a boiler house. The permitted raw steel production capacity is 4.1 million tpy. Raw steel production from the BOF was reported as 3.3 million tpy in the 2004 emissions inventory. The plant site is zoned heavy industrial.
The 80-inch hot strip mill is located in the city of River Rouge between Zug Island and the main plant. The hot strip mill facility includes the hot strip finishing and shipping building, scale pit, coil storage and shipping building, slab yard, and 80” hot strip mill. The facility site is zoned heavy industrial. The nearest residential area is approximately 1.5 miles from the facility. The plant produces flat-rolled steel products for the automotive, appliance, container, service center, and piping and tubing industries.
The primary iron-producing facility is located in the city of River Rouge on Zug Island and is bordered by the Rouge River on the north, south, and west sides and the Detroit River on the east side. The Zug Island facility includes three blast furnaces and three boiler houses. The permitted capacity of the blast furnaces is3.7 million tpy of iron. Iron production was reported as 2.7 million tpy in the 2004 emissions inventory.
The EES Coke facility is also located on Zug Island. It includes one 85-oven coke battery with 6-meter ovens and a coke by-product recovery plant. The facility produces coke for use in blast furnaces and has the capacity to produce approximately 1 million tpy of coke. The Zug Island site is zoned heavy industrial. The nearest residential area is approximately 0.6 miles from the facility.
3.0 Descriptions of Processes, Emissions, and Controls Figure 3-1 provides an overview of integrated iron and steel processes. Coal is thermally
distilled in the absence of air in specialized ovens to produce coke (carbon), which is used as fuel and to produce a reducing atmosphere in the blast furnace. The blast furnace reduces iron oxides to molten iron that contains about four percent carbon. The molten iron and ferrous scrap are charged to the BOF, where oxygen is blown into the iron to remove carbon and produce steel. The molten steel is cast in continuous casters, and the solidified steel is rolled into various shapes for final processing or sale. Although some integrated iron and steel mills have sinter plants, neither of the two Michigan mills have one. Sintering is a process that produces sinter, a hard
Evaluation of PM
2.5 Emissions and C
ontrols at Two M
ichigan Steel Mills and a C
oke Oven Battery
3
Figure 3-1. Simplified schematic of integrated iron and steel processes.
Coke ovenbattery
Blastfurnace
Basicoxygenfurnace
Byproductrecovery
plant
Venturiscrubber
Stoves
Continuouscaster
Rollingmills
ESPCoal
CokeHot metal
(iron)
Ferrous scrap
Byproducts (tar, lightoil, ammonium sulfate)
Air
Heatedblast airRaw coke
oven gas
Clean coke oven gas
Steel shapes
Cast steel
Molten steel
Exhaust gases
Iron ore
FluxBOF slag
Sinter
CleanBF gas
BF gasOxygen
Fuel
Clean BF gasto other processes
Natural gas
Evaluation of PM2.5 Emissions and Controls at Two Michigan Steel Mills and a Coke Oven Battery
4
fused material for use in the blast furnace, from dusts, sludges, rolling mill scale, coke breeze (undersized coke), and slag. Sinter plants are used to recover the iron value and some of the lime in these materials. More details on the processes at Severstal, USSGLW, and EES Coke are given in the following sections.
3.1 Ironmaking
3.1.1 Process Description 3, 4, 5
Iron is produced in blast furnaces by the reduction of iron-bearing materials with a hot gas. The large, refractory-lined blast furnace is charged through its top with iron ore, sinter, flux (limestone and dolomite), and coke, which provides fuel and forms a reducing atmosphere in the furnace. Many modern blast furnaces also inject pulverized coal to reduce the quantity of coke required. Iron oxides, coke, coal, and fluxes react with the heated blast air injected near the bottom of the furnace to form molten reduced iron, carbon monoxide (CO), and slag (a molten liquid solution of silicates and oxides that solidifies upon cooling). The molten iron and slag collect in the hearth at the base of the furnace. The by-product gas is collected at the top of the furnace and is recovered for use as fuel.
The production of one ton of iron requires approximately 1.4 tons of ore or other iron-bearing material; 0.5 to 0.65 ton of coke and coal; 0.25 ton of limestone or dolomite; and 1.8 to 2 tons of air. By-products consist of 0.2 to 0.4 ton of slag and 2.5 to 3.5 tons of blast furnace gas containing up to 100 pounds of dust.
The molten iron and slag are removed from the furnace periodically (this is called “tapping” or “casting”). The casting process begins with drilling a taphole into the clay-filled iron notch at the base of the hearth. During casting, molten iron flows into runners that lead to transport ladles. Slag also flows from the furnace and is directed through separate runners to a slag pit adjacent to the casthouse or into slag pots for transport to a remote slag pit. At the conclusion of the cast, the taphole is replugged with clay. The area around the base of the furnace, including all iron and slag runners, is enclosed by a casthouse. The molten iron is transferred to a refractory-lined rail car (called a “torpedo” car because of it shape) and sent to the BOF shop.
The blast furnace by-product gas, which is collected from the furnace top, contains primarily CO and particulate matter (PM). This gas has a low heating value (about 90 Btu/ft3). Before the gas can be burned efficiently, the PM must be removed. Initially, the by-product gas passes through a settling chamber or dry cyclone to remove about 60 percent of the particulate matter that is collected as blast furnace dust. Next, the gas is cleaned in high-energy venturi scrubbers, which remove about 90 percent of the remaining particulate. Together these control devices provide a clean fuel with less than 0.02 grain per dry standard cubic foot (gr/dscf) of PM, typically as low as 0.005 gr/dscf. A portion of this gas is fired in the blast furnace stoves to preheat the blast air, and the rest is used in other plant operations. At USSGLW, a portion of the blast furnace gas is sent to EES Coke where it is used for underfiring the adjacent coke oven battery.
There are generally three to four stoves per blast furnace. Before the blast air is delivered to the blast furnace, it is preheated by passing it through a regenerator (heat exchanger). In this way, some of the energy of the off-gas that would otherwise have been lost is returned to the process. The additional thermal energy returned to the blast furnace as heat decreases the
Evaluation of PM2.5 Emissions and Controls at Two Michigan Steel Mills and a Coke Oven Battery
5
amount of fuel that has to be burned for each unit of hot metal and improves the efficiency of the process. In many furnaces, the off-gas is enriched by the addition of a fuel with much higher calorific value, such as natural gas or coke oven gas, to obtain even higher hot blast temperatures. This decreases the fuel requirements and increases the hot metal production rate to a greater extent than is possible when burning blast furnace gas alone to heat the stoves.
3.1.2 Emissions and Controls 3, 5, 6, 7, 8
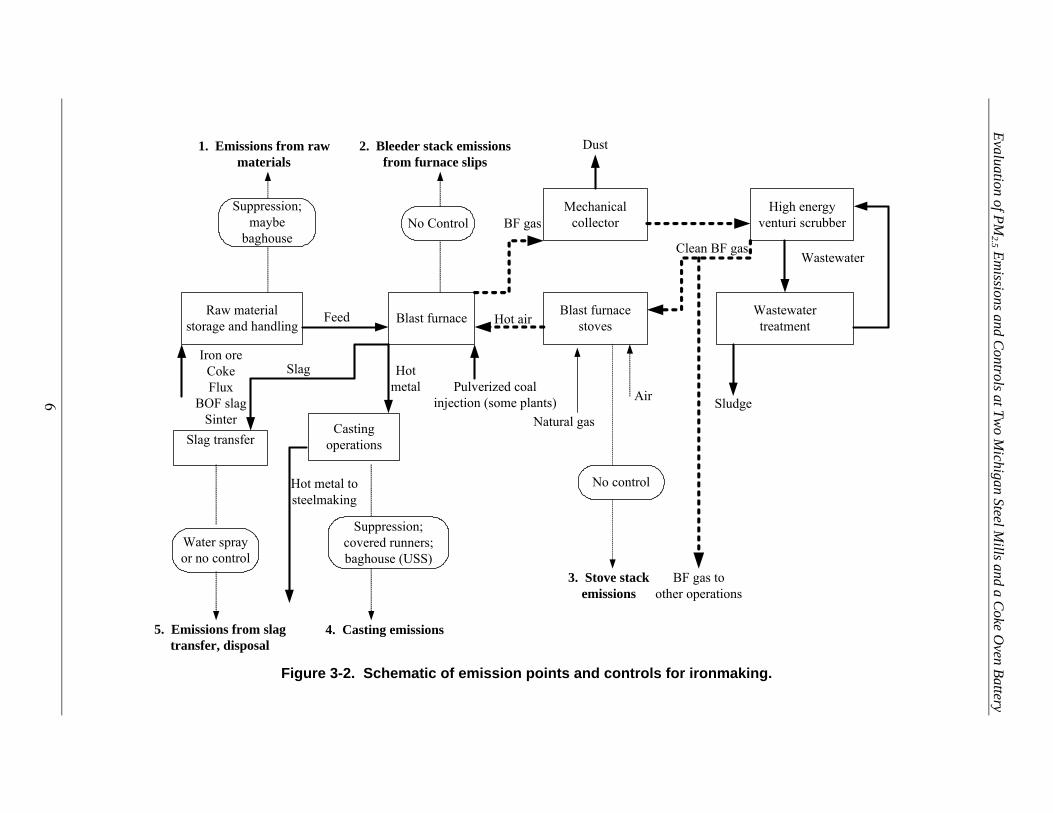
Several emission points release PM and metals from ironmaking: raw material handling, casting and slag handling, the stove stack(s), and transfer in the torpedo car. A diagram of blast furnace processes and emission points is presented in Figure 3-2.
Raw Material Handling
Emissions from raw material handling occur from the storage, sizing, screening, mixing, and transport of the feed materials that comprise the blast furnace burden. These raw materials that generate dust include iron ore, sinter, coke, and flux materials such as limestone and silica. Emissions are affected by the extent to which fine particles are generated, use of enclosures and extent of exposure to the atmosphere, use of water sprays or other materials for suppression, etc. These emissions are primarily filterable PM; they are not expected to be significant contributors to condensible PM or metal hazardous air pollutant (HAP) levels.
Both Severstal and USSGLW use suppression techniques to reduce emissions from raw material handling. In addition, Severstal has a baghouse on its stockhouse to control PM emissions from all raw materials charged to the blast furnaces.
Casting and Slag Handling
Particulate emissions from the blast furnace are primarily generated during the casting of molten iron and slag from the blast furnace. During casting, molten iron and slag flow out of a taphole at the base of the furnace into runners that lead to transport ladles. When the molten iron and slag contact air, particulate emissions are generated. Emissions are also generated by drilling and plugging the taphole, and heavy emissions are generated when an oxygen lance has to be used to open a taphole that cannot be drilled open.
During the casting operation, emissions include flakes of iron oxide and graphite (carbon) called “kish” that is released as the metal cools, and metal oxides that form when the reduced metal (e.g., iron, manganese) reacts with oxygen in the air. Manganese is the predominant metal HAP in casting emissions and averages about 0.6 percent of PM, with values up to 1.7 percent reported. Analyses of metals in the blast furnace dust found 0.88 percent manganese and trace quantities of others, including lead (0.03 percent), chromium (0.009 percent), and nickel (0.006 percent). The analysis of blast furnace sludge from the Venturi scrubber showed (on a dry weight basis) 0.4 percent manganese, 0.1 percent lead, 0.006 percent chromium, and 0.004 percent nickel.
Some plants (e.g., Severstal) rely entirely on suppression techniques to control casthouse emissions. For example, flame suppression using natural gas consumes oxygen over the molten metal and prevents the formation of metal oxides. Using covers over the iron and slag runners and minimizing the air space between the runners and covers also suppresses emissions. Severstal uses natural gas flame suppression at the taphole, trough. iron spouts, and runners and
Evaluation of PM
2.5 Emissions and C
ontrols at Two M
ichigan Steel Mills and a C
oke Oven Battery
6
Figure 3-2. Schematic of emission points and controls for ironmaking.
Raw materialstorage and handling Blast furnace Blast furnace
stovesWastewatertreatment
High energyventuri scrubber
MechanicalcollectorNo Control
No control
Castingoperations
Suppression;covered runners;baghouse (USS)
Slag transfer
Water sprayor no control
1. Emissions from rawmaterials
2. Bleeder stack emissionsfrom furnace slips
Dust
Hot air
Clean BF gas
BF gas
Sludge
Wastewater
3. Stove stackemissions
4. Casting emissions5. Emissions from slagtransfer, disposal
Pulverized coalinjection (some plants) Air
Iron oreCokeFlux
BOF slagSinter
Hot metal tosteelmaking
BF gas toother operations
Slag Hotmetal
Feed
Suppression;maybe
baghouse
Natural gas
Evaluation of PM2.5 Emissions and Controls at Two Michigan Steel Mills and a Coke Oven Battery
7
covered runners. The most effective control for casthouse emissions that is used at several integrated iron and steel plants (including USSGLSW) is a capture system that is exhausted to a baghouse. USSGLW uses hoods over the iron troughs and tilting spots at each of its three blast furnaces to capture emissions from casting. Each blast furnace has a baghouse to control the emissions.
As the slag is discharged and allowed to cool, gaseous and particulate emissions occur. Particulate emissions also occur when the solidified slag is later broken up and removed. These emissions are generally uncontrolled, although water sprays are sometimes used to reduce emissions.
Emissions may also occur from the torpedo car as the hot metal is transferred to the BOF shop. Suppression techniques, including a slag cover, can be used to reduce contact with air to prevent oxidation and emissions.
Blast Furnace Slips 9
Emissions also occur from blast furnace “slips.” A slip occurs when the burden material hangs or bridges in the furnace rather than continuing its downward movement. When this happens, the solid material below the “hang” continues to move downward and forms a void below the hang that is filled with hot gas at very high pressure. When the hang finally collapses, the sudden downward thrust of the burden material forces the hot gas upward with the force of an explosion. To prevent damage to the furnace, the pressure is relieved through bleeder stacks on top of the furnace that discharge the particle-laden gas directly to the atmosphere. Factors that are believed to contribute to blast furnace slips include re-solidification of previously fused slag and molten iron, an excessive quantity of fines in the coke, alkalis such as oxides of sodium and potassium, and overblowing of the furnace (excess air). One plant reported that slips were very infrequent now because it used pellets rather than iron ore. Older blast furnaces are reported to experience more slips than are newer furnaces. The quantity of emissions from slips is related to the duration of the slips, their frequency, how fast the pressure rises, and how quickly it is relieved.
Blast Furnace Stoves
The gas leaving the blast furnace is primarily CO and nitrogen and is heavily laden with PM. The gas is cleaned in venturi scrubbers and is used as fuel in the blast furnace stoves and other operations at the plant. Emissions occur from stove stacks when this gas is burned. The quantity and composition of these emissions are affected by the amount and type of particles remaining after cleaning and the combustion conditions when the fuel is burned. The stove stack is a source of filterable PM2.5 (PM2.5-FIL), condensible PM (PM-CON), sulfur oxides (SOx), and nitrogen oxides (NOx). The primary metal HAP detected is manganese, which has been reported at 0.2 to 0.25 percent of PM.
None of the integrated iron and steel plants control PM from the blast furnace stoves, and control is not generally economical because of the low PM concentration (generally less than 0.01 gr/dscf). No plants use controls for SOx. Some plants (but not the two Michigan steel plants) use improved combustion techniques and low-NOx burners to reduce NOx emissions; however, Severstal plans to install low-NOx burners on their blast furnace stoves.
Evaluation of PM2.5 Emissions and Controls at Two Michigan Steel Mills and a Coke Oven Battery
8
3.2 Hot Metal Transfer, Desulfurization, and Slag Skimming After the hot metal is produced in the blast furnace, it is transferred to the BOF shop.
Brick-lined torpedo cars are used because of their insulating qualities and the consequent lower heat loss from the iron. The hot metal is then poured from the torpedo cars into the BOF shop ladle; this is referred to as hot metal transfer (also known as “reladling”). Hot metal transfer generally takes place under a hood to capture emissions of PM including kish (flakes of carbon), which is formed during the process.
Desulfurization of the hot metal is accomplished by adding reagents such as soda ash, lime, and magnesium. Injection of the reagents is accomplished pneumatically with either dry air or nitrogen. Desulfurization may take place at various locations within the iron and steel making facility; however, if the location is the BOF shop, then it is most often accomplished at the hot metal transfer (reladling) station to take advantage of the fume collection system at that location.
Skimming of slag from the ladle of molten iron removes the sulfur it contains from the steelmaking process. Skimming results in the emissions of kish, and is therefore normally done under a hood.
Both Severstal and USSGLW use capture systems exhausted to baghouses to control emissions from hot metal transfer, desulfurization, and slag skimming. The metal HAP composition of these emissions is expected to be similar to those from the casthouse, with manganese as the predominant metal HAP.
3.3 Steelmaking 3, 4, 5, 10
3.3.1 Process Description
The BOF receives a charge composed of molten iron and scrap and converts it to molten steel. Each BOF shop at the two steel mills contains two BOF vessels that may be operated alternately; in some shops, both vessels may be in use at different stages of the cycle. The distinct operations in the BOF process are the following:
# Charging – the addition of molten iron and metal scrap to the furnace # Oxygen blow – introducing oxygen into the furnace to refine the iron # Turndown – tilting the vessel to obtain a sample and check temperature # Reblow – introducing additional oxygen, if needed # Tapping – pouring the molten steel into a ladle # Deslagging – pouring residual slag out of the vessel.
The furnace is a large, open-mouthed vessel lined with a refractory material. A jet of high-purity oxygen oxidizes the carbon and silicon in the molten iron in order to remove these constituents and to provide heat for melting the scrap. After the oxygen jet is started, lime is added to the top of the bath to provide a slag of the desired basicity. The oxygen combines with the unwanted elements to form oxides, which leave the bath as gases or enter the slag.
The basic oxygen steelmaking process is a thermochemical process; computations are made to determine the necessary percentage of molten iron, scrap, flux materials, and alloy additions. Various steelmaking fluxes are added during the refining process to reduce the sulfur
Evaluation of PM2.5 Emissions and Controls at Two Michigan Steel Mills and a Coke Oven Battery
9
and phosphorus content of the metal to the prescribed level. The oxidation of silicon, carbon, manganese, phosphorus, and iron provide the energy required to melt the scrap, form the slag, and raise the temperature of the bath to the desired temperature.
The BOF shop is generally arranged with three parallel aisles. The first aisle, the charging aisle, has one or more cranes for handling charge materials to the furnace as well as handling ladles of molten slag away from the furnace. The second aisle, the furnace aisle, contains the furnaces, collection hood for the fumes, lances for injecting oxygen into the bath, and overhead bins for storing and metering out the various flux materials and alloy additions. The third aisle, the pouring aisle, handles the finished heats of steel. This aisle has one or more overhead cranes and facilities for transferring heats of steel to ladle metallurgy and continuous casting machines.
The BOF vessel is tilted toward the charging aisle for charging with scrap, charging with molten iron, sampling the heat for analysis, and dumping the slag. The vessel is tilted toward the pouring aisle when pouring the finished heat of steel from the furnace into the steel ladles.
After the steel is refined, alloy or other additions are made in the vessel as necessary, and the vessel is then turned toward the pouring aisle and tapped. Alloys and other additives may be added to the steel ladle during tapping. The steel is transferred to a ladle metallurgy station for further alloy additions to achieve the desired specifications. The purpose of ladle metallurgy (also referred to as secondary steelmaking) is to produce steel that satisfies stringent requirements of surface, internal, and microcleanliness quality and mechanical properties. Ladle metallurgy is a secondary step of the steelmaking process and is performed in a ladle after the initial refining process in the primary BOF is completed. This secondary step enables plants to exercise control over many processing conditions contributing to a higher quality of steel including the following:
# Temperature, especially for continuous casting operations # Deoxidation # Decarburization (ease of producing steels to carbon levels of less than 0.03 percent) # Addition of alloys to adjust chemical composition.
This step also increases production rates by decreasing refining times in the furnace.
Nearly all of the integrated iron and steel facilities (including both Michigan steel mills) have ladle metallurgy facilities (LMFs). Several LMF processes are commonly used, including vacuum degassing, ladle refining, argon-oxygen decarburization, and lance powder injection. Once the final adjustments are made, the steel is transferred to the continuous caster where it is cast, cooled, and solidified. Both Michigan plants have LMFs, and U.S. Steel also has an argon-oxygen decarburization vessel to reduce the carbon content of the steel.
Emissions may also occur later in the steel processing from scarfing, which is a process that uses oxygen torches to remove the surface of semifinished steel shapes (e.g., to remove imperfections or defects). Scarfing can be performed by hand or by machine. Emissions can be captured by hoods and vented to a baghouse. For example, the U.S. Steel plant has a slab scarfing machine vented to a baghouse, and Severstal uses hand scarfing without capture and control.
Evaluation of PM2.5 Emissions and Controls at Two Michigan Steel Mills and a Coke Oven Battery
Figure 3-3 is a simplified schematic of emission points and typical controls for the BOF shop. Emissions occur from the BOF shop during charging (hot metal and scrap), the oxygen blow, and tapping. The heaviest emissions occur during the oxygen blow and are captured by the primary hood. Primary emission control systems are divided into two basic types: open full combustion and closed suppressed combustion. Traditionally, high-energy venturi scrubbers and electrostatic precipitators (ESPs) have been the best demonstrated control technologies for controlling BOF primary emissions. Both of the Michigan steel mills use ESPs and open hood BOFs (rather than the close fitting closed hoods used at some plants with suppressed combustion systems).
CO is emitted from the vessel mouth during the oxygen blow phase of the furnace cycle. The gas temperature is sufficiently hot to promote combustion of CO if air is permitted to mix with the waste gas. A design decision must be made to determine how much air is allowed to mix with the gas, so that hood cooling capacity can be matched to the needs of the system. Some air must be admitted to obtain sufficient capture velocity necessary to contain fume emissions within the hood. Capture velocities generally run 14 to 58 feet per second.
The two Michigan steel mills use ESPs for controlling PM emissions from the BOF. Because of the potential for igniting the CO and air mixture by precipitator sparking, it is necessary to use an open hood to admit large quantities of excess combustion air at the hood and to facilitate the complete combustion of CO. This leads to larger gas volumes to be treated for control of particulate emissions than is necessary for closed hood furnaces. In the open hood system, the hood skirt is in a fixed position, and no precautions for leakage into the system are necessary. Control systems are shared between furnaces with multiple fans operating in a parallel flow arrangement.
When an ESP is used, gas cooling downstream from the hood skirt is continued by the use of water sprays located in the upper part of the hood. These sprays are generally controlled by time and temperature to turn on and off at various points in the operating cycle. The intent is to limit the gas temperature reaching the precipitator and to condition the gases with moisture for better precipitation. Emissions during the oxygen blow are captured by the open hood, enter a hood cooling section, and pass through a conditioning chamber where the gas is cooled and humidified to the required levels for proper ESP operation. The gas cleaning system commonly consists of precipitators, fans, dust handling equipment, and a stack for carrying away the cleaned gases. ESPs can be used with open hoods because the combustible CO generated during the oxygen blow burns at the mouth of the vessel, reducing the risk of explosions that could be set off by sparks in the precipitator.
For charging and tapping emissions, many integrated iron and steel plants (including USSGLW) use a dedicated canopy hood and baghouse for capture and control of these emissions. Severstal has a local hood for charging and sends the captured emissions to the ESP. Some tapping emissions are captured and controlled by the primary system’s open hood and ESP. Both plants have capture hoods exhausted to baghouses to control emissions from LMFs.
Evaluation of PM
2.5 Emissions and C
ontrols at Two M
ichigan Steel Mills and a C
oke Oven Battery
11
Figure 3-3. Schematic of emission points and controls for the BOF shop.
Hot metaldesulfurization
Slag skimming Basic oxygen furnace Deslagging
Slag transfer,disposal
None orwater spray
Tapping
Baghouse
Ladletreatment
Baghouse
Transfer tocontinuous
caster
None
Baghouse
Torpedo cartransfer Baghouse
Baghouse
Baghouse Electrostaticprecipitator No control
Hot metalEmissions from
transfer Emissions fromskimming Charging emissions
Emissions fromoxygen blow
Emissions fromslag removal
SlagHot metal
Molten steelScrapFlux
Emissions from slagtransfer, disposalEmissions from tapping
Emissions from ladlemetallurgyCaster emissions
Cast steel
Desulfurizationemissions
Additives
Additives Oxygen
Alloys andother additives
Evaluation of PM2.5 Emissions and Controls at Two Michigan Steel Mills and a Coke Oven Battery
12
Emissions from the ESP stack, charging, tapping, and LMFs include filterable PM, condensible PM, and metal HAP. Because of the high temperatures, the more volatile metals are removed and concentrated in the PM. The primary metal HAP is manganese, which was reported in an EPA survey as about 1 percent of the BOF dust. Other analyses of BOF dust averaged 1.1 percent manganese, 0.74 percent lead, 0.03 percent chromium, and 0.01 percent nickel. BOF slag contains about 4.3 percent manganese, 0.001 percent each lead and nickel, and 0.1 percent chromium. The dust from the LMF generally contains higher concentrations of HAP metals because of the addition of alloys containing manganese and chromium (e.g., 5.9 percent manganese and 0.05 percent chromium).
3.4 Coke Ovens 5, 12, 13
3.4.1 Process Description
Coke ovens use thermal distillation to remove volatile non-carbon elements from coal to produce coke. Thermal distillation takes place in groups of ovens called batteries. A coke oven battery consists of 20 to 100 vertically adjacent ovens that range from 3 to 6 meters in height with common side walls made of refractory brick. The EES coke battery consists of 85 6-meter tall ovens. Ovens are charged with coal from the top. When coking is complete, doors on both ends of the oven are removed, and the coke is pushed from one side of the battery (the “pusher side”) out the other side (the “coke side”).
Pulverized coal is mixed and blended, and sometimes water and oil are added to control the bulk density of the mixture. The prepared coal mixture is transported to the coal storage bunkers on the coke oven battery. A specific volume of coal is discharged from the bunker into a larry car—a charging vehicle that moves along the top of the battery. The larry car is positioned over an empty, hot oven; the lids on the charging ports are removed; and the coal is discharged from the hoppers of the larry car into the oven. To minimize the escape of gases from the oven during charging, steam aspiration is used to draw gases from the space above the charged coal into a collecting main. After charging, the aspiration is turned off, and the gases are directed through an offtake system into a gas collecting main.
The wall separating adjacent ovens, as well as each end wall, is made up of a series of heating flues. Process heat comes from the combustion of blast furnace gas and coke oven gas. The EES coke battery uses an underjet heating system. In this type of system, the flue gas is introduced into each flue from piping in the basement of the battery. The gas flow to each flue is metered and controlled. Waste gases from combustion exit through the battery stack.
The individual ovens are charged and discharged (or “pushed”) at approximately equal time intervals during the coking cycle. Coking continues for approximately 18 hours to produce blast furnace coke. The coking time is determined by the coal mixture, moisture content, rate of underfiring, and the desired properties of the coke. The coking flue temperature at the EES coke battery is about 1,274ºC (2,325ºF).
The maximum temperature attained at the center of the coke mass is usually 1100ºC to 1500ºC. At this temperature, almost all volatile matter from the coal mass volatilizes and leaves a high quality metallurgical coke. Air is prevented from leaking into the ovens by maintaining a positive back pressure of about 10 mm of water. The gases and hydrocarbons that evolve during thermal distillation are removed through the offtake system and sent to the by-product plant for recovery.
Evaluation of PM2.5 Emissions and Controls at Two Michigan Steel Mills and a Coke Oven Battery
13
Near the end of the coking cycle, each oven is dampered off the collection main. Once an oven is dampered off, the standpipe cap is opened to relieve pressure. Volatile gases exiting through the open standpipe are ignited if they fail to self-ignite and are allowed to burn until the oven has been pushed. At the end of the coking cycle, doors at both ends of the oven are removed, and the hot coke is pushed out the coke side of the oven by a ram that is extended from a pusher machine. The coke is pushed through a coke guide into a special rail car, called a quench car, which traverses the coke side of the battery. The quench car carries the coke to a quench tower where the hot coke is deluged with water. The quenched coke is discharged onto an inclined “coke wharf” to allow excess water to drain and to cool the coke to a reasonable temperature. Gates along the lower edge of the wharf control the rate that the coke falls on the conveyor belt that carries it to a crushing and screening system.
Gases evolved during coking leave the coke oven through standpipes, pass into goosenecks, and travel through a damper valve to the gas collection main that directs the gases to the by-product plant. These gases account for 20 to 35 percent by weight of the initial coal charge and are composed of water vapor, tar, light oils, heavy hydrocarbons, and other chemical compounds.
At the by-product recovery plant, tar and tar derivatives, ammonia, and light oil are extracted from the raw coke oven gas. After tar, ammonia, and light oil removal, the gas undergoes a final desulfurization process at most coke plants to remove hydrogen sulfide before being used as fuel. (EES Coke is one of the few coke plants in the United States that does not desulfurize its coke oven gas before burning it in the underfiring system of the coke oven battery.) Approximately 35 to 40 percent of cleaned coke oven gas (after the removal of economically valuable by-products) is used to heat the coke ovens, and the remainder is used in other operations related to steel production, in boilers, or is flared.
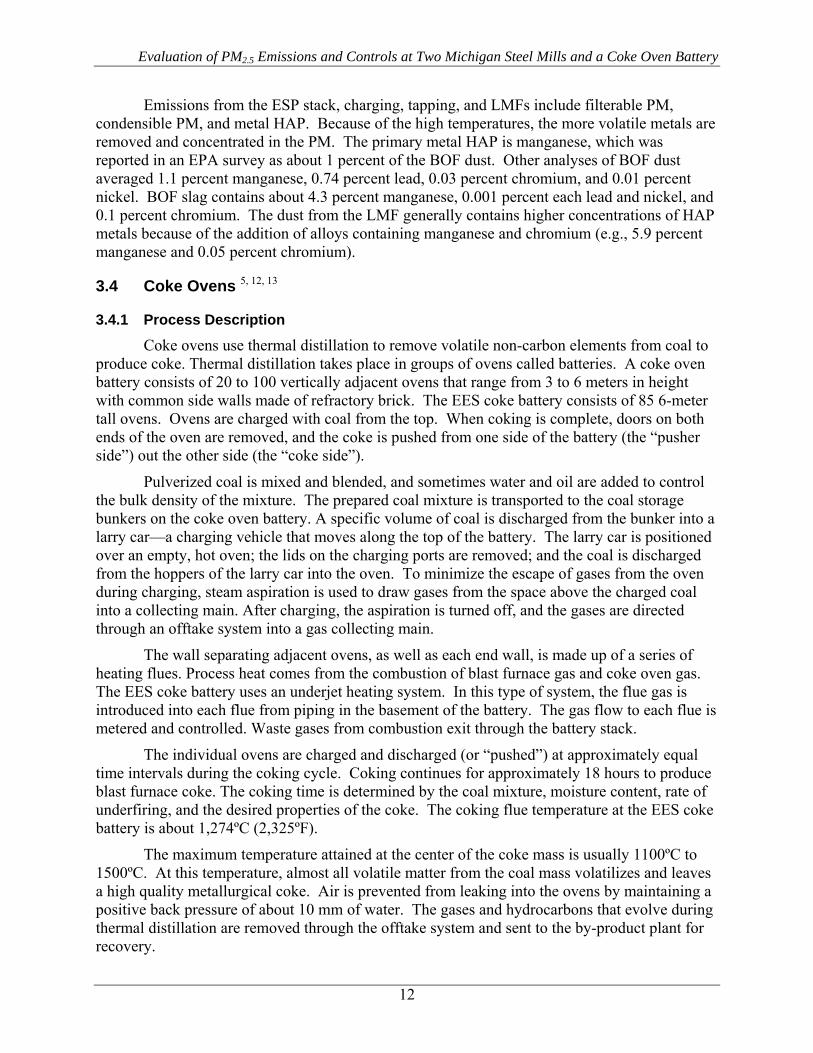
3.4.2 Emissions and Controls 5, 8, 12, 13
Emissions from coke oven batteries consist primarily of filterable PM (coal and coke fines) and raw coke oven gas—a complex mixture of dusts, vapors, and gases that typically include polycyclic aromatic hydrocarbons (PAHs), hydrogen sulfide, formaldehyde, acrolein, aliphatic aldehydes, ammonia, carbon monoxide, nitrogen oxides, phenol, and dozens of other compounds. The components of most concern with respect to health effects are carcinogenic PAHs found primarily in the tar and commonly called polycyclic organic matter (POM). These compounds are high-molecular-weight organic compounds that condense to form fine organic PM or condense on filterable PM particles. They are typically measured and reported as the filterable and condensible PM that is soluble in benzene (benzene-soluble organics or BSO) or methylene chloride (methylene chloride-soluble organics or MCSO). Both “coke oven emissions” and POM are listed under the Clean Air Act as HAPs.
Sources of emissions from coke ovens include charging; leaks from doors, lids, offtakes, and the collecting main during the coking cycle; pushing; quenching; and the battery’s combustion stack. Figure 3-4 is a schematic of the emission points for a coke oven battery. The following description of control techniques apply to EES Coke and to coke oven batteries in general.
Evaluation of PM2.5 Emissions and Controls at Two Michigan Steel Mills and a Coke Oven Battery
14
Combustion stack
Quench tower
Coal bunker
Chargingcar
for coal
Quench carCoke
Coke pushing machine
Coke wharf
Doors
Lids on charging ports
Offtakes
Gas collectingmain
Water
Coke Oven Battery
Quenchingemissions
Combustionstack
emissions
Fugitive pushingemissionsCharging
emissionsLid leaks Offtakeleaks
Door leaks
Baghouse forcaptured pushing
emissions
Pushingbaghouseemissions
Figure 3-4. Schematic of emission points on a coke oven battery.
Emissions from charging are controlled by using stage charging and steam aspiration. Stage charging is the controlled release of coal from the hopper to ensure that a headspace is maintained in the top of the oven for removal of gases. Steam aspiration is used to pull the charging emissions into the gas collection system to prevent their release to the atmosphere. All U.S. coke batteries use these techniques and have reduced charging emissions to a few seconds of visible emissions per charge.
After charging, the lids are replaced on the charging ports and sealed with a water and refractory mixture called luting. Emissions from lid leaks have almost disappeared at U.S. coke oven batteries because of increased worker diligence in spotting leaks. They are easily sealed with the luting material.
Emissions may occur from the cap on top of the offtake (or standpipe) or from the expansion joint where the offtake is attached to the oven. Water seals and luting are used to stop offtake leaks. Leaks may also occur in the collecting main, the pipe that collects the raw coke oven gas.
Emissions from door leaks are controlled primarily by work practices that maintain the “self-sealing” doors. The doors have a metal knife-edge seal that seats against the door jamb on the oven. Any small gaps in the seal are filled by the condensation of tar generated during coking. Work practices include cleaning tar from the jamb and seals after pushing, maintaining the metal seals, and adjusting the seals as necessary to stop leaks. Some plants apply a supplemental sealant (such as sodium silicate) to the outside of the door to assist in stopping leaks. In their survey response, EES Coke reported that it had implemented improved work practices to reduce door leaks by 50 percent. In addition, the door cleaner and jamb cleaner tools are renewed once per week.
Evaluation of PM2.5 Emissions and Controls at Two Michigan Steel Mills and a Coke Oven Battery
15
Pushing emissions are generated during the transfer of coke from the oven to the quench car and during travel to the quench tower. Pushing emissions contain gases resulting from the combustion of hot coke and from incomplete coking, as well as PM resulting from the breakage of coke when it falls into the quench car. Almost all coke plants have capture and control systems for pushing emissions because it is a large source of PM emissions. The EES coke battery uses a moveable hood that is positioned over the oven being pushed to capture pushing emissions. The emissions are captured at a rate of 185,000 actual cubic feet per minute (acfm) with an estimated capture efficiency of 98 percent and are sent to a pulse-jet baghouse for control. If the coke is not completely coked out, a “green” push occurs. A green push is one in which the volatile organic matter is still evolving from uncoked coal and results in heavy emissions that overwhelm the pushing capture system. Emissions during travel to the quench tower generally have a low opacity (except when the coke is green) and are not controlled.
PM emissions also occur during quenching when the red-hot coke is deluged with water. HAP emissions can also occur from the quenching of green coke. The only emission control equipment used to reduce quenching emissions is baffles or “mist eliminators.” Most baffles consist of wooden slats spaced 10 to 20 cm apart, inclined at an angle of 14 to 70 degrees from the horizontal. In some cases, there may be more than one row of baffles, or they may be of a special design. Use of baffles is primarily intended for reduction of carryover or fallout of PM that often occurs in the vicinity of the quench tower. The intended action is the interception of particulates and water droplets carried in the quench vapor updraft. Most of the larger particulate and water droplets that impact the baffles presumably fall back down the tower. However, some of the dust-bearing mist adheres to the baffles until it is physically removed by overhead sprays or some similar cleaning mechanism. Consequently, periodic cleaning of the baffles is another necessary emission control technique. Most plants use automated spray systems to clean the baffles. EES Coke indicated that within the past year it had installed stainless steel baffles and backwash sprays to improve baffle cleaning.
Water quality also affects quenching emissions as pollutants in the water are vaporized or entrained in the plume of water vapor. Most states have limits on total dissolved solids (TDS) for the water used for quenching. For example, the EES coke plant has a limit of 800 ppm TDS.
Emissions from the combustion stack include filterable and condensible PM, NOx, and SO2. Coke oven emissions (a HAP) can occur when raw coke oven gas leaks through cracks in the oven walls into the flue system. No U.S. coke batteries use an add-on control device to control emissions from the combustion stack. The PM emissions are controlled by good combustion practices and inspection and repair of oven walls. Maintenance techniques and work practices are important control methods because both particulate and gaseous emissions are related to fuel combustion problems or oven-to-wall leakage, which results in localized oxygen deficiency and incomplete combustion. EES Coke reported that when the battery was rebuilt in 1992, the ovens were equipped with flue gas recirculation to reduce NOx emissions.
Visible emissions observations and a continuous opacity monitor (COM) on the stack are used to identify problem ovens that are in need of maintenance or repair. When excess visible emissions or high opacity readings are noted from the combustion stack, the oven most recently charged is often the source of emissions. If these ovens are identified and scheduled for inspection of oven walls and flues, the source of excess emissions can often be determined and corrected. The EES Coke battery is equipped with a COM to monitor emissions from the combustion stack.
Evaluation of PM2.5 Emissions and Controls at Two Michigan Steel Mills and a Coke Oven Battery
16
4.0 Permit Limits and Performance
4.1 Limits and Conditions All three facilities are considered major sources of HAP and are subject to conditions
under Renewable Operating Permits (ROPs). In addition, Severstal and USSGLW are subject to one or more consent orders, which are legally binding agreements between the facility and U.S. EPA or Michigan DEQ. The permit limits for the operations with the greatest potential emissions are summarized in Table 4-1.
Table 4-1. Permit Limits for Major Emission Points Facility Emission Point Permit Condition
EES Coke Pushing fugitives 20% opacity EES Coke Pushing baghouse 9.7 tpy and 0.02 lb/ton coke PM EES Coke Battery stack 25.7 lb/hr and 0.012 gr/dscf PM
a Severstal has proposed a limit of 0.0152 gr/dscf to DEQ.
Table 4-2 summarizes performance tests on one of the major emission points—the BOF ESP. The table shows compliance with the permit limit of 0.02 gr/dscf. However, the test results show that performance has been highly variable. If this variability could be reduced to obtain consistent performance at the lowest levels measured, emissions might be reduced by 25 to 50 percent from peak levels.
Table 4-2. PM Test Results for BOF ESPs
Severstal’s ESP tests14–16 USS ESP tests17, 18
Date Run PM (gr/dscf) Date Run PM (gr/dscf) Jun-00 1 0.00893 Dec-04 1 0.008
2 0.00668 2 0.006 3 0.00818 3 0.010 Average 0.00793 Average 0.008
Apr-98 1 0.0088 Sep-02 1 0.018 2 0.0159 2 0.018 3 0.0092 3 0.012 Average 0.0113 Average 0.016
Oct-98 1 0.00638 2 0.00769 3 0.01448 Average 0.00952
Evaluation of PM2.5 Emissions and Controls at Two Michigan Steel Mills and a Coke Oven Battery
17
4.2 Performance Recent problems or malfunctions leading to excess emissions are summarized below for
each facility. Explanations, repairs, and any other mitigation measures taken by the facilities are also discussed.
4.2.1 USSGLW
In 2004, USSGLW experienced some problems with the opacity of emissions from the ESP stack and BOF shop roof monitors.19-21 The plant has ongoing construction projects to improve the efficiency of the ESP during the oxygen blow; improve the capture of emissions from charging and tapping; improve the capture of emissions from hot metal transfer, desulfurization, and slag skimming; and enlarging the No. 2 baghouse.22 USSGLW had occurrences of bleeder stack emissions from “D” blast furnace in 2005; however, the company identified a problem with seals on the bleeder caps and resolved the problem after trying several seal installation methods.22, 23
The facility also plans to install bag leak detection systems, pressure drop monitors, wet scrubber flow rate measurement equipment, fan amp monitors, and damper position monitors, as required by the NESHAP (40 CFR subpart CCCCC).21, 22
4.2.2 Severstal
Since taking control of the facility in early 2004, Severstal has had problems with the opacity of emissions from the BOF shop roof monitors and torpedo cars. Occasional exceedances have also been observed from scarfer operations, casthouse roof monitors, and the blast furnace bleeder stack.24 The opacity problems with the BOF shops and casthouse will be corrected because Severstal plans to install dedicated capture hoods and new baghouses to control emissions from the casthouse and BOF shop.25-27 These changes will result in reduced emissions of PM2.5-FIL and manganese. In its survey response, Severstal indicated that the causes of bleeder stack emissions included problems with raw materials, malfunctions, preventative maintenance, and downstream delays. Corrective actions include procuring raw materials that meet specifications and monitoring and analyzing the causes of delays. The company indicated that it was necessary to burn the taphole open if there was a malfunction with the drill or if iron had solidified in the taphole. The number of times it has been necessary to burn the taphole open has decreased each quarterly reporting period from 35 times in the 4th quarter of 2004 to 7 times in the 3rd quarter of 2005.25
Severstal plans to install bag leak detection systems and monitors for pressure drop for baghouses applied to reladling, desulfurization and, LRF. In addition, a camera system will be installed to monitor the BOF roof and the ESP stack.25
4.2.3 EES Coke
In May 2003, the quench tower baffles were inspected and found to be in need of repair or replacement. New baffles were installed in August 2004.28 Within the past year, EES Coke has implemented work practices resulting in a 50 percent reduction in door leak emissions.29
In its survey response, the company indicated there had been only four malfunctions of short duration over the past year, and they affected the emissions from the battery combustion
Evaluation of PM2.5 Emissions and Controls at Two Michigan Steel Mills and a Coke Oven Battery
18
stack. A reversing arm broke on two occasions, resulting in malfunctions lasting 36 minutes and 48 minutes. Two other minor events lasted 6 minutes each.29
Tests conducted on the battery stack in 2004 showed PM emissions of 11.1 lb/hr and 0.0087 gr/dscf, both well below the permit limits. Similarly, the baghouse used for pushing emissions performed well below the PM permit limits in 2004 with an average of 0.0036 lb/ton of coke and 2.0 lb/hr. Emissions from charging and leaks on doors, lids, and offtakes have been consistently below the allowable levels.30 Opacity data for 102 pushes showed all were well below the 20 percent limit with an average of 1.4 percent opacity and a maximum of 13 percent.12
5.0 Emission Estimates This section presents emission estimates for PM2.5, PM condensibles, SOx, NOx, and
HAP metals. These estimates are derived from a variety of sources, and there is a varying amount of uncertainty associated with them. One of the most uncertain estimates is for PM condensibles because the plants of interest have not been tested; consequently, estimates are developed from plants with similar processes and controls. Similarly, these plants have generally not been tested to measure emissions of HAP metals, and as a result, there is a great deal of uncertainty associated with these emission estimates. Finally, fugitive emissions by their very nature are not captured and are not directly measured. The estimates for fugitive emissions are based on uncontrolled emission factors and a best estimate of capture efficiency. A comprehensive program of emission testing is needed to develop a more credible emissions inventory, provide the information needed to establish the impact on ambient air concentrations, and identify additional cost-effective opportunities to reduce emissions.
5.1 Development of Emission Estimates The first choice for a sound basis to estimate emissions is an emission test conducted
under representative conditions using validated test methods. Ideally, there would be multiple tests over time to account for variability in the process as well as in sampling and analysis. This first choice is seldom available, and techniques of varying accuracy and uncertainty must be used to develop best estimates of emissions. For the three Michigan plants, there are few emission test results for the pollutants of interest (i.e., no data for PM2.5-FIL and PM-CON and very little data for HAP.) Some of the primary emission points have been tested for total filterable PM (front half of Method 5), but most emission points have not been tested even for PM. In addition, fugitive emissions comprise a significant part of total emissions, and by their very nature, they are not captured and cannot be reasonably sampled.
For the few emission points that have been tested, the site-specific test results are used as the starting point. Other resources examined and used to develop emission factors include the following:
# Test results from other iron and steel plants and coke plants with similar emission points and control devices
# EPA’s AP-42 compilation of emission factors31, 32 # The Michigan Air Emissions Reporting System (MAERS) database of emission factors33 # EPA’s Alternative Control Techniques Document—NOx Emissions from Iron and Steel
Mills 34
Evaluation of PM2.5 Emissions and Controls at Two Michigan Steel Mills and a Coke Oven Battery
19
# Volumetric flow rate and estimates or measurements of outlet grain loading # Air Pollution Control Bureau (local agency) in Allegheny County (Pittsburgh,
Pennsylvania) database on emissions from coke plants and steel mills35 # Emission inventories and emission factors used by the three companies in reporting
emissions to DEQ.
The general approach used here relies on measurements and estimates of PM-FIL as a starting point to estimate emissions. Particle size distributions are then used to estimate PM2.5-FIL. Data from other sources are used to estimate the ratio of PM-CON/PM-FIL, and this ratio is applied to the PM-FIL estimates to approximate condensibles. Metal HAPs are estimated from data on the composition of dust, primarily from PM captured by control devices. Estimates of SO2 and NOx are based primarily on emission factors from AP-42 and the MAERS.
The emission inventories submitted to DEQ by the companies are important resources for the emission estimates, especially for the process throughputs that are needed to apply the emission factors and to identify the population of emission points. Details for the 2003 and 2004 inventories are given in Appendix A along with the results of a detailed review and analysis of the emission estimates in the inventory.
5.2 Emission Factors for PM, NOx, and SOx Emission factors for PM, NOx, and SOx are summarized in Table 5-1. Plant-specific
data for PM are used for the BOF ESPs for both plants because they have been tested several times.14–18, 36 Test data were available for the baghouses applied to fugitive emissions from U.S. Steel’s casthouses and BOF shop.37–40 Test data were also available for the coke plant’s pushing baghouse and combustion stack.41–48 The primary source of PM emission factors for other sources in Table 5-1 is EPA’s AP-42 compilation of emission factors.
In some cases, it is necessary to estimate a capture and control efficiency in order to estimate fugitive emissions escaping capture. For example, there is no emission factor for the use of covered runners and fume suppression to control emissions from the blast furnace casthouse. The extent of the emission reduction from the uncontrolled case is very difficult to measure directly. In developing their emissions inventory, Severstal uses an 85 percent reduction based on the Michigan SIP. A German researcher reported casthouse emissions of 546 kg/day from the casthouse were reduced to 144 kg/day (74 percent reduction) by using covered runners, minimal space between the molten iron and covers, and fume suppression with an inert gas.49 In the absence of better information, a nominal reduction of 75 percent is used in this report for estimating casthouse emissions controlled by suppression techniques. However, we acknowledge the uncertainty in the estimated reduction and cannot conclusively state that it is not as high as 85 percent or that it may be lower than 75 percent.
Evaluation of PM2.5 Emissions and Controls at Two Michigan Steel Mills and a Coke Oven Battery
20
Table 5-1. Development of Emission Factors
Emission point Pollutant Emission
factor Units Source
(see text for details) Blast furnace casthouse roof monitor – uncontrolled
2004) Battery combustion stack PM-CON 159 lb/hr Test in 2002 Battery combustion stack (BFG/COG) SOx 192 lb/hr Test in 1996 Battery combustion stack NOx 77 lb/hr Two tests (2003 and
2004)
There are several cases where hoods are used to capture process emissions, such as those from hot metal transfer, desulfurization, and ladle metallurgy. Capture efficiency can vary widely, depending on hood design, proximity to the source, evacuation rate, and other factors. In the background document for the New Source Performance Standards (NSPS) for electric arc furnaces,50 EPA estimated capture efficiencies of 75 percent to 85 percent for a single canopy hood, 85 percent to 95 percent for a segmented canopy hood and for a local tapping hood, and 90 percent to 95 percent for combinations of capture hoods. Modern hoods are designed for efficient capture by strategically locating them and providing adequate evacuation. A capture efficiency of 95 percent is used in Table 5-1 to estimate the emissions escaping capture hoods (i.e., 0.05 times the uncontrolled emission rate).
Evaluation of PM2.5 Emissions and Controls at Two Michigan Steel Mills and a Coke Oven Battery
22
The primary hood and control system on the BOF can be used to capture some of the emissions from charging and tapping when there is no dedicated capture and control system. Severstal has a local hood to capture charging emissions and send the emissions to the ESP for control. Some tapping emissions are captured by the BOF’s open hood and ESP. In their inventory estimates, Severstal uses an estimated capture efficiency of 95 percent for charging and tapping emissions and applied emission factors of 0.03 and 0.046 lb/ton, respectively (0.05 times uncontrolled factor). Our research indicates that 95 percent capture is more appropriate for hoods designed and dedicated to capture fugitive emissions, but the estimate appears high for capture and control by the primary system. This observation is further supported by the exceedances of the 20 percent opacity limit for the BOF shop, as described in Chapter 4, and by the judgment of inspectors from DEQ and EPA Region V. For this report, we use a capture and control efficiency of 75 percent instead of 95 percent when the primary system is used to control charging and tapping emissions. We use a value of 95 percent for a dedicated capture system vented to a baghouse; however, we acknowledge the uncertainty in these estimates because they are based on judgment rather than actual measurements. For example, if a dedicated hood and baghouse achieve 98 percent control instead of 95 percent, emissions would be 60 percent lower than our estimates. In some cases, emissions are estimated based on the company’s emissions inventory submitted to DEQ because no alternative estimating procedure was found. These are generally minor sources. For blast furnaces, U.S. Steel estimated SO2 emissions from the combustion of blast furnace gas at 1.67 lb/MMSCF and Severstal used 8.87 lb/MMSCF. For natural gas combustion in blast furnace stoves, U.S. Steel estimated NOx emissions using the AP-42 uncontrolled emission factor of 280 lb/MMSCF. Severstal used a factor of 140 lb/MMSCF for the blast furnace stoves and 110 lb/MMSCF for reheat furnaces (from MAERS). For this report, we used a factor of 280 lb/MMSCF for both plants. (The emission factor of 140 lb/MMSCF from MAERS appears to be for low-NOx burners). We used a factor of 0.03 lb/ton for NOx from the casthouse, but we note that Severstal recommends a factor of 0.006 lb/ton based on testing at National Steel.
There are a few cases where the volumetric flow rate through a control device (e.g., a baghouse) is known, and there is a measurement or estimate of the outlet grain loading in gr/dscf. The PM concentration, volumetric flow rate, and hours of operation can be used to estimate PM emissions in lb/hr and tpy.
For storage piles, unpaved roads, and paved roads, site-specific information was requested from each company. However, none of the companies had performed any analyses in recent years, and the only information available were estimates provided to DEQ for their June 1993 technical support document for the PM10 SIP. The estimates reflect emission controls used at that time for fugitive emissions, such as chemical suppressants for storage piles and unpaved roads and sweeping of paved areas. These estimates are acknowledged to be outdated and highly uncertain because of the difficulty in developing accurate estimates for open area sources and adequately accounting for the efficiency of the control measures that are used.
Emissions from coke oven charging, door leaks, lid leaks, and offtake leaks are based on site-specific visible emissions data and procedures in the revised draft section of AP-42 for cokemaking.31 The procedure estimates BSO emissions as a surrogate for coke oven emissions. AP-42 also includes ratios that can be used to estimate filterable and condensible emissions from the BSO estimate. The emission calculations are illustrated here based on 608 daily inspections of Battery 5. The battery averaged 1.6 percent leaking doors (PLD), 0.16 percent leaking lids
Evaluation of PM2.5 Emissions and Controls at Two Michigan Steel Mills and a Coke Oven Battery
23
(PLL), 0.6 percent leaking offtakes (PLO), and 4.7 seconds of emissions per charge (s/charge).30 For door leaks, the revised AP-42 procedure accounts for door leaks that are too small to be seen when inspections are made at a distance from the battery for safety reasons (i.e., 6 percent of the doors are estimated to have leaks too small to be seen during the inspection). Emissions were estimated as follows:
The ratio of PM-FIL to BSO is 0.8 for charging and 0.9 for leaks. The ratio of PM-CON to BSO is 0.9 for charging and for leaks.14
Emissions that escape capture during pushing are based on two EPA tests that involved sampling at the inlet and outlet of the baghouse.51, 52 These tests were performed in 1998 at a coke plant producing blast furnace coke and at another plant producing foundry coke. PM-FIL at the baghouse inlet was measured as 1.9 lb/ton of coke at one plant and 1.5 lb/ton at the other plant. Using a typical capture efficiency of 95 percent, emissions escaping capture would be 0.09 lb/ton.
The SOx emissions from the coke battery’s combustion stack are based on a 1996 test with a rate of 192 lb/hr (841 tpy).48 Estimates of emissions of SOx from the combustion of coke oven gas by flaring and in processes at the steel plant are derived from the H2S content of the gas and the conversion of H2S to SO2 during combustion. (EES Coke submitted data from H2S analyses in 2005 with values of 0.9, 1.3, and 1.75 grains [gr] H2S/standard cubic foot [scf]).53 A survey of coke oven batteries in the late 1990s showed a range of approximately 1.7 to 2.9 gr/scf.13 An estimate of 1.75 gr/scf is used for the H2S concentration in this report to estimate the equivalent SO2 emissions as 471 lb/MMSCF.
5.3 Emission Factors for PM2.5 and Condensibles Factors used to estimate PM2.5 and condensible emissions are summarized in Table 5-2.
The primary source for particle size distributions is EPA’s AP-42 compilation of emission factors.32 For natural gas combustion, AP-42 states that all PM is less than 1 micron54 (the same is assumed for the combustion of BFG and COG). There were no particle size data in AP-42 for BOFs controlled by ESPs; however, tests were conducted at Rouge Steel (now Severstal) in 1985 and 1989 that included particle size distribution of the PM-FIL. For PM2.5-FIL (as a percent of PM-FIL), the results from five analyses averaged 73 percent with a range of 60 percent to 87 percent.55–57
Evaluation of PM2.5 Emissions and Controls at Two Michigan Steel Mills and a Coke Oven Battery
24
Table 5-2. PM2.5 Filterables and Condensibles (ratios to PM-FIL)
Source PM2.5-FIL:
PM-FIL Basis PM-CON: PM-FIL Basis
Blast furnace stove (NG) 1 AP-42 3 AP-42 Boiler (NG) 1 AP-42 3 AP-42 Boiler (BFG) 1 AP-42 0.55 Average from Geneva Steel and
Allegheny County Boiler (COG) 1 AP-42 0.55 Average from Geneva Steel and
Allegheny County Blast furnace casthouse 0.23 AP-42 0.7 Allegheny County inventory Desulfurization fugitives 0.11 AP-42 0.7 Assume same as casthouse Desulfurization baghouse 0.42 AP-42 0.045 Allegheny County inventory BOF ESP stack 0.73 Rouge Steel test
average 0.29 LTV Steel, WCI Steel
BOF charging fugitives 0.22 AP-42 0.7 Assume same as casthouse BOF charging baghouse 0.22 AP-42 0.77 Average from Geneva Steel and
Allegheny County BOF tapping fugitives 0.37 AP-42 0.7 Assume same as casthouse BOF tapping baghouse 0.16 AP-42 0.77 Average from Geneva Steel and
Allegheny County Ladle metallurgy baghouse 0.16 Assume same as
tapping baghouse 0.05 LTV Steel
Slag 0.2 AP-42 (aggregate storage)
0 Allegheny County inventory
Raw material and slag storage and handling
0.2 AP-42 (aggregate storage)
0 Allegheny County inventory
Coke pushing baghouse 0.74 AP-42 0.08 Allegheny County inventory Pushing fugitives 0.17 AP-42 0.002 Allegheny County inventory Combustion stack 0.935 AP-42 159 lb/hr Site-specific test results for
Data from other plants with similar processes and emission control devices were used to estimate the ratio of PM-CON to PM-FIL. For the BOF ESP stack, the back half catch from Method 5 tests (PM in the impingers) was reported for four tests (19 runs) performed on the BOF ESPs at LTV Steel (Cleveland, Ohio) and WCI Steel (Warren, Ohio). The average ratio of condensible to filterable PM was 0.29.58–62 LTV Steel also measured condensibles for the ladle metallurgy baghouse with an average ratio of 0.05 from three runs.63 This is similar to the ratio
Evaluation of PM2.5 Emissions and Controls at Two Michigan Steel Mills and a Coke Oven Battery
25
from the Allegheny County (Pennsylvania) inventory for the baghouse applied to hot metal transfer and desulfurization (0.045).35 Geneva Steel (Provo, Utah) measured condensibles for the baghouse applied to charging and tapping emissions with an average ratio of 0.43 from six runs.64 The ratio for the BOF baghouse in Allegheny County was 1.1. An average value of 0.77 is used in Table 5-2.
Geneva Steel also reported condensibles from testing a boiler burning COG and BFG with an average condensibles-to-filterables ratio of 0.55.64 This is significantly lower than the ratio in AP-42 for the combustion of natural gas (3.0). However, it is in the same range as the ratio from the Allegheny County inventory for a U.S. Steel plant, which had a condensibles-to-filterables ratio ranging from 0.52 to 0.58 for combustion of BFG and COG in several boilers. The Allegheny County inventory for two blast furnaces reported a ratio of 0.7 for casthouse emissions and ratios of 1.7 and 1.9 for the blast furnace stoves. The same inventory reported no condensibles for emissions from paved roads, unpaved roads, storage piles, and slag handling.35
The fugitive emissions from storage piles, paved roads, and unpaved roads are from 1993 estimates of PM10 emissions. Particle size distributions from AP-42 for these sources were used to estimate the ratio of PM2.5 to PM10 in Table 5-2.
There are 12 U.S. Steel coke oven batteries in Allegheny County. For the five baghouses used to control pushing emissions (primarily coke fines), the average ratio of condensibles to filterables was 0.08. For pushing fugitive emissions, a ratio of 0.002 was used.35
For quenching, an emission factor of 0.15 lb/ton was used for condensible PM65 and gives a ratio of 0.48 (based on 0.31 lb/ton for PM-FIL); however, there are several factors that introduce significant uncertainty in this estimate. The quantity of condensible PM is strongly affected by the frequency of green pushes, and there is no direct comparison of this factor between the EES Coke battery and the one that was tested. In addition, the EPA test was conducted approximately 30 years ago, and the design and operation of quench towers make it very difficult to perform accurate sampling.
The EES Coke plant was tested in September 2002 to determine the emission rate of condensible PM from the combustion stack. The results were reported for organic and inorganic condensibles (minus sulfates) and for sulfates. The emission rate for total condensibles was 159 lb/hr with 0.6 lb/hr for inorganics, 98.3 lb/hr for organics, and 60.5 lb/hr for sulfates.66 We use these test results in this report because they are the only data available; however, we note that the test method as used for this test introduces a high bias and recommend additional testing be performed to develop a better estimate of condensible emissions from the combustion stack.
5.4 Emission Factors for HAP Metals There are very few test results for direct measurement metal HAP emissions from the
numerous emission points at integrated iron and steel plants. The emission points of most interest with respect to metal HAP are those for ironmaking and steelmaking where molten iron and steel are present. The high temperatures of these processes volatilize metal HAP, and others escape as oxides after exposure to oxygen. Manganese is by far the most prevalent HAP and is emitted in the highest quantities.
The procedure used here to develop emission estimates for HAP is based on the analysis of the dust and sludges captured by air pollution control devices. These analyses can be used with some confidence when applying them to fugitive emissions because they should be the
Evaluation of PM2.5 Emissions and Controls at Two Michigan Steel Mills and a Coke Oven Battery
26
same composition as the captured emissions. They are used with somewhat less confidence for emissions from control devices because controlled emissions are likely to have smaller particle sizes than the captured dust, and the HAP concentration may change with particle size. Table 5-3 summarizes the metal HAP estimates based on the composition of air pollution control device (APCD) residue from an EPA/Office of Solid Waste (OSW) study of solid wastes in the iron and steel industry 67 and a survey conducted for the maximum achievable control technology (MACT) standard.3 Table 5-4 provides information from an EPA survey in 2005 of the Michigan steel plants.
Table 5-3. Metal HAP in APCD Residue and Slag Metal HAP as percent of dry solids
Ladle metallurgy dustb 5.9 0.11 0.0068 0.050 Ladle metallurgy dusta 2.2 0.11 0.0035 0.017 a From the U.S. Steel survey response. b From the Severstal survey response.
A study performed by three Indiana steel mills, EPA, and the Indiana Department of Environmental Management examined sources of mercury at integrated iron and steel mills.68 The total amount of mercury entering the processes with raw materials and recycled materials was estimated as 242 lb/yr for the three plants with a total steel capacity of 16 million tpy. Approximately 106 lbs of mercury were removed in the disposal of waste and wastewater. However, the study did not examine mercury that might enter the process with ferrous scrap.
Evaluation of PM2.5 Emissions and Controls at Two Michigan Steel Mills and a Coke Oven Battery
27
Data on mercury emissions from melting ferrous scrap were obtained from 22 tests conducted on electric arc furnaces (EAF) and averaged 0.0004 lb/ton.69 (Mercury switches in end-of-life vehicles are the primary source of mercury in scrap.) For an integrated iron and steel mill producing 3.3 million tpy of steel with about 30 percent of the steel from scrap, mercury emissions from each plant, based on the EAF tests, would be about 400 lbs/yr. This estimate is highly uncertain and will depend on the types of scrap charged to the BOF (i.e., the types of scrap may be quite different from those used in electric arc furnaces).
EPA tests of two coke oven batteries indicate that emissions of HAP metals are just a few pounds per year.51, 52 Results are summarized in Tables 5-5 and 5-6. These results are consistent with a European study that tracked the fate of metals in the coal that is used for coking.70 The study found that the heavier metals (beryllium, arsenic, cobalt, nickel, antimony, chromium, copper, vanadium, and manganese) were largely retained in the coke. However, cadmium, mercury, thallium, lead, and zinc were volatilized and then recovered in the tar in the by-product recovery plant. There was no discussion of the ultimate fate of these metals in the tar. (Tar is dewatered and sold to tar refiners who produce coal tar pitch for use as a binder in making graphite electrodes for electric arc furnaces and primary aluminum reduction plants.)
Table 5-5. Test Results for Metals from the Battery Combustion Stack Metal lb/ton coke (Plant A) lb/ton coke (Plant B) lb/yr (at 1 million tpy coke)
Pb 1.9 x 10⁻⁶ 7.1 x 10⁻⁶ 1.9 – 7.1 Mn not detected 5.0 x 10⁻⁶ 5.0 Hg not detected not detected — Ni not detected 1.9 x 10⁻⁶ 1.9
Table 5-6. Test Results for Metals from Pushing Fugitive Emissionsa Metal lb/ton coke (Plant A) lb/ton coke (Plant B) lb/yr (at 1 million tpy coke)
Pb 4.2 x 10⁻⁶ 1.4 x 10⁻⁶ 1.4 – 4.2 Mn 1.3 x 10⁻⁵ 1.7 x 10⁻⁶ 1.7 – 13 Hg 1.7 x 10⁻⁸ not detected 0.017 Ni 2.5 x 10⁻⁶ 1.5 x 10⁻⁶ 1.5 to 2.5 a Based on sampling at the baghouse inlet and 95 percent capture (5 percent emitted).
5.5 Site-Specific Estimates of Emissions The emission factors and procedures discussed in previous sections were applied to the
three plants to estimate emissions. The results are summarized in Table 5-7. The pollutant emitted in the highest quantity is NOx, which accounts for 43 percent of the total for PM2.5 and precursors. Approximately 89 percent of the SOx emissions results from the combustion of undesulfurized coke oven gas. SOx emissions comprise 35 percent of the total, followed by condensibles (14 percent) and filterables (8 percent). Manganese emissions are estimated as 13 tpy and comprise 84 percent of the metal HAP emissions in total PM and in the PM2.5 fraction. The metal HAP are associated with filterable PM emissions from the blast furnace casthouses and BOF shops where molten metal is processed.
Evaluation of PM2.5 Emissions and Controls at Two Michigan Steel Mills and a Coke Oven Battery
28
Table 5-7. Summary of the Emission Estimates Pollutant Emissions (tpy) Percent
HAP Total emissions (tpy) HAP in PM2.5 (tpy) Manganese 13 7.2 Lead 1.9 0.7 Nickel 0.04 0.01 Chromium 0.2 0.1 Mercury 0.4 0.4 Total 15.5 8.4
Tables 5-8 through 5-13 present the results for each emission point at each plant, and
additional details are given in Appendix B to show how the estimates were developed (e.g., throughput, emission factors, and other details). The primary source of PM2.5 and HAP metal emissions at both steel plants is the BOF shop: the BOF ESP stack and fugitive emissions from BOF charging and tapping. Emissions from the two blast furnace casthouses at Severstal are estimated to be significant contributors, primarily because they do not have capture hoods and baghouses for the casthouse.
U.S. Steel burns a variety of fuels (e.g., coke oven gas, blast furnace gas, natural gas), and the process gas from the coke ovens and blast furnaces appears to contribute the most to estimated PM2.5 emissions. The combustion of blast furnace gas at Severstal also contributes to PM2.5 emissions. Table 5-10 shows that the combustion stack at the coke battery is the most significant PM contributor because of condensible PM. The large quantity of condensibles includes both organic material and sulfates. (This estimate must be viewed with caution because it is based on only one emission test.)
The most significant sources of SOx emissions are from the combustion of coke oven gas at the coke battery and at the steel mill. The coke oven gas is not desulfurized to remove H2S; consequently, the combustion results in the formation of large quantities of sulfur compounds. NOx emissions are dominated by the combustion of blast furnace gas and coke oven gas.
Evaluation of PM
2.5 Emissions and C
ontrols at Two M
ichigan Steel Mills and a C
oke Oven Battery
29
Table 5-8. PM2.5 and HAP Metal Estimates for U.S. Steel (tpy)a
PM2.5 HAP metals in total PM HAP metals in PM2.5 Source PM25FIl PM-CON PM25PRI Mn Pb Ni Cr Mn Pb Ni Cr
a See the text of the report for a discussion of the uncertainty in the emission estimates. In particular, there is a great deal of uncertainty in the estimates for condensible PM due to the lack of site-specific test results.
Evaluation of PM
2.5 Emissions and C
ontrols at Two M
ichigan Steel Mills and a C
oke Oven Battery
30
Table 5-8. (continued) PM2.5 HAP metals in total PM HAP metals in PM2.5
522 685 1,207 10 0.5 0.03 0.1 5.9 0.2 0.01 0.03 a See the text of the report for a discussion of the uncertainty in the emission estimates. In particular, there is a great deal of uncertainty in the estimates for condensible PM due to the lack of site-specific test results.
Evaluation of PM2.5 Emissions and Controls at Two Michigan Steel Mills and a Coke Oven Battery
33
Table 5-10. PM2.5 Estimates for Battery 5 a Emissions (tpy)
a See the text of the report for a discussion of the uncertainty in the emission estimates. In particular, there is a great deal of uncertainty in the estimates for condensible PM due to the lack of site-specific test results.
Evaluation of PM2.5 Emissions and Controls at Two Michigan Steel Mills and a Coke Oven Battery
34
Table 5-11. SOx and NOx Estimates for U.S. Steel a Emissions (tpy)
a See the text of the report for a discussion of the uncertainty in the emission estimates.
Evaluation of PM2.5 Emissions and Controls at Two Michigan Steel Mills and a Coke Oven Battery
36
6.0 Control Options This section discusses control options and compares controls in place at other U.S.
integrated iron and steel mills as well as those in place in other countries. Table 6-1 summarizes the most feasible control options.
Feasible control technologies for emissions of NOx, SO2, and PM from combustion sources at iron and steel plants have been previously evaluated for the Midwest Regional Planning Organization (RPO) in a report on best available retrofit technology (BART).71 Table 6-2 summarizes the results of that analysis. The technologies are described briefly in the following sections.
The BART analysis failed to describe and evaluate two technologies for SO2 and PM that are currently being used at many iron and steel plants in the United States and abroad. The study examined flue gas desulfurization for coke oven combustion stacks and other iron and steel combustion processes. However, desulfurization of the coke oven gas fuel before it is burned is the more economical and most widely practiced technique that reduces SOx emissions, and this technology was not evaluated. Desulfurizing the fuel gas requires the treatment of a gas volume much smaller than the volume of combustion gases after it is burned, and in addition, it reduces the SOx emissions from all of the combustion sources in which the gas is used. The report examined PM controls for sources such as the coke oven combustion stack; however, an add-on device is not cost-effective because of the low PM concentration. Good combustion practices and repair of oven walls have been demonstrated to reduce emissions. The most cost-effective retrofit for PM control is to install capture hoods and baghouses for blast furnace casthouses and BOF shops. These options were not evaluated in the BART engineering analysis.
The BART analysis concluded that low-NOx burners and ultra-low NOx burners represented BART for iron and steel sources. As shown in Table 6-2, these controls are cost-effective. Our survey of the three plants indicated that NOx controls were not widely implemented. The EES Coke battery’s underfiring system is equipped with staged heating and flue gas recirculation to reduce NOx emissions. U.S Steel’s continuous galvanizing line is equipped with selective catalytic reduction to reduce NOx emissions. In addition, Severstal plans to install low-NOx burners on their blast furnace stoves.
Selection of SO2 controls as BART was more difficult because of the high cost. Our analysis of the Michigan plants indicates that removal of H2S (and other sulfur compounds) from the coke oven gas before it is burned is a widely demonstrated and feasible control technology; it has several advantages over treating the flue gas for SO2 removal. Desulfurizing the coke oven gas would reduce SO2 emissions from the combustion of coke oven gas by roughly 90 percent.
Evaluation of PM2.5 Emissions and Controls at Two Michigan Steel Mills and a Coke Oven Battery
37
Table 6-1. Summary of Demonstrated and Feasible Control Options Control option Feasibility Potential reductions Cost implications
1. Coke oven gas desulfurization at EES Coke Battery
Very feasible; in place at 11 of 16 US coke plants; used in Canada, UK, Europe, Japan
3,668 tpy (from a 90% reduction for the combustion of coke oven gas)
May be feasible; need site-specific engineering and feasibility study
If upgraded to 25% reduction: 66 tpy PM2.5FIL, 0.6 tpy Mn
Depends on site-specific analysis
5. Flue gas desulfurization
Feasible, but primary focus should be on COG; most SO2 reductions can be achieved by COG desulfurization
Remaining SO2 from fuels other than coke oven gas is 490 tpy; 442 tpy reduction at 90%
$8,500/ton - $45,000/ton (wet and dry FGD, 90% control; boilers) d
6. NOx controls Very feasible; demonstrated technology; apply to boilers, BF stoves, reheat furnaces
~1,500 tpy for 50% reduction at major fuel users at 2 steel mills (4,800 tpy to 3,300 tpy)
$880/ton to $1,400/ton (low NOx burners) d
7. Upgrade capture hoods and baghouses for miscellaneous operations
May be feasible; need site-specific testing and engineering study
Example: If testing shows 0.01 gr/dscf, a baghouse upgrade can easily achieve 0.005 gr/dscf
Depends on site-specific analysis
a Based on information provided for an installation in 1997 at a coke plant producing approximately 1.8 million tpy of coke: capital cost was $30 million and operating cost was $3.5 million/year. Scaling to EES Coke capacity (1 million tpy) and indexing to 2004 dollars (Chemical Engineering Plant Cost Index = 444.2/386.5 = 1.15) gives a capital cost estimate of $19 million and an operating cost of $2.2 million/year. The total annualized cost is $4 million/year using a capital recovery factor of 0.094 (20 years at 7 percent). EES Coke estimated a capital cost of $24 million. 72
b Severstal estimated a capital cost of $30 million for the capture and control system for the BOF shop and $10 million for the casthouse. 73
c Operating costs are taken from the BID for integrated iron and steel (indexed to $2005). Capital recovery is based on a factor of 0.094 (20 years at 7 percent).
d From the BART analysis.
Evaluation of PM2.5 Emissions and Controls at Two Michigan Steel Mills and a Coke Oven Battery
38
Table 6-2. Summary of Technologies Evaluated for BART 71
For PM controls applied to combustion sources, the BART analysis recommended existing controls. Our evaluation indicates that no integrated iron and steel plants in the United States have add-on control devices for the coke battery underfiring stack or blast furnace stoves; consequently, it is difficult to say that the add-on control technologies have been demonstrated for these processes or that it is practical considering their contribution to PM emissions. The relatively low PM concentration in these emissions makes the cost per ton of PM removed high. However, capture and control systems for fugitive emissions from casthouses and BOF shops have been widely used in the integrated iron and steel industry in the United States and abroad. Although this technology was not evaluated in the BART report, it is a feasible and demonstrated technology for reducing emissions of PM and toxic metals.
6.1 Coke Oven Gas Desulfurization Coke oven gas desulfurization is performed at 11 of the 16 by-product coke plants
currently operating in the United States.13 In Canada, one out of four integrated plants with coke batteries practices desulfurization;74 however, it is more widely used in Europe. A European
Evaluation of PM2.5 Emissions and Controls at Two Michigan Steel Mills and a Coke Oven Battery
40
Commission report75 on “best available techniques” for iron and steel production stated “desulphurisation of coke oven gas is a measure of high priority to minimise SO2 emissions, not only at coke plants themselves but also at other plants where the coke oven gas is used as fuel.”
The most commonly used process at U.S. coke plants is the Sulfiban process, followed by a Claus unit to produce elemental sulfur. The Sulfiban process uses monoethanolamine (MEA) as the absorbing solution. The rich solution is pumped to the still where H2S and hydrogen cyanide (HCN) are steam stripped. The acid gases are sent to a cyanide reactor where the cyanide is catalytically converted to ammonia, which can be recovered in an ammonia recovery plant, where one exists. The gas from the cyanide reactor passes to a plant for conversion into high-purity sulfur. This process is reported to remove organic sulfur as well as H2S. The sulfur removal efficiency is about 98 percent.74
The largest U.S. coke plant (U.S. Steel’s Clairton Works with 12 batteries) uses the vacuum carbonate process followed by a Claus unit. In the vacuum carbonate process, the gas is contacted with a solution of sodium carbonate in an absorber tower to remove the H2S and other impurities. The foul solution from the base of the absorber is circulated over the actifier where the H2S is removed by counter-current stripping with water vapor under vacuum. The actified solution is pumped from the base of the actifier through a cooler back to the absorber. The mixture of water vapor and H2S passes through a condenser to remove water vapor. The concentrated acid gas stream is processed in a Claus plant to produce elemental sulfur or in a sulfuric acid converter. A single-stage vacuum carbonate process removes about 90 percent of the H2S, whereas a double-stage vacuum carbonate process removes about 98 percent of the H2S.74
There are several other H2S removal processes. The Holmes-Stretford process used at a Canadian coke plant consists of a removal system using catalysts, a sulfur recovery and purification system, and a spent liquor reprocessing system (approximately 98 percent H2S removal).74
The Takahax process (used by some Japanese coke plants and previously used by the LTV coke plant in Chicago, Illinois) also uses a catalyst to remove the hydrogen sulfide. However, the process can be designed to produce either sulfuric acid or sulfur. The H2S removal efficiency is 90 to 99 percent.76
The DESULF process is the most common desulfurization process in Europe. It also uses ammonia scrubbing to remove H2S and ammonia from the coke oven gas. The coke oven gas is contacted counter-currently by the liquor in three absorptive towers operated in series where the liquor’s ammonia content decreases in the direction of the gas flow. Fresh water is used in the third tower, the liquor for the third tower is pumped to the second tower, and the liquor is then pumped from the second tower to the first tower. The first absorptive tower removes the bulk of the H2S, and the loaded ammonia liquor is treated in a deacidifier. The top vapors from the deacidifier partly condense, and the remaining sour gas containing the H2S is treated in a sulfur recovery plant. The H2S removal efficiency is about 98 percent.74
Information was obtained from the historical operating experience of two coke plants to estimate the overall emission reduction that might be achieved by desulfurization. Shenango’s desulfurization unit operated 94.4 percent of the time in 2002 and 92 percent of the time in 2004. The overall SO2 reduction was 91 percent for 2002 and 84 percent for 2004 (based on the control efficiency and down time). The U.S. Steel Clairton Works achieved overall control efficiencies
Evaluation of PM2.5 Emissions and Controls at Two Michigan Steel Mills and a Coke Oven Battery
41
of 94 percent to well over 95 percent for 2002 through 2004. Based on these results, a desulfurization unit should be able to achieve a reduction efficiency of at least 90 percent over the long term.77
6.2 Flue Gas Desulfurization 71, 78 Sulfur dioxide may be generated both from the sulfur compounds in raw materials and
from sulfur in fuel. The sulfur content of raw materials and fuels varies from plant to plant and with geographic location. The main SO2-emitting processes at the facilities being evaluated are (1) coke underfiring and (2) boilers and process heaters firing either coke oven gas or blast furnace gas. As discussed previously, desulfurization of the low volume of fuel gas (COG) before combustion is more practical that treating the larger volume of flue gas after combustion. However, flue gas desulfurization is a demonstrated control option for other fuels and processes. The three control technologies identified for removing SO2 from the flue gas are described below.
Advanced flue gas desulfurization accomplishes SO2 removal in a single absorber that prequenches the flue gas, absorbs the SO2, and oxidizes the resulting calcium sulfite to wallboard-grade gypsum.
Incoming flue gas is cooled and humidified before passing to the absorber, where two tiers of fountain-like sprays distribute reagent slurry over a packed polymer grid. The gas then enters a large gas/liquid disengagement zone and exits through a horizontal mist eliminator. As the flue gas contacts the slurry, the sulfur dioxide is absorbed, neutralized, and partially oxidized to calcium sulfite and calcium sulfate.
After contacting the flue gas, slurry falls into the slurry reservoir where any unreacted acids are neutralized by limestone. A slurry stream is drawn from the tank, dewatered, and washed to remove chlorides. The resultant wallboard-quality gypsum cake contains less than 10 percent water and 20 ppm chlorides. Water evaporates, and dissolved solids are collected along with PM for disposal or sale.
Wet flue gas desulfurization (wet FGD) is a wet scrubbing process used to control SO2. Caustic scrubbing using lime produces a liquid waste, and minimal equipment is needed. Additional equipment is needed for preparing the lime slurry and collecting and concentrating the resultant sludge. Calcium sulfite sludge is watery and it is typically stabilized with PM for land filling.
The normal SO2 control efficiency range for wet flue gas desulfurization is 80 to 90 percent for low-efficiency scrubbers and 90 to 99 percent for high-efficiency scrubbers. Wet scrubbers have been used successfully in the utility industry for control of SO2 from boilers, however they may require more care when used for an iron and steel plant, due to the likelihood of additional contaminants in the fuel source. Calcium sulfate scaling and cementitious buildup when a wet scrubber is used for acid gas control are potential problems when high particulate loadings are found in the gas stream. Many of these problems can be avoided if these systems are installed downstream of a high efficiency particulate control device (e.g., fabric filter). Failure of the particulate control device can pose difficult problems for a downstream wet scrubber.
Dry flue gas desulfurization (dry FGD) involves spray dryer absorption (SDA) systems which spray lime slurry into an absorption tower where SO2 is absorbed, forming CaSO3/CaSO4.
Evaluation of PM2.5 Emissions and Controls at Two Michigan Steel Mills and a Coke Oven Battery
42
The water evaporates before the droplets reach the bottom of the tower, and the dry solids are carried out with the gas and collected with a fabric filter or ESP.
As with other types of dry scrubbing systems (such as lime/limestone injection) exhaust gases that exit at or near the adiabatic saturation temperature can create problems with this control technology by causing the baghouse filter cake to become saturated with moisture and plug both the filters and the dust removal system. In addition, the lime slurry would not dry properly and it would plug up the dust collection system. Therefore, dry FGD may not be feasible if exit gas temperatures are not substantially above the adiabatic saturation temperature. This should not pose a problem at iron and steel plants, and if necessary a reheater can be applied to the stream to raise the temperature above the adiabatic saturation level.
6.3 NOx Emission Control Options 34, 71, 78 As with most fuel-fired NOx sources, there are two broad categories of NOx reduction
techniques: (1) process controls, including combustion modifications, that rely on reducing or inhibiting the formation of NOx in the production process and (2) post-combustion (secondary) controls, where flue gases are treated to remove NOx that has already been formed. For iron and steel plants, six different control technologies or control technology combinations were identified for NOx emissions from fuel-fired emission units at iron and steel plants. These technologies, which provide both combustion or post-combustion controls (or a combination of both), are described below.
Flue gas recirculation (FGR) uses flue gas as an inert material to reduce flame temperatures. In a typical FGR system, flue gas is collected from the heater or stack and returned to the burner via a duct and blower. The flue gas is mixed with the combustion air and introduced into the burner. The addition of flue gas reduces the oxygen content of the combustion air, which in turn reduces flame temperatures, resulting in lower NOx emissions. Typical NOx control efficiency for FGR ranges from 30 percent to 50 percent, or 50 to 72 percent when coupled with low-NOx burners.
Low-NOx burner (LNB) technology uses advanced burner design to reduce NOx formation through the restriction of oxygen, flame temperature, and/or residence time. LNB is a staged combustion process that is designed to split fuel combustion into two zones: primary combustion and secondary combustion.
Two general types of LNBs exist: staged fuel and staged air. Staged fuel LNBs separate the combustion zone into two regions. In the first region, combustion takes place in the presence of a large excess of oxygen at substantially lower temperatures than a standard burner. In the second region, the remaining fuel is injected and combusted with any oxygen left over from the primary region. The remaining fuel is introduced in the second stage outside of the primary combustion zone so that the fuel and oxygen are mixed diffusively (rather than turbulently) which maximizes the reducing conditions. LNBs inhibit the formation of thermal NOx, but have little effect on fuel NOx. Therefore, staged fuel LNBs are particularly well suited for coal- and natural gas-fired emissions units that are higher in thermal NOx. The estimated NOx control efficiency for LNBs in high-temperature applications is 25 percent. However, when coupled with FGR or selective non-catalytic reduction (SNCR), these efficiencies increase to 50 to 72 and 50 to 89 percent, respectively.
Evaluation of PM2.5 Emissions and Controls at Two Michigan Steel Mills and a Coke Oven Battery
43
Ultra low-NOx burners (ULNB) combine the benefits of flue gas recirculation and low-NOx burner control technologies. Rather than a system of fans and blowers (like FGR), the burner itself is designed to recirculate hot flue gas from the flame or firebox back into the combustion zone. This leads to a reduction in the average oxygen concentration in the flame without reducing the flame temperature below that necessary for optimal combustion efficiency. Because of this reduction in temperature, ULNB would likely only be applicable to processes at iron and steel plants that are not temperature dependent, unless the reduction in flame temperature does not fall below the required threshold temperature for the process. The estimated NOx control efficiency for ULNBs in high-temperature applications is 50 percent. Newer designs have yielded efficiencies between 75 to 85 percent. When coupled with selective catalytic reduction, efficiencies from 85 to 97 percent can be obtained.
In the selective non-catalytic reduction (SNCR) process, urea or ammonia-based chemicals are injected into the flue gas stream to convert NO to N2 and water. Without the participation of a catalyst, the reaction requires a high temperature range to obtain activation energy. The reaction with urea is as follows:
2NO + CO(NH2)2 + 1/2 O2 → 2N2 + CO2 + 2 H2O
The optimum operating temperature for SNCR is 1,600°F to 2,100°F. Under these temperature conditions, a significant reduction in NOx occurs. At temperatures above 2,000°F, an alternative reaction occurs and NOx control efficiency decreases rapidly. The normal NOx control efficiency range for SNCR is 50 to 70 percent. To date there are no known installations of SNCR at iron and steel plants. While there are not any known installations, SNCR could be used for some operations within an iron and steel plant.
6.4 Control of Casthouse Emissions As described earlier in Section 3, suppression techniques and capture hoods vented to
baghouses are used to control emissions during blast furnace tapping. Based on an EPA survey conducted in the late 1990s, approximately 10 of the 20 integrated iron and steel plants controlled emissions from at least one blast furnace casthouse using capture hoods and a baghouse.3 The other plants rely primarily on flame suppression and covered runners. In Canada, two of four integrated mills use hoods and baghouses.74 In the United Kingdom, eight of nine casthouses are tightly controlled using local hoods over tapholes, troughs, and runners, with the exhaust going to baghouses.79 The European Commission identified the best available technique for casthouse emissions as evacuation of the emission points to a baghouse or ESP. 80 In Japan, casthouse emissions are captured and sent to a baghouse. In addition, emissions from raw material storage and transfer are sent to either a baghouse or wet scrubber.75
USSGLW has capture systems and baghouses for all three blast furnaces. Severstal intends to install a dedicated capture system and baghouse for one casthouse and plans to either install a similar system on the other casthouse or to shut down the blast furnace.
6.5 Fugitive Emissions from BOF Charging and Tapping An EPA survey in the late 1990s indicated that eight BOF shops out of 20 in the United
States had capture systems for BOF charging and tapping, and most exhausted to baghouses (one exhausted to a wet scrubber). 3 Two of four Canadian integrated mills capture charging and
Evaluation of PM2.5 Emissions and Controls at Two Michigan Steel Mills and a Coke Oven Battery
44
tapping emissions, one exhausting to a baghouse and one to a scrubber.74 All of the BOF shops in the United Kingdom capture emissions from charging and tapping; they are exhausted to baghouses, scrubbers, or ESPs.79 In Japan, the emissions are captured and sent to baghouses, and in some cases, the building exhaust is controlled by roof-mounted ESPs.75 The European Commission defined their best available technique as efficient capture and evacuation to a baghouse or ESP. They state that a capture efficiency of 90 percent can be achieved.80
Severstal uses a local hood and the ESP on the BOF for capture of charging emissions and the BOF’s open hood and ESP for tapping emissions. The planned installation of capture hoods and a baghouse for charging and tapping at Severstal’s BOF will result in improved capture control of charging and tapping emissions.
6.6 ESP Upgrade The BOF primary emissions at both plants are controlled by ESPs. However, the ESP
stack is still a major contributor to emissions of PM2.5-FIL and condensibles. It may be possible to improve emission control by upgrading the ESP or by careful monitoring and maintenance to ensure that the ESP operates consistently over time. Table 6-3 summarizes the available test data for the two ESPs.14–18
Table 6-3. PM Test Results for BOF ESPs
Severstal’s ESP tests 14–16 USS ESP tests 17, 18
Date Run PM (lb/hr) Date Run PM (lb/hr) May-85 1 57.6 Dec-96 Average 67.7
Dec-89 1 41.6 Average 58.8 2 47.1 Dec-04 1 23.3 3 38.4 2 18.6 Average 42.4 3 33.1
Apr-98 1 36.5 Average 25.0 2 67.3 3 40.2 Average 48
Oct-98 1 26.9 2 31.3 3 64.4 Average 40.9
Jun-00 1 35.1 2 25.6 3 31.5 Average 30.8
Evaluation of PM2.5 Emissions and Controls at Two Michigan Steel Mills and a Coke Oven Battery
45
The most recent test data show the best levels of performance, which suggests that improvements have been made at both plants over time. However, even the most recent tests show a two-fold variability from run to run and suggest that control might be improved by reducing variability and identifying the reasons for high values for individual runs. In its survey response, U.S. Steel indicated that it had projects underway to improve the performance of its ESP during the oxygen blow to reduce opacity from the stack. Severstal reported that it planned additional repairs to the BOF exhaust spark box and downcomer to reduce leaks in the system to the ESP.
ESP upgrades may include increasing the size of the precipitator (i.e., adding an additional collection cell, either in series or in parallel). Increasing the size of the precipitator increases treatment time: the longer a particle spends in the precipitator, the greater its chance of being collected, other things being equal. Precipitator size also is related to the specific collection area (SCA), the ratio of the surface area of the collection electrodes to the gas flow. Higher collection areas tend to lead to better removal efficiencies. Modern ESPs in the United States have collection areas in the range of 200 to 800 square feet (ft²) per 1000 acfm. To achieve collection efficiencies of 99.5 percent, specific collection areas of 350 to 400 ft²/1000 acfm are typically used. Some older precipitators on utility boilers are small, with specific collection areas below 200 ft²/1000 acfm and correspondingly short treatment times. Expansion of these precipitators, or their replacement with larger precipitators, can lead to greatly enhanced performance. However, space constraints at many plants limit the ability to significantly increase precipitator size.81
Other examples of ESP upgrades include replacement of weighted-wire electrodes with rigid discharge electrodes and addition of advanced electronic controls, including pulsed energization. The corona discharge electrodes in ESPs have traditionally been weighted wires hung between the collecting plates. The problem with weighted wires is that the wire can snap, causing the discharge wire to short into the grounded collecting plate. Many ESP users and rebuilders have avoided this problem by going to rigid (non-wire) discharge electrodes. These electrodes avoid the shorting problem that can occur with weighted-wire electrodes. Another potential upgrade for ESPs is the conversion of antiquated electrical controls to modern electronic controls, including the possibility of pulsed energization. Traditionally, the amount of particulate charging that can be achieved by an ESP is limited, due to the problems of sparking and back-corona that occur, particularly with high resistivity fly ash. Modern computerized controls can reduce these problems; one technique is to substitute the steady voltage of traditional ESPs with voltage pulses (pulsed energization). Pulsed energization allows for higher voltages (improved particle charging) while minimizing the problems of back-corona and sparking.82
Gulf States Steel provides an example of an ESP upgrade. This plant had an open hood BOF (as do the two Michigan steel plants) with a 550,000 acfm primary gas cleaning system. Extensive developments were carried out to improve the effectiveness of the system. Air atomized spray nozzles were used to replace direct pressure nozzles in the spray chamber. The improved atomization reduced moisture and dust build-up in the off-gas ducting as well as the ESP and dust handling system. These nozzles also improved the moisture content of the off-gas, lowering the dust resistivity and improving collection efficiency. However, during low temperature periods of the blowing cycle, the desired cleaning efficiency was not being
Evaluation of PM2.5 Emissions and Controls at Two Michigan Steel Mills and a Coke Oven Battery
46
achieved. Therefore, the plant decided to install a new precipitator system in parallel with the existing units.83
To determine the additional collection plate area, the precipitator performance was predicted during the entire blowing system for the existing system and for 50 percent and 100 percent expansion. Based on stack opacity, the 100 percent expansion was required to provide acceptable stack opacity levels (10 percent) throughout the oxygen blowing cycle. The expanded system increased the specific collection area from 285 to 560 ft2/1,000 acfm. The expanded system increased the collection efficiency from 99 to 99.93 percent, and the outlet particulate concentration was reduced from 0.059 to 0.004 gr/acf (0.14 to 0.01 gr/dscf).83
6.7 Upgraded Controls for Miscellaneous Operations Both of the Michigan steel mills and most U.S. steel mills capture and control emissions
from hot metal transfer, desulfurization, slag skimming. and ladle metallurgy. All use baghouses for these processes. Options for improved control include increasing the capture efficiency and improving the performance of the baghouse. These potential improvements would need to be evaluated on a site-specific basis by observing the capture of emissions and determining if the hooding can be improved. Emission tests would provide insight into the performance of a baghouse. Baghouses on similar operations at minimills using electric arc furnaces easily achieve 0.0052 gr/dscf, and many achieve less than 0.002 gr/dscf. Consequently, test results showing emissions of 0.01 gr/dscf indicate that the baghouse control efficiency might be improved by 50 percent, either by decreasing the air-to-cloth ratio, using a better fabric material (e.g., membrane-coated fabric), changing out bags more frequently, or other operational changes.
U.S. Steel reported in its survey response that it had several projects underway to improve capture and control systems. It is working to improve the capture of fugitive emissions from charging and tapping in the BOF shop and to enlarge the baghouse. It also plans to improve the capture of fugitive emissions from hot metal transfer and desulfurization and to enlarge that baghouse. These projects will result in lower emissions and lower opacity at the BOF shop roof monitor.
The potential for improving capture and control must be evaluated on a site-specific basis. For example, the hot metal transfer baghouse at Ispat-Inland’s (now Mittal Steel) No. 2 BOF shop was upgraded in June 1994 to optimize the existing equipment. The 400,000 acfm negative pressure shaker baghouse operated at excessively high pressure drop, reducing system flow capacity and causing dust to bleed through the bags. As part of the overall secondary emission control system upgrade, a baghouse appraisal study was completed to help define the problems. The investigation indicated that the absence of hopper air lock valves and leaks in the screw conveyor dust disposal system caused dust re-entrainment, which prevented regular dust disposal and resulted in a slow, steady rise in bag pressure drop, even with proper cleaning. The primary cause of bag failure was identified as abrasion resulting from undertensioning of the bags in their attachment to the shaker mechanism. The strap bag attachment induced the bags to fold during shaking, which restricted dust removal. Ingress of moisture through poorly sealing access doors allowed bags to get wet, resulting in crust formation on the bags. A high degree of shaker maintenance was attributed to generally poor mechanical design and was aggravated by wear on a knife-edge support at the far ends of the shaker logs. In addition to mechanical problems, the original hard-wired relay control system was found to be unreliable and too difficult to maintain.3
Evaluation of PM2.5 Emissions and Controls at Two Michigan Steel Mills and a Coke Oven Battery
47
A new bag design, complete with a spring-tensioned attachment and top and bottom sewn rings, was installed in a test compartment and operated for several weeks. The new bag design was subsequently installed in all 18 compartments. A new screw conveyor system was installed using a rotary air lock at each compartment hopper to eliminate re-entrainment of dust through the hopper discharge conveyors. Other modifications included replacement of all compartment doors with a new design that provided better sealing, replacement of butterfly outlet dampers with poppet dampers on all compartments, and a new computerized baghouse control system. Baghouse performance was greatly improved as a result of the modifications.3
6.8 Coke Oven Charging and Leaks on Doors, Lids, and Offtakes The emissions inventory indicates that emissions from charging, doors, lids, and offtakes
are not significant contributors to PM2.5 emissions. These emission points are very well controlled and are subject to the 1993 coke oven NESHAP (40 CFR Part 63, Subpart L). There is little room for improvement because of the low seconds of emissions achieved for charging and the low leak rate for other emission points. For example, the results of daily inspections in June 2005 showed a 30-day average of 3.8 seconds of visible emissions per charge, 0.3 percent leaking doors (an average of one leaking door every 2 inspection days), 0.14 percent leaking lids, and 0.12 percent leaking offtakes.84 In addition, there is close monitoring for these emissions because inspections are required every day. A review of the emission control techniques used for these emission points in Canada and the United Kingdom indicate they are the same as those used in the United States: sequential or stage charging and charging “on the main” (using steam aspiration) for charging emissions and work practices to identify and seal leaks for the other emission points.74, 79 No additional control options are proposed for charging, doors, lids, and offtakes.
6.9 Coke Oven Pushing and Quenching Battery 5 currently has a state-of-the art capture and control system for pushing
emissions: a moveable hood vented to a baghouse. The inventory estimates shows that these controlled emissions do not make a significant contribution to PM2.5 emissions. In addition, opacity data for this battery indicates few fugitive emissions escape from the capture system. For example, opacity data for 102 pushes observed between June and December 1999 averaged 1.4 percent opacity, and the highest opacity observed was 13 percent.12 The battery will be subject to the 2003 NESHAP for pushing, quenching, and battery stacks (40 CFR Part 63, Subpart ). This standard will require observing the opacity of four pushes per day and is designed to minimize the frequency of green pushes. With the daily monitoring and other requirements in the NESHAP, there are no obvious additional control options that would have a significant impact on PM2.5 emissions from pushing.
The opacity data for pushing also suggest that emissions from quenching green coke are not a problem at this battery. Quenching emission controls in Canada and the United Kingdom are similar to those in the United States: using baffles in the quench tower and water sprays to periodically clean the baffles.74, 79 In addition, the EES Coke plant is subject to a limit for total dissolved solids (TDS) in the water. The requirements to have baffles installed, requiring inspection and cleaning of baffles, and a TDS limit are also codified in the 2003 coke oven NESHAP. No additional demonstrated and feasible controls were identified for PM2.5 emissions.
Evaluation of PM2.5 Emissions and Controls at Two Michigan Steel Mills and a Coke Oven Battery
48
6.10 Emerging Technologies and Innovative Controls 85 This section describes innovative control systems that may be technologically feasible for
improving control of the primary emissions from the BOF. In general, addition of an innovative control system will be more expensive, but yield higher PM2.5 emission reductions than the methods identified to improve existing control device performance.
Advanced hybrid collector (ESP). The Advanced Hybrid™ filter combines electrostatic precipitation with fabric filtration. The internal geometry contains alternating rows of ESP components (discharge electrodes and perforated collector plates) and filter bags. Particulate-laden flue gas enters the ESP sections, and significant amounts are precipitated on the perforated collection plates. The perforated plates also allow flue gas to be drawn through the plates to be collected on the filter bags. The filter bags have a Gore-Tex® membrane coating and are pulse-cleaned.
COHPAC (ESP). The COHPAC (Compact Hybrid Particulate Collector) is a pulse jet filter module operated at a very high filtration velocity (air-to-cloth ratio), installed downstream of an ESP. The function of a COHPAC is as a “polishing filter,” collecting the particulate (especially fine particulate) that escapes an ESP. A full-scale COHPAC system has been installed at the Gaston power plant near Birmingham, Alabama.
Indigo particle agglomerator (ESP). The Indigo Agglomerator was developed in Australia to reduce visible emissions from coal-fired boilers. The Indigo Agglomerator contains two sections, a bipolar charger followed by a mixing section. The bipolar charger has alternate passages with positive or negative charging. That is, the even passages may be positive and the odd passages negative, or vice versa. This can be contrasted with a conventional coal-fired boiler precipitator, which has only negative charging electrodes. Following the charging sections, a mixing process takes place, where the negatively charged particles from a negative passage are mixed with the positively charged particles from a positive passage. The close proximity of particles with opposite charges causes them to electrostatically attach to each other. These agglomerates enter the precipitator, where they are easily collected due to their larger size.
Wet ESPs. One significant barrier to improved ESP performance is that increasing energy levels can lead to excessive sparking and back-corona. This is particularly problematic with high-resistivity particles, as occurs with low-sulfur coals. Another problem with ESPs is that operating at lower temperatures, which can improve collection of condensable particulate matter, can result in condensation on the ESP collection plates, causing corrosion. One method of avoiding these problems is a wet ESP, which bathes the collection plates in liquid. The lower operating temperature should improve the collection of condensibles.
Wet membrane ESP. The wet membrane ESP attempts to avoid problems of water channeling and resulting dry spots that can occur with wet ESPs, and to avoid the higher-cost metals that must be employed to avoid corrosion in a traditional wet ESP. The membranes are made from materials that transport flushing liquid by capillary action, effectively removing collected material without spraying.
6.11 Improved or Increased Monitoring Improved or increased monitoring can reduce emissions if corrective actions are
implemented quickly when the monitors indicate the potential for increased emissions. In general, the processes and control equipment at these plants are or will be subject to many
Evaluation of PM2.5 Emissions and Controls at Two Michigan Steel Mills and a Coke Oven Battery
49
monitoring requirements, including those in current permits coupled with the NESHAPs that are in place and those that will soon become effective. For example, the permit requires that the operating parameters associated with the BOF ESPs at both plants be monitored. The NESHAP for steel mills will require monitoring the ESP by a COM, and any sudden increase in PM concentration can be identified by an increase in opacity from the COM. The NESHAP will also require bag leak detectors and corrective actions if the detector’s alarm sounds. Capture systems must be monitored to ensure that the proper damper settings are used and that there is adequate ventilation. For these operations, there is adequate monitoring. However, it is important that corrective actions be taken promptly for the monitoring to be effective at reducing emissions.
A similar situation exists for the coke plants and the two NESHAPs that apply. Doors, lids, offtakes, and charging must be inspected every day according to EPA Method 303. Inspections for these emission points are very important because they identify leaks, and when leaks are seen, they can be promptly repaired. The other NESHAP requires a COM for the battery stack. This is a critical monitoring device in this application because when a spike in opacity occurs, the most recently charged oven should be identified. When that oven is pushed, its oven walls should be inspected for cracks, and any cracks should be repaired. High opacity may also be an indication of combustion problems. The 2003 coke oven NESHAP requires the observation of opacity for four pushes every day. This procedure is necessary to identify green pushes, which cause excess pushing emissions because they overwhelm the capture system. If a green push is observed, operating procedures should be used to determine the cause and prevent future green pushes (e.g., plugged burner or flue, combustion problems). Parameters on the pushing emission control system must also be monitored to ensure that the evacuation system and baghouse are operating properly on a continuous basis.
Additional monitoring with daily opacity observations for the blast furnace casthouses and BOF shops could be valuable for reducing emissions. These operations are sources of fugitive emissions, and PM emissions can be significant as shown in the emissions inventories. When high opacities are seen at the roof monitor, the event should be investigated to determine the cause and to implement corrective actions.
6.12 Exhaust Gas Cooling 85 In general, particulate control systems are ineffective at removing gaseous-phase
components of the gas stream. Exhaust gas temperature is the primary factor influencing the state of PM-CON from stationary sources. Reducing the temperature of the exhaust gas prior to the PM control device increases the amount of condensible PM that is in particulate form within the control device. That is, at lower temperatures, the ratio of PM2.5-FIL to PM-CON increases, and the overall PM2.5 removal efficiency of the control system goes up since the control systems can now effectively reduce the condensed PM. The temperature of the exhaust gases can be reduced through the use of heat recovery or other gas cooling technologies.
6.13 Storage Piles and Roads Fugitive emissions occur from wind-blown dust, storage piles, raw material transfer, and
paved and unpaved surfaces. Estimates of these emissions have been included in the inventory and are based on a 1993 submittal by the companies and the emission control practices in place. Control measures include watering, chemical stabilization, reducing surface wind speed with windbreaks or source enclosures, clean up of spillage, vehicle restrictions (limiting speed,
Evaluation of PM2.5 Emissions and Controls at Two Michigan Steel Mills and a Coke Oven Battery
50
weight, number of vehicles), and surface improvements such as paving or adding gravel or slag to a dirt road. The steel plants have detailed control requirements for these fugitive emissions in their operating permits. For example, storage piles, open areas, and unpaved roads at Severstal must be treated with a chemical suppressant at least once per month from March through October. There are also provisions for wet sweeping of paved areas and street flushing. U.S. Steel has similar detailed requirements for vacuum sweeping, use of dust suppressants, and loading/unloading at storage piles. No additional control measures have been identified in this study. However, increased monitoring of fugitive emissions might be useful in providing additional control if control measures are applied when dusty conditions are observed (in addition to the regularly scheduled controls required by the permit).
6.14 Mercury The EPA’s recent information gathering for the area source standard for electric arc
furnaces indicates that mercury is emitted when melting scrap contaminated with mercury.69 The primary contributor to mercury in scrap is from convenience light switches in end-of-life vehicles. Many states have programs that require or encourage the removal of mercury switches before the automobiles are dismantled, crushed, shredded, and melted in steel mill furnaces. This pollution prevention approach has been shown by several states to be cost-effective, and studies in New Jersey and Ohio indicate a reduction of 50 percent or more can be achieved. A control option for mercury would require the plants to purchase scrap only from suppliers that know the mercury switches have been removed, or to discontinue the use scrap from end-of-life vehicles. For example, Severstal plans to limit their use of shredded (fragmented) automobile scrap to 2 percent of the total scrap, and their scrap management plan commits the company to purchase scrap from suppliers who reduce or eliminate mercury switches from their scrap.
Data submitted by the companies show that mercury has been detected in the APCD dust collected from different processes (blast furnace, BOF ESP, desulfurization, BOF charging and tapping). The presence of mercury indicates the PM control devices provide co-control of particulate mercury. There are also add-on controls for vapor phase mercury emissions that have been applied to other industrial processes (such as injection of powdered activated carbon). However, there are insufficient data to assess their cost or feasibility. There are no mercury emission test data for these plants, and information on mercury loading, mercury concentrations, and speciation (particulate vs. vapor phase) is needed to assess feasibility and cost.
The limited test data show no detectable levels of mercury emissions from the combustion of coke oven gas at by-product recovery coke plants. A European study found that most of the mercury distilled from the coal during coking was captured in the by-product recovery process and was removed with the tar.70
Evaluation of PM2.5 Emissions and Controls at Two Michigan Steel Mills and a Coke Oven Battery
51
7.0 References
1. Michigan Department of Environmental Quality Air Quality Division. Renewable Operating Permit Staff Report. Severstal North America, Inc. Permit Number 19970004. October 18, 2004.
2. Michigan Department Of Environmental Quality Air Quality Division. Renewable Operating Permit Staff Report. United States Steel Corporation, Great Lakes Works. Permit Number 199600132. June 23, 2004.
3. U.S. Environmental Protection Agency. National Emission Standards for Hazardous Air Pollutants (NESHAP) for Integrated Iron and Steel Plants– Background Information for Proposed Standards. EPA-453/R-01-005. January 2001.
4. Preamble for the Integrated Iron and Steel NESHAP. Federal Register. Vol. 68, No. 97. May 20, 2003.
5. United States Steel. The Making, Shaping, and Treating of Steel. Published by the Association of Iron and Steel Engineers (AISE). Available from AISE at Suite 2350, Three Gateway Center, Pittsburgh, PA.
6. U.S. Department of Energy. Steel Industry Technology Roadmap Chapter 4: Environmental Leadership. December 2001.
7. State Of Michigan Renewable Operating Permit. Severstal North America, Inc. Permit Number 19970004. October 18, 2004.
8. State Of Michigan Renewable Operating Permit. United States Steel Corporation, Great Lakes Works. Permit Number 199600132. March 1, 2005.
9. Jablin, R., D. Coy, et al. Pollution Effects of Abnormal Operations in Iron and Steel Making - Volume III. Blast Furnace Ironmaking Manual of Practice. EPA-600/2-78-118c. June 1978. 93 pp.
10. U. S. Environmental Protection Agency. Revised Standards for Basic Oxygen Process Furnaces -- Background Information for Proposed Standards. EPA-450/3-82-005a.. December 1982.
11. Jablin, R., D. Coy, et al. Pollution Effects of Abnormal Operations in Iron and Steel Making - Volume VI. Basic Oxygen Process, Manual of Practice. EPA-600/2-78-118f. June 1978.
Evaluation of PM2.5 Emissions and Controls at Two Michigan Steel Mills and a Coke Oven Battery
52
12. U.S. Environmental Protection Agency. National Emission Standards for Hazardous Air Pollutants (NESHAP) for Coke Ovens: Pushing, Quenching, and Battery Stacks– Background Information for Proposed Standards. EPA-453/R-01-006. February 2001.
13. Memorandum with attachments, S. Burns, RTI, to the docket, enclosing data compiled from EPA Section 114 survey responses, July 1998. Docket Item II-I-45 in Docket Number A-2000-34.
14. TolTest, Inc. Emissions Evaluation Particulate Matter, Particulate Matter Less Than 10 Microns in Diameter, and Carbon Monoxide Emission Rates. Basic Oxygen Furnace. Rouge Steel Company. November 27, 1998.
15. TolTest, Inc. Particulate Emissions Study - Basic Oxygen Furnace. Rouge Steel Company. June 1998.
16. NTH Consultants. Emission Test Results for Particulate Matter from the Basic Oxygen Furnace ESP at Rouge Steel Company. July 10, 2000.
17. NTH Consultants. Emission Test Results for the Determination of Particulate Matter and Visible Emissions from the No.2 BOP ESP at U.S. Steel Corporation Great Lakes Works. January 2005.
18. NTH Consultants. Emission Test Results for the Determination of Particulate Matter and Visible Emissions from the No.2 BOP ESP at National Steel Company Great Lakes Operations. November 2002.
19. Michigan DEQ/AQD. Activity Report: Scheduled Investigation, December 8, 2004.
20. Michigan DEQ Office of the Director, Stipulation for Entry of Final Order by Consent, February 2005.
21. James T. Volanski, U.S. Steel Great Lakes Works, Letter to Teresa Seidel, MI DEQ/AQD, January 31, 2005.
22. James T. Volanski, U.S. Steel Great Lakes Works, Letter with attachments, to Amy Vasu, USEPA OAQPS/AQSSD/IPSG, Re: Response to Survey Questionnaire, November 8, 2005.
23. Jill E. Gerne, U.S. Steel Great Lakes Works, Letter to Bernardo Sia, MI DEQ/AQD, June 24, 2005.
24. Michigan DEQ/AQD. Staff Activity Report for Severstal. SRN#A8640. February 22, 2005.
Evaluation of PM2.5 Emissions and Controls at Two Michigan Steel Mills and a Coke Oven Battery
53
25. D.S. Windeler, Severstal North America, Inc., Letter with attachments to Amy Vasu, USEPA OAQPS/AQSSD/IPSG, Re: Response to survey questionnaire, November 8, 2005.
26. Michigan DEQ/AQD. Renewable Operating Permit for Severstal NA. October 18, 2004.
27. Michigan DEQ/AQD. Public Participation Documents for Severstal North America Inc., Permit Application Number 182-05, November 14, 2005.
28. Michigan DEQ/AQD, Staff Activity Report, December 13, 2004.
29. Yogendra, K. 2005. “Response to Survey Questionnaire.” E-mail message from Kumar Yogendra, EES Coke, to Amy Vasu, U.S. EPA OAQPS/AQSSD/IPSG. November.
30. Research Triangle Institute. Method 303 Inspections of By-Product Coke Oven Batteries – Compliance with the NESHAP. September 1999.
31. U.S. Environmental Protection Agency. Emission Factor Documentation for AP-42 Section 12.2: Coke Production. Available at http://www.epa.gov/ttn/chief/ap42/index.html. Revised draft version as of July 2001.
32. U. S. Environmental Protection Agency. Compilation of Air Pollution Emission Factors. Publication AP-42. Section 12.5 Iron and Steel Production. July 1995.
33. Michigan Department of Environmental Quality. MAERS Support Resources. Accessed December 6, 2005, at http://www.michigan.gov/deq/0,1607,7-135-3310_4103_4193-16709--,00.html. 2005.
34. U.S. Environmental Protection Agency. Alternative Control Techniques Document – NOx Emissions From Iron and Steel Mills. EPA-453/R-94-065. September 1994.
35. Emissions Inventory for U.S. Steel’s Clairton Works (Coke Plant) and Edgar Thomson Works (Steel Mill). Provided in September 2005 by the Bureau of Air Pollution Control, Allegheny County Health Department, Pittsburgh, PA.
36. Braun Intertec. Metals and Particulate Emission Study #2 BOP ESP and #2 Baghouse. March 1997.
37. NTH Consultants. Emission Test Results for Nitrogen Oxides and Total Particulate on the B2 Blast Furnace Stove Stack at U.S. Steel Corporation Great Lakes Works. November 2003.
38. NTH Consultants. Particulate Emissions Testing Results from the #2 BOP No. 1 Baghouse at U.S. Steel Corporation Great Lakes Works. January 2005.
Evaluation of PM2.5 Emissions and Controls at Two Michigan Steel Mills and a Coke Oven Battery
54
39. NTH Consultants. Emission Test Results for Total Particulate on the D Furnace Baghouse at U.S. Steel Corporation Great Lakes Works. July 2003.
40. NTH Consultants. Emission Test Results from the No.2 BOP No. 1 Baghouse at National Steel Company Great Lakes Operations. November 2002.
41. NTH Consultants. Emission Test Results for No. 5 Coke Battery Combustion Stack Exhaust Located at U.S. Steel Corp. October 15, 2005.
42. NTH Consultants. Particulate Emissions Testing on the Pushing Emissions Control Stack. October 15, 2005.
43. NTH Consultants. Emission Test Results for No. 5 Coke Battery Combustion Stack Exhaust. June 23, 2003.
44. NTH Consultants. Emission Test Results for No. 5 Coke Battery Combustion Stack Exhaust. September 10, 2002.
45. NTH Consultants. Emission Test Results for No. 5 Coke Battery Combustion Stack Exhaust. April 13, 2001.
46. NTH Consultants. Particulate Emissions Testing on the Pushing Emissions Control Stack. October 23, 2002.
47. NTH Consultants. Particulate Emissions Testing on the Pushing Emissions Control Stack. June 4, 2003.
48. Swanson Environmental. Emissions Testing – Lean Gas. National Steel’s No. 5 Coke Battery Combustion Exhaust. August 9, 1996.
49. Karl, U. and O. Rentz. Particulate Matter Emissions from Industrial Sources (with the Iron and Steel Industry as an Example). French-German Institute for Environmental Research. November 2000.
50. U.S. Environmental Protection Agency. Electric Arc Furnaces and Argon-Decarburization Vessels in the Steel Industry – Background Information for Proposed Revisions to the Standard. EPA-450/3-82-020a. July 1983.
51. U.S. Environmental Protection Agency. Emissions Testing of Combustion Stack and Pushing Operations at Coke Battery No. 2 at Bethlehem Steel Corporation’s Burns Harbor Division in Chesterton, Indiana. EPA-454/R-99-001a. February 1999.
52. U.S. Environmental Protection Agency. Emissions Testing of Combustion Stack and Pushing Operations at Coke Battery No. 5/6 at ABC Coke in Birmingham, Alabama. EPA-454/R-99-002a. February 1999.
Evaluation of PM2.5 Emissions and Controls at Two Michigan Steel Mills and a Coke Oven Battery
55
53 Mourad, F. 2006. “H2S data for the EES Coke battery.” E-mail message from F. Mourad, DTE Energy, to Amy Vasu, U.S. EPA. January.
54. U. S. Environmental Protection Agency. Compilation of Air Pollution Emission Factors. Publication AP-42. Section 1.4 Natural Gas Production. July 1998.
55. Russell, D. Test Report: Rouge Steel Company PM10 Evaluations – Three Source Consent Decree Requirement. December 1989.
56. Russell, D. Test Report: Rouge Steel Company PM10 Evaluations – Three Source Consent Decree Requirement. December 1989.
57. Russell, D. Test Report: Rouge Steel Company PM10 Evaluations – Six Source Consent Decree Requirement. June 1985.
58. Envisage Environmental, Inc. BOF ESP Particulate Emission Evaluation – LTV Steel, Cleveland, OH. October 1989.
59. Envisage Environmental, Inc. BOF ESP Particulate Emission Evaluation – LTV Steel, Cleveland, OH. November 1986.
60. Envisage Environmental, Inc. BOF ESP Particulate Emission Evaluation – WCI Steel, Warren, OH. May 1990.
61. Mostardi-Platt Associates. BOF Precipitator Performance Test Program – LTV Steel, East Chicago, IN. August 1992.
62. Envisage Environmental, Inc. BOF ESP Particulate Emission Evaluation – LTV Steel, Cleveland, OH. November 1985.
63. Envisage Environmental, Inc. LMF Baghouse Particulate Emission Evaluation – LTV Steel, Cleveland, OH. April 21, 1993.
64. State of Utah, Department of Environmental Quality, Division of Air Quality. Geneva Steel – Latest Emissions Test Data, Title V Permit Application, and Emission Limits. March 27, 1998.
Evaluation of PM2.5 Emissions and Controls at Two Michigan Steel Mills and a Coke Oven Battery
56
65. Bloom, B. and J. Jeffrey. Review of Coke Plant Quench Tower Particulate Emission Rates. Draft EPA publication. 1982.
66. NTH Consultants. Stack Testing at the National Steel Facility for Condensible Particulate Matter. October 31, 2002.
67. Calspan Corporation. Assessment of Industrial Hazardous Waste Practices in the Metal Smelting and Refining Industry. Vol III. Ferrous Smelting and Refining. OSW Report SWR-2. 1977.
68. Mercury Agreement Reduction Program. Final Report. Study Sponsored by U.S. EPA, Indiana Department of Environmental Management, Lake Michigan Forum, International Steel Group, Ispat Inland, and U.S. Steel. January 2004.
69. U.S. EPA/OAQPS/Metals Group. Test data on mercury emissions collected from EAF survey and other sources for the EAF Area Source Standard. 2005.
70. Fisher, R. Progress in Pollution Abatement in European Cokemaking Industry. Ironmaking and Steelmaking. vol. 19, no. 6., 1992. Pages 449-456.
71. Midwest Regional Planning Organization (RPO). Iron and Steel Mills Best Available Retrofit Technology (BART) Engineering Analysis. Prepared for The Lake Michigan Air Directors Consortium (LADCO). March 30, 2005.
72. Panczak, K. 2006. “Comments on the draft still mill report.” E-mail message from K. Panczak, DTE Energy, to Amy Vasu, U.S. EPA. January.
73. Earl, J. 2006. “Comments on the draft steel mill report.” E-mail message from James Earl, Severstal North America, to Amy Vasu, U.S. EPA. January.
74. Charles E. Napier Co. Multi-pollutant Emission Reduction Analysis Foundation for the Iron and Steel Sector. Prepared for Environment Canada. September 2002.
75. European Commission – Institute for Prospective Technological Studies. Integrated Pollution Prevention and Control (IPCC) Reference Document on Best Available Techniques in the Ferrous Metals Processing Industry. October 2000.
76. Hogetsu, A. Air Pollution Control Technology in Steel Industry. Ministry of the Environment, Japan. March 2005.
77. Fischman, G. 2006. “Desulfurization Effectiveness and Availability.” E-mail message from G. Fischman, Allegheny County Health Department, Bureau of Air Pollution Control, to Katherine Panczak, DTE Energy. January.
Evaluation of PM2.5 Emissions and Controls at Two Michigan Steel Mills and a Coke Oven Battery
57
78. Midwest Regional Planning Organization (RPO). Boiler Best Available Retrofit Technology (BART) Engineering Analysis. Prepared for The Lake Michigan Air Directors Consortium (LADCO). March 30, 2005.
79. Passant, N. et al. UK Particulate and Heavy Metal Emissions from Industrial Processes. February 2002.
80. European Commission – Institute for Prospective Technological Studies. Integrated Pollution Prevention and Control (IPCC) Reference Document on the Production of Iron and Steel. December 2001.
81. Institute of Clean Air Companies, 2004. Control Technology Information. Available at http://www.icac.com/controls.html#esp. Accessed September 25, 2005.
82. Southern Company, 2004. Emission Control Systems. Available at http://www.southerncompany.com/gapower/about/pdf/Air%20Quality.pdf. Accessed August 26, 2005.
83. Cesta, T., Optimization of BOPF Air Emission Control Systems. Iron and Steel Engineer, July, 1995, pp. 23-31.
84. Buckler, M. to G. Czerniak. Memorandum Transmitting Method 303 Inspection Results for EES Coke Battery for June 2005. July 7, 2005.
85. Pechan and Research Triangle Institute. Evaluation of Potential PM2.5 Reductions by Improving Performance of Control Devices: Conclusions and Recommendations. Draft Report Prepared for AQSSD/EPA. September 2005.
Appendix A
A-1
Appendix A
Details of the Emission Inventories Submitted by the Companies to DEQ
Appendix A
A-2
[This page intentionally left blank.]
Appendix A
A-3
A.1 Emission Inventories for 2003 and 2004 Michigan DEQ provided emission inventories prepared by the plants, which were
submitted to MAERS. These inventories were reviewed extensively with the goal of using the company’s estimate as a starting point for the development of PM2.5 emission estimates. However, the review indicated that the emission inventories for PM2.5 should be constructed from independent estimates. The inventory estimates are summarized in Tables A-1 through A-6. Some of the observations from the review are noted below:
# The most reliable and consistent estimates are for PM emissions from the BOF stack at both steel plants. This is one of the few emission points for which testing has actually been conducted. The reported emissions are consistent with the emission test results we obtained from DEQ.
# In general, the inventories were fairly complete in that they included the primary emission points. However, neither of the steel plants provided estimates for storage piles and paved and unpaved roads.
# The estimates from Severstal are the most consistent and transparent primarily because most of the estimates were based on MAERS emission factors and throughput, both of which were given in the inventory and provided a means of checking the calculations.
# Severstal’s PM estimates for the blast furnace stoves apply a control efficiency of 90 percent for PM and PM2.5-PRI (filterables plus condensibles). Their estimate is based on an interpretation that 90 percent removal by the blast furnace’s dust catcher and Venturi scrubber should be applied. However, our interpretation is that the blast furnace stoves are uncontrolled for PM (other than by using good combustion practices). The U.S. Steel estimates are based on the uncontrolled emission factor.
# Severstal did not include PM estimates from natural gas combustion in three reheat furnaces because there are no test data, and there is no emission factor in MAERS.
# The U.S. Steel PM10 estimates for 2004 for hot metal desulfurization and hot metal transfer are based on the AP-42 emission factor for uncontrolled emissions. These emissions are captured and sent to a baghouse. Actual emissions are much lower than those in the inventory.
# Similarly, the U.S. Steel PM2.5-FIL (filterables) estimates for 2003 for BOF charging and tapping are based on the AP-42 emission factor for uncontrolled emissions and the AP-42 particle size distribution data. These emissions are also captured and sent to a baghouse; consequently, actual emissions are much lower than those reported in the inventory.
# We could not determine the basis for the PM10 emission estimates for loading raw materials into the blast furnaces at U.S. Steel (187 tons in 2003 and 118 tons in 2004). These estimates seem very high and may be based on uncontrolled emission factors.
# There are no estimates for U.S. Steel for PM fugitive emissions escaping through the casthouse roof monitors. Although all of the blast furnaces are equipped with capture and controls for casting emissions, the capture efficiency is not 100 percent.
Appendix A
A-4
# U.S. Steel uses an SOx emission factor of 1.67 lb/MMSCF for the blast furnace stoves compared to 8.87 lb/MMSCF used by Severstal. The reason for the difference is not known.
# The PM10 estimates for door leaks for Battery 5 appear to be greatly overestimated. The estimates give an emission factor of 0.27 lb/ton of coke. The revised AP-42 estimate for door leak emissions when the battery is performing at the allowable level for percent leaking doors is 0.016 lb/ton of coal (about 0.023 lb/ton of coke). 31 This battery is performing well below the allowable limit for door leaks; consequently, estimates based on actual door leak emissions are expected to be lower than those from the AP-42 emission factor.
a See the text of the report for a discussion of the uncertainty in the emission estimates. In particular, there is a great deal of uncertainty in the estimates for condensible PM due to the lack of site-specific test results.
Appendix B
B-5
Table B-2. Details of PM Emission Estimates for Severstal a Ratios Emissions (tpy)
Factor Units PM (tpy) PM25FIL:PM PM-CON:PM PM2.5FIl PM-CON PM2.5PRI
Annealing furnace (NG) NG 883 MMSCF 1.9 lb/MMSCF 0.8 1 3 0.8 2.5 3.4 Lime Unloading Exhaust gas
flow 14,000 DSCFM 0.005 gr/dscf 2.6 1 2.6 - 2.6
Torch cutting PM10 inventory
2.0 1 0 2.0 - 2.0
BOF (NG) NG 520 MMSCF 1.9 lb/MMSCF 0.5 1 3 0.5 1.5 2.0 B BF Stoves (NG) NG 459 MMSCF 1.9 lb/MMSCF 0.4 1 3 0.4 1.3 1.7 C BF Stoves (NG) NG 434 MMSCF 1.9 lb/MMSCF 0.4 1 3 0.4 1.2 1.6 Storage piles 3.1 tpy PM10 3.1 0.4 0 1.24 - 1.24 Desulfurization Slag Pit Slag 81,572 TPY 0.09 lb/ton 3.7 0.2 0 1 - 1 BF bleeder stacks inventory 0.3 1 0 0.3 - 0.3 C BF Slag Pit Slag 273,413 TPY 0.0088 tpy PM10 1.2 0.2 0 0.24 - 0.24 Taphole burning inventory 0.2 1 0 0.2 - 0.2 B BF Slag Pit Slag 156,693 TPY 0.0088 lb/ton 0.7 0.2 0 0.14 - 0.14 Totals 1,267 522 685 1,207 a See the text of the report for a discussion of the uncertainty in the emission estimates. In particular, there is a great deal of uncertainty in the estimates for condensible PM due to the lack of site-specific test results.
Appendix B
B-7
Table B-3. Details of PM Emission Estimates for Battery 5 a Ratios Emissions (tpy)
Source Material Throughput Units PM Emission Factor Units PM (tpy) PM25FIL:PM PM-CON:PM PM2.5FIl PM-CON PM2.5PRI
Total 379 94 799 894 a See the text of the report for a discussion of the uncertainty in the emission estimates. In particular, there is a great deal of uncertainty in the estimates for condensible PM due to the lack of site-specific test results.
Appendix B
B-8
Table B-4. Details of NOx and SOx Emission Estimates for U.S. Steel a
(tpy) Heaters (NG) Natural Gas 106 MMSCF 280 lb/MMSCF 0.6 lb/MMSCF 15 0.03 Heaters (NG) Natural Gas 77 MMSCF 280 lb/MMSCF 0.6 lb/MMSCF 11 0.02 Blast furnace flares (NG) Natural Gas 53 MMSCF 280 lb/MMSCF 0.6 lb/MMSCF 7 0.02 Flares (NG) Natural Gas 11 MMSCF 280 lb/MMSCF 0.6 lb/MMSCF 2 0.003 Ladle metallurgy (NG) Natural Gas 5 MMSCF 280 lb/MMSCF 0.6 lb/MMSCF 1 0.002 Total 3,188 2,626 a See the text of the report for a discussion of the uncertainty in the emission estimates.
Table B-5. Details of NOx and SOx Emission Estimates for Severstal a
Source Material Throughput Units NOx emission
factor Units SOx emission
factor Units
NOx emissions
(tpy) SOx emissions
(tpy) C BF stoves (BFG) BFG 24,003 MMSCF 23 lb/MMSCF 8.67 lb/MMSCF 276 104 B BF stoves (BFG) BFG 13,392 MMSCF 23 lb/MMSCF 8.67 lb/MMSCF 154 58 Reheat furnace 1 (NG) NG 2,367 MMSCF 280 lb/MMSCF 0.6 lb/MMSCF 331 0.7 Reheat furnace 2 (NG) NG 2,367 MMSCF 280 lb/MMSCF 0.6 lb/MMSCF 331 0.7 BOF ESP stack Steel 2,944,089 TPY 0.08 lb/ton 118 - Reheat furnace 3 (NG) NG 2,367 MMSCF 280 lb/MMSCF 0.6 lb/MMSCF 331 0.7 C BF casthouse Iron 1,571,337 TPY 0.03 lb/ton 0.0564 lb/ton 24 44 Annealing furnace (NG) NG 926 MMSCF 280 lb/MMSCF 0.6 lb/MMSCF 130 0.3 B BF casthouse Iron 900,533 TPY 0.03 lb/ton 0.0564 lb/ton 14 25 BOF (NG) NG 520 MMSCF 280 lb/MMSCF 0.6 lb/MMSCF 73 0.2 B BF stoves (NG) NG 459 MMSCF 280 lb/MMSCF 0.6 lb/MMSCF 64 0.1 C BF stoves (NG) NG 434 MMSCF 280 lb/MMSCF 0.6 lb/MMSCF 61 0.1 BOF tapping Steel 2,944,089 TPY 0.02 lb/ton 29 - Process heater (NG) NG 28 MMSCF 280 lb/MMSCF 0.6 lb/MMSCF 3.95 0.008 Coke unloading (NG) NG 5 MMSCF 280 lb/MMSCF 0.6 lb/MMSCF 0.71 0.002 Blast furnace stockhouse (NG) NG 5 MMSCF 280 lb/MMSCF 0.6 lb/MMSCF 0.71 0.002 Hand scarfing (NG) NG 2 MMSCF 280 lb/MMSCF 0.6 lb/MMSCF 0.26 0.001
Total 1,942 235 a See the text of the report for a discussion of the uncertainty in the emission estimates.
Appendix B
B-10
Table B-6. Details of NOx and SOx Emission Estimates for Battery 5 a