70
Deutsche Bahn Integrated Interim Report January – June 2018 Departure into a new era!

Deutsche Bahn Integrated Interim Report January – June 2018Departure into a new era!

At a glance
Selected key figures
H 1 Change
2018 2017 absolute %
KEY FINANCIAL FIGUR E S (€ MILLION)
Revenues adjusted 21,548 21,070 + 478 +2.3Revenues comparable 21,880 21,069 + 811 + 3.8Profit before taxes on income 560 733 –173 –23.6Net profit (after taxes) 562 779 –217 –27.9EBITDA adjusted 2,304 2,574 –270 –10.5EBIT adjusted 974 1,179 –205 –17.4Equity as of Jun 30/Dec 31 14,143 14,238 – 95 – 0.7Net financial debt as of Jun 30/Dec 31 19,704 18,623 +1,081 + 5.8Total assets as of Jun 30/Dec 31 58,155 56,436 +1,719 + 3.0Capital employed 1) as of Jun 30 36,201 34,506 +1,695 + 4.9Return on capital employed (ROCE) (%) 5.4 6.8 – –Redemption coverage (%) 16.9 19.3 – –Gross capital expenditures 4,217 4,108 +109 +2.7Net capital expenditures 1,925 1,490 + 435 +29.2Cash flow from operating activities 1,294 762 + 532 + 69.8
KEY PER FOR MAN CE FIGUR E S
Passengers (million) 2,320 2,355 –35 –1.5R AIL PA S SENGER TR ANSP ORT
Punctuality DB passenger transport (rail) in Germany (%) 94.0 94.6 – – Punctuality DB Long-Distance (%) 77.4 81.0 – –Passengers (million) 1,287 1,294 –7 – 0.5 thereof in Germany 1,031 1,030 +1 + 0.1 thereof DB Long-Distance 70.9 68.3 +2.6 + 3.8Volume sold (million pkm) 47,575 46,536 +1,039 +2.2Volume produced (million train-path km) 388.6 391.5 –2.9 – 0.7R AIL FR EIGHT TR ANSP ORT
Freight carried (million t) 129.4 139.2 – 9.8 –7.0Volume sold (million tkm) 44,534 47,756 –3,222 – 6.7TR ACK INFR A STRUC TUR E
Punctuality (rail) in Germany 2) (%) 93.3 94.2 – – Punctuality DB Group (rail) in Germany (%) 93.9 94.5 – –Train kilometers on track infrastructure (million train-path km) 540.0 534.2 + 5.8 +1.1 thereof non-Group railways 172.2 164.3 +7.9 + 4.8
Share of non-Group railways (%) 31.9 30.8 – –Station stops (million) 76.7 76.4 + 0.3 + 0.4 thereof non-Group railways 18.3 18.0 + 0.3 +1.7BUS TR ANSP ORT
Passengers (million) 1,034 1,060 –26 –2.5Volume sold 3) (million pkm) 3,516 3,701 –185 – 5.0Volume produced (million bus km) 802.8 815.4 –12.6 –1.5FR EIGHT FORWAR DING AND LO GISTIC S
Shipments in land transport (thousand) 52,522 50,751 +1,771 + 3.5Air freight volume (export) (thousand t) 649.4 613.1 + 36.3 + 5.9Ocean freight volume (export) (thousand TEU) 1,087 1,063 +24 +2.3
ADDITIONAL KEY FIGUR E S
Order book for passenger transport as of Jun 30/Dec 31 (€ billion) 91.4 91.0 + 0.4 + 0.4Moody’s/S&P Global Ratings Aa1/AA– Aa1/AA– – –
Employees as of Jun 30 (FTE) 316,919 307,565 + 9,354 + 3.0
1) Figure as of June 30, 2017 adjusted µ60 F.2) Non-Group and DB Group train operating companies.3) Excluding DB Arriva.
Focus 2018Better and more reliable for our customers. For a direct improvement in quality, we have introduced comprehensive immediate actions and expect to achieve a trend reversal.
Creating added value for our customers. With our Comfort Check-in, our passengers can digitally check into the ICE themselves and use their travel time in an even more relaxed manner and according to their needs – a fur-ther step towards a “digital railway.”
Creating more individual mobility products. With “ioki” we will introduce increasingly more on-demand products and autonomous driving in public transport and develop modern ser-vices that will supplement rail transport.
Driving innovations through new partner-ships. DB Digital Ventures invests in start-ups which may make a useful addition to our core business and play a decisive role in the mobil-ity market in the future.
Digitalization of the rail network. Our pro-gram Digital Rail for Germany represents a technological quantum leap for the entire rail industry. The first visible result: Hamburg is becoming a model city and pioneer in rail digitalization.
“At Deutsche Bahn we are guided by a triad
that is comprised of investing, modernizing
and digitalizing. That’s our compass.”
Dr. Richard Lutz

Contents 1 Chairmanʼs letter
3 Interim Group management report (unaudited)
3 DB Group
7 Quality
9 Social
11 Environmental
13 Economic report
23 Development of business units
49 Opportunity and risk report
49 Events after the balance sheet date
50 Outlook
54 Consolidated interim financial statements (unaudited)
54 Consolidated statement of income
55 Consolidated balance sheet
56 Consolidated statement of cash flows
57 Consolidated statement
of changes in equity
58 Segment information according
to segments
60 Notes to the consolidated interim
financial statements
U5 Contact information and financial calendar
Cover image: #grünspotting — train travel equals environmental protection.
Every year, more than 140 million passengers travel through
Germany in our ICE, InterCity or EuroCity trains using 100 %
eco- power. For this reason, two third- and fourth-generation
green ICEs with a green stripe acted as ambassadors be -
tween February 23 and April 1. Everybody who noticed them
on their travels through Germany had the chance to win
a BahnCard 100 or one of 25 travel coupons. All they had to
do was upload a photo of the ICE with the green stripe on
Instagram using the hashtag #grünspotting and link it to
@deutschebahn. For the first 2,000 photo uploads, Berg-
waldprojekt e. V. will plant 2,000 new trees to protect our
environment. More than 3,000 photos were uploaded.
¥ EC
O-P
ION
EER
¿ P
ROFI
TABL
E Q
UAL
ITY
LEAD
ER†
TO
P EM
PLO
YER
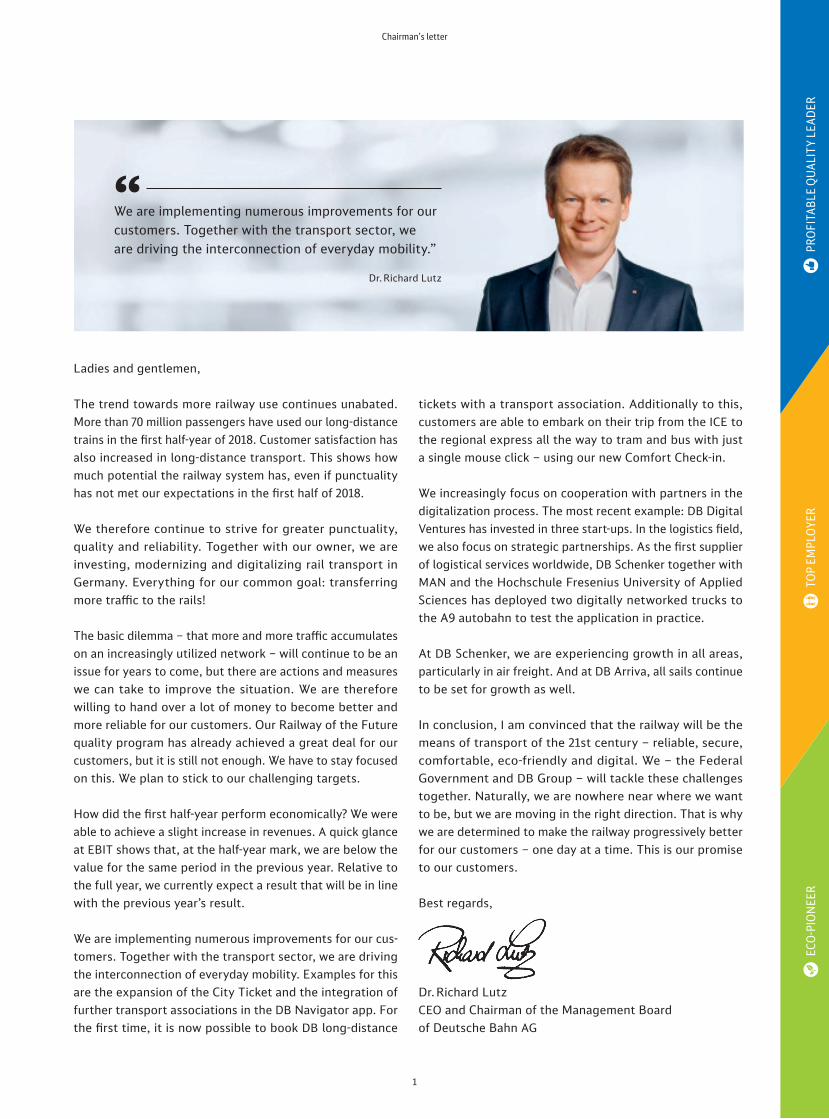
Ladies and gentlemen,
The trend towards more railway use continues unabated. More than 70 million passengers have used our long-distance trains in the fi rst half-year of 2018. Customer satisfaction has also increased in long-distance transport. This shows how much potential the railway system has, even if punctuality has not met our expectations in the fi rst half of 2018.
We therefore continue to strive for greater punctuality, quality and reliability. Together with our owner, we are investing, modernizing and digitalizing rail transport in Germany. Everything for our common goal: transferring more traffi c to the rails!
The basic dilemma – that more and more traffi c accumulates on an increasingly utilized network – will continue to be an issue for years to come, but there are actions and measures we can take to improve the situation. We are therefore willing to hand over a lot of money to become better and more reliable for our customers. Our Railway of the Future quality program has already achieved a great deal for our customers, but it is still not enough. We have to stay focused on this. We plan to stick to our challenging targets.
How did the fi rst half-year perform economically? We were able to achieve a slight increase in revenues. A quick glance at EBIT shows that, at the half-year mark, we are below the value for the same period in the previous year. Relative to the full year, we currently expect a result that will be in line with the previous year’s result.
We are implementing numerous improvements for our cus-tomers. Together with the transport sector, we are driving the interconnection of everyday mobility. Examples for this are the expansion of the City Ticket and the integration of further transport associations in the DB Navigator app. For the fi rst time, it is now possible to book DB long-distance
tickets with a transport association. Additionally to this, customers are able to embark on their trip from the ICE to the regional express all the way to tram and bus with just a single mouse click – using our new Comfort Check-in.
We increasingly focus on cooperation with partners in the digitalization process. The most recent example: DB Digital Ventures has invested in three start-ups. In the logistics fi eld, we also focus on strategic partnerships. As the fi rst supplier of logistical services worldwide, DB Schenker together with MAN and the Hochschule Fresenius University of Applied Sciences has deployed two digitally networked trucks to the A9 autobahn to test the application in practice.
At DB Schenker, we are experiencing growth in all areas, particularly in air freight. And at DB Arriva, all sails continue to be set for growth as well.
In conclusion, I am convinced that the railway will be the means of transport of the 21st century – reliable, secure, comfortable, eco-friendly and digital. We – the Federal Government and DB Group – will tackle these challenges together. Naturally, we are nowhere near where we want to be, but we are moving in the right direction. That is why we are determined to make the railway progressively better for our customers – one day at a time. This is our promise to our customers.
Best regards,
Dr. Richard LutzCEO and Chairman of the Management Board of Deutsche Bahn AG
We are implementing numerous improvements for our customers. Together with the transport sector, we are driving the interconnection of everyday mobility.”
Dr. Richard Lutz
Best regards,
Dr. Richard Lutz
“
1
Chairmanʼs letter


Changes in the executive bodies
The Deutsche Bahn AG (DB AG) Management Board and Supervisory Board underwent the following changes in the first half of 2018:
◊ Alexander Doll has taken up his duties as member of the Management Board responsible for Freight Transport and Logistics on April 1, 2018.
◊ Prof. Dr. Dr. Utz-Hellmuth Felcht resigned from his posi-tion on the Supervisory Board and position as Chairman of the Supervisory Board as of March 31, 2018. State Secretary Michael Odenwald resigned from his position on the Supervisory Board of DB AG in conjunction with his leaving the German Federal Ministry of Transport and Digital Infrastructure (BMVI) as of April 10, 2018. He was appointed member of the Supervisory Board of DB AG during the extraordinary Annual General Meeting on April 10, 2018 with effect from April 11, 2018 and succeeds Prof. Felcht; and in the extraordinary meeting of the Supervisory Board of DB AG on April 17, 2018, he was elected Chairman of the Supervisory Board of DB AG for the duration of his term. State Secretary Guido Beer-mann (BMVI) was appointed as his successor on the Supervisory Board of DB AG on April 11, 2018. In the context of his resignation from the German Federal Min-istry of Economics and Energy (BMWi), Parliamentary State Secretary Uwe Beckmeyer resigned from the Super- visory Board of DB AG with effect from April 30, 2018.
Implementation of DB2020+ strategy
In addition to quality, improving our organizational per-formance capability and driving the digital transformation forward continue to be part of DB Group’s central strategic areas of action.
We are working on the digitalization of our core business in the business units and across DB Group via our GROUP
PROGRAMS (2017 INTEGRATED REPORT µ16 FF.) as well as on new business models to expand our portfolio to make DB Group fit for the future. We create additional customer benefits
with new mobility products that provide a seamless travel chain and innovative solutions to integrate all mobility products. In the first half of 2018, examples of this were the expansion of our on-demand services via our IOKI BRAND µ4 as well as the integration of more than 21 transport associ-ations in DB NAVIGATOR µ27.
Sixth DB Sustainability Day
“Sustainable Cities Require Smart Products” was the lead- ing theme of the sixth DB Sustainability Day on March 1 in Berlin. Throughout one entire day, the Group Management Board spoke with 190 invited representatives of various stakeholder groups about ideas and expectations for better quality of life in cities and a contribution to a society that is fit for the future. Among the guests of the event were Olaf Scholz (former First Mayor of the Free and Hanseatic City of Hamburg), Clare Jones (Chief Customer Officer of what3words) as well as representatives of the cities of Copenhagen, London and Darmstadt.
Interim Group management report (unaudited)
DB Group — Michael Odenwald becomes new chairman of the
Supervisory Board — Central strategic areas of action remain unchanged
— New coalition agreement contributes to a strengthening of the railway in Germany
— BNetzA has approved 2019 train-path prices
Driving innovative solutions
New product and service conceptsComfort Check-in replaces ticket controlsAfter an initial testing phase, we introduced our Comfort Check-in service throughout Germany. This makes ticket checks obsolete as the customer checks in independently. The function is integrated exclusively into the DB Navigator app and can be used by all customers with a mobile or online ticket and seat reservation. Once the passengers have taken their seats, they simply check in by clicking on the app. This information is then displayed to the train crew on their ticket control devices. The train conductors can use the time they save for more customer service in the future. As of 2019, the digital service is to be released for additional ticket types.
3
Interim Group Management Report―DB Group

New digital services in local transportDB Regional, together with the contracting organizations in local transport, plans to provide customers with a digital travel experience. For this purpose, we are installing WiFi technology on our trains. In addition, an information portal has been developed that offers news, current trip informa-tion and tourist information. In addition to numerous pilot projects, such as in S-Bahn (metro) Munich, we have already equipped a few local transport networks with WiFi; these are: Elbe-Saale-Bahn, Expresskreuz Bremen, S-Bahn (metro) Rhine-Main and S-Bahn (metro) Stuttgart. We are in negoti-ations with additional public transport authorities. Currently, S-Bahn (metro) Hamburg stations are equipped with WiFi.
ioki Рmobility on demandWith ΠIOKI (WWW.IOKI.COM), we are bringing on-demand mobility and autonomous driving into public transport. We have expanded our offer:
◊ ioki collaborates with the public transport provider Berliner Verkehrsbetriebe (BVG). As part of a pilot proj- ect, a small self-driving bus can for the first time be individually ordered via an app. This small bus has been driving around the EUREF campus in Berlin since April. At a later point in time, we are planning to expand the testing operations to public roads.
◊ The first on-demand service followed in May 2018 as part of local public transport with integration into the ex -isting fares in the town of Wittlich in Rhineland-Palati-nate. The “Wittlich Shuttle” supplements existing trans-port structures and brings customers to their destination on flexible and varying routes depending on the travel destination. The service can be conveniently booked via an app. Owners of season tickets or single tickets pay a convenience surcharge of € 1 for the new service.
◊ As part of the smart city partnership of DB Group with the Free and Hanseatic City of Hamburg, ioki will implement a driver-based on-demand shuttle service with connec-tions to local public transport in Hamburg as of July 2018.
◊ In Bad Birnbach, the autonomous minibus has already been used by 10,000 passengers. As of summer 2018, a second bus will be added. Both vehicles will also stop at the train station which is 2 km away.
Cooperation for self-driving trucks DB Schenker, in cooperation with MAN and Fresenius Uni-versity, is carrying out a platooning project which is funded by the BMVI. In addition, there will be preparatory activities for the piloting of autonomous truck runs on terminal prem-ises in 2018. MAN provided the test vehicles for the truck platooning project to DB Schenker in February 2018. 2017
INTEGRATED REPORT µ8 F. (DEPARTURE INTO THE FUTURE)
Utilizing blockchain technologyBlockchain is considered to be one of the most disruptive technologies ever. DB Group is testing various applica -tions – from logistics supply chains and the clearing of internal services via smart contracts as well as the distribu-tion of proceeds in regional transport to digital identity, such as that of trains but also of passengers. The DB Systel blockchain team drives the blockchain and distributed ledger technology implementation.
Clarity in real time thanks to SmartBooking The SmartBooking solution developed by DB employees shows free conference rooms and workstations in real time. For this purpose, the first rooms and workstations were equipped with sensors that function like motion sensors and with check-in buttons during a test phase. This makes it possible to book or release workstations at the touch of a button. The data is delivered via a radio network to the DB Internet of Things cloud.
Digitalization in rail operationsPredictive maintenance Wayside monitoring takes advantage of digitalization by enabling predictive maintenance. The goal is to improve rail system quality while lowering maintenance costs by recognizing potential irregularities at an early stage so that malfunctions can be avoided. In 2017, a video-based system was introduced for the online analysis of freight cars for maintenance purposes. At the end of 2018, a laser-based system for measuring wheel sets will be tested, as will a sys- tem for brake shoe diagnostics during ongoing operations.
With a fiber optic sensing (FOS) system, we plan to counteract external influences better and even earlier in the future. In addition, the data provides information on the condition of the infrastructure and the moving mate-rials as well as about the location and speed of the trains. This supports not only maintenance, but also the informa-tion provided to the customers and enhances traveling com-fort. The results of the pilot projects have been available since mid-2018, and we are deciding our further approach on the basis of those results. Our vision comprises the devel-opment of an intelligent system which provides useful sensor data in real time and can be used as a solid decision-making support with minimal expansion of the infrastructure.
First milestone for digital rail in GermanyHamburg will be equipped with the first highly automated S-Bahn (metro) in Germany. DB Group, the Free and Han-seatic City of Hamburg and Siemens AG are cooperating on
Deutsche Bahn Group―Integrated Interim Report January – June 2018
4

a project that plans to provide digital equipment for a pilot line including four vehicles. The implementation date is October 2021, when Hamburg is hosting the world congress for intelligent transport systems (ITS). The pilot project will cost about € 60 million.
Digitalization in station managementGlowing fiber optic cables point the wayFinding your way around stations is becoming easier with glowing fiber optic cables in the flooring; we have been testing this together with the start-up SIUT in the Stuttgart- Bad Cannstatt station since February. Thanks to the lit-up symbols in the station platform concrete, S-Bahn (metro) customers will also be able to see where the train stops, how long it is and how full it is even before the train arrives at the station. DB Group plans to improve passenger information and punctuality using this optimized train dispatch service.
Testing cleaning robots New developments, such as in the area of robotics, help us to improve our service even more. DB mindbox asked pro-viders to present specific station cleaning solutions during a challenge at Berlin’s central station. The most compelling model was the cleaning robot CR700 from Adlatus Robotics. Since May, the CR700 has been supporting the cleaning teams at the central station in Ulm and will continue to do so for the next two years.
Equity investments and partnerships for more digitalization and innovationDB Digital VenturesDeutsche Bahn Digital Ventures (DB DV) invests in new data-driven business models. In the first half of 2018, DB DV acquired shares in three US companies:
◊ GoKid is a car-pooling platform that helps to take the kids to school, sports or other after-school activities safely and on time.
◊ Ridecell has developed intelligent software for the oper-ation of car-sharing, car pools and autonomous fleet management.
◊ Trillium develops cyber security software to protect net-worked vehicles against hacker attacks.
CleverShuttle expands its servicesIn May, CleverShuttle also commenced operations in Stutt-gart. We are supporting the start-up during the expansion of its services. CleverShuttle intelligently supplements the mobility products of DB Group and enables energy-efficient and seamless door-to-door mobility, which is a particularly attractive option for train passengers.
BEYOND1435The program Œ BEYOND1435 (WWW.BEYOND1435.COM) pro-vides additional freedom to DB employees and also helps them to realize their digital business model. The first team to successfully complete the Intrapreneurship program was “weColli.” At program completion, the team is offered the option of a spin-out into an independent company. weColli has a platform for logistics companies that provides an emissions-free supply of goods over the last mile using cargo bikes. During its next step, the team will be inte-grated into the Group program Smart Cities to offer the solution to cities and towns.
Legal topics
Proceedings regarding financing contributionsTo avoid risks related to statutes of limitations, at the end of 2016 we lodged a complaint with the Stuttgart Adminis-trative Court for additional financing contributions based on the so-called negotiation clause (Sprechklausel) against the partners of project Stuttgart 21. The project partners have meanwhile responded to the complaint. The Stuttgart Administrative Court has set a dead line for response to the statement of defense for the end of August 2018.
Political environment
New coalition agreement contains strong support for rail transportIn the coalition agreement of February 7, 2018, the CDU, CSU and SPD have committed to the strengthening of the railway in Germany and to an integrated DB Group. The coalition agreement includes numerous topics that are important to the entire industry. A railway pact between the Federal Government and industry is expected to result in a two-fold increase in passenger numbers by the year 2030, and is also expected to boost rail freight. Focus topics for the sector from a DB Group perspective:
◊ Continued capital expenditure increase providing the funds needed to maintain the current status (perfor-mance and financing agreement; LuFV III) as well as expansion and new construction, implementation of a planning acceleration law and application of building information modeling (BIM);
◊ Implementation of a master plan for rail freight trans-port with train-path price support and realization of the 740 m network;
5
Interim Group Management Report―DB Group

◊ Increased digitalization including the expansion of the European command and control technology ETCS;
◊ Further work on a synchronized timetable for all of Germany including a target schedule and appropriate hub measures;
◊ Strengthening of the railway within a context of climate and environmental protection, including appropriate measures in the 2050 climate protection program, a pro-gram for electrification and alternative drives as well as continued commitment to further noise reduction.
Regulatory and transport policy topicsBNetzA approves train-path prices for 2019The competent ruling chamber approved the train-path prices for the schedule year 2018/2019 on January 17, in-cluding the proposed 1.8% increase of train-path prices in regional rail passenger transport. This follows from the statutory linking of the train-path price development to the growth rate of the regionalization funds. As set forth in the resolution to the 2018 train-path pricing system (TPS), the proposed train-path prices in long-distance rail pas-senger transport were increased as part of the approval and lowered in the rail freight transport by about € 28 million, respectively. The decision is not yet final.
The BNetzA has to redetermine the equity yield rate in the energy gridOn March 22, 2018, the Düsseldorf Higher Regional Court decided that the Federal Network Agency (BNetzA) had a faulty approach in its method to determine the equity yield rate. About 1,100 municipal utilities and network operators, including DB Energy, had lodged a complaint against the permitted equity yield rate which BNetzA had reduced. The court did not provide any guidelines regarding the new rate. The BNetzA has the option to appeal the court decision before the German Federal Supreme Court.
Law to accelerate planning and approval processesThe hearing of the associations in relation to a legislative draft for the acceleration of planning and approval processes as part of the transport sector of the BMVI took place in June 2018. The draft focuses on the BMVI’s strategy to accelerate planning processes and also comprises the bundling of hearing and plan approval procedures at the Federal Rail- way Authority (EBA) recommended by the planning acceler-ation innovation forum. This step also occurred in view of the increasing digitalization and introduction of BIM. The bundling enables the EBA to continue processing digital planning submitted by DB Group on both procedural levels; this ensures that interfaces are avoided. Further more, the
draft contains a regulation for Federal rail structures which sets forth that the traffic development forecast to date may continue to be used as the basis for ongoing proceedings even if the Federal Transport Infrastructure Plan is amend - ed, as well as an update and expansion of the projects for the review of which the German Federal Administrative Court is to be the responsible court of the first and last instance.
New road traffic regulations On May 17, 2018, the third and last part of the EU legis lative proposals under the strategy “Europe on the Move” for road traffic was submitted, including a proposal to intro-duce emissions targets for heavy commercial vehicles. According to the proposal, trucks are to reduce their CO₂ emissions by 15% by 2025 as compared to 2019. By 2030, the reduction is to reach 30%. Further elements of the pack- age are a message for the creation of a digital envi ron - ment for the exchange of information in the transport area (“e-freight”), a proposal that aims to make approval pro-cesses for TEN-T projects (Trans-European-Network-Trans-port) leaner and regulations that improve the energy effi-ciency in the heavy load transport on the road.
Proposals for a multi-year EU financial frameworkOn May 2, 2018, the Commission proposed a budget amounting to € 1,279 billion for the new EU budget for the years 2021 to 2027. The funds of the Connecting Europe Facility (CEF) are to be increased to € 42.3 billion for invest-ments in trans-European transport, digital and energy net-works, of which close to € 31 billion are earmarked for investments in transport networks.
French rail reform resolvedThe main topics of the rail reform in France which was en -acted in June 2018 are the gradual opening of the na tion al rail passenger transport market to competition (market opening in long-distance rail passenger transport between December 2019 and December 2023, with longer periods for the Paris metropolitan area, with long-distance transport operated on a purely commercial basis as of 2020), the reor-ganization of the SNCF into a stock corporation permanently owned by the government, the removal of public servant status for new employees at the SNCF as of the end of 2020, the assignment of the passenger stations segment to the rail infrastructure operator SNCF Réseau and the order arranging an employee transfer in the event of an operator change in local rail passenger transport. In connection with the rail reform, large-scale strike actions have occurred in France since April.
Deutsche Bahn Group―Integrated Interim Report January – June 2018
6
Focus on quality, operational and digital excellence in our core businessThe development in product quality, particularly punctu-ality, was again not satisfactory among the transporters in the integrated rail system in the first half-year of 2018. We have therefore immediately started implementing addi-tional actions from which we expect a direct effect on punc-tuality and customer satisfaction in 2018:
◊ Under the punctuality management center, vehicle availability will be improved and anticipatory measures will be implemented at DB Long-Distance.
◊ At DB Regional, task forces will focus on regional hot spots (such as the Munich S-Bahn (metro)).
◊ In the production area, DB Netze Track is currently im -plementing an emergency program focused on com-mand and control technology for railroad crossings and the track. In addition, we are further optimizing our construction measures.
◊ DB Netze Stations is implementing about 500 individual measures to improve customer satisfaction. In addition, 30 S-Bahn (metro) stations in Hamburg, Munich, Frank-furt am Main, Cologne and Berlin are being upgraded.
◊ Across business units, we are promoting the imple-mentation and expansion of the PlanStart program and continuing to work on relieving pressure in the four corridors suffering the highest loads.
Structural process enhancements are necessary to achieve a high and sustained quality level over the medium term, too. For this reason, we created the Processexcellence@ZuBa (@Railway of the Future) program to realize the re -spec tive process improvements and implement Group- wide standards utilizing standardized lean management and digi talization methods. Our first step thereby focuses on im proving incident management in the event of major incidents and the provision of trains. These processes con-sis tently aim to achieve a benefit for end customers. As part of the excellence program, strong process owners are being introduced from the line organization; they are responsible for the continuous further development of processes across all business units to achieve sustained improvement.
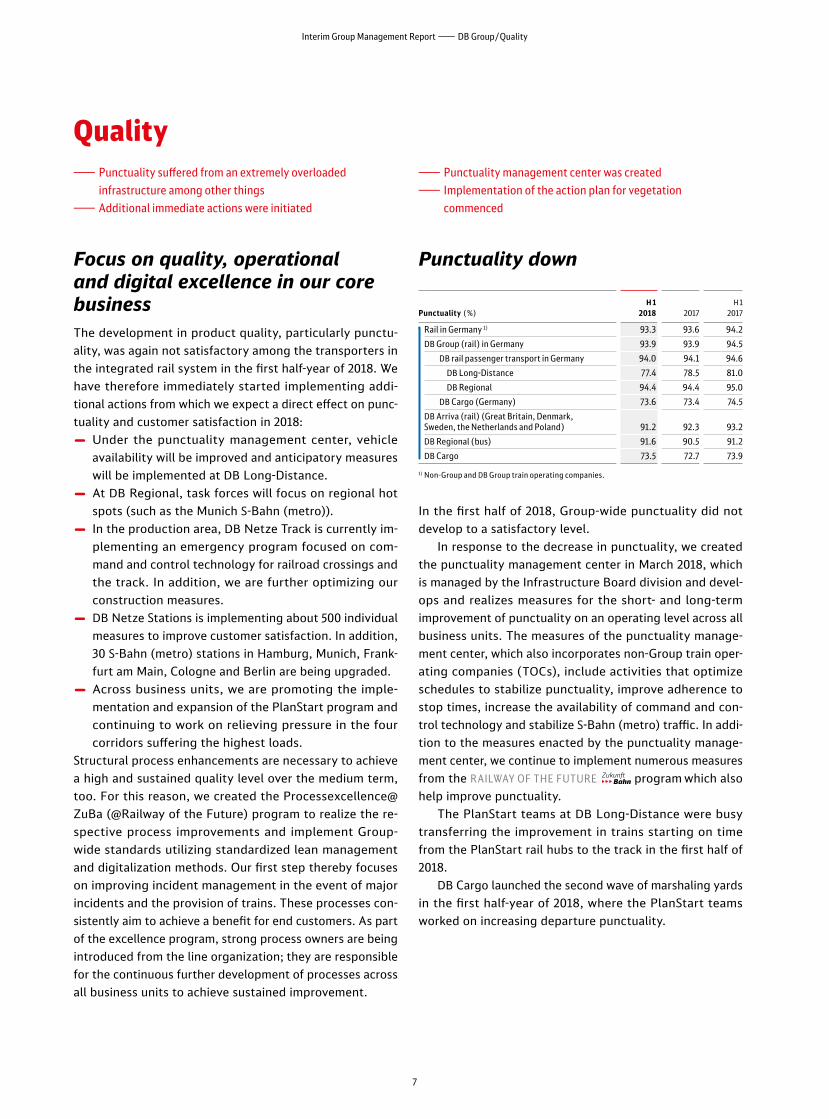
Punctuality down
Punctuality (%)H 1
2018 2017H 1
2017
_
Rail in Germany 1) 93.3 93.6 94.2
DB Group (rail) in Germany 93.9 93.9 94.5
DB rail passenger transport in Germany 94.0 94.1 94.6
DB Long-Distance 77.4 78.5 81.0
DB Regional 94.4 94.4 95.0
DB Cargo (Germany) 73.6 73.4 74.5
DB Arriva (rail) (Great Britain, Denmark, Sweden, the Netherlands and Poland) 91.2 92.3 93.2
DB Regional (bus) 91.6 90.5 91.2
DB Cargo 73.5 72.7 73.9
1) Non-Group and DB Group train operating companies.
In the first half of 2018, Group-wide punctuality did not develop to a satisfactory level.
In response to the decrease in punctuality, we created the punctuality management center in March 2018, which is managed by the Infrastructure Board division and devel- ops and realizes measures for the short- and long-term improvement of punctuality on an operating level across all business units. The measures of the punctuality manage-ment center, which also incorporates non-Group train oper-ating companies (TOCs), include activities that optimize schedules to stabilize punctuality, improve adherence to stop times, increase the availability of command and con-trol technology and stabilize S-Bahn (metro) traffic. In addi-tion to the measures enacted by the punctuality manage-ment center, we continue to implement numerous measures from the RAILWAY OF THE FUTURE program which also help improve punctuality.
The PlanStart teams at DB Long-Distance were busy transferring the improvement in trains starting on time from the PlanStart rail hubs to the track in the first half of 2018.
DB Cargo launched the second wave of marshaling yards in the first half-year of 2018, where the PlanStart teams worked on increasing departure punctuality.
Quality — Punctuality suffered from an extremely overloaded
infrastructure among other things —Additional immediate actions were initiated
—Punctuality management center was created — Implementation of the action plan for vegetation
commenced
7
Interim Group Management Report―DB Group/Quality
Punctuality in the first half of 2018 in part still remained significantly under the values from the same period of the previous year both for non-Group and DB Group TOCs in Germany.
Punctuality suffered from an infrastructure that was increasingly utilized. The additional increase in traffic volume, the expansion of the construction program and the corresponding reduction in network capacity resulted in delays. In contrast, it was possible to further reduce con-struction-related delays (delays that can be directly linked to a construction site).
On the operational side, a large number of incidents in command and control technology, vehicle faults and incidents related to the provision of vehicles had a negative impact on punctuality.
Additional stress resulted from weather-related re stric-tions, such as the storm Friederike in mid-January which led to massive track undercutting and large-scale track closures due to fallen trees.
Implementing the action plan for vegetationIn the first half of 2018 we had started implementing the vegetation action plan, which aims at reducing the negative impact of increasingly extreme weather on rail operations.
In addition to continuing proven measures such as the preventative pruning of trees and bushes alongside tracks, the plan also includes thinning tree populations along the tracks to significantly stabilize the tree population even beyond the trimming zone of 6 meters. As part of the refor-estation measures, trees that have a stable height and suit-able growth patterns will be planted, as will bushes and scrubs.
More than 3,000 acres of forest had already been in -spected and digitally recorded by June 2018. The data forms the basis for the thinning of the tree population which is planned to start in November 2018.
It is planned that up to 150 forestry workers will join the more than 1,000 employees already working on the inspec-tion. In the next five years, we are planning to spend a further € 125 million on the care and management of the plant population in addition to the € 100 million that has been available for this project each year since 2007.
The construction management center continues its workThe goal of the construction management center is to carry out the construction volume for 2018, which is set to reach record highs this year, with the lowest possible impact on our customers.
To achieve this, the construction measures are bundled in terms of time and location and the specific construction processes are considered. Sometimes it is possible to pre-assemble complex technical construction parts next to the track and thus reduce the time the track construction engineers need for the actual installation, which results in tracks getting cleared for traffic much faster. Another option is to install additional switches before the construc-tion measure. Together with colleagues from the specialist departments and the regions, the management center also decides whether a measure should be delayed or combined with other projects. Additional improvements result from the use of additional employees and tool-based forecasting support as well as work in three-shift operations or the shifting of closing times to peripheral low-traffic regions.
!!! !!!
Deutsche Bahn Group―Integrated Interim Report January – June 2018
8
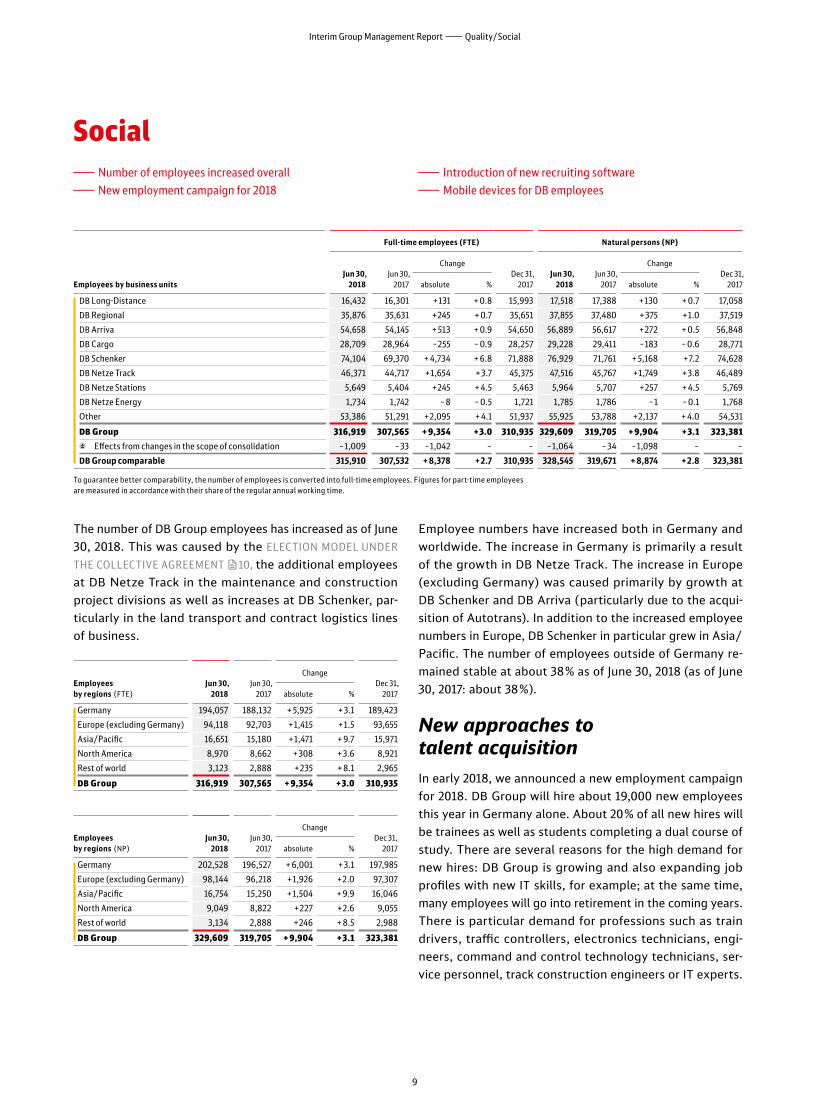
The number of DB Group employees has increased as of June 30, 2018. This was caused by the ELECTION MODEL UNDER
THE COLLECTIVE AGREEMENT µ10, the additional employees at DB Netze Track in the maintenance and construction project divisions as well as increases at DB Schenker, particularly in the land transport and contract logistics lines of business.
Employees by regions (FTE)
Jun 30, 2018
Jun 30, 2017
ChangeDec 31,
2017absolute %
Germany 194,057 188,132 + 5,925 + 3.1 189,423
Europe (excluding Germany) 94,118 92,703 +1,415 +1.5 93,655
Asia/Pacific 16,651 15,180 +1,471 + 9.7 15,971
North America 8,970 8,662 + 308 + 3.6 8,921
Rest of world 3,123 2,888 +235 + 8.1 2,965
DB Group 316,919 307,565 + 9,354 + 3.0 310,935
Employees by regions (NP)
Jun 30, 2018
Jun 30, 2017
ChangeDec 31,
2017absolute %
Germany 202,528 196,527 + 6,001 + 3.1 197,985
Europe (excluding Germany) 98,144 96,218 +1,926 +2.0 97,307
Asia/Pacific 16,754 15,250 +1,504 + 9.9 16,046
North America 9,049 8,822 +227 +2.6 9,055
Rest of world 3,134 2,888 +246 + 8.5 2,988
DB Group 329,609 319,705 + 9,904 + 3.1 323,381
Employee numbers have increased both in Germany and worldwide. The increase in Germany is primarily a result of the growth in DB Netze Track. The increase in Europe (ex cluding Germany) was caused primarily by growth at DB Schenker and DB Arriva (particularly due to the acquisition of Autotrans). In addition to the increased employee numbers in Europe, DB Schenker in particular grew in Asia/Pacific. The number of employees outside of Germany re mained stable at about 38% as of June 30, 2018 (as of June 30, 2017: about 38%).
New approaches to talent acquisition In early 2018, we announced a new employment campaign for 2018. DB Group will hire about 19,000 new employees this year in Germany alone. About 20% of all new hires will be trainees as well as students completing a dual course of study. There are several reasons for the high demand for new hires: DB Group is growing and also expanding job profiles with new IT skills, for example; at the same time, many employees will go into retirement in the coming years. There is particular demand for professions such as train drivers, traffic controllers, electronics technicians, engineers, command and control technology technicians, service personnel, track construction engineers or IT experts.
Social —Number of employees increased overall —New employment campaign for 2018
—Introduction of new recruiting software —Mobile devices for DB employees
Employees by business units
Full-time employees (FTE) Natural persons (NP)
Jun 30, 2018
Jun 30, 2017
ChangeDec 31,
2017Jun 30,
2018Jun 30,
2017
ChangeDec 31,
2017absolute % absolute %
DB Long-Distance 16,432 16,301 +131 + 0.8 15,993 17,518 17,388 +130 + 0.7 17,058
DB Regional 35,876 35,631 +245 + 0.7 35,651 37,855 37,480 + 375 +1.0 37,519
DB Arriva 54,658 54,145 + 513 + 0.9 54,650 56,889 56,617 +272 + 0.5 56,848
DB Cargo 28,709 28,964 –255 – 0.9 28,257 29,228 29,411 –183 – 0.6 28,771
DB Schenker 74,104 69,370 + 4,734 + 6.8 71,888 76,929 71,761 + 5,168 +7.2 74,628
DB Netze Track 46,371 44,717 +1,654 + 3.7 45,375 47,516 45,767 +1,749 + 3.8 46,489
DB Netze Stations 5,649 5,404 +245 + 4.5 5,463 5,964 5,707 +257 + 4.5 5,769
DB Netze Energy 1,734 1,742 – 8 – 0.5 1,721 1,785 1,786 –1 – 0.1 1,768
Other 53,386 51,291 +2,095 + 4.1 51,937 55,925 53,788 +2,137 + 4.0 54,531
DB Group 316,919 307,565 + 9,354 + 3.0 310,935 329,609 319,705 + 9,904 + 3.1 323,381
Effects from changes in the scope of consolidation –1,009 –33 –1,042 – – –1,064 –34 –1,098 – –
DB Group comparable 315,910 307,532 + 8,378 +2.7 310,935 328,545 319,671 + 8,874 +2.8 323,381
To guarantee better comparability, the number of employees is converted into full-time employees. Figures for part-time employees are measured in accordance with their share of the regular annual working time.
9
Interim Group Management Report―Quality/Social

People above 50 years of age, college dropouts, former soldiers or lateral entrants: DB Group is increasingly fo cus ing on new target groups when recruiting new em ployees.
In May 2018, we transferred our application management to a new software. Submitting an application is now much quicker and more transparent. It is even possible to apply via smartphone. Applicants can check online where they are in the application process, and can update data and upload documents. There is also a new option where an applicant can create a job agent that notifies the applicant by email regarding new positions that fit the applicant’s profile.
DB Group plans to forgo the cover letter as of this year, initially for trainees. After all, writing an application is a substantial hurdle for many applicants without actually saying much: a résumé and interview are much better suited to determine applicants’ skills and their motiva tion. This step is based on the findings of the successful DB application marathon in November 2017; the informal application process was particularly wellreceived by the candidates.
Employment conditions improved
On January 1, 2018, the second phase of the collective wage increase from the collective bargaining agreement round 2016/2017 came into effect for employees of the integrated rail system in Germany. According to the elected options, 40% of employees will receive an additional wage increase of 2.62%. 58% will receive six more vacation days, and for 2% the working time per week will be reduced by one hour. This election model has since been referenced several times in collective bargaining processes in other industries.
Together with the Group Works Council, we created the framework conditions for an accelerated change of today’s work environment through digitalization as part of a new framework Group employer/works council agreement (RKBV) in March. The RKBV “Jointly designing our progress and our future” is meant to give our employees guidance and security. Among other things, it was agreed that the Group Works Council will actively participate in the creation of the new work formats, from hierarchyfree teams and work in labs to startups and the Intrapreneurship Program.
In late March 2018 we presented the first prototypes of our new corporate clothing during the Annual Results Press Conference. These were developed in cooperation with the designer Guido Maria Kretschmer. The new corporate clothing, which will likely be introduced starting at the end of 2019, will give DB Group a more modern and sympathetic image in its interaction with the public. Confident, welldressed employees, who feel comfortable, will be able to provide even better service to customers. The new corporate clothing thus represents a further contribution to the RAILWAY OF THE FUTURE quality program. Significant improvements in functionality, look and comfort additionally increase employee satisfaction and pride and identification with the brand.
Keeping up with the transformation process In April 2018, we decided that all employees in Germany who so far do not have a work device and are thus cut off from the digital transformation of DB Group, should be equipped with a mobile device (smartphone or tablet). The program will be launched in 2018 and will run until the end of 2019. In this way, these employees will also have the opportunity to use all new online services. This will strength en the digital expertise of individual employees. At the same time, DB Group will become more efficient since, for example, on the operational side work orders can be picked up electronically or work processes can be documented electronically.
On April 1, 2018, DB Group as one of the first large companies in Germany created a new change management division, which reports directly to the member of the Management Board responsible for HR, in order to provide a solid foundation for the DB Group transformation within the organization. DB Group is undergoing a fundamental transformation process: the change management will accompany the fundamental change of our business processes to increase our performance capability, drive the digitalization of DB Group, but also the transformation within DB Group through hiring new employees in the coming years. The new division will function as a strategic change consultant, define requirements such as those for staff planning, further qualification, working conditions or onboarding and set guidelines and provide tools for a professional change management within the Group.
!!!!!! !!!
Deutsche Bahn Group―Integrated Interim Report January – June 2018
10

With its strategy DB2020+ , DB Group is harmonizing the dimensions ECONOMY ¿, SOCIAL † and ENVIRONMENTAL ¥. The target in the ENVIRONMENTAL ¥ dimension is to strengthen our role as an eco-pioneer. We want our cus-tomers to benefit from first-class and environmentally friendly mobility and logistics solutions driven by dedi-cated employees and digital expertise. To strengthen our aspiration to be an eco-pioneer, five fields of ac tion are key: climate protection, noise reduction, resource effi-ciency, air quality control and nature conservation.
5-point strategy for climate change
DB Group is probably more severely affected by the effects of climate change than any other large company in Ger-many. This is one of the findings from the study entitled “Climate change – impact on Deutsche Bahn AG” by the renowned Potsdam Institute for Climate Impact Research (Potsdam-Institut für Klimafolgenforschung; PIK). The study basically concludes that many extreme weather events are now occurring more often, with the frequency probably increasing in the coming years.
For this reason, DB Group is committed to a five-point strategy for adaptation to ensure safe and secure rail oper-ations. More green cuttings along the train-paths, robust command and control technology, intelligent vehicle tech-nology, structural protection in risk areas and especially a further sharp reduction in CO₂ emissions are the focus of attention. VEGETATION MANAGEMENT µ8 is being expanded considerably.
Regular inspection of the air-conditioning systems in more than 4,000 interlockings, sub-interlockings and con-trol units as well as other cooling facilities is aimed at pro-tecting the command and control technology against extreme heat.
We aim to ensure that the more than 5,500 rock embank-ments and hillside cuttings with a total length of over 1,400 km do not pose a risk after heavy moisture penetra-tion near the rail tracks. For this purpose, more than 1,000 constructions such as safety nets, guard walls and catch fences provide protection against hillside movements.
Progress in climate protection
DB Group takes its climate protection responsibility seri-ously and has set itself a challenging climate target to further reduce greenhouse gas emissions. By 2030 the spe-cific greenhouse gas emissions of our worldwide transport operations will be cut by at least 50% in comparison with 2006. By doing so, we will come a big step closer to our vision of being completely emissions-free throughout DB Group in 2050.
100% eco-power in DB long-distance transport Since January 1, 2018, passengers have been traveling on our long-distance trains using only eco-power across Ger-many. In this way, our customers become active in climate protection. Since 2010, S-Bahn (metro) Hamburg has been running completely free of CO₂ emissions, contributing to the high share of eco-power in the traction current mix.
First CO₂-neutral facility for ICE openedThe first CO₂-neutral long-distance transport facility in Cologne-Nippes is a true pioneering project in the use of innovative and sustainable environmental technologies. Under construction for almost two and a half years, the CO₂-neutral ICE maintenance facility in Cologne-Nippes became operational on February 23, 2018.
Research project on the use of e-trucks in urban transportElectromobility presents a particular challenge for group- age solutions: for this industry, it is important to be fast, punctual and reliable. Due to the need for recharging, elec-tric vehicles have an apparent disadvantage compared to diesel trucks. On the other hand, they have the advantage of using just half the energy of a diesel engine.
The “iHub” research project in Berlin is examining the integration of electric trucks into the vehicle fleets of logis-tics services providers in urban transport. The project is intended to demonstrate how an IT-aided system can manage fleets of trucks efficiently when they comprise both diesel and electric vehicles. DB Schenker is cooperating with FRAMO, a manufacturer of electric trucks in Saxony, as
Environmental —We want to be CO₂-free by 2050 — 100% eco-power in long-distance transport
since January
— More than half of all freight cars refitted with whisper brakes
—Research project on use of e-trucks in urban transport
11
Interim Group Management Report―Social/Environmental
well as the software firm PTV, the Fraunhofer Institute for Transportation and Infrastructure Systems (IVI) and the Institute for Post-fossil Logistics. The project is sponsored by the BMWi.
In total, DB Schenker is now testing the use of electric vehicles for distribution transport in more than four Euro-pean cities. It is also examining the options for using e-bikes in combination with micro-hubs in seven French cities as well as in Berlin, Bergen, Oslo and Helsinki.
Saving energy with new technology and implementation of DIN EN ISO 50001By systematically adapting the energy management system to the DIN EN ISO 50001 standard, DB Netze Stations intends to cut the primary energy requirement of stations by 20% between 2010 and 2020. At present we have already achieved a reduction of 17.3%. The consistent implementa-tion of metrological accounting, with allocation of energy consumption to the smallest possible unit, right down to the individual person, has one of the biggest leverage ef-fects for motivating energy savings. Another key action is the conversion of the lighting for platforms, display cases, escalators and clocks to LED technology. Energy-efficient hoisting and conveying technology also contributes to energy savings. An example is elevators fitted with energy recovery systems. These elevators have a regenerative supply unit, which generates electricity during the down-ward part of the cycle and feeds it into the power network.
Noise reduction measures
We also want to take a pioneering role in noise reduction. In order to noticeably relieve residents near railway tracks, we intend to halve our rail transport noise by 2020, com-pared to 2000.
Further development of the noise remediation program and progress on freight cars
◊ Revision of the overall concept for the noise remedia-tion program to the now lowered limit of 57 dB(A) has been completed and will likely be published by the BMVI in the course of 2018.
◊ By the end of June 2018, about 46,000 freight cars out of about 65,000 freight cars of DB Cargo Germany’s ac -tive fleet were already rolling on quiet brake shoes. The vehicle fleet will be completely quiet by the end of 2020.
Additional noise protection in the Middle Rhine Valley Seven municipalities in the Middle Rhine Valley will receive additional noise protection in the next few years. The cap-ital expenditures planned so far for noise-reducing projects of € 73 million will increase significantly. It was necessary to revise the so-called feasibility study, as the limit was reduced from 60 to 57 dB in January 2016. Places such as Bad Salzig, Oberwesel and Rhens will also receive noise protection.
Some 70 noise protection measures, such as special noise absorbers or shielding systems on the rails, noise pro tection walls and palings, will further reduce rail transport noise in the vicinity of the “Upper Middle Rhine Valley” World Heritage site between Koblenz/Lahnstein and Bingen/Rüdesheim. The first projects to be implemented will be those that do not require an approval procedure last ing several years. An example would be the installation of noise absorption systems that are fitted directly to the rails.
Nature conservation
Many strictly protected animals and plants have settled on railway lines or in unused buildings. Our goal is to pro-tect them, both in operations and planning and in the construction and maintenance of railway facilities.
Nesting boxes, reservations and protective barriers for sand lizards, kestrels and great bustardsHundreds of rare animal species live along tracks and on DB facilities, as they can no longer find any other habitat. In order to protect this diversity of species, we are con-stantly implementing environmental measures in relation to construction projects on tracks and rail facilities. Our environmental experts take care of sand lizards, smooth snakes, bats, cranes, wild horses and wild bees. In the first half of 2018 we have planned about 2,200 new individual measures, including steps to protect endangered species, some of which have already been implemented. For ex -ample, nesting aids for the common dormouse have been installed, with the aim of increasing the attractiveness of forest land as a habitat for the strictly protected species of mammal and enticing the animals to settle there naturally. The forest stand is located directly beside areas used for construction site facilities and storage, in a project in -volving upgrading two tunnels for the Hunsrück railway.
Deutsche Bahn Group―Integrated Interim Report January – June 2018
12
Positive environment for global and European transport markets
Strong global demand promotes world tradeThe continuing growth in world trade is driving demand for goods transport; Asian markets and the USA in particular showed a high level of momentum in the first few months of 2018. The economic upturn in Germany and Europe has now flattened out. However, economic growth remains at a solid level. US protectionism, uncertainty about the outcome of the Brexit negotiations and rising oil prices pose major risks to the global economy and world trade, leaving the logistics sector particularly exposed. The demand for mobility remains robust with continued employment growth and rising wages. The passenger transport markets are strongly influenced by the respective general legal frameworks. The differences between European countries here are still great despite progressive liberalization.
Dynamic global economic growth continues – Europe’s growth is weakerIn the first half of 2018, the dynamic growth of the global economy largely continued. Drivers include a strong de mand for capital goods and strong private consumption. As a result, world trade also recorded significant growth. Risks to growth include significantly higher oil prices and conflicts over trade issues.
European economic growth has already weakened slightly, particularly due to declining exports. Uncertainties have had a negative impact on the investment climate. Inflation has recently increased, driven by higher oil prices, and is reducing disposable household income.
A similar development emerged in Germany. Domestic demand continued to perform well as a result of robust employment growth. Among the industrial sectors, the construction industry in particular grew. Falling order numbers in the industry point to an end to the boom.
The UK economy has grown weaker in the first half of 2018. Consistently high inflation rates have put pressure on the Bank of England to raise interest rates before the end of 2018. Uncertainty surrounding Brexit arrangements is also putting a strain on the business climate.
Political uncertainties have caused nervousness in the energy marketThe central hedging policy of DB Group aims to minimize energy price fluctuations. Our activities are therefore not exposed to the full impact of changes in market prices, at least not in the short term.
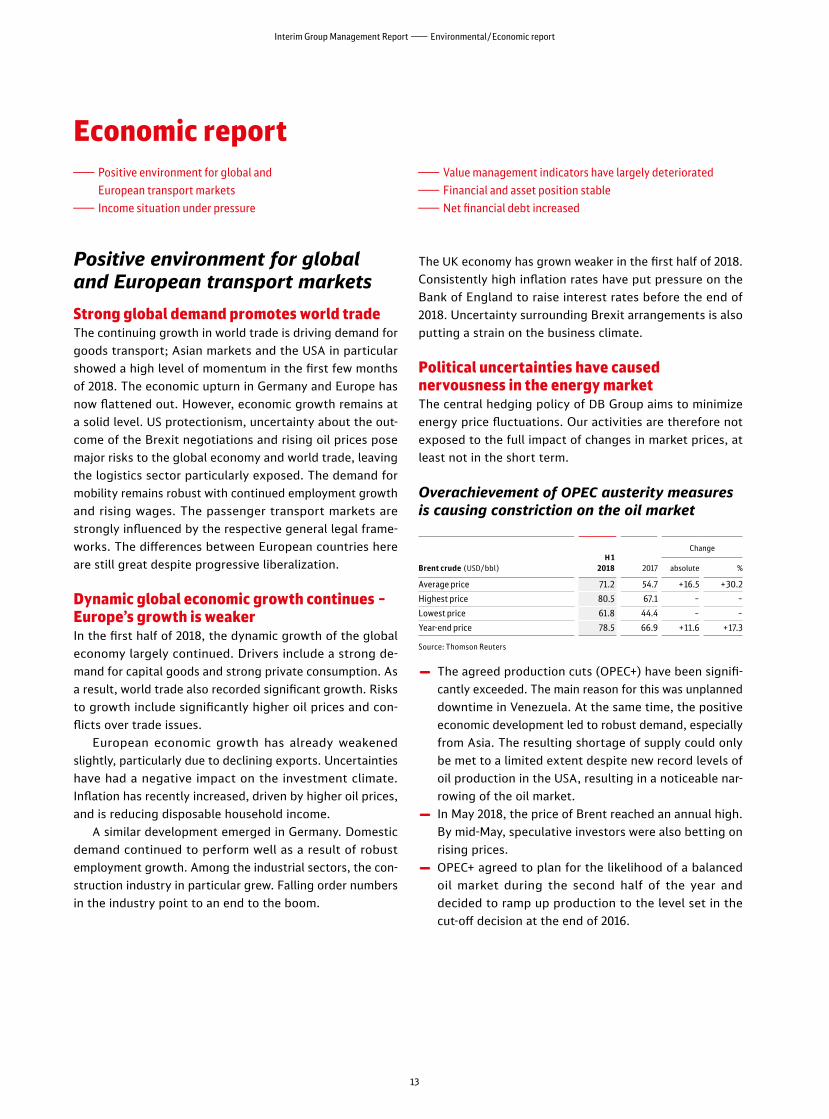
Overachievement of OPEC austerity measures is causing constriction on the oil market
Brent crude (USD/bbl)H 1
2018 2017
Change
absolute %
Average price 71.2 54.7 +16.5 + 30.2
Highest price 80.5 67.1 – –
Lowest price 61.8 44.4 – –
Year-end price 78.5 66.9 +11.6 +17.3
Source: Thomson Reuters
◊ The agreed production cuts (OPEC+) have been significantly exceeded. The main reason for this was un planned downtime in Venezuela. At the same time, the positive economic development led to robust demand, especially from Asia. The resulting shortage of supply could only be met to a limited extent despite new record levels of oil production in the USA, resulting in a noticeable narrowing of the oil market.
◊ In May 2018, the price of Brent reached an annual high. By midMay, speculative investors were also betting on rising prices.
◊ OPEC+ agreed to plan for the likelihood of a balanced oil market during the second half of the year and decided to ramp up production to the level set in the cutoff decision at the end of 2016.
!!! !!!
Economic report — Positive environment for global and
European transport markets —Income situation under pressure
—Value management indicators have largely deteriorated —Financial and asset position stable —Net financial debt increased
13
Interim Group Management Report―Environmental/Economic report

Electricity prices are developing in parallel with the coal and CO₂ markets
Base load power (following year)
H 1 2018 2017
Change
absolute %
BA SE LOAD CUR R ENT (FOLLOWING YE AR) (€/MWH)
Average price 37.7 32.4 + 5.3 +16.4
Highest price 43.9 38.4 – –
Lowest price 32.6 28.0 – –
Year-end price 43.9 37.2 + 6.7 +18.0
EMI S SION S CERTIFIC ATE S (€/T CO₂)
Average price 12.2 5.8 + 6.4 +110
Highest price 16.7 8.3 – –
Lowest price 7.6 4.3 – –
Year-end price 15.2 8.2 +7.0 + 85.4
Source: Thomson Reuters
◊ The German electricity spot market is becoming increasingly weatherdependent. The fluctuation in production from renewable energies caused significant price fluctuations due to limited predictability. High primary energy prices acted as price drivers.
◊ The electricity futures market eased after the climate targets for 2020 were revised during the coalition negotiations.
◊ The coal market saw a price dip as a result of temporary import restrictions in China. Delivery difficulties and persistently high demand in Asia drove prices up again quickly.
◊ The entry into force of the market stability reserve from 2019, which will withdraw 24% of the surplus certifi cates from the market, caused a supply shortage on the CO₂ market. In addition, discussions regarding a minimum price lured additional consumers to the market, doubling the price of emissions allowances since the beginning of the year.
Income situation not satisfactory
◊ Revenue increase due to performance gains. ◊ Rising factor costs for energy and personnel. ◊ Extensive measures to improve quality
and further digitalization. ◊ Operating profit development under pressure.
No major restrictions in comparability with the first half of 2017Trends in expenses and income in the first half of 2018 were not materially affected by CHANGES IN THE SCOPE OF CONSOL-
IDATION µ61.
Revenues increased Revenues developed positively. The growth occurred broadly across the business units and was largely driven by performance gains.
◊ The REVENUE DEVELOPMENT OF THE BUSINESS UNITS µ23 FF. was positive with the exception of DB Cargo and DB Netze Energy. DB Schenker and DB LongDistance in particular showed strong development.
◊ Negative operating effects resulted from operational restrictions (primarily STORM FRIEDERIKE µ8, heavy snowfall in Great Britain and Sweden and STRIKES IN
FRANCE µ6, GREAT BRITAIN µ31 and the Netherlands). On a comparable basis (adjusted for special items as well as scope of consolidation and exchange rate changes), revenues increased slightly more:
◊ The special items in the first half of 2018 resulted from the omission of revenue deductions in connection with ongoing proceedings (first half of 2017: from revenue deductions for previous years).
◊ Changes in the scope of consolidation affected DB Arriva (€ +20 million), DB Cargo (€ +6 million) and the Other area (€ +1 million).
◊ The effects of exchange rate changes were attributable to DB Schenker (€ –315 million), DB Arriva (€ –41 million) and DB Cargo (€ –3 million).
Deutsche Bahn Group―Integrated Interim Report January – June 2018
14

Revenues (€ million)
H 1 Change
2018 2017 absolute %
DB Group 21,555 21,066 + 489 + 2.3
Special items – 7 4 – 11 –
DB Group adjusted 21,548 21,070 + 478 + 2.3
Changes in the scope of consolidation – 27 – 1 – 26 –
Exchange rate changes 359 – + 359 –
DB Group comparable 21,880 21,069 + 811 + 3.8
External revenues by business units (€ million)
H 1 Change
2018 2017 absolute %
DB Long-Distance 2,177 2,028 + 149 + 7.3
DB Regional 4,325 4,254 + 71 + 1.7
DB Arriva 2,702 2,659 + 43 + 1.6
DB Cargo 2,112 2,150 – 38 – 1.8
DB Schenker 8,301 8,072 + 229 + 2.8
DB Netze Track 754 746 + 8 + 1.1
DB Netze Stations 297 273 + 24 + 8.8
DB Netze Energy 628 654 – 26 – 4.0
Other 252 234 + 18 + 7.7
DB Group adjusted 21,548 21,070 + 478 + 2.3
Revenue structure virtually unchanged
External revenue structure by divisions (%) H 1 2018 (H 1 2017)
There were no significant changes to the revenue structure at business unit level.
External revenues by regions (€ million)
H 1 Change
2018 2017 absolute %
Germany 12,204 11,850 + 354 + 3.0
Europe (excluding Germany) 6,745 6,669 + 76 + 1.1
Asia/Pacific 1,447 1,404 + 43 + 3.1
North America 885 878 + 7 + 0.8
Rest of world 267 269 – 2 – 0.7
DB Group adjusted 21,548 21,070 + 478 + 2.3
Revenue development in the individual regions was driven primarily by performance gains.
◊ Revenues in Germany rose, especially owing to growth in DB Netze Track, DB LongDistance and DB Regional.
◊ Revenue development in Europe (excluding Germany) was slightly positive, driven by a growth in volume at DB Arriva and DB Schenker. In addition to operational restrictions at DB Arriva and DB Cargo, negative ex change rate effects from the development of the pound sterling had a dampening effect.
◊ Revenues increased in the Asia/Pacific and North America regions as a result of business development at DB Schenker. This was partly offset by negative ex change rate effects.
External revenue structure by regions (%) H 1 2018 (H 1 2017)
Income development under pressureReconciliation to the adjusted statement of incomeThe transition to the adjusted income statement is a twostep process. The RECLASSIFICATION AND ADJUSTMENT
PROCEDURE (2017 INTEGRATED REPORT µ84) has not changed.
Operating profit figures declinedThe following presentation of profit development describes the adjusted changes in the key items of the statement of income for the first half of 2018 versus the first half of 2017. The effects of the changes in the scope of consolidation and in exchange rates are presented in the following table and are not explained further in the following section.
During the first half of 2018, exchange rate effects re duced income and expenses overall. Effects resulting from changes to the scope of consolidation were not significant.
Passenger transport 43 (42)
Other 1 (1)
Freight transport and logistics 48 (49)
Infrastructure 8 (8)
Germany 57 (56)
Rest of world 1 (1)
Europe (excluding Germany) 31 (32)
Asia/Pacific 7 (7)
North America 4 (4)
15
Interim Group Management Report―Economic report
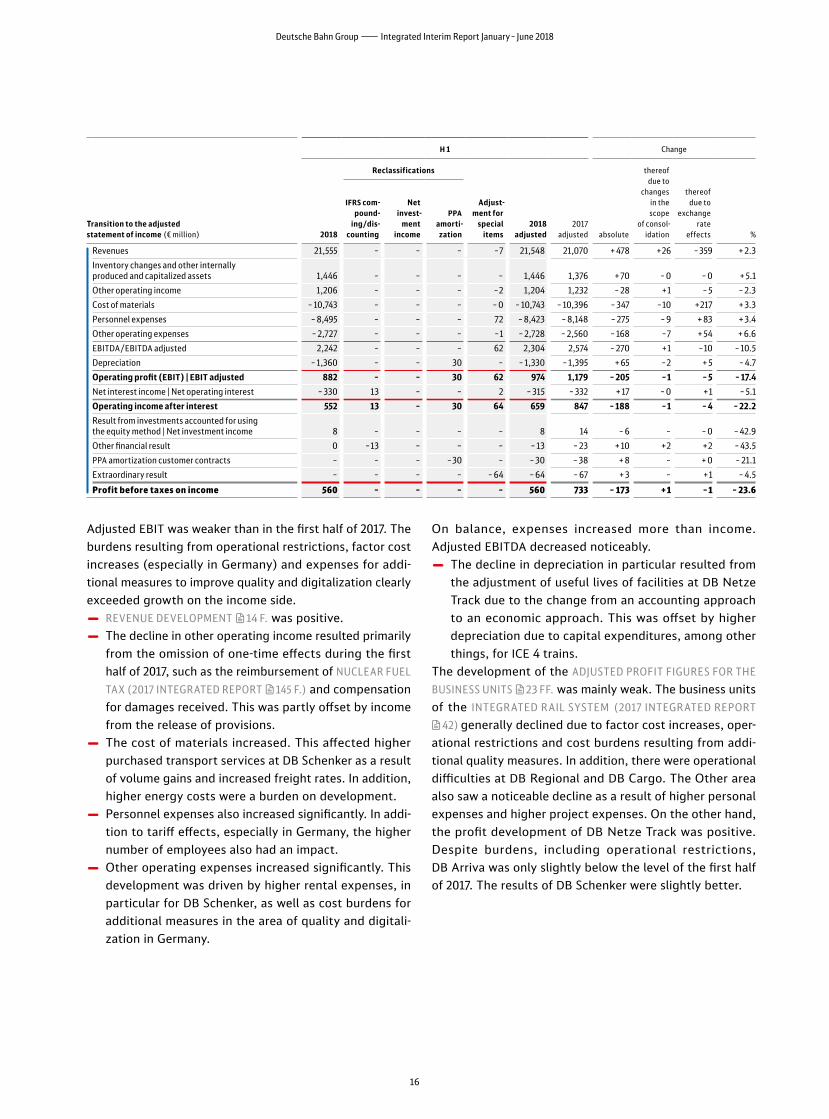
Adjusted EBIT was weaker than in the first half of 2017. The burdens resulting from operational restrictions, factor cost increases (especially in Germany) and expenses for additional measures to improve quality and digitalization clearly exceeded growth on the income side.
◊ REVENUE DEVELOPMENT µ14 F. was positive. ◊ The decline in other operating income resulted primarily from the omission of onetime effects during the first half of 2017, such as the reimbursement of NUCLEAR FUEL
TAX (2017 INTEGRATED REPORT µ145 F.) and compensation for damages received. This was partly offset by income from the release of provisions.
◊ The cost of materials increased. This affected higher purchased transport services at DB Schenker as a result of volume gains and increased freight rates. In addition, higher energy costs were a burden on development.
◊ Personnel expenses also increased significantly. In addition to tariff effects, especially in Germany, the higher number of employees also had an impact.
◊ Other operating expenses increased significantly. This development was driven by higher rental expenses, in particular for DB Schenker, as well as cost burdens for additional measures in the area of quality and digitalization in Germany.
On balance, expenses increased more than income. Adjusted EBITDA decreased noticeably.
◊ The decline in depreciation in particular resulted from the adjustment of useful lives of facilities at DB Netze Track due to the change from an accounting approach to an economic approach. This was offset by higher depreciation due to capital expenditures, among other things, for ICE 4 trains.
The development of the ADJUSTED PROFIT FIGURES FOR THE
BUSINESS UNITS µ23 FF. was mainly weak. The business units of the INTEGR ATED R AIL SYSTEM (2017 INTEGR ATED REPORT
µ42) generally declined due to factor cost increases, operational restrictions and cost burdens resulting from additional quality measures. In addition, there were operational difficulties at DB Regional and DB Cargo. The Other area also saw a noticeable decline as a result of higher personal expenses and higher project expenses. On the other hand, the profit development of DB Netze Track was positive. Despite burdens, including operational restrictions, DB Arriva was only slightly below the level of the first half of 2017. The results of DB Schenker were slightly better.
!!!
Transition to the adjusted statement of income (€ million)
H 1 Change
2018
Reclassifications
Adjust- ment for
special items
2018 adjusted
2017 adjusted absolute
thereof due to
changes in the
scope of consol-
idation
thereof due to
exchange rate
effects %
IFRS com- pound-
ing/dis- counting
Net invest-
ment income
PPA amorti-
zation
Revenues 21,555 – – – –7 21,548 21,070 + 478 +26 –359 + 2.3
Inventory changes and other internally produced and capitalized assets 1,446 – – – – 1,446 1,376 + 70 – 0 – 0 + 5.1
Other operating income 1,206 – – – –2 1,204 1,232 – 28 +1 – 5 – 2.3
Cost of materials – 10,743 – – – – 0 – 10,743 – 10,396 – 347 –10 +217 + 3.3
Personnel expenses – 8,495 – – – 72 – 8,423 – 8,148 – 275 – 9 + 83 + 3.4
Other operating expenses – 2,727 – – – –1 – 2,728 – 2,560 – 168 –7 + 54 + 6.6
EBITDA/EBITDA adjusted 2,242 – – – 62 2,304 2,574 – 270 +1 –10 – 10.5
Depreciation – 1,360 – – 30 – – 1,330 – 1,395 + 65 –2 + 5 – 4.7
Operating profit (EBIT) | EBIT adjusted 882 – – 30 62 974 1,179 – 205 –1 – 5 – 17.4
Net interest income | Net operating interest – 330 13 – – 2 – 315 – 332 + 17 – 0 +1 – 5.1
Operating income after interest 552 13 – 30 64 659 847 – 188 –1 – 4 – 22.2
Result from investments accounted for using the equity method | Net investment income 8 – – – – 8 14 – 6 – – 0 – 42.9
Other financial result 0 –13 – – – – 13 – 23 + 10 +2 +2 – 43.5
PPA amortization customer contracts – – – –30 – – 30 – 38 + 8 – + 0 – 21.1
Extraordinary result – – – – – 64 – 64 – 67 + 3 – +1 – 4.5
Profit before taxes on income 560 – – – – 560 733 – 173 + 1 –1 – 23.6
Deutsche Bahn Group―Integrated Interim Report January – June 2018
16

Stable financial position
◊ A total of four bonds (€ 2.0 billion) issued. ◊ Ratings stable.
Interest rates continue to rise
German bunds (ten-year) (%)
H 1 2018 2017
Change (percentage
points)
Average yield 0.55 0.38 + 0.17
Highest yield 0.81 0.64 + 0.17
Lowest yield 0.19 0.15 + 0.04
Year-end yield 0.30 0.42 – 0.12
Source: Thomson Reuters
EBIT adjusted by business units (€ million)
H 1 Change
2018 2017 absolute %
DB Long-Distance 206 216 – 10 – 4.6
DB Regional 214 314 – 100 – 31.8
DB Arriva 106 110 – 4 – 3.6
DB Cargo – 127 – 28 – 99 –
DB Schenker 216 208 + 8 + 3.8
DB Netze Track 483 389 + 94 + 24.2
DB Netze Stations 158 150 + 8 + 5.3
DB Netze Energy 12 44 – 32 – 72.7
Other/consolidation – 294 – 224 – 70 + 31.3
DB Group 974 1,179 – 205 – 17.4
The development of operating income after interest was slightly less negative due to an improvement of the net operating interest. Effects from lower interest rates on refinancing primarily had an effect here.
The decline in net investment income was largely driven by changes at Etihad Rail and London Overground (business was transferred to the fully consolidated Arriva Rail London in the second half of 2017).
The development in other financial result was mainly caused by effects from hedging transactions.
The extraordinary charges were somewhat lower than in the first half of 2017, but this did not materially affect the decline in profit before taxes on income.
Extraordinary charges slightly lower
Extraordinary result (€ million)
H 1
2018
thereof affecting
EBIT 2017
thereof affecting
EBIT
DB Long-Distance – – – –
DB Regional 0 0 28 28
DB Arriva 1 1 0 0
DB Cargo – 3 –3 – 1 –1
DB Schenker 0 0 – 1 –1
DB Netze Track – 1 0 – 3 –3
DB Netze Stations 7 7 – 3 –3
DB Netze Energy – – – 15 –15
Other/consolidation – 68 – 67 – 72 –72
DB Group – 64 – 62 – 67 – 67
There was no substantial change in the extraordinary result, which was composed inter alia of the following special items:
◊ Expenses in connection with restructuring measures (DB Cargo),
◊ Effects of civil proceedings in connection with infrastructure charges (DB Netze Track, DB Netze Stations),
◊ Expenses from the formation of provisions for em ployee contractual obligations (Other).
In the first half of 2017, the extraordinary result comprised, among other things, the following special items:
◊ Effects from vehicle assignments (DB Regional), ◊ Effects associated with the financing of Germany’s nuclear phaseout (DB Netze Energy) and
◊ Expenses from the formation of provisions for employee contractual obligations (Other).
Profit after taxes also weaker
Excerpt from statement of income (€ million)
H 1 Change
2018 2017 absolute %
Profit before taxes on income 560 733 – 173 – 23.6
Taxes on income 2 46 – 44 – 95.7
Actual taxes on income – 99 – 82 – 17 + 20.7
Deferred tax expenses 101 128 – 27 – 21.1
Net profit (after taxes) 562 779 – 217 – 27.9
DB AG shareholders 554 766 – 212 – 27.7
Other shareholders (non-controlling interests) 8 13 – 5 – 38.5
The decline in profit before taxes on income was exacerbated by the development of the income tax position. Higher income tax risks abroad as well as the declining development of the deferred tax position at DB AG had an effect here. The improvement in the expected use of tax loss carryforwards did not reach the level of the first half of 2017. Net profit (after taxes) therefore fell more sharply.
17
Interim Group Management Report―Economic report

After an increase in the yield on tenyear German Federal bonds until the beginning of February, it then fell during the remainder of the first half of 2018. While the US Federal Reserve (Fed) has already raised the key interest rate twice to a range of 1.75 to 2.00%, the European Central Bank (ECB) intends to slow down its extremely loose monetary policy at a very slow rate. Although the bond purchase program will be cut by half from October 2018 and completely phased out by the end of the year, it is unlikely that the ECB will raise interest rates until the summer of 2019. Other curative effects on bonds included uncertainty due to trade disputes, driven mainly by the USA, and the election of a Eurosceptic government in Italy.
Financial management stable
(€ billion)Volume
Jun 30, 2018thereof utilized
Volume Dec 31, 2017
thereof utilized
European debt issuance program 25.0 19.2 25.0 19.3
Australian debt issuance program (AUD 5 billion) 3.4 0.7 3.4 0.5
Multi-currency multi-issuer commercial paper program 2.0 1.1 2.0 –
Guaranteed unutilized credit facilities 2.0 – 2.0 –
In addition to aiming for a sustained rise in enterprise value, DB Group’s financial management focuses on maintaining a capital structure that will ensure excellent credit ratings. Please see VALUE MANAGEMENT µ19 F. for detailed information on the key figures used: redemption coverage, gearing and net financial debt/EBITDA.
◊ DB Group has access to a European debt issuance program (EDIP) for longterm debt financing. Under the EDIP, two Euro bonds were issued by DB Finance with durations of 10 and 15.5 years and a volume of € 1,000 million and € 750 million. In return, two bonds of € 1,600 million and € 300 million were redeemed. As a result, the absolute utilization of the EDIP as of June 30, 2018 decreased slightly by € 0.1 billion compared with the end of 2017. The degree of utilization as of June 30, 2018 is 77% (as of December 31, 2017: 77%).
◊ We also have an Australian Debt Issuance Program (Kangaroo Program). Under this program, a bond was issued and an existing bond was increased (durations: 14.5 and 10 years; total volume € 228 million (AUD 150 million and AUD 206 million)).
◊ In the area of shortterm debt financing, a multicurrency multiissuer commercial paper program with a volume of € 2 billion remains available.
◊ As of June 30, 2018 we also had guaranteed unutilized credit facilities with a remaining term of between 1.0 and 2.0 years, and another guaranteed unutilized credit facility of € 0.1 billion (as of December 31, 2017: € 0.1 billion).
◊ In addition, we were able to rely on credit lines of € 2.2 billion for the operating business (as of December 31, 2017: € 2.2 billion). These credit lines, which are made available to our subsidiaries around the world, include provisions for financing working capital as well as sureties for payment.
No major finance leases or sale and leaseback agreements were concluded during the first half of 2018.
Four bonds issued
Bond issues H 1 2018/ISIN Issuer
Cur- rency
Volume (mil- lion)
Volume (€ mil-
lion)Coupon
(%)Matu-
rityTerm
(years)
XS1752475720DB
Finance EUR 1,000 1,000 1.000Dec
2027 10.0
XS1772374770DB
Finance EUR 750 750 1.625Aug
2033 15.5
AU3CB0248250 1)DB
Finance AUD 150 94 4.050Oct
2032 14.5
AU3CB0253623 1)DB
Finance AUD 206 133 3.494Jun
2028 10.0
1) Private placement.
Via the Group financing company DB Finance, we issued four bonds with a value of just under € 2.0 billion during the first half of 2018. At the beginning of July we issued another CHF BOND µ49. The funds were raised to refinance due liabilities. The proceeds of bonds not issued in euros were swapped into euros.
Demand for the two public issues under the European Debt Issuance program mainly originated from institutional investors in Europe and Asia.
In addition, we issued two more bonds under the newly established Australian Debt Issuance Program. The two private placements were placed with institutional investors in Asia (mainly in Japan).
Deutsche Bahn Group―Integrated Interim Report January – June 2018
18

Value management ratios predominantly under pressure
◊ Operating profit development negatively impacts ROCE, redemption coverage and net financial debt/EBITDA.
◊ Disproportionate increase in equity drives gearing.
ROCE falling
ROCE (€ million)
H 1 Change
2018 2017 absolute %
EBIT adjusted 1) 974 1,179 – 205 – 17.4
Capital employed as of Jun 30 2) 36,201 34,506 + 1,695 + 4.9
ROCE (%) 5.4 6.8 – –
Target value (%) ≥ 8.0 ≥ 9.0 – –
1) Figures extrapolated to the full year for calculation purposes. 2) Figure as of June 30, 2017 adjusted µ60 F.
ROCE fell as a result of the decline in adjusted EBIT combined with an increase in capital employed. The increase in capital employed resulted mainly from capital expenditure activities and working capital effects.
Generally weak development of key debt ratiosRedemption coverage declining
Redemption coverage (€ million)
H 1 Change
2018 2017 absolute %
EBITDA adjusted 1) 2,304 2,574 – 270 – 10.5
Net operating interest 1) – 315 – 332 + 17 – 5.1
Depreciation share leasing rate 1) 553 522 + 31 + 5.9
Original tax expenses 1) – 99 – 82 – 17 + 20.7
Operating cash flow after taxes 2,443 2,682 – 239 – 8.9
Net financial debt as of Jun 30 19,704 19,030 + 674 + 3.5
Present value operate leases as of Jun 30 4,875 4,798 + 77 + 1.6
Adjusted net financial debt as of Jun 30 24,579 23,828 + 751 + 3.2
Pension obligations as of Jun 30 2) 4,269 3,958 + 311 +7.9
Adjusted net debt as of Jun 30 2) 28,848 27,786 +1,062 + 3.8
Redemption coverage (%) 16.9 19.3 – –
Target value (%) ≥ 25.0 ≥ 25.0 – –
1) Figures extrapolated to the full year for calculation purposes.2) Figure as of June 30, 2017 adjusted µ60 F.
A significant decline in operating cash flow after taxes and a simultaneous increase in adjusted net debt led to a decline in redemption coverage. In addition to net financial debt, pension obligations also increased.
Gearing improved
Gearing as of June 30 (€ million) 2018 2017
Change
absolute %
Net financial debt 19,704 19,030 + 674 + 3.5
Equity 1) 14,143 13,362 + 781 + 5.8
Gearing (%) 139 142 – –
Target value (%) 100 100 – –
1) Figure as of 30 June 2017 adjusted µ60 F.
Gearing has improved slightly, but it remains above the target value of 100%. The increase in EQUITY µ22 through the CAPITAL MEASURES PUT IN PLACE BY THE FEDERAL GOVERN-
MENT (2017 INTEGRATED REPORT µ43) in the previous year was decisive for this development. Higher NET FINANCIAL DEBT
µ20 F. partially compensated for this effect.
Ratings stable
Ratings for DB AGFirst
issued
Last con-
firmed
Current ratings
Short- term
Long- term Outlook
S&P Global RatingsMay 16,
2000Jul 15,
2016 A–1+ AA– Stable
Moody’sMay 16,
2000Sep 28,
2015 P–1 Aa1 Stable
The creditworthiness of DB Group is constantly monitored and assessed by the rating agencies S&P Global Ratings (S&P) and Moody’s. In the first half of 2018, Moody’s published an update on the assessments of DB AG and left the ratings and outlook unchanged.
Further information on the topic ΠRATING (WWW.DB.DE/
RATINGE) and the full analyses of the rating agencies for DB AG are available on our Investor Relations Web site.
19
Interim Group Management Report―Economic report
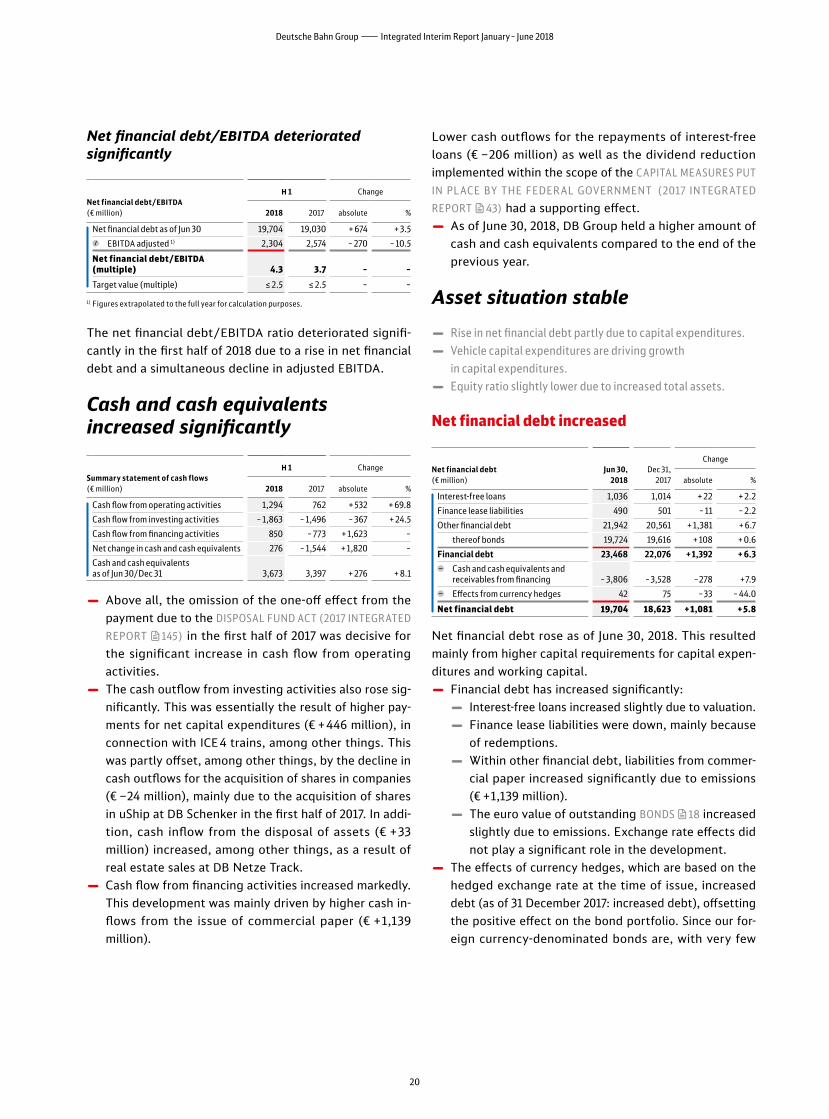
Net financial debt/EBITDA deteriorated significantly
Net financial debt/EBITDA (€ million)
H 1 Change
2018 2017 absolute %
Net financial debt as of Jun 30 19,704 19,030 + 674 + 3.5
EBITDA adjusted 1) 2,304 2,574 – 270 – 10.5
Net financial debt/EBITDA (multiple) 4.3 3.7 – –
Target value (multiple) ≤ 2.5 ≤ 2.5 – –
1) Figures extrapolated to the full year for calculation purposes.
The net financial debt/EBITDA ratio deteriorated significantly in the first half of 2018 due to a rise in net financial debt and a simultaneous decline in adjusted EBITDA.
Cash and cash equivalents increased significantly
Summary statement of cash flows (€ million)
H 1 Change
2018 2017 absolute %
Cash flow from operating activities 1,294 762 + 532 + 69.8
Cash flow from investing activities – 1,863 – 1,496 – 367 + 24.5
Cash flow from financing activities 850 – 773 + 1,623 –
Net change in cash and cash equivalents 276 – 1,544 + 1,820 –
Cash and cash equivalents as of Jun 30/Dec 31 3,673 3,397 + 276 + 8.1
◊ Above all, the omission of the oneoff effect from the payment due to the DISPOSAL FUND ACT (2017 INTEGRATED
REPORT µ145) in the first half of 2017 was decisive for the significant increase in cash flow from operating activities.
◊ The cash outflow from investing activities also rose significantly. This was essentially the result of higher payments for net capital expenditures (€ +446 million), in connection with ICE 4 trains, among other things. This was partly offset, among other things, by the decline in cash outflows for the acquisition of shares in companies (€ –24 million), mainly due to the acquisition of shares in uShip at DB Schenker in the first half of 2017. In addition, cash inflow from the disposal of assets (€ +33 million) increased, among other things, as a result of real estate sales at DB Netze Track.
◊ Cash flow from financing activities increased markedly. This development was mainly driven by higher cash inflows from the issue of commercial paper (€ +1,139 million).
Lower cash outflows for the repayments of interestfree loans (€ –206 million) as well as the dividend reduction implemented within the scope of the CAPITAL MEASURES PUT
IN PLACE BY THE FEDER AL GOVERNMENT (2017 INTEGR ATED
REPORT µ43) had a supporting effect. ◊ As of June 30, 2018, DB Group held a higher amount of cash and cash equivalents compared to the end of the previous year.
!!!
Asset situation stable
◊ Rise in net financial debt partly due to capital expenditures. ◊ Vehicle capital expenditures are driving growth
in capital expenditures. ◊ Equity ratio slightly lower due to increased total assets.
Net financial debt increased
Net financial debt (€ million)
Jun 30, 2018
Dec 31, 2017
Change
absolute %
Interest-free loans 1,036 1,014 + 22 + 2.2
Finance lease liabilities 490 501 – 11 – 2.2
Other financial debt 21,942 20,561 + 1,381 + 6.7
thereof bonds 19,724 19,616 + 108 + 0.6
Financial debt 23,468 22,076 +1,392 + 6.3
Cash and cash equivalents and receivables from financing – 3,806 –3,528 –278 +7.9
Effects from currency hedges 42 75 –33 – 44.0
Net financial debt 19,704 18,623 + 1,081 + 5.8
Net financial debt rose as of June 30, 2018. This resulted mainly from higher capital requirements for capital expenditures and working capital.
◊ Financial debt has increased significantly: ◊ Interestfree loans increased slightly due to valuation. ◊ Finance lease liabilities were down, mainly because of redemptions.
◊ Within other financial debt, liabilities from commercial paper increased significantly due to emissions (€ +1,139 million).
◊ The euro value of outstanding BONDS µ18 increased slightly due to emissions. Exchange rate effects did not play a significant role in the development.
◊ The effects of currency hedges, which are based on the hedged exchange rate at the time of issue, increased debt (as of 31 December 2017: increased debt), offsetting the positive effect on the bond portfolio. Since our foreign currencydenominated bonds are, with very few
Deutsche Bahn Group―Integrated Interim Report January – June 2018
20
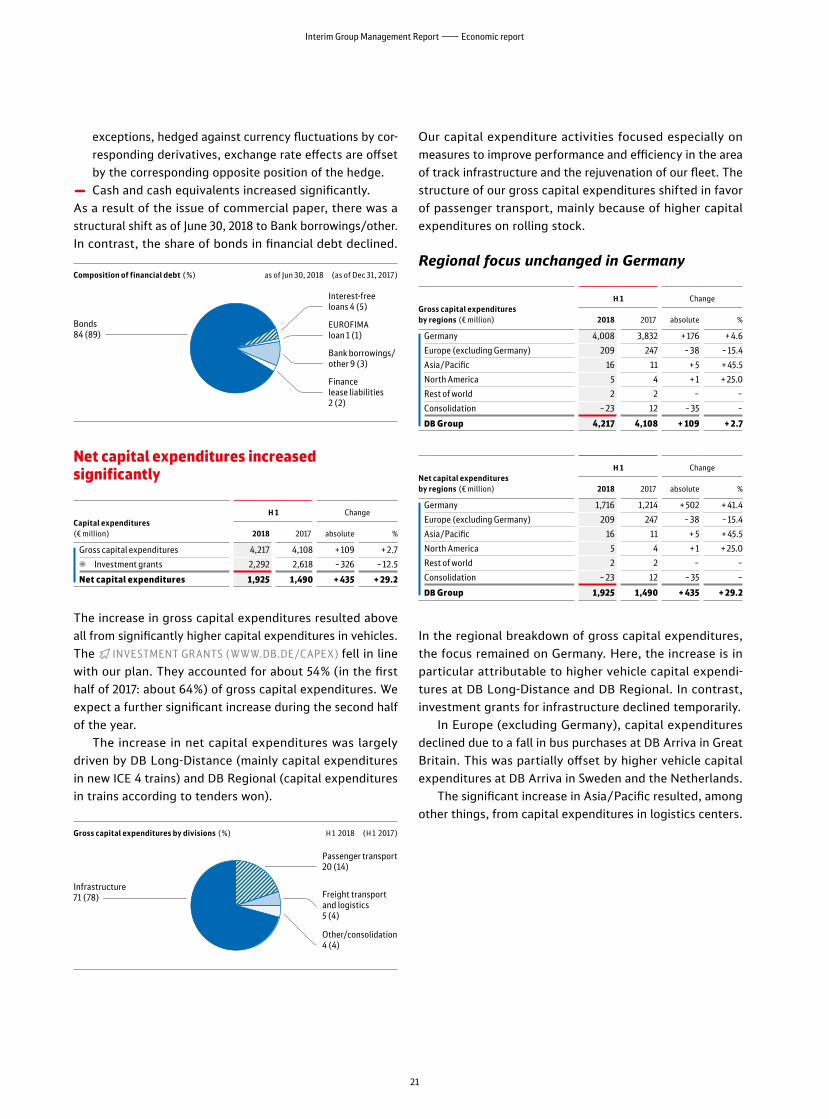
exceptions, hedged against currency fluctuations by corresponding derivatives, exchange rate effects are offset by the corresponding opposite position of the hedge.
◊ Cash and cash equivalents increased significantly.As a result of the issue of commercial paper, there was a structural shift as of June 30, 2018 to Bank borrowings/other. In contrast, the share of bonds in financial debt declined.
Composition of financial debt (%) as of Jun 30, 2018 (as of Dec 31, 2017)
Net capital expenditures increased significantly
Capital expenditures (€ million)
H 1 Change
2018 2017 absolute %
Gross capital expenditures 4,217 4,108 + 109 + 2.7
Investment grants 2,292 2,618 – 326 – 12.5
Net capital expenditures 1,925 1,490 + 435 + 29.2
The increase in gross capital expenditures resulted above all from significantly higher capital expenditures in vehicles. The ΠINVESTMENT GRANTS (WWW.DB.DE/CAPEX) fell in line with our plan. They accounted for about 54% (in the first half of 2017: about 64%) of gross capital expenditures. We expect a further significant increase during the second half of the year.
The increase in net capital expenditures was largely driven by DB LongDistance (mainly capital expenditures in new ICE 4 trains) and DB Regional (capital expenditures in trains according to tenders won).
Gross capital expenditures by divisions (%) H 1 2018 (H 1 2017)
Our capital expenditure activities focused especially on measures to improve performance and efficiency in the area of track infrastructure and the rejuvenation of our fleet. The structure of our gross capital expenditures shifted in favor of passenger transport, mainly because of higher capital expenditures on rolling stock.
Regional focus unchanged in Germany
Gross capital expenditures by regions (€ million)
H 1 Change
2018 2017 absolute %
Germany 4,008 3,832 + 176 + 4.6
Europe (excluding Germany) 209 247 – 38 – 15.4
Asia/Pacific 16 11 + 5 + 45.5
North America 5 4 + 1 + 25.0
Rest of world 2 2 – –
Consolidation – 23 12 – 35 –
DB Group 4,217 4,108 + 109 + 2.7
Net capital expenditures by regions (€ million)
H 1 Change
2018 2017 absolute %
Germany 1,716 1,214 + 502 + 41.4
Europe (excluding Germany) 209 247 – 38 – 15.4
Asia/Pacific 16 11 + 5 + 45.5
North America 5 4 + 1 + 25.0
Rest of world 2 2 – –
Consolidation – 23 12 – 35 –
DB Group 1,925 1,490 + 435 + 29.2
In the regional breakdown of gross capital expenditures, the focus remained on Germany. Here, the increase is in particular attributable to higher vehicle capital expenditures at DB LongDistance and DB Regional. In contrast, investment grants for infrastructure declined temporarily.
In Europe (excluding Germany), capital expenditures declined due to a fall in bus purchases at DB Arriva in Great Britain. This was partially offset by higher vehicle capital expenditures at DB Arriva in Sweden and the Netherlands.
The significant increase in Asia/Pacific resulted, among other things, from capital expenditures in logistics centers.
Bonds 84 (89)
Interest-free loans 4 (5)
EUROFIMA loan 1 (1)
Bank borrowings/other 9 (3)
Finance lease liabilities 2 (2)
Infrastructure 71 (78)
Passenger transport 20 (14)
Freight transport and logistics 5 (4)
Other/consolidation 4 (4)
21
Interim Group Management Report―Economic report

Equity almost unchanged
Balance sheet (€ million)Jun 30,
2018Dec 31,
2017
Change
absolute %
Total assets 58,155 56,436 + 1,719 + 3.0
A S SET S
Non-current assets 46,310 45,625 + 685 + 1.5
Current assets 11,845 10,811 + 1,034 + 9.6
EQ UIT Y AND LIABILITIE S
Equity 14,143 14,238 – 95 – 0.7
Non-current liabilities 28,179 27,510 + 669 + 2.4
Current liabilities 15,833 14,688 + 1,145 + 7.8
Balance sheet structure (%) As of Jun 30, 2018 (as of Dec 31, 2017)
There were no material changes to IFRS regulations for DB Group’s consolidation and accounting principles that would result in any changes to the consolidated financial statements.
Total assets rose slightly: ◊ Noncurrent assets were slightly higher. The increase in property, plant and equipment (€ +553 million) resulting from the acquisition of vehicles by DB LongDistance was particularly decisive here. In addition, deferred tax assets increased (€ +96 million) as a result of improved tax earnings expectations of DB AG compared to the end of 2017.
◊ The rise in current assets was mainly attributable to the increase in trade receivables (€ +315 million) and other current receivables and assets (€ +310 million), particularly at DB Schenker and DB Sales. Cash and cash equivalents also increased (€ +276 million).
In structural terms this did not result in any material change on the asset side.
Equity fell slightly on the liabilities side. Increasing effects mainly resulted from the generated net profit (€ +562 million) and the increase in the changes recognized in the reserves in connection with volatility of hedge transactions (€ +74 million). This was partly offset mainly by the dividend payment to the Federal Government (€ –450 million) and the interestrelated changes to the changes recognized in the reserves in connection with the revaluation of pensions (€ –294 million).
The equity ratio also fell slightly as a result of the increased total assets.
◊ Noncurrent liabilities increased as a result of: ◊ higher noncurrent FINANCIAL DEBT µ20 F. (€ +539 million) as a result of the issue of new bonds and an increase in pension obligations (€ +329 million) as a result of a slight decline in the revaluation rate.
◊ In contrast, other provisions (€ –89 million) and deferred income (€ –89 million) declined.
◊ Current liabilities increased even more. This was primarily the result of the following:
◊ increased current financial debt (€ +853 million) as a result of the issue of commercial paper,
◊ higher deferred income (€ +160 million) and ◊ increased current other liabilities (€ +115 million), among others due to seasonal staffing effects.
In structural terms of equity and liabilities, the ratio of current liabilities has increased as a result. The share of non current liabilities was almost unchanged.
Purchasing volume increased slightlyThe purchasing volume corresponds to the contractual obligation which DB Group has entered into with suppliers. On subsequent realization these become capital expenditures or expenses (mainly cost of materials and other operating expenses). The purchase volume amounted to € 16.7 billion in the first half of 2018 (in the first half of 2017: € 14.5 billion).
◊ In the area of freight and forwarding services, the purchasing volume remained at a consistently high level of € 5.2 billion (in the first half of 2017: € 5.2 billion).
◊ For industrial products, the purchasing volume in creased to € 4.0 billion, compared to € 3.2 billion in the first half of 2017.
◊ Construction and engineering services recorded an increase of € 3.2 billion (in the first half of 2017: € 2.5 billion).
◊ Third party services also increased to € 2.8 billion (in the first half of 2017: € 2.2 billion).
◊ Cable and pipebound power and fuels increased slightly from € 1.4 billion in the first half of 2017 to € 1.5 billion in the first half of 2018.
The share of local purchasing volume in Germany increased to 86% (in the first half of 2017: 84%).
A S SET S
Non-current assets 79.6 (80.8)
Current assets 20.4 (19.2)
EQ UIT Y ANDLIABILITIE S
Equity 24.3 (25.2)
Current liabilities 27.2 (26.0)
Non-current liabilities 48.5 (48.8)
!!!
Deutsche Bahn Group―Integrated Interim Report January – June 2018
22
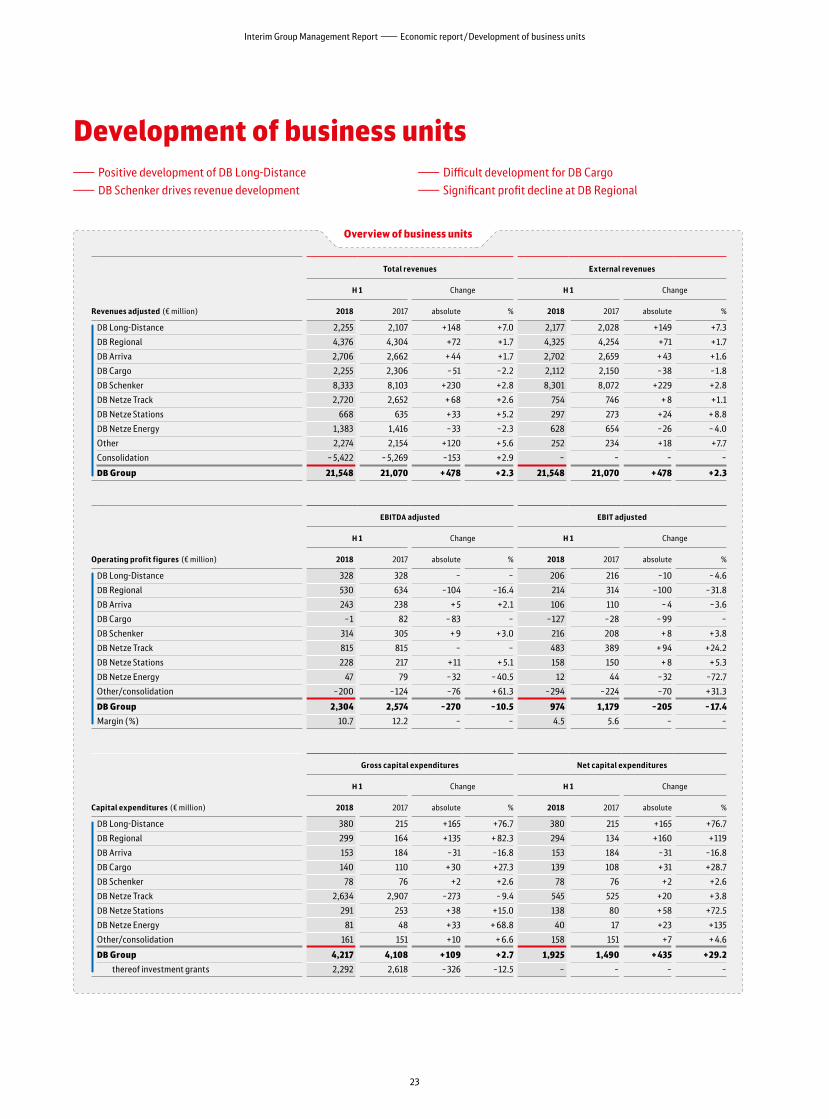
Development of business units
Revenues adjusted (€ million)
Total revenues External revenues
H 1 Change H 1 Change
2018 2017 absolute % 2018 2017 absolute %
DB Long-Distance 2,255 2,107 +148 +7.0 2,177 2,028 +149 +7.3
DB Regional 4,376 4,304 +72 +1.7 4,325 4,254 +71 +1.7
DB Arriva 2,706 2,662 + 44 +1.7 2,702 2,659 + 43 +1.6
DB Cargo 2,255 2,306 – 51 –2.2 2,112 2,150 –38 –1.8
DB Schenker 8,333 8,103 +230 +2.8 8,301 8,072 +229 +2.8
DB Netze Track 2,720 2,652 + 68 +2.6 754 746 + 8 +1.1
DB Netze Stations 668 635 + 33 + 5.2 297 273 +24 + 8.8
DB Netze Energy 1,383 1,416 –33 –2.3 628 654 –26 – 4.0
Other 2,274 2,154 +120 + 5.6 252 234 +18 +7.7
Consolidation – 5,422 – 5,269 –153 +2.9 – – – –
DB Group 21,548 21,070 + 478 + 2.3 21,548 21,070 + 478 + 2.3
Operating profit figures (€ million)
EBITDA adjusted EBIT adjusted
H 1 Change H 1 Change
2018 2017 absolute % 2018 2017 absolute %
DB Long-Distance 328 328 – – 206 216 –10 – 4.6
DB Regional 530 634 –104 –16.4 214 314 –100 –31.8
DB Arriva 243 238 + 5 +2.1 106 110 – 4 –3.6
DB Cargo –1 82 – 83 – –127 –28 – 99 –
DB Schenker 314 305 + 9 + 3.0 216 208 + 8 + 3.8
DB Netze Track 815 815 – – 483 389 + 94 +24.2
DB Netze Stations 228 217 +11 + 5.1 158 150 + 8 + 5.3
DB Netze Energy 47 79 –32 – 40.5 12 44 –32 –72.7
Other/consolidation –200 –124 –76 + 61.3 –294 –224 –70 + 31.3
DB Group 2,304 2,574 –270 –10.5 974 1,179 –205 –17.4
Margin (%) 10.7 12.2 – – 4.5 5.6 – –
Capital expenditures (€ million)
Gross capital expenditures Net capital expenditures
H 1 Change H 1 Change
2018 2017 absolute % 2018 2017 absolute %
DB Long-Distance 380 215 +165 +76.7 380 215 +165 +76.7
DB Regional 299 164 +135 + 82.3 294 134 +160 +119
DB Arriva 153 184 –31 –16.8 153 184 –31 –16.8
DB Cargo 140 110 + 30 +27.3 139 108 + 31 +28.7
DB Schenker 78 76 +2 +2.6 78 76 +2 +2.6
DB Netze Track 2,634 2,907 –273 – 9.4 545 525 +20 + 3.8
DB Netze Stations 291 253 + 38 +15.0 138 80 + 58 +72.5
DB Netze Energy 81 48 + 33 + 68.8 40 17 +23 +135
Other/consolidation 161 151 +10 + 6.6 158 151 +7 + 4.6
DB Group 4,217 4,108 + 109 + 2.7 1,925 1,490 + 435 + 29.2
thereof investment grants 2,292 2,618 –326 –12.5 – – – –
Overview of business units
—Positive development of DB Long-Distance —DB Schenker drives revenue development
—Difficult development for DB Cargo —Significant profit decline at DB Regional
23
Interim Group Management Report―Economic report/Development of business units

Passenger transport
Continuing growth in the German marketThe overall market at the beginning of 2018 saw moderate but steady increase in volume sold at the level of the cor-responding period in the previous year. The key develop-ments were:
◊ Continued increase in employment figures and dispos-able income with inflation rising slightly.
◊ Moderate increase in volume sold of motorized indi-vidual transport despite rising fuel prices.
◊ Development of domestic air transport significantly lower than in the previous year due to the Air Berlin insolvency.
◊ Slight recovery of long-distance bus services after market consolidation in the previous year.
◊ Moderately rising prices in motorized individual transport and long-distance bus services after a significant increase in 2017 and in the flight segment after a short-term in -crease in prices due to the Air Berlin insolvency at the end of 2017 while rail prices remained relatively stable.
Rail passenger transport ◊ Rail passenger transport posted a significant growth in volume sold in the first quarter (+2.7%) compared with the corresponding period in the previous year, sup-ported by continued good income and employment development.
◊ Local rail passenger transport with a slight decline in the first quarter (– 0.1%) and intense competition, DB Regional with comparable negative performance (–0.3%).
◊ Long-distance rail passenger transport reported strong growth in the first quarter (+6.7%), supported by ex-tended DB Long-Distance services.
Public road passenger transport ◊ Slight increase in volume sold for scheduled public road passenger transport services in the first quarter (+1.2%). Both market segments – local and long-distance bus services – posted positive development.
◊ FlixBus is the dominant provider with a market share of more than 90% and has moderately expanded its service following a consolidation phase. IC Bus is the third-largest provider with a market share of about 2%.
◊ Slight increase in local bus transport in the first quarter (+1.0%) due to an increasing population and employ-ment figures, especially in metropolitan areas. DB bus traffic experienced declines (–5.7%) due to falling demand for rural local scheduled transport and adjust-ment of the supply portfolio.
Europe-wide gains for trains and busesThe development of the overall European market was sup-ported in many European countries at the beginning of 2018 by positive environmental conditions with increasing em -ployment and rising incomes. Electromobility is in creasing in relevance across Europe in tenders and fleet renewals in bus transport, supported by the diesel driving bans announced in many cities.
◊ New growth and competition impulses can be identi-fied, including in the following countries:
◊ Finland, Lithuania, Moldova and Norway, which are preparing to open up their railway markets; Norway will award its first tendered transport con-tract in October.
◊ Lithuania has separated its traffic and infrastructure operations; Finland is outsourcing new companies for its train fleet and real estate.
◊ French Senate approves RAIL REFORM µ6 with market opening in rail passenger transport.
◊ Slight increase in volume sold in European rail pas-senger transport in
◊ Germany, ◊ the Czech Republic due to the expansion of CD in international long-distance transport, especially on the Prague – Vienna – Graz and Prague – Berlin – Ham-burg lines, as well as through intramodal competi-tion with LEO Express and RegioJet,
◊ Spain due to the accelerated distribution of low-cost high-speed tickets and quality improvements by Renfe.
◊ European long-distance bus services remain strong due to new partnerships and general frameworks. In May 2018, the EU Transport Committee decided to introduce a bus toll from 2020. FlixBus also remains Europe’s market leader.
◊ Bus operators National Express (GB), Ouibus (FR), Marino Bus (IT) and ALSA (ES) are forming an alli-ance in response to FlixBus’s dominance.
◊ FlixBus has entered into a distribution partnership with the Swiss Eurobus, which has received a license for three long-distance routes in Switzerland until 2020.
Deutsche Bahn Group―Integrated Interim Report January – June 2018
24
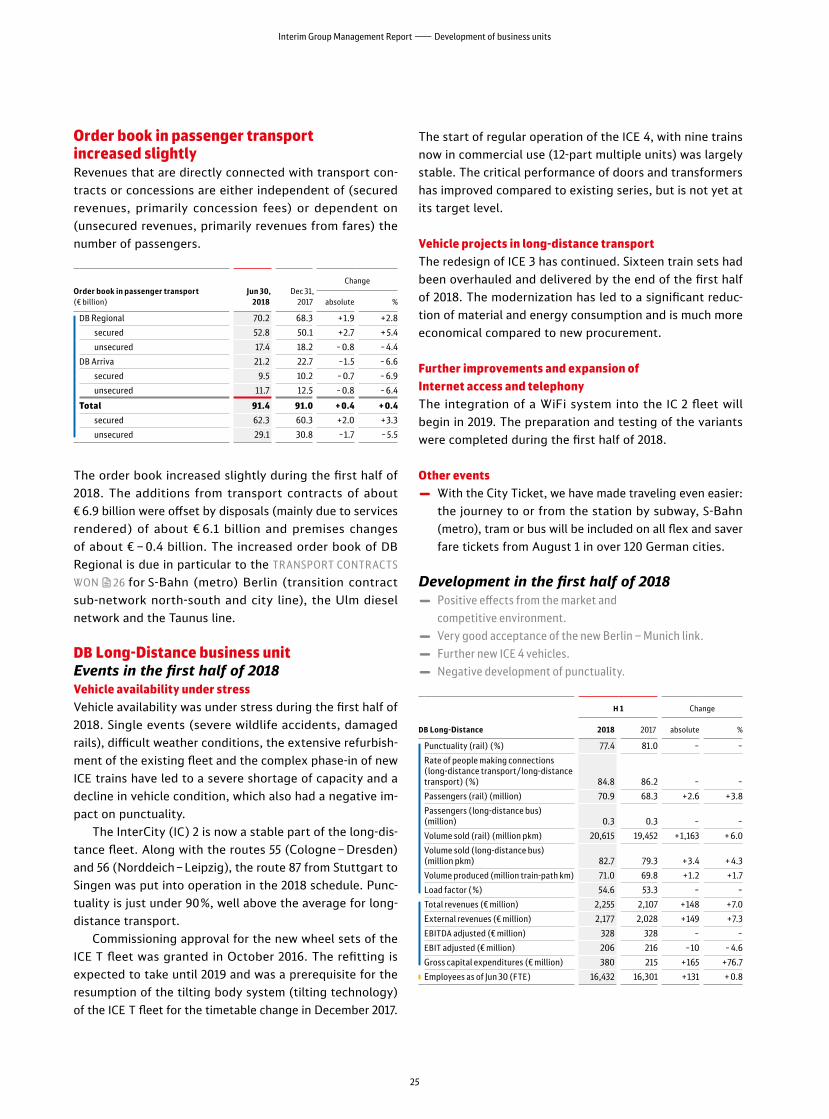
Order book in passenger transport increased slightlyRevenues that are directly connected with transport con-tracts or concessions are either independent of (secured revenues, primarily concession fees) or dependent on (unsecured revenues, primarily revenues from fares) the number of passengers.
Order book in passenger transport (€ billion)
Jun 30, 2018
Dec 31, 2017
Change
absolute %
DB Regional 70.2 68.3 +1.9 +2.8
secured 52.8 50.1 +2.7 + 5.4
unsecured 17.4 18.2 – 0.8 – 4.4
DB Arriva 21.2 22.7 –1.5 – 6.6
secured 9.5 10.2 – 0.7 – 6.9
unsecured 11.7 12.5 – 0.8 – 6.4
Total 91.4 91.0 + 0.4 + 0.4
secured 62.3 60.3 +2.0 + 3.3
unsecured 29.1 30.8 –1.7 – 5.5
The order book increased slightly during the first half of 2018. The additions from transport contracts of about € 6.9 billion were offset by disposals (mainly due to services rendered) of about € 6.1 billion and premises changes of about € –0.4 billion. The increased order book of DB Regio nal is due in particular to the TRANSPORT CONTRACTS
WON µ26 for S-Bahn (metro) Berlin (transition contract sub-network north-south and city line), the Ulm diesel network and the Taunus line.
DB Long-Distance business unitEvents in the first half of 2018Vehicle availability under stressVehicle availability was under stress during the first half of 2018. Single events (severe wildlife accidents, damaged rails), difficult weather conditions, the extensive refurbish-ment of the existing fleet and the complex phase-in of new ICE trains have led to a severe shortage of capacity and a decline in vehicle condition, which also had a negative im -pact on punctuality.
The InterCity (IC) 2 is now a stable part of the long-dis- tance fleet. Along with the routes 55 (Cologne – Dresden) and 56 (Norddeich – Leipzig), the route 87 from Stuttgart to Singen was put into operation in the 2018 schedule. Punc-tuality is just under 90%, well above the average for long- distance transport.
Commissioning approval for the new wheel sets of the ICE T fleet was granted in October 2016. The refitting is expected to take until 2019 and was a prerequisite for the resumption of the tilting body system (tilting technology) of the ICE T fleet for the timetable change in December 2017.
The start of regular operation of the ICE 4, with nine trains now in commercial use (12-part multiple units) was largely stable. The critical performance of doors and transformers has improved compared to existing series, but is not yet at its target level.
Vehicle projects in long-distance transportThe redesign of ICE 3 has continued. Sixteen train sets had been overhauled and delivered by the end of the first half of 2018. The modernization has led to a significant reduc-tion of material and energy consumption and is much more economical compared to new procurement.
Further improvements and expansion of Internet access and telephony The integration of a WiFi system into the IC 2 fleet will begin in 2019. The preparation and testing of the variants were completed during the first half of 2018.
Other events ◊ With the City Ticket, we have made traveling even easier: the journey to or from the station by subway, S-Bahn (metro), tram or bus will be included on all flex and saver fare tickets from August 1 in over 120 German cities.
Development in the first half of 2018 ◊ Positive effects from the market and
competitive environment. ◊ Very good acceptance of the new Berlin – Munich link. ◊ Further new ICE 4 vehicles. ◊ Negative development of punctuality.
DB Long-Distance
H 1 Change
2018 2017 absolute %
Punctuality (rail) (%) 77.4 81.0 – –
Rate of people making connections (long-distance transport/long-distance transport) (%) 84.8 86.2 – –
Passengers (rail) (million) 70.9 68.3 +2.6 + 3.8
Passengers (long-distance bus) (million) 0.3 0.3 – –
Volume sold (rail) (million pkm) 20,615 19,452 +1,163 + 6.0
Volume sold (long-distance bus) (million pkm) 82.7 79.3 + 3.4 + 4.3
Volume produced (million train-path km) 71.0 69.8 +1.2 +1.7
Load factor (%) 54.6 53.3 – –
Total revenues (€ million) 2,255 2,107 +148 +7.0
External revenues (€ million) 2,177 2,028 +149 +7.3
EBITDA adjusted (€ million) 328 328 – –
EBIT adjusted (€ million) 206 216 –10 – 4.6
Gross capital expenditures (€ million) 380 215 +165 +76.7
Employees as of Jun 30 (FTE) 16,432 16,301 +131 + 0.8
!!!
25
Interim Group Management Report―Development of business units

Punctuality declined due to the more heavily utilized infra-structure and high number of disruptions to the command and control technology, vehicles and provision of the vehi-cles. As a result of the decrease in punctuality, the rate ofpeople making long-distance transport connections also declined slightly.
The performance development in rail transport was positive.
◊ The number of passengers and volume sold increased. The main drivers of this development were the expan-sion of services as a result of the new Berlin – Munich link (German unification transport projects no. 8) and the Gäubahn. Market-driven stimuli were also positive. On the other hand, weather-related restrictions had a damp ening effect.
◊ The commissioning of German unification transport projects no. 8 and Gäubahn also resulted in an increase in volume produced.
◊ As the number of passengers increased, the load factor rose as well.
Supply adjustments on individual lines led to an increase in volume sold in bus transport.
Operating profit development was driven by higher rev-enues, which were offset by higher expenses and the omis-sion of the reimbursement of nuclear fuel tax, which meant that adjusted EBITDA remained virtually unchanged and adjusted EBIT declined slightly.
◊ Revenues developed better due to price and perfor-mance effects. Supportive effects also resulted from a less intense competitive environment compared to the first half of 2017.
◊ The significant decline in other operating income (–27.0%) is mainly attributable to the reimbursement of nuclear fuel tax in the first half of 2017.
◊ The increase in the cost of materials (+6.2%) was mainly driven by the higher volume produced, higher track usage charges and quality improvement measures.
◊ The higher personnel expenses (+1.5%) resulted mainly from collective wage increases.
◊ Other operating expenses (+13.4%) mainly increased due to higher expenses for travel support, passenger rights, marketing and IT.
◊ The increase in depreciation (+8.9%) is mainly due to the new ICE 4. The locomotives of the 101 series reached the end of their accounting useful life, which had a counteracting effect.
Capital expenditure activity was at a significantly higher level and was characterized by vehicle procurement (ICE 4). The completion of the ICE facility in Cologne-Nippes damp-ened this development slightly.
The number of employees as of June 30, 2018 increased due to the TARIFF-BASED ELECTION MODEL µ10 and as a result of the expansion of services.
DB Regional business unitTransport contracts in Germany
Transport contracts awarded (rail) first half of 2018 Term
Volume (million train km)
p.a. total 1)
S-Bahn (metro) Berlin transitional contract Subnet north-south and city line 12/2017 – 06/2027 25.9 205.0
2022 Taunus line 12/2021 – 12/2036 1.5 22.5
Ulm diesel network 12/2020 – 12/2032 2) 1.6 19.2
RB line 83 Wittlich – Trier – Luxembourg – Dommeldange 12/2019 – 12/2024 0.5 2.4
Dresden – Pirna S-Bahn (metro) line 04/2018 – 12/2027 0.1 1.0
Taunus line 12/2020 – 12/2021 1.0 1.0
Total 1) 30.6 251.1
1) Differences due to rounding are possible. 2) Option for extension.
In the local rail passenger transport market in Germany, nine tender procedures were concluded in the first half of 2018 (in the first half of 2017: 12) and about 35 million train kilometers (train km) (in the first half of 2017: 33 million train km) were awarded. Of the train kilometers awarded, about 86% had previously been operated by companies within DB Group.
DB Regional won six tender procedures (including pub-lished contract amendments) (in the first half of 2017: eight procedures) and 88% (in the first half of 2017: 85%) of the train kilometers awarded.
Transport contracts awarded (bus) first half of 2018 Term
Volume (million bus km) 1)
p.a. total 1)
Osnabrück Süd 02/2019 – 01/2029 3.9 38.7
VRN – Mosbach 01/2019 – 12/2028 2.6 25.9
VRN – Buchen 01/2019 – 12/2028 2.1 21.4
VVS – Ludwigsburg 06 – Marbach 08/2019 – 06/2029 1.8 14.9
Alzey – Worms Nord 08/2019 – 06/2029 1.5 14.5
VGF – Freudenstadt ewA 2018 12/2018 – 12/2026 1.9 13.3
KVV – Lußhardt 12/2018 – 12/2026 1.7 13.3
Holzminden district 08/2018 – 07/2020 2.3 4.7
Other (32 contracts) 1 – 10 years 15.9 124.4
Total 1) 33.7 272.9
1) Differences due to rounding are possible.
!!!
Deutsche Bahn Group―Integrated Interim Report January – June 2018
26
In bus services, a volume of 66 million bus kilometers (bus km) was awarded in Germany in the first half of 2018 (in the first half of 2017: 27 million bus km) in 102 tenders (in the first half of 2017: 60 tenders). Of the bus kilometers awarded, 48% (in the first half of 2017: 38%) were previ-ously operated by DB Regional Bus.
In the first half of 2018, we participated in 68 tenders (first half of 2017: 43 tenders) with a volume of 49 million bus km (first half of 2017: 21 million bus km). We won 75% of the tender procedures in which we participated (first half of 2017: 19%).
Events in the first half of 2018Vehicle measures implementedMeasures to improve our vehicle fleet included: interior redesign, installation of passenger information and video recording systems and new paint.
◊ The modernization of 91 electric multiple units of the 425 series was completed for the tender of the Rhine-Neckar S-Bahn (metro) and the RB 44.
◊ Since 2016, 32 out of a total of 111 vehicles of the 474 series have been refurbished for S-Bahn (metro) Ham-burg.
◊ A total of 36 vehicles of the 420 series and 238 vehicles of the 423 series are to be refurbished for the S-Bahn (metro) Munich transition contract. There are currently six vehicles in trial operation.
◊ 7 out of 48 ET of the 422 series to be modernized were rebuilt to provide the vehicles for S-Bahn (metro) Rhine-Ruhr.
New vehicle purchasesFor the Ulm diesel network 12 VT of the 622 series LINT 54 and eight VT of the 623 series LINT 41 have been procured from the vehicle manufacturer Alstom. These will be resold to a leasing company following acceptance and will be leased there for the duration of the transport contract in December 2020 when the transport contract begins.
Delays in vehicle deliveriesVehicle availability increased further during the first half of 2018. However, there were still delays and restrictions relating to the delivery of new trains:
◊ Bombardier’s delayed delivery of the 2010 double-deck cars, which began in December 2015, continued with the addition of a further 58 vehicles for the transport net-works Ringzug-West and Main-Spessart in Bavaria, North-South in Berlin-Brandenburg, Main-Neckar-Ried in Hessen and the Mitte network in Schleswig-Holstein.
◊ In December 2016, we rented a total of 15 locomotives and three diesel railcars from Paribus for use in the Schleswig- Holstein network west transport contract. Of the total of 90 defective passenger cars, 88 vehicles were acquired successively. Existing vehicles will con-tinue to be deployed until the defects are remedied. The rental contract will be drawn up with Paribus upon completion of the maintenance work in the second half of 2018.
◊ Of the eight pre-series vehicles of the 490 series for S-Bahn (metro) Hamburg, four were delivered, while those remaining will follow in the coming months and will be used in trial operation. S-Bahn (metro) Hamburg also aims to transfer a further 42 of the total of 60 vehi-cles by the end of 2018.
◊ We expect delivery of Link diesel multiple units from PESA (632/633 series) for the Sauerland network and Dreieich Railway to be delayed by more than two years and for the Allgäu diesel network by one year on average. Comprehensive replacement concepts with existing vehicles will continue to be used for the first two networks. The delivery of the 20 vehicles of the 632 series is scheduled for October 2018 at the latest.
◊ The delivery of the ordered vehicles from Škoda for the Nuremberg – Ingolstadt – Munich Express have been delayed until September/October 2018.
Other events ◊ Passengers can now book tickets for 21 different trans-port associations using DB Navigator. With this offer, we have reached over 50 million people – about 80% of the potential passengers on all transport networks in Germany.
27
Interim Group Management Report―Development of business units

Development in the first half of 2018 ◊ Slight performance gains in the rail line of business. ◊ Significant burdens due to higher expenses for
personnel and infrastructure utilization. ◊ Delays in vehicle deliveries still necessitate
replacement concepts. ◊ Weak development of the bus line of business.
DB Regional
H 1 Change
2018 2017 absolute %
Punctuality (rail) (%) 94.4 95.0 – –
Punctuality (bus) (%) 91.6 91.2 – –
Passengers (million) 1,258 1,285 –27 –2.1
Volume sold (million pkm) 24,011 24,101 – 90 – 0.4
Total revenues (€ million) 4,376 4,304 +72 +1.7
External revenues (€ million) 4,325 4,254 +71 +1.7
Rail concession fees (€ million) 2,009 1,934 +75 + 3.9
EBITDA adjusted (€ million) 530 634 –104 –16.4
EBIT adjusted (€ million) 214 314 –100 –31.8
Gross capital expenditures (€ million) 299 164 +135 + 82.3
Employees as of Jun 30 (FTE) 35,876 35,631 +245 + 0.7
Punctuality in rail transport has fallen due to lower values in regional transport and at the S-Bahnen (metros). The punctuality of bus transport increased.
The performance development was differentiated: ◊ In rail transport, there was a slight increase in the num-ber of passengers, volume sold and volume produced.
◊ The development in bus services was marked by nega-tive development as a result of a loss in performance.
The economic development of DB Regional is particularly affected by the development of the higher-revenue and higher-performance rail line of business (share of revenues: 89%). Of the adjusted EBIT 95% is generated by the rail line of business and 5% by the bus line of business. The increase in expenses associated with the loss of income from com-pensations for damage and the reimbursement of the nuclear fuel tax led to a noticeable decline in the adjusted profit figures EBITDA and EBIT.
◊ Revenues increased slightly. This was primarily driven by an increase in the rail line of business due to price and volume effects. The performance-based decline in the development of the bus line of business countered this development.
◊ Other operating income (–36.1%) decreased mainly as a result of the omission of compensations for damage for vehicles and the reimbursement of nuclear fuel tax in the first half of 2017.
◊ The cost of materials (+2.4%) was in particular driven by price-related higher costs for infrastructure utilization.
◊ Personnel expenses (+3.4%) were higher, among other things due to collective wage increases. Lower employee figures in the bus line of business had a slight damp-ening effect.
◊ Other operating expenses (+6.4%) rose as a result of increased vehicle leases and higher procured services. The decline in the bus line of business had a dampening effect.
◊ Depreciation (–1.3%) fell as a result of the adjustment of the useful life for S-Bahn (metro) Berlin vehicles.
Capital expenditures increased mainly as a result of vehicle purchases due to tenders won in the rail line of business. Capital expenditures declined in the bus line of business.
77% of employees are employed in the rail line of busi-ness, with 23% in the bus line of business. The lower number of employees in the bus line of business as a result of performance losses was compensated for by an increase in the rail line of business as a result of the TARIFF-BASED
ELECTION MODEL µ10.
Rail line of business ◊ Performance gains from awarded transport contracts
dampened by construction activity in the network. ◊ Significant burdens due to higher expenses for
personnel and infrastructure utilization. ◊ Delays in vehicle deliveries still necessitate replacement
concepts.
Rail line of business
H 1 Change
2018 2017 absolute %
Passengers (million) 984.0 984.9 – 0.9 – 0.1
thereof rail 960.6 960.0 + 0.6 + 0.1
Volume sold (million pkm) 20,933 20,856 +77 + 0.4
thereof rail 20,582 20,483 + 99 + 0.5
Volume produced (million train-path km) 229.6 228.6 +1.0 + 0.4
Total revenues (€ million) 3,879 3,823 + 56 +1.5
External revenues (€ million) 3,760 3,683 +77 +2.1
Rail concession fees (€ million) 2,009 1,934 +75 + 3.9
EBITDA adjusted (€ million) 491 588 – 97 –16.5
EBIT adjusted (€ million) 203 292 – 89 –30.5
Gross capital expenditures (€ million) 274 126 +148 +117
Employees as of Jun 30 (FTE) 27,472 27,084 + 388 +1.4
Deutsche Bahn Group―Integrated Interim Report January – June 2018
28
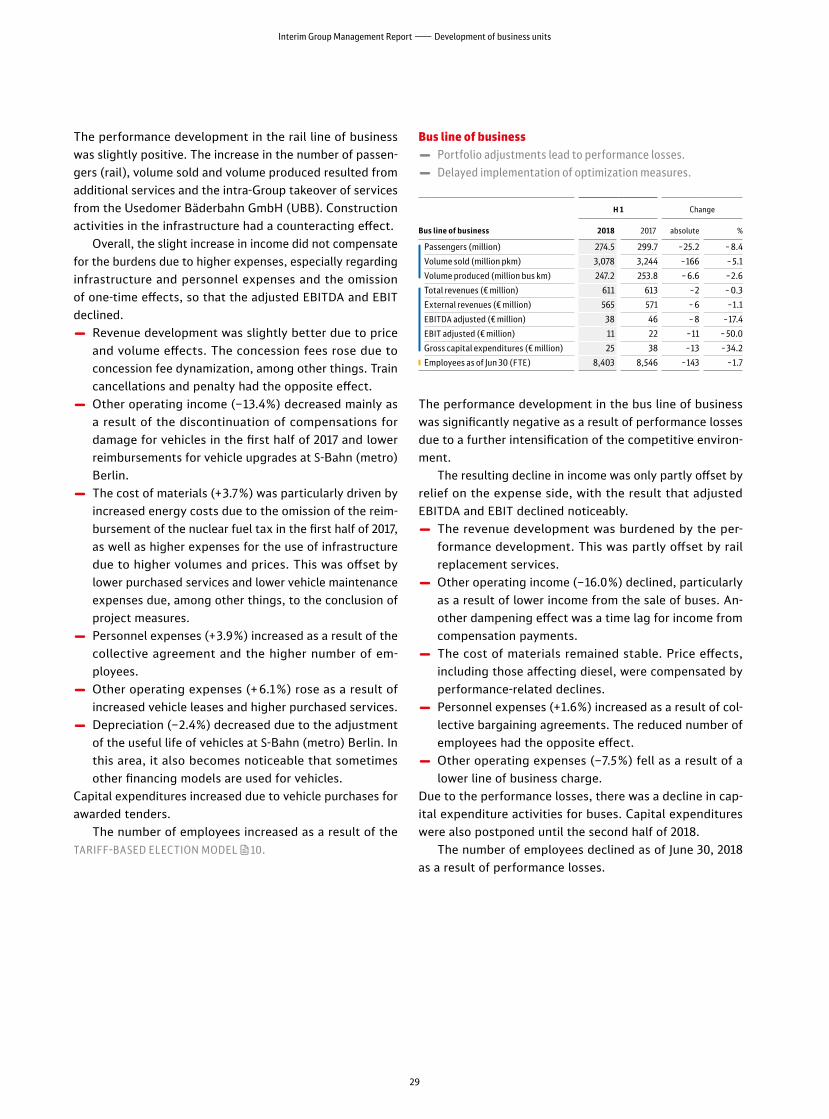
The performance development in the rail line of business was slightly positive. The increase in the number of passen-gers (rail), volume sold and volume produced resulted from additional services and the intra-Group takeover of services from the Usedomer Bäderbahn GmbH (UBB). Construction activities in the infrastructure had a counteracting effect.
Overall, the slight increase in income did not compensate for the burdens due to higher expenses, especially regarding infrastructure and personnel expenses and the omission of one-time effects, so that the adjusted EBITDA and EBIT declined.
◊ Revenue development was slightly better due to price and volume effects. The concession fees rose due to concession fee dynamization, among other things. Train cancellations and penalty had the opposite effect.
◊ Other operating income (–13.4%) decreased mainly as a result of the discontinuation of compensations for damage for vehicles in the first half of 2017 and lower reimbursements for vehicle upgrades at S-Bahn (metro) Berlin.
◊ The cost of materials (+3.7%) was particularly driven by increased energy costs due to the omission of the reim-bursement of the nuclear fuel tax in the first half of 2017, as well as higher expenses for the use of infrastructure due to higher volumes and prices. This was offset by lower purchased services and lower vehicle maintenance expenses due, among other things, to the conclusion of project measures.
◊ Personnel expenses (+3.9%) increased as a result of the collective agreement and the higher number of em -ployees.
◊ Other operating expenses (+6.1%) rose as a result of increased vehicle leases and higher purchased services.
◊ Depreciation (–2.4%) decreased due to the adjustment of the useful life of vehicles at S-Bahn (metro) Berlin. In this area, it also becomes noticeable that sometimes other financing models are used for vehicles.
Capital expenditures increased due to vehicle purchases for awarded tenders.
The number of employees increased as a result of the TARIFF-BASED ELECTION MODEL µ10.
Bus line of business ◊ Portfolio adjustments lead to performance losses. ◊ Delayed implementation of optimization measures.
Bus line of business
H 1 Change
2018 2017 absolute %
Passengers (million) 274.5 299.7 –25.2 – 8.4
Volume sold (million pkm) 3,078 3,244 –166 – 5.1
Volume produced (million bus km) 247.2 253.8 – 6.6 –2.6
Total revenues (€ million) 611 613 –2 – 0.3
External revenues (€ million) 565 571 – 6 –1.1
EBITDA adjusted (€ million) 38 46 – 8 –17.4
EBIT adjusted (€ million) 11 22 –11 – 50.0
Gross capital expenditures (€ million) 25 38 –13 –34.2
Employees as of Jun 30 (FTE) 8,403 8,546 –143 –1.7
The performance development in the bus line of business was significantly negative as a result of performance losses due to a further intensification of the competitive environ-ment.
The resulting decline in income was only partly offset by relief on the expense side, with the result that adjusted EBITDA and EBIT declined noticeably.
◊ The revenue development was burdened by the per -formance development. This was partly offset by rail replacement services.
◊ Other operating income (–16.0%) declined, particularly as a result of lower income from the sale of buses. An -other dampening effect was a time lag for income from compensation payments.
◊ The cost of materials remained stable. Price effects, including those affecting diesel, were compensated by performance-related declines.
◊ Personnel expenses (+1.6%) increased as a result of col-lective bargaining agreements. The reduced number of employees had the opposite effect.
◊ Other operating expenses (–7.5%) fell as a result of a lower line of business charge.
Due to the performance losses, there was a decline in cap-ital expenditure activities for buses. Capital expenditures were also postponed until the second half of 2018.
The number of employees declined as of June 30, 2018 as a result of performance losses.
!!!
29
Interim Group Management Report―Development of business units

DB Arriva business unitGeneral frameworkMarket liberalization is progressing Market liberalization in Europe is progressing in many countries. For example, the French Government plans to open the regional passenger transport market. As an experienced and innovative passenger transport service provider operating in 14 countries, DB Arriva is well positioned for up coming opportunities and will closely follow developments.
Bus tender process has started in Portugal The municipality elections took place in Portugal in October 2017, resulting in significant political changes impacting our bus operations. The new bus tendering process in Portugal has started, with the definition of regulations by the public transport authorities. This replaces the current provisional public transport operating licenses, and is expected to be concluded by the end of 2019.
Political changes in the Czech Republic with impact on future public transportThe Czech Republic parliamentary elections were held in Octo ber 2017 and brought some political changes that have the potential to impact on future public transport tenders.
The government approved an increase in the minimum wage by 11% in 2017, effective from January 2018, which has led to increases in personnel expenses.
In order to promote an integrated approach to public transport solutions in the rail market, the Ministry of Transport plans to introduce a single tariff across the rail network. The project is currently under way and the rail transport companies, including DB Arriva, are invited to participate on the design phase.
S-Bahn (metro) system in CopenhagenThe Ministry for Transport will present its report on the fu ture organization of the SBahn (metro) system in Copenhagen in the late summer. In doing so, the government has commenced an informal tender process and allowed more competition in suburban rail transport. The organization and future operator should be in place by 2020.
The future SBahn (metro) system will be driverless, in spired by the local metro system in Copenhagen. Further, there is a focus on the future of sustainable mobility. Congestion has become a significant political issue for parliament, and proposals to introduce road tolls, for example, when the technology is available are being discussed.
There are major issues with the implementation of the European Rail Traffic Management System (ERTMS), with no political agreement on how the Danish railway authorities (Banedanmark) will deal with that.
Changes in SerbiaThe Serbian Government introduced an updated plan to reform the railway in the period 2018 until 2020. The plan introduces a MultiAnnual Infrastructure Contract (MAIC) as a central part of the policy regarding public rail infrastructure. The government also intends to introduce a fee for the use of infrastructure and the provision of public transport services, in support of market competition.
Events in the first half of 2018Awarded transport contracts
Transport contracts awarded (bus) first half of 2018 Term
Volume (million bus km)
p. a. total 1)
Sweden
Helsingborg City Traffic (Skånetrafiken) 06/2019 – 06/2027 6.4 51.2
Sweden E32 Ekerö 06/2019 – 06/2029 4.6 46.5
The Netherlands Zuid Holland Noord 2) 12/2020 –12/2022 20.5 41.0
Great BritainLondon (eight separate lines) 5 years each 5.7 28.4
Czech Republic
Bilovecko (Moravskolezsky Region – North Moravia) 12/2018 – 12/2028 2.5 24.6
Poland City of Warsaw I 12/2018 – 12/2026 2.0 16.0
Czech Republic
Teplice City (Ustecky Region – Northern Bohemia) 07/2018 – 12/2023 2.1 11.7
Total 1) 43.8 219.4
1) Differences due to rounding are possible.2) Extension of the existing contract.
◊ DB Arriva has submitted bids for two new bus contracts in Warsaw worth a combined value of € 110 million. The first bid has been won and if successful on the second bid DB Arriva would become one of the largest private operators in Poland with 668 buses with services start ing later in 2018. Passengers would benefit from im provements including airconditioning and live jour ney information.
◊ Arriva Sweden has won an eightyear contract to operate bus services in the Swedish city of Helsingborg, in clud ing the city’s new electric Bus Rapid Transit (BRT) system, branded the Helsingborg Express Line. As part of the € 185 million contract, which begins in June 2019, DB Arriva will introduce 76 buses to the city network with a further six held in reserve. Thirteen of these buses will also form part of the new electric BRT system,
!!!
Deutsche Bahn Group―Integrated Interim Report January – June 2018
30
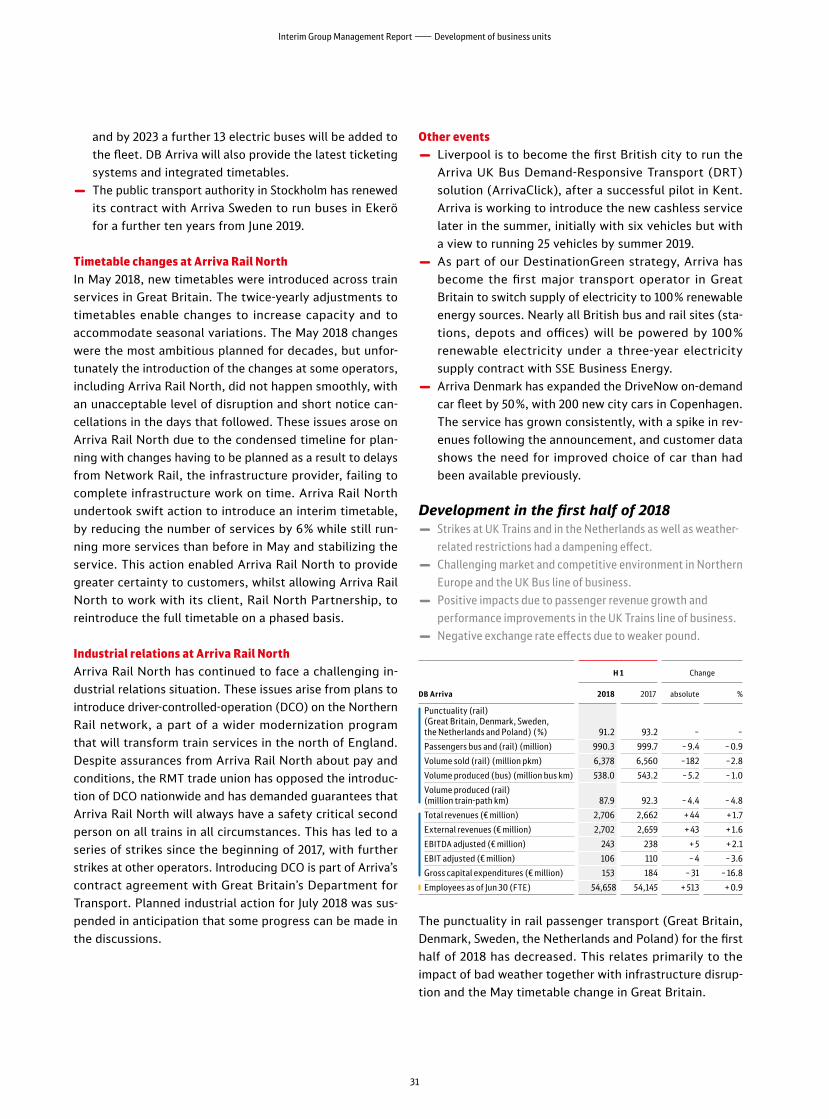
and by 2023 a further 13 electric buses will be added to the fleet. DB Arriva will also provide the latest ticketing systems and integrated timetables.
◊ The public transport authority in Stockholm has renewed its contract with Arriva Sweden to run buses in Ekerö for a further ten years from June 2019.
Timetable changes at Arriva Rail North In May 2018, new timetables were introduced across train services in Great Britain. The twiceyearly adjustments to timetables enable changes to increase capacity and to accommodate seasonal variations. The May 2018 changes were the most ambitious planned for decades, but unfortunately the introduction of the changes at some operators, including Arriva Rail North, did not happen smoothly, with an unacceptable level of disruption and short notice cancellations in the days that followed. These issues arose on Arriva Rail North due to the condensed timeline for planning with changes having to be planned as a result to delays from Network Rail, the infrastructure provider, failing to complete infrastructure work on time. Arriva Rail North undertook swift action to introduce an interim timetable, by reducing the number of services by 6% while still running more services than before in May and stabilizing the service. This action enabled Arriva Rail North to provide greater certainty to customers, whilst allowing Arriva Rail North to work with its client, Rail North Partnership, to reintroduce the full timetable on a phased basis.
Industrial relations at Arriva Rail NorthArriva Rail North has continued to face a challenging in dustrial relations situation. These issues arise from plans to introduce drivercontrolledoperation (DCO) on the Northern Rail network, a part of a wider modernization pro gram that will transform train services in the north of England. Despite assurances from Arriva Rail North about pay and conditions, the RMT trade union has opposed the introduction of DCO nationwide and has demanded guarantees that Arriva Rail North will always have a safety critical second person on all trains in all circumstances. This has led to a series of strikes since the beginning of 2017, with further strikes at other operators. Introducing DCO is part of Arriva’s contract agreement with Great Britain’s Department for Transport. Planned industrial action for July 2018 was suspended in anticipation that some progress can be made in the discussions.
Other events ◊ Liverpool is to become the first British city to run the Arriva UK Bus DemandResponsive Transport (DRT) solution (ArrivaClick), after a successful pilot in Kent. Arriva is working to introduce the new cashless service later in the summer, initially with six vehicles but with a view to running 25 vehicles by summer 2019.
◊ As part of our DestinationGreen strategy, Arriva has become the first major transport operator in Great Britain to switch supply of electricity to 100% renewable energy sources. Nearly all British bus and rail sites (stations, depots and offices) will be powered by 100% renewable electricity under a threeyear electricity supply contract with SSE Business Energy.
◊ Arriva Denmark has expanded the DriveNow ondemand car fleet by 50%, with 200 new city cars in Copenhagen. The service has grown consistently, with a spike in revenues following the announcement, and customer data shows the need for improved choice of car than had been available previously.
Development in the first half of 2018 ◊ Strikes at UK Trains and in the Netherlands as well as weather
related restrictions had a dampening effect. ◊ Challenging market and competitive environment in Northern
Europe and the UK Bus line of business. ◊ Positive impacts due to passenger revenue growth and
performance improvements in the UK Trains line of business. ◊ Negative exchange rate effects due to weaker pound.
DB Arriva
H 1 Change
2018 2017 absolute %
Punctuality (rail) (Great Britain, Denmark, Sweden, the Netherlands and Poland) (%) 91.2 93.2 – –
Passengers bus and (rail) (million) 990.3 999.7 – 9.4 – 0.9
Volume sold (rail) (million pkm) 6,378 6,560 –182 –2.8
Volume produced (bus) (million bus km) 538.0 543.2 – 5.2 – 1.0
Volume produced (rail) (million trainpath km) 87.9 92.3 – 4.4 – 4.8
Total revenues (€ million) 2,706 2,662 + 44 + 1.7
External revenues (€ million) 2,702 2,659 + 43 + 1.6
EBITDA adjusted (€ million) 243 238 + 5 + 2.1
EBIT adjusted (€ million) 106 110 – 4 – 3.6
Gross capital expenditures (€ million) 153 184 – 31 – 16.8
Employees as of Jun 30 (FTE) 54,658 54,145 + 513 + 0.9
The punctuality in rail passenger transport (Great Britain, Denmark, Sweden, the Netherlands and Poland) for the first half of 2018 has decreased. This relates primarily to the impact of bad weather together with infrastructure disruption and the May timetable change in Great Britain.
31
Interim Group Management Report―Development of business units

The performance development figures were slightly negative mainly due to industrial action and engineering works in UK Trains and the cessation of the Tyne and Wear Metro concession in March 2017.
The economic development was dampened, mainly driven by revenue losses due to strikes and severe weather. Overall, adjusted EBITDA improved slightly, but increased depreciation due to significant capital expenditures in 2017 resulted in a slight reduction in EBIT.
◊ The UK Bus line of business generated 20% of DB Arrivaʼs revenues, the UK Trains line of business generated 41%, and the Mainland Europe line of business generated 39%. The increase in revenues is mainly attributable to passenger revenue growth in UK Trains and the acquisition of Autotrans in August 2017. Exchange rate effects (development of the British pound), strikes at UK Trains and market and competitionrelated declines at UK Bus had a dampening effect.
◊ Other operating income (– 3.9%) was mainly influenced by funding income for project costs (offset by higher other operating expenses). Ex change rate effects, in contrast, had a dampening impact.
◊ The cost of materials (– 0.2%) remained almost un changed. Exchange rate effects had a positive impact here.
◊ Personnel expenses (+ 0.7%) increased due to the ac qui sition of Autotrans, increased statutory charges in the UK and wage inflation. This was largely offset by an accounting change with regard to pensions and a significant positive exchange rate effect.
◊ Other operating expenses (+ 5.8%) increased due to project costs (offset by higher other operating income), franchise payments in UK Trains and insurance claims costs in UK Bus.
◊ Depreciation (+ 7.0%) was mainly driven by the higher capital expenditures in 2017 and the acquisition of Autotrans.
Capital expenditures at UK Bus were lower due to high capital expenditures in new transport contracts in London in the first half of 2017.
DB Arriva employs 29% of its employees in the UK Bus line of business, 23% in the UK Trains line of business and 47% in the Mainland Europe line of business. The number of employees increased slightly, driven by the acquisition of Autotrans. The discontinuation or adjustment of transport contracts countered this effect.
UK Bus line of business ◊ Challenging market environment and operational cost
pressures in the regional bus markets. ◊ Market share in London increased, despite
challenging environment. ◊ Weaker pound leads to negative exchange rate effects.
UK Bus line of business
H 1 Change
2018 2017 absolute %
Passengers (million) 348.8 350.0 –1.2 – 0.3
Volume produced (million bus km) 176.7 180.4 – 3.7 – 2.1
Total revenues (€ million) 529 546 – 17 – 3.1
External revenues (€ million) 528 545 – 17 – 3.1
EBITDA adjusted (€ million) 60 69 – 9 – 13.0
EBIT adjusted (€ million) 20 32 – 12 – 37.5
Gross capital expenditures (€ million) 26 76 – 50 – 65.8
Employees as of Jun 30 (FTE) 16,005 16,349 – 344 – 2.1
The number of passengers declined slightly, mainly due to route rationalization in the regions and in London.
Adjusted EBITDA and EBIT decreased primarily due to the challenging market environment including cost pressures and regional passenger revenue shortfalls.
◊ Revenue development was negative due to shortfalls in regional passenger revenues (including effects of route rationalization) and the cessation of contracts in non emergency patient transport. There was a positive ef fect from improved performance settlements in London. Exchange rate effects had a negative impact.
◊ Other operating income (+ 53.3%) grew strongly, but the increase was offset by corresponding changes in other operating expenses.
◊ The cost of materials (– 7.4%) decreased slightly, mainly due to lower volume produced, driven by route rationalization.
◊ Personnel expenses (– 1.3%) were driven by increased statutory charges in the UK and wage inflation. Ex change rate effects had a positive impact.
◊ Other operating expenses (+ 19.4%) increased due to higher consulting expenses and insurance claim costs.
◊ Depreciation (+ 8.1%) was higher as a result of significant capital expenditures in 2017.
Capital expenditures decreased significantly. This was mainly due to extensive vehicle purchases in the first half of 2017 in connection with transport contracts won in London.
The number of employees declined, largely due to the cessation of nonemergency patient transport contracts.
!!!!!!
Deutsche Bahn Group―Integrated Interim Report January – June 2018
32

UK Trains line of business ◊ Performance impacted by strike actions and severe
weather conditions. ◊ Positive passenger revenue development. ◊ Weaker pound leads to negative exchange rate effects.
UK Trains line of business
H1 Change
2018 2017 absolute %
Passengers (million) 193.6 206.3 –12.7 – 6.2
Volume sold (million bus km) 5,249 5,375 –126 –2.3
Volume produced (million trainpath km) 61.3 64.5 – 3.2 – 5.0
Total revenues (€ million) 1,147 1,103 + 44 + 4.0
External revenues (€ million) 1,123 1,086 + 37 + 3.4
EBITDA adjusted (€ million) 59 31 + 28 + 90.3
EBIT adjusted (€ million) 42 16 + 26 + 162.5
Gross capital expenditures (€ million) 25 21 + 4 + 19.0
Employees as of Jun 30 (FTE) 12,802 12,509 + 293 + 2.3
The performance development of UK Trains was impacted by strike actions, severe weather and the cessation of the Tyne and Wear Metro concession (March 2017). The delayed delivery of the industrywide rail INFRASTRUCTURE PROGRAM
AND THE TIMETABLE CHANGE µ 31 had an additional negative impact.
Adjusted EBITDA and EBIT improved as a result of revenue growth, partially offset by the impact of strike action and severe weather.
◊ Revenue development was positive overall, including passenger revenue growth, but was impacted by the cessation of the Tyne and Wear Metro concession. Ex change rate effects had a significant dampening effect.
◊ Other operating income is unchanged. Increases primarily due to funding income for project costs (offset by corresponding changes in other operating expenses) were fully offset by exchange rate effects.
◊ The cost of materials (+ 4.3%) increased slightly mainly driven by rail refurbishment costs at Arriva Rail North. Exchange rate effects had a positive impact.
◊ Personnel expenses (– 3.9%) declined mainly due to an accounting change with regard to pensions. Exchange rate effects had a positive impact.
◊ Other operating expenses (+ 4.2%) increased due to project costs (offset by corresponding changes in other operating income) and a change in franchise payments at CrossCountry.
◊ Depreciation (+ 12.5%) increased due to capital expenditures, driven mainly by Arriva Rail North.
The higher gross capital expenditures are mainly attributable to contractual capital expenditure requirements in relation to Arriva Rail North.
The number of employees increased primarily as a result of the impact of Arriva Rail North due to fulfillment of driver vacancies.
Mainland Europe line of business ◊ Challenging trading environment, particularly
in Northern Europe. ◊ Strikes in the Netherlands and weatherrelated restrictions
in Sweden had a dampening effect. ◊ Positive effects from acquisition of Autotrans in Croatia.
Mainland Europe line of business
H1 Change
2018 2017 absolute %
Passengers bus (million) 386.4 385.2 +1.2 + 0.3
Passengers rail (million) 61.5 58.2 + 3.3 + 5.7
Volume sold rail (million pkm) 1,129 1,185 – 56 – 4.7
Volume produced rail (million trainpath km) 361.3 362.8 – 1.5 – 0.4
Volume produced bus (million bus km) 26.6 27.8 – 1.2 – 4.3
Total revenues (€ million) 1,097 1,071 + 26 + 2.4
External revenues (€ million) 1,050 1,028 + 22 + 2.1
EBITDA adjusted (€ million) 146 146 – –
EBIT adjusted (€ million) 67 71 – 4 – 5.6
Gross capital expenditures (€ million) 94 76 + 18 + 23.7
Employees as of Jun 30 (FTE) 25,516 24,946 + 570 + 2.3
The performance development in the Mainland Europe line of business was mixed. The number of passengers increased in rail (mainly due to the removal of restrictions caused by construction work in Sweden in 2017) and bus transport (mainly due to the Autotrans acquisition) while volume sold and produced fell driven by operational difficulties due to strikes and weather conditions.
Adjusted EBIT decreased driven by weatherrelated restrictions in Sweden and strikes in the Netherlands. In contrast, the acquisition of Autotrans had a positive effect.
◊ Revenue development was positive, mainly driven by the impact of the Autotrans acquisition, partially offset by snow impact in Sweden.
◊ Other operating income (+ 9.0%) decreased slightly after adjusting internal effects.
◊ Personnel expenses (+ 2.8%) increased due to the acquisition of Autotrans, higher expenses in relation to em ployee absence in the Netherlands and the increased minimum wage in the Czech Republic.
◊ Other operating expenses (+ 5.0%) remained stable after adjusting internal effects.
◊ Depreciation (+ 5.3%) increased mainly driven by higher contractual capital expenditures in 2017 and the acquisition of Autotrans.
Gross capital expenditures rose due to the Northern Lines rail contract renewal in the Netherlands, which will start in December 2020.
The number of employees increased, mainly due to the acquisition of Autotrans.
33
Interim Group Management Report―Development of business units

Freight transport and logistics
Positive general framework German freight transport market continues growingInternal calculations indicate that the overall freight transport market grew significantly at the start of 2018:
◊ Overall, positive economic effects from trading and domestic demand continued.
◊ Despite existing difficulties with capacity and cost in creases, price and competitive pressure remain high. Significance of staff shortages increasing.
◊ Noncyclical special effects such as reductions in coal shipments as a result of an ongoing energy transition or quality losses dampen the development, especially in rail freight transport.
◊ Following a significant drop in performance at the start of the previous year, inland waterway transport made a strong start in 2018. We expect this to tail off noticeably in subsequent months. This was also driven by extensive maintenance and repair work on locks on major waterways as well as adverse effects of low water levels in some regions.
Rail with below average development ◊ Until the relevant reports are published, no quantified statement can be made regarding the performance development of the rail freight transport market in the first months of 2018.
◊ Volume sold for DB Cargo decreased significantly. As well as some modest impulses in certain industries such as the moderate development in steel production or current difficulties in the automotive industry, the port folio adjustments of the energy producers continue to have a negative effect through the closure of coalfired power plants and the conversion from coal to gas. Intramodal and intermodal shifts are also hav ing adverse effects.
◊ We are expecting nonGroup railways to continue their positive, aboveaverage development. In addition to strong economic momentum overall, this expectation is based on shifts in modal transport by DB Cargo and effects due to the extended reporting scope when the rail freight transport statistics are officially revised.
Road with stable growth ◊ Strong momentum from the construction industry, foreign trade and positive consumer sentiment meant that the increase in volume sold to May 2018 was at the 2017 level based on internal calculations.
◊ According to the toll statistics issued by the German Federal Agency for Freight Transport, the number of trucks registered in Germany remained approximate ly at the level of the previous year while trucks from abroad (in particular Central and Eastern Europe) recorded strong growth again.
◊ The market is characterized by a shortage of hold capacity and increasing costs, particularly for fuel and personnel.
European rail freight transport market above previous year’s levelThe positive development in volume sold in European rail freight transport (EU 28, Switzerland and Norway) in 2017 appears to have continued at the beginning of 2018 with markets growing in particular in Poland and Sweden. Development was supported by strong demand for capital goods and dynamic European trading. Positive momentum was generated mainly from transport through the North Sea ports of Antwerp, Rotterdam and Hamburg. While combined transport continues to be the growth driver of rail freight transport, the persistent decline in coal shipments is having an adverse effect.
◊ Rail freight volume sold in Great Britain declined sig nificantly in the first quarter of 2018. This affected all freight divisions, while the decline in coal transport continued, but slowed significantly. DB Cargo UK performance also declined; the leading market position was maintained.
◊ Rail freight volume sold in Poland again showed a very strong increase in the first quarter of 2018. The positive development was supported by an increase in steel, building materials and intermodal transport. DB Cargo Polska also recorded dynamic growth, particularly in intermodal and steel transport.
◊ We expect rail freight volume sold in France to have declined significantly in the first half of 2018 due to the massive strikes at SNCF connected with the FRENCH RAIL
REFORM µ6. This has also had a severe effect on Euro Cargo Rail (ECR).
European land transport shows growthDemand continued to develop positively in European land transport in the first half of 2018 with shipment figures increasing once more.
A Europewide price increase can be observed in 2018. Continuing shortages of drivers and capacity as well as more increases in the diesel price have maintained pressure on margins which could increase even further in the second half of the year.
!!!
34
Deutsche Bahn Group―Integrated Interim Report January – June 2018

Air freight with strong growthDriven mainly by an increase in demand for transport of machinery and automotive supplier parts, chemicals, perishable goods and ecommerce, development in the global air freight market was positive in the first half of 2018.
This development was driven by volumes from North America to Europe and Asia/Pacific as well as trade routes from Asia/Pacific – Europe. With cargo space increasingly scarce, air freight rates have remained constantly high since the beginning of the year.
Ocean freight continues to growDriven by an increase in demand for transport of raw materials, consumer goods and chemicals, particularly on trade routes within Asia and from Asia to other regions, global ocean freight was positive in the first half of 2018.
The trend towards improved utilization of capacity is causing ocean freight rates to recover. The vertical integration and consolidation of shipping companies is continuing.
Persisting momentum in contract logistics As in previous years, the global market for contract logistics continued to be characterized by dynamic growth. The Asia/Pacific region also recorded aboveaverage growth. The strongest momentum was generated by the industri al, electronics, automotive and consumer goods sectors. The continuing strong growth in ecommerce business, particularly in the USA, also drove positive development.
DB Cargo business unit Events in the first half of 2018Digitalization and innovation
◊ The freight car fleet in Germany is to be fitted with the latest telematics and sensors by 2020. About 1,000 re fitted freight cars are already on the way. To this end, we are investing an amount in the doubledigit millions.
◊ The Innovative Freight Car project has begun operational testing. Findings from the project will speed up the use of innovative freight cars that are quieter, more energyefficient and more costeffective than the cars currently in use. The project is being implemented by DB Cargo in cooperation with VTG AG on behalf of the BMVI.
◊ Additional features have been added to myRailportal to make it easier to access rail freight transport. Order place ment, empty car orders, consignment tracking and billing are automated and fully supported on the portal.
Development in the first half of 2018 ◊ Restrictions, above all in Germany, due to
continuing strained transport quality (resource problems with personnel and cars).
◊ Strikes in France had adverse effects on development. ◊ Positive business development in Eastern Europe.
DB Cargo
H 1 Change
2018 2017 absolute %
Punctuality (%) 73.5 73.9 – –
Freight carried (million t) 129.4 139.2 – 9.8 –7.0
Volume sold (million tkm) 44,534 47,756 –3,222 – 6.7
Volume produced (million train-path km) 83.3 89.1 – 5.8 – 6.5
Capacity utilization (t per train) 534.7 535.7 –1.0 – 0.2
Total revenues (€ million) 2,255 2,306 – 51 –2.2
External revenues (€ million) 2,112 2,150 –38 –1.8
EBITDA adjusted (€ million) –1 82 – 83 –
EBIT adjusted (€ million) –127 –28 – 99 –
Gross capital expenditures (€ million) 140 110 + 30 + 27.3
Employees as of Jun 30 (FTE) 28,709 28,964 –255 – 0.9
The punctuality of DB Cargo declined slightly, mainly due to the weak development in Germany. It was adversely affected by construction activity in the network, scarcity of resources particular in relation to train drivers, and operational restrictions due among others to the STORM
FRIEDERIKE µ8.The performance development was unfortunate and
was driven by Western Europe and Central Europe. Freight carried, volume sold and volume produced fell, while capacity utilization per train remained roughly stable.
The economic development was also weak. The lower in come was not offset by expenses, which remained roughly unchanged, so that adjusted EBITDA declined significantly. Due to the increased depreciation, the development of the adjusted EBIT was even weaker. The development was driven by Central Europe.
◊ 83% of revenues were generated in Central Europe, 12% in Western Europe and 5% in Eastern Europe. Revenues declined. Performancerelated declines, particularly in Germany and Great Britain, strikes in France and ad verse exchange rate effects were only slightly offset by a performancerelated increase in Eastern Europe.
35
Interim Group Management Report―Development of business units

◊ Other operating income (– 12.7%) fell, partly due to reimbursement of the nuclear fuel tax in the first half of 2017 and adjustments to leases in Great Britain with no impact on profit and loss.
◊ The cost of materials (+ 0.2%) was at the level of the first half of 2017. The increase in purchased transport services as well as higher energy prices in Germany were offset by lower trainpath expenses as a result of price and volume effects, a decline in energy consumption for performance related reasons and exchange rate effects.
◊ Personnel expenses (– 0.9%) declined slightly due to the decrease in the number of employees despite the negative impact of collective wage increases.
◊ Other operating expenses (+ 3.1%) increased, mainly due to higher expenses for vehicle rents and higher purchases of IT services.
◊ Depreciation (+ 14.5%) rose, mainly due to capital ex pen ditures but also impairments on IT projects.
Capital expenditure activities increased significantly due to higher capital expenditures in locomotives in Central Europe. In contrast, capital expenditures fell in Western Europe.
A total of 66% of employees are employed in Central Europe, 15% in Western Europe and 14% in Eastern Europe. The number of employees declined slightly. This was mainly due to reductions in Great Britain and France in connection with restructuring. The number of employees also fell in Poland as a result of a decline in the sidings business and sand mining business.
Region Central Europe ◊ Significant restrictions due to strikes in France
and storm Friederike. ◊ Strained transport quality due to resource bottlenecks. ◊ Production quality causes performance losses.
Region Central Europe
H 1 Change
2018 2017 absolute %
Freight carried (million t) 119.2 126.5 –7.3 – 5.8
Volume sold (million tkm) 36,240 38,721 –2,481 – 6.4
Volume produced (million train-path km) 67.8 71.3 –3.5 – 4.9
Total revenues (€ million) 2,465 2,465 – –
External revenues (€ million) 1,750 1,764 –14 – 0.8
EBITDA adjusted (€ million) 23 111 – 88 –79.3
EBIT adjusted (€ million) – 66 34 –100 –
Gross capital expenditures (€ million) 124 91 + 33 + 36.3
Employees as of Jun 30 (FTE) 18,934 18,757 + 177 + 0.9
The performance development in Central Europe declined. This was driven by development in Germany − STORM
FRIEDERIKE µ8, the impact of the STRIKES IN FRANCE µ6
and resource problems with personnel and freight cars caused performance losses.
The economic development decreased significantly: since noticeable burdens, in the cost of materials in particular, were not offset by the slight rise in income, adjusted EBITDA and adjusted EBIT decreased significantly.
◊ Revenues remained virtually unchanged despite the decline in performance, due in part to the positive effects on revenues of switching from the freight settlement procedure with foreign railways to a service procurement model. Nominal price levels were also increased.
◊ Other operating income (+ 12.7%) increased due to higher Government subsidies, for example for conversion to whisper brakes, and a onetime reimbursement from the Bremen Customs Office under a judicial settlement.
◊ The cost of materials (+ 5.5%) increased, mainly as a result of higher purchased transport services. This was partially offset by lower expenses for utilization of trainpaths as a result of price and volume effects.
◊ Personnel expenses (– 0.7%) were at the level of the first half of 2017.
◊ The increase in other operating expenses (+ 5.9%) re sulted from higher expenses on vehicle rents and purchases of IT services, among other things.
◊ Depreciation (+ 17.1%) rose significantly, mainly due to capital expenditures but also impairments on IT projects.
Gross capital expenditures increased significantly due to higher capital expenditures in locomotives.
The number of employees increased compared with June 30, 2017. Personnel increased particularly in Germany as a result of new hirings to meet the need for staffing in operational functional groups, takeover of vocational trainees and intraGroup reassignments. Personnel were also ac quired as a result of new business in Belgium and Italy, among other countries.
36
Deutsche Bahn Group―Integrated Interim Report January – June 2018

Region Western Europe ◊ Strikes in France and decreases in demand in
Great Britain had adverse effects on development. ◊ Continuing quality restrictions in France. ◊ Restructuring measures in Great Britain move ahead.
Region Western Europe
H 1 Change
2018 2017 absolute %
Freight carried (million t) 24.5 29.2 – 4.7 –16.1
Volume sold (million tkm) 5,868 6,831 – 963 –14.1
Volume produced (million train-path km) 11.5 13.9 –2.4 –17.3
Total revenues (€ million) 324 353 –29 – 8.2
External revenues (€ million) 259 288 –29 –10.1
EBITDA adjusted (€ million) 6 3 + 3 + 100
EBIT adjusted (€ million) –25 –24 –1 + 4.2
Gross capital expenditures (€ million) 13 18 – 5 –27.8
Employees as of Jun 30 (FTE) 4,320 4,694 –374 – 8.0
In Western Europe freight carried, volume sold and volume produced fell considerably, driven by strikes in France. A decline in demand in Great Britain in intermodal, coal and construction among other areas, as well as declines in performance in France as a result of quality restrictions, also had an adverse effect on development.
The economic development was weak: the decline in income was largely offset by lower expenses; operating profit figures thus remained virtually unchanged.
◊ Revenues declined for performance and exchange rate reasons.
◊ Other operating income (– 12.7%) fell, partly due to adjustments to leases in Great Britain with no impact on profit and loss (offset by a fall in other operating expenses).
◊ The cost of materials (– 5.8%) declined for performance and exchange rate reasons.
◊ Personnel expenses (– 12.3%) fell due to a decrease in the number of employees (implementation of restructuring measures in Great Britain and France) and to a small extent for exchange rate reasons.
◊ Other operating expenses (– 12.6%) fell significantly, mainly due to adjustments to leases in Great Britain with no impact on profit and loss (offset by a fall in other operating income) and exchange rate effects.
◊ Depreciation (+ 14.8%) rose significantly, mainly due to impairments on IT projects.
Gross capital expenditures decreased. This was the result of delays to capital expenditures in Great Britain and lower capital expenditures in Spain.
The number of employees fell, mainly due to adjustment to the business conditions (implementation of restructuring measures begun in 2017) in Great Britain and France.
Region Eastern Europe ◊ Positive performance development, particularly in Poland. ◊ Adjustments to the transport portfolio in Poland. ◊ Personnel expenses under pressure due to labor market
situation.
Region Eastern Europe
H 1 Change
2018 2017 absolute %
Freight carried (million t) 8.4 8.4 – –
Volume sold (million tkm) 2,426 2,204 + 222 + 10.1
Volume produced (million train-path km) 4.0 3.9 + 0.1 + 2.6
Total revenues (€ million) 151 141 + 10 + 7.1
External revenues (€ million) 103 98 + 5 + 5.1
EBITDA adjusted (€ million) 14 10 + 4 + 40.0
EBIT adjusted (€ million) 7 3 + 4 + 133
Gross capital expenditures (€ million) 3 2 + 1 + 50.0
Employees as of Jun 30 (FTE) 3,985 4,068 – 83 –2.0
The performance development in Eastern Europe was posi tive and driven by DB Cargo Polska. A major factor here were higher volumes in industrials due to new coal and ore transports.
The economic development was weakened: the improvement in EBITDA and EBIT was mainly due to income from the sale of locomotives.
◊ Revenue development was positive, mainly for performancerelated reasons. The inclusion of TransEurasia Logistics, acquired in the previous year, was supportive.
◊ Other operating income (+ 57.1%) increased mainly as a result of sales of locomotives in Romania.
◊ The cost of materials (+ 3.6%) increased, mainly for per formancerelated reasons and as a result of increased maintenance expenses in Poland.
◊ Personnel expenses (+ 8.8%) increased despite a cut in the number of employees mainly as a result of collective bargaining agreements (including an increase in the minimum wage).
◊ Other operating expenses (+ 28.6%) also increased. This was due in particular to the costs of disposal incurred during locomotive sales in Romania.
◊ Depreciation was at the level of the first half of 2017.Capital expenditure activities increased at a low level. This increase is mainly due to the postponement of capital ex penditures at DB Cargo Polska to the second half of 2017.
The number of employees declined, mainly due to optimization measures in Poland. This was offset by an increase in the number of employees in Southeastern Europe.
37
Interim Group Management Report―Development of business units

DB Schenker business unitChanges in presentation of lines of business
◊ The land transport line of business now also includes land transport activities outside Europe, mainly in Asia/Pacific, North America and Mexico. This has caused major restrictions in comparability to the first half of 2017.
◊ Activities in air and ocean freight are now each presented in their own separate lines of business, excluding the activities of Fairs&Exhibitions and Global Projects.
Events in the first half of 2018Legal issues
◊ DB Group is pursuing compensation for damage against the airlines that were part of the socalled air freight cartel, which, according to the findings of various competition authorities around the world, agreed on kerosene and security surcharges, among other things, from 1999 to at least 2006 at the expense of freight forwar ders such as DB Schenker. We have now concluded the proceedings in the US with outofcourt settlements relating to all the airlines involved. In addition, outofcourt settlements relating to the proceedings in Germany have now been concluded with four airlines. Settlement negotiations are being conducted with additional airlines to settle these proceedings.
Digitalization and innovation ◊ DB Schenker and Cisco are working together to shape the digitalization transformation. A joint innovation lab was opened in Houston, Texas/USA for testing and marketing new technologies for logistics.
◊ Customers can use the eSchenker online portal to configure and order 3D printing. For example, stainless steel medical devices, plastic robot grippers or customized packaging materials are currently being printed.
Other events ◊ New groupage services are standardized available across the board in Europe: DB Schenker launched its “Premium 13” service in the first half of 2018, delivering goods by 1:00 p.m.; its “Premium 10” service guarantees customers delivery by 10:00 a.m. on the following day.
◊ For the third time in a row, DB Schenker received the award for best logistics services provider in the Rail cate gory at the Asian Freight, Logistics&Supply Chain Awards (AFLAS). Continuous improvement of rail freight transport shipments between Europe and Asia in terms of costs, delivery time and service options means we occupy a leading position in transEurasian rail connections.
◊ DB Schenker operated the first block train carrying fresh agricultural produce from China to Russia. In the trial a train loaded with refrigerated containers took 17 days to travel from Chengdu to Moscow.
Development in the first half of 2018 ◊ Positive development in land transport, ocean and air freight. ◊ Development in contract logistics and exchange rate
effects had adverse impact. ◊ Market and competitive environment with positive stimuli.
DB Schenker
H 1 Change
2018 2017 Absolute %
Shipments in land transport1) (thousand) 52,522 50,751 + 1,771 + 3.5
Air freight volume (export) (thousand t) 649.4 613.1 + 36.3 + 5.9
Ocean freight volume (export) (thousand TEU) 1,087 1,063 + 24 + 2.3
Total revenues (€ million) 8,333 8,103 + 230 + 2.8
External revenues (€ million) 8,301 8,072 + 229 + 2.8
Gross profit margin (%) 34.7 34.7 – –
EBITDA adjusted (€ million) 314 305 + 9 + 3.0
EBIT adjusted (€ million) 216 208 + 8 + 3.8
EBIT margin (adjusted) (%) 2.6 2.6 – –
Gross capital expenditures (€ million) 78 76 + 2 + 2.6
Employees as of Jun 30 (FTE) 74,104 69,370 + 4,734 + 6.8
1) Including activities outside Europe as of 2018.
The volume development was very positive in air freight. Volumes also increased in land transport and ocean freight.
The economic development improved: the adjusted operating profit figures showed positive development due to a disproportionate rise in income. Adjusted for exchange rates, the development of operating profit was actually significantly more positive. Gross profit (+ 2.6%) also grew, most markedly in air freight, although all lines of business recorded gains. The development of gross profit matched revenue growth, so the gross profit margin remained un changed.
Revenues were generated 43% in land transport, 22% in air freight, 17% in ocean freight and 15% in contract logistics.
The operating profit development was positive and even better when adjusted for exchange rates. The adjust ed EBIT was generated 31% in land transport, 26% in air freight, 13% in ocean freight and 21% in contract logistics.
◊ The main drivers of the positive revenue development were land transport and air freight. Negative exchange rate effects and the conclusion of a major power plant project the previous year reduced revenues. Adjusted for exchange rate effects, development was positive in ocean freight and contract logistics.
!!!!!!
38
Deutsche Bahn Group―Integrated Interim Report January – June 2018

◊ Other operating income (+ 21.0%) increased, partly as a result of higher release of provisions including for claims for compensation for damage that did not arise.
◊ The cost of materials (+ 2.9%) rose, due especially to vol ume development. Higher freight rates also increased expenses in air freight. This was partly offset by lower expenses due to exchange rate effects and the conclusion of a major power plant project in the previous year.
◊ Personnel expenses (+ 3.1%) rose in the wake of a great er number of employees. The rise was clearer when adjust ed for exchange rate effects.
◊ Other operating expenses (+ 3.8%) rose in part due to the leasing of new space and higher purchases of IT services. Adjusted for exchange rates, the increase was significantly higher.
◊ Depreciation was at the level of the first half of 2017. Adjusted for exchange rates, it rose slightly at a low level.
Capital expenditure activities increased. Some of this growth came from North America and Asia/Pacific. However, Europe continued to be the main focus. Capital expenditures were made in particular in new construc tion and the expansion of freight forwarding facilities and terminals, as well as the introduction of new IT systems.
As of June 30, 2018, 29% of employees were employed in land transport, 9% in air freight, 7% in ocean freight and 31% in contract logistics. The number of employees in creased. Principal drivers were growth in volume and the takeover of temporary workers.
Land transport line of business ◊ Addition of activities outside Europe to the line of business. ◊ Within the system transport area, greater
focus on international transport services. ◊ Europe-wide pricing measures implemented
and cost reduction initiatives continued.
Land transport line of business
H 1 Change
2018 2017 absolute %
Shipments 1) (thousand) 52,522 50,751 + 1,771 + 3.5
System transports (thousand) 31,618 31,438 +180 + 0.6
Direct transports 1) (thousand) 4,726 3,907 + 819 +21.0
Parcels (thousand) 16,177 15,404 +773 + 5.0
Total revenues (€ million) 3,556 3,326 + 230 + 6.9
External revenues (€ million) 3,526 3,299 + 227 + 6.9
EBITDA adjusted (€ million) 103 96 + 7 + 7.3
EBIT adjusted (€ million) 68 62 + 6 + 9.7
Employees as of Jun 30 (FTE) 21,700 19,661 + 2,039 + 10.4
1) Including activities outside Europe as of 2018.
Activities previously allocated to contract logistics and other areas will be reported under the land transport line of business from the 2018 financial year onwards. This resulted in restrictions in comparability with the previous year.
In a market environment which was marked by grow ing demand, volume development was positive overall. Adjusted for the effects of the reassignments, volume in direct transports fell due to crosscountry declines.
The economic development was positive: the develop ment of adjusted EBITDA and EBIT was better. However, this was due to the reassignments. The increase in revenues from European business was offset by increases in expenses.
◊ Revenue development was up as a result of price and volume effects and the reassignments. This was partly offset by negative exchange rate effects.
◊ The cost of materials (+ 6.7%) rose. This was partly due to the higher direct and groupage transports. Exchange rate effects had an offsetting effect.
◊ Personnel expenses (+ 7.1%) increased, mainly as a result of the increase in the number of employees.
◊ Other operating expenses (+5.4%) increased noticeably as a result of higher rental and IT expenses.
The number of employees has increased as a result of business development and the takeover of temporary workers.
Air freight line of business ◊ Noticeable effects due to positive development of volumes
and increasing freight rates. ◊ Focus on increasing productivity through standardization.
Air freightline of business
H 1 Change
2018 2017 absolute %
Air freight volume (export) (thousand t) 649.4 613.1 + 36.3 + 5.9
Total revenues (€ million) 1,806 1,649 + 157 + 9.5External revenues (€ million) 1,806 1,649 + 157 + 9.5EBITDA adjusted (€ million) 61 55 + 6 + 10.9EBIT adjusted (€ million) 57 51 + 6 + 11.8
Employees as of Jun 30 (FTE) 6,877 6,431 + 446 + 6.9
Volumes increased significantly in air freight. This growth was driven by routes from North America to Asia/Pacific and Europe as well as transpacific transports.
The economic development was positive, adjusted EBITDA and adjusted EBIT both increased significantly. The significant market growth combined with weaker growth in cargo space caused freight rates to rise.
39
Interim Group Management Report―Development of business units

◊ The main drivers of revenue growth were freight rate and volume trends. Adjusted for exchange rates, revenues increased even more sharply.
◊ The cost of materials (+ 12.5%) also rose significantly accord ing to volume and freight rate development.
◊ Personnel expenses (+ 3.1%) rose in the wake of a great er number of employees.
The number of employees increased as a result of business development.
Ocean freight line of business ◊ Effects of increase in performance are offset
by exchange rate effects. ◊ Focus on efforts to optimize capacity utilization,
costs and purchase prices.
Ocean freightline of business
H 1 Change
2018 2017 absolute %
Ocean freight volume (export) (thousand TEU) 1,087 1,063 + 24 + 2.3
Total revenues (€ million) 1,420 1,458 –38 –2.6External revenues (€ million) 1,420 1,458 –38 –2.6EBITDA adjusted (€ million) 29 22 + 7 + 31.8EBIT adjusted (€ million) 28 21 + 7 + 33.3
Employees as of Jun 30 (FTE) 5,006 4,859 + 147 + 3.0
Ocean freight volume increased in line with market development. Transpacific transports and exports from the Middle East recorded significant increases. This was partly offset by weak demand for routes between Europe and the Far East.
The economic development was positive, adjusted EBITDA and adjusted EBIT both increased.
◊ Revenue development declined as a result of exchange rate effects. Adjusted for exchange rates, revenue in creased for performancerelated reasons.
◊ The cost of materials (– 3.8%) fell despite the positive volume development due to countervailing exchange rate effects. Adjusted for exchange rate effects, the cost of materials increased slightly.
◊ Personnel expenses (+ 1.1%) were just above the level of the first half of 2017 as a result of collective bargaining agreements. This was driven by the increase in the number of employees. Adjusted for exchange rate effects, personnel expenses increased significantly.
The number of employees increased as a result of busi ness development.
Contract logistics line of business ◊ Negative effects of reallocating activities to land transport. ◊ Growth in Europe and America continues. ◊ Business development in Asia/Pacific is weaker. ◊ Contracts with major customers completed, extensive
activities to gain new business.
Contract logisticsline of business
H 1 Change
2018 2017 absolute %
Total revenues (€ million) 1,265 1,301 –36 –2.8External revenues (€ million) 1,264 1,300 –36 –2.8EBITDA adjusted (€ million) 69 79 –10 –12.7EBIT adjusted (€ million) 46 56 –10 –17.9
Employees as of Jun 30 (FTE) 22,864 20,572 + 2,292 + 11.1
Some activities previously allocated to contract logistics will be reported under the land transport line of business from the 2018 financial year onwards. This reduces revenue and expenses, resulting in restrictions in comparability.
The economic development in contract logistics was unsatisfactory: the development of adjusted EBITDA and EBIT was below the level of the first half of 2017 as a result of weaker business development and the reclassification of activities.
◊ Revenue development was negative due to exchange rate effects. Adjusted for exchange rates, revenues increased slightly. The good business development in Europe and North America was noticeable here.
◊ The cost of materials (– 16.4%) decreased as a result of ex change rate effects and the reclassifications.
◊ The increase in personnel expenses (+ 6.5%) was driven by an increase in the number of employees. Exchange rate effects and the reclassifications had an offset ting effect, reducing expenses.
The increase in the number of employees was due to the continued business expansion as well as the taking on of temporary workers.
!!!
40
Deutsche Bahn Group―Integrated Interim Report January – June 2018
Infrastructure
Progress on the Stuttgart — Ulm project Construction at Stuttgart central station continues to progress. Further reinforcement and concreting work on the floors and walls in some construction phases is underway. The west tunnel of the middle Filder tunnel has meanwhile been conventionally bored. At the northern end, breakthrough of the second Feuerbach tunnel has been completed. Tunnel boring at the northern end is complete, all relevant anhydrite lenses in Cannstatt and Feuerbach tunnels have been successfully dealt with. The fourth and last tunnel has successfully passed under the Neckar river. Following submission of an appeal to the Higher Administrative Court, no further contracts will be awarded in the airport sector for plan approval section 1.3a despite possible immediate enforceability until a final judgment has been issued. About 41 km, representing more than twothirds of the tunnels required for Stuttgart 21, have been drilled and excavated.
On the Wendlingen – Ulm new construction line, a stretch of over 47 km, or more than threequarters of the tunnels, has already been bored and extracted. The tunnel borer has also drilled the second tunnel of the 8,806 m Bossler tunnel above Filstal. The two tunnel borers working on the Albvorland tunnel, which will be more than 8 km long, have already progressed more than 2 km. Restoration of the landscape along the line on the Alb plateau is under way. The work on constructing the advance scaffolding for the Filstal bridge has been completed.
Cost and schedule development for Stuttgart 21 and the Wendlingen — Ulm new construction lineOn January 26, 2018, the Supervisory Board of DB AG deliberated the schedule and cost situation for the Stuttgart 21 project. The cost forecast was increased to a total value of about € 7.7 billion. To take into account unanticipated events, further funds of about € 0.5 billion have been earmarked, meaning that the overall funding framework has increased to € 8.2 billion. In addition to increases in construction prices, the increase in costs results in particular from significantly more elaborate procedures for tunneling in the anhydrite rock, more extensive approval processes as a result of species protection and the postponement of commissioning to 2025, among other things.
The cost and schedule planning for the Wendlingen – Ulm new construction line was also deliberated. The cost forecast was increased to € 3.7 billion and the completion date postponed to 2022. The cost increase is mainly down to greater geological risks as well as additional capital expenditures in the modernization of Ulm central station. The delay results from more elaborate plan revision procedures for species protection in the Albvorland.
Modernization of the existing network is on scheduleIn the fourth year of LuFV II, we have already been able to complete various measures and projects. We are confident of our ability to complete implementation of the plan by the end of this year and thus to ensure full achievement of the LuFV II targets. To enable us to steadily continue along our chosen path even after 2020, we have commenced negotiation of a followon agreement to LuFV II with the Federal Government, as scheduled.
Capital expenditure program for the future in the third yearThe BMVI has provided additional Federal funding of € 995 million from 2016 to 2018 as part of the German Federal Government’s capital expenditure program for the future (Zukunftsinvestitionsprogramm; ZIP). In the first two years, spending totaled about € 295 million, followed by a further € 83 million in the first half of 2018.
Start of planning for the 740 m networkCreating a continuous rail network for 740 m freight trains is a key element for enhancing cost efficiency in rail freight trans port and making more efficient use of the rail infrastructure.
BMVI has therefore defined a 740 m network action plan, which has been included under the compound item “Further network measures aimed at relieving bottlenecks” in the potential requirements of the Federal Transport Infrastructure Plan (Bundesverkehrswegeplan; BVWP) 2030. BMVI has determined the profitability of the 740 m network and has assured Federal funding for the start of planning. The requirement plan measure is currently focusing on 75 individual actions, such as relocating signals and installing switches to create new possibilities for overtaking.
!!!
41
Interim Group Management Report―Development of business units
Accident in AichachOn May 7, 2018, a passenger train operated by Bayerische Regiobahn collided with a freight train near Aichach station. Two people died in the accident and several were injured.
We sincerely regret the consequences of this tragic train collision. Conclusive statements cannot yet be made about the causes and possible actions to be taken as the investigation of the accident has not yet been completed.
DB Netze Track business unitGeneral frameworkDemand for train-paths increased againThere are now more than 420 TOCs in Germany, which have submitted a total of 84,038 trainpath requests to DB Netz AG for the 2019 annual timetable, 5.9% more than in the previous year. Of this increase, market growth accounts for about 1 percentage point, while the majority is due to in creased construction volume which is resulting in many more constructionrelated variants. In addition, customers are being advised more intensively, resulting in more precise orders with several time slices. Of all the trainpath registrations, longdistance rail passenger transport ac counted for the largest increase of more than 35% (freight transport +17%, regional rail passenger transport +1%).
Events in the first half of 2018Record capital expenditures in infrastructure In 2018, € 5.5 billion is available for building new rail infrastructure and maintaining the existing network. In the first halfyear, we have already renewed 539 km of track, 712 switches and about 6,300 m² of bridges. In addition, € 2.6 billion has been earmarked for more than 40 new construction and expansion projects. Across Germany, 12 major construction projects are starting. They are joined by 19 com missioning projects.
Bundling in over 100 corridors and a professional construction management are indispensable for the large number of construction sites – up to 800 a day at peak times. By pooling the building sites, we can minimize the impacts on normal operation. In addition, the CONSTRUC-
TION MANAGEMENT CENTER µ8 is collaborating with the regional units on optimizing and improving the management of construction works. Moreover, we plan to employ about 2,000 new constructionrelated employees in 2018. These measures enabled us to further reduce the delays caused by construction works in the first half of 2018 de spite the larger number of building sites.
Emergency Management Manual approvedTo enable better handling of major disruptions, the Chief Executive Officers of the railway companies operating in the RhineAlps rail freight transport corridor approved a joint Emergency Management Manual in May. The lead authors were the infrastructure operators (DB Netz AG and SBB Infrastruktur) and TOCs that were hardest hit by the temporary closure of the Rhine valley railway (Rheintalbahn). The Manual focuses on processes for better coordination and communication among infrastructure operators when international disruptions occur. In addition, the Manual describes how infrastructure operators define diversions and publish them, together with the relevant technical parameters. This enables TOCs to prepare for diversions and to act quickly in the event of a disruption.
Action plan for customer-friendly construction In early June 2018, rail transport companies and associations submitted their “Round Table for Building Site Management” findings report to BMVI. The aim was to develop an action plan for more transport, improved quality and reliability in order to minimize the adverse effects on passengers and cargo customers wherever possible during the urgently needed modernization of the rail network. Four specific modules for improving construction management were agreed: agreements between the Federal Government and DB Netz AG on customeroriented construction, an incentive system between DB Netz AG and TOCs, improved risk distribution between public transport authorities and TOCs, and the optimization of construction processes and communication.
Temporary closure of the Rhine valley railway–damage to the Rastatt tunnelFollowing the damage in the east tunnel of the Rastatt tunnel, preparations to renovate the tunnel have been underway since March. At the same time, the mediation proceedings agreed between DB Group and ARGE Tunnel Rastatt are ongoing to clarify the cause of the damage during tunnel boring and thus who is responsible. A team of technical and legal experts is charged with investigating the causes and drafting a settlement proposal. Although originally ex pected to last six months, the process is taking longer as further investigations are needed to clarify the causes of the damage. To this end, a further drilling program will take place within the next three months. The mediation proceedings are expected to finish in early 2019.
Deutsche Bahn Group―Integrated Interim Report January – June 2018
42

DB Netz AG joins Orient/East — Med RFCDB Netz AG has joined the ŒORIENT/EAST – MED EUROPEAN
RAIL FREIGHT CORRIDOR (RFC) (WWW.RFC7.EU). The resulting crossborder transport axis stretches about 9,000 km from the North and Baltic Seas to the Aegean and Black Sea. The aim is to eliminate border hurdles and offer dependable and harmonized transport services, thus further strengthening rail freight transport beyond Europe’s borders.
Capital expenditures initiative for the Marsh railwayWith disruptions continuing on the Marsh railway (Marschbahn), we are working on a modernization concept. The main focus is a capital expenditures initiative to bring forward capital expenditures. To achieve this, we are raising the volume of capital expenditures over the next four years from € 53 million to nearly € 160 million.
Progress with regard to new construction and expansion measuresHanau – Fulda planning is progressing
Plans for the new section of line between Gelnhausen and Fulda in the Hanau – Würzburg/Fulda expansion/new construction project have progressed: Line Variant IV is being included in the regional planning procedure as the preferred solution. Compared with all other variants, it will have the least impact overall on people and the environment and will shorten passengers’ travel time between Frankfurt and Fulda by 11 minutes. The additional tracks will also improve local transport services. The decision was preceded by intense discussions with the region that lasted several years. Our early and comprehensive involvement of the general public has been described as exemplary.
Fehmarn Belt Fixed Link – approval procedure
The Fehmarn Belt Fixed Link project is in the design and approval planning stage. The documents for plan approval section 6 have been submitted to the Federal Railway Authority. Applications for the remaining sections will be filed between now and early 2019. While the approval proceedings are ongoing, a report is being drafted for BMVI in preparation for the Bundestag’s discussion of the demands of the region. Construction of a new link across Fehmarn Sound is also planned in connection with the rail link to the Fehmarn Belt crossing. The decision in favor of a preferred variant will probably be made in the first quarter of 2019.
Progress on the second main S-Bahn (metro) line in Munich
Since April 2018, legally valid building permits have been available for all three plan approval sections for the second main line in Munich. At present, preparations for construction are ongoing in the Overground West section and at the central station. The main construction work will begin at the end of 2018. At Marienhof, preparations for construction have finished and archaeological poststudies are currently being conducted prior to main construction commencing.
Developments on expansion project 38 Munich – Mühldorf – Freilassing
The threetrack expansion between Freilassing and Salzburg was completed in December 2017. Preliminary planning of the twotrack expansion between Markt Schwaben and Ampfing has been completed, as has the electrification.
Expansion of the Cologne hub
To relieve the heavily frequented Cologne hub, 15 infrastructure measures are planned. At present, the S 11 proj ect with its core package of expansion measures between Cologne central station and Bergisch Gladbach is at the preliminary planning phase. Expansion of the S 13 from Troisdorf to BonnOberkassel is on schedule, including the initial bridge works. Regarding longdistance, the expansion south of Gummersbacher Strasse is in the design and ap proval planning stage. Of the ABS 4 project, plan approval section 1 is in the execution phase and section 2 is in the design and approval planning stage.
Progress on the Knappenrode ‒ Horka ‒ German/Polish border expansion line
Recommissioning of the line between Knappenrode and the German/Polish border is planned for December. The main construction work in the section from Niesky to Horka was completed in December 2017. Since then, the structural engineering has been put in place, the embankment has been made fit for purpose, and the overhead wiring and signal technology have been newly installed. New platforms for regional transport are being built at Niesky station.
43
Interim Group Management Report―Development of business units
Relocation of the Hamburg-Altona long-distance train station
The existing terminal station at Altona will be replaced by a new station at the Diebsteich site. The current SBahn (metro) station in Altona will remain. The project is being financed primarily through the LuFV, from DB funds and from the proceeds from the sale of land to the Free and Hanseatic City of Hamburg. The plan approval decision was issued on December 29, 2017. Three cases are currently pending against the Federal Railway Authority’s plan approval decision before Hamburg’s Higher Administrative Court. A decision is expected in July. Main construction work is scheduled to start in fall 2018.
Construction of new S4 S-Bahn (metro) line from Hamburg to Bad Oldesloe
The S4 is being planned to strengthen local transport between Hamburg and SchleswigHolstein. The draft plans for plan approval section 1 have been completed. The two other sections are still works in progress. The plan approval procedure hearing for plan approval section 1 has taken place, while publication of the plan approval documentation for sections 2 and 3 is scheduled to take place before the end of 2018. Initial construction work is slated for 2020.
Development of the Frankfurt hub
The Frankfurt am Main hub is one of the most heavily frequented in our network. To ensure rail transport is made fit for the future, we are revamping the Stadium hub, building two tracks on the Homburg embankment, connecting Gate way Gardens to the metro network, expanding the S6 SBahn (metro) and building an SBahn (metro) line on the northern side of the Main river. Work on the crossing at the Homburg embankment has commenced. Along the S6, work is ongoing to expand the line between Frankfurt West and Bad Vilbel to four tracks.
Progress on expansion project 46/2 Emmerich – Oberhausen
Construction work on expansion project 46/2 Emmerich –Oberhausen is progressing on schedule. The hearings for all outstanding plan approval sections have taken place. Building permits for further plan approval sections are expected to be issued before the end of 2018.
Developments on the Rhine-Ruhr-Express
Agreement governing the funding of the electronic interlocking at Düsseldorf is expected to be reached with the Federal Government over the course of the next 12 months. Objections have been received to plan approval section 2.1, Düsseldorf, and the hearings are expected to be set for 2018. Planning of phase 2 in DüsseldorfReisholz has commenced with the inclusion of DüsseldorfBenrath as a stop in the Federal Transport Infrastructure Plan. Construction work on plan approval section 4.0, Mülheim, has begun.
Digitalization and innovationProgress in standardizing maintenance
Within the framework of the standardization of production system maintenance (Standardisierung Produktionssystem Instandhaltung; SPI), the scheduling and feedback process of operational maintenance has been standardized and digitalized. The rollout of level 1 has been completed as scheduled. Level 2 commenced in 2018 as part of the OPEX program. It focuses predominantly on shop floororiented performance management based on feedback from operations staff. The third wave of rollouts is currently taking place at seven sites. Nine sites are already working in accordance with the new standard. As part of level 2, workflows and work preparation and execution processes will be further standardized. The IT tools developed for this purpose are currently undergoing trials. The nationwide rollout of both approaches will probably be completed around mid2020.
First digital interlocking commences operation
Europe’s first digital interlocking commenced operation in January in AnnabergBuchholz on the Ore Mountain Railway (Erzgebirgsbahn). This preseries project heralds a revolution in command and control technology. The digital interlocking marks the start of the further development and nationwide implementation of a new and innovative generation of interlockings. The technology can be used both to operate main lines with tight schedules and major hub stations, and for simpler applications in rural areas.
Rollout of drive-related switch diagnostics
In order to optimize the availability of switches, a digital remote diagnostic system is used to detect potential faults before they can occur. The DIANA diagnostics platform can be used for preventive maintenance to remedy faults. This should make it possible to reduce driverelated switch defects by up to 50%. Some 18,400 switches are connected to DIANA.
Deutsche Bahn Group―Integrated Interim Report January – June 2018
44

Development in the first half of 2018 ◊ Revenue growth from price adjustments and
increased train-path demand. ◊ Increased maintenance expenses. ◊ Higher personnel expenses.
DB Netze Track
H 1 Change
2018 2017 absolute %
Punctuality DB Group (rail) in Germany (%) 93.9 94.5 – –Punctuality (rail) in Germany 1) (%) 93.3 94.2 – –Train kilometers on track infrastructure (million train-path km) 539.3 533.5 + 5.8 +1.1 thereof non-Group railways 172.2 164.3 +7.9 + 4.8 share of non-Group railways (%) 31.9 30.8 – –
Total revenues (€ million) 2,720 2,652 + 68 +2.6External revenues (€ million) 754 746 + 8 +1.1 share of total revenues (%) 27.7 28.1 – –EBITDA adjusted (€ million) 815 815 – –EBIT adjusted (€ million) 483 389 + 94 +24.2Operating income after interest (€ million) 375 250 +125 + 50.0ROCE (%) 5.3 4.4 – –Capital employed as of Jun 30 (€ million) 18,193 17,780 + 413 +2.3Net financial debt as of Jun 30 (€ million) 9,330 10,092 –762 –7.6Redemption coverage (%) 15.9 14.1 – –Gross capital expenditures (€ million) 2,634 2,907 –273 – 9.4Net capital expenditures (€ million) 545 525 +20 + 3.8
Employees as of Jun 30 (FTE) 46,371 44,717 +1,654 + 3.7
1) Non-Group and DB Group train operating companies.
Punctuality in Germany declined on the part of both nonGroup and DB Group TOCs.
Train kilometers on track infrastructure increased in the wake of higher demand from nonGroup customers (especially in freight and regional transport) and from DB Long Distance and DB Regional. Lower demand from DB Group freight customers had the opposite effect.
However, economic performance was modest overall. The positive income trend was offset by the increase in personnel and maintenance expenses, leaving adjusted EBITDA unchanged compared to the first half of 2017. Adjusted EBIT showed positive development due to lower depreciation.
◊ Total revenues increased, with the negative effects of storm Friederike more than offset by price adjustments and increases in demand.
◊ Other operating income (+6.0%) increased, partly due to higher income from the sale of property, plant and equipment (sale of real estate) and scrap. Less income from compensations for damage and refund of expenses had the opposite effect.
◊ The cost of materials increased (+2.6%), driven primarily by higher maintenance expenses for qualityrelated measures and the remediation of severe weather damage.
◊ The increase in personnel expenses (+5.6%) was primarily attributable to wage adjustments and the higher number of employees.
◊ Other operating expenses rose (+5.5%), partly because of higher expenses for IT services, grants for thirdparty facilities and rents.
◊ Depreciation (–22.1%) decreased following adjustments to useful lives of facilities due to the change from an accounting approach to an economic approach.
Operating income after interest also improved, further supported by lower interest expenses, which led to an improvement in net operating interest.
ROCE improved in the wake of positive profit development, burdened by a slight increase in capital employed.
Net financial debt fell, primarily due to the capital in crease at DB Netz AG. This also slightly improved the re demp tion coverage.
Gross capital expenditures were slightly lower due to the smaller volume relating to German unification transport projects no. 8 (Berlin – Munich line). We expect capital ex penditures to expand again significantly in the second half of 2018. Net capital expenditures increased slightly.
The number of employees rose, mainly due to increases to cover existing and future staffing requirements, especially in maintenance and construction projects.
DB Netze Stations business unitEvents in the first half of 2018Improvements in station qualityWe launched numerous projects to improve the quality of stations, some of which have already been completed.
◊ An SBahn (metro) Task Force has identified actions to improve quality at SBahn (metro) stations.
◊ Modernization of the underground passenger transport facilities has commenced at Hamburg’s Jungfernstieg, Stadthausbrücke, Königsstrasse, Landungsbrücken and Reeperbahn SBahn (metro) stations. Some of the works have already been completed.
◊ Extensive work has commenced in Frankfurt am Main on its central station underground, Hauptwache, Mühlberg, Ostendstrasse and Airport Regional stations. At the central station, two generous waiting areas have already been equipped with new benches.
◊ The test stair access to Rosenheimer Platz has been com missioned in Munich. With its nextgeneration design – especially with regard to material and lighting – it is slated to become the role model for accessing other Munich stations.
◊ Düsseldorf Central Station is being equipped with three new waiting pavilions and benches. Two pavilions had already been finished by the end of June.
45
Interim Group Management Report―Development of business units
Other events ◊ A new cleaning concept and a WhatsApp service aimed at combating dirt in stations were implemented in spring 2018 at more than 230 selected stations (in cluding some 160 SBahn (metro) stations in Berlin).
Development in the first half of 2018 ◊ Increased demand from additional traffic and
increased schedule frequencies. ◊ Rental revenues are driven by price and volume effects. ◊ Burdens from higher personnel expenses. ◊ Measures to further reduce energy consumption
pressed ahead.
DB Netze Stations
H 1 Change
2018 2017 absolute %
Facilities quality (grade) 2.89 2.91 – –
Station stops (million) 75.1 74.8 + 0.3 + 0.4
thereof non-Group railways 18.2 17.9 + 0.3 +1.7
Total revenues (€ million) 668 635 + 33 + 5.2
thereof station revenues (€ million) 437 424 +13 + 3.1
thereof rental (€ million) 200 196 + 4 +2.0
External revenues (€ million) 297 273 +24 + 8.8
EBITDA adjusted (€ million) 228 217 +11 + 5.1
EBIT adjusted (€ million) 158 150 + 8 + 5.3
ROCE (%) 11.0 10.5 – –
Capital employed as of Jun 30 (€ million) 2,886 2,859 +27 + 0.9
Net financial debt as of Jun 30 (€ million) 1,237 1,215 +22 +1.8
Redemption coverage (%) 29.2 27.5 – –
Gross capital expenditures (€ million) 291 253 + 38 +15.0
Net capital expenditures (€ million) 138 80 + 58 +72.5
Employees as of Jun 30 (FTE) 5,649 5,404 +245 + 4.5
The quality of the facilities at passenger stations remained at a good level.
The performance development was marked by a slight in crease in the number of station stops. This was mainly due to increased schedule frequencies and additional traffic in regional transport. In particular, the higher demand was driven by nonGroup railways.
The economic development was positive: overall, higher income compensated for the increase in expenses, particularly maintenance and personnel expenses, resulting in an im prove ment in operating profit.
◊ The rise in revenues is attributable to higher station revenues as a result of volume and price effects as well as higher revenues from rental. The development of external revenues reflects the growing market share of nonGroup railways.
◊ Other operating income decreased (–4.2%) due to the fact that income from investment grants was higher for seasonal reasons in the first half of 2017.
◊ The cost of materials increased (+1.6%). Higher maintenance expenses due to the implementation of measures to en hance quality, punctuality and customer satisfaction were partially offset by lower volumedriven energy expenses.
◊ Personnel expenses (+7.1%) increased significantly, driven primarily by the larger number of employees, alongside collective wage increases.
◊ The increase in other operating expenses (+9.3%) was partially due to higher rents, increased disposals of prop erty, plant and equipment, and higher IT and communication services, partially as a result of the larger headcount.
◊ Depreciation increased (+4.5%) in the wake of the larger capital expenditure volume.
The positive EBIT development resulted in an increase in the ROCE since capital employed remained roughly stable.
Net financial debt increased, mainly as a result of higher net capital expenditures.
Operating cash flow was higher as a result of the profit development and improved redemption coverage. Higher net capital expenditures had the opposite effect.
The higher capital expenditures were focused primarily on renovating existing stations and projects under RAILWAY
OF THE FUTURE . The number of employees rose due to the increase in
personnel in construction and facility management.
DB Netze Energy business unitMarkets and strategyRealignment of the business unit strategyThe new strategy “Departure into the DB EnergyTransition” focuses on DB Netze Energy’s contribution to meeting DB Group’s CO₂ targets and addresses the following areas of action: making traction current green, replacing diesel on road and rail and energy efficiency in DB premises and properties. Alongside the strategic measures, the strategy also showcases the economic challenges posed by making traction current green, replacing diesel on road and rail and recent trends in the energy industry. Against this backdrop, we plan to renegotiate energy supply contracts, clarify fund ing issues and challenge the current business model. Our aim is to become a provider of complex services.
Events in the first half of 2018Successful launch of business with private customersAfter one year, DB Power – our ecopower product for pri vate households – already has more than 10,000 customers. As such, DB Netze Energy has closed the gap separating it from fullservice provision. DB Power only supplies ecopower bearing the seal of quality of the okpower label.
!!!
Deutsche Bahn Group―Integrated Interim Report January – June 2018
46

Charging at the station projectDB Netze Energy participated in the Charging at the station project under the BMVI’s Federal program on charging infrastructure for electric vehicles in Germany. Public quickcharging infrastructures with ecopower have been set up at Frankfurt am Main, Hanau, Regensburg and Düsseldorf stations. Thanks to participation in the roaming association, customers of other emobility providers can also use the charging infrastructure. With this project, DB Netze Energy is supporting the further development of the intermodal interface between road and rail.
Further development of the traction current network access modelSince 2014, DB Netze Energy has been operating a network access model offering traction current to all TOCs. In the first half of 2018, key steps were decided in ongoing talks with market players and the German Federal Network Agency to further develop the network access model and to simplify the process in important areas. A new discussion forum has been set up for this purpose – the Traction Current Grid Task Force. The development of market share shows that the network access model works: in 2017, some 70% of the final consumption of nonGroup railways was provided by other suppliers.
Development in the first half of 2018 ◊ Lower demand for electricity and diesel products. ◊ Higher prices on primary energy markets. ◊ Increased capital expenditures in building new traction
current lines and modernizing existing ones.
DB Netze Energy
H 1 Change
2018 2017 absolute %
Supply reliability (%) 99.99 99.99 – –
Traction current (16.7 Hz and direct current) (GWh) 4,146 4,283 –137 –3.2
Traction current pass-through (16.7 Hz) (GWh) 842.6 999.6 –157.0 –15.7
Stationary energy (50 Hz and 16.7 Hz) (GWh) 8,885 9,813 – 928 – 9.5
Diesel fuel (million l) 214.3 218.1 –3.8 –1.7
Total revenues (€ million) 1,383 1,416 –33 –2.3
External revenues (€ million) 628 654 –26 – 4.0
EBITDA adjusted (€ million) 47 79 –32 – 40.5
EBIT adjusted (€ million) 12 44 –32 –72.7
ROCE (%) 2.2 9.4 – –
Capital employed as of Jun 30 (€ million) 1,097 947 +150 +15.8
Net financial debt as of Jun 30 (€ million) 646 445 +201 + 45.2
Redemption coverage (%) 12.2 24.7 – –
Gross capital expenditures (€ million) 81 48 + 33 + 68.8
Net capital expenditures (€ million) 40 17 +23 +135
Employees as of Jun 30 (FTE) 1,734 1,742 – 8 – 0.5
Supply reliability again remained at its previous high level. Volumes declined:
◊ Traction current sales decreased, mainly due to less de mand from DB Group customers, particularly in freight transport.
◊ Traction current volumes passed through for nonGroup customers decreased. Adjusted for this effect, an in crease was recorded from shifts from full power supply to passthrough.
◊ Sales of stationary energy to nonGroup customers de creased, primarily due to smaller volumes from shortterm portfolio optimization measures on the energy market as a result of fewer energy schedule deviations. On the opposite side, business with industrial customers increased.
◊ The declining demand for diesel fuels is attributable to the development of DB Group customers in freight and regional passenger transport. Demand from nonGroup customers increased slightly.
The economic development was negative. Lower income and much higher purchase prices on the primary energy markets resulted in weaker adjusted EBITDA and EBIT.
◊ Revenues decreased in the wake of lower sales volumes of traction current and portfolio optimizations on the energy market. Higher revenues from industrial customers had a compensating effect and were driven by both volumes and prices.
◊ The increase in other operating income (+47.4%) was due to higher income from insurance payouts and effects from the release of provisions.
◊ The cost of materials – which is mainly determined by the trend in energy purchase costs – was virtually un changed (+ 0.2%). Volumedriven declines were completely offset by negative price effects from much higher primary energy prices for electricity and mineral oil products.
◊ Personnel expenses (+1.7%) increased as a result of collective bargaining agreements.
◊ The increase in other operating expenses (+ 7.1%) re flects the costs of further developing our IT systems.
◊ Depreciation was virtually unchanged. The decrease in operating profit, accompanied by an increase in capital employed, resulted in a significant weakening of the ROCE. The higher capital employed is due in particular to the increase in inventory and temporarily higher trade receivables from nonGroup customers.
47
Interim Group Management Report―Development of business units

Redemption coverage decreased significantly due to a decline in operating cash flow accompanied by an increase in net financial debt. The development of net financial debt was influenced by the higher capital employed.
Increased capital expenditures in building new traction current lines and modernizing existing ones resulted in an increase in capital expenditures, together with the faster execution of projects.
The number of employees was virtually unchanged.
Subsidiaries/other
Events in the first half of 2018DB E&C continues on its path of growthDB E & C expertise is in demand worldwide
◊ For years, DB Engineering&Consulting (DB E&C) has been involved in planning the traffic systems and structural engineering for the TEN project Karlsruhe – Basel. The mandate has now been expanded to include the technical equipment. DB E&C is therefore now providing allinclusive planning services for both plan approval sections, including plan reviews, acceptance tests and construction supervision.
◊ In the project to modernize Dortmund central station, DB E&C has won the contract for supervising the construction of the platform facilities, including passenger tunnels. This includes construction management planning services, welding and environmental supervision, and health and safety coordination.
◊ In January, DB E&C signed a consultancy agreement for Metro Mumbai Line 4 in Mumbai/India. The 32.5 km line, with 32 stations, is planned to carry some 335,000 passen gers every day in 2031. As general consultant, DB E&C is managing a consortium with Louis Berger and Hill International. After Bhopal and Indore, this is now the third major metro project that DB E&C has acquired in India in just a few months.
◊ Together with Yenon, DB E&C won the tender for planning and supervising the construction of the 28 km local Purple Line in Tel Aviv/Israel. The experts will also provide services to integrate a further local line (Red Line, 24 km) into the overall system for the CRTGCREEG joint venture. DB E&C is advising ISR, Israel’s stateowned railway company, on its electrification program, on defining standards, and on procuring rolling stock.
IBN-InfraTool developed by DB E & C provides digitalization for efficient project deliveryManaging commissioning requires the bundling of technical, organizational and schedulerelated factors of an infrastructure project and ensures the conditions are met for safe, plancompliant and punctual commissioning. The IBNInfraTool supports commissioning management with structured data and document collection, management and assessment, smart links, completeness and plausibility tests and automated generation of reports and applications.
Development in the first half of 2018 ◊ Increased expenses due to Group projects. ◊ Increase in the number of employees to cope
with enhanced workload.
Subsidiaries/other
H 1 Change
2018 2017 absolute %
Total revenues (€ million) 2,274 2,154 +120 + 5.6
External revenues (€ million) 252 234 +18 +7.7
EBITDA adjusted (€ million) –160 –113 – 47 + 41.6
EBIT adjusted (€ million) –280 –235 – 45 +19.1
Gross capital expenditures (€ million) 184 139 + 45 + 32.4
Net capital expenditures (€ million) 181 139 + 42 + 30.2
Employees as of Jun 30 (FTE) 53,386 51,291 +2,095 + 4.1
Subsidiaries/other encompasses the governance func tions (such as corporate development, finance or human resources) and the dependent service units (such as the Accounting Shared Service Center or HR services) of the holding company DB AG. This segment also bundles the legally independent service units within DB Group (such as DB Temporary Work and DB JobService) and the independent operating service units (such as DB Vehicle Maintenance or DB Systel) which provide services to several DB Group business units.
The increase in total revenues was primarily driven by higher revenues from DB Group customers, partly in connection with the growth in building and project business at DB Bahnbau and DB E&C and with the growth in project business at DB Systel.
The decrease in adjusted EBITDA and adjusted EBIT was mainly due to collective wage increases driving personnel expenses, and to project costs for measures under RAILWAY
OF THE FUTURE .The increased capital expenditures were mainly attrib
utable to the purchase of new ticketing machines and of construction vehicles at DB Bahnbau.
The number of employees increased, partly as a result of additional recruitments for Group projects and commissions, especially at DB Systel, DB E&C, DB Vehicle Maintenance and DB Security.
!!!
Deutsche Bahn Group―Integrated Interim Report January – June 2018
48
Our business activities are associated with risks as well as opportunities. Our business policy therefore aims to take advantage of opportunities through our opportunity man-agement system, while also actively managing those risks identified within the framework of our risk management system. There were no significant changes to DB Group’s RISK MANAGEMENT SYSTEM (2017 INTEGRATED REPORT µ150 FF.)
in the first half of 2018. Nor were there any significant changes to DB Group’s MAJOR OPPORTUNITIES AND RISKS (2017
INTEGRATED REPORT µ152 FF.).
The opportunities and risks analysis was performed compared to the updated anticipated DEVELOPMENT OF
DB GROUP µ51 F. in 2018.Compared to the estimate in the 2017 Integrated Report,
the total risk position has decreased by € 0.2 billion to € 0.2 billion as a result of risks being processed in the updated estimate. The risks in the EBIT forecast are mostly in the areas of procurement and energy markets in the amount of € 0.1 billion (thereof very likely (vl): € 0.0 billion),
and production and technology and market and competi-tion in the amount of € 0.05 billion each (thereof very likely (vl): € 0.0 billion).
Compared to the estimate in the 2017 Integrated Re port, the overall opportunity position is unchanged at € 0.1 billion. Opportunities exist mostly in the areas of production and technology in the amount of € 0.1 billion (thereof very likely (vl): € 0.0 billion).
Overall, this results in a balanced profile of the very likely opportunities and risks for the 2018 financial year. In total, the likely risks outweigh the likely opportunities.
Our analyses of risks, countermeasures, hedging and precautionary measures, together with the opinion of the Group Management Board based on the current risk assess-ment and our mid-term planning, indicate that there are no risks that, individually or jointly, could have an impact on the net assets, financial or income situation of DB Group and would pose a threat to the Group as a going concern.
Opportunity and risk report — No material changes in opportunity and risk management — Risks for EBIT development in 2018 reduced
— Risk portfolio unchanged without any threats to DB Group as a going concern
Fifth bond issued in 2018
On July 3, 2018, we issued a CHF bond through DB Finance with a total volume of CHF 400 million (about € 346 million) (maturity: ten years; coupon of 0.50%) and swapped it to euros.
Reduction of train-path prices in rail freight transportThe German Bundestag approved in early July the 2018 budget, including an increase in funds for BMVI.
Of these additional funds, € 175 million will go toward reducing train-path prices in rail freight transport in the second half of 2018. The funds will be made available following notification of the funding regulations by the European Union.
Changes in the Supervisory Board
Dr. Michael Frenzel and Dr. Jürgen Großmann both resigned their mandates on the Supervisory Board of DB AG with effect from the end of July 18, 2018. Ludwig Koller resigned his Supervisory Board mandate with effect from the end of July 31, 2018.
!w
Events after the balance sheet date — CHF bond issued — Reduction of train-path prices in rail freight
transport approved
— Further changes in the Supervisory Board
49
Interim Group Management Report―Development of business units/Opportunity and risk report/Events after the balance sheet date

Future direction of DB Group
The future direction of DB Group is described in the 2017
INTEGRATED REPORT µ159. There were no significant changes to this in the first half of 2018.
We are currently working on the further development of our sustainable strategy DB2020+ .
Positive development in the economic outlook
Anticipated development (%) 20172018 (Mar
forecast)2018 (Jul forecast)
GDP world + 3.0 ~+ 3.1 ~+ 3.1
World trade 1) + 6.0 ~+ 5.0 ~+ 4.8
GDP Eurozone +2.5 ~+2.3 ~+2.1
GDP Germany +2.5 ~+2.4 ~+2.0
1) Trade in goods only.
The data for 2017, adjusted for price and calendar effects, is based on the information and estimates available as of July 2018. Expectations for 2018 are rounded off to the nearest half percentage point.
Source: Oxford Economics
Assuming a stable geopolitical situation and no further escalation in the protectionist trade conflicts, we expect the global economy and world trade to undergo stable growth in 2018. The minor downward correction of our cur-rent guidance for world trade compared to March is, how-ever, indicative that global economic growth is already losing pace. Growing uncertainty is fueling the modest expectations.
The mentioned development applies particularly to the Eurozone as well, whose prospects are more subdued compared to the previous year. Although the currently favorable price of the euro is helping exports, demand from abroad has weakened. On balance, we nevertheless expect solid economic development in Europe.
By the same token, economic growth in Germany will probably also be well below the level of the previous year. This is mainly due to declining industrial production, while domestic demand remains strong.
Positive expectations for relevant marketsPassenger transport
Anticipated market development (%) 20172018 (Mar
forecast)2018 (Jul forecast)
German passenger transport (based on pkm) +1.0 +1.0 +1.0
The data for 2017 is based on the information and estimates available as of July 2018.
Expectations for 2018 are rounded off to the nearest half percentage point.
Growth in volume sold in 2018 on the German passenger transport market is expected to be at the same level as the previous year. Rail passenger transport growth is stronger than the average, not least due to improved long-distance offers on the Berlin – Munich line.
Demand is also expected to increase slightly in the Euro-pean passenger transport market. With increases in employ-ment figures and disposable incomes continuing, the gen-eral framework remains positive. As the year progresses, rising fuel prices and inflation could take some of the pace out of the market.
Across Europe, moderate growth in rail passenger trans-port is expected.
Freight transport and logistics
Anticipated market development (%) 20172018 (Mar
forecast)2018 (Jul forecast)
German freight transport (based on tkm) ~+1.9 ~+2.0 +2.0
European rail freight transport (based on tkm) ~+ 2.7 ~+1.5 ~+1.5
European land transport (based on revenues) + 4.8 + 3.5 + 4.0
Global air freight (based on t) +10.0 +2.0 + 4.0
Global ocean freight (based on TEU) + 4.8 + 3.5 + 3.5
Global contract logistics (based on revenues) + 3.0 + 3.0 + 4.0
The data for 2017 and 2018 is based on information and estimates available as of July 2018.
Expectations for 2018 are rounded off to the nearest half percentage point.
The outlook for the entire German freight transport market has not changed much since the previous forecasts were published:
◊ The absence of final statistics for 2017 makes it difficult to predict the development of rail freight transport in 2018. Bearing in mind the economic outlook, special issues such as the closure of/shift away from coal-fired
Outlook — Expectations remain stable for overall
economic development
— Rail passenger transport growth above market average — Expectations adjusted with regard to the development
of DB Group
50
Deutsche Bahn Group―Integrated Interim Report January – June 2018

power stations, and a positive baseline effect following the closure of the Rhine Valley line in late summer 2017, growth in 2018 is expected to be slightly below the average.
◊ Development of road freight transport in Germany will continue to be above the average. In 2018, growth should be more or less on a par with the previous year, and market position should be further expanded. The expansion of truck tolls to include all federal roads from July 1, 2018 onwards is not expected to have a damp-ening effect.
◊ Following a dynamic start to the year, the development of inland waterway transport should lose pace consid-erably, but will nevertheless remain positive. In addi- tion to subdued stimulus from the iron, coal and steel industry, this trend will probably be fueled by the low water levels that are already occurring and by a negative baseline effect in the second half of 2018. Growth in the second half of 2017 was unusually strong at more than 9% due partly to temporary shifts to other means of transport during the weeks in which the Rhine Valley line was closed.
In the European rail freight transport market, volume sold in 2018 is expected to increase at a lesser pace. Although economic stimulus will remain positive overall, the weak development of coal will continue. The strikes in France are also having an adverse effect that extends beyond the borders.
Based on the development to date in 2018, we have raised our expectations for global air freight and contract logistics significantly, and for European land transport slightly.
InfrastructureFor 2018 as a whole, we expect train-path demand to re- main largely constant in the wake of expanded rail pas-senger transport services and the stable development of rail freight transport. The planned REDUCTION OF TRAIN-PATH
PRICES µ49 offers opportunities in rail freight transport.In terms of station stops, we expect a slight increase
in the year-on-year comparison. The share of train stops operated by non-Group railways will continue to increase. Leasing income in stations will also show stable development and be slightly over the level of the previous year (+1.1%).
Procurement marketsIn the baseline scenario, we continue to expect no bottle-necks in procurement. In light of the announced increases in OPEC and Russian oil production, a balanced oil market can be expected for the second half of 2018. The risks of rising prices are inherent in potential further production losses.
In Germany, there will continue to be struggles over the design of the new electricity market (Electricity Market 2.0). Short-term price volatility is likely to be further amplified by the ongoing expansion of renewable energies due to the limited ability to forecast them. Wholesale prices are being boosted by the dismantling of conventional capacities. Cli-mate policy aimed at speeding up the phasing out of coal and raising the price of CO₂ emissions are contributing to this development.
Development of DB Group
Profitable quality leader
Anticipated development of DB Group 20172018 (Mar
forecast)2018 (Jul forecast)
Volume sold in rail passenger transport (Germany) (billion pkm) 82.3 ~84.5 ~84.5
Volume sold in rail freight transport (billion tkm) 92.7 ~98 ~93
Train kilometers on track infrastructure (billion train-path km) 1.07 ~1.1 ~1.09
Land transport shipments (million) 100.5 ~103 ~105
Air freight volume (export) (million t) 1.30 ~1.3 ~1.35
Ocean freight volume (export) (million TEU) 2.17 ~2.3 ~2.23
Customer satisfaction – passengers (SI) 75.8 ~78 ~78
Punctuality DB Group (rail) in Germany (%) 93.9 ~95 < 94
Punctuality DB Long-Distance (%) 78.5 82 < 80
Revenues (€ billion) 42.7 ~44 ~43.7
Revenues comparable (€ billion) 43.0 − ~44.2
EBIT adjusted (€ billion) 2.15 ≥ 2.2 ~2.1
ROCE (%) 6.1 ~6.0 ~5.6
Redemption coverage (%) 18.7 ≥ 18.5 ~18.0
On the basis of the developments to date and the current estimates for the second half of 2018, we have made adjust-ments to our expectations:
◊ Following the decline in the first half of 2018, we expect volume sold in rail freight transport to be weaker.
◊ The increase in shipment volumes in land transport will likely be more positive in light of the upward trend in parcel and direct transport business (not least due to inclusion of non-European transport business).
◊ In air freight, we now expect the development to be somewhat stronger in 2018 as a whole as well.
!!!
51
Interim Group Management Report―Outlook
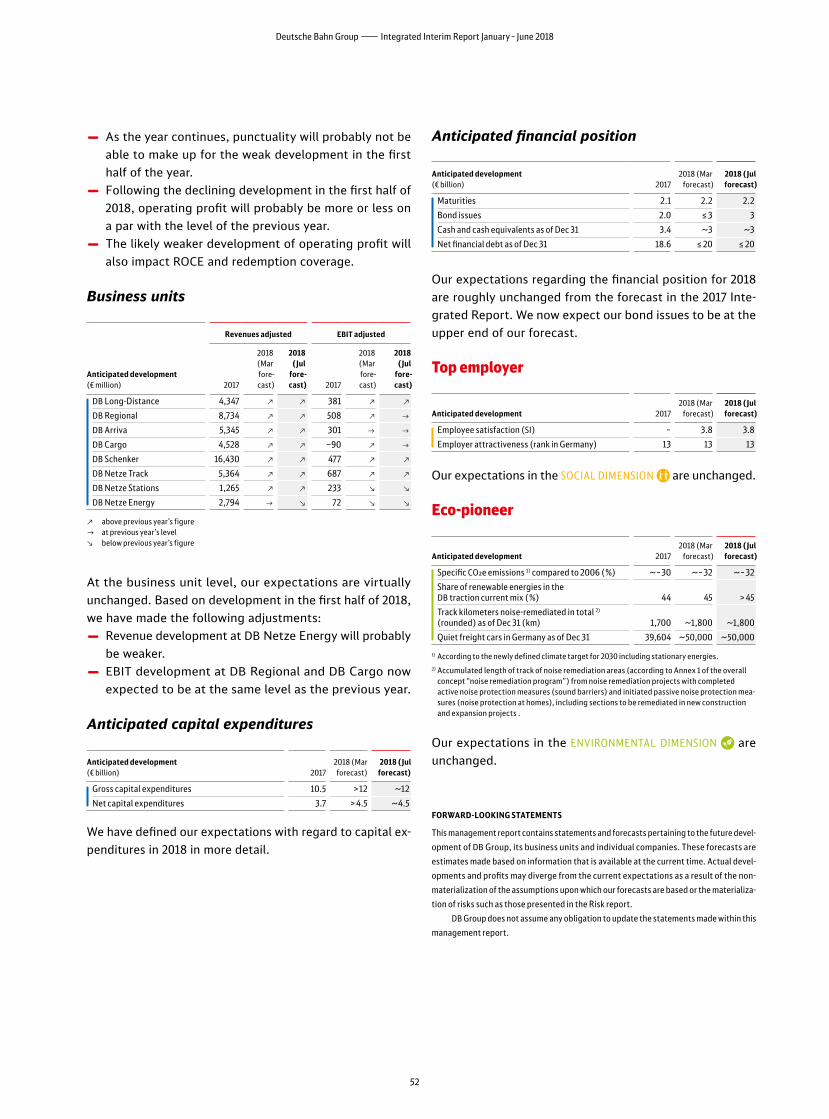
◊ As the year continues, punctuality will probably not be able to make up for the weak development in the first half of the year.
◊ Following the declining development in the first half of 2018, operating profit will probably be more or less on a par with the level of the previous year.
◊ The likely weaker development of operating profit will also impact ROCE and redemption coverage.
Business units
Anticipated development (€ million)
Revenues adjusted EBIT adjusted
2017
2018 (Mar fore- cast)
2018 (Jul
fore- cast) 2017
2018 (Mar fore- cast)
2018 (Jul
fore- cast)
DB Long-Distance 4,347 q q 381 q q
DB Regional 8,734 q q 508 q e
DB Arriva 5,345 q q 301 e e
DB Cargo 4,528 q q −90 q e
DB Schenker 16,430 q q 477 q q
DB Netze Track 5,364 q q 687 q q
DB Netze Stations 1,265 q q 233 w w
DB Netze Energy 2,794 e w 72 w w
q above previous year’s figure e at previous yearʼs level w below previous yearʼs figure
At the business unit level, our expectations are virtually un changed. Based on development in the first half of 2018, we have made the following adjustments:
◊ Revenue development at DB Netze Energy will probably be weaker.
◊ EBIT development at DB Regional and DB Cargo now ex pected to be at the same level as the previous year.
Anticipated capital expenditures
Anticipated development (€ billion) 2017
2018 (Mar forecast)
2018 (Jul forecast)
Gross capital expenditures 10.5 >12 ~12
Net capital expenditures 3.7 > 4.5 ~4.5
We have defined our expectations with regard to capital ex- penditures in 2018 in more detail.
Anticipated financial position
Anticipated development (€ billion) 2017
2018 (Mar forecast)
2018 (Jul forecast)
Maturities 2.1 2.2 2.2
Bond issues 2.0 ≤ 3 3
Cash and cash equivalents as of Dec 31 3.4 ~3 ~3
Net financial debt as of Dec 31 18.6 ≤ 20 ≤ 20
Our expectations regarding the financial position for 2018 are roughly unchanged from the forecast in the 2017 Inte-grated Report. We now expect our bond issues to be at the upper end of our forecast.
Top employer
Anticipated development 20172018 (Mar
forecast)2018 (Jul forecast)
Employee satisfaction (SI) – 3.8 3.8
Employer attractiveness (rank in Germany) 13 13 13
Our expectations in the SOCIAL DIMENSION † are unchanged.
Eco-pioneer
Anticipated development 20172018 (Mar
forecast)2018 (Jul forecast)
Specific CO₂e emissions 1) compared to 2006 (%) ~–30 ~–32 ~–32
Share of renewable energies in the DB traction current mix (%) 44 45 > 45
Track kilometers noise-remediated in total 2) (rounded) as of Dec 31 (km) 1,700 ~1,800 ~1,800
Quiet freight cars in Germany as of Dec 31 39,604 ~50,000 ~50,000
1) According to the newly defined climate target for 2030 including stationary energies.2) Accumulated length of track of noise remediation areas (according to Annex 1 of the overall
concept “noise remediation program”) from noise remediation projects with completed active noise protection measures (sound barriers) and initiated passive noise protection mea-sures (noise protection at homes), including sections to be remediated in new construction and expansion projects .
Our expectations in the ENVIRONMENTAL DIMENSION ¥ are unchanged.
FORWARD-LOOKING STATEMENTS
This management report contains statements and forecasts pertaining to the future devel-
opment of DB Group, its business units and individual companies. These forecasts are
estimates made based on information that is available at the current time. Actual devel-
opments and profits may diverge from the current expectations as a result of the non-
materialization of the assumptions upon which our forecasts are based or the materializa-
tion of risks such as those presented in the Risk report.
DB Group does not assume any obligation to update the statements made within this
management report.
52
Deutsche Bahn Group―Integrated Interim Report January – June 2018

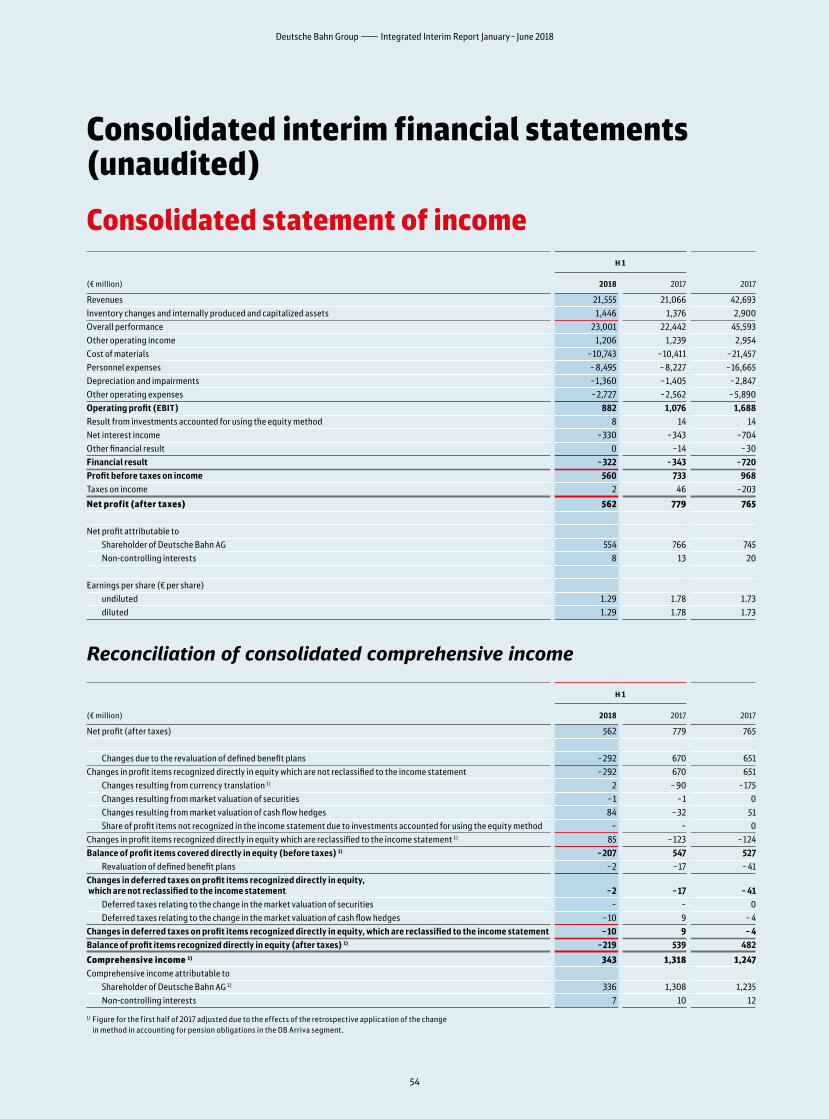
Consolidated statement of income
(€ million)
H 1
20172018 2017
Revenues 21,555 21,066 42,693Inventory changes and internally produced and capitalized assets 1,446 1,376 2,900Overall performance 23,001 22,442 45,593Other operating income 1,206 1,239 2,954Cost of materials –10,743 –10,411 –21,457Personnel expenses – 8,495 – 8,227 –16,665Depreciation and impairments –1,360 –1,405 –2,847Other operating expenses –2,727 –2,562 – 5,890Operating profit (EBIT) 882 1,076 1,688Result from investments accounted for using the equity method 8 14 14Net interest income –330 –343 –704Other financial result 0 –14 –30Financial result –322 –343 –720Profit before taxes on income 560 733 968Taxes on income 2 46 –203
Net profit (after taxes) 562 779 765
Net profit attributable to Shareholder of Deutsche Bahn AG 554 766 745 Non-controlling interests 8 13 20
Earnings per share (€ per share) undiluted 1.29 1.78 1.73 diluted 1.29 1.78 1.73
Reconciliation of consolidated comprehensive income
(€ million)
H 1
20172018 2017
Net profit (after taxes) 562 779 765
Changes due to the revaluation of defined benefit plans –292 670 651Changes in profit items recognized directly in equity which are not reclassified to the income statement –292 670 651 Changes resulting from currency translation 1) 2 – 90 –175 Changes resulting from market valuation of securities –1 –1 0 Changes resulting from market valuation of cash flow hedges 84 –32 51 Share of profit items not recognized in the income statement due to investments accounted for using the equity method – – 0Changes in profit items recognized directly in equity which are reclassified to the income statement 1) 85 –123 –124Balance of profit items covered directly in equity (before taxes) 1) –207 547 527 Revaluation of defined benefit plans –2 –17 – 41Changes in deferred taxes on profit items recognized directly in equity, which are not reclassified to the income statement –2 –17 – 41 Deferred taxes relating to the change in the market valuation of securities – – 0 Deferred taxes relating to the change in the market valuation of cash flow hedges –10 9 – 4Changes in deferred taxes on profit items recognized directly in equity, which are reclassified to the income statement –10 9 – 4Balance of profit items recognized directly in equity (after taxes) 1) –219 539 482
Comprehensive income 1) 343 1,318 1,247Comprehensive income attributable to Shareholder of Deutsche Bahn AG 1) 336 1,308 1,235 Non-controlling interests 7 10 12
1) Figure for the first half of 2017 adjusted due to the effects of the retrospective application of the change in method in accounting for pension obligations in the DB Arriva segment.
Consolidated interim financial statements (unaudited)
54
Deutsche Bahn Group―Integrated Interim Report January – June 2018

Consolidated balance sheetAssets
(€ million) Jun 30, 2018 Dec 31, 2017 Jun 30, 2017
NON- CURRENT ASSETS 1)
Property, plant and equipment 40,161 39,608 38,941Intangible assets 1) 3,569 3,599 3,576Investments accounted for using the equity method 505 500 537Available-for-sale financial assets 34 40 38Receivables and other assets 1) 306 302 368Derivative financial instruments 223 160 255Deferred tax assets 1,512 1,416 1,647
46,310 45,625 45,362CURRENT ASSETS
Inventories 1,244 1,151 1,175Available-for-sale financial assets 1 1 1Trade receivables 4,886 4,571 4,366Other receivables and other assets 1,930 1,620 1,912Income tax receivables 51 52 45Derivative financial instruments 59 19 44Cash and cash equivalents 3,673 3,397 2,906Held-for-sale assets 1 0 0
11,845 10,811 10,449
Total assets 1) 58,155 56,436 55,811
Equity and liabilities
(€ million) Jun 30, 2018 Dec 31, 2017 Jun 30, 2017
EQUITY 1)
Subscribed capital 2,150 2,150 2,150Reserves 1) 4,595 4,813 3,865Retained earnings 1) 7,244 7,110 7,165Equity attributable to shareholder of Deutsche Bahn AG 1) 13,989 14,073 13,180Non-controlling interests 154 165 182
14,143 14,238 13,362NON- CURRENT LIABILITIES 1)
Financial debt 20,255 19,716 18,398Other liabilities 224 233 220Derivative financial instruments 325 341 312Pension obligations 1) 4,269 3,940 3,958Other provisions 2,285 2,374 2,267Deferred items 1) 696 785 855Deferred tax liabilities 1) 125 121 151
28,179 27,510 26,161CURRENT LIABILITIES 1)
Financial debt 3,213 2,360 3,829Trade liabilities 5,139 5,157 5,204Other liabilities 3,514 3,399 3,471Income tax liabilities 181 150 158Derivative financial instruments 11 41 63Other provisions 2,777 2,743 2,672Deferred items 1) 998 838 891
15,833 14,688 16,288
Total assets 1) 58,155 56,436 55,811
1) Figure as of June 30, 2017 adjusted due to the effects of the retrospective application of the change in method in accounting for pension obligations in the DB Arriva segment.
55
Consolidated Interim Financial Statements―Consolidated statement of income/Consolidated balance sheet

Consolidated statement of cash flows
(€ million)
H 1
20172018 2017
Profit before taxes on income 560 733 968Depreciation on property, plant and equipment and intangible assets 1,360 1,405 2,847Write-ups/write-downs on non-current financial assets 8 0 0Result on disposal of property, plant and equipment and intangible assets – 60 –38 –121Result on disposal of financial assets 0 0 –19Interest and dividend income –17 – 41 – 53Interest expense 347 384 757Foreign currency result –7 9 19Result of investments accounted for using the equity method – 8 –14 –14Other non-cash expenses and income 386 512 1,291Changes in inventories, receivables and other assets 1) – 864 – 975 – 639Changes in liabilities, provisions and deferred items 1) –74 – 853 –1,966Cash generated from operating activities 1,631 1,122 3,070Interest received 14 28 39Received/paid (–) dividends and capital distribution 0 0 –10Interest paid –282 –324 – 592Paid (–)/reimbursed (+) taxes on income – 69 – 64 –178Cash flow from operating activities 1,294 762 2,329
Proceeds from the disposal of property, plant and equipment and intangible assets 153 120 341Payments for capital expenditures in property, plant and equipment and intangible assets – 4,269 – 4,149 –10,524Proceeds from investment grants 2,292 2,618 6,724Payments for repaid investment grants –34 – 56 – 63Proceeds from sale of financial assets 0 0 5Payments for investments in financial assets –1 –25 –28Proceeds from sale of shares in consolidated companies less net cash and cash equivalents sold 0 2 2Payments for acquisition of shares in consolidated companies less net cash and cash equivalentsacquired as well as payments for parts of companies – 4 –7 –30Proceeds from disposal of investments accounted for using the equity method 0 1 4Cash flow from investing activities –1,863 –1,496 –3,569
Proceeds from capital contributions – – 1,000Distribution of profits to shareholder – 450 – 600 – 600Distribution of profits to minority interests –11 –10 –12Payments for finance lease transactions –24 –34 – 53Proceeds from issue of bonds 1,964 576 2,038Payments for redemption of bonds –1,900 – 500 –1,819Payments for the redemption and repayment of interest-free loans – –206 –206Proceeds from borrowings and commercial paper 1,280 16 100Payments for the redemption of borrowings and commercial paper – 9 –15 –209Cash flow from financing activities 850 –773 239
Net changes in cash and cash equivalents 281 –1,507 –1,001Cash and cash equivalents as of Jan 1 3,397 4,450 4,450Changes in cash and cash equivalents due to changes in exchange rates – 5 –37 – 52
Cash and cash equivalents as of Jun 30/Dec 31 3,673 2,906 3,397
1) Figure for first half of 2017 adjusted due to the effects of the retrospective application of the change in method in accounting for pension obligations in the DB Arriva segment.
56
Deutsche Bahn Group―Integrated Interim Report January – June 2018

Consolidated statement of changes in equity
(€ million)
Sub- scribedcapital
Reserves
Retainedearnings
Equityattribut-
able to share-
holder ofDeutsche
Bahn AG
Non- controlling
interests
Equity Capital
reserves
Currencytrans- lation
Fair valuevalua-
tion of secu rities
Fair valuevaluation
of cash flow
hedges
Revalua- tion of
pensions Other
movements Total
As of Jan 1, 2017 2,150 5,310 149 0 –168 –1,891 –12 3,388 7,022 12,560 184 12,744Adjustment opening balance: change in method pension obli-gations in the DB Arriva segment – – 9 – – –74 – – 65 –22 – 87 – – 87As of Jan 1, 2017 adjusted 2,150 5,310 158 1) 0 –168 –1,965 1) –12 3,323 1) 7,000 1) 12,473 1) 184 12,657 1)
Capital increase – – – – – – – – – – 1 1 Capital decrease – – – – – – – – – – –3 –3 Dividend payment – – – – – – – – – 600 – 600 –10 – 610 Other changes – – – – – – – – –1 –1 – –1 Comprehensive income – – – 87 1) –1 –23 653 – 542 1) 766 1,308 1) 10 1,318 1)
thereof net profit – – – – – – – – 766 766 13 779 thereof currency effects – – – 87 1) – – – – – 87 1) – – 87 1) –3 – 90 1)
thereof deferred taxes – – – – 9 –17 – – 8 – – 8 – – 8 thereof market valuation – – – –1 –32 – – –33 – –33 – –33 thereof revaluation of
defined benefit plans – – – – – 670 – 670 – 670 – 670 thereof share of items not
recognized in the income statement from invest-ments accounted for using the equity method – – – – – – – – – – – –
As of Jun 30, 2017 2,150 5,310 71 1) –1 –191 –1,312 1) –12 3,865 1) 7,165 1) 13,180 1) 182 13,362 1)
(€ million)
Sub- scribedcapital
Reserves
Retainedearnings
Equityattribut-
able to share-
holder ofDeutsche
Bahn AG
Non- controlling
interests
Equity Capital
reserves
Currencytrans- lation
Fair valuevalua- tion of
securities
Fair valuevaluation
of cash flow
hedges
Revalua-tion of
pensions Other
movements Total
As of Jan 1, 2018 2,150 6,310 – 9 – –121 –1,355 –12 4,813 7,110 14,073 165 14,238Adjustment due to IFRS 9 – – – – – – – – 24 24 – 24
Capital increase – – – – – – – – – – 1 1 Capital decrease – – – – – – – – – – –1 –1 Dividend payment – – – – – – – – – 450 – 450 –11 – 461 Other changes – – – – – – – – 6 6 –7 –1 Comprehensive income – – 3 –1 74 –294 – –218 554 336 7 343
thereof net profit – – – – – – – – 554 554 8 562 thereof currency effects – – 3 – – – – 3 – 3 –1 2 thereof deferred taxes – – – – –10 –2 – –12 – –12 – –12 thereof market valuation – – – –1 84 – – 83 – 83 – 83 thereof revaluation of
defined benefit plans – – – – – –292 – –292 – –292 0 –292 thereof share of items not
recognized in the income statement from invest-ments accounted for using the equity method – – – – – – – – – – – –
As of Jun 30, 2018 2,150 6,310 – 6 –1 – 47 –1,649 –12 4,595 7,244 13,989 154 14,143
1) Figure as of June 30, 2017 adjusted due to the effects of the retrospective application of the change in method in accounting for pension obligations in the DB Arriva segment.
57
Consolidated Interim Financial Statements―Consolidated statement of cash flows/Consolidated statement of changes in equity
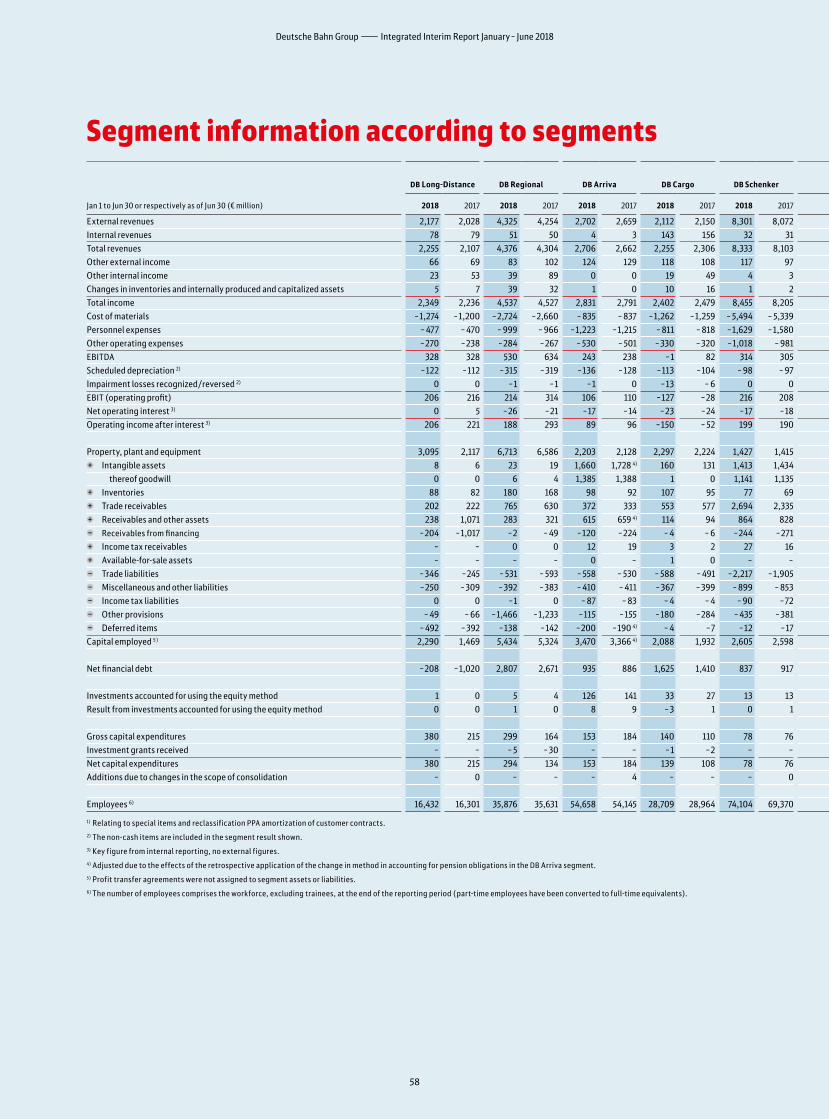
Segment information according to segments
Jan 1 to Jun 30 or respectively as of Jun 30 (€ million)
DB Long-Distance DB Regional DB Arriva DB Cargo DB Schenker DB Netze
TrackDB Netze Stations
DB NetzeEnergy
Subsidiaries/ Other
Sum of segments
Consolidation
DB Groupadjusted
Reconciliation 1)
DB Group
2018 2017 2018 2017 2018 2017 2018 2017 2018 2017 2018 2017 2018 2017 2018 2017 2018 2017 2018 2017 2018 2017 2018 2017 2018 2017 2018 2017
External revenues 2,177 2,028 4,325 4,254 2,702 2,659 2,112 2,150 8,301 8,072 754 746 297 273 628 654 252 234 21,548 21,070 – – 21,548 21,070 7 – 4 21,555 21,066Internal revenues 78 79 51 50 4 3 143 156 32 31 1,966 1,906 371 362 755 762 2,022 1,920 5,422 5,269 – 5,422 – 5,269 – – – – – –Total revenues 2,255 2,107 4,376 4,304 2,706 2,662 2,255 2,306 8,333 8,103 2,720 2,652 668 635 1,383 1,416 2,274 2,154 26,970 26,339 – 5,422 – 5,269 21,548 21,070 7 – 4 21,555 21,066Other external income 66 69 83 102 124 129 118 108 117 97 357 323 56 62 14 107 269 235 1,204 1,232 – – 1,204 1,232 2 7 1,206 1,239Other internal income 23 53 39 89 0 0 19 49 4 3 99 107 12 9 14 – 88 506 492 716 714 –716 –714 – – – – – –Changes in inventories and internally produced and capitalized assets 5 7 39 32 1 0 10 16 1 2 446 415 24 19 10 9 432 433 968 933 478 443 1,446 1,376 – – 1,446 1,376Total income 2,349 2,236 4,537 4,527 2,831 2,791 2,402 2,479 8,455 8,205 3,622 3,497 760 725 1,421 1,444 3,481 3,314 29,858 29,218 – 5,660 – 5,540 24,198 23,678 9 3 24,207 23,681Cost of materials –1,274 –1,200 –2,724 –2,660 – 835 – 837 –1,262 –1,259 – 5,494 – 5,339 – 856 – 834 –261 –257 –1,238 –1,235 –1,367 –1,266 –15,311 –14,887 4,568 4,491 –10,743 –10,396 0 –15 –10,743 –10,411Personnel expenses – 477 – 470 – 999 – 966 –1,223 –1,215 – 811 – 818 –1,629 –1,580 –1,434 –1,358 –165 –154 – 61 – 60 –1,625 –1,528 – 8,424 – 8,149 1 1 – 8,423 – 8,148 –72 –79 – 8,495 – 8,227Other operating expenses –270 –238 –284 –267 – 530 – 501 –330 –320 –1,018 – 981 – 517 – 490 –106 – 97 –75 –70 – 649 – 633 –3,779 –3,597 1,051 1,037 –2,728 –2,560 1 –2 –2,727 –2,562EBITDA 328 328 530 634 243 238 –1 82 314 305 815 815 228 217 47 79 –160 –113 2,344 2,585 – 40 –11 2,304 2,574 – 62 – 93 2,242 2,481Scheduled depreciation 2) –122 –112 –315 –319 –136 –128 –113 –104 – 98 – 97 –332 – 426 –70 – 67 –35 –35 –120 –122 –1,341 –1,410 26 22 –1,315 –1,388 –30 –38 –1,345 –1,426Impairment losses recognized/reversed 2) 0 0 –1 –1 –1 0 –13 – 6 0 0 0 0 0 0 0 0 0 0 –15 –7 – – –15 –7 – 28 –15 21EBIT (operating profit) 206 216 214 314 106 110 –127 –28 216 208 483 389 158 150 12 44 –280 –235 988 1,168 –14 11 974 1,179 – 92 –103 882 1,076Net operating interest 3) 0 5 –26 –21 –17 –14 –23 –24 –17 –18 –108 –139 –14 –20 – 8 –7 –102 – 94 –315 –332 – – –315 –332 – – – –Operating income after interest 3) 206 221 188 293 89 96 –150 – 52 199 190 375 250 144 130 4 37 –382 –329 673 836 –14 11 659 847 – – – –
Property, plant and equipment 3,095 2,117 6,713 6,586 2,203 2,128 2,297 2,224 1,427 1,415 19,800 19,837 3,216 3,201 987 972 1,142 1,150 40,880 39,630 –719 – 689 40,161 38,941 – – 40,161 38,941 Intangible assets 8 6 23 19 1,660 1,728 4) 160 131 1,413 1,434 138 133 16 8 28 35 149 69 3,595 3,563 4) –26 13 3,569 3,576 4) – – 3,569 3,576 4)
thereof goodwill 0 0 6 4 1,385 1,388 1 0 1,141 1,135 – 0 0 0 – 0 15 14 2,548 2,541 – 22 2,548 2,563 – – 2,548 2,563 Inventories 88 82 180 168 98 92 107 95 77 69 191 176 0 0 89 39 448 488 1,278 1,209 –34 –34 1,244 1,175 – – 1,244 1,175 Trade receivables 202 222 765 630 372 333 553 577 2,694 2,335 324 321 39 50 319 158 584 636 5,852 5,262 – 966 – 896 4,886 4,366 – – 4,886 4,366 Receivables and other assets 238 1,071 283 321 615 659 4) 114 94 864 828 122 183 18 13 –139 26 19,162 19,516 21,277 22,711 4) –19,041 –20,431 2,236 2,280 4) – – 2,236 2,280 4)
Receivables from financing –204 –1,017 –2 – 49 –120 –224 – 4 – 6 –244 –271 –2 –1 0 0 173 160 –18,406 –18,797 –18,809 –20,205 18,676 20,066 –133 –139 – – –133 –139 Income tax receivables – – 0 0 12 19 3 2 27 16 0 0 0 – 0 0 9 8 51 45 – – 51 45 – – 51 45 Available-for-sale assets – – – – 0 – 1 0 – – – – – – – – – – 1 0 – – 1 0 – – 1 0 Trade liabilities –346 –245 – 531 – 593 – 558 – 530 – 588 – 491 –2,217 –1,905 – 617 –1,084 – 80 – 98 –263 –286 – 900 – 857 – 6,100 – 6,089 961 885 – 5,139 – 5,204 – – – 5,139 – 5,204 Miscellaneous and other liabilities –250 –309 –392 –383 – 410 – 411 –367 –399 – 899 – 853 – 829 – 694 –158 –122 – 44 – 88 –759 – 804 – 4,108 – 4,063 370 372 –3,738 –3,691 – – –3,738 –3,691 Income tax liabilities 0 0 –1 0 – 87 – 83 – 4 – 4 – 90 –72 – – –1 –1 – – –19 –18 –202 –178 21 20 –181 –158 – – –181 –158 Other provisions – 49 – 66 –1,466 –1,233 –115 –155 –180 –284 – 435 –381 –343 –356 –33 – 55 – 50 – 66 –2,378 –2,322 – 5,049 – 4,918 –13 –21 – 5,062 – 4,939 – – – 5,062 – 4,939 Deferred items – 492 –392 –138 –142 –200 –190 4) – 4 –7 –12 –17 – 591 –735 –131 –137 –3 –3 –123 –124 –1,694 –1,747 4) 0 1 –1,694 –1,746 4) – – –1,694 –1,746 4)
Capital employed 5) 2,290 1,469 5,434 5,324 3,470 3,366 4) 2,088 1,932 2,605 2,598 18,193 17,780 2,886 2,859 1,097 947 –1,091 –1,055 36,972 35,220 4) –771 –714 36,201 34,506 4) – – 36,201 34,506 4)
Net financial debt –208 –1,020 2,807 2,671 935 886 1,625 1,410 837 917 9,330 10,092 1,237 1,215 646 445 2,495 2,414 19,704 19,030 – – 19,704 19,030 – – 19,704 19,030
Investments accounted for using the equity method 1 0 5 4 126 141 33 27 13 13 1 1 – – 0 0 326 351 505 537 – – 505 537 – – 505 537Result from investments accounted for using the equity method 0 0 1 0 8 9 –3 1 0 1 0 0 – – 0 – 2 3 8 14 – – 8 14 – – 8 14
Gross capital expenditures 380 215 299 164 153 184 140 110 78 76 2,634 2,907 291 253 81 48 184 139 4,240 4,096 –23 12 4,217 4,108 – – 4,217 4,108Investment grants received – – – 5 –30 – – –1 –2 – – –2,089 –2,382 –153 –173 – 41 –31 –3 0 –2,292 –2,618 – – –2,292 –2,618 – – –2,292 –2,618Net capital expenditures 380 215 294 134 153 184 139 108 78 76 545 525 138 80 40 17 181 139 1,948 1,478 –23 12 1,925 1,490 – – 1,925 1,490Additions due to changes in the scope of consolidation – 0 – – – 4 – – – 0 – – – – – – – – – 4 – – – 4 – – – 4
Employees 6) 16,432 16,301 35,876 35,631 54,658 54,145 28,709 28,964 74,104 69,370 46,371 44,717 5,649 5,404 1,734 1,742 53,386 51,291 316,919 307,565 – – 316,919 307,565 – – 316,919 307,565
1) Relating to special items and reclassification PPA amortization of customer contracts.2) The non-cash items are included in the segment result shown.3) Key figure from internal reporting, no external figures.4) Adjusted due to the effects of the retrospective application of the change in method in accounting for pension obligations in the DB Arriva segment. 5) Profit transfer agreements were not assigned to segment assets or liabilities.6) The number of employees comprises the workforce, excluding trainees, at the end of the reporting period (part-time employees have been converted to full-time equivalents).
58
Deutsche Bahn Group―Integrated Interim Report January – June 2018
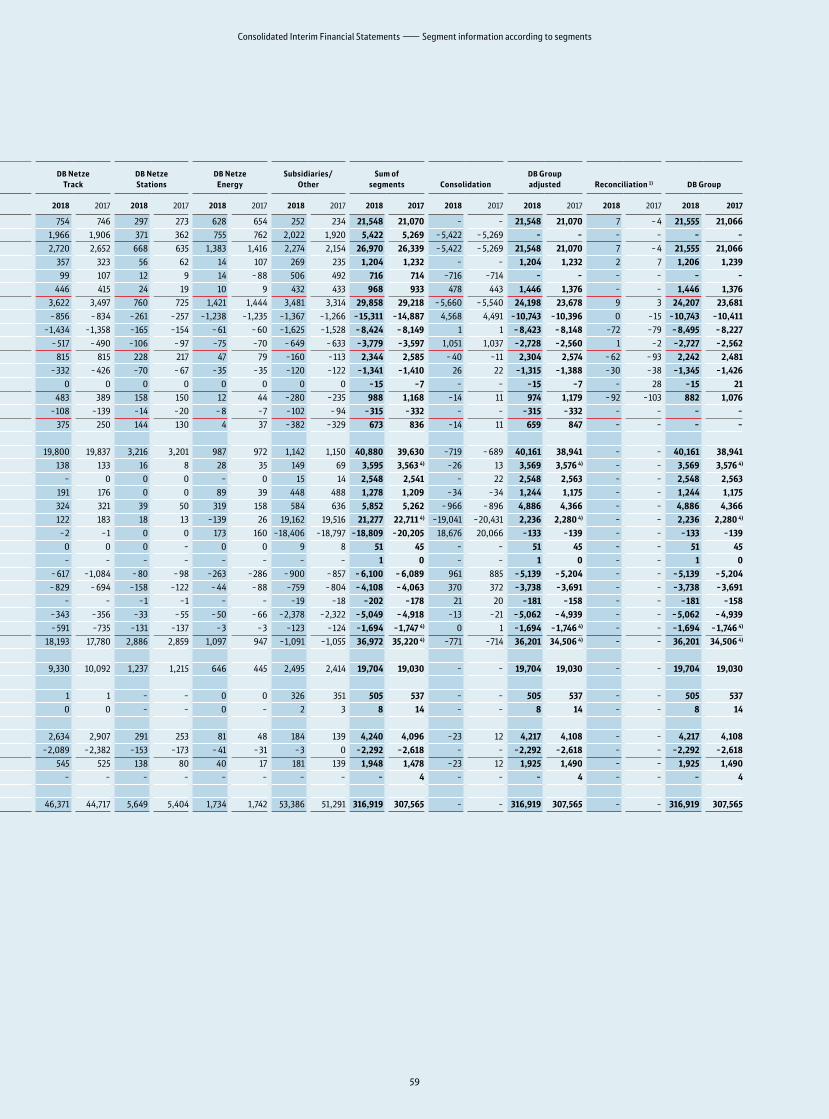
Segment information according to segments
Jan 1 to Jun 30 or respectively as of Jun 30 (€ million)
DB Long-Distance DB Regional DB Arriva DB Cargo DB Schenker DB Netze
TrackDB Netze Stations
DB NetzeEnergy
Subsidiaries/ Other
Sum of segments
Consolidation
DB Groupadjusted
Reconciliation 1)
DB Group
2018 2017 2018 2017 2018 2017 2018 2017 2018 2017 2018 2017 2018 2017 2018 2017 2018 2017 2018 2017 2018 2017 2018 2017 2018 2017 2018 2017
External revenues 2,177 2,028 4,325 4,254 2,702 2,659 2,112 2,150 8,301 8,072 754 746 297 273 628 654 252 234 21,548 21,070 – – 21,548 21,070 7 – 4 21,555 21,066Internal revenues 78 79 51 50 4 3 143 156 32 31 1,966 1,906 371 362 755 762 2,022 1,920 5,422 5,269 – 5,422 – 5,269 – – – – – –Total revenues 2,255 2,107 4,376 4,304 2,706 2,662 2,255 2,306 8,333 8,103 2,720 2,652 668 635 1,383 1,416 2,274 2,154 26,970 26,339 – 5,422 – 5,269 21,548 21,070 7 – 4 21,555 21,066Other external income 66 69 83 102 124 129 118 108 117 97 357 323 56 62 14 107 269 235 1,204 1,232 – – 1,204 1,232 2 7 1,206 1,239Other internal income 23 53 39 89 0 0 19 49 4 3 99 107 12 9 14 – 88 506 492 716 714 –716 –714 – – – – – –Changes in inventories and internally produced and capitalized assets 5 7 39 32 1 0 10 16 1 2 446 415 24 19 10 9 432 433 968 933 478 443 1,446 1,376 – – 1,446 1,376Total income 2,349 2,236 4,537 4,527 2,831 2,791 2,402 2,479 8,455 8,205 3,622 3,497 760 725 1,421 1,444 3,481 3,314 29,858 29,218 – 5,660 – 5,540 24,198 23,678 9 3 24,207 23,681Cost of materials –1,274 –1,200 –2,724 –2,660 – 835 – 837 –1,262 –1,259 – 5,494 – 5,339 – 856 – 834 –261 –257 –1,238 –1,235 –1,367 –1,266 –15,311 –14,887 4,568 4,491 –10,743 –10,396 0 –15 –10,743 –10,411Personnel expenses – 477 – 470 – 999 – 966 –1,223 –1,215 – 811 – 818 –1,629 –1,580 –1,434 –1,358 –165 –154 – 61 – 60 –1,625 –1,528 – 8,424 – 8,149 1 1 – 8,423 – 8,148 –72 –79 – 8,495 – 8,227Other operating expenses –270 –238 –284 –267 – 530 – 501 –330 –320 –1,018 – 981 – 517 – 490 –106 – 97 –75 –70 – 649 – 633 –3,779 –3,597 1,051 1,037 –2,728 –2,560 1 –2 –2,727 –2,562EBITDA 328 328 530 634 243 238 –1 82 314 305 815 815 228 217 47 79 –160 –113 2,344 2,585 – 40 –11 2,304 2,574 – 62 – 93 2,242 2,481Scheduled depreciation 2) –122 –112 –315 –319 –136 –128 –113 –104 – 98 – 97 –332 – 426 –70 – 67 –35 –35 –120 –122 –1,341 –1,410 26 22 –1,315 –1,388 –30 –38 –1,345 –1,426Impairment losses recognized/reversed 2) 0 0 –1 –1 –1 0 –13 – 6 0 0 0 0 0 0 0 0 0 0 –15 –7 – – –15 –7 – 28 –15 21EBIT (operating profit) 206 216 214 314 106 110 –127 –28 216 208 483 389 158 150 12 44 –280 –235 988 1,168 –14 11 974 1,179 – 92 –103 882 1,076Net operating interest 3) 0 5 –26 –21 –17 –14 –23 –24 –17 –18 –108 –139 –14 –20 – 8 –7 –102 – 94 –315 –332 – – –315 –332 – – – –Operating income after interest 3) 206 221 188 293 89 96 –150 – 52 199 190 375 250 144 130 4 37 –382 –329 673 836 –14 11 659 847 – – – –
Property, plant and equipment 3,095 2,117 6,713 6,586 2,203 2,128 2,297 2,224 1,427 1,415 19,800 19,837 3,216 3,201 987 972 1,142 1,150 40,880 39,630 –719 – 689 40,161 38,941 – – 40,161 38,941 Intangible assets 8 6 23 19 1,660 1,728 4) 160 131 1,413 1,434 138 133 16 8 28 35 149 69 3,595 3,563 4) –26 13 3,569 3,576 4) – – 3,569 3,576 4)
thereof goodwill 0 0 6 4 1,385 1,388 1 0 1,141 1,135 – 0 0 0 – 0 15 14 2,548 2,541 – 22 2,548 2,563 – – 2,548 2,563 Inventories 88 82 180 168 98 92 107 95 77 69 191 176 0 0 89 39 448 488 1,278 1,209 –34 –34 1,244 1,175 – – 1,244 1,175 Trade receivables 202 222 765 630 372 333 553 577 2,694 2,335 324 321 39 50 319 158 584 636 5,852 5,262 – 966 – 896 4,886 4,366 – – 4,886 4,366 Receivables and other assets 238 1,071 283 321 615 659 4) 114 94 864 828 122 183 18 13 –139 26 19,162 19,516 21,277 22,711 4) –19,041 –20,431 2,236 2,280 4) – – 2,236 2,280 4)
Receivables from financing –204 –1,017 –2 – 49 –120 –224 – 4 – 6 –244 –271 –2 –1 0 0 173 160 –18,406 –18,797 –18,809 –20,205 18,676 20,066 –133 –139 – – –133 –139 Income tax receivables – – 0 0 12 19 3 2 27 16 0 0 0 – 0 0 9 8 51 45 – – 51 45 – – 51 45 Available-for-sale assets – – – – 0 – 1 0 – – – – – – – – – – 1 0 – – 1 0 – – 1 0 Trade liabilities –346 –245 – 531 – 593 – 558 – 530 – 588 – 491 –2,217 –1,905 – 617 –1,084 – 80 – 98 –263 –286 – 900 – 857 – 6,100 – 6,089 961 885 – 5,139 – 5,204 – – – 5,139 – 5,204 Miscellaneous and other liabilities –250 –309 –392 –383 – 410 – 411 –367 –399 – 899 – 853 – 829 – 694 –158 –122 – 44 – 88 –759 – 804 – 4,108 – 4,063 370 372 –3,738 –3,691 – – –3,738 –3,691 Income tax liabilities 0 0 –1 0 – 87 – 83 – 4 – 4 – 90 –72 – – –1 –1 – – –19 –18 –202 –178 21 20 –181 –158 – – –181 –158 Other provisions – 49 – 66 –1,466 –1,233 –115 –155 –180 –284 – 435 –381 –343 –356 –33 – 55 – 50 – 66 –2,378 –2,322 – 5,049 – 4,918 –13 –21 – 5,062 – 4,939 – – – 5,062 – 4,939 Deferred items – 492 –392 –138 –142 –200 –190 4) – 4 –7 –12 –17 – 591 –735 –131 –137 –3 –3 –123 –124 –1,694 –1,747 4) 0 1 –1,694 –1,746 4) – – –1,694 –1,746 4)
Capital employed 5) 2,290 1,469 5,434 5,324 3,470 3,366 4) 2,088 1,932 2,605 2,598 18,193 17,780 2,886 2,859 1,097 947 –1,091 –1,055 36,972 35,220 4) –771 –714 36,201 34,506 4) – – 36,201 34,506 4)
Net financial debt –208 –1,020 2,807 2,671 935 886 1,625 1,410 837 917 9,330 10,092 1,237 1,215 646 445 2,495 2,414 19,704 19,030 – – 19,704 19,030 – – 19,704 19,030
Investments accounted for using the equity method 1 0 5 4 126 141 33 27 13 13 1 1 – – 0 0 326 351 505 537 – – 505 537 – – 505 537Result from investments accounted for using the equity method 0 0 1 0 8 9 –3 1 0 1 0 0 – – 0 – 2 3 8 14 – – 8 14 – – 8 14
Gross capital expenditures 380 215 299 164 153 184 140 110 78 76 2,634 2,907 291 253 81 48 184 139 4,240 4,096 –23 12 4,217 4,108 – – 4,217 4,108Investment grants received – – – 5 –30 – – –1 –2 – – –2,089 –2,382 –153 –173 – 41 –31 –3 0 –2,292 –2,618 – – –2,292 –2,618 – – –2,292 –2,618Net capital expenditures 380 215 294 134 153 184 139 108 78 76 545 525 138 80 40 17 181 139 1,948 1,478 –23 12 1,925 1,490 – – 1,925 1,490Additions due to changes in the scope of consolidation – 0 – – – 4 – – – 0 – – – – – – – – – 4 – – – 4 – – – 4
Employees 6) 16,432 16,301 35,876 35,631 54,658 54,145 28,709 28,964 74,104 69,370 46,371 44,717 5,649 5,404 1,734 1,742 53,386 51,291 316,919 307,565 – – 316,919 307,565 – – 316,919 307,565
1) Relating to special items and reclassification PPA amortization of customer contracts.2) The non-cash items are included in the segment result shown.3) Key figure from internal reporting, no external figures.4) Adjusted due to the effects of the retrospective application of the change in method in accounting for pension obligations in the DB Arriva segment. 5) Profit transfer agreements were not assigned to segment assets or liabilities.6) The number of employees comprises the workforce, excluding trainees, at the end of the reporting period (part-time employees have been converted to full-time equivalents).
59
Consolidated Interim Financial Statements―Segment information according to segments

Information by regions
Jan 1 to Jun 30 (€ million)
Externalrevenues
Non-currentassets 1)
Capital employed 1)
Gross capitalexpenditures
Net capitalexpenditures
Employees 1)
2018 2017 2018 2017 2018 2017 2018 2017 2018 2017 2018 2017
Germany 12,204 11,850 37,579 36,253 30,562 28,943 4,008 3,832 1,716 1,214 194,057 188,132Europe (excluding Germany) 6,745 6,669 5,922 5,995 2) 5,225 5,235 2) 209 247 209 247 94,118 92,703Asia/Pacific 1,447 1,404 799 778 843 780 16 11 16 11 16,651 15,180North America 885 878 195 203 315 277 5 4 5 4 8,970 8,662Rest of world 267 269 27 28 50 27 2 2 2 2 3,123 2,888Consolidation – – –745 – 698 –794 –756 –23 12 –23 12 – –DB Group adjusted 21,548 21,070 43,777 42,559 2) 36,201 34,506 1) 4,217 4,108 1,925 1,490 316,919 307,565Reconciliation 7 – 4 – – – – – – – – – –
DB Group 21,555 21,066 43,777 42,559 2) 36,201 34,506 1) 4,217 4,108 1,925 1,490 316,919 307,565
1) As of June 30.2) Figure adjusted due to the effects of the retrospective application in the change
in method for recognizing pension obligations in the DB Arriva segment.
Basic principles and methodsThe unaudited and condensed interim financial statements as of June 30, 2018 are prepared in accordance with the International Financial Reporting Standards (IFRS) as applied in the EU and their interpretation by the IFRS Interpretations Committee. The requirements of IAS 34 (Interim Financial Reporting) have been followed. The accounting policies underlying the consolidated financial statements 2017 have been consistently applied for these interim financial statements.
The following new standards, interpretations and amend ments of the IAS/IFRS standards which are significant for Deutsche Bahn Group (DB Group) are the subject of mandatory adoption within the reporting period.
◊ IFRS 9: “Financial Instruments” (published July 2014; applicable for reporting periods starting January 1, 2018)
◊ IFRS 15: “Revenue from Contracts with Customers” (published May 2014; applicable for reporting periods starting January 1, 2018)
Comparability with the first half of 2017After due consideration is given to the following issues, the financial information presented for the first half of 2018 is comparable with the financial information for the first half of 2017:
◊ Change of method regarding the recognition of pension obligations in the DB Arriva segment
In Great Britain, some rail transport agreements are operated as franchises, for the duration of which DB Group pays contributions into the British railway pension scheme for the employees deployed in such arrangements. As was the case in the previous year, the obligations to these em ployees as well as the plan assets are completely disclosed after de duction of the element financed by the employees (40%).
The process of recognizing the effects due to franchise agreements also included until now that part of the shortfall or surplus cover which will probably not be financed by DB Group. Personnel expenses also include the service cost resulting from the application of the projected unit credit method.
As a result of the lower level of interest rates, DB Group has established that these two valuation rules no longer provide a true and fair view of the net assets and results of operations. The current contributions actually paid are now disclosed as personnel expenses. After taking account of the effects due to franchise agreements, there will in future only be the obligations resulting from the payment of contributions for reducing any deficit in the pension scheme during the current franchise. If such an obligation exists at the time at which a franchise transport agreement commenced, this is capitalized in the amount of an intangible asset which is written down over the duration of the franchise.
The following table shows the impact on the consolidated interim financial statements as of June 30, 2017 resulting from the retrospective application.
Notes to the consolidated interim financial statements
60
Deutsche Bahn Group―Integrated Interim Report January – June 2018
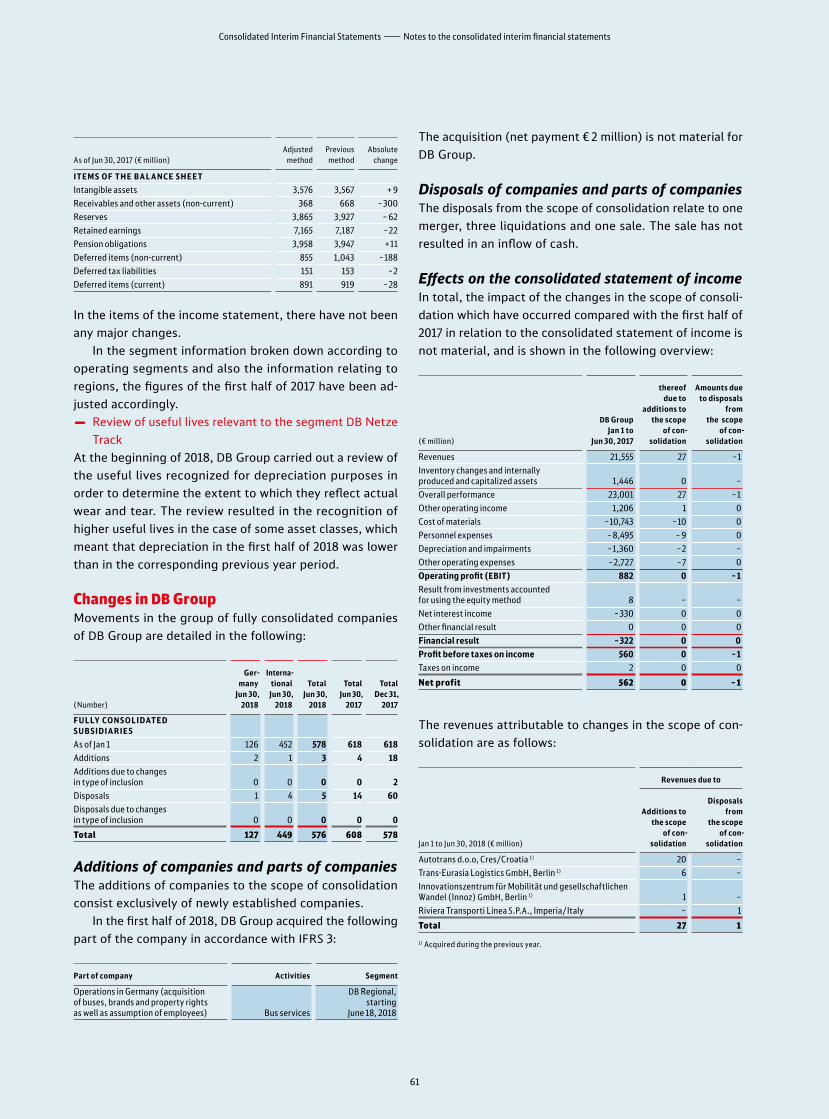
As of Jun 30, 2017 (€ million)Adjusted
methodPrevious method
Absolutechange
ITEM S OF THE BAL AN CE SHEET
Intangible assets 3,576 3,567 + 9Receivables and other assets (non-current) 368 668 –300Reserves 3,865 3,927 – 62Retained earnings 7,165 7,187 –22Pension obligations 3,958 3,947 +11Deferred items (non-current) 855 1,043 –188Deferred tax liabilities 151 153 –2Deferred items (current) 891 919 –28
In the items of the income statement, there have not been any major changes.
In the segment information broken down according to operating segments and also the information relating to regions, the figures of the first half of 2017 have been adjusted accordingly.
◊ Review of useful lives relevant to the segment DB Netze Track
At the beginning of 2018, DB Group carried out a review of the useful lives recognized for depreciation purposes in order to determine the extent to which they reflect actual wear and tear. The review resulted in the recognition of higher useful lives in the case of some asset classes, which meant that depreciation in the first half of 2018 was lower than in the corresponding previous year period.
Changes in DB GroupMovements in the group of fully consolidated companies of DB Group are detailed in the following:
(Number)
Ger- many
Jun 30, 2018
Interna- tional
Jun 30, 2018
Total Jun 30,
2018
Total Jun 30,
2017
Total Dec 31,
2017
FULLY CON S OLIDATED SUB SIDIAR IE S
As of Jan 1 126 452 578 618 618Additions 2 1 3 4 18Additions due to changes in type of inclusion 0 0 0 0 2Disposals 1 4 5 14 60Disposals due to changes in type of inclusion 0 0 0 0 0
Total 127 449 576 608 578
Additions of companies and parts of companies The additions of companies to the scope of consolidation consist exclusively of newly established companies.
In the first half of 2018, DB Group acquired the following part of the company in accordance with IFRS 3:
Part of company Activities Segment
Operations in Germany (acquisition of buses, brands and property rights as well as assumption of employees) Bus services
DB Regional, starting
June 18, 2018
The acquisition (net payment € 2 million) is not material for DB Group.
Disposals of companies and parts of companiesThe disposals from the scope of consolidation relate to one merger, three liquidations and one sale. The sale has not resulted in an inflow of cash.
Effects on the consolidated statement of incomeIn total, the impact of the changes in the scope of consolidation which have occurred compared with the first half of 2017 in relation to the consolidated statement of income is not material, and is shown in the following overview:
(€ million)
DB Group Jan 1 to
Jun 30, 2017
thereof due to
additions to the scope
of con- solidation
Amounts due to disposals
from the scope
of con- solidation
Revenues 21,555 27 –1Inventory changes and internally produced and capitalized assets 1,446 0 –Overall performance 23,001 27 –1Other operating income 1,206 1 0Cost of materials –10,743 –10 0Personnel expenses – 8,495 – 9 0Depreciation and impairments –1,360 –2 –Other operating expenses –2,727 –7 0Operating profit (EBIT) 882 0 –1Result from investments accounted for using the equity method 8 – –Net interest income –330 0 0Other financial result 0 0 0Financial result –322 0 0Profit before taxes on income 560 0 –1Taxes on income 2 0 0
Net profit 562 0 –1
The revenues attributable to changes in the scope of consolidation are as follows:
Jan 1 to Jun 30, 2018 (€ million)
Revenues due to
Additions to the scope
of con- solidation
Disposals from
the scope of con-
solidation
Autotrans d.o.o, Cres/Croatia 1) 20 –Trans-Eurasia Logistics GmbH, Berlin 1) 6 –Innovationszentrum für Mobilität und gesellschaftlichen Wandel (Innoz) GmbH, Berlin 1) 1 –Riviera Transporti Linea S.P.A., Imperia/Italy – 1
Total 27 1
1) Acquired during the previous year.
61
Consolidated Interim Financial Statements―Notes to the consolidated interim financial statements
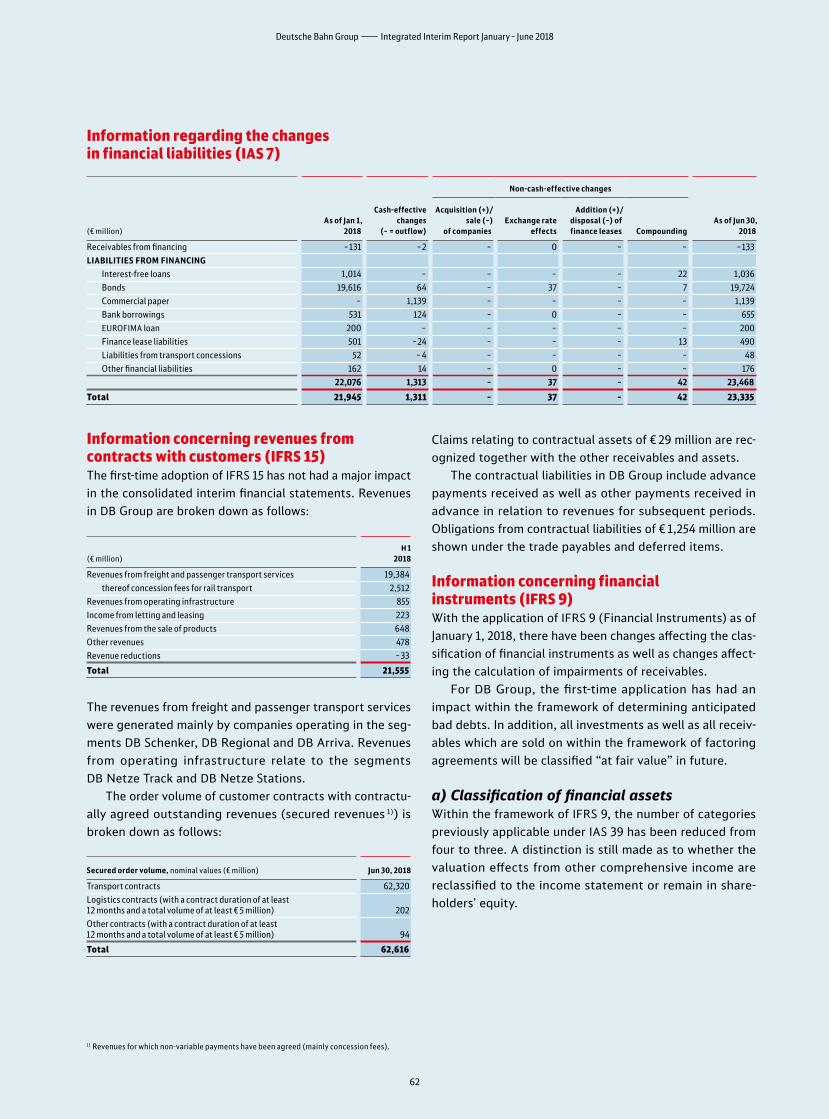
Information concerning revenues from contracts with customers (IFRS 15) The firsttime adoption of IFRS 15 has not had a major impact in the consolidated interim financial statements. Revenues in DB Group are broken down as follows:
(€ million)H 1
2018
Revenues from freight and passenger transport services 19,384 thereof concession fees for rail transport 2,512Revenues from operating infrastructure 855Income from letting and leasing 223Revenues from the sale of products 648Other revenues 478Revenue reductions –33
Total 21,555
The revenues from freight and passenger transport services were generated mainly by companies operating in the segments DB Schenker, DB Regional and DB Arriva. Revenues from operating infrastructure relate to the segments DB Netze Track and DB Netze Stations.
The order volume of customer contracts with contractually agreed outstanding revenues (secured revenues 1)) is broken down as follows:
Secured order volume, nominal values (€ million) Jun 30, 2018
Transport contracts 62,320Logistics contracts (with a contract duration of at least 12 months and a total volume of at least € 5 million) 202Other contracts (with a contract duration of at least 12 months and a total volume of at least € 5 million) 94
Total 62,616
Claims relating to contractual assets of € 29 million are recognized together with the other receivables and assets.
The contractual liabilities in DB Group include advance payments received as well as other payments received in advance in relation to revenues for subsequent periods. Obligations from contractual liabilities of € 1,254 million are shown under the trade payables and deferred items.
Information concerning financial instruments (IFRS 9)With the application of IFRS 9 (Financial Instruments) as of January 1, 2018, there have been changes affecting the classification of financial instruments as well as changes aff ect ing the calculation of impairments of receivables.
For DB Group, the firsttime application has had an impact within the framework of determining anticipated bad debts. In addition, all investments as well as all receivables which are sold on within the framework of factoring agreements will be classified “at fair value” in future.
a) Classification of financial assets Within the framework of IFRS 9, the number of categories previously applicable under IAS 39 has been reduced from four to three. A distinction is still made as to whether the valuation effects from other comprehensive income are reclassified to the income statement or remain in shareholders’ equity.
!!!
Information regarding the changes in financial liabilities (IAS 7)
(€ million)As of Jan 1,
2018
Cash-effective changes
(– = outflow)
Non-cash-effective changes
As of Jun 30, 2018
Acquisition (+)/ sale (–)
of companies Exchange rate
effects
Addition (+)/ disposal (–) of finance leases Compounding
Receivables from financing –131 –2 – 0 – – –133LIABILITIES FROM FINANCING
Interest-free loans 1,014 – – – – 22 1,036 Bonds 19,616 64 – 37 – 7 19,724 Commercial paper – 1,139 – – – – 1,139 Bank borrowings 531 124 – 0 – – 655 EUROFIMA loan 200 – – – – – 200 Finance lease liabilities 501 –24 – – – 13 490 Liabilities from transport concessions 52 – 4 – – – – 48 Other financial liabilities 162 14 – 0 – – 176
22,076 1,313 – 37 – 42 23,468
Total 21,945 1,311 – 37 – 42 23,335
1) Revenues for which non-variable payments have been agreed (mainly concession fees).
62
Deutsche Bahn Group―Integrated Interim Report January – June 2018

Financial assets (€ million)
Fair value (recog-
nized in the income
statement)
Fair value (not recog- nized in the
income statement)
Amortized cost of
purchase
As of Dec 31, 2017 5 2 9,333Reclassification of other investments +24 +14 –38Reclassification of receivables earmarked for factoring + 353 – –353
As of Jan 1, 2018 382 16 8,942
b) Measurement of financial assets For the measurement of financial instruments, IFRS 9 specifies that expected losses are now recognized within the framework of risk provisioning.
For trade receivables, the expected credit losses were determined on a collective basis using an impairment matrix; these expected losses amounted to € 19 million as of June 30, 2018.
For receivables from financing as well as other receivables, the expected impairment requirement for major items was also determined in relation to specific receivables. Risk provisioning of € 5 million was created for this purpose as of June 30, 2018.
The change in the process of determining expected credit losses resulted in a oneoff positive effect of € 24 million in DB Group; this was disclosed separately in equity (see CONSOLIDATED STATEMENT OF CHANGES IN EQUITY µ57).
c) Hedge accountingWith regard to the recognition of hedges, there have been additions in the field of designation possibilities as well as a closer link between hedge accounting and risk management. There is also the need to implement extended ac counting and measurement logic. In DB Group, this is relevant particularly for a differentiated treatment of the currency basis spreads which, under IFRS 9, will no longer be an element of the underlying of a hedge. Any resultant ineffectiveness is, where necessary, recognized in the income statement. With IFRS 9, the quantitative limits for the effectiveness test are no longer applicable.
Contingent receivables and liabilities, and guarantee obligationsAs of June 30, 2018, there were contingent receivables of € 46 million (as of December 31, 2017: € 23 million; as of June 30, 2017: € 18 million). They mainly comprise a recovery claim in conjunction with construction grants which have been provided but which had not been sufficiently determined as of the balance sheet date in terms of the specific amount and the time at which the claim would become due.
As of the balance sheet date, no contingent receivables had been recognized for all injunction proceedings in view of the high level of uncertainty relating to refund claims, the timing of refunds and the probability of refunds.
The contingent liabilities are broken down as follows:
(€ million)Jun 30,
2018Dec 31,
2017 Jun 30,
2017
Contingent liabilities from guarantee obligations – 30 30Other contingent liabilities 134 124 93
Total 134 154 123
Other contingent liabilities also comprise risks arising from litigation which had not been stated as provisions because the expected probability of occurrence is less than 50%.
There are also contingencies of € 16 million from guarantees as of June 30, 2018 (as of December 31, 2017: € 17 million; as of June 30, 2017: € 18 million). As of June 30, 2018, property, plant and equipment with carrying amounts of € 9 million (as of December 31, 2017: € 7 million; as of June 30, 2017 € 2 million) were also used as security for loans. The reported figure essentially relates to rolling stock used at the operating companies in the segment DB LongDistance.
DB Group acts as guarantor mainly for equity participations and joint ventures, and is subject to joint and several liability for all syndicates in which it is involved.
Information regarding the fair value of financial instruments The carrying amounts of the cash and cash equivalents, trade receivables and other financial assets (€ 6,487 million) approximate the fair values as of the balance sheet date.
The carrying amounts of the trade payables, the miscellaneous other financial liabilities (a total of € 6,708 million) as well as the current financial debt approximate the fair values as of the balance sheet date.
Of the figure stated for receivables and other assets as of June 30, 2018, € 635 million was attributable to nonfinancial assets (as of December 31, 2017: € 566 million; as of June 30, 2017; € 5711) million). Of the figure stated for other liabilities as of June 30, 2018, € 2,169 million was attributable to nonfinancial liabilities (as of December 31, 2017: € 2,067 million; as of June 30, 2017; € 2,220 million).
The fair value of the noncurrent financial debt amount ed to € 21,484 million as of June 30, 2018 (as of December 31, 2017: € 21,331 million; as of June 30, 2017; € 20,018 million).
Other financial commitmentsThe total amount of other financial commitments was stated as € 21,140 million as of June 30, 2018 (as of December 31, 2017: € 20,507 million; as of June 30, 2017; € 21,747 million).
!!!
1) Figure adjusted due to the effects of the retrospective application of the change in method in accounting for pension obligations in the DB Arriva segment.
63
Consolidated Interim Financial Statements―Notes to the consolidated interim financial statements
Capital expenditures in relation to which DB Group has entered into contractual obligations as of the balance sheet date, but for which no consideration has yet been received, are broken down as follows:
(€ million)Jun 30,
2018Dec 31,
2017 Jun 30,
2017
Committed capital expenditures Property, plant and equipment 15,237 14,478 15,926 Intangible assets 38 55 35Acquisition of financial assets 406 402 430
Total 15,681 14,935 16,391
The increase in the committed capital expenditures in property, plant and equipment is due particularly to planned investment projects resulting from DB Group’s own construction services; this is opposed mainly by the acquisitions of new rolling stock. In the case of some supply ar range ments, there are independent admissions of guilt with regard to fulfilling the order commitment; these are opposed by claims of the same amount, backed by bank guarantees and insurance policies with very good ratings. The committed capital expenditures in property, plant and equipment also contains future obligations for vehicles in connection with trans port contracts to be recognized in accordance with IFRIC 12.
The acquisition of financial assets relates to outstand ing deposits (which have not been called in) at the European Company for the Financing of Railroad Rolling Stock (EUROFIMA), Basel/Switzerland.
Other financial commitments relate to future minimum leasing payments from operating lease agreements.
Related-party disclosuresMajor economic relations between DB Group and the Federal Republic of Germany (Federal Government) relate to liabilities due to the Federal Government arising from loans which have been extended (present value as of June 30, 2018: € 1,036 million; as of December 31, 2017: € 1,014 million; as of June 30, 2017: € 992 million). There are also service relationships arising from the fees paid to the Federal Government within the framework of proforma billing for the assigned civil servants as well as cost refunds for the secondment of service provision personnel as well as from investment grants which have been received. The guarantees received from the Federal Government primarily relate to the loans received from EUROFIMA as well as the outstanding contributions and liabilities arising from collective liability of Deutsche Bahn AG (DB AG) at EUROFIMA.
Business relations with Deutsche Telekom and Deutsche Post regarding the use of telecommunications and postal services have taken place to the usual extent.
Other disclosuresBond issues and repaymentsAs of June 30, 2018, the following bonds were issued by Deutsche Bahn Finance GmbH (DB Finance):
Issue volumeDuration
(years)Coupon
(%) Placing
€ 1 billion 10 1.0Institutional investors
mainly in Europe and Asia
€ 750 million 15.5 1.625Institutional investors
mainly in Europe
AUD 150 million 14.5 4.050Private placement with an
institutional investor in Asia
AUD 206 million 10 3.494Private placement with
institutional investors in Japan
In the same period, two maturing bonds of DB Finance for € 1.9 billion were repaid.
Dividend payment Pursuant to the resolution of the Annual General Meeting of March 21, 2018, DB AG paid a dividend of € 450 million to the Federal Government.
Number of issued sharesThe number of issued shares is unchanged at 430,000,000.
Significant events after the balance sheet dateBond issueIn July 2018, DB Group issued a further bond with a total volume of CHF 400 million (about € 346 million) via DB Finance. The bond has a duration of ten years, has been issued with a coupon of 0.5% and has been placed with institutional investors in Switzerland and swapped into euros.
Reduction of train path prices in rail freight transportAt the beginning of July, the German Bundestag adopted the budget for 2018 and, in this connection, adopted an increase in the funds for the Federal Ministry for Transport and Digital Infrastructure (Bundesministerium für Verkehr und digitale Infrastruktur; BMVI).
Of the total volume of additional funds, € 175 million will be channeled into the reduction of train path prices for rail freight transport in the second half of 2018. After successful approval under the terms of the funding guideline, the funds will be provided by the European Union.
Berlin, July 19, 2018
Deutsche Bahn AktiengesellschaftThe Management Board
!!!
64
Deutsche Bahn Group―Integrated Interim Report January – June 2018

Contact information
Investor RelationsDeutsche Bahn AG
Investor Relations
Europaplatz 1
10557 Berlin, Germany
Telephone — +49 - 30- 297 - 6 40 31
Fax — +49 - 69 - 265 - 2 01 10
E-mail — ir @ deutschebahn.com
Internet — www.deutschebahn.com/ir-e
This Interim Report was published on July 25, 2018
(copy deadline: July 20, 2018) and is available online at
www.db.de/zb-e.
The Interim and Integrated Reports of Deutsche
Bahn Group as well as the Annual Financial Statements
of Deutsche Bahn AG are published in German and
English.
The Interim and Integrated Reports of Deutsche
Bahn Group, the Annual Financial Statements of Deutsche
Bahn AG, the Annual Report of DB Fernverkehr AG,
DB Regio AG, DB Station&Service AG and DB Netz AG,
and up-to-date information are also available on the
Internet.
Corporate Communications General corporate publications and the Competition Report are available
online or can be requested from Corporate Communications:
Deutsche Bahn AG
Corporate Communications
Potsdamer Platz 2
10785 Berlin, Germany
Telephone — +49 - 30 - 297 - 6 10 30
Fax — +49 - 30 - 297 - 6 19 19
E-mail — presse @ deutschebahn.com
Internet — www.deutschebahn.com/presse
DB service numberOur service number +49 - 180 - 699 - 6633 gives you direct access to all of
our telephone services. These services include our Group-wide general
information phone number, timetable information and booking of train
tickets, our customer dialog, and further offers for members of our
frequent traveler system (BahnCard).
The following charges apply: calls from the German
fixed-line network cost 20 cents/call; calls from the
German cell phone network cost 60 cents/call at most.
Leisure and business travelers can find answers to
frequently asked questions and further contact details
online.
Our passenger transport services on social mediaOur passenger transport is available on various social media channels for
conversations, discussions and for service and product questions. You
can find us on Facebook, Twitter and YouTube.
Financial calendar
March 28, 2019 Annual Results Press Conference,
publication of the 2018 Integrated Report
July 25, 2019Interim Results Press Conference,
publication of the Interim Report January – June 2019
ImprintEditor — Deutsche Bahn AG, Investor Relations, Berlin
Design and typesetting — Studio Delhi, Mainz
Editing — AdverTEXT, Düsseldorf
Lithography — Koch. Prepress Print Media GmbH, Wiesbaden
Printing — Kunst- und Werbedruck, Bad Oeynhausen
Photography and consulting — Max Lautenschläger, Berlin
Photo credits
Cover page Max Lautenschläger µ1 Max Lautenschläger µ2 Max Lautenschläger µ53 Max Lautenschläger

Deutsche Bahn AG Potsdamer Platz 2
10785 BerlinGermany
www.deutschebahn.com


