23
Deutsche Bank 2006 Results Anthony di Iorio Chief Financial Officer Edinburgh / Dublin, 15 -16 March 2007

Deutsche Bank 2006 ResultsAnthony di IorioChief Financial Officer
Edinburgh / Dublin, 15 -16 March 2007

financialtransparency.
Investor Relations 03/07 · 2
Agenda
1 Outstanding performance in 2006
2 Strengthened strategic positions
3 Phase 3 of our Management Agenda

financialtransparency.
Investor Relations 03/07 · 3
Our bottom line has improved significantly
7.7
6.0
4.03.6
1.4
2002 2003 2004 2005 2006
Underlying pre-tax profit Net income
6.0
0.4
1.4
2.5
3.5
2002 2003 2004 2005 2006
In EUR bn
70%
28%
financialtransparency.
Investor Relations 03/07 · 4
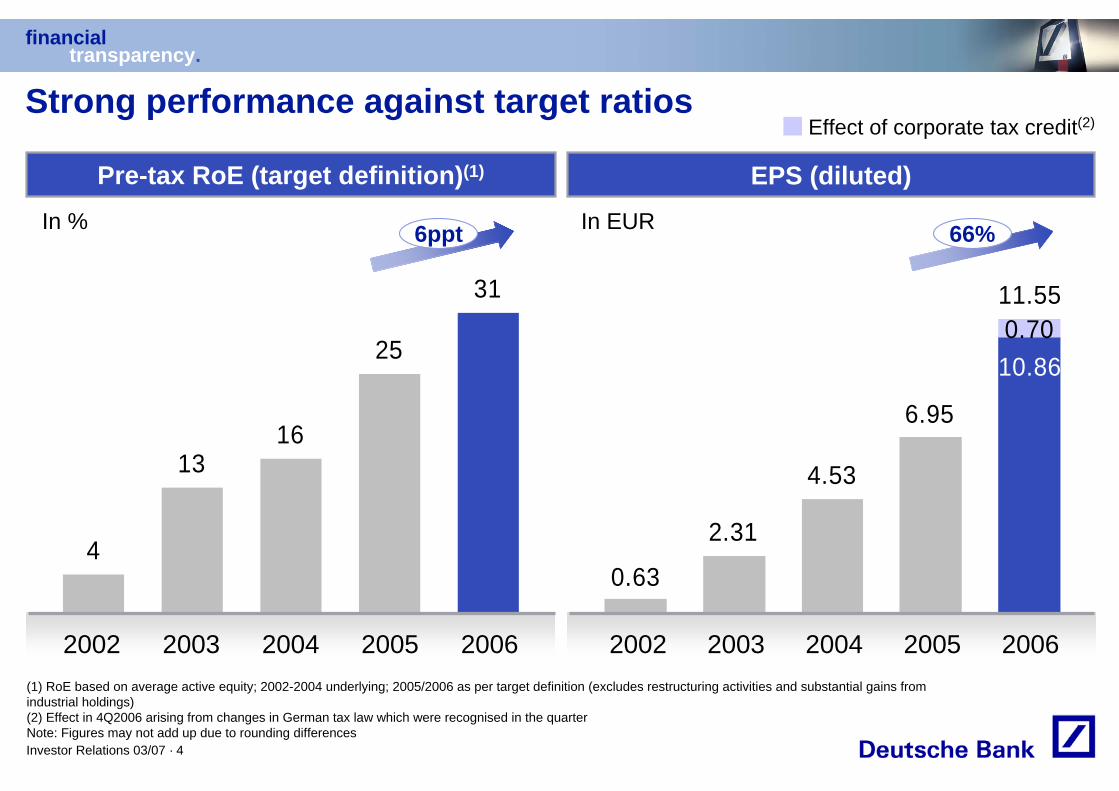
Strong performance against target ratios
EPS (diluted)Pre-tax RoE (target definition)(1)
In %
(1) RoE based on average active equity; 2002-2004 underlying; 2005/2006 as per target definition (excludes restructuring activities and substantial gains from industrial holdings)(2) Effect in 4Q2006 arising from changes in German tax law which were recognised in the quarterNote: Figures may not add up due to rounding differences
In EUR
2003 2004 20052002 2006
4
1316
25
310.7011.55
0.63
2.31
4.53
6.95
10.86
2003 2004 20052002 2006
Effect of corporate tax credit(2)
6ppt 66%

financialtransparency.
Investor Relations 03/07 · 5
1.30 1.50 1.70
2.50
4.00
Exceptional dividend growth
2002 2003 2004 2005 2006(Recommended)
Dividend per share, in EUR32%
CAGR
financialtransparency.
Investor Relations 03/07 · 6
Agenda
1 Outstanding performance in 2006
2 Strengthened strategic positions
3 Phase 3 of our Management Agenda
financialtransparency.
Investor Relations 03/07 · 7
GoldmanSachs*
JPMorganChase
Citigroup DB MorganStanley*
MerrillLynch
UBS CreditSuisse
LehmanBrothers*
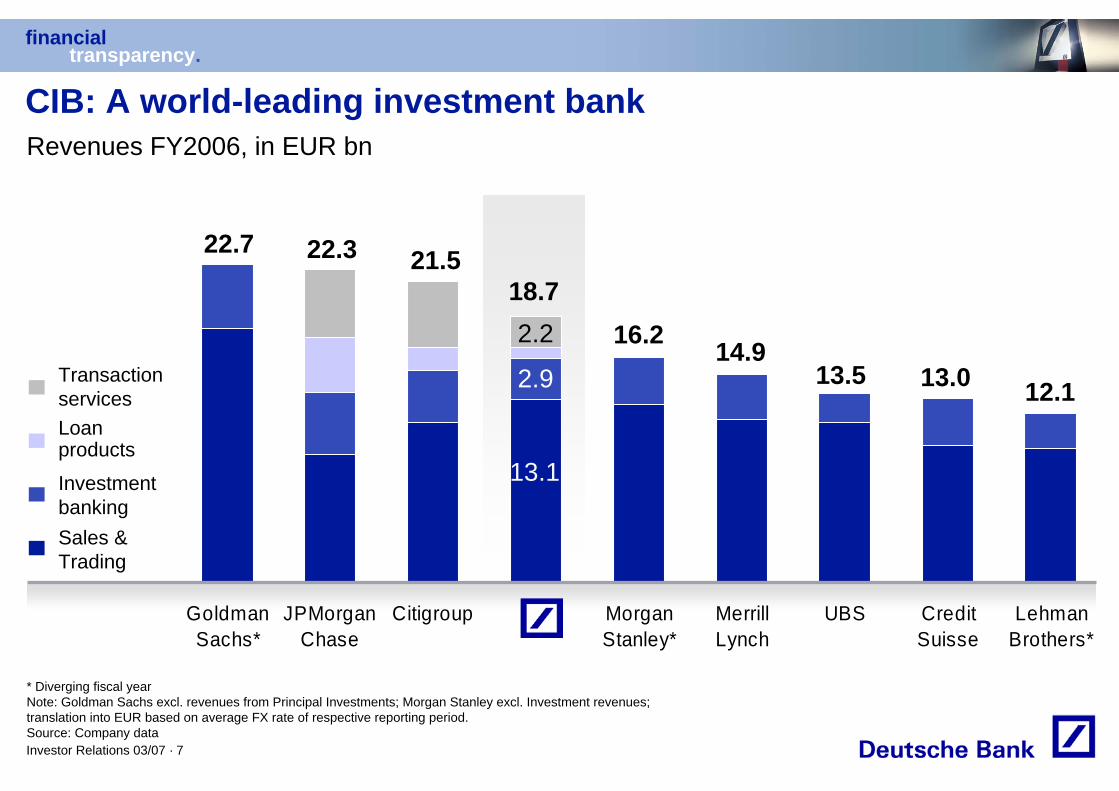
CIB: A world-leading investment bankRevenues FY2006, in EUR bn
16.2
12.1
22.7
14.9
22.3
Sales & Trading
Loan products
Transaction services
Investment banking
* Diverging fiscal yearNote: Goldman Sachs excl. revenues from Principal Investments; Morgan Stanley excl. Investment revenues; translation into EUR based on average FX rate of respective reporting period. Source: Company data
21.5
13.1
2.9
2.218.7
13.5 13.0

financialtransparency.
Investor Relations 03/07 · 8
6.66.76.47.7 8.711.4
9.05.8 6.1
5.15.3
3.12.8 2.6
6.8
4.1
5.7 3.7
9.29.6
18.2
13.111.7 11.4
9.811.5
12.7
GoldmanSachs*
DB MorganStanley*
MerrillLynch
UBS Citigroup CreditSuisse
LehmanBrothers*
JPMorganChase
Debt
Equity
Revenues FY2006, in EUR bnChange vs. 2005
Leading Sales & Trading franchise
* Diverging fiscal yearNote: Citigroup total Sales & Trading revenues include Other revenues of EUR (0.3) bn; translation into EUR based on average FX rate of respective reporting period. Source: Company data
57% 23% 38% 34% 26%14%37% 19% 23%

financialtransparency.
Investor Relations 03/07 · 9
396442
611
434423
576
403467
Record revenues in Origination and Advisory
Origination
1Q 2Q 3Q 4Q 1Q 2Q 3Q 4Q
2005 2006
1,664 2,087FY 25%
38%
197
239208
148 156145114
180
Advisory
1Q 2Q 3Q 4Q 1Q 2Q 3Q 4Q
2005 2006
604 783FY 30%
21%
Net revenues, in EUR m
financialtransparency.
Investor Relations 03/07 · 10
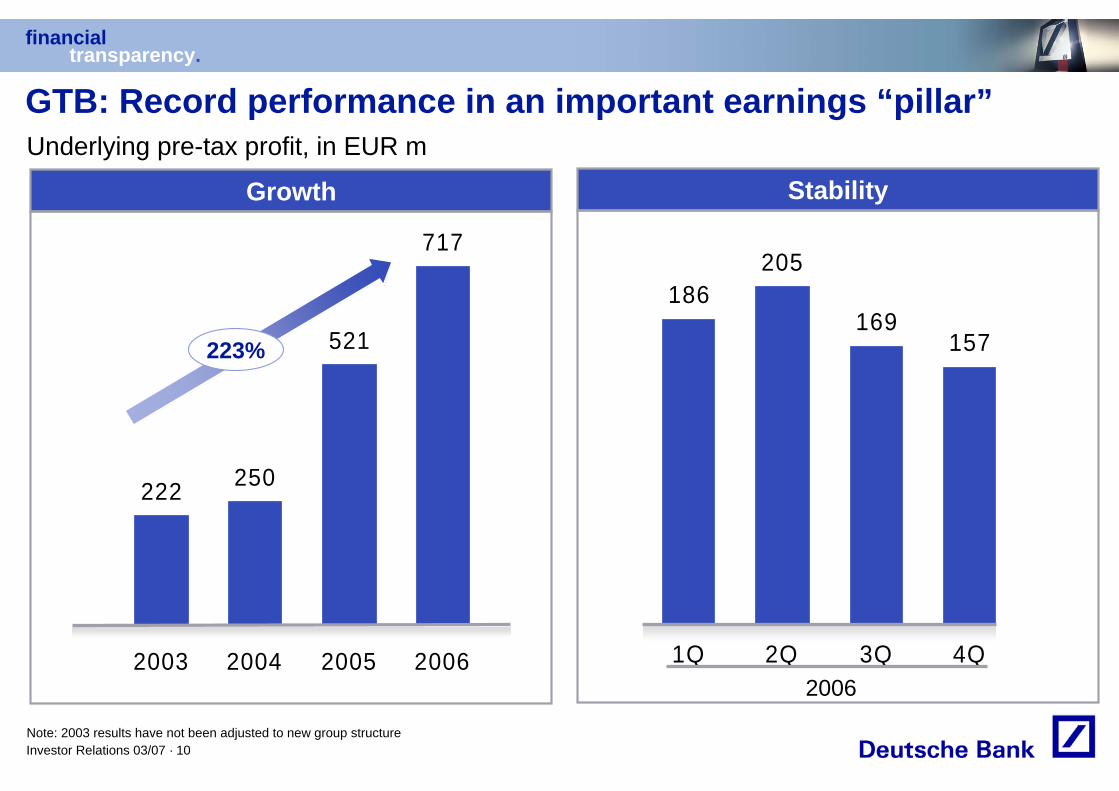
222 250
521
717
2003 2004 2005 2006
223%
Growth
GTB: Record performance in an important earnings “pillar”Underlying pre-tax profit, in EUR m
186205
169157
1Q 2Q 3Q 4Q2006
Stability
Note: 2003 results have not been adjusted to new group structure
financialtransparency.
Investor Relations 03/07 · 11
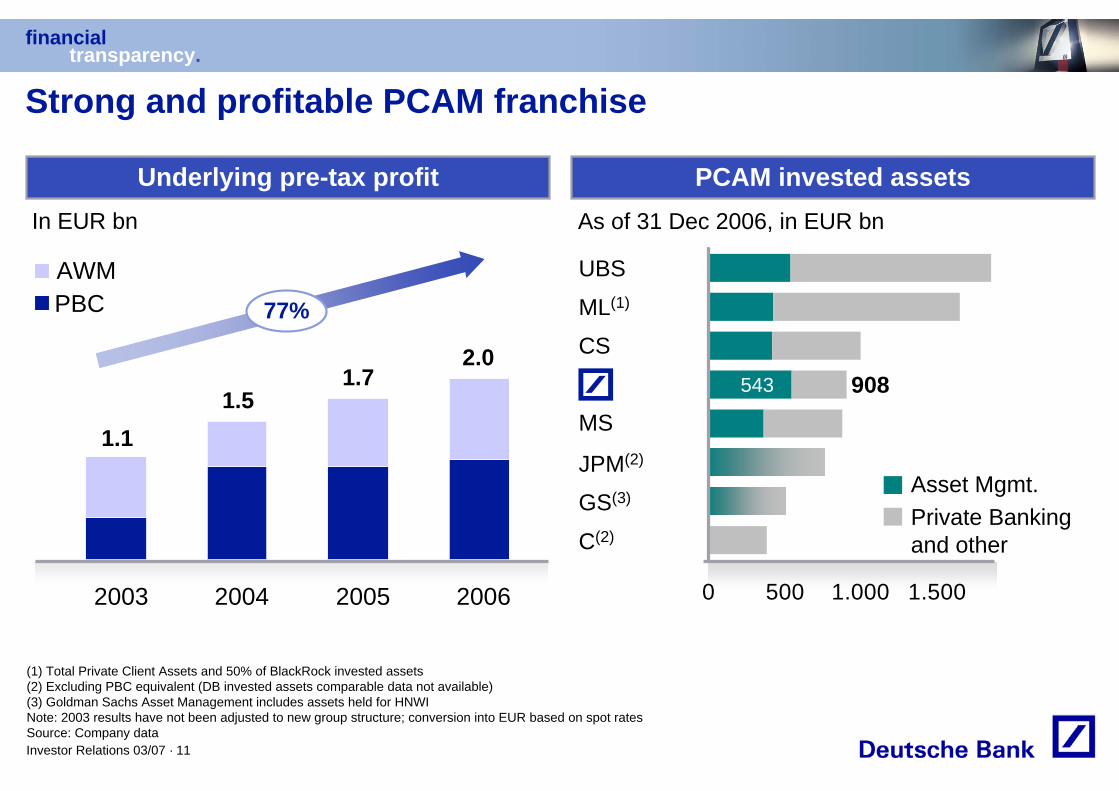
2003 2004 2005 2006
(1) Total Private Client Assets and 50% of BlackRock invested assets (2) Excluding PBC equivalent (DB invested assets comparable data not available) (3) Goldman Sachs Asset Management includes assets held for HNWINote: 2003 results have not been adjusted to new group structure; conversion into EUR based on spot ratesSource: Company data
Underlying pre-tax profit PCAM invested assets
Strong and profitable PCAM franchise
As of 31 Dec 2006, in EUR bn
Private Banking and other
0 500 1.000 1.500
UBS
ML(1)
CS
JPM(2)
GS(3)
C(2)
543 908
In EUR bn
1.11.5
1.7
AWMPBC
2.0
77%
Asset Mgmt.
MS

financialtransparency.
Investor Relations 03/07 · 12
243
162
237 241
183205 208
125
PCAM investing in further growth
Asset and Wealth Management
1Q 2Q 3Q 4Q 1Q 2Q 3Q 4Q
2005 2006
735 870FY 18%
(1)%
Private & Business Clients
244 261235252254
281246
321
1Q 2Q 3Q 4Q 1Q 2Q 3Q 4Q
2005 2006
1,005 1,089FY 8%
(10)%
Underlying pre-tax profit, in EUR m

financialtransparency.
Investor Relations 03/07 · 13
Returns on capital have improved strongly across the board
Corporate Banking & Securities
Global Transaction Banking
Corporate Investments
Private & Business Clients
Asset and Wealth Management
PCA
MC
IB
2002 2006
Average active equity (in EUR bn)
Underlying pre-tax RoE(in %)
Group*
47
18
31
29
33
7
6
4
6622
1.1
2.3
4.9
1.1
16.6
26.8
6.5
1.6
5.7
15.3
31.2
2.2
(13)
* Group incl. Consolidations & AdjustmentsNote: FY2002 figures reflect segment composition as of 31 December 2004
(2)

financialtransparency.
Investor Relations 03/07 · 14
Agenda
1 Outstanding performance in 2006
2 Strengthened strategic positions
3 Phase 3 of our Management Agenda

financialtransparency.
Investor Relations 03/07 · 15
The current phase of our strategy
Management Agenda Phase 3
Build on our competitive edge in CIB
Continue to invest in organic growth and ‘bolt-on’ acquisitions
Further grow our ‘stable’ businesses in PCAM and GTB
Maintain our cost, risk, capital and regulatory discipline
2006 – 2008:Leveraging our global platform for accelerated growth

financialtransparency.
Investor Relations 03/07 · 16
8.9
10.09.6
8.6 8.7
'02 '03 '04 '05 '06
Maintain our cost, risk, capital and regulatory discipline
Cost Risk Capital
(1) Problem loans divided by total loans, at year end(2) At year end
Tier 1 ratio(2), in %
1.9
4.5
6.3
3.5
2.5
'02 '03 '04 '05 '06
Underlying CIR, in % Problem loan ratio(1), in %
71
79
85
80
74
'02 '03 '04 '05 '06

financialtransparency.
Investor Relations 03/07 · 17
Continue to invest in organic growth …
237
216 217
251
274
2002 2003 2004 2005 2006
Risk-weighted assetsAt year end, in EUR bn
Underlying return on RWA(1) (in %)
0.51.6
1.82.5
2.9
(1) Underlying pre-tax profit in % of average risk-weighted assets(2) Net of de-/consolidations
1,525
531
251
890
PBC
AWM
GTB
CB&S
Growth in key businessesFTE, change 31 Dec 2006 vs. 31 Dec 2005(2)

financialtransparency.
Investor Relations 03/07 · 18
… and ‘bolt-on’ acquisitions
Transactions announced during 2006 Closing dates
MortgageIT
Berliner Bank
Norisbank
Tilney 14 December 2006
2 January 2007
1 January 2007
2 November 2006
Status

financialtransparency.
Investor Relations 03/07 · 19
2003 2004 2005 2006
Note: 2003 results have not been adjusted to new group structure
Further grow our ‘stable’ businessesUnderlying pre-tax profit GTB, AWM and PBC, in EUR bn
GTB
PBCAWM
1.31.7
2.32.7
2x

financialtransparency.
Investor Relations 03/07 · 20
5.2
4.2
2.82.7
2003 2004 2005 2006
Build on our competitive edge in investment banking
Note: 2003 results have not been adjusted to new group structure
Underlying pre-tax profit CB&S, in EUR bn
2x

financialtransparency.
Investor Relations 03/07 · 21
Vision 2008: A good start
Asset and Wealth Management
Private & Business Clients
Consolidation & Adjustments
Corporate Banking & Securities
Global Transaction Banking
Corporate Investments
Group
Underlying pre-tax profit, in EUR bn
Note: Figures may not add up due to rounding
2005
0.7
1.0
(0.6)
4.2
0.5
0.0
6.0
2006
0.9
1.1
(0.1)
5.2
0.7
(0.0)
7.7
Vision 2008
1.3
1.3
(0.5)
5.3
1.0
0.0
8.4

financialtransparency.
Investor Relations 03/07 · 22
We are confident of delivering on our Group targets
DividendsIncrementally increasing
pay-out ratio to 50%
Share buybacksFlexible lever to
optimise capital structure
Double-digit EPS growth in%
Sustainable profitabilityof 25% pre-tax RoE
Capital managementGroup targets “over-the-cycle”
Organic growthFinancing RWA increase
External growthCovering goodwill
and intangibles MaintainingTier 1 ratioof 8 – 9%
MaintainingTier 1 ratioof 8 – 9%

financialtransparency.
Investor Relations 03/07 · 23
Cautionary statement regarding forward-looking statements and non-U.S. GAAP financial measuresThis presentation contains forward-looking statements. Forward-looking statements are statements that are not historical facts; they include statements about our beliefs and expectations. Any statement in this presentation that states our intentions, beliefs, expectations or predictions (and the assumptions underlying them) is a forward-looking statement. These statements are based on plans, estimates and projections as they are currently available to the management of Deutsche Bank. Forward-looking statements therefore speak only as of the date they are made, and we undertake no obligation to update publicly any of them in light of new information or future events.
By their very nature, forward-looking statements involve risks and uncertainties. A number of important factors could therefore cause actual results to differ materially from those contained in any forward-looking statement. Such factors include the conditions in the financial markets in Germany, in Europe, in the United States and elsewhere from which we derive a substantial portion of our trading revenues, potential defaults of borrowers or trading counterparties, the implementation of our management agenda, the reliability of our risk management policies, procedures and methods, and other risks referenced in our filings with the U.S. Securities and Exchange Commission. Such factors are described in detail in our SEC Form 20-F of 23 March 2006 on pages 7 through 13 under the heading "Risk Factors." Copies of this document are readily available upon request or can be downloaded from www.deutsche-bank.com/ir.
This presentation contains non-U.S. GAAP financial measures. For a reconciliation to directly comparable figures reported under U.S. GAAP refer to the 4Q2006 Financial Data Supplement, which is accompanying this presentation and available on our Investor Relations website at www.deutsche-bank.com/ir.


