29
March 22, 2016 NYSE: GLT Deutsche Bank Basic Materials One-on-One Day John P. Jacunski, EVP & CFO
| Date post: | 06-Apr-2018 |
| Category: |
Documents |
| Upload: | trankhuong |
| View: | 215 times |
| Download: | 0 times |

March 22, 2016
NYSE: GLT
Deutsche Bank Basic Materials
One-on-One Day
John P. Jacunski, EVP & CFO

Any statements included in this presentation which pertain to future financial and business matters are
“forward-looking statements” within the meaning of the safe harbor provisions of the United States Private
Securities Litigation Reform Act of 1995. The Company uses words such as “anticipates”, “believes”,
“expects”, “future”, “intends” and similar expressions to identify forward-looking statements. Any such
statements are based on management’s current expectations and are subject to numerous risks,
uncertainties and other unpredictable or uncontrollable factors that could cause future results to differ
materially from those expressed in the forward-looking statements including, but not limited to: changes in
industry, business, market, political and economic conditions in the U.S. and other countries in which the
Company does business, demand for or pricing of its products, changes in tax legislation, governmental
laws, regulations and policies, initiatives of regulatory authorities, technological changes and innovations,
market growth rates, and cost reduction initiatives. In light of these risks, uncertainties and other factors,
the forward-looking matters discussed in this presentation may not occur and readers are cautioned not to
place undue reliance on these forward-looking statements. The forward-looking statements speak only as
of the date of this presentation and Glatfelter undertakes no obligation, and does not intend, to update
these forward-looking statements to reflect events or circumstances occurring after the date of this
presentation. More information about these factors is contained in Glatfelter’s filings with the U.S.
Securities and Exchange Commission, which are available at www.glatfelter.com.
During the course of this presentation, certain non-U.S. GAAP financial measures will be presented. A
reconciliation of these measures to U.S. GAAP financial measures is included in the appendix of this
presentation.
Forward-Looking Statements and Use of Non-GAAP Financial Measures
2

Agenda
• Business Overview
• Financial Overview
3
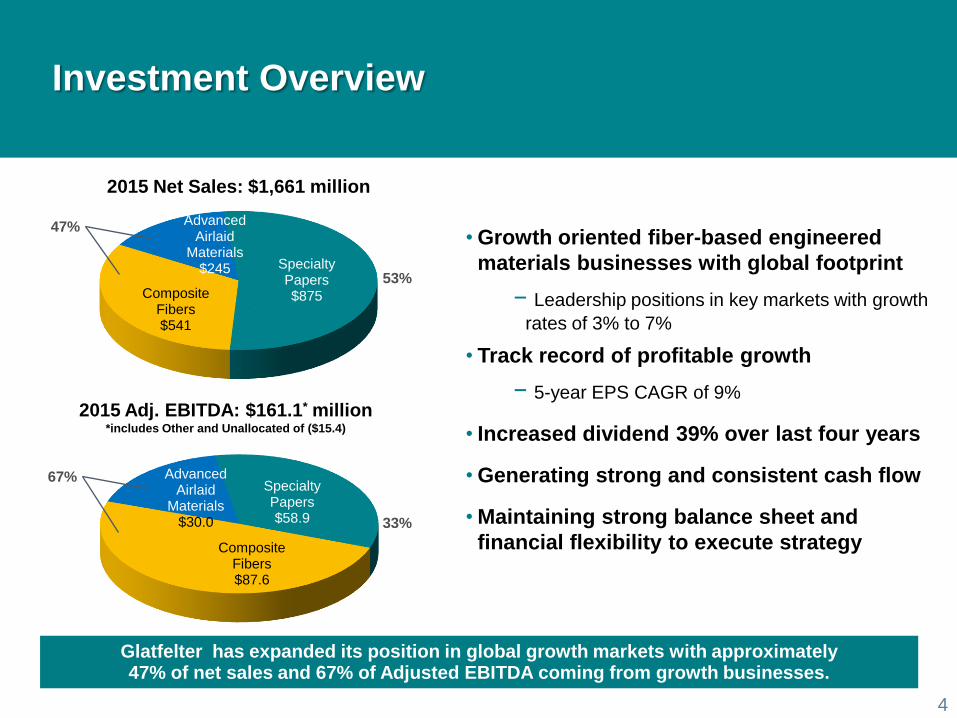
Glatfelter has expanded its position in global growth markets with approximately 47% of net sales and 67% of Adjusted EBITDA coming from growth businesses.
2015 Net Sales: $1,661 million
2015 Adj. EBITDA: $161.1* million *includes Other and Unallocated of ($15.4)
Specialty Papers $863
Advanced Airlaid Materials
$239
Composite Fibers $447
Specialty Papers $58.9
Composite Fibers $87.6
Advanced Airlaid
Materials $30.0
Specialty Papers $875 Composite
Fibers $541
Advanced Airlaid
Materials $245
67%
33%
53%
Investment Overview
• Growth oriented fiber-based engineered
materials businesses with global footprint
− Leadership positions in key markets with growth
rates of 3% to 7%
• Track record of profitable growth
− 5-year EPS CAGR of 9%
• Increased dividend 39% over last four years
• Generating strong and consistent cash flow
• Maintaining strong balance sheet and
financial flexibility to execute strategy
47%
4

Composite Fibers Business Unit
Food & Beverage
51%
Nonwoven
Wallcovering 17% Metallized
Products 13%
Technical Specialties
13%
Composite Laminates
6%
• Leading market positions driving growth
• 2015 revenue flat in constant currency
– Food & beverage volume +5%
– Wallcover volume down 20% due to situation in Russia &
Ukraine
• Attractive long term growth rates
– Global tea and coffee markets ~ 3%
– Nonwoven wallcover market ~ 5%
– Electrical market ~ 7%
• Broadened electrical product portfolio with 2014
acquisition
2015 Key Product Sales Mix
5
Revenue & Shipment Trends
$419 $476 $437
$566 $618
$541
90,350 93,317 90,300
133,570
157,336 153,767
2010 2011 2012 2013 2014 2015
Revenue Tons Sold
• Tea Bags #1
• Single-Serve Coffee #1
• Nonwoven Wallcovering #1
Market Positions (Worldwide, Pro-Forma)
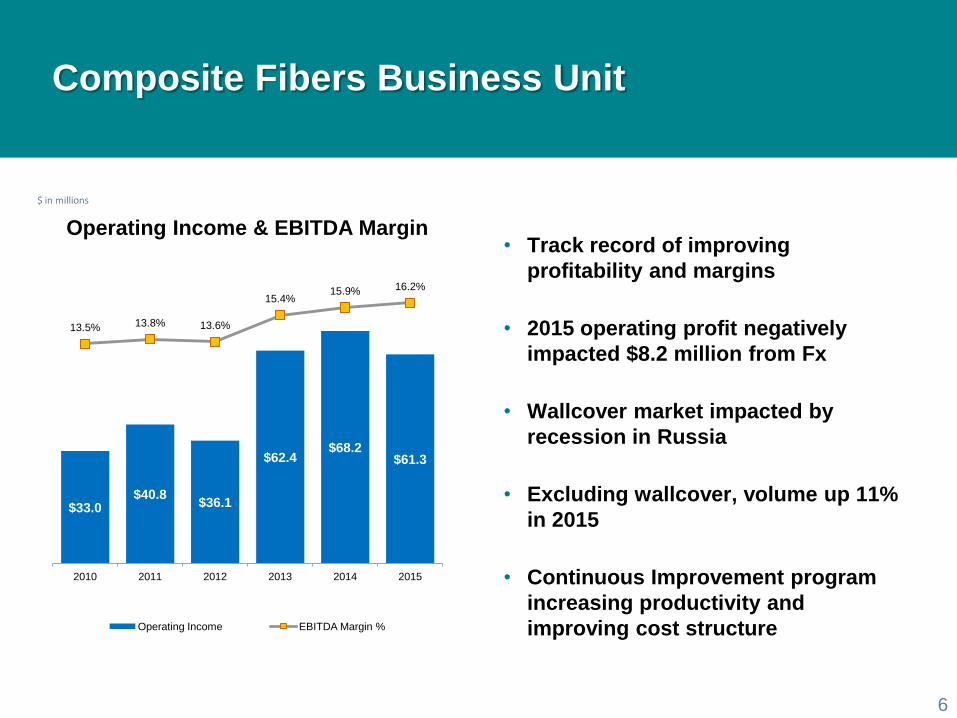
Composite Fibers Business Unit
• Track record of improving
profitability and margins
• 2015 operating profit negatively
impacted $8.2 million from Fx
• Wallcover market impacted by
recession in Russia
• Excluding wallcover, volume up 11%
in 2015
• Continuous Improvement program
increasing productivity and
improving cost structure
$ in millions
Operating Income & EBITDA Margin
6
$33.0 $40.8
$36.1
$62.4 $68.2
$61.3
13.5% 13.8% 13.6%
15.4% 15.9% 16.2%
2010 2011 2012 2013 2014 2015
Operating Income EBITDA Margin %
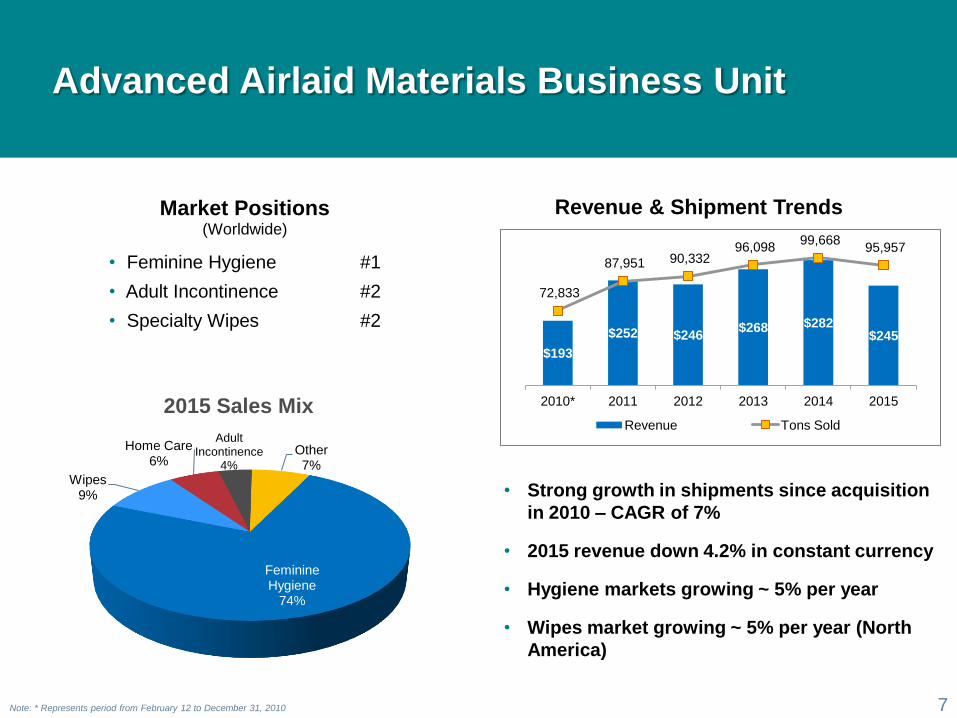
Advanced Airlaid Materials Business Unit
Feminine Hygiene
74%
Wipes 9%
Home Care 6%
Adult Incontinence
4%
Other 7%
2015 Sales Mix
7 Note: * Represents period from February 12 to December 31, 2010
Revenue & Shipment Trends
$193
$252 $246 $268 $282
$245
72,833
87,951 90,332 96,098
99,668 95,957
2010* 2011 2012 2013 2014 2015
Revenue Tons Sold
• Feminine Hygiene #1
• Adult Incontinence #2
• Specialty Wipes #2
Market Positions (Worldwide)
• Strong growth in shipments since acquisition
in 2010 – CAGR of 7%
• 2015 revenue down 4.2% in constant currency
• Hygiene markets growing ~ 5% per year
• Wipes market growing ~ 5% per year (North
America)

Advanced Airlaid Materials Business Unit
• Track record of profit and margin
growth since 2010
– Operating profit impacted by weak
volume in 1H’15
• Leading market positions driving
growth
• Innovation and R&D capability
creating new product opportunities
• Continuous Improvement initiatives
are expanding margins
• ~ 90% of revenue has cost pass-
through arrangements
• Building new facility in U.S. with
start-up expected in late 2017
$ in millions
Operating Income & EBITDA Margin
8
$4.4
$13.4
$18.0 $21.4
$25.3
$21.2
6.0%
8.7%
10.8% 11.3%
12.2% 12.3%
2010* 2011 2012 2013 2014 2015
Operating Income EBITDA Margin %
Note: * Represents period from February 12 to December 31, 2010

Specialty Papers Business Unit
Carbonless & Forms
40%
Engineered Products
22%
Book Publishing
18%
Envelope & Converting
20%
2015 Sales Mix
9
• 11 consecutive years of outperforming
broader market and growing market
share
• Superior customer service
• Intensive focus on new products
Year-Over-Year Change in Shipments
0.0%
-5.0% -8.0%
-16.0%
-2.3% -3.7% -3.4% -2.3%
-8.1%
-1.0%
4.0% 1.6% 2.5%
-0.7%
3.5% 2.0% 1.2% 1.4% 0.3% -0.1%
2006 2007 2008 2009 2010 2011 2012 2013 2014 2015
UFS Market Demand for N.A.
Glatfelter Shipments (adjusted for acquisitions)
• Postal Applications #1
• Playing Cards #1
• Trade Book Publishing #1
• Carbonless Products #2
• Greeting Cards #2
• Envelope #2
Market Positions (North America)

Specialty Papers Business Unit
• Recent results impacted by
following:
– Bottom of cycle pricing
– Pulp production issues
• Customer service and new business
development driving share gains
• Culture of continuous improvement
and aggressive cost control
• Manufacturing flexibility
• Track record of success
Operating Income & EBITDA Margin
$ in millions
10
$58.4 $57.3
$67.3
$39.7 $38.6 $33.0
11.1% 10.7%
11.1%
8.2%
7.6%
6.7%
2010 2011 2012 2013 2014 2015
Operating Income EBITDA Margin %

Agenda
• Business Overview
• Financial Overview
11
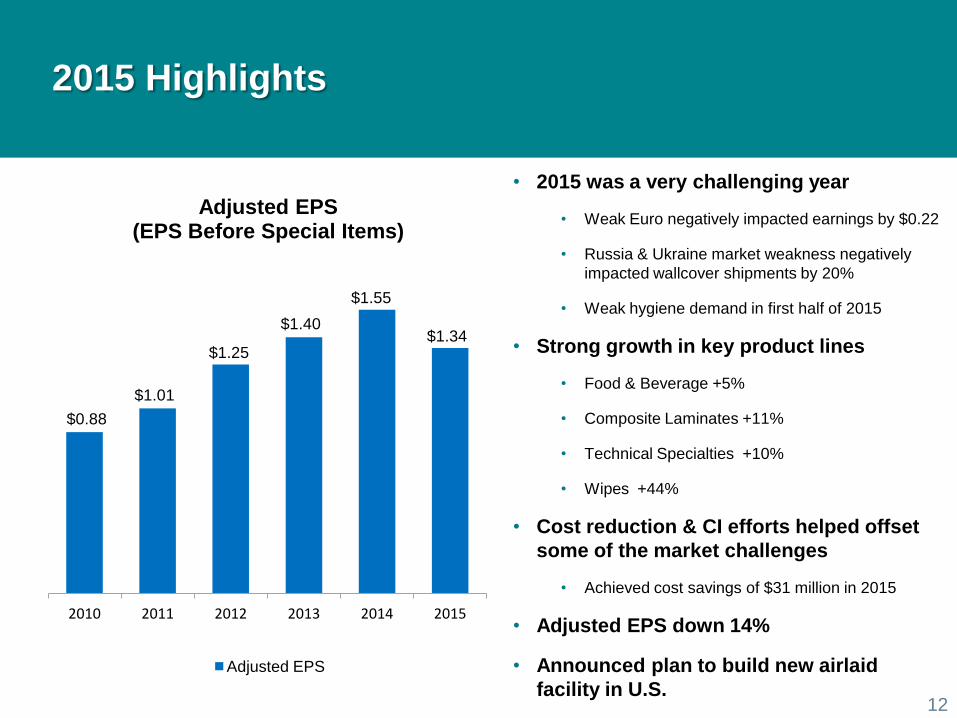
2015 Highlights
• 2015 was a very challenging year
• Weak Euro negatively impacted earnings by $0.22
• Russia & Ukraine market weakness negatively
impacted wallcover shipments by 20%
• Weak hygiene demand in first half of 2015
• Strong growth in key product lines
• Food & Beverage +5%
• Composite Laminates +11%
• Technical Specialties +10%
• Wipes +44%
• Cost reduction & CI efforts helped offset
some of the market challenges
• Achieved cost savings of $31 million in 2015
• Adjusted EPS down 14%
• Announced plan to build new airlaid
facility in U.S.
Adjusted EPS (EPS Before Special Items)
12
$0.88
$1.01
$1.25
$1.40
$1.55
$1.34
2010 2011 2012 2013 2014 2015
Adjusted EPS

$1.55
$1.34
$(0.32)
$(0.24)
$0.46
$0.16 $(0.09)$(0.02) $0.06 $(0.22)
2014 Selling
Price
Volume
/Mix (*)
Input
costs
Operations SPBU
expandedoutage
Corporate
Unallocated& Pension
Tax
Rate
FX 2015
Adjusted EPS – 2015 vs. 2014
13 Note: See appendix of this presentation for the reconciliation of adjusted EPS to its nearest GAAP measure.
Food & Beverage +5%
Composite Laminates +11%
Technical Specialties +10%
Wallcover -20%
Feminine Hygiene -6%
Wipes +44%
SPBU -0.1%
Fx ($0.35)
Benefit of Currency Hedges $0.13
Lower input costs and operations improvements were more than offset by the challenging market environment and negative currency headwinds.
Tax rate 17.7% in 2015
versus 21.6% in 2014
* - Volume/mix includes the impact of market related downtime

$1,455 $1,603 $1,578
$1,723 $1,802 $1,661
2010 2011 2012 2013 2014 2015
Net Sales (in millions)
Financial Highlights
$150.9 $164.0
$174.2 $177.2 $183.3 $161.1
10.4% 10.2%
11.0%
10.3% 10.2% 9.7%
2010 2011 2012 2013 2014 2015
Adj. EBITDA / Margin % (in millions)
Adj. EBITDA Adj. EBITDA % of Net Sales
14
Steady growth in Revenue and EBITDA from 2010-2014; 2015 impacted by weak Euro and Russia/Ukraine situation.

Attractive Free Cash Flow Profile
Glatfelter continues to generate strong and consistent cash flow to fund growth initiatives, dividends and share repurchases, and to maintain financial flexibility.
Note: Figures in millions
$168.0
$140.3
$112.8
$173.6
$99.6
$133.7
$76.6 $58.0
$77.3 $94.3
$38.2 $53.9
2010 2011 2012 2013 2014 2015
Cash from Ops. Adjusted FCF (excl. AFM/CBC & Major Capital Projects)
15

Capital Expenditures and Related Cost Estimate
(in millions) 2015A 2016E 2017E
Normal Capital Expenditures $73 $70 - $80 $70 - $80
Major Projects
Boiler Environmental Compliance (SPBU) 27 40 - 45 7 - 17
Capacity expansion (AMBU) - 40 - 45 35 - 40
Total $100 $150 - $170 $112 - $137
• Boiler Environmental Compliance
• Convert/Replace boilers to use natural gas
• Upgrade associated infrastructure including
connecting to gas pipelines
• Total project cost of $85 million to $90 million
• Total spend to date of $33 million
• Total capital expenditures for
Advanced Airlaid Materials capacity
expansion project estimated at $80
million
• Expect start-up in Q4 2017 with
commercial shipments in Q1 2018
(in millions) 2015A 2016E 2017E
Boiler Environmental Compliance (SPBU) - $7 $0
Capacity expansion (AMBU) - $2 $4
Total - $9 $4
Capital Expenditures Estimate
Major Projects One-Time Costs Estimate
• SPBU annual maintenance outages
in Q2 2016 expected to cost $28
million versus $33 million in Q2 2015
16

Improved Returns on Invested Capital
Earnings growth, consistent free cash flow and disciplined capital deployment have significantly improved return on capital, which is above GLT’s weighted average cost of capital.
4.3%
5.6%
6.3%
8.5%
7.6%
8.3% 8.6%
9.3% 8.8%
8.0% 7.7%
2005 2006 2007 2008 2009 2010 2011 2012 2013 2014 2015
Note: Return on invested capital based on after-tax earnings from operations excluding unusual items. 17

Pension Plan Remains Overfunded
No cash contribution required in 2015 or expected for the foreseeable future. Pension expense
expected to decrease in 2016 primarily driven by higher discount rates.
(in millions) 2010 2011 2012 2013 2014 2015
2016
Estimate
Pension (Income) /
Expense
$9.2 $10.4 $11.6 $14.2 $6.7 $9.1 $4.6
Cash contributions* $0 $0 $0 $0 $0 $0 $0
Funded Status ($ millions)
$92.1
$28.0 $17.3
$113.5
$60.4 $53.0
2010 2011 2012 2013 2014 2015
Funded status ($mm) No cash contributions needed from 2010 through 2015
* Qualified plans only
18

Balance Sheet Metrics
• In 2015, Company completed
sale of 15,628 acres of
timberlands for $25 million
cash and after-tax gain of
approximately $13.2 million
• Leverage at 1.6x as of
December 31, 2015
• Total liquidity of $354 million
• Sufficient financial flexibility
and liquidity to meet near term
investment needs and execute
long term strategy
Notes: *The above calculation is not intended to be used for purposes of calculating debt covenant compliance.
The sum of individual amounts set forth above may not agree to the column totals due to rounding. 19
(in millions) 31-Dec-13 31-Dec-14 31-Dec-15
Cash $122.9 $99.8 $105.3
Debt
Current portion of long term debt - 5.7 7.4
5⅜% Notes, due October 2020 250.0 250.0 250.0
1.55 - 2.4% Term Loans, due June 2022 - 2025 58.8 58.3 47.7
Revolving credit agreement 133.5 90.6 58.8
Total Debt $442.3 $404.6 $363.9
Net Debt $319.4 $304.8 $258.6
Shareholders’ Equity $684.5 $649.1 $663.2
TTM Adj. EBITDA (excl. Pension) $177.2 $183.3 $161.1
Leverage* 1.8 1.7 1.6
Cash available under bank facility $211.3 $246.6 $248.3

Wrap-Up
• Leading positions in key growth markets
• Expansion of growth platforms both organically and through acquisition
• Near term challenges
– Recession in Russia
– Weakened Euro
• Focus Areas
– New product development
– New market opportunities
– Manufacturing execution
– Continuous improvement initiatives
• Track record of profitable growth
• Delivering returns above cost of capital
• Financial strength to fund future growth
20 Profitable Growth • Delivering Returns • Financial Strength

Appendix
21

Adjusted EBITDA– 2015 vs. 2014
22 Note: See appendix of this presentation for the reconciliation of adjusted EBITDA to its nearest GAAP measure.
Lower input costs and operations improvements were more than offset by the challenging market environment and negative currency headwinds.
$183.3
$161.1
$(18.1)
$(13.2)$25.7
$6.7 $(5.2) $1.2 $(17.7)
$(1.6)
2014 Selling
Price
Volume
/Mix (*)
Input
costs
Operations SPBU
expandedoutage
Corporate
Unallocated
FX Net Power
Sales, REC's& Other
2015
Food & Beverage +5%
Composite Laminates +11%
Technical Specialties +10%
Wallcover -20%
Feminine Hygiene -6%
Wipes +44%
SPBU -0.1%
Fx $(24.9)m
Benefit of Currency Hedges $7.2m
* - Volume/mix includes the impact of market related downtime

Flexible Operating Platforms
Strong Global Reach
Fremont, OH
Chillicothe, OH
York, PA
Scaër, France
Lydney, UK
Gernsbach, Germany
Lanao del Norte, Philippines
Falkenhagen, Germany Gatineau, Quebec
Spring Grove, PA
Caerphilly, UK
Atlanta, GA
Moscow, Russia
Suzhou, China
Hong Kong, China
2015 Revenue Breakdown
North America 63% $1.1 billion
Europe 28% $0.5 billion
ROW 9% $0.1 billion
Total 100% $1.7 billion
Corporate Headquarters
Specialty Papers
Composite Fibers
Advanced Airlaid Materials
Sales / Distribution Offices
Glatfelter end-markets
Glatfelter’s strong global production platform in core geographies is enhanced by key sales and distribution operations.
Dresden, Germany
23
Dresden, Germany
OberSchmitten, Germany

Cost of Goods Sold Breakdown
Raw Materials
Energy
Labor
Depreciation
Other COGS
― Total Glatfelter ―
46%
8%
23%
4%
19%
― Specialty Papers ―
37%
8% 26%
3%
26%
― Composite Fibers ―
55%
11%
20%
6% 8%
― Advanced Airlaid Materials ―
62%
4%
17%
4%
13%
24
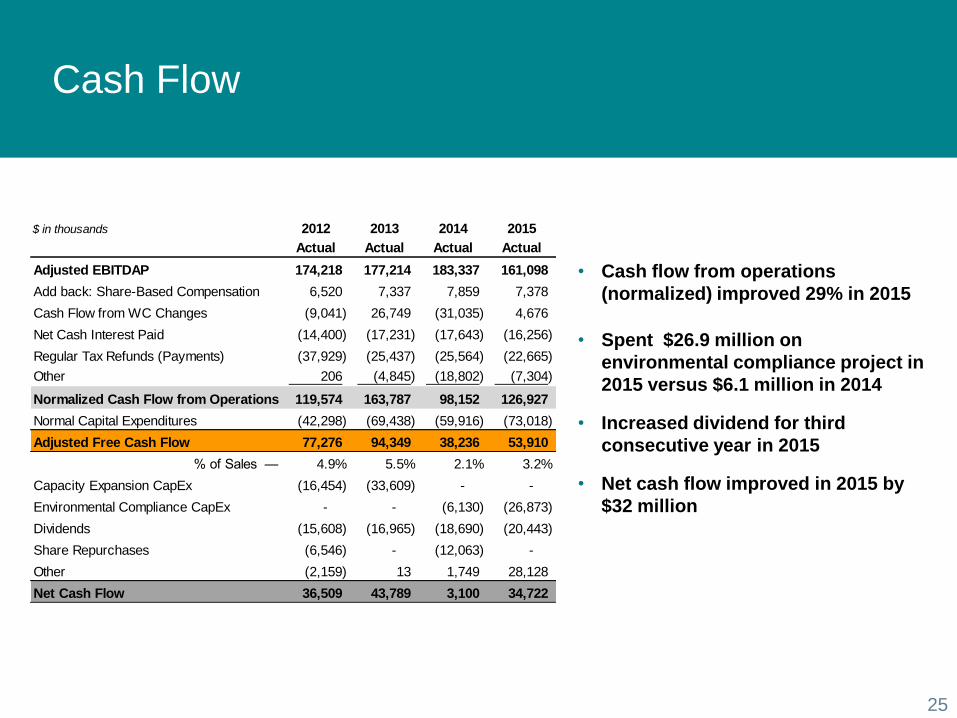
Cash Flow
• Cash flow from operations
(normalized) improved 29% in 2015
• Spent $26.9 million on
environmental compliance project in
2015 versus $6.1 million in 2014
• Increased dividend for third
consecutive year in 2015
• Net cash flow improved in 2015 by
$32 million
$ in thousands 2012 2013 2014 2015
Actual Actual Actual Actual
Adjusted EBITDAP 174,218 177,214 183,337 161,098
Add back: Share-Based Compensation 6,520 7,337 7,859 7,378
Cash Flow from WC Changes (9,041) 26,749 (31,035) 4,676
Net Cash Interest Paid (14,400) (17,231) (17,643) (16,256)
Regular Tax Refunds (Payments) (37,929) (25,437) (25,564) (22,665)
Other 206 (4,845) (18,802) (7,304)
Normalized Cash Flow from Operations 119,574 163,787 98,152 126,927
Normal Capital Expenditures (42,298) (69,438) (59,916) (73,018)
Adjusted Free Cash Flow 77,276 94,349 38,236 53,910
% of Sales — 4.9% 5.5% 2.1% 3.2%
Capacity Expansion CapEx (16,454) (33,609) - -
Environmental Compliance CapEx - - (6,130) (26,873)
Dividends (15,608) (16,965) (18,690) (20,443)
Share Repurchases (6,546) - (12,063) -
Other (2,159) 13 1,749 28,128
Net Cash Flow 36,509 43,789 3,100 34,722
25

Free Cash Flow
Notes: The sum of individual amounts set forth above may not agree to the column totals due to rounding.
Working capital is defined as accounts receivable plus inventories less accounts payable. 26
(in millions) 2011 2012 2013 2014 2015
Adjusted EBITDA $164.0 $174.2 $177.2 $183.3 $161.1
Change in Working Capital 10.1 (9.0) 26.7 (31.0) 4.7
Taxes paid 8.3 (44.7) (15.6) (24.1) (15.8)
Interest Paid (24.2) (14.4) (17.2) (17.6) (16.3)
Other (17.9) 6.7 2.5 (10.9) 0.1
Cash Flow from Operations 140.3 112.8 173.6 99.6 133.7
Less: Capital Expenditures (64.5) (58.8) (103.0) (66.0) (99.9)
Free Cash Flow 75.8 54.1 70.6 33.5 33.9
Adjustment for major capital projects 0.0 16.5 33.6 6.1 26.9
Exclude: CBC/AFM Credit (17.8) 6.7 (9.8) (1.4) (6.8)
Adjusted Free Cash Flow $58.0 $77.3 $94.3 $38.2 $53.9

Reconciliation of Non-GAAP
Measures Adjusted EPS
Note: The sum of individual amounts set forth above may not agree to the column totals due to rounding. 27
2009 2010 2011 2012 2013 2014 2015
Net income (loss) $2.70 $1.17 $0.93 $1.36 $1.52 $1.57 $1.47
Charge for workforce efficiencies - - 0.01 - - 0.01 0.03
Cellulosic bio-fuel and alternative fuel mixture credits (2.09) (0.50) - (0.09) (0.23) (0.02) -
Gains from sales of timberland and related transaction
costs(0.00) (0.02) (0.10) (0.12) (0.04) (0.06) (0.33)
Asset impairment charge - - - - - 0.05 0.02
Shutdown and restructuring charges - - - - - - -
Acquisition and integration related costs 0.04 0.20 0.02 - 0.13 0.01 -
International legal entity restructuring - - - - 0.01 - -
Fox River environmental matter - - - - - - 0.14
Debt redemption costs - - 0.14 0.11 - - -
Reserves for environmental matters - - - - - - -
Adjusted earnings (loss) $0.64 $0.88 $1.01 $1.25 $1.40 $1.55 $1.34
Pension Impact on Adjusted EPS 0.10 0.12 0.14 0.17 0.20 0.09 0.13
Adjusted earnings (loss) excl. pension $0.74 $1.00 $1.16 $1.42 $1.59 $1.65 $1.47

Reconciliation of Non-GAAP Measures Adjusted EBITDA, Excluding Pension
Note: The sum of individual amounts set forth above may not agree to the column totals due to rounding. 28
2009 2010 2011 2012 2013 2014 2015
In millions
Net Income 123.4$ 54.4$ 42.7$ 59.4$ 67.2$ 69.2$ 64.6$
Taxes 19.7 (20.9) 8.2 19.6 2.0 18.1 14.0
Net Pension Expenses 7.0 9.2 10.4 11.6 14.2 6.7 9.1
Depreciation and Amortization 61.3 65.8 69.3 69.5 68.2 70.6 63.2
Net Interest Expense 17.3 24.7 31.1 18.2 17.7 18.8 17.2
EBITDA, excluding Pension 228.8$ 133.4$ 161.7$ 178.3$ 169.3$ 183.4$ 168.1$
Adjustments / exclusions:
Gains on Timberland Sales and Transaction Related Costs (0.5) (0.4) (3.4) (9.2) (1.4) (4.9) (20.9)
Asset impairment charge - - - - - 3.3 1.2
Debt Redemption Costs - - 3.6 5.1 - - -
Cellulosic Bio-fuel and Alternative Fuel Mixture Credits (105.5) 0.1 - - - - -
Acquisition and Integration Related Costs 3.5 11.9 1.1 - 6.5 1.1 0.2
Workforce Efficiency Charge - - 1.0 - - 0.5 2.5
International legal entity Restructuring - - - - 2.8 - -
Write-off of Concert Indemnification Receivable - 2.5 - - - - -
Foreign Currency Hedge on Acquisition Price - 3.4 - - - - -
AMBU capacity expansion - - - - - - 0.0
Fox River Environmental matter - - - - - - 10.0
Adjusted EBITDA, excluding pension 126.2$ 150.9$ 164.0$ 174.2$ 177.2$ 183.3$ 161.1$

Reconciliation of Non-GAAP Measures Net Debt and Leverage
* - The above calculation is not intended to be used for purposes of calculating debt covenant compliance. 29
Net debt & Leverage December 31 December 31 December 31
In millions 2013 2014 2015
Current Portion of Long-Term Debt $0.0 $5.7 $7.4
Long-Term Debt 442.3 398.9 356.5
Total Debt 442.3 404.6 363.9
Less: Cash (122.9) (99.8) (105.3)
Net Debt $319.4 $304.8 $258.6
Net Debt $319.4 $304.8 $258.6
Divided by: TTM Adjusted EBITDA 177.2 183.3 161.1
Leverage* 1.8x 1.7x 1.6x


