ACOUSTICS FINISHING SEATING COMPONENTS DEUTSCHE BANK LEVERAGED FINANCE CONFERENCE 2017 Brian Kobylinski, Chief Executive Officer Chad Paris, Chief Financial Officer John Hengel, Vice President, Finance
Transcript
ACOUSTICSFINISHING SEATINGCOMPONENTS
DEUTSCHE BANK LEVERAGED FINANCE CONFERENCE 2017
Brian Kobylinski, Chief Executive Officer
Chad Paris, Chief Financial Officer
John Hengel, Vice President, Finance
2
DISCLAIMER
FORWARD LOOKING STATEMENTS
This presentation includes “forward looking statements” within the meaning of the “safe harbor” provisions of the United States Private Securities Litigation
Reform Act of 1995. Forward-looking statements may be identified by the use of words such as “anticipate,” “believe,” “expect,” “estimate,” “plan,” “outlook,”
and “project” and other similar expressions that predict or indicate future events or trends or that are not statements of historical matters. Such forward looking
statements with respect to revenues, earnings, financial information, performance, strategies, prospects and other aspects of the businesses of Jason
Industries, Inc. (the “Company”) are based on current expectations that are subject to risks and uncertainties. A number of factors could cause actual results
or outcomes to differ materially from those indicated by such forward looking statements.
The forward‐looking statements contained in this presentation are based on assumptions that we have made in light of our industry experience and our
perceptions of historical trends, current conditions, expected future developments and other factors we believe are appropriate under the circumstances. The
forward-looking statements are not guarantees of performance or results, as they involve risks, uncertainties (some of which are beyond our control) and
assumptions. Although we believe that these forward‐looking statements are based on reasonable assumptions, many factors could affect our actual results
and cause them to differ materially from those anticipated in the forward-looking statements.
More information on potential factors that could affect the Company’s financial condition and operating results is included in “Risk Factors” and “Management’s
Discussion and Analysis of Financial Condition and Results of Operations” in the Company’s Annual Report on Form 10-K filed on March 2, 2017,
and in the Company’s other filings with the Securities and Exchange Commission. Any forward‐looking statement made by the Company in this presentation
speaks only as of the date on which we make it. We undertake no obligation to publicly update any forward‐looking statement, whether as a result of new
information, future developments or otherwise, except as may be required by law.
NON-GAAP AND OTHER COMPANY INFORMATION
Included in this presentation are certain non-GAAP financial measures designed to complement the financial information presented in accordance with
generally accepted accounting principles in the United States of America because management believes such measures are useful to investors. Because the
Company’s calculations of these measures may differ from similar measures used by other companies, you should be careful when comparing the Company’s
non-GAAP financial measures to those of other companies. A reconciliation of non-GAAP financial measures to GAAP financial measures is included in
an appendix to this presentation.
JASON INDUSTRIES - DB LEVERAGED FINANCE CONFERENCE 2017 //// PAGE
3
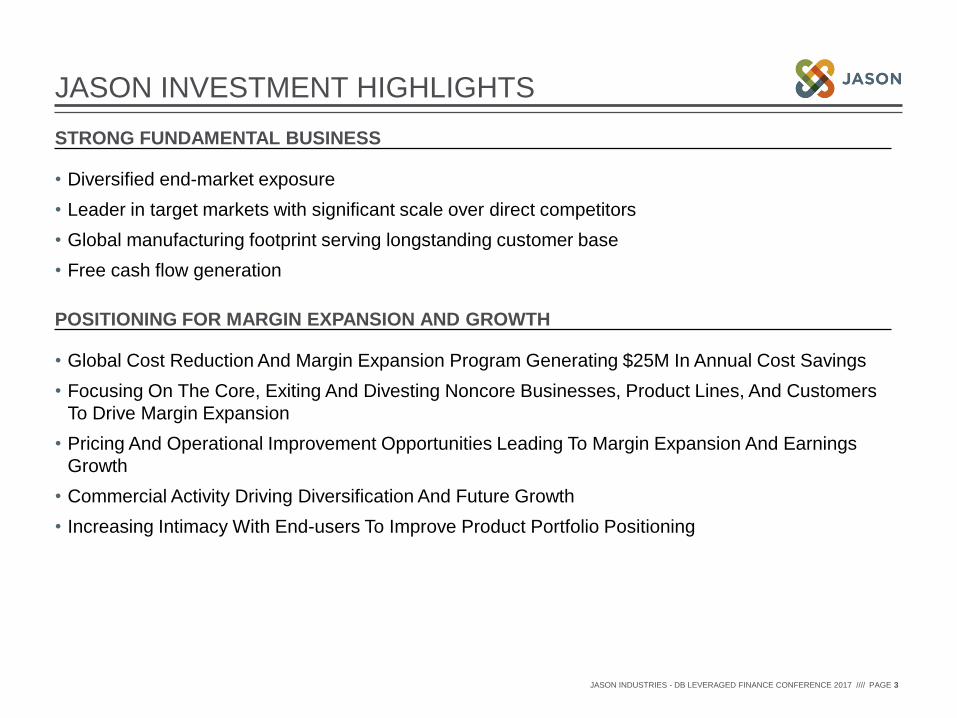
JASON INVESTMENT HIGHLIGHTS
JASON INDUSTRIES - DB LEVERAGED FINANCE CONFERENCE 2017 //// PAGE
STRONG FUNDAMENTAL BUSINESS
• Diversified end-market exposure
• Leader in target markets with significant scale over direct competitors
• Global manufacturing footprint serving longstanding customer base
• Free cash flow generation
POSITIONING FOR MARGIN EXPANSION AND GROWTH
• Global Cost Reduction And Margin Expansion Program Generating $25M In Annual Cost Savings
• Focusing On The Core, Exiting And Divesting Noncore Businesses, Product Lines, And Customers
To Drive Margin Expansion
• Pricing And Operational Improvement Opportunities Leading To Margin Expansion And Earnings
Growth
• Commercial Activity Driving Diversification And Future Growth
• Increasing Intimacy With End-users To Improve Product Portfolio Positioning
4
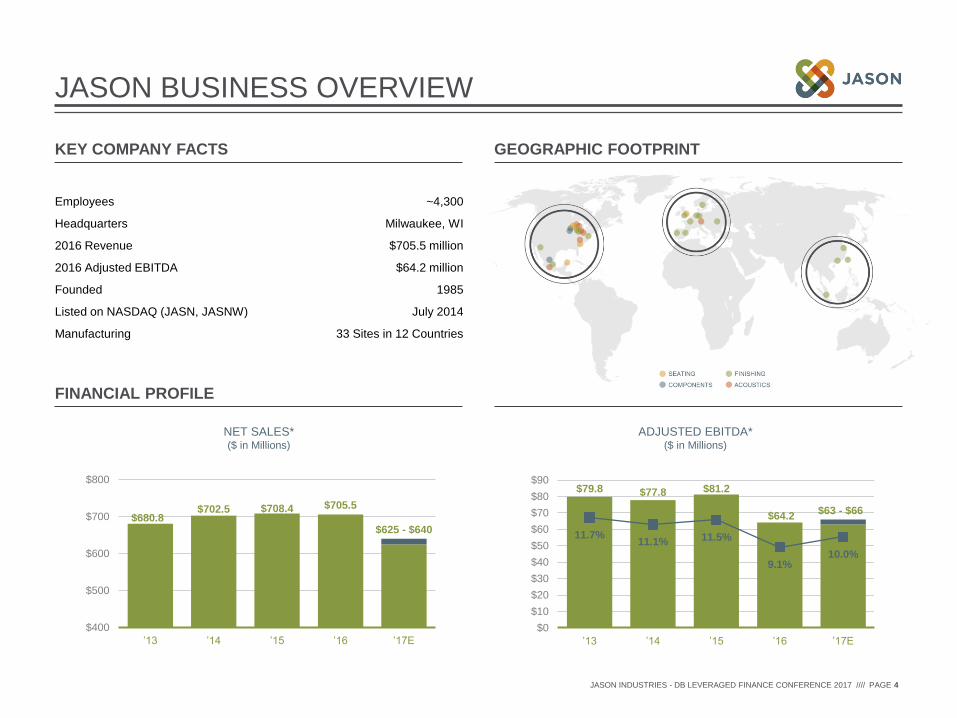
JASON BUSINESS OVERVIEW
KEY COMPANY FACTS
Employees ~4,300
Headquarters Milwaukee, WI
2016 Revenue $705.5 million
2016 Adjusted EBITDA $64.2 million
Founded 1985
Listed on NASDAQ (JASN, JASNW) July 2014
Manufacturing 33 Sites in 12 Countries
GEOGRAPHIC FOOTPRINT
FINANCIAL PROFILE
$680.8 $702.5 $708.4 $705.5
$625 - $640
$400
$500
$600
$700
$800
ʼ13 ʼ14 ʼ15 ʼ16 ʼ17E
$79.8 $77.8 $81.2
$64.2 $63 - $66
11.7%11.1% 11.5%
9.1%10.0%
$0
$10
$20
$30
$40
$50
$60
$70
$80
$90
ʼ13 ʼ14 ʼ15 ʼ16 ʼ17E
NET SALES*($ in Millions)
ADJUSTED EBITDA*($ in Millions)
JASON INDUSTRIES - DB LEVERAGED FINANCE CONFERENCE 2017 //// PAGE
5
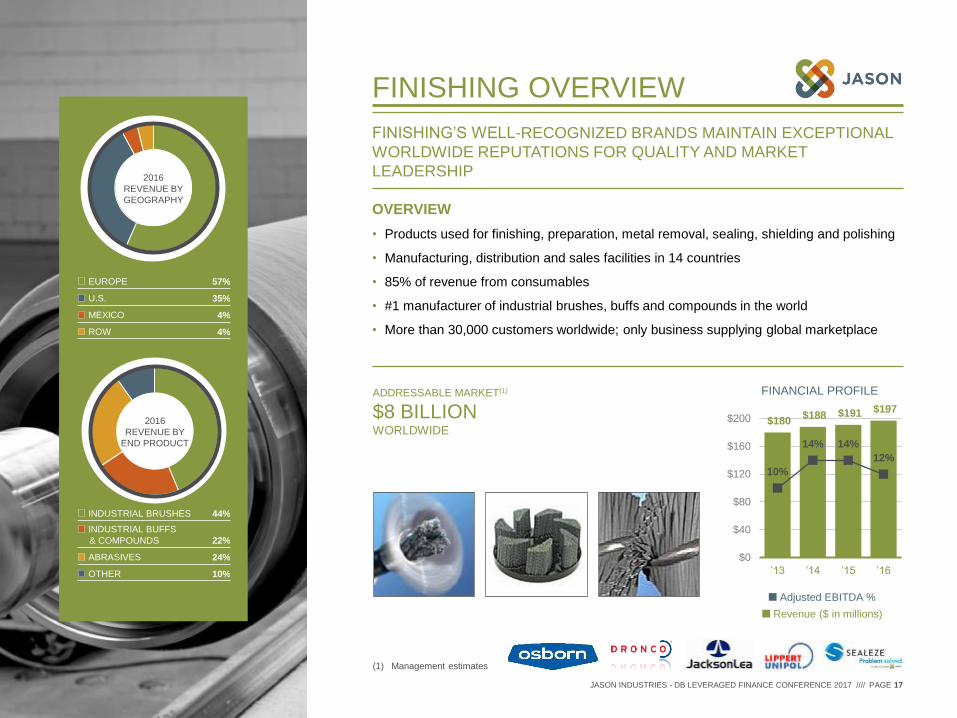
SEGMENT KEY HIGHLIGHTS BRANDS 2016 REVENUE
% OF JASON
2016 REVENUE
2016 ADJUSTED
EBITDA %
• Used for surface preparation,
cutting, finishing, polishing, and
sealing
• World’s largest producer of
industrial brushes, buffs and buffing
compounds
• Only business supplying global
marketplace
• 85% consumable, high recurring
revenue
$197M 12%
• Products used in filter products,
smart utility meters, railcars, and
other industrial equipment
• Industry-leading engineering,
coupled with customized
components and individualized
solutions
$98M 15%
SEGMENT OVERVIEW
FINISHING
JASON INDUSTRIES - DB LEVERAGED FINANCE CONFERENCE 2017 //// PAGE
28%
COMPONENTS
86%14%
6
SEGMENT KEY HIGHLIGHTS BRANDS 2016 REVENUE
% OF JASON
2016 REVENUE
2016 ADJUSTED
EBITDA %
• Leading commercial and industrial
seat manufacturer
• Designs and manufactures a broad
spectrum of seating systems for
multiple vehicle platforms, including
heavyweight motorcycles, turf care,
heavy industry, and powersports
• Differentiated patents and IP filings
$161M 10%
• North America’s largest producer of
acoustical fiber insulation
• Have product on 70% of the light
vehicle platforms in North America
• Innovative solutions provider with
brand recognition
$250M 11%
SEGMENT OVERVIEW
23%
23%
SEATING
JASON INDUSTRIES - DB LEVERAGED FINANCE CONFERENCE 2017 //// PAGE
ACOUSTICS
35%
7
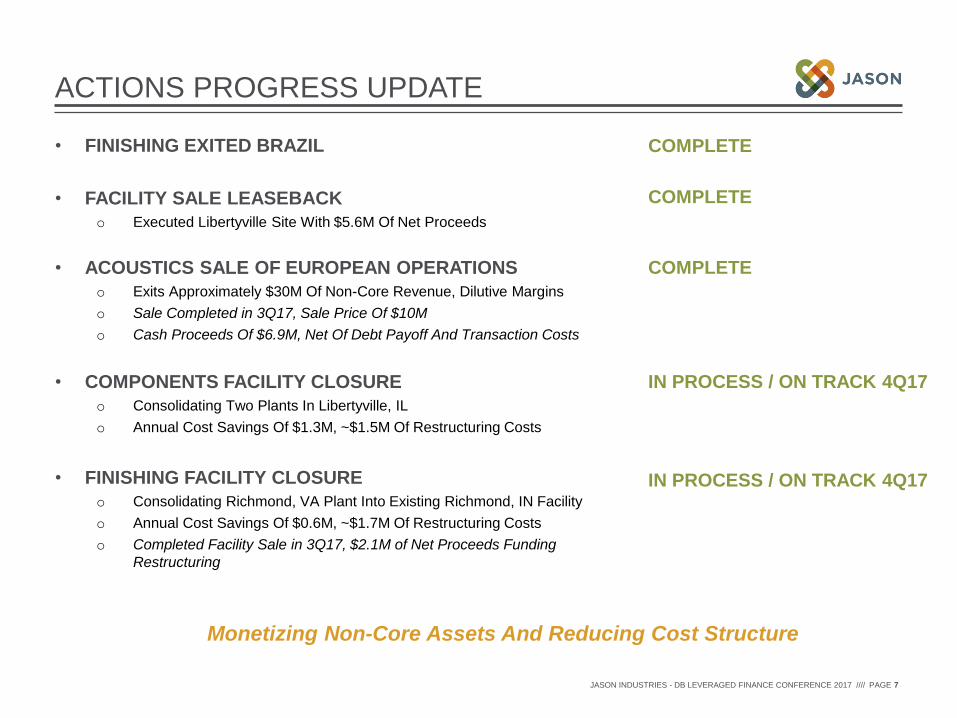
ACTIONS PROGRESS UPDATE
JASON INDUSTRIES - DB LEVERAGED FINANCE CONFERENCE 2017 //// PAGE
• FINISHING EXITED BRAZIL
• FACILITY SALE LEASEBACK
o Executed Libertyville Site With $5.6M Of Net Proceeds
• ACOUSTICS SALE OF EUROPEAN OPERATIONS
o Exits Approximately $30M Of Non-Core Revenue, Dilutive Margins
o Sale Completed in 3Q17, Sale Price Of $10M
o Cash Proceeds Of $6.9M, Net Of Debt Payoff And Transaction Costs
• COMPONENTS FACILITY CLOSURE
o Consolidating Two Plants In Libertyville, IL
o Annual Cost Savings Of $1.3M, ~$1.5M Of Restructuring Costs
• FINISHING FACILITY CLOSURE
o Consolidating Richmond, VA Plant Into Existing Richmond, IN Facility
o Annual Cost Savings Of $0.6M, ~$1.7M Of Restructuring Costs
o Completed Facility Sale in 3Q17, $2.1M of Net Proceeds Funding
Restructuring
COMPLETE
COMPLETE
IN PROCESS / ON TRACK 4Q17
COMPLETE
Monetizing Non-Core Assets And Reducing Cost Structure
IN PROCESS / ON TRACK 4Q17
8
LEAN ACTIONS
• FACILITY CLEANUPo Implementing LEAN Tools
o Freeing Up Existing Space
o Improving Manufacturing Flow
• OFFSITE FACILITY CLOSURESo Jackson, MI Warehouse (Seating)
o Burgwald, Germany Warehouse
(Finishing)
• AUTOMATION PROJECTSo Finishing Core Production Lines
o Components Flow Lines
o Acoustics Assembly Testing
JASON INDUSTRIES - DB LEVERAGED FINANCE CONFERENCE 2017 //// PAGE
9
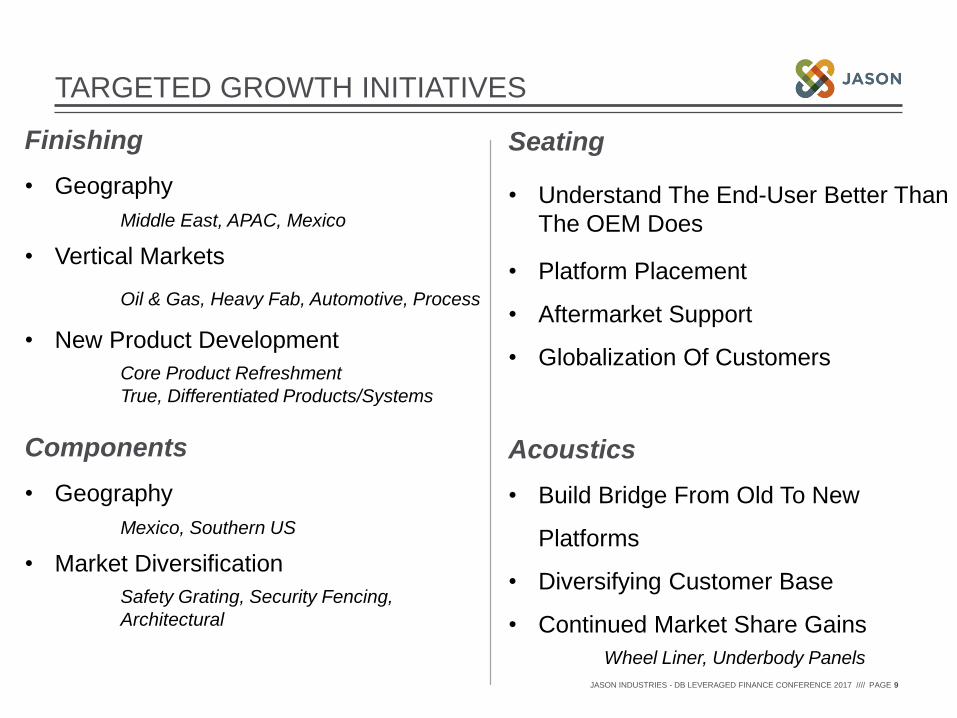
TARGETED GROWTH INITIATIVES
JASON INDUSTRIES - DB LEVERAGED FINANCE CONFERENCE 2017 //// PAGE
Finishing
• Geography
Middle East, APAC, Mexico
• Vertical Markets
Oil & Gas, Heavy Fab, Automotive, Process
• New Product Development
Core Product Refreshment
True, Differentiated Products/Systems
Seating
• Understand The End-User Better Than
The OEM Does
• Platform Placement
• Aftermarket Support
• Globalization Of Customers
Components
• Geography
Mexico, Southern US
• Market Diversification
Safety Grating, Security Fencing,
Architectural
Acoustics
• Build Bridge From Old To New
Platforms
• Diversifying Customer Base
• Continued Market Share Gains
Wheel Liner, Underbody Panels
10
FINISHING GROWTH ACTIVITY
Dronco Integration Into Osborn Geography
New Product DevelopmentVertical Markets
JASON INDUSTRIES - DB LEVERAGED FINANCE CONFERENCE 2017 //// PAGE
11
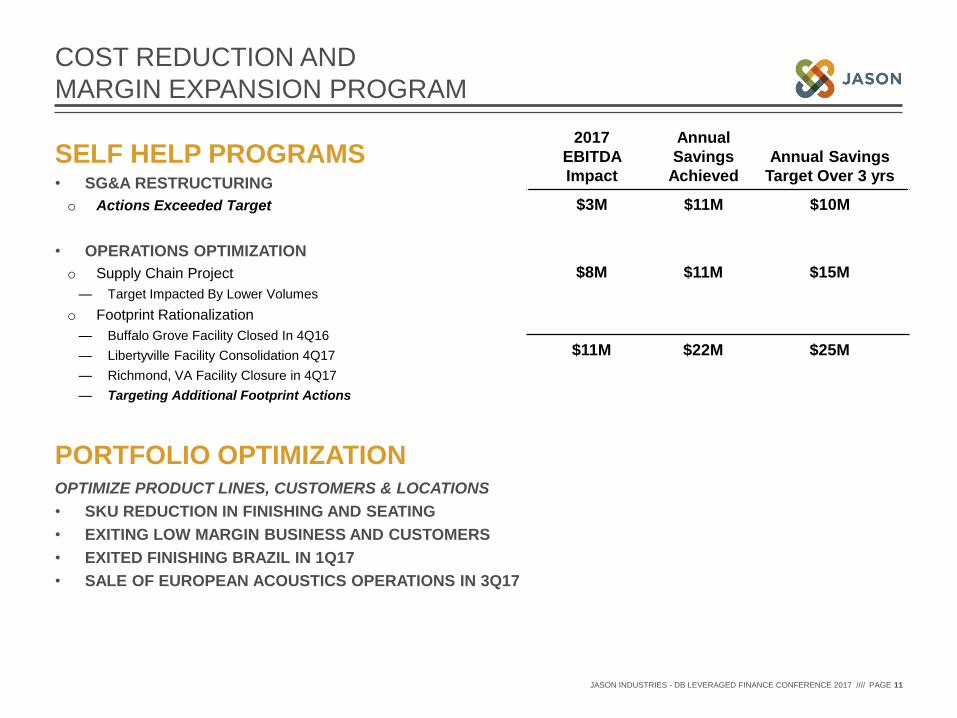
COST REDUCTION AND
MARGIN EXPANSION PROGRAM
• SG&A RESTRUCTURING
o Actions Exceeded Target
• OPERATIONS OPTIMIZATION
o Supply Chain Project
— Target Impacted By Lower Volumes
o Footprint Rationalization
— Buffalo Grove Facility Closed In 4Q16
— Libertyville Facility Consolidation 4Q17
— Richmond, VA Facility Closure in 4Q17
— Targeting Additional Footprint Actions
JASON INDUSTRIES - DB LEVERAGED FINANCE CONFERENCE 2017 //// PAGE
SELF HELP PROGRAMS2017
EBITDA
Impact
Annual
Savings
Achieved
Annual Savings
Target Over 3 yrs
$3M $11M $10M
$8M $11M $15M
OPTIMIZE PRODUCT LINES, CUSTOMERS & LOCATIONS
• SKU REDUCTION IN FINISHING AND SEATING
• EXITING LOW MARGIN BUSINESS AND CUSTOMERS
• EXITED FINISHING BRAZIL IN 1Q17
• SALE OF EUROPEAN ACOUSTICS OPERATIONS IN 3Q17
PORTFOLIO OPTIMIZATION
$11M $22M $25M
12
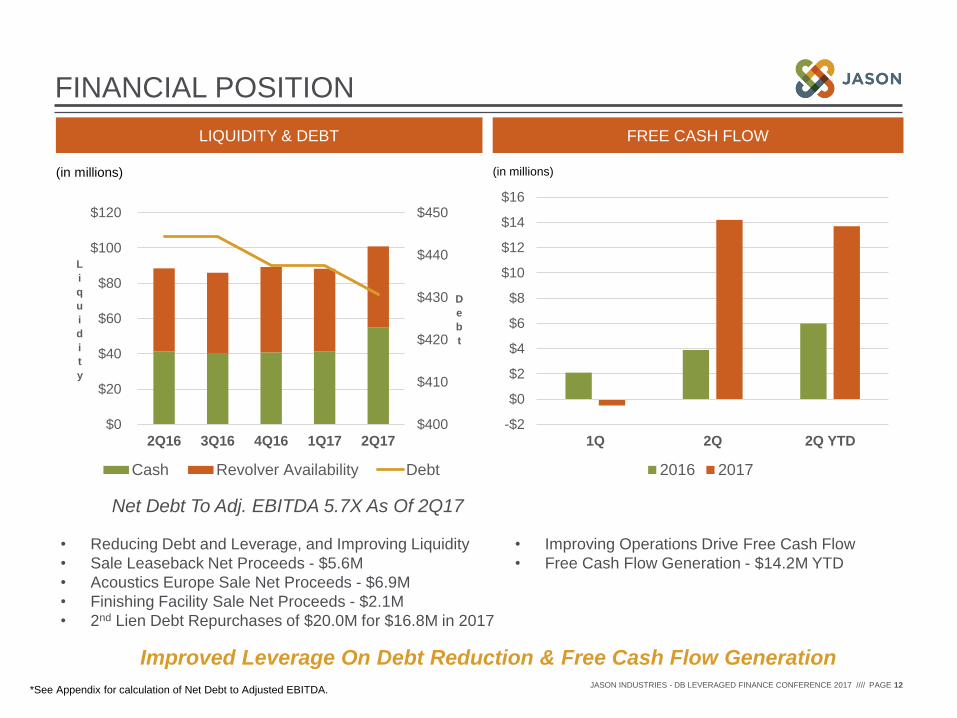
FINANCIAL POSITION
JASON INDUSTRIES - DB LEVERAGED FINANCE CONFERENCE 2017 //// PAGE
LIQUIDITY & DEBT FREE CASH FLOW
Improved Leverage On Debt Reduction & Free Cash Flow Generation
(in millions)
$400
$410
$420
$430
$440
$450
$0
$20
$40
$60
$80
$100
$120
2Q16 3Q16 4Q16 1Q17 2Q17
D
e
b
t
L
i
q
u
i
d
i
t
y
Cash Revolver Availability Debt
Net Debt To Adj. EBITDA 5.7X As Of 2Q17
*See Appendix for calculation of Net Debt to Adjusted EBITDA.
(in millions)
• Reducing Debt and Leverage, and Improving Liquidity
• Sale Leaseback Net Proceeds - $5.6M
• Acoustics Europe Sale Net Proceeds - $6.9M
• Finishing Facility Sale Net Proceeds - $2.1M
• 2nd Lien Debt Repurchases of $20.0M for $16.8M in 2017
-$2
$0
$2
$4
$6
$8
$10
$12
$14
$16
1Q 2Q 2Q YTD
2016 2017
• Improving Operations Drive Free Cash Flow
• Free Cash Flow Generation - $14.2M YTD
13
DEBT SUMMARY
JASON INDUSTRIES - DB LEVERAGED FINANCE CONFERENCE 2017 //// PAGE
DEBT STRUCTURE
Long-Term Maturities With Covenant-Lite Terms
(in millions)
$300
$102
$29
2Q17
First Lien
Term Loan
Second Lien
Term Loan
Non-U.S. Debt
2021
2022
Maturity
50% Variable
50% Fixed
Effective Interest
Rate – 7.7%
COVENANTS
• Springing First Lien Leverage Ratio
Covenant Only Applicable When
≥$10m Borrowings On U.S. Revolver
At Quarter End
• Zero Borrowings Outstanding U.S.
Revolver, Strong Liquidity With No
Expectation To Use Revolver
• First Lien Leverage Ratio of 3.89x As
Of 2Q17
• Covenant (if applicable):
• 2Q17 4.75x
• 4Q17 4.50x
*Note the consolidated First lien net leverage ratio under the Company’s senior secured credit facilities was 3.89x as of June 30, 2017, and excludes second lien term loan
borrowings from net debt. See Form 10-Q for further discussion of the Company’s senior secured credit facilities.
14
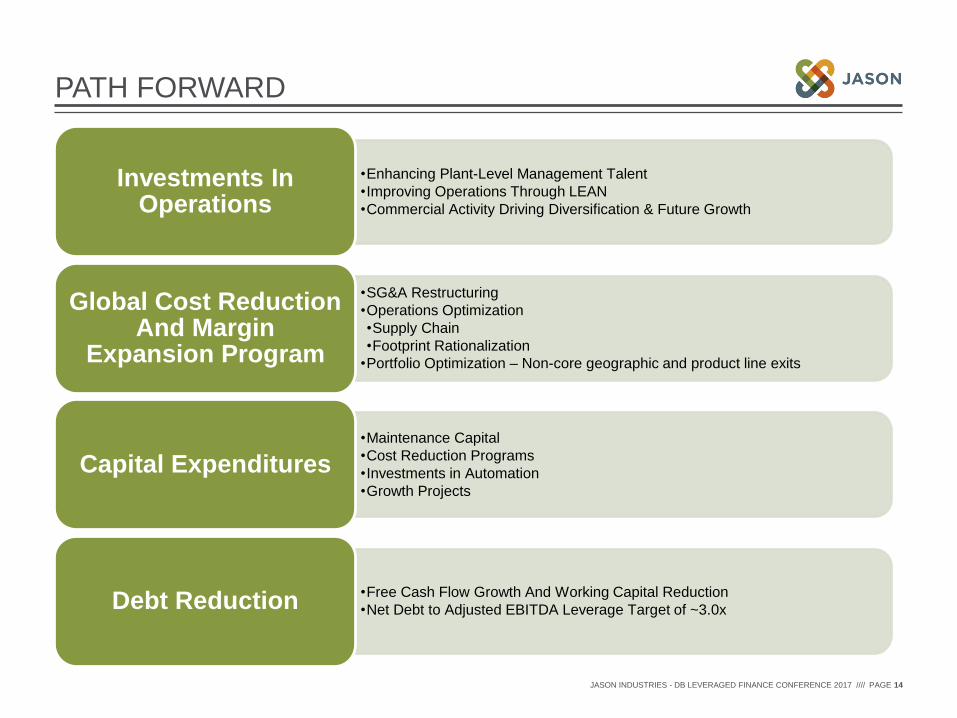
PATH FORWARD
JASON INDUSTRIES - DB LEVERAGED FINANCE CONFERENCE 2017 //// PAGE