678 SEPTEMBRE/OCTOBRE 2008, VOL. 84, N o 5 — THE FORESTRY CHRONICLE Developing a silvicultural framework and definitions for use in forest management planning and practice by F. Wayne Bell 1 , John Parton 2 , Neil Stocker 3 , Dennis Joyce 3 , Doug Reid 4 , Monique Wester 5 , Al Stinson 6 , Gordon Kayahara 7 and Bill Towill 8 ABSTRACT Lack of a management framework on which to base silviculture options has plagued the forest management planning process in Ontario. The Forest Management Planning Manual for Ontario’s Crown Forests directs that strategic silvicul- tural options be developed and identified in terms of the (i) applicable forest unit, (ii) associated assumptions, and (iii) extent to which they can be used on a forest management unit. In this paper, we describe a framework for classifying man- agement (or silviculture) intensity and propose definitions for extensive, basic, intensive, and elite intensities of silvicul- ture to support the framework’s use in planning and application. We outline how the Canadian Ecology Centre – Forestry Research Partnership, a research partnership between Tembec Inc., the Ontario Ministry of Natural Resources, and Nat- ural Resources Canada, is considering applying these in the forest management planning process. The framework and definitions can be used to develop strategic silviculture options within an active adaptive management approach. This framework should help to reduce uncertainties associated with forest development, treatment costs, response to treat- ments, and success rates provided appropriate monitoring. The framework and definitions described were specifically developed for silviculture related to reforestation of even-aged boreal forests. Key words: intensive silviculture, adaptive management, forest management RÉSUMÉ L’absence d’un cadre de référence en aménagement à partir duquel il serait possible d’établir les options sylvicoles a con- stitué une lacune du processus de planification de l’aménagement forestier en Ontario. Le Manuel de planification de la gestion forestière des forêts publiques de l’Ontario exige que des options stratégiques de sylviculture soient élaborées et identifiées en fonction (i) de l’unité forestière visée, (ii) des prémisses utilisées et (iii) de l’étendue de leur utilisation dans une unité de gestion forestière. Dans cet article, nous discutons d’un cadre de référence permettant de classifier l’intensité de la gestion (ou de la sylviculture) et proposons une définition de l’intensité extensive, primaire, intensive et élite de sylvi- culture afin d’aider à l’utilisation du cadre de référence au niveau de la planification et de son application. Nous soulignons comment le Centre écologique du Canada – Partenariat pour la recherche forestière, un partenariat de recherche regroupant Tembec Inc., le Ministère des Richesses naturelles de l’Ontario et Ressources naturelles Canada, compte utiliser ces dernières au sein du processus de planification de l’aménagement forestier. Le cadre de référence et les défini- tions peuvent être utilisés pour élaborer des options stratégiques de sylviculture lors d’une approche d’aménagement adap- tatif déjà amorcée. Ce cadre de référence devrait permettre de minimiser les incertitudes associées au développement forestier, aux coûts des traitements et aux taux de succès à condition d’assurer un suivi adéquat. Le cadre de référence et les définitions qui ont été décrits, ont été spécifiquement élaborés pour une sylviculture portant sur le reboisement des forêts boréales équiennes. Mots clés : sylviculture intensive, aménagement adaptatif, aménagement forestier 1 Applied Research and Development Branch, Ontario Forest Research Institute, Ontario Ministry of Natural Resources (OMNR), 1235 Queen Street East, Sault Ste. Marie, Ontario P6A 2E5. E-mail: [email protected]2 Science and Information Branch, Ontario Terrestrial Assessment Program, OMNR, Hwy 101 East, P.O. Bag 3020, South Porcupine, Ontario P0N 1H0. 3 Forest Management Branch, Forest Health and Silviculture Section, OMNR, 70 Foster Drive, Suite 400, Sault Ste. Marie, Ontario P6A 6V5. 4 Applied Research and Development Branch, Centre for Northern Forest Ecosystem Research, OMNR, 955 Oliver Road, Thunder Bay, Ontario P7B 5E1. 5 Science and Information Branch, Ontario Terrestrial Assessment Program, OMNR, 1235 Queen Street East, Sault Ste. Marie, Ontario P6A 2E5. 6 Forestry Research Partnership, P.O. Box 430, 6905 Highway 17 W., Mattawa, Ontario P0H 1V0. 7 Science and Information Branch, Northeast Science and Information Section, OMNR, Hwy 101 East, P.O. Bag 3020, South Porcupine, Ontario P0N 1H0. 8 Science and Information Branch, Northwest Science and Information Section, OMNR, R.R. #1, 25TH Side Road, Thunder Bay, Ontario P7C 4T9.
Transcript
678 SEPTEMBRE/OCTOBRE 2008, VOL. 84, No 5 — THE FORESTRY CHRONICLE
Developing a silvicultural framework and definitions for use in forest management planning and practice
by F. Wayne Bell1, John Parton2, Neil Stocker3, Dennis Joyce3, Doug Reid4,Monique Wester5, Al Stinson6, Gordon Kayahara7 and Bill Towill8
ABSTRACTLack of a management framework on which to base silviculture options has plagued the forest management planningprocess in Ontario. The Forest Management Planning Manual for Ontario’s Crown Forests directs that strategic silvicul-tural options be developed and identified in terms of the (i) applicable forest unit, (ii) associated assumptions, and (iii)extent to which they can be used on a forest management unit. In this paper, we describe a framework for classifying man-agement (or silviculture) intensity and propose definitions for extensive, basic, intensive, and elite intensities of silvicul-ture to support the framework’s use in planning and application. We outline how the Canadian Ecology Centre – ForestryResearch Partnership, a research partnership between Tembec Inc., the Ontario Ministry of Natural Resources, and Nat-ural Resources Canada, is considering applying these in the forest management planning process. The framework anddefinitions can be used to develop strategic silviculture options within an active adaptive management approach. Thisframework should help to reduce uncertainties associated with forest development, treatment costs, response to treat-ments, and success rates provided appropriate monitoring. The framework and definitions described were specificallydeveloped for silviculture related to reforestation of even-aged boreal forests.
RÉSUMÉL’absence d’un cadre de référence en aménagement à partir duquel il serait possible d’établir les options sylvicoles a con-stitué une lacune du processus de planification de l’aménagement forestier en Ontario. Le Manuel de planification de lagestion forestière des forêts publiques de l’Ontario exige que des options stratégiques de sylviculture soient élaborées etidentifiées en fonction (i) de l’unité forestière visée, (ii) des prémisses utilisées et (iii) de l’étendue de leur utilisation dansune unité de gestion forestière. Dans cet article, nous discutons d’un cadre de référence permettant de classifier l’intensitéde la gestion (ou de la sylviculture) et proposons une définition de l’intensité extensive, primaire, intensive et élite de sylvi-culture afin d’aider à l’utilisation du cadre de référence au niveau de la planification et de son application. Nous soulignonscomment le Centre écologique du Canada – Partenariat pour la recherche forestière, un partenariat de rechercheregroupant Tembec Inc., le Ministère des Richesses naturelles de l’Ontario et Ressources naturelles Canada, compteutiliser ces dernières au sein du processus de planification de l’aménagement forestier. Le cadre de référence et les défini-tions peuvent être utilisés pour élaborer des options stratégiques de sylviculture lors d’une approche d’aménagement adap-tatif déjà amorcée. Ce cadre de référence devrait permettre de minimiser les incertitudes associées au développementforestier, aux coûts des traitements et aux taux de succès à condition d’assurer un suivi adéquat. Le cadre de référence etles définitions qui ont été décrits, ont été spécifiquement élaborés pour une sylviculture portant sur le reboisement desforêts boréales équiennes.
Mots clés : sylviculture intensive, aménagement adaptatif, aménagement forestier
1Applied Research and Development Branch, Ontario Forest Research Institute, Ontario Ministry of Natural Resources (OMNR), 1235Queen Street East, Sault Ste. Marie, Ontario P6A 2E5. E-mail: [email protected] and Information Branch, Ontario Terrestrial Assessment Program, OMNR, Hwy 101 East, P.O. Bag 3020, South Porcupine,Ontario P0N 1H0.3Forest Management Branch, Forest Health and Silviculture Section, OMNR, 70 Foster Drive, Suite 400, Sault Ste. Marie, Ontario P6A 6V5.4Applied Research and Development Branch, Centre for Northern Forest Ecosystem Research, OMNR, 955 Oliver Road, Thunder Bay,Ontario P7B 5E1.5Science and Information Branch, Ontario Terrestrial Assessment Program, OMNR, 1235 Queen Street East, Sault Ste. Marie, Ontario P6A 2E5.6Forestry Research Partnership, P.O. Box 430, 6905 Highway 17 W., Mattawa, Ontario P0H 1V0.7Science and Information Branch, Northeast Science and Information Section, OMNR, Hwy 101 East, P.O. Bag 3020, South Porcupine,Ontario P0N 1H0.8Science and Information Branch, Northwest Science and Information Section, OMNR, R.R. #1, 25TH Side Road, Thunder Bay, OntarioP7C 4T9.
IntroductionThe degree to which intensification of silvicultural effort in themanaged forest is beneficial, required, or desired has beendebated in Ontario for the past several decades (ODLF 1967;Armson 1972, 1976, 1979; Reed and Associates 1978). Theintroduction of Ontario’s Living Legacy, a strategy for expand-ing the province’s systems of parks and protected areas by anadditional 2.4 million hectares (ha), represented a 12% reduc-tion in the area available for industrial forest management.This expansion of protected areas combined with predictedtimber supply shortfalls between 2020 and 2040 that are asso-ciated with the age class structure of the historic and existingforest estate (Armson 1972, 1976; Reed and Associates 1978)was anticipated to further reduce the availability of wood sup-ply from Crown lands by approximately 4% to 5% (OFAAB2001). To mitigate the potential social and economic effects ofthis reduction, intensive forest management (IFM) was sug-gested in the 1999 Ontario Forest Accord as a possible meansto offset wood supply losses associated with a reduction in thearea managed for timber (OMNR 1999, 2004a).
As IFM is not commonly practised in Ontario, a workshopwas convened to discuss associated knowledge gaps, researchneeds, and expectations. The 204 participants had verydiverse understanding of IFM. They thought of it as every-thing from plantation forestry (including monocultures,forests void of diversity, and tree farming) to a continuumwhere forests are composed of a mosaic of species complexesmanaged under a range of intensities designed to achieveoverall forest objectives (Bell et al. 2000). Such diverse viewswould inevitably hinder the development of IFM-related pol-icy and legislation and communications with stakeholders.An overarching framework and clear, unambiguous defini-tions for IFM and intensive silviculture were needed. In 2000,the Canadian Ecology Centre – Forestry Research Partner-ship (CEC-FRP9) required a framework and definitions torelate management activities, including silviculture, to growthand yield models used in forest management planning.
In this paper, we provide an overview of the frameworkand approach used to develop definitions that incorporateharvesting, silviculture, and protection into 5 managementintensities (i.e., natural disturbances and extensive, basic,intensive and elite silviculture) to which the acronym NEBIEis applied. We suggest that this approach can be used to reflectassumptions about forest development, treatment costs,response to treatment, and success rates resulting from appli-cation of intensity-based strategic silvicultural options andrelate our experience to date in incorporating it into Ontario’sforest management planning process. The need for monitor-ing and ongoing adaptive management to test the assump-tions inherent in this framework is also highlighted.
NEBIE Framework and DefinitionsDeveloping a framework and definitions for even-aged silvi-culture in boreal forests involved 5 steps: (1) reviewing histor-ical use of the terms, (2) reviewing factors that affect produc-tivity and yield, (3) developing a framework for categorizingmanagement practices, (4) proposing definitions for a rangeof management intensities (NEBIE) using information from(1) to (3), and (5) incorporating the NEBIE framework anddefinitions into Ontario’s forest management planningprocess.
Review of historical use of termsRather than simply developing new definitions, we thought itbest to review the historical use of IFM-related terms to deter-mine whether the intent of the definitions remained the samethrough time. A brief history of the use of the terms inOntario is provided in Bell et al. (2000, 2006). Older defini-tions are provided in Appendix A to allow the reader to fol-low the development of the definitions and judge for them-selves whether our efforts were warranted.
For over 60 years, forest managers have classified forestmanagement practices into various intensity classes (Chap-man 1950; Duerr 1960; Reed and Associates 1978; OMNR1986, 1989, 1997; Hodge et al. 1989; NRCan 1995; Dunsterand Dunster 1996; Côtè 2000; Park and Wilson 2007). Dur-ing this time, the definitions have changed somewhat but nei-ther the rationale for the definitions nor the changes weredocumented. Despite this, the basis for the definitionsremained constant. Extensive implied cut and leave to naturalregeneration without further intervention. Basic impliedcombinations of natural and/or artificial regeneration free ofinter-specific competition without further interventions.Intensive implied combinations of regeneration free of inter-and intra-specific competition. Elite or highly intensive wasessentially an extension of intensive that included pruningand site amelioration treatments. A chronology is providedfor those interested in greater detail (Appendix A).
Review of factors that affect productivity and yieldThe second step in developing a management framework andcommon set of definitions was to review the factors affectingforest productivity and yield to identify those that would becritical. The factors reviewed were: (1) site productivity, (2)time, (3) silviculture, (4) protection, and (5) harvest. Of these,only silviculture and protection are referred to in previouslypublished definitions (Appendix A).
Site productivity refers to the availability of resources(light, water, and nutrients) needed to sustain healthy tree andvegetation growth on a particular site. It involves the complexinteraction of physical, chemical, and biological conditionsand processes: physical conditions include soil moisture, tex-ture, and temperature; chemical conditions include soil pH,amount and availability of carbon, nitrogen and other essen-tial nutrients; and biological conditions include the existingplant community, soil micro-organisms, and fauna (e.g.,insects, worms) responsible for biological processes includingdecomposition and mineralization (NRCan 2007). Some ofthese conditions and processes can be altered by managementpractices and, where successful, improve yield of desired for-est products (or services).
9The CEC-FRP is a partnership between Tembec Inc., the OntarioMinistry of Natural Resources (MNR), Natural Resources Canada(NRCan) and the Canadian Ecology Centre (Bruemmer et al.2008, thi sissue). Its mission is to identify, develop and implementecologically sustainable and scientifically defensible leading edgeforestry practices required to maintain and enhance an economi-cally viable supply of quality fibre to Tembec mills, and to the com-munities those mills support, over the long term. (CEC-FRP 2000).
680 SEPTEMBRE/OCTOBRE 2008, VOL. 84, No 5 — THE FORESTRY CHRONICLE
When managing forests for fibre production, time is a crit-ical factor. Three time-related factors are of particular impor-tance: regeneration lag, rotation age, and when silviculturalpractices are applied. Every additional year added at theregeneration phase is assumed to lengthen the rotation by ayear. In practice, the longer it takes for a tree to establish andbecome free of inter-specific competition, the longer it willtake for it to produce a commercial wood product and pro-vide economic returns but the effect is not 1:1. In Ontario,rotations in forest management plans typically exceed 70years; with proper timing of silvicultural practices, however,rotations of 35 to 45 years are possible.
Silviculture can be defined in many ways. Here we define itas the theory and practice of managing the species/genotypecomposition of forest stands and the site resources through allphases of stand development to meet management objectives.
Most of Ontario’s tree species yield relatively low woodvolumes (Bonnor and Nietmann 1987), which affects eco-nomic returns on investments in silviculture. Markets change,however, and trees must survive long periods through sea-sonal changes in temperature and precipitation and rare orinfrequent events such as extreme weather, insect infestations,or severe fires (Fernum et al. 1983, Smith et al. 1997). Thus, itis important to maintain a breeding population with a broadgenetic base at the forest level. Species choices are essentiallyselection of genetic material on a coarse scale. Within-speciesselections can be used to improve traits such as faster growth,stem quality characteristics, winter hardiness, disease resist-ance, wood density, and/or product uniformity (OMNR 1997,1998a, b; Joyce et al. 2001; McInnes and Tosh 2004).
Stand composition (i.e., both species and genotypemakeup of a stand) is influenced by the chosen silviculturesystem and associated management practices (Matthews1989, Smith et al. 1997). Poor judgement in selecting andimplementing either the silviculture system or managementpractices can reduce the economic value of future stands(Smith et al. 1997). Artificial regeneration provides the great-est likelihood that the composition of a stand at maturity canbe predicted. It also allows the establishment of single- ormultiple-species plantations. Release, cleaning, and thinningactivities can be extremely selective, when used in combina-tion, and can be adjusted to remove species or low-gradestems at whatever level is considered desirable. In effect, thin-ning is a form of mass selection (OMNR 1998b).
How a tree species responds to management practices is afunction of all the adaptive mechanisms it has evolved (e.g.,regeneration strategies and physiological traits) to respond tonatural disturbances (Grime 1977, Sims et al. 1990). Silvicul-ture can be used to emulate such disturbances and to improvetree growth by controlling the availability of site resources. Toeffectively manage site resources, forest managers requireknowledge of species’ autecology, particularly shade tolerancethresholds (Bell et al. 1998).
Silvicultural treatments used in Ontario and their generalintent are described briefly below in the context of potentialeffects on productivity and yields:1. Site preparation is used to direct resources towards specific
trees within a stand. The effect of site preparation (e.g.,prescribed fire or mechanical treatments) on forest pro-ductivity and yield can be complex. For example, fire
removes surface organic matter, releases mineral nutrients,increases soil temperature, exposes mineral soil, and stim-ulates the production of nitrogen, but typically does notremove large organic debris (Fernum et al. 1983, Matthews1989, McRae et al. 2001). Mechanical site preparation canbe used to facilitate planting or natural regeneration byexposing or disturbing moderate amounts of mineral soil(Sutherland and Foreman 1995, OMNR 1997). However, itcan negatively affect a site by causing rutting and com-paction, exposing excessive amounts of mineral soil, andmaking substantial area inoperable when slash is piled.
2. Natural and/or artificial regeneration can be used to estab-lish a new stand, and the method used influences siteoccupancy. Too few of a desired tree species reduces siteoccupancy, and too many can reduce growth rate and/orcause undesirable stem quality. Natural regeneration (i.e.,the establishment of a tree crop by natural seeding, sprout-ing, suckering, or layering) generally produces clumpedregeneration. Artificial regeneration permits even distri-bution of trees across a site reducing gaps and voids (Andi-son and Callaghan 1988, Bell et al. 1990).
3. Release and cleaning operations in a young stand reduce,eliminate, or suppress undesirable competing vegetation,increasing the availability of resources and improvinggrowing conditions (Walstad and Kuch 1987, Brand 1991).Maximum benefits occur when treatments are appliedbefore competing vegetation impedes growth of desiredcrop trees (Pitt et al. 1999, Wagner et al. 2006).
4. Precommercial and commercial thinning reduce stemdensity increasing availability of resources for the mostdesirable trees (OMNR 1997). These treatments can beregarded as tools to increase the value of the residual stems(Fernum et al. 1983). In overstocked stands, thinning isrecommended to reduce competition and direct siteresources towards producing fewer larger stems. Thinningin the winter and leaving felled trees on site ensures thatnutrients in the needles and small branches are recycledback into the soil (Burger 2002).
5. Pruning live branches redirects resources within individualstems, increasing log quality and opportunities for produc-ing high value products (Zhang and Gingras 1998). Prun-ing can be used to control disease (e.g., white pine blisterrust [Cronartium ribicola]) by preventing the spread ofcankers, changing the microclimate, and reducing the sur-face area where the infection occurs (Hodge et al. 1989).
6. On sites where simply allocating existing resources isinsufficient to achieve desired objectives, treatments thatameliorate site conditions may need to be considered. Siteproductivity can be increased through fertilization (Meyeret al. 1997), drainage, and irrigation.Hawley (1947) states the role of protection in forest man-
agement as follows: Protection is in reality just one phase ofcrop tending but one which must constantly be kept in mind. Infact, often times the details of successful silvicultural practice fora given species are determined by the protection factor. Hawleyand others (Gross et al. 1992) have long recognized that treespecies vary in their susceptibility and vulnerability to fire,mammalian herbivory (browse), insects, disease, and severeweather as a factor of climate change (together referred to asFhIDS factors), and anthropogenic disturbances.
Forest managers need to model the frequency and inten-sity of natural disturbances because they affect subsequentregeneration (Matthews 1989, OMNR 2002a). Frequent,moderate disturbances affect forest structure and growthrates and favour shade-intolerant tree species while infre-quent disturbances favour shade-tolerant species (Waringand Schlesinger 1985). Information about disturbances canbe used to direct forest protection activities and reduce lossesthrough careful analysis of risk and the development of ade-quate protection strategies (Hodge et al. 1989, De Groot et al.2005). Forest managers cannot completely eliminate or pre-dict all of the risks associated with forest management (e.g.,climate change, invasive species). Unless protection strategiesare extended to all forests, fire and pest outbreaks will spreadfrom less valuable stands to those deemed worthy of protec-tion (Smith et al. 1997).
Harvesting is the simplest form of silviculture, and har-vesting practices can affect subsequent forest productivity andyield in several ways. Harvesting creates growing space fornew trees, determines the quantity and quality of seed trees,and can be used to preferentially select trees that exhibitgenetically superior traits for retention. Felling and skiddingcan lead to physical damage of residual trees resulting in adecline in bole quality and subsequent loss of value. Harvest-ing practices that leave some downed woody material supportthe maintenance of biodiversity by providing habitat andstructure for many plant and animal species, prevent soil ero-sion, and store carbon (Stevens 1997). Light screefing thatoccurs when harvested trees are dragged across a site canincrease soil aeration and microbial activity in the organiclayer, thereby releasing nutrients. However, compaction canreduce macroporosity, gas transfer potential, and microbialactivity, alter moisture regime, and increase resistance to rootpenetration, all of which negatively affect tree growth (Morris2001). Proper planning of harvesting practices (e.g., harvestblock layout, equipment selection, and timing) can substan-tially reduce potentially negative effects.
Developing a framework for categorizing forest managementpractices If it were possible to monitor the development of all standswithin a forest, a classification system would not be necessarysince the development and yield of each stand could be mod-elled. However forest managers in Ontario rely on a far lessintensive monitoring program. Prior to the development ofthe NEBIE framework and subsequent intensity-based yieldcurves (Penner et al. 2008, this issue; Sharma et al 2008, thisissue), forest growth and development was modelled usingnormal yield tables (Plonski 1981), which were developed innatural stands (see Penner et al. 2008, this issue; Sharma et al.2008, this issue) and thus may not have reflected the effects ofsilviculture on yield. In Ontario, extensive, basic, and inten-sive yield curves are used within a strategic forest manage-ment model (SFMM; Davis 1999) as a discrete or categoricalvariable when assigning yield curves. All areas of the produc-tive forest landbase within each forest unit10 are assigned a
planned silviculture intensity prior to model runs. Thisassignment of silviculture intensity, and choice of the associ-ated yield curve, is thus critical to wood supply calculations.In addition, the categories help to track stands with and with-out investment and are therefore useful for economic analy-ses. To ensure that stands are accurately assigned to yieldcurves, clear concise definitions are needed for the associatedsilviculture intensities.
As recommended by participants of the IFM scienceworkshop (Bell et al. 2000), application of these definitionswould be most efficient with a common intensity-basedframework for forest management planning and practice. Wepropose adopting a modified version of a framework pub-lished by Burger (2002) that includes objectives and specificmetrics associated with forest protection, harvesting, and sil-viculture practices (Fig. 1). In developing the framework, weassumed that forest managers will continue to increase invest-ments in harvest, silviculture, and protection simultaneouslyas documented in Armson (2001).
Once the objectives and metrics were agreed on, a frame-work was developed (Table 1), appropriate practices selected(Table 2), and the definitions were revised.
NEBIE definitions Our objective in developing new definitions was to ensurethey were intent-based, as free from ambiguity as possible,broad enough to include a range of practices, applicable toboth afforestation and reforestation, and focused on boreal,even-aged silviculture. They are:
Silvicultural intensity: The degree to which the factorsinfluencing growth and yield are manipulated. One of fourclasses (extensive, basic, intensive, and elite) representingincreasing silvicultural effort expended to increase the yield andvalue of forest stands.
Natural disturbance: Intervention applied following fire,insect, disease, or severe weather events. Regeneration andstand development are determined by the incidence, type, andintensity of the natural disturbance and the availability of plantpropagules, and by the composition of the residual stand.
Extensive silviculture: Intervention characterized by selec-tion of harvesting method and scarification. Species composi-tion of the recruitment cohort, stand development, and standdynamics are determined by plant propagules present naturallyand micro-sites created during harvesting or by scarification orby the residual stand characteristics. Stand dynamics and devel-opment are similar to natural disturbance.
Basic silviculture: Intervention intended to shorten therotation length/cutting cycle by: increasing residual stand qual-ity; ensuring the availability of suitable micro-sites for propag-ule establishment; influencing species composition of therecruitment cohort; and reducing inter-specific competitionretarding the development of the recruitment cohort.
Intensive silviculture: Intervention intended to control thequality and quantity of fibre grown on a given site and to meeta specific short rotation length/cutting cycle target by tightlycontrolling species composition and quality of residual stemswhile closely managing both inter- and intra-specific competi-tion during all stand development phases.
Elite silviculture: Intervention intended to maximize thequality and quantity of fibre grown on a given site and to meeta specific short rotation length/cutting cycle target by extendingintensive silvicultural intervention options to include site ame-
10A classification system that aggregates forest stands for manage-ment purposes that will normally have similar species composi-tion, will develop in a similar manner (both naturally and inresponse to silvicultural treatments), and will be managed underthe same silvicultural system (OMNR 2004b).
682 SEPTEMBRE/OCTOBRE 2008, VOL. 84, No 5 — THE FORESTRY CHRONICLE
Fig. 1. Range of managed systems and the degree of manipulation of factors influencing for-est productivity (Adapted from Burger 2002). The level of control of specific factors isdenoted by a scale from none to high.
Table 1. Preliminary framework used to develop intensity-based forest management definitions and renewal standards
IntensityExtensive Basic Intensive Elite
Objectives
Management Acceptable species and Preferred species composition and volumeobjective composition, fixed(at age to volume and threshold Medium value, some High value Maximize wood valueoperability/ quality requirements quality improvementcutting cycle) Specific wood products, volumes and qualities expected
Biodiversity basis for Stand level Landscape (within limits of silviculture requirements)consideration
Age to operability/ ≈ the same <80% <60% <50%cutting cycle (considerable variability
tolerated) …of the “natural” rotation age
Stand yield (product Low confidence Moderate confidence High confidence quantity and quality)predictability (atplanning):
Harvest scheduling Low flexibility High flexibility (to maximize return on investment andoptions (area-based drivers) capitalize on current market values) (multiple entries
(single-pass harvest) possible, even desirable)
Silviculture – species, quality, and genetic selection
Species Preferred and acceptable tree species Preferred tree species
Quality AGS:UGSa ratio increases with intensity
Genotype (genetic Maintained (high-grading Remains same or Uniformly high Highestb
quality at stand level) not tolerated) is improved
Silviculture – resource management/amelioration
Regeneration delay <10 yearsd <7 yearsd <3 years <2 yearstolerancec
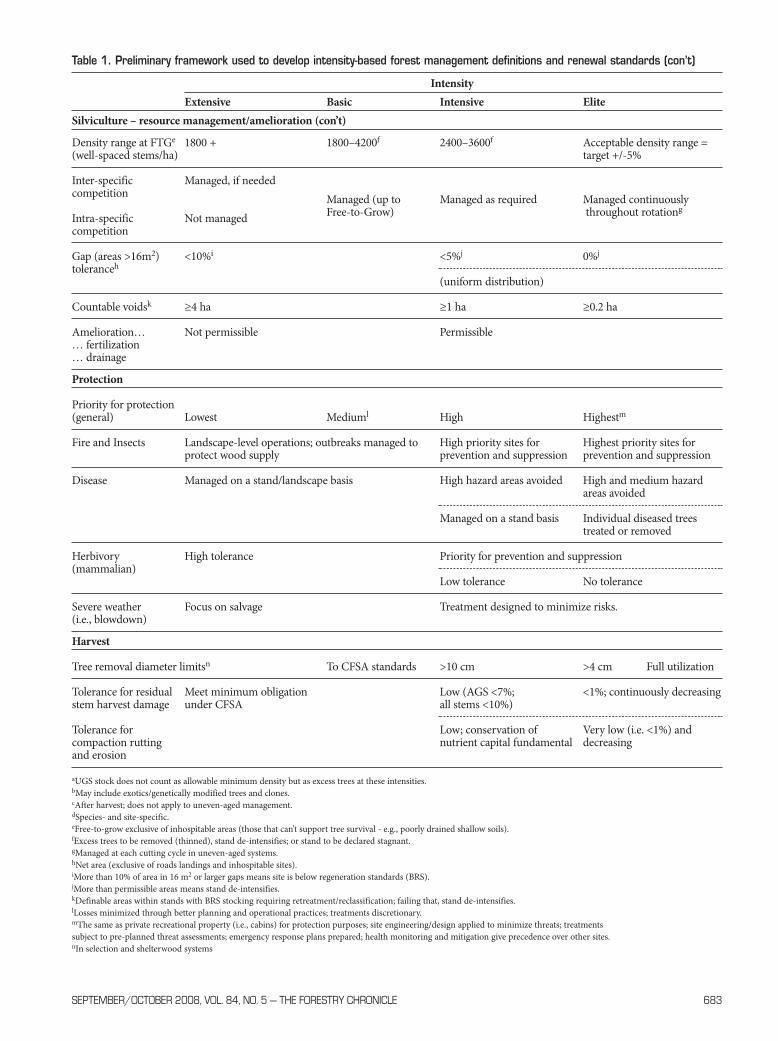
Table 1. Preliminary framework used to develop intensity-based forest management definitions and renewal standards (con’t)
Density range at FTGe 1800 + 1800–4200f 2400–3600f Acceptable density range =(well-spaced stems/ha) target +/-5%
Inter-specific Managed, if neededcompetition Managed (up to Managed as required Managed continuouslyIntra-specific Not managed Free-to-Grow) throughout rotationg
competition
Gap (areas >16m2) <10%i <5%j 0%j
toleranceh
(uniform distribution)
Countable voidsk ≥4 ha ≥1 ha ≥0.2 ha
Amelioration… Not permissible Permissible… fertilization… drainage
Protection
Priority for protection (general) Lowest Mediuml High Highestm
Fire and Insects Landscape-level operations; outbreaks managed to High priority sites for Highest priority sites forprotect wood supply prevention and suppression prevention and suppression
Disease Managed on a stand/landscape basis High hazard areas avoided High and medium hazardareas avoided
Managed on a stand basis Individual diseased treestreated or removed
Herbivory High tolerance Priority for prevention and suppression(mammalian)
Low tolerance No tolerance
Severe weather Focus on salvage Treatment designed to minimize risks.(i.e., blowdown)
Harvest
Tree removal diameter limitsn To CFSA standards >10 cm >4 cm Full utilization
Tolerance for residual Meet minimum obligation Low (AGS <7%; <1%; continuously decreasingstem harvest damage under CFSA all stems <10%)
Tolerance for Low; conservation of Very low (i.e. <1%) andcompaction rutting nutrient capital fundamental decreasingand erosion
aUGS stock does not count as allowable minimum density but as excess trees at these intensities.bMay include exotics/genetically modified trees and clones.cAfter harvest; does not apply to uneven-aged management.dSpecies- and site-specific. eFree-to-grow exclusive of inhospitable areas (those that can’t support tree survival - e.g., poorly drained shallow soils). fExcess trees to be removed (thinned), stand de-intensifies; or stand to be declared stagnant. gManaged at each cutting cycle in uneven-aged systems.hNet area (exclusive of roads landings and inhospitable sites).iMore than 10% of area in 16 m2 or larger gaps means site is below regeneration standards (BRS).jMore than permissible areas means stand de-intensifies.kDefinable areas within stands with BRS stocking requiring retreatment/reclassification; failing that, stand de-intensifies.lLosses minimized through better planning and operational practices; treatments discretionary.mThe same as private recreational property (i.e., cabins) for protection purposes; site engineering/design applied to minimize threats; treatments subject to pre-planned threat assessments; emergency response plans prepared; health monitoring and mitigation give precedence over other sites.nIn selection and shelterwood systems
684 SEPTEMBRE/OCTOBRE 2008, VOL. 84, No 5 — THE FORESTRY CHRONICLE
lioration (fertilization and/or drainage) and enhance stemquality through pruning.
Dividing plantations into basic, intensive, and elite cate-gories is somewhat unique to Ontario. In other parts of theworld (e.g., Finland, Sweden, New Zealand, southernUnited States) forest managers use the term “intensive” todescribe most if not all planted forests (e.g., Florence 1996).They probably practice intensive silviculture for several rea-sons. Land value is high in these jurisdictions and forestrymay be economically viable only when it can comparefavourably against all other economic uses for the landbase.In these areas, planted forests are located on private landsand mostly rely on highly intensive afforestation practices,including high initial planting densities, use of geneticallyimproved stock, multiple release treatments, commercialthinnings, fertilization, and pruning. This level of manage-ment intensity is in sharp contrast to practices used inOntario’s Area of the Undertaking where the most intensepractices, such as planting of exotic species and geneticallymodified organisms, and site amelioration treatments, suchas fertilization and drainage, are not permitted “unless theybecome regulated“ under the Crown Forest SustainabilityAct (Statutes of Ontario 1995). In much of Ontario, eco-nomic uses for the landbase as alternatives to forestry areseverely restricted due to a relatively harsh climate, low siteproductivity, and limited access. The varied distances tomarkets and extremely varied alternative land use poten-tials, however, broaden the range of possible forest manage-ment intensities, depending on location.
Although the definitions were developed for shorter rota-tion, even-aged boreal silviculture they may have broaderapplication. Intensive and elite practices are generally appliedto shorten rotations, as implied in the new definitions; how-ever, intensive practices can also be used to meet a range ofobjectives, both in the short and long term, by influencing the
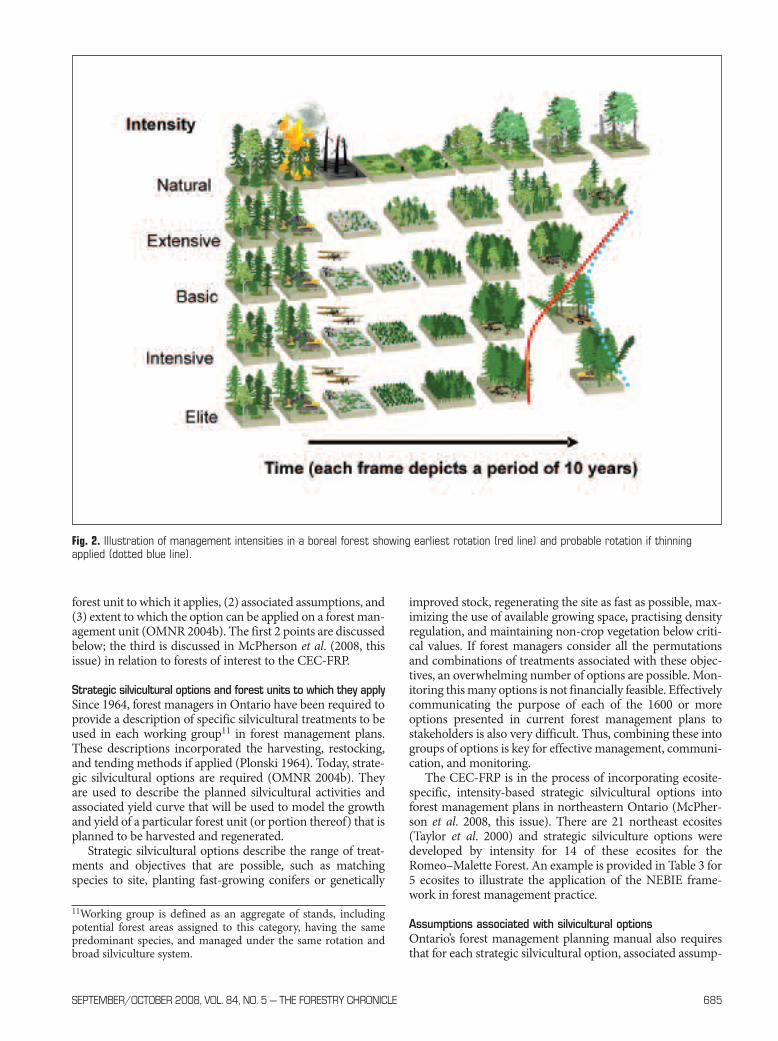
desired composition, structure, and ecological characteristicsof the future forest (Florence 1996). Since it is impossible todevelop definitions that capture all possible uses of intensivepractices, we chose to base the NEBIE definitions on the timeof first possible commercial harvest as illustrated in Fig. 2.
Applying the definitions to afforestation seems reasonable.Abandoned farm fields can become forested through ingressof seed from adjacent stands or they can be scarified toencourage ingress (extensive) or planted, weeded, thinned,pruned, and fertilized (elite).
Applying the definitions to uneven-aged silviculture alsoseems reasonable. The Allegheny Section of the Society ofAmerican Foresters first proposed intensity-based definitionsfor uneven-aged stands in 1950 (Chapman 1950) (see Appen-dix A for details) and Florence (1996) uses the terms “exten-sive” and “intensive” to describe silviculture methods in selec-tion-type harvesting in eucalypt forests. Thus, precedentexists to apply intensity-based terms and their intent inuneven-aged silviculture.
Incorporating NEBIE Framework and Definitions intoOntario’s Forest Management Planning ProcessAs described above, the NEBIE concept is not new to forestmanagers in Ontario (OMNR 1986, 1989, 1997; Bell et al.2000). What is new is that a common understanding of theimplied terms has been reached through a systematic process.The changes to the definitions, although subtle, will haveimplications for forest management planning. In Ontario, for-est management planning requires the identification of strate-gic silvicultural options. These options are groups of silvicul-tural treatments and objectives that exhibit similarcharacteristics including initial forest unit, silvicultural inten-sity, expenditures, and growth projections. The Forest Man-agement Planning Manual for Ontario’s Crown Forestsdirects that each strategic silvicultural option identify: (1) the
Table 2. NEBIE treatments (includes high-grading for reference only) in clearcut system
aMinimize presence of trees with high probability of contributing to disease in future crops.
forest unit to which it applies, (2) associated assumptions, and(3) extent to which the option can be applied on a forest man-agement unit (OMNR 2004b). The first 2 points are discussedbelow; the third is discussed in McPherson et al. (2008, thisissue) in relation to forests of interest to the CEC-FRP.
Strategic silvicultural options and forest units to which they applySince 1964, forest managers in Ontario have been required toprovide a description of specific silvicultural treatments to beused in each working group11 in forest management plans.These descriptions incorporated the harvesting, restocking,and tending methods if applied (Plonski 1964). Today, strate-gic silvicultural options are required (OMNR 2004b). Theyare used to describe the planned silvicultural activities andassociated yield curve that will be used to model the growthand yield of a particular forest unit (or portion thereof) that isplanned to be harvested and regenerated.
Strategic silvicultural options describe the range of treat-ments and objectives that are possible, such as matchingspecies to site, planting fast-growing conifers or genetically
improved stock, regenerating the site as fast as possible, max-imizing the use of available growing space, practising densityregulation, and maintaining non-crop vegetation below criti-cal values. If forest managers consider all the permutationsand combinations of treatments associated with these objec-tives, an overwhelming number of options are possible. Mon-itoring this many options is not financially feasible. Effectivelycommunicating the purpose of each of the 1600 or moreoptions presented in current forest management plans tostakeholders is also very difficult. Thus, combining these intogroups of options is key for effective management, communi-cation, and monitoring.
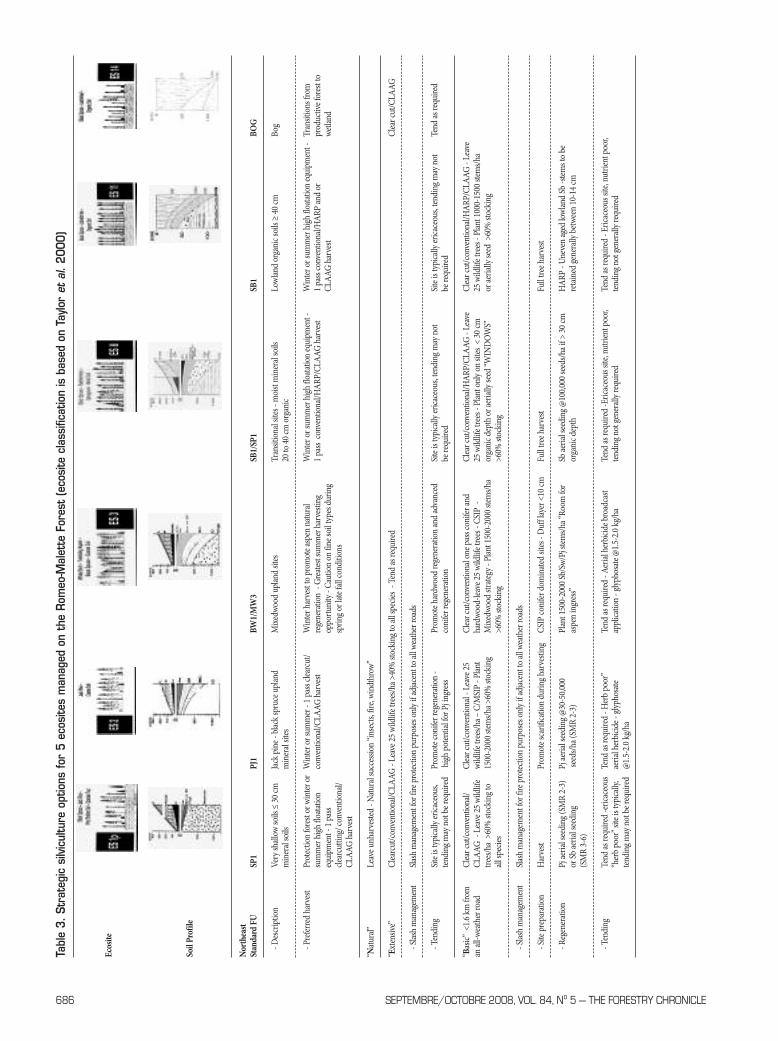
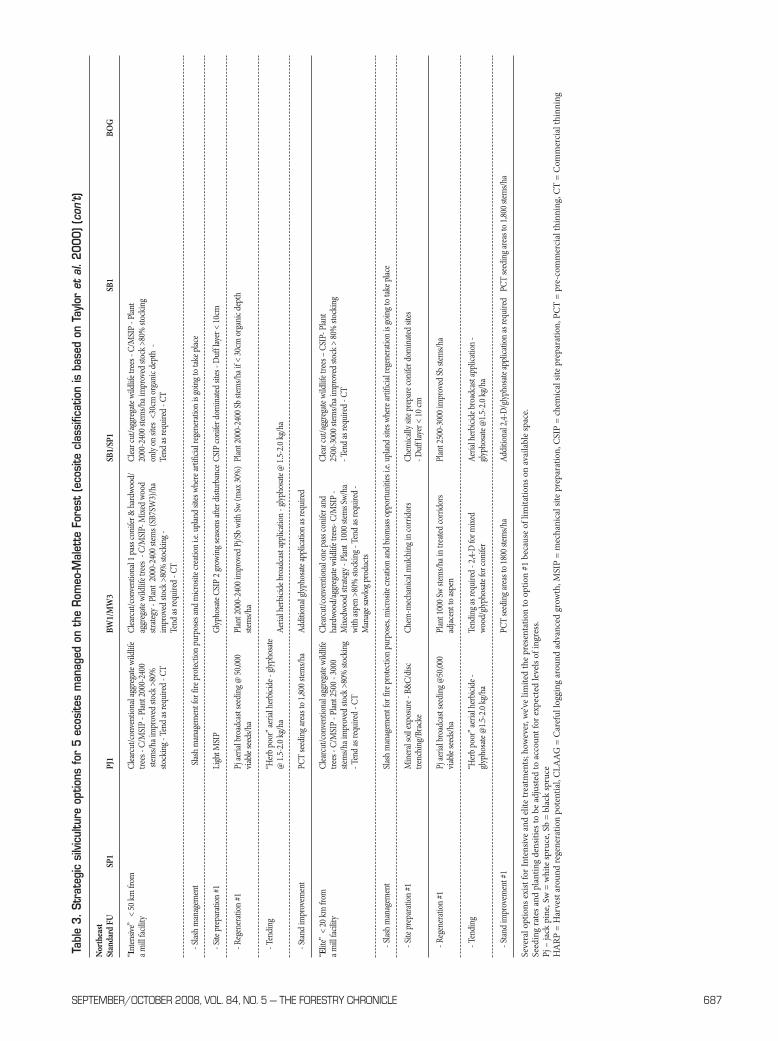
The CEC-FRP is in the process of incorporating ecosite-specific, intensity-based strategic silvicultural options intoforest management plans in northeastern Ontario (McPher-son et al. 2008, this issue). There are 21 northeast ecosites(Taylor et al. 2000) and strategic silviculture options weredeveloped by intensity for 14 of these ecosites for theRomeo–Malette Forest. An example is provided in Table 3 for5 ecosites to illustrate the application of the NEBIE frame-work in forest management practice.
Assumptions associated with silvicultural optionsOntario’s forest management planning manual also requiresthat for each strategic silvicultural option, associated assump-
Fig. 2. Illustration of management intensities in a boreal forest showing earliest rotation (red line) and probable rotation if thinningapplied (dotted blue line).
11Working group is defined as an aggregate of stands, includingpotential forest areas assigned to this category, having the samepredominant species, and managed under the same rotation andbroad silviculture system.
688 SEPTEMBRE/OCTOBRE 2008, VOL. 84, No 5 — THE FORESTRY CHRONICLE
tions about (i) forest development, (ii) treatment costs, (iii)response to treatments, and (iv) expected success rates areclearly stated (OMNR 2004b).
Forest developmentAssumptions about forest development are expressed interms of growth and yield curves (see Penner et al. 2008, thisissue). Silvicultural effort that is successful in establishingfully stocked single- or mixed-species stands has the potentialto produce merchantable volume sooner, and possibly evenincrease merchantable yield of desired species (Fig. 3).
In Ontario, forest growth and yield is modelled usingSFMM, which uses yield curves that describe changes in mer-chantable volume with age. Growth and yield models are gen-erally sensitive to site productivity, species, managementintensity, and utilization standards. As a result, the CEC-FRPsponsored the development of new stand- and tree-levelgrowth and yield models that encompass these factors (Pen-ner et al. 2008, this issue; Sharma et al. 2008, this issue). Thoselabelled with higher levels of management (or silviculture)intensity rise to their maximum merchantable yield sooner,and tend to achieve higher maximum yield. Site quality (asmeasured by site index12) is a key determinant of shape forthese curves, but because SFMM is an aspatial model, a singleaverage site index is generally used for all intensities within agiven forest unit across a management unit. We draw upon anexample from the Crossroute Forest (~1.6 million ha innorthwestern Ontario) (Fig. 4). Although not one of the 6CEC-FRP forests, the example is applicable. For the jack pinepure forest unit all modelled intensities use a site index of 16.5m. To allow more site-specific calculations, research is under-way to develop growth intercept models that will help toassign young plantations to actual rather than average siteindices (Sharma et al. 2008, this issue).
It is recognized that not all silvicultural interventions willachieve the intended result. Based on data (where available)
and/or the opinions of the planning team members and theiradvisors, the frequency with which a particular yieldcurve/forest unit combination will be achieved is included inthe model. For example, where a particular silvicultural treat-ment is designed to achieve the basic curve for a jack pine-dominated forest unit, the model can be modified to reflectthe anticipated results: the planning team can assign 70% ofthe area treated to the basic curve, 10% to an intensive curve,and the remaining 20% to a mixedwood extensive curvewithin SFMM. This approach allows generic yield curves tobe used that reflect the anticipated impact of the strategic sil-viculture options described in forest management plans.
Treatment costsThe financial return on investment from intensive silvicultureis deemed negligible except on very productive sites (Benson1988, Willcocks et al. 1990, Adamowicz et al. 2003). Toremain competitive, forest managers must produce high-value wood products as inexpensively as possible. Benson(1988) advocated the use of extensive practices as their inher-ent lower costs keep wood and stumpage costs low. However,extensive practices are also associated with longer rotations,higher incidence of mixed species composition, variable den-sities, and thus variable quality. Benson’s argument was basedon a stand-level analysis and assumed much longer rotationsfor intensive silviculture than is currently assumed necessary.
In Ontario, forest renewal charges are based on volumeharvested, are prorated by species, and, in the case of whitepine, red pine, and hardwoods, by quality (Fig. 4). Charging asingle rate for most species and wood qualities effectively pro-vides incentive to use the least expensive strategic silvicultureoptions to renew the forest. Reduced renewal charges can andhave been negotiated, which has led to large discrepancies inrenewal charges across forest management units for somespecies (Fig. 4). These discrepancies may or may not berelated to differences in intensity and/or renewal standards.
Monitoring of treatment effectiveness (response to treat-ments and expected success rates)Forest management success rates can only be determinedthrough systematic monitoring that includes the collection ofreliable data. In Ontario, under the forest management plan-ning manual (OMNR 2004b), forest managers are required toassess and report on the success of their regeneration effortsto ensure that the obligations and silviculture standards out-lined in a forest management plan are met. EnvironmentalAssessment Term and Condition (T&C) 96 provides broaddirection on how the work is to be done, specifically “infor-mation on success and failure, and more important, the rea-sons for those successes and failures must be available on aconsistent basis across the province…” and “… in order totrack silviculture effectiveness, a mechanism is needed totrace the results of prescriptions back to the initial actiontaken” (OMOEE 1994). In 2002, recognizing that silvicultureis the responsibility of the sustainable forest license holders(SFLs), the Ontario Ministry of Natural Resources (OMNR)recommended that T&C 96 be replaced with Condition 29(OMNR 2002b). Based on Condition 29 of the DeclarationOrder MNR-71 (OEAB 2003), OMNR was mandated toensure that silviculture effectiveness monitoring continuesand to provide direction for systematic reporting of theresults. That direction is to include: (a) a description of the
Fig. 3. Draft intensity-based empirical yield curves for mer-chantable volume for the pure jack pine forest unit (PJPUR) onthe Crossroute Forest in northwestern Ontario, assuming a siteindex (SI) of 16.5 m and equivalent regeneration delay (SourceCrossroute Forest Management Plan).
12Height of dominant trees at 50 years breast height age.
standards and acceptable assessment methodologies that ensurethe appropriate linkages among the silviculture guides, silvicul-tural ground rules, project records, assessment and forestresource inventory updating; (b) a description of the timing ofmonitoring activities and the systematic reporting of the resultsto the general public; and (c) requirements for the maintenanceof silvicultural records and analysis, and the evaluation of theeffectiveness of the silvicultural activities. Information pro-vided by SFLs is used to track the number of hectares har-vested, the number of hectares treated (including planting,seeding, site preparation), and the number of hectaresdeclared free-to-grow (FTG; free from overtopping competi-tion). The Silvicultural Effectiveness Monitoring Manual forOntario (OMNR 2001) describes the detailed methods thatcan be used to evaluate FTG status and will be used to resolvedisputes.
When an area is assigned to a specific forest unit and yieldcurve within a forest management plan, the planning teamalso agrees to renewal standards. These standards aredescribed within silvicultural ground rules (SGRs) thatinclude specifications, standards, and other instructions todirect silvicultural activities on a management unit during theperiod of the forest management plan (OMNR 2004b). Thedetermination of whether or not the intent of an SGR hasbeen met is made through FTG assessments. However,OMNR does not require a licensee to report the results ofFTG surveys for individual stands. Licensees are onlyrequired to report total areas managed (e.g., area harvested,treated, or declared FTG) within an SFL. At present, there isno requirement for quantitative data to be collected orreported on a stand-by-stand basis. Stocking, density, andspecies composition are not reported at the FTG stage. Manylicensees employ ocular surveys, even for areas that are mod-eled using the intensive yield curve. Though some SFLs havevery good treatment records, it is sometimes difficult to tracethe results back to the initial prescriptions or actions taken. Itis difficult to identify the reasons for failures where they occur
as failures are generally not reported. At present, there is alsono requirement for monitoring beyond the FTG stage. As aresult, quantitative data that could be used to confirm (ordeny) the achievement of growth projections used in forestmanagement plans are not available. As a result, it is unclearwhether Ontario’s monitoring programs are sufficient to eval-uate the effectiveness of silvicultural practices accurately.
The intensity-based yield curves are derived using datafrom permanent plots established in managed stands. Theinherent assumption is that the results of past practices can berepeated. It is important to note that the permanent plots areestablished after the stands reach 20 years of age, whichmeans monitoring silvicultural practices that were used over20 years ago. There have, however, been substantial changesin the techniques (planting density, scarification) and tech-nology (improved stock, herbicide) used in plantation estab-lishment in recent decades (Sharma et al. 2008, this issue).
The process used to establish renewal standards during thedevelopment of each new forest management plan is also aconcern. Based largely on historical precedent, the minimumheight requirement for conifer stands is generally 1 m and40% stocking is the typical minimum for a boreal coniferstand to be declared FTG for all silviculture intensities acrossall forest units (Table 4). It is unclear whether projected differ-ences in growth and yield can be achieved when similar min-imum renewal standards are used for all intensities. Hearn-den et al. (1992) found that where only 40% stocking wasachieved, open, poorer-quality, low-volume, mixed-speciesstands tended to develop. It is thus difficult to determinewhether or not future yield objectives will be met with anacceptable degree of certainty (Buda and White 2007).
To address uncertainties regarding the effectiveness of sil-viculture within an adaptive management approach to forestmanagement, renewal standards must be objective-based,have measurable responses, and not limited to the periodbetween harvest activities and when regeneration meets therenewal standard (i.e., FTG). In response, OMNR is in the
Fig. 4. Forest renewal charges for 49 forest management units in Ontario as of March 31, 2007 (Data source: OMNR 2008). Shownare means and standard deviations.
690 SEPTEMBRE/OCTOBRE 2008, VOL. 84, No 5 — THE FORESTRY CHRONICLE
process of reviewing existing renewal standards and silvicul-tural effectiveness monitoring efforts. One possibility is thatnew provincial minimum renewal standards will be devel-oped that are species-, site-, and intensity-specific. An exam-ple of what intensity-based renewal standards may look like isprovided in Table 4. Regenerating stand characteristics asso-ciated with strategic silviculture options that can be reliablyassessed should assist forest managers in planning for andmonitoring treatment outcomes as well as communicatingtheir intentions and achievements to stakeholders. We recom-mend that the provincial silvicultural effectiveness monitor-ing program be enhanced so that the data are more objective(i.e., statistically defensible) and the process adaptable, partic-ularly for areas assigned to higher yield curves. Surveys thatinclude quantitative and qualitative data of areas declaredFTG, as well as growth performance and stand conditionbeyond the FTG stage will provide the data needed to linkrenewal standards to future growth and yield. The collectionand analysis of height growth data in managed stands will beof particular importance since management activities areknown to influence height growth, particularly for conifers(Sharma et al. 2002, Huang et al. 2004). Permanent growthplots can also be used to monitor stand development in juve-nile stands and to provide a benchmark for natural forest con-ditions, including forest structure, soil fertility, and relation tosoil moisture and nutrient regime gradients, against which tocontrast treatment responses (Sharma et al. 2008, this issue).
An active adaptive management approach that uses reli-able data collected with standard quantitative samplingmethodologies is likely the most efficient means to determinesuccess rates. At the time of writing, a monitoring programthat reflects the intent of silvicultural intensities is being con-sidered, and is expected to be in place by 2009 following theimplementation of Tembec’s most recent forest managementplans. We recommend that the approach to silvicultural effec-tiveness monitoring incorporate natural controls (Weetman1996) and controlled experiments to help illuminate thecauses of success and/or failure.
Under condition 31 of the OEAB (2003) declaration order71, OMNR is required to maintain a program of scientific
studies to assess the effectiveness of guides. The 1999 IFM sci-ence workshop participants recommended that priority begiven, wherever possible, to larger multidisciplinary studiesbacked by a solid research team, since these types of studiesare more cost-effective and synergistic in generating long-term, multivariate, multidimensional data than are smallersingle-problem-focused studies (Bell et al. 2000). Also recom-mended was that new studies should apply a common suite oftreatments across different species and site types. The CEC-FRP partners have implemented these kinds of controlledexperiments (Bell et al. 2008, this issue, McPherson et al.2008, this issue) and are actively engaged in the NEBIE plotnetwork, wherein the full suite of silvicultural intensities isbeing applied across a broad range of forest units in large (100m ? 200 m) plots ensuring that treatments could be applied inan operational manner. Site and management intensity spe-cific prescriptions are being implemented by forest industrypartners. In addition, large plot (i.e., greater than 500 ha)experimental installations of intensive silviculture have beenestablished on the Gordon-Cosens, Romeo Malette, andNipissing SFLs (McPherson et al. 2008, this issue). The com-bination of the NEBIE plot network and large plot experi-mentation will help the partners understand the factors thatcontribute towards silviculture success or failure. They arealso indicators that an active adaptive management approachis already being considered (Baker et al. 2008, this issue).
SummaryOntario’s forest management planning process requires thatstrategic silvicultural options (i.e., groups of silviculturaltreatments that exhibit similar characteristics including initialforest unit, silvicultural intensity, expenditures, and growthprojections) be defined. For each option, forest managersmust identify: (1) the forest unit(s) to which it applies, (2)associated assumptions (forest development, treatment costs,response to disturbance, and expected success rates), and (3)extent to which it can be applied on the forest managementunit. The NEBIE framework and definitions provide anapproach whereby the effects of management activity of for-est growth and development can at least partially be captured.
Table 4. Representative renewal standards for the jack pine 1 forest unit (PJ1)a by management intensity from recent forest manage-ment plans in Ontario’s northeast administrative region, and a possible approach to renewal standards by intensity
Possible approach to renewal standards Existing PJ1
Intensive 0.4–0.5 1000–1330 1st thinning 1 or 2 high highest none taller fewest(and shorter (narrow range)
rotation)
aPJ1 – Jack pine working group
Ideally, forest managers would monitor the development andthus project the growth and yield of each forest stand; how-ever, this kind of monitoring program is not possible giventhe financial realities of forest management in Ontario.Instead, growth and yield models are generated for combina-tions of species, ecosite, and management (or silviculture)intensity and assigned to forest areas. One of the difficulties inthis process has been the assignment of silviculture intensity,due in part to a lack of common definitions. To reduce thisuncertainty, we have reviewed the factors affecting forest pro-ductivity and yield and historical use of terms, developed aframework for classifying management practices, and pro-posed definitions for natural disturbance, as well as extensive,basic, intensive, and elite silviculture. We have described howthe NEBIE framework and definitions can be incorporatedinto forest management planning in Ontario. This frameworkprovides a starting point, or hypothesis, which can be contin-ually refined through adaptive management using systematicmonitoring designed to test the assumptions. By taking thisapproach, the NEBIE framework offers an opportunity toensure that forests are managed sustainably, and that the ben-efits of silviculture are recognized. Without the systematiccollection and analysis of reliable data through monitoring,however, this approach is nothing more than an elegant andwell thought out hypothesis.
AcknowledgementsThe authors extend their gratitude to Lisa Buse, MichaelMcLaughlan, Ian Thompson, Margaret Penner, ShelaghDuckett, Greg Pawson and 2 anonymous reviewers whosecomments on previous versions of this manuscript helpedimprove accuracy, clarity and readability and Jeff Leach, Tem-bec Inc. for the use of the proposed Romeo-Malette forest sil-vicultural matrix.
ReferencesAdamowicz, W.L., G.W. Armstrong and M.J. Messmer. 2003. Theeconomics of boreal forest management. In P.J. Burton, C. Messier,D.W. Smith and W.L. Adamowicz (eds.). Towards Sustainable Manage-ment of the Boreal Forest. pp. 181–211. NRC Res. Press. Ottawa, ON. Andison, D.W. and B.P. Callaghan. 1988. Survey of artificiallyregenerated sites of North Central Region. Ont. Min. Nat. Resour.,For. Resour. Group, Unpub. Rep.Armson, K.A. 1972. Forest production policy for Ontario. Ont.Min. Nat. Resour., Toronto, ON. 54 p.Armson, K.A. 1976. Forest management in Ontario. Ont. Min. Nat.Resour., Toronto, ON.Armson, K.A. 1979. Incentives for intensive forest management: aview from Ontario. Pulp Pap. Can. 80(6): 94–97.Armson, K.A. 2001. Ontario forests: a historical perspective.Fitzhenry & Whiteside, Toronto, ON. 233 p.Baker, J.A., F.W. Bell and A. Stinson. 2008. Ontario’s ForestryResearch Partnership: Progress and next steps. For. Chron. 84(5):756–763.Bell, F.W., J.A. Baker, G. Bruemmer, J. Pineau and A. Stinson.2008. The Canadian Ecology Centre – Forestry Research Partner-ship: Implementing a research strategy based on an active adaptivemanagement approach. For. Chron. 84(5): 666–677.Bell, F.W., W.C. Parker, R.G. White, D.R. Duckert and J.E. Elliot.1998. Autecology of associated plants. In OMNR. A SilviculturalGuide for the Great Lakes–St. Lawrence Conifer Forest in Ontario.pp. 1–16. Ont. Min. Nat. Resour., Toronto, ON. 424 p.Bell, F.W., D.G. Pitt, M. Irvine, B. Parker, L. Buse, N. Stocker, B.Towill, H. Chen, F. Pinto, K. Brown, D. DeYoe, T. McDonough, G.
Smith and M. Weber. 2000. Intensive forest management scienceworkshop summary. Ont. Min. Nat. Resour., Sault Ste. Marie, ON.Sci. Devel. Trans. Ser. No. 003. 45 p. + append.Bell, F.W., D.G. Pitt, and M.C. Wester. 2006. Is intensive forestmanagement a misnomer? An Ontario-based discussion of termi-nology and an alternative approach. For. Chron. 82(5): 662–674.Bell, F.W., A.J. Willcocks and J. Kavanagh. 1990. Preliminary vari-able density yield tables for four Ontario conifers. Ont. Min. Nat.Resour., Northw. Ont. For. Technol. Devel. Unit, Thunder Bay, ON.NWOFTDU Tech. Rep. #50. 80 p.Benson, C.A. 1988. A need for extensive forest management. For.Chron. 64: 421–430.Bonnor, G.M. and K. Nietmann. 1987. Metric units in forestry:What do they mean? Can. For. Serv., Ottawa, ON. 10 p.Brand, D.G. 1991. The establishment of boreal and sub-borealconifer plantations: an integrated analysis of environmental condi-tions and seedling growth. For. Sci. 37(1): 68–100.Bruemmer, G. 2008. The Forestry Research Partnership: Develop-ing the partnership. For. Chron 84(5): 648–652.Buda, N.J. and R.G. White. 2007. Forest regeneration standards inOntario: A historical perspective. Ont. Min. Nat. Resour., Northw.Sci. Info. Sect., Thunder Bay, ON. NWSI Inf. Rep. IR-006.Burger, J.A. 2002. Soil and long-term site productivity values. In J.Richardson, R. Björheden, R. Hakkila, and A.T. Lowe (eds.). Bioen-ergy From Sustainable Forestry. pp. 165–189. Kluwer AcademicPublishers, Dordrecht, The Netherlands. [CEC-FRP] Canadian Ecology Centre – Forestry Research Part-nership. 2000. The Canadian Ecology Centre Forestry ResearchPartnership strategic plan. Can. Ecol. Cent., For. Res. Partner., Mat-tawa, ON. 33 p.Chapman, H.H. 1950. Forest Management. Hildreth Press Publ.,Bristol, CT.Côtè, M. 2000. Dictionnaire de la Foresterie/Dictionary of Forestry.Les Presses de U’Université Laval, Saint Nicolas, PQ.Davis, R. 1999. Strategic Forest Management Model Version 1.6User Guide. Ont. Min. Nat. Resour., Toronto, ON.De Groot, P., A.A. Hopkins and R.J. Sajan. 2005. Silvicultural tech-niques and guidelines for the management of major insects and dis-eases of spruce, pine and aspen in eastern Canada. Nat. Resour. Can.,Can. For. Serv., Great Lakes For. Cen., Sault Ste. Marie, ON.Duerr, W.A. 1960. Fundamentals of Forestry Economics. McGraw-Hill, New York, NY.Dunster, J. and K. Dunster. 1996. Dictionary of Natural ResourceManagement. UBC Press, Univ. British Columbia, Vancouver, BC.Fernum, P., R. Timmis and J.L. Kulp. 1983. Biotechnology of forestyield. Science 219: 694–702.Florence, R.G. 1996. Ecology and Silviculture of Eucalypt Forests.CSIRO Publishing, Collingwood, VIC, Australia.Grime, A. 1977. Evidence for the existence of three primary strate-gies in plants and its relevance to ecological and evolutionary theory.Am. Nat. 111: 1169–1194.Gross, H.L., D.B. Roden, J.J. Churcher, G.M. Howse and D. Ger-tridge. 1992. Pest-caused depletions to the forest resource ofOntario, 1982–1987. For. Can., Ont. Region, Sault Ste. Marie, ON.Joint Rep. 17. 16 p.Hawley, R.C. 1947. The Practice of Silviculture, Fifth Ed. John Wiley& Son, New York, NY.Hearnden, K.W., S.V. Millson and W.C. Wilson. 1992. A report onthe status of forest regeneration. Ont. Min. Nat. Resour., Toronto,ON. 31 p. + append.Hodge J.C., J. Juzwik, H.L. Gross and A. Retnakaran. 1989. Whitepine blister rust and white pine weevil management. Ont. Min. Nat.Resour., Queen’s Printer Ont., Toronto, ON. Pest Mange. Sec. Rep.PM-36. 21 p.Huang, S., R.A. Monserud, T. Braun, H. Lougheed and O.Bakowsky. 2004. Comparing site productivity of mature fire-originand post-harvest juvenile lodgepole pine stands in Alberta. Can. J.For. Res. 34: 1181–1191.
692 SEPTEMBRE/OCTOBRE 2008, VOL. 84, No 5 — THE FORESTRY CHRONICLE
Joyce, D., P. Nitschke and A. Mosseler. 2001. Genetic resourcemanagement. In R.G. Wagner and S.J. Colombo (eds.). Regeneratingthe Canadian Forest: Principles and Practice for Ontario. pp.141–154. Fitzhenry & Whiteside, Markham, ON. 650 p.Matthews, J.D. 1989. Silvicultural Systems. Oxford Univ. Press, NewYork, NY. 264 p.McInnes, B. and K. Tosh. 2004. Genetic gains from 20 years ofcooperative tree improvement in New Brunswick. For. Chron. 80(1):127–133.McPherson, S. F.W. Bell, J. Leach, P. Street and A. Stinson. 2008.Applying research for enhanced forest productivity on the CanadianEcology Centre – Forestry Research Partnership forests. For. Chron.84(5): 653–665.McRae, D.J., M.G. Weber and P.C. Ward. 2001. Site preparation –prescribed fire. In R.G. Wagner and S.J. Colombo (eds.) Regenerat-ing the Canadian Forest: Principles and Practice for Ontario. pp.201–219. Fitzhenry & Whiteside, Markham, ON. 650 p.Meyer, W.L., F.W. Bell, P.J. Bastarache and C. Bowling. 1997. Con-cepts of tree mineral nutrition related to fertilizer use in northernOntario Forests. Ont. Min. Nat. Resour., Northw. Ont. Technol.Devel. Unit, Thunder Bay, ON. NWST Tech. Rep. TR-114. 29 p.Morris, L.A. 2001. Management of soil and site. In J. Evans (ed.).The Forest Handbook. Vol. 2. pp. 105–128. Blackwell Sci. Ltd., Lon-don, UK.[NRCan] Natural Resources Canada. 1995. Silvicultural terms inCanada, 2nd ed. Can. For. Ser., Nat. Resour. Can., Pol. Econ. Intern.Aff. Direct., Ottawa, ON. 109 p._____. 2007. Jack pine ecosystem productivity project [online].Available at http://cfs.nrcan.gc.ca/projects/219 [Accessed March 12,2008].[ODLF] Ontario Department of Lands and Forests. 1967. A con-densation of the report on the forestry study unit 1967. Ont. Dept.Lands. For., Toronto, ON. 29 p. + append.[OEAB] Ontario Environmental Assessment Board. 2003. Declara-tion order regarding MNR’s Class Environmental Assessment Approvalfor Forest Management on Crown lands in Ontario, MNR-71. [OFAAB] Ontario Forest Accord Advisory Board. 2001. State ofthe Ontario Forest Accord. Ont. Min. Nat. Resour., Sault Ste. Marie,ON. Int. Rep. 15 p.[OMOEE] Ontario Ministry of the Environment and Energy.1994. Decisions and reasons for decision, class environmentalassessment by the Ministry of Natural Resources for timber manage-ment on Crown lands in Ontario. Ont. Environ. Assess. Board,Toronto, ON. Rep. EA-87-02. 468 p. + append.[OMNR] Ontario Ministry of Natural Resources. 1986. The forestmanagement challenge. Ont. Min. Nat. Res., For. Resour. Group.Toronto, ON. Unpubl. Rep._____. 1989. Silvicultural guide for the white pine and red pineworking groups in Ontario. Ont. Min. Nat. Res., For. Resour. Br., Sci.Tech. Ser., Vol. 6. Toronto, ON._____. 1997. Silvicultural guide to managing for black spruce, jackpine and aspen on boreal forest ecosites in Ontario. Book 1: Silvicul-ture in Ontario. Ver. 1.1. Ont. Min. Nat. Resour., Toronto, ON. 136 p._____. 1998a. A silvicultural guide for the tolerant hardwood forestin Ontario. Ont. Min. Nat. Resour. Toronto, ON. 500 p._____. 1998b. A silvicultural guide for the Great Lakes–St. Lawrenceconifer forest in Ontario. Ont. Min. Nat. Resour., Toronto, ON. 424 p._____. 1999. The 1999 Ontario Forest Accord: A foundation forprogress. Ont. Min. Nat. Resour., Toronto, ON._____. 2001. Silvicultural effectiveness monitoring manual forOntario. Ont. Min. Nat. Resour., Toronto, ON. 42 p._____. 2002a. State of the forest report. Ont. Min. Nat. Resour.,Toronto, ON._____. 2002b. Class Environmental Assessment for Timber Man-agement on Crown Lands in Ontario “MNR’s Timber Class EAReview.” Ont. Min. Nat. Resour., Toronto, ON._____. 2004a. Provincial wood supply strategy. Ont. Min. Nat.Resour., Toronto, ON. 92 p.
_____. 2004b. Forest management planning manual for Ontario’sCrown forests. Ont. Min. Nat. Resour., Toronto, ON. Tech. Ser. 440 p._____. 2008. [online]. Available at http://www.mnr.gov.on.ca/mnr/forests/businessweb/stumpage/2006/renewal_0607.html#ne(Accessed April 8, 2008)Park, A. and E.R. Wilson. 2007. Beautiful plantations: Can inten-sive silviculture help Canada to fulfill ecological and timber produc-tion objectives. For. Chron. 83(6): 825–839.Penner, M., M. Woods, J. Parton and A. Stinson. 2008. Validationof empirical yield curves for natural-origin stands in boreal Ontario.For. Chron. 84(5): 704–717.Pitt, D.G., C.S. Krishka, F.W. Bell and A. Lehela. 1999. Five-yearperformance of three conifer stock types on fine sandy loam soilstreated with hexazinone. North. J. Appl. For. 16(2): 72–81.Plonski, W.L. 1964. Manual of management plan requirements forthe province of Ontario. Ont. Dept. Lands For., Toronto, ON. Silv.Ser. Bull. No. 3. 20 p. + append.Plonski, W.L. 1981. Normal yield tables (Metric) for major forestspecies of Ontario. Ont. Min. Nat. Resour., For. Resour. Gr.. Toronto,ON. 40 p.Reed, F.L.C. and Associates, Ltd. 1978. Forest management inCanada. Vol. 1. Can. Dep. Environ., Ottawa, ON., For. Manage. Inst.,Info. Rep. FMR-X-102. 155 p. Sharma, M., H.E., Burkhart and R.L. Amateis. 2002. Modeling theeffect of density on the growth of loblolly pine trees. South. J. Appl.For. 26(3): 124–133.Sharma, M., J. Parton, M. Woods, P. Newton, M. Penner, J. Wang,A. Stinson and F.W. Bell. 2008. Ontario’s forest growth and yieldmodelling program: Advances resulting from the Forestry ResearchPartnership. For. Chron. 84(5): 694–703. Sims R.A., H.M. Kershaw and G.M. Wickware. 1990. The autecol-ogy of major tree species in the north central region of Ontario. For.Can. – Ont. Region, Sault Ste. Marie, ON. and Ont. Min. Nat. Res.,Thunder Bay, ON., COFRA. Rep. No. 3302/NWOFTDU Tech. Rep.No. 48.126 p. Smith, D.M., B.C. Larson, M.J. Kelty and P.M.S. Ashton. 1997.The Practice of Silviculture and Applied Forest Ecology, 9th ed. JohnWiley & Sons, Inc., New York, NY. 518 p.Statutes of Ontario. 1995. Crown Forest Sustainability Act, revised.R.S.O. 1998. Chap. 25 and Ontario Regulation 167/95.Stevens, V. 1997. The ecological role of coarse woody debris: anoverview of the ecological importance of CWD in B.C. B.C. Min.For., For. Res. Br. Victoria, BC. Work. Pap. 30.Sutherland, B.J. and F.F. Foreman. 1995. Guide to the use ofmechanical site preparation equipment in northwestern Ontario.Nat. Resour. Can., Can. For. Serv., Sault Ste. Marie, ON. 186 p.Taylor, K.C., R.W. Arnup, B.G. Merchant, W.J. Parton and J. Niep-pola. 2000. A field guide to forest ecosystems of northeasternOntario. Ont. Min. Nat. Resour., Northeast Sci. Technol., Timmins,ON. NEST Field Guide FG-001.Wagner, R.G, K.M. Little, B. Richardson and K. McNabb. 2006.The role of vegetation management for enhancing productivity ofthe world’s forests. Forestry 79(1): 57–79.Walstad, J.D. and P.J. Kuch. 1987. Forest Vegetation Managementfor Conifer Production. John Wiley & Sons, Toronto, ON. 523 p.Waring, R.H. and W.H. Schlesinger. 1985. Forest Ecosystems Con-cepts and Management Academic Press, Inc. Toronto, ON. 340 p.Weetman, G.F. 1996. Are European silvicultural systems and prece-dents useful for British Columbia silviculture prescriptions? For.Resour. Devel. Agree. Rep. 239. 31 p.Willcocks, A.J., F.W. Bell, J. Williams and P.N. Duinker. 1990. Acrop-planning process for northern Ontario forests. Ont. Min. Nat.Resour., Northw. Ont. For. Technol. Devel. Unit. Tech. Rep. #30. 159 p.Zhang, T. and J. Gingras. 1998. Timber management toward woodquality and end-product value. Workshop highlights and relatedinformation. Forest Engineering Research Institute of Canada,Pointe Claire, PQ. 10 p.
Appendix AThe need to categorize forest practices by level of intensitywas proposed as early as 1950 when the Allegheny Section ofthe Society of American Foresters published the followingdefinitions (Chapman 1950, pp. 558–565):
Intensity “A” management practices included the most inten-sive methods which can be applied in order to obtain the high-est profitable production on the area. It will require the mark-ing of individual trees for cutting and necessitate supervision bytechnical foresters. In order to obtain maximum production ofhigh-quality material it may be necessary to make thinningsand improvement cuttings in the young stands before it is pos-sible to obtain any revenue from such cuttings. Cutting shouldbe made if the cut material will pay for the labor or when theinvestments in labor will increase the value of the stand to suchan extent that the added later return will pay back this capitalinvestment with compound interest.
Intensity “B” management practices. The second highestorder of intensity will also require considerable supervision bytechnical personnel. The amount cut in each operation will besomewhat greater, making each cutting cycle longer. Areasmanaged under INTENSITY “B” management practices willnot be suitable for long-term investments such as planting,cleanings, improvement cuttings and thinnings which will notpay for themselves. However, if the products removed will payfor the labour of cutting, such operations may still be includedin this intensity.
Intensity “C” management practices. This intensity imposesonly limited restrictions on the cutting operations such as leav-ing a scattered residual stand and cutting to certain diameterlimits. No intensive practices such as marking trees for cuttingor improvement thinnings will take place, since it will requiretoo high an investment. A certain limited amount of manage-ment may be employed such as marking trees to be left in cut-ting operations.
Economists, silviculturalists, forest pathologists, and otherspecialists have continued to modify these definitions basedon their particular area of interest. Between 1950 and 1960,forest management intensities started to be coined as exten-sive, basic, and intensive forest management (Duerr 1960). By1978, these terms had become part of the forestry lexiconacross Canada. Reed and Associates (1978) presented them asfollows:
Extensive forest management: Using Duerr, in extensivemanagement the ratio of variable to fixed inputs is low. In otherwords, nature is left to produce or reproduce a timber crop withlittle or no assistance from the forest land manager.
Basic forest management: Somewhere in between extensiveand intensive there may be a place for “basic” forest manage-ment. In Canada (at that time) this usually included standardprotection activities together with some assistance in artificialregeneration. It has as its objective the maintenance of theresource and accomplishes that by keeping within the allowablecut and by ensuring regeneration of commercial tree species on
all depleted areas. Any treatment beyond basic management is,by definition, more intensive management.
Intensive forest management: “that which combines a largequantity of variable inputs with the fixed output” (Duerr 1960).The fixed input is the forest land base and the variables aretreatments. Implied in this definition is an objective of intensiveforest management which might be expressed as raising, overtime, the average net growth and yield from a given area to alevel above that which nature could achieve unaided.
The full complement of NEBIE definitions was introducedby OMNR in 1986 and soon incorporated into forest manage-ment planning via the white pine silviculture guides (OMNR1986, 1989; Hodge et al. 1989). By 1995, the elite term hadbeen dropped and other terms further modified by NRCan(1995) as:
Extensive forest management: Protection from fire andinsects; reliance on natural regeneration.
Basic silviculture: All the silvicultural practices required toachieve free-growing (or established) regeneration of desiredspecies at specified densities and stocking.
Intensive forest management: Basic forest management plusjuvenile-stand improvement plus acceleration of artificialregeneration.
Intensive silviculture: Application of cultural measureswhich, in addition to simply maintaining the forest cover, willallow an increase in the value or volume of the cut. The termincremental silviculture is defined in the British Columbia For-est Act and thus “intensive silviculture” is no longer used there.In Ontario, intensive silviculture may be considered to includeplantation establishment, e.g., using genetically improved plant-ing stock; intensive site preparation, such as spraying herbicidesto reduce competing vegetation before mechanical preparation;and manual weeding of plantations at early stages.
The above definitions were incorporated into more recentdefinitions by Dunster and Dunster (1996), Côtè (2000), andPark and Wilson (2007). Although OMNR continues toincorporate intensity classes into silviculture guides (OMNR1997), the terms were further modified as follows: