Page 1
T A M P E R E E N A M M A T T I K O R K E A K O U L U U N I V E R S I T Y O F A P P L I E D S C I E N C E S B U S I N E S S S C H O O L
FINAL THESIS REPORT
DEVELOPING MASTER SCHEDULE TEMPLATE FOR CAPITAL PROJECTS
Case Metso Power Finland
Susanna Koivisto
Degree Programme in International Business May 2010
Kai Hintsanen
T A M P E R E 2 0 1 0
Page 2
Author: Susanna Koivisto Title of Thesis: Developing Master Schedule Template for Capital Projects Degree Programme: International Business Month and Year: May 2010 Supervisor: Kai Hintsanen Number of Pages: 35
Abstract
The purpose of this Final Thesis was to develop the scheduling template used in creating
executive project schedules in the case company. The objection of the development work
was to create a functional and coherent schedule template based on the case company’s
Work Breakdown Structure. This way also the schedule will be connected to the global
management system implemented in the case company.
Scheduling is linked to other project management areas tightly. To really get a deeper
understanding of scheduling also the other areas were considered and therefore project
management has been dealt as a whole and scheduling as a part of it. Project management
areas such as project life cycle, planning and scheduling, risk and opportunity management,
cost management, project control and closeout were investigated further.
Based on the theory current working methods in the case company were introduced. The
final chapters concentrate on the development work itself. The current schedule template
was investigated and features of the new schedule template were introduced. Also the flow
of the development work is described and suggestions for future developments were listed.
The working methods of the case company and the development work itself are confidential
and therefore not included in the public version of the Final Thesis.
Keywords: Project Management Schedule Management Schedule Development Schedule Template Work Breakdown Structure
Page 3
Table of Contents Abstract .......................................................................................................................................... 2 Table of Contents .......................................................................................................................... 3 Abbreviations ................................................................................................................................ 4 1. Introduction ............................................................................................................................... 5
1.1 Background ........................................................................................................................ 5 1.2 Research Objectives ........................................................................................................... 5 1.3 Research Methods .............................................................................................................. 6 1.4 Structure of the Research ................................................................................................... 6
2. Project Management ................................................................................................................. 7 2.1 Project Organisation ........................................................................................................... 7 2.2 Project Phases ..................................................................................................................... 9 2.3 Planning ............................................................................................................................ 10
2.3.1 Project Scope .......................................................................................................... 10 2.3.2 Work Breakdown Structure (WBS) ........................................................................ 11 2.3.3 Activity Definition .................................................................................................. 15 2.3.4 Developing Networks ............................................................................................. 15
2.4 Scheduling ........................................................................................................................ 18 2.4.1 Activity Duration Estimation .................................................................................. 18 2.4.2 Activity Resource Estimation ................................................................................. 19 2.4.3 Gantt Chart .............................................................................................................. 20 2.4.4 Computer Software Programmes ............................................................................ 21
2.5 Risk and Opportunity Management ................................................................................. 24 2.6 Cost Management ............................................................................................................. 25 2.7 Project Evaluation and Control ........................................................................................ 27
2.7.1 Reviews ................................................................................................................... 27 2.7.2 Tracking Gantt ........................................................................................................ 28 2.7.3 Milestone Analysis ................................................................................................. 28 2.7.4 S-curve Analysis ..................................................................................................... 28
2.8 Project Closeout and Termination .................................................................................... 29 3. Company Overview................................................................................................................. 31
3.1 Metso Corporation ............................................................................................................ 31 3.2 Metso Power ..................................................................................................................... 32
4. Conclusions .............................................................................................................................. 34 Bibliography ................................................................................................................................ 35
Page 4
Abbreviations WBS Work Breakdown Structure
A tool to breaking down the project scope into smaller more manageable
pieces of work to meet the project objectives. Also a graphic description
of the project scope.
ERP Enterprise Resource Planning
A compute-based system to manage resources, finances, materials and
human resources.
DOR Division of Responsibility
A document for dividing project responsibilities by person or
organisation used by the case company.
PEM Project Execution Model
A tool for monitoring project progress in the case company.
R&O Register Risk and Opportunity Register
A document for controlling risks and opportunities during projects in the
case company.
Page 5
1. Introduction The main focus of this thesis is to develop the project schedule template for the case
company. Scheduling is only one piece of a bigger picture which is project management. To
really get a deeper understanding of scheduling also the other parts involved in project
management have to be looked at and taken into consideration. Therefore in this thesis
project management has been dealt as a whole and scheduling as a part of it.
Scheduling improvement is now one of the top priority development issues in the case
company, Metso’s Power business line. This includes developing the scheduling tool Master
Schedule Template for Capital Projects and the scheduling methods. Metso Power is an
international company with locations in Finland, Sweden, Brazil and USA. The Master
Schedule Template is currently implemented in Finland but the development work was
performed with the Metso global management system in mind. The development ideas and
the Master Schedule Template have been introduced to the all the company locations.
1.1 Background In 2009 a Master of Science Thesis on Scheduling in Multiproject Environment was written
for Metso Power. The thesis analysed the current scheduling methods in all the Metso Power
global locations to find a global framework for scheduling and suggestions for best
practices. As a result the scheduling process was developed to a more detailed level where
roles and responsibilities were defined. Suggestions for the schedule tool functionality and
framework were made. The structure recommendation for the scheduling tool was based on
the Metso Power global WBS. This thesis continues from these suggestions to conduct the
development work of the scheduling tool Master Schedule Template.
1.2 Research Objectives The purpose of this final thesis is to develop the Master Schedule Template for Capital
Projects business unit in case company Metso Power Finland. The aim is to develop the
Master Schedule Template into a functional and coherent scheduling tool for projects. The
schedule is developed away from the separate departmental discipline schedules towards a
schedule where the chain of activities can be cross-checked based on the company WBS
Page 6
6
logic. In this way the project schedule can follow the same logic as risk and opportunity,
cost and scope management.
1.3 Research Methods The research was mainly conducted based on the qualitative research method. Theoretical
data and ideas are gathered from secondary literary resources dealing with project
management. The current situation in the case company Metso was established with internal
material and observation of daily routines and ongoing projects.
In the actual case study development work action research method was used. The input from
departmental disciplines in the Capital Projects business unit was vital. Based on their
knowledge and experience the information was gathered through discussions and put
together to find the best solutions. The reason to collect input from the departmental
disciplines was that people from these different disciplines form the project team. It was
momentous to have their input and knowledge since the team members are the end users of
project schedules created from the Master Schedule Template.
1.4 Structure of the Research The final thesis consists of four entities. The first part deals with the theoretical literature
discussing project management. The development work in the thesis focus on schedule
development but since it is only one part of the project also other important parts are studied
as these different parts together form the project as a whole and affect each other greatly.
The second and third entities cover an overview of the case company and how project
management is executed currently. The last entity goes deeper into the development work
behind the Master Schedule Template. Problems with the current scheduling tool are
introduced and solutions to these problems are presented. The development process is
introduced as well as the methods of implementation. In the end the findings are anlysed,
conclusions drawn up and suggestions listed for the future.
Page 7
7
2. Project Management Lewis (2002) defines the word project in his book as a “multitask job that has performance,
time, cost, and scope requirements and that is done only one time”. He continues that a
project has a definite starting as well as an ending point and a temporary team that will be
disbanded after the project ends. The PMBOK Guide (2004, 5) further defines that a project
is “undertaken to create a unique product, service, or result.”
There are four project constrains: time, budget, scope and performance requirements. All of
these constraints are dependent on each other and have to be in balance for the project to
succeed. Only three of the constraints can have values assigned and one of them has to be
determined by the project team. For example the customer or project sponsor can define a
certain timeframe, scope and performance level for the project. From here the project
manager or the project team can determine the costs. Being realistic at this stage is very
important since committing to a too tight schedule or budget might result in a disaster later
on. (Lewis 2002, 7-8)
There are two types of organizations in the macro level, project-based or non-project-based.
In project-based organizations everything is focused around projects. Each project has its
profit and loss statement and the organization profit is a sum of the profits of all the projects.
(Kerzner 2006, 20) There are two categories of project-based organisations. Organisations
that get their revenue primarily from performing projects under contract for other
organisations and organisations that have adopted their management style by projects. In the
latter the organisation’s management systems are designed to specially facilitate project
management. (PMI 2004, 27) In non-project-based organisations projects are performed to
support the product or functional lines. (Kerzner 2006, 20) Often non-project-based
organisations may be lacking management systems that facilitate project management
effectively and efficiently. (PMI 2004, 27)
2.1 Project Organisation A project organisation is an organisation that is created for the purpose of executing a
project. The amount of people in the project organisation may vary along the different
phases of the project. Projects often vary in size and character and therefore also project
organisation composition and emphasis vary between projects. (Pelin 2008, 65)
Page 8
8
In project organisations with multiple projects a management team is created to make the
essential project decisions, define the project and decide on the project manager. The
management team consists of senior managers that regularly review the current situation of
all the ongoing projects. At the reviews any conflicts between projects such as for example
with resources or finances are seen and resolved objectively. (Pelin 2008, 66)
The project manager holds the main responsibility for planning, execution and control of the
project. In smaller projects the project manager is the main resource for the project. In multi-
year projects the best solution is to create a project organisation where the essential
resources are found in the subordination of the project manager. The key for the success of
the project manager is creating the project team for the project. (Pelin 2008, 66-69)
To create an effective project team a great deal of effort goes to finding the right people and
developing this team into a functional and collectively performing project team. The ideal
situations in creating a project team is where people themselves express an interest to take
part and are awarded a place in the team. Unfortunately, in reality, in many organisations
people are often chosen simply because they are available. However the team is built, it is a
challenge for the project manager to build these different individuals into an effective and
united project team. (Pinto 2007, 183)
The project manager needs to approach the people he or she would like to have in the
project team. Sometimes personnel have authority to assign their time to projects but most
of the time these people are under the authority of the departmental head. The latter situation
can lead to situations where the project manager will have to negotiate with the departmental
manager over the use of their staff. The final step is to assemble the project team and check
that all necessary skills have been acquired. (Pinto 2007, 183)
One of the key factors in a successful project is a mutually understood and clear project
mission. All project members need to understand the project objectives and how they can
contribute in achieving these objectives. Enthusiasm and positive attitude are strengthened
Page 9
9
when the project team is encouraged to believe that by working together towards certain
goals they are attainable. (Pinto 2007, 186-187)
All project team members need a reason for their contribution in the project. Often projects
may compete with team member’s other duties and managers need to make all resources and
sources of organisational reward available in order for the team members to devote time and
energy to further the project’s goals. A sense of interdependency is vital among team
members. It is not only important to know how team members own contributions affect the
project but also how this work fits into the overall scheme and to the work of other team
members in other departments. (Pinto 2007, 186-187)
Participation from the project team in the planning process is extremely important,
especially for the people who will be involved in performing the detailed activities. They
usually have the best knowledge about these activities. Commitment comes through
participation and taking part in the planning stage is of consequence. (Gido & Clements
2003, 102)
2.2 Project Phases Projects are divided into phases from the beginning of the project to the end to gain better
management control. Many organisations set specific phases which together form the
project’s life cycle and use this life cycle on all of their projects. Project phase descriptions
can be extremely detailed or on the opposite very general. Detailed descriptions can include
charts, forms and checklists to create control and structure. (PMI 2004, 19-20)
There is no one way of defining project life cycle. Different project phases generally define
what work is to be performed and when the deliverables are generated. Phases are usually
sequential and the amount of work and resources required are low at the initial phase, peak
during the intermediate phase and drop dramatically at the final phase. Level of uncertainty
is also at the highest in the beginning as the risk of failing to achieve the project objectives is
high. (PMI 2004, 20-21)
Page 10
10
In large projects in particular the project phases are often divided into subphases for reasons
of complexity, level of risk and financial constraints. Each of these subphases consists of
deliverables related to the primary phase deliverable. Deliverables for phases are
measurable, verifiable work such as detailed design document, specification or working
prototype. The deliverables can match to the project management process or the end product
or a component of it. (PMI 2004, 22)
Throughout the project the project manager needs to demonstrate to the executive
management that the project has clear objectives and the work is carried out as planned. A
system of phase gates between different phases of a project offer review points to evaluate
project status and progress. Each of the phase gates, if opened, allow the work to be
continued into the next phase. The decision to open a phase gate is made after revising the
current progress and possible slippages, current risks, the budget and available resources.
Occasionally it is necessary to make recommendations or revisions to current plans before
proceeding to the next phase or even cancel the work. (Young 2007, 26-28)
2.3 Planning “Failing to plan is planning to fail.” (Kerzner 2006, 396) Planning a project is to establish a
predefined plan of action in an environment that is characterized by estimation and
uncertainty. Project planning must be systematic, flexible, disciplined and a continuous
process throughout the duration of the entire project. Good planning reduces uncertainty,
improves efficiency and gives tools to control and monitor the project. Planning will give
answers to questions what and how. (Kerzner 2006, 396-398)
2.3.1 Project Scope
The project scope includes the work that is required to complete the project successfully to
meet the requirements for deliverables set at the onset of the project. (Gido & Clements
2007, 6) Scope so to speak sets the boundaries for the project, what is included and what is
not included in the project. (PMI 2004, 103) Project scope contains also constrains and
limitations as well as project goals. (Pinto 2007, 147)
Page 11
2.3
It is
the
pro
com
acc
The
the
the
not
into
into
task
pro
app
Fig
3.2 Work B
s a graphic
project sco
oject objecti
mponents as
complished
e WBS can
re are three
size and co
t all of the p
o three leve
o the accura
k. Breaking
oductive ma
propriate ba
gure 1: Samp
reakdown
description
ope hierarch
ives. (PMI 2
s work pack
in the proje
be broken d
to five leve
omplexity o
paths have to
ls is sufficie
acy desired.
g the work d
anagement a
alance betwe
ple Work B
Structure
of the proje
hically into s
2004, 112) T
kages. The W
ect?” (Haug
down into d
els in a WB
f the projec
o end up on
ent, while a
(Lewis 200
down to too
and inefficie
een too little
Breakdown S
(WBS)
ect scope (L
smaller mor
The PMI go
WBS answe
an, 2002, 13
different lev
S. The amo
ct. The WBS
n the same le
another work
02, 50) Find
many level
ent use of re
e and too m
Structure (M
Lewis 2002,
re manageab
oes on defin
ers the ques
3)
vels. Accord
ount of level
S tree does n
evel. Somet
k may take
ding the righ
ls and too m
esources. Th
much. (PMI 2
Modified fro
, 27) and a t
ble pieces o
ning the low
tion “What
ding to Lew
ls can vary
not have to
times break
up to five l
ht level can
much detail m
he project te
2004, 114)
om PMI 200
tool to break
of work to m
west level W
has to be
wis (2002, 47
greatly dep
be symmet
king down th
evels to bre
n prove to be
may lead to
eam needs t
04, 114)
11
king down
meet the
WBS
7) typically
pending on
trical and
he work
eak it down
e a difficult
o non-
to find the
Page 12
12
The deliverables and subprojects are summed up from the work of work packages
supporting them. When deliverables or subprojects are divided into work packages, the
deliverables or subprojects do not have duration of their own, have assigned costs or spend
any resources. All the resources and costs to a deliverable or subproject are from the work
packages supporting it. (Pinto 2007, 157-158)
The main reason for the WBS structure is to identify and ensure that all relevant work
packages are included in order to successfully carry out the project. “The 100 percent rule”
states that the sum of work in the next WBS level must be 100 percent of the work
represented in the previous level. This means that the work represented by the work
packages in each deliverable or subproject must add up to 100 percent of the work it takes to
complete the deliverable or subproject. The purpose of this rule is to arouse the question
whether any work is missing from the WBS. (Haugan 2002, 18)
WBS is important to create before the schedule. A WBS does not contain the sequence of
the work packages and this is done later on in the scheduling process. WBS shows the scope
of the project in a graphic form allowing resource allocation as well as time and cost
estimates. (Lewis 2002, 49) Lewis writes that it is misleading to develop a schedule before
all work packages have been identified and agreed on by the project team.
Projects are often unique but a previous WBS can be used as a template for a new
resembling project. Many large organizations have similar project life cycles with similar
deliverables required from different phases of the project and thus have a standard WBS
template which is used in new projects. (PMI 2004, 113)
All the different components in the WBS are assigned a unique identifying numeric code.
(Pinto 2007, 157) The numbering can follow any desired method or logic but it has to be
consistent throughout the entire WBS. This numeric code shows where each activity fits in
the project overall hierarchy and identify them from each other. The WBS code helps with
scheduling, tracking, assigning and communicating throughout the project. (Haugan 2002,
Page 13
42)
the
The
situ
com
) Also the co
activities to
e WBS can
uations and
mbination o
• Project
Where
down i
B, Proj
• Project
The W
for exa
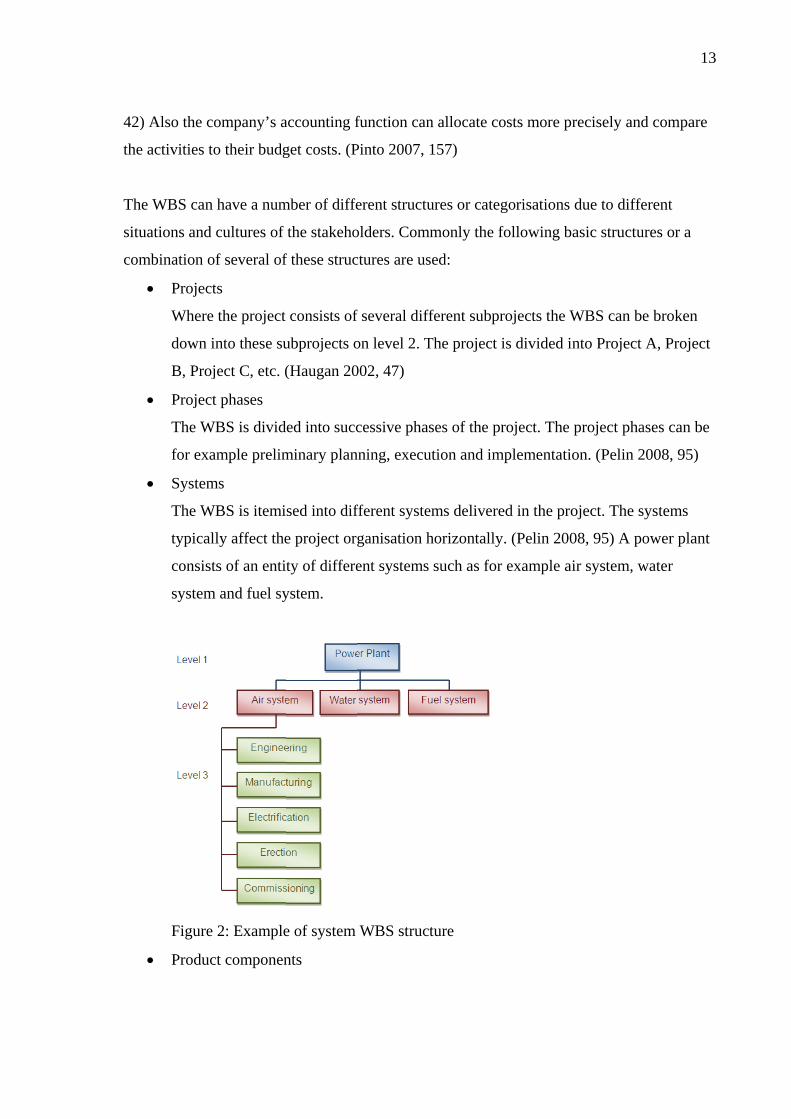
• System
The W
typical
consist
system
Figure
• Produc
ompany’s a
o their budg
have a num
cultures of
of several of
ts
the project
into these su
ject C, etc. (
t phases
WBS is divid
ample prelim
ms
WBS is itemi
ly affect the
ts of an enti
m and fuel sy
2: Example
ct componen
accounting f
get costs. (P
mber of diffe
the stakeho
f these struc
consists of
ubprojects o
(Haugan 20
ded into succ
minary plan
sed into dif
e project org
ty of differe
ystem.
e of system
nts
function can
Pinto 2007,
erent structu
olders. Com
ctures are us
f several diff
on level 2. T
002, 47)
cessive pha
nning, execu
fferent syste
ganisation h
ent systems
WBS struc
n allocate co
157)
ures or categ
mmonly the f
sed:
fferent subpr
The project
ses of the p
ution and im
ems delivere
horizontally
such as for
ture
osts more pr
gorisations
following b
rojects the W
is divided i
roject. The
mplementatio
ed in the pro
y. (Pelin 200
r example ai
recisely and
due to diffe
asic structu
WBS can be
nto Project
project pha
on. (Pelin 2
oject. The s
08, 95) A po
ir system, w
13
d compare
erent
ures or a
e broken
A, Project
ases can be
2008, 95)
systems
ower plant
water
3
Page 14
The W
the WB
buildin
and so
such as
Figure
• Organi
The W
manufa
Figure
WBS is broke
BS can be fi
ngs. It is the
on. (Pelin 2
s boiler, fue
3: Example
isational Un
WBS is divid
acturing, ere
4: An exam
en down to
irst broken d
en further di
2008, 95) A
el handling a
e of product
nits
ded into orga
ection, com
mple of orga
different ph
down into g
ivided into d
A power plan
and flue gas
t componen
anisational u
mmissioning
anisational u
hysical parts
geographica
different pa
nt for examp
s cleaning.
nt WBS stru
units in the
etc. (Pelin
units WBS
s of the proj
ally separate
rts of the bu
ple consists
ucture
project suc
2008, 95)
structure
ject. In a lar
e parts such
uilding, equ
s of differen
ch as engine
14
rge project
h as
uipment
nt products
eering,
4
Page 15
15
2.3.3 Activity Definition
In the activity definition process the WBS work package deliverables are further broken
down into smaller schedule activities that can be scheduled and monitored during the project
duration. (PMI 2004, 127-128) In large multiyear projects with thousands of people working
on the initial planning the top-level activities are usually created by a core group. Other team
members will then further develop these levels and break them into lower-level activities.
(Lewis 2002, 49) The activity definition process answers the question “How will the project
be accomplished?” (Haugan 2002, 13)
The short-duration activities have a definite start and finish time, have costs assigned and
spend resources. (Pinto 2007, 156) A single person or a discipline within the organization is
responsible for the work described in the activity. (Haugan 2002, 36) These activities are not
a part of the actual WBS structure but the structure offers a framework for defining these
activities for the project. (Haugan 2002, 4)
Activity lists from similar projects in the past or a standard list can be used as template for
new projects. The template can also include further information on resource skills and the
requisite hours of effort, reference to risks and possible other characteristic information
needed in activity definition. (PMI 2004, 128)
Rolling Wave Planning is a form of gradual planning where the work that is performed in
the near future is planned on a detailed low level of the WBS and work far in the future is
planned on a more general WBS level higher up. As the project progresses, work is planned
in more detail for the next one or two reporting periods. This means that schedule activities
can appear in different detail levels throughout the life cycle of the project. (PMI 2004, 128)
2.3.4 Developing Networks
As the WBS does not show the sequence of activities and a network diagram can be
prepared once all the activities are known. The two most commonly used methods for
creating activity networks are the Activity-on-Node (AON) and the Activity-on-Arrow
(AOA) logic. (Pinto 2007, 284) The AOA logic was commonly used a several decades ago
Page 16
16
but nowadays because of the computer-based scheduling programs the AON logic has
become the preferred method. (Pinto 2007, 285)
With these two methods the activities can be placed in their logical precedential order.
According to Gido & Clements in order to find the precedential order for each individual
activity you should ask the following questions:
1. Which activities have to be finished immediately before the start of this activity?
2. Which activities can be performed at the same time with this activity?
3. Which activities can not start before this activity has finished?
By answering these questions you are able to place each activity in their right place in the
network diagram portraying the interrelationship and sequence between the activities needed
to accomplish the project. (Gido & Clements 2003, 116) If a WBS has been developed for
the project, there should be activities in the network diagram for each work package. (Gido
& Clements 2003, 116)
In the Activity-on-Node (AON) logic each activity is written within a box. In each activity
node contains a unique activity number. The node can also include the following
information, activity descriptor, activity duration, early start time, early finish time, late start
time, late finish time and activity float. (Pinto 2007, 285) Activity float or slack is the time
that an activity can be delayed from its early start without delaying the finish of the whole
project. (Pinto 2007, 284) The more information included in the node makes calculations
easier such as identifying critical path, activity float, total project duration and so on. (Pinto
2007, 286)
Activities have relationships and they are linked in a precedential order to display which
activities are to be finished before starting another activity. Arrows linking the boxes show
the direction of the precedential order. (Gido & Clements 2003, 110-111)
Some of the activities are to be done in a serial order where a preceding activity has to be
finished before starting on the consequential activity. For example when designing a product
the activity “Detail Engineering” can start only after activity “Basic Engineering” is
finished. (Gido & Clements 2003, 111)
Page 17
Fig
Som
afte
and
“M
reso
Fig
In t
Act
the
doe
(Gi
Al
Un
Cle
tog
the
Fig
gure 5: Activ
me activitie
er the activi
d “Layout D
Manufacturin
ources to pe
gure 6: Activ
the Activity
tivities are e
activity and
es not indica
ido & Clem
l activities a
like in the a
ements 2003
gether with e
beginning
gure 7: Activ
vity-on-Nod
es can be do
ity “Basic E
Design” can
ng” can start
erform all s
vity-on-Nod
y-on-Arrow
each represe
d the arrow
ate the dura
ments 2003,
are linked b
activity in a
3, 112) Acti
event numb
of activity “
vity-on-Arr
de logic, act
ne at the sa
Engineering”
be done co
t. When per
imultaneou
de logic, act
(AOA) log
ented by an
whead repres
ation of the
111)
by events. A
box format
ivities “Bas
ber 2. Event
“Detail Eng
row logic, ta
tivities perf
ame time. (G
” has been f
oncurrently.
rforming ac
s activities.
tivities perf
gic activities
n arrow whe
sents the end
activity nor
Activities fin
t, here the e
ic Engineer
2 signifies
gineering”.
asks perform
formed cons
Gido & Clem
finished bot
When they
ctivities con
(Pinto 200
formed conc
s are written
ere the tail o
d of the acti
r implicates
nish in these
events have
ring” and “D
the end of a
med conseq
sequentially
ments 2003
th activities
y are both do
currently th
7, 287)
currently.
n on the arro
of the arrow
ivity. The le
anything ab
e circles and
a unique nu
Detail Engin
activity “Ba
uentially.
y.
, 111) For e
“Detail En
one, activity
here must be
ow instead o
w signifies th
ength of the
bout its imp
d start form
umber. (Gid
neering” are
asic Enginee
17
example,
ngineering”
y
e sufficient
of a box.
he start of
e arrow
portance.
m them.
do &
e linked
ering” and
7
Page 18
Act
Act
acti
“De
Fig
2.4 SchIn t
pro
to v
sch
2.4
The
(Gi
(Ha
the
esti
met
The
Thi
in p
org
esti
Cle
tivities goin
tivities can
ivity start. (
etail Engine
gure 8: Activ
heduling the planning
oject objecti
visualise the
heduling the
4.1 Activity
e scheduling
ido & Clem
augan 2002
work plus
imates are b
thods, durin
e ideal situa
is creates co
particular in
ganisation or
imations for
ements 2003
ng into an ev
be perform
(Gido & Cle
eering” hav
vity-on-Arr
g section ac
ives. This pl
e project sco
e plan. Sche
Duration E
g process st
ments 2003,
, 13) Activi
any addition
based on the
ng normal w
ation would
ommitment
nvolving hu
r subcontra
r all the acti
3, 144)
vent must b
ed simultan
ements 2003
e to be both
row logic, ta
ctivities hav
lan was then
ope. Now th
eduling can
Estimation
tarts with es
144) and re
ity duration
nal waiting
e assumptio
working hou
d be to have
to the work
undreds of p
ctor designa
ivities the o
be finished b
neously and
3, 112) For
h finished be
asks perform
ve been deci
n portrayed
he schedulin
answer the
n
stimating ho
espond to th
signify the
time. (Gido
on that they
urs and norm
the person
k and avoids
eople, this w
ates a respo
organisation
before activ
when they
example, a
efore activit
med concurr
ided and seq
d in graphica
ng process f
questions w
ow long eac
e question “
total elapse
o & Clemen
will be com
mal busines
performing
s bias. How
would not b
onsible perso
n or subcont
vities going
are both fin
activities “L
ty “Manufa
rently.
quencing fo
al form by t
for the proje
when and by
ch activity w
“When will
ed time whi
nts 2003, 14
mpleted with
s days. (Pin
g the job esti
wever, in larg
be possible.
on to make
tractor is res
out can star
nished can t
ayout Desig
acturing” ca
ormed to rea
the network
ect can begi
y whom.
will take to c
it be accom
ich means th
44) Activity
h normal wo
nto 2007, 29
imating the
ge multiyea
Here each
the duration
sponsible fo
18
rt.
the next
gn” and
an start.
ach the
k diagram
in by
complete
mplished?”
he time for
y duration
orking
92)
duration.
ar projects
n
or. (Gido &
8
Page 19
19
The activity duration estimation is always directly linked to the available resources in the
project and estimation must always be based on the resources that will be expected to be
used on the performance of the activity. This should be as realistic as possible, not too
pessimistic or positive. People sometimes perform to expectation, hence if the duration
estimation is too pessimistic and set to 10 days, the activity may take the whole 10 days
even if it could have been done in a shorter time. The activity estimation should not include
a lot of extra time for things that could go wrong. (Gido & Clements 2003, 144-145)
Duration estimation is always somewhat uncertain. Past work and experience can be used as
a guide and history to estimation. What worked in the past might not work right now due to
for example different external factors. (Pinto 2007, 292) Duration estimations for some tasks
will be spot on, some will be delayed for one reason or another and some activities are
performed faster than expected. Over the duration of the whole project these delays and
accelerations sometimes tend to cancel each other out. For example, one activity can take
two weeks longer to complete but two activities preceding it took each one week less to
complete than expected and this way cancelling each other out. (Gido & Clements 2003,
145)
The entire project also requires a start and completion time. These times can also be dates,
usually the completion time is a date that is stated in the contract. (Gido & Clements 2003,
146) Creating the project schedule can begin from the completion date when the project is
due to end and worked from there until the start date can be defined. Alternatively the
project schedule creation can begin from the start date and be built from there until the
completion date is defined. Often in practice both the completion date and the start date are
defined in the contract and the project schedule is created either form the beginning or the
end but is restrained by both the start and completion dates.
2.4.2 Activity Resource Estimation
Activity resource estimation is to define the appropriate resources whether it is material,
equipment, facilities or personnel to perform the activities in a work package. The budget of
the project often dictates how much resources are at disposal. (PMI 2004, 135) Resource
estimation is closely knitted with cost estimation and budgeting process. (PMI 2004, 135)
Page 20
Av
req
use
may
200
2.4
The
ind
diff
Gan
Cle
In t
side
han
rev
Fig
ailable reso
quire the use
e of these re
y have to be
04, 230)
4.3 Gantt C
e Gantt char
dividual acti
ference betw
ntt chart com
ements 2003
the Gantt ch
e and time s
nd side. Esti
view of the s
gure 9: Exam
ources for th
e of same re
esources. If t
e reschedul
Chart
rt was deve
ivities into t
ween planne
mbines both
3, 109)
hart activitie
scale with a
imated start
status of the
mple of a ba
he use of a p
esources at t
there are no
ed until the
eloped in 19
the schedule
ed and actu
h the planni
es with an e
a bar display
t and finish
e project at a
asic Gantt c
project are o
the same tim
ot enough re
necessary r
917 by Henr
e baseline. I
al performa
ing and sche
estimated sta
ying the dur
dates are or
any given d
hart
often limited
me span and
esources for
resources ar
ry Gantt to c
It is also a v
ance is easy
eduling fun
art and finis
ration of eac
rdered by ba
date during t
d. Several d
d therefore a
r all the acti
re available
create a netw
very handy t
to see. (Pin
nctions of a p
sh dates are
ch task hori
aseline cale
the project.
different act
are competi
ivities some
e. (Gido & C
work linkin
tracking too
nto 2007, 31
project. (Gi
e listed on th
izontally on
endar dates a
(Pinto 2007
20
tivities may
ing for the
e of them
Clements
ng
ol, the
19) The
ido &
he left-hand
n the right-
allowing
7, 319)
0
d
Page 21
21
Besides benefits the Gantt chart also has limitations. The chart does not show
interdependencies between the activities. (Kerzner 2006, 525) Without these relationships it
is difficult to see how a change in one activity will affect the rest of the activities. It is clear
that a change in the beginning can affect the rest of the project but it is not clear which
individual activities this change may affect.
2.4.4 Computer Software Programmes
Today there are many available computer software programmes to plan and control projects.
The programs vary slightly as to how they function and what features they offer. Gido &
Clements (2003, 409-413) list the following features among the most important:
Planning
The feature allows the definition of all the activities to be performed during the project. For
each activity the user can specify the basic functions; a name or description, start date, finish
date and duration. In addition the precedential relationships between activities can be
established and resources assigned.
Graphics
For large projects consisting of several thousands of activities it would be difficult and prone
to errors to manually draw up and update Gantt charts and network diagrams. The software
can generate a variety of charts and networks quickly and easily based on the given data.
Modifications to the plan can easily be entered to the data and the software will
automatically adjust these changes into the graphics.
Scheduling
The feature provides support for scheduling based on planning. The software can create
Gantt Charts and network diagrams from the planned activities and the precedential
relationships. After the relationships have been entered, any changes to the activities will be
reflected to the entire schedule automatically. Users can also schedule recurring activities,
perform scheduling from the project start or finish date, schedule lag, set priorities to
activities and give constrains to activities such as schedule activities to start as late or soon
Page 22
22
as possible, specify must-start-by or must-finish-by dates, no-earlier-than or no-later-than
dates.
Project monitoring and tracking
For the project manager it is important to know during the project how activities are actually
being performed compared to the baseline plan. The software allows the user to set a
baseline from the planned schedule and compare actual progress or cost to the baseline
schedule. Most available software allow tracking of progress, start and finish date,
completed tasks, actual cost spent and used resources. There are several different report
formats provided for these monitoring and tracking features.
Handling multiple projects and subprojects
The feature allows to handle at the same time multiple projects in separate files with
connecting links between these files or to divide large projects into smaller subprojects. It is
possible to store multiple projects in the same file and handle several projects
simultaneously. Gantt Charts and network diagrams can be created from several projects.
Importing and exporting data
Software allows the user to import information from other applications such as spreadsheets,
word processing or database applications. This feature saves time and possibility of errors
from retyping the information into the project management software. Data transferring also
works in reverse where data can be exported from project management software into other
applications.
Calendars
This function offers the possibility to define different working days and hours to different
resources or groups of resources. The project has a set base calendar with standard working
hours and holidays. This calendar can be changed for each resource or resource group.
Working hours, working days, nonworking days, vacation days, different shifts such as part-
time or night time can be entered.
Page 23
23
Budgeting and cost control
Costs can be assigned to each activity and resource. The employee, subcontractor and
material costs such as hourly rates, overtime rates, one-time-only rates or ongoing costs can
be defined. Accounting and material codes can also be specified to each resource. This
information is used to calculate and track the budgeted and actual costs of the project.
Actual individual resource, group resource and subcontractor costs as well as actual costs of
the entire project can be compared to the planned budget at any time during the project.
Resource management
A list of resources can be added where details concerning each resource or resource group
can be maintained and updated. Resources have an identifying name, standard and overtime
rates and an invoicing method. Each resource can have a personalised calendar and
constraints when the resource is available. Resources can be assigned to several activities at
the same time and have a certain percentage of the level of input to an activity. The software
highlights over allocation and helps to correct and level resources.
Report generation
Reports can be generated from the entire project or a part of the project. For partial reports
the user can set a date range, select activities that are completed or ongoing, activities that
start or finish in a certain time frame, or choose to report the milestones of a project.
What-if analysis
When activities are linked together to make precedential relationships different
manipulations can be performed. Since the software adapts changes in one activity into the
entire project the user can explore different effects of various scenarios. For example if an
activity is changed to occur later the software will automatically calculate how this change
will affect the rest of the project. This way the project manager can better control risks
involved with the project costs, schedule and resources.
Page 24
Fig
Pro
2.5 RisThe
any
of t
pro
or p
cos
Ris
pro
bas
(Pin
foll
gure 10: Exa
oject
sk and Ope environme
y aspect of t
the control o
oject risks as
positively. P
st or time m
sk managem
oject life cyc
sis of the lik
nto 2007, 2
lowing step
ample of a G
pportunitent around p
the project;
of the organ
s possible e
PMI continu
may be impac
ment is to re
cle and in th
kelihood of
22) PMI (20
ps:
Gantt chart
ty Managprojects is f
budget, res
nisation and
events that c
ues that one
cted and ris
cognise, an
he best inter
the event oc
004, 237) d
view in the
gement filled with u
ources, cust
d so on. (Pin
can affect th
e or more of
sks may hav
alyse and re
rests of its m
ccurring as
describes the
project ma
uncertainty.
tomer requi
nto 2007, 22
he objective
f these objec
ve one or mo
eact to these
main objecti
well as the
e project ris
nagement s
Problems c
irements, an
21) PMI (20
s of the proj
ctives such
ore causes.
e risk factor
ives. Risks
consequenc
sk managem
software Mi
can occur in
ny outside f
004, 238) de
oject either n
as for exam
rs throughou
are assessed
ces they ma
ment process
24
icrosoft
n almost
factors out
efines
negatively
mple scope,
ut the
d on the
ay have.
s with the
4
Page 25
25
• Risk Management Planning – deciding on a plan how to identify, plan and manage
risks of the project.
• Risk Identification – identify and document possible risks that are likely to affect the
success of the project.
• Qualitative Risk Analysis – prioritising identified risks by how likely they are to
occur and how they would impact the project.
• Quantitative Risk Analysis – analysing with numbers how the identified risks would
threaten the project objectives.
• Risk Response Planning –developing precautions and minimising the impact of
likely risks.
• Risk Monitoring and Control – executing, evaluating and documenting identified
risks and risk response plans throughout the entire project.
Projects encounter different kind of risks with impact on different areas of the project. Risks
commonly fall under certain classifications. Pinto (2007,223-224) classifies risks under the
five following clusters:
• Financial risk
• Technical risk
• Commercial risk
• Execution risk
• Contractual or legal risk
2.6 Cost Management Cost Management is composed of planning, estimating, budgeting and controlling costs of
the project. Cost Management is mainly interested in the costs of the resources that are
needed in completing the scheduled activities. This should be done without forgetting the
life-cycle costs. These are costs of using, maintaining and supporting the project end
product, service or result. Decisions done to reduce costs of the project can increase cost for
the customer such as in case of limiting reviews during the project phase can bring
additional operational costs to the customer. (PMI 2004, 157)
Page 26
26
Estimating the costs of the project includes evaluating how much costs it will take to
perform each work package in the WBS structure. There can be several different alternatives
as to how much a work package is expected to cost. Additional work during the design or
engineering phase can reduce costs in the operational phase and save total costs in the long
run. The estimation process is to find these possibilities and consider whether the savings in
the end will cover the costs of additional input. (PMI 2004, 161)
Project costs are often estimated during development of project proposal for a customer.
Depending on the required level of detail the proposal includes the total bottom-line costs or
detailed breakdown of various costs. Costs include labour, materials, subcontractors and
consultant, equipment and facilities as well as travelling costs. In addition there can be
included contingency costs. These are to take care of any unexpected situations which have
been overlooked such as changes in cost of labour especially in multiyear projects or when
producing a new product. (Gido & Clements 2003, 254-255)
Estimation should be as realistic as possible. If too much contingency costs are estimated in
case of pretty much anything that can go wrong there is a risk of overpricing the project and
loosing to a competing contractor. On the other hand, if the estimation is too optimistic and
unexpected costs arise the profits of the project may be lower than expected or facing the
embarrassment of having to go to the customer to request additional funds. (Gido &
Clements 2003, 255-256)
Gido & Clements (2003, 254) clearly state that it is vital during the project, from the
beginning to the end, regularly monitor actual costs and progress of work to ensure that
everything is going within the budget. They continue that any variance or inefficiencies in
costs is crucial to recognize early in order to take action before the situation spirals out of
control.
PMI (2004, 171) includes the following into cost control:
• monitoring cost performance to find any variance from baseline
• managing and documenting changes to budget when they occur
Page 27
27
• making sure potential changes do not exceed the authorized funding in the total
budget for the project
• preventing inappropriate or unapproved changes going into the reported costs
2.7 Project Evaluation and Control During project implementation it is of uppermost importance to monitor and control the
project. Since projects have one or more constraints (time, budget, scope or performance) set
by the customer or the project sponsor, these constraints require particular monitoring. Once
baseline is set for schedule and budget the ongoing current status can be compared and
evaluated against these original estimations. During the duration of the project cumulative
work or budget can be broken down by time. (Pinto 2007, 410-412)
2.7.1 Reviews
Project Performance Reviews are held periodically during the running of the project to asses
and compare cost performance, schedule activities, planned budget and milestones. Actual
performance is analysed and compared to the planned or expected performance. Also a trend
analysis can be done where project performance over time is analysed to determine whether
performance is weakening or improving. (PMI 2004, 176)
Kerzner (2006, 238) mentions three types of reviews; project team, executive management
and customer review meetings. Meetings can be held in a variety of timely manner such as
weekly, alternate weeks, monthly, quarterly and so on. Most project teams hold regular
meetings to keep the project manager and the project team informed in current issues and
the project status. Executive management most often require monthly status review
meetings. Customer reviews are often the most critical and require preparation in advance.
(Kerzner 2006, 238-239)
In complex project review gates are held to close a certain phase in the project. The review
gates are usually scheduled as milestones in the project schedule. The gates are determined
based on deliverables and activities that need to be completed. These periodical evaluations
have to be carried out in order to proceed to the next phase of the project and are often a
requirement in the contract. (Pinto 2007, 415)
Page 28
28
2.7.2 Tracking Gantt
Tracking Gantt is a form of Gantt chart where project schedule performance can be
evaluated at a given date during the project. The tracking Gantt chart offers a visual graph to
detect positive or negative deviation of the current situation to the originally planned
baseline. (Pinto 2007, 416-417)
The tracking Gantt chart is easy to interpret and it can be updated quickly to give a real-time
control of the project. The chart does show when activities are ahead or behind the schedule
but as a drawback it does not offer information to the underlying cause of this kind of
activity slippage. (Pinto 2007, 417) Projections to the future can be difficult with the
tracking Gantt chart. When an ongoing activity is behind schedule on a given date it is
difficult to tell whether the activity is not going to be completed before the finish date or
whether it is just momentarily late and can still be completed before the finish date.
2.7.3 Milestone Analysis
Milestones are events or dates in the project where significant deliverables are completed.
The deliverables can be one single task or a combination of several different tasks.
Milestones give indication to the project team of the current status of the project and
especially in multiyear projects provide a good picture of the overall progress. (Pinto 2007,
415)
2.7.4 S-curve Analysis
The classic S-curve displays graphically the actual accumulated amount of cost or work
against time. The analysis is done for both the actual cost or work and the planned cost or
work. Any variation between actual and planned can potentially signify a problem.
Simplicity is the biggest advantage with the S-curve analysis. It offers real-time information
of the project status in a timely manner. (Pinto 2007, 412-413)
Simplicity can also be considered as the biggest downfall of the S-curve. The information it
provides is not always easily interpreted. The S-curve provides an easy way to identify
Page 29
29
positive or negative variance but does not give any indication as to the cause of this
variance. (Pinto 2007, 413)
2.8 Project Closeout and Termination The final stage of a project is termination. Projects are one-off with a definite ending where
the termination is planned from the beginning. The termination is a series of events where
project acceptance is handed over to the customer or project sponsor and various project
documents and records are finalised, revised and completed. (Pinto 2007, 445)
Pinto (2007, 445-446) lists four different reasons for project termination:
• Termination by extinction –the project can be concluded unsuccessfully or
successfully. In successful termination by extinction the project has been handed
over to the customer and all termination activities are conducted. The final budget is
audited and team members disbanded.
• Termination by addition – the project has been institutionalised as a part of the
parent organisation. The project team has been in a way promoted to a formal part of
the organisation’s structure.
• Termination by integration – the project resources, with the project team included,
are reintegrated within the existing structure in the organisation to perform other
duties or to wait for new project assignments. There is a chance that the project team
members have no desire to go back to their old functional department duties and the
risk of loosing key organisational members is significant.
• Termination by starvation – the project can starve out for a number of different
reasons. Due to budget cuts some projects may be kept on the books waiting for
better economic times to be reactivated. Some projects may be kept on file for
political reasons where the organisation has no real intent for the project to succeed
or ever finish. Starving a project may even to be a conscious decision to neglect and
slowly decrease the project budget resulting in making the project unviable.
Even though project termination can be conducted for a variety of reasons, the termination
activities should be included already in the planning phase. The termination activities can
begin after all the project execution phase is completed and the results are accepted by the
Page 30
30
customer. When the project is completed it must be verified by the project that deliverables
in the contract have been supplied to the customer or the project sponsor. These deliverables
can include documents such as training and instruction manuals, drawings, reports or as-
built documentation, equipment, software and data. The documentation is to be properly
organised and filed appropriately for future reference. (Gido & Clements 2003, 84)
All payments have to be received and paid by the project organisation. Once the final
payments are made the project’s final budget can be audited closed. Evaluations of
performance can be held during the termination process. The evaluations should be held
both internally within the project organisation as well as between the project organisation
and the customer or project sponsor. The purpose is to provide valuable information on
performance, find out whether anticipated benefits were achieved and receive suggestions
for future projects. (Gido & Clements 2003, 86)
In some projects termination is required before the project is completed and before it was
originally planned. Early termination can be caused by a number of reasons such as for
example circumstances where the benefits from the project are exceeded by costs, customer
dissatisfaction or when the expected results of the project are found to be unrealistic or
otherwise unattainable. (Gido & Clements 2003, 91)
Page 31
31
3. Company Overview The development work was conducted for the case company Metso in the Power business
unit’s Capital Projects business line. In the following chapter the company is further
introduced and the organisation presented.
3.1 Metso Corporation Metso Corporation is a worldwide deliverer of technology and services in pulp and paper,
mining, construction, power generation, oil and gas and recycling industries. The customers
are typically industrial companies such as paper companies, mining companies and energy
companies. Multiyear project deliveries are typically in pulp and paper industries, mining
and power generation. Deliveries to the construction, oil and gas industries are mostly
smaller package solutions and individual equipment components. The services business
totals up to over 40 percent of the net sales. (Metso Corporation 2010)
Figure 11: Net sales by customer industry in 2009 (Metso Corporation 2010)
Metso traditionally receives orders from the Western Europe, North America, Japan,
Australia and New Zealand. In 2009 48 percent of received orders came from emerging
markets such as Eastern Europe, South and Central America, the Middle East and Africa and
Asia-Pacific (excluding Japan, Australia and New Zealand). Focus on investment is now
more clearly in these emerging markets. (Metso Corporation 2010)
Page 32
Fig
Me
ove
ope
3.2 MeMe
Min
line
Aut
des
pap
rec
ma
Me
del
des
pro
cor
Bra
pro
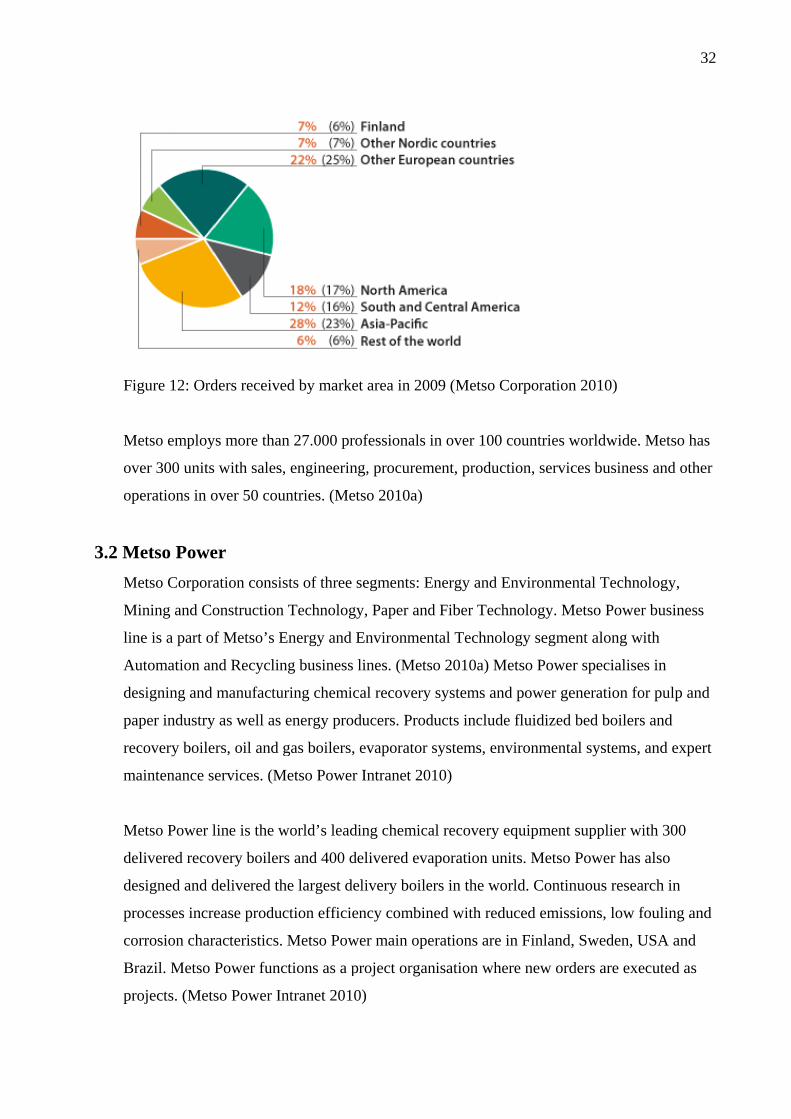
gure 12: Ord
etso employ
er 300 units
erations in o
etso Poweetso Corpora
ning and Co
e is a part of
tomation an
signing and
per industry
overy boile
intenance s
etso Power l
ivered recov
signed and d
ocesses incre
rrosion char
azil. Metso
ojects. (Mets
ders receive
ys more than
with sales,
over 50 coun
er ation consis
onstruction
f Metso’s E
nd Recyclin
manufactur
y as well as e
ers, oil and g
ervices. (M
line is the w
very boilers
delivered th
ease produc
racteristics.
Power func
so Power In
ed by marke
n 27.000 pro
engineerin
ntries. (Met
sts of three s
Technology
Energy and E
ng business
ring chemic
energy prod
gas boilers,
Metso Power
world’s lead
s and 400 de
he largest de
ction efficie
Metso Pow
ctions as a p
ntranet 2010
et area in 20
ofessionals
g, procurem
tso 2010a)
segments: E
y, Paper and
Environmen
lines. (Mets
cal recovery
ducers. Prod
evaporator
Intranet 20
ing chemica
elivered eva
elivery boile
ency combin
wer main ope
project organ
0)
009 (Metso C
in over 100
ment, produc
Energy and
d Fiber Tec
ntal Techno
so 2010a) M
y systems an
ducts includ
systems, en
010)
al recovery
aporation un
ers in the wo
ned with red
erations are
nisation wh
Corporation
0 countries w
ction, servic
Environmen
hnology. M
ology segme
Metso Powe
nd power ge
de fluidized
nvironmenta
equipment
nits. Metso
orld. Contin
duced emiss
e in Finland,
here new ord
n 2010)
worldwide.
ces business
ntal Techno
Metso Power
ent along wi
r specialise
eneration fo
bed boilers
al systems,
supplier wi
Power has
nuous resea
sions, low f
, Sweden, U
ders are exe
32
Metso has
s and other
ology,
r business
ith
s in
or pulp and
s and
and expert
ith 300
also
arch in
fouling and
USA and
ecuted as
2
Page 33
Fig
gure 13: Jämmsänkosken
Voima powwer plant (MMetso 2010b
b)
333
Page 34
34
4. Conclusions
The purpose of this thesis was to develop the currently used Master Schedule Template in
the case company. The first objective of the development work was to develop the schedule
template into a functional tool in creating coherent project schedules. The second objective
was to create a chain of activities that are easy to cross-check based on the company WBS
logic. Both objectives were met during the development work and the result was a schedule
template that has been implemented in new projects.
The theoretical study involved project management as a whole since scheduling is closely
related to all project management areas. The main focus however was on planning and
scheduling. Special attention was also given to Work Breakdown Structure because it was
the key factor in the schedule template development process. Scheduling is a challenging
area in project management and success in scheduling is directly linked to the success of the
project. The literature offered different ways and methods on how to plan and schedule a
project but the overall logic was similar. It was clear that there is a strong link between the
WBS and scheduling. The WBS can have a number of different structures or categorisations
depending on the needs of the company. The WBS final level work packages are divided
into specific scheduling activities. These scheduling activities form the project schedule.
The case company project management analysis and the development work are confidential
and not included in the public version of the Final Thesis.
Page 35
35
Bibliography Gido, Jack and Clements, James P. 2003. Successful Project Management. 2nd ed. Mason
(Ohio): Thomson South-Western. Haugan, Gregory T. 2002. Effective work breakdown structures. Vienna (Virginia):
Management Concepts. Kerzner, Harold 2006. Project Management: A Systems Approach to Planning, Scheduling,
and Controlling. 9th ed. Hoboken (New Jersey): John Wiley & Sons.
Lewis, James P. 2002. Fundamentals of Project Management: Developing Core Competencies to Help Outperform the Competition. 2nd ed. New York (NY): American Management Association.
Metso Corporation 2010. Metso Annual Report 2009. Lönnberg Painot Oy
Metso 2010a Metso in brief. [online]. [referred to 17.3.2010] Available:
http://www.metso.com/corporation/about_eng.nsf/WebWID/WTB-041026-2256F-55957?OpenDocument
Metso 2010b Sensodec 6S: Averts unexpected downtime at JaVo. [online]. [referred to
17.3.2010] Available: http://www.metso.com/Automation/magazinebank.nsf/Resource/autom_1_2004_p10-p12/$File/autom_1_2004_p10-p12.pdf [Published in print: Automation No 1, 2004]
Metso Power Intranet 2010 About us. [online]. [referred to 17.3.2010] Available:
http://power.metso.com/
Pelin, Risto 2008. Projektihallinnan käsikirja. 5th ed. Jyväskylä: Gummerus Kirjapaino Oy.
Pinto, Jeffrey K. 2007. Project Management: Achieving Competitive Advantage. Upper Saddle River (New Jersey): Pearson/Prentice Hall.
Project Management Institute (PMI) 2004. A Guide to the Project Management Body of
Knowledge: PMBOK Guide. 3rd ed. Newtown Square (Pennsylvania): PMI. Young, Trevor L. 2007. The Handbook of Project Management: A Practical Guide to
Effective Policies, Techniques and Processes. Rev. 2nd ed. London: Kogan Page Ltd.