i Developing Methodologies for Sustainable Groundwater Management in sub-Saharan Africa: a case study of the Chad Basin around Maiduguri, Nigeria Ali Bakari Mohammed B.Sc., M.Sc. A thesis submitted in partial fulfilment of the requirements for the degree of Doctor of Philosophy in the School of Science, Engineering & Technology, Abertay University, Dundee, United Kingdom February, 2017
Transcript
i
Developing Methodologies for Sustainable Groundwater Management in sub-Saharan Africa: a case study of the Chad Basin
around Maiduguri, Nigeria
Ali Bakari Mohammed B.Sc., M.Sc.
A thesis submitted in partial fulfilment of the requirements for the degree of Doctor of Philosophy in the School of Science, Engineering & Technology, Abertay University,
Dundee, United Kingdom
February, 2017
ii
ABSTRACT
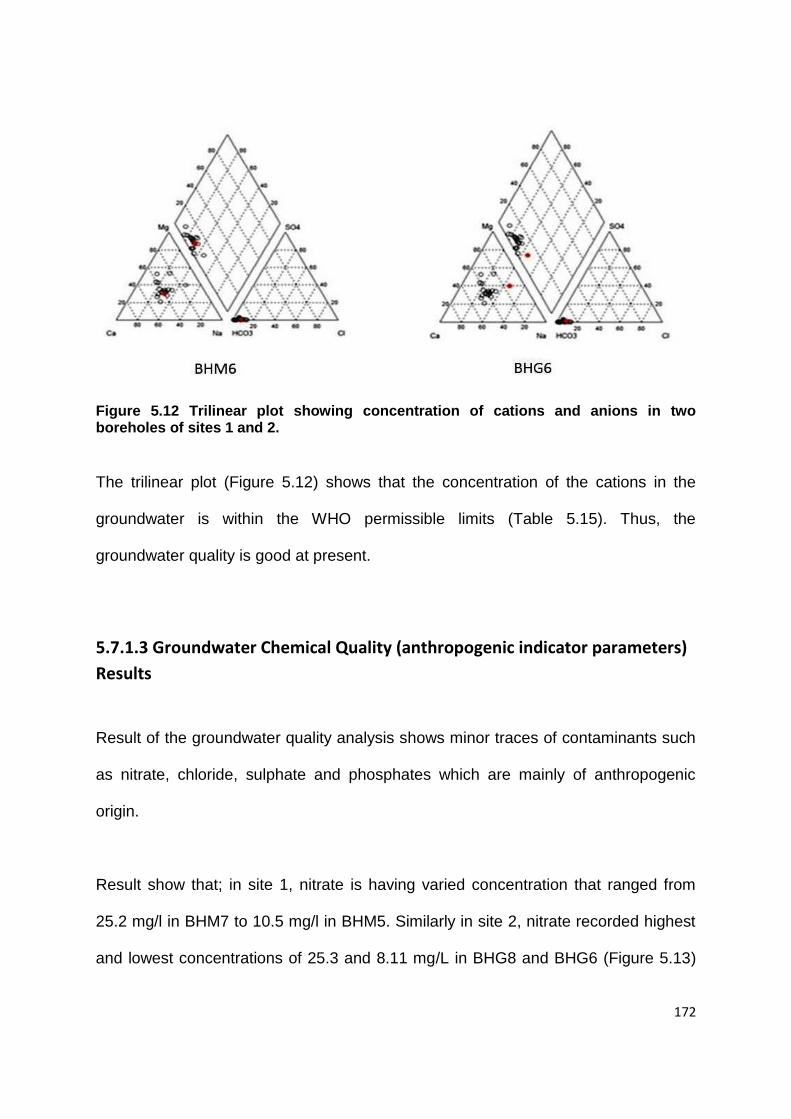
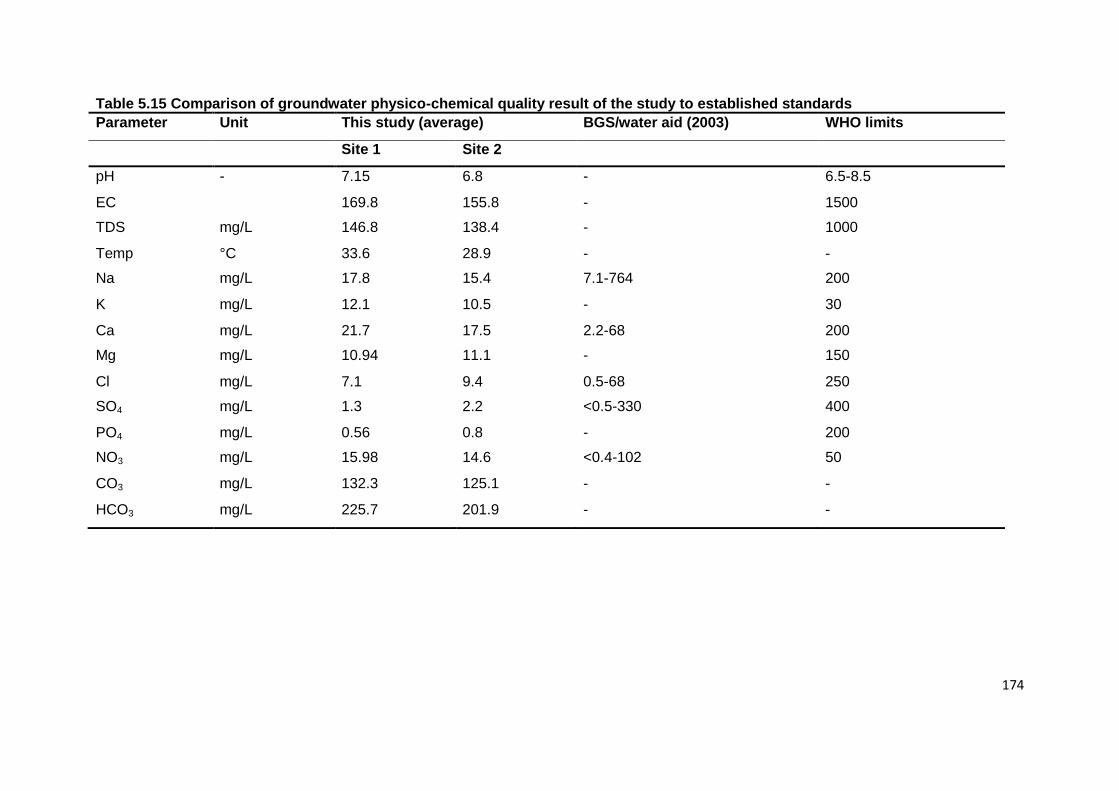
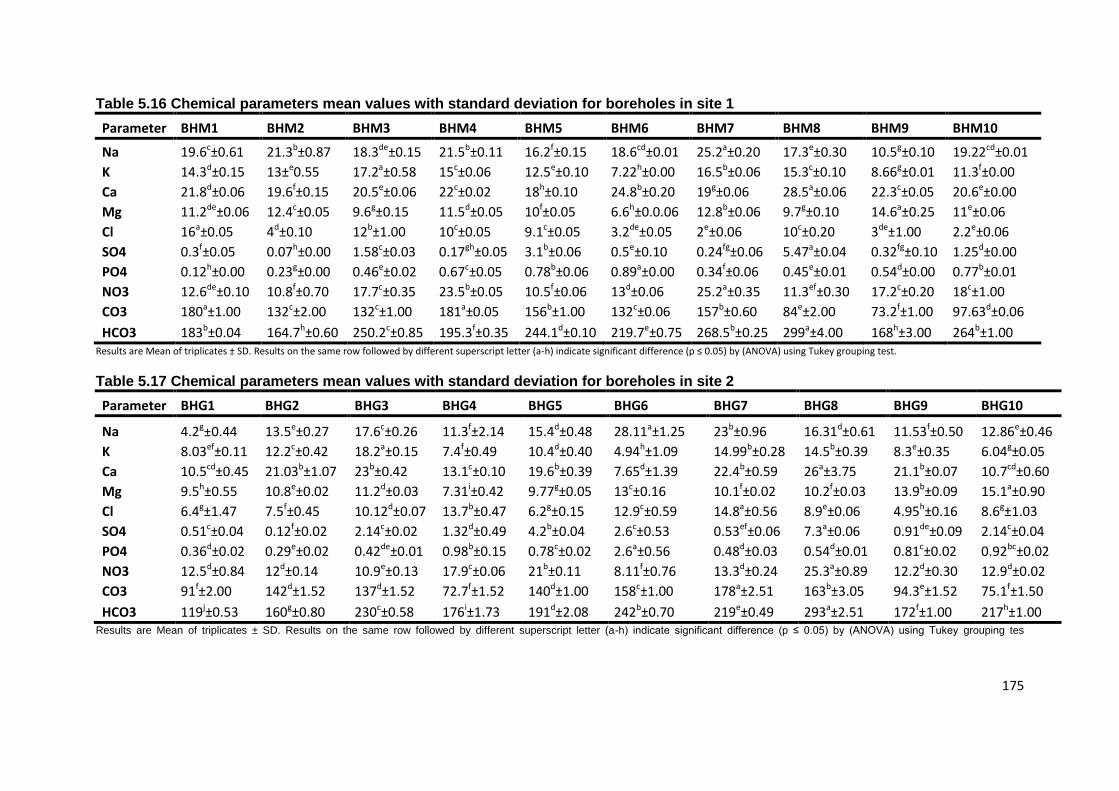
This study developed sustainable groundwater management methodology applicable to sedimentary environments in sub-Saharan Africa, taking the Chad basin, North-eastern Nigeria as a case study. The study employed integrated methodological approaches and is divided into three major interrelated phases. The first phase of the study carried out a stakeholder analysis and identified the stakeholders that are responsible for and those affected by problems of groundwater contamination as well as those that have formal authority and influence in addressing the situation. A total of 22 stakeholder groups comprised of; 10 government agencies, 4 water user groups, 3 professional organisations, 3 civil society organisations, an NGO, and a research institution were identified and engaged at the tactical level via interviews, focus groups, and household surveys. The second phase evaluated the various above ground pollution sources and assessed their impact on groundwater, and carried out physico-chemical investigation of groundwater samples collected from selected shallow boreholes across the study area in determining the extent of contamination from the aforesaid pollution sources. The third phase of the study carried out modelling of chloride contamination due to pit latrine impacts and developed guidelines for mitigating the negative impact of on-site sanitation systems on the underlying aquifer. The results of the stakeholder engagement show that knowledge about groundwater contamination is good among the strategic stakeholders and limited among the primary stakeholders. Also, most interviewees are concerned about problems of contamination and are keen to be part of addressing the situation, a handful of focus group participants, and the survey respondents are equally concerned about this issue. Also, all the stakeholder categories suggested that community participation, increase in investment, controlling waste from source, and strict legislations are the possible ways of addressing the existing problems of groundwater management in the study area. Overall, social, economic, and cultural influences are the factors responsible for the prevalence of the pit latrines and open dumpsites. Risk matrix result shows that pit latrines, dumpsites, and other non-point sources are the potential sources of pollution based on the order of their magnitude. Geological material constitutes the lowest risks. Groundwater Physico-chemical analyses result show that the groundwater in the study area ranged from alkaline (pH 6.61-7.57) to slightly alkaline-acidic (6.2-7.31). The distribution of non-anthropogenic parameters such as; Na2+, Ca2+, K+, and Mg2+ across all the boreholes varied significantly (p<0.05; significant level of 95% and confidence interval of 0.05). Also, the concentrations of anthropogenic indicator parameters such as; Cl-, NO3
-, SO42-, and PO4
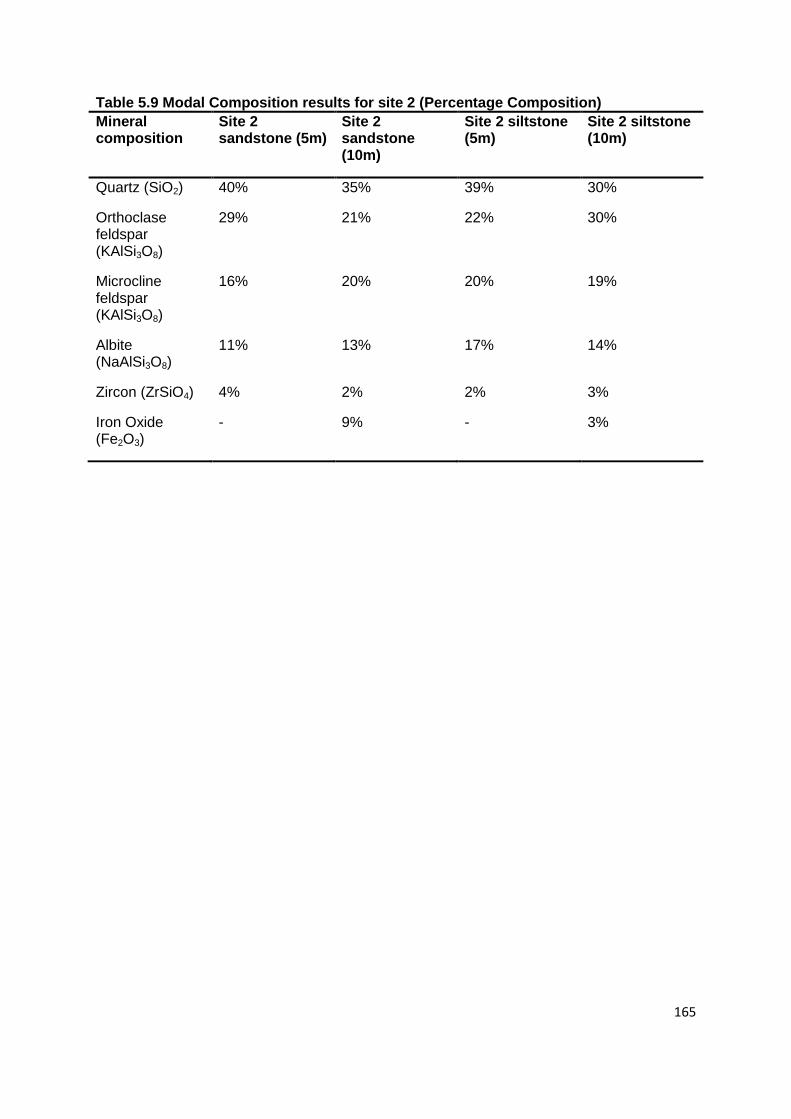
3- in the groundwater are correlated with the above ground pollution sources; their distribution across the boreholes of the study area varied significantly (p<0.05). Furthermore, the groundwater is currently of good quality for consumption. Equally, Granulometric and mineral content analyses of the sediment were carried out to determine the sediments particle sizes and the distribution of their contained minerals. Results show that the sediments particles ranged between 1mm-<63µm while minerals such as Quartz, Feldspar, Albite, Zircon and Iron Oxide are dominant. The alternative guidelines developed by this study can be applied across the major sedimentary basins of Nigeria. The study provides baseline data for achieving sustainable groundwater management in sub-Saharan Africa region. The concept outlined in this thesis can be replicated in other international case studies across Africa.
iii
DEDICATION
To my Late Daughter
Fatima Ali (Ummul-Khair)
Of Blessed Memory
iv
AUTHOR’S DECLARATION
By the Candidate:
I ALI BAKARI MOHAMMED declare that this thesis is my own, unaided work. It is
being submitted for the Degree of Doctor of Philosophy at the Abertay University,
Dundee, United Kingdom. It has not been submitted before for any degree or
examination in any other University.
Signed:
_____________________________________
By the supervisors:
It is hereby declared that the work presented in this Thesis is the work of the
candidate ALI BAKARI MOHAMMED, and that in carrying out this work, the
conditions of the relevant Ordinance and Regulations have been fulfilled.
Signed:
__________________
Professor Joseph Akunna
____________________
Professor David Blackwood
v
ACKNOWLEDGEMENTS
First and foremost, I would like to express my extreme gratitude to Professor Chris
Jefferies for supervising two-third of this work before his retirement, and Professors
Joseph Akunna and David Blackwood for their tremendous supervision, patience,
and guidance. The trio‘s insight and scientific guidance are deeply appreciated, I feel
privileged to have been trained under their supervision. Also, I am thankful to my
external examiners Dr Derek Clarke (University of Southampton), former internal
examiner Professor Wilfred Otten (Cranfield University) and the newly appointed
internal examiner Dr Kehinde Oduyemi (Abertay University).
I am very grateful to the Nigerian Petroleum Technology Development Fund (PTDF)
for funding this study. Also, my special thanks to Alhaji Mohammed Kyari Dikwa and
His Excellency Ambassador Babagana Kingibe for their tremendous support.
Special thanks to my colleagues and friends for their kindness and encouragement.
Many people, too numerous to mention here, have contributed in many ways to bring
this work to fruition. I request Allah to reciprocate to them gracefully, and to make
this piece of work beneficial to human intellectual development.
Last but not least, I owe very much to my family members who have always stood by
my side, their love and prayers were the energy drive throughout these years. My
deepest appreciation goes to all of them, especially my mother, father, and all the
siblings. Special thanks go to my wife (Aisha) for the invaluable support,
encouragement, and love you have given me throughout our union. You all mean a
lot to me, and a very many thanks to you all.
vi
AUD-PERMISSIOIN TO COPY
In submitting this thesis to the Abertay University, Dundee, I understand that I am
giving permission for it to be made available for use in accordance with the
regulations of the University Library for the time being in force, subject to any
copyright vested in the work not being affected thereby.
……………………………………………………..
…………………………………………..day of………………20……………………
vii
ACRONYMS AND ABBREVIATIONS
AICD Africa Infrastructure Country Diagnostic
BGS British Geological Survey
BHG Borehole in Gwange
BHM Borehole in Moduganari
BOHA Borno State House of Assembly
BOSEPA Borno State Environment Protection Agency
BOSG Borno State Government
CSO Civil Society Organisation
DEFRA Department for Environment Food and Rural Affairs
EC Electrical Conductivity
EC European Commission
ECOWAS Economic Community of West African States
EEA European Economic Area
EEC European Economic Council
ESRI Environmental Systems Research Institute
EU European Union
FG Focus Group
FGN Federal Government of Nigeria
FMWR Federal Ministry of Water Resources
GBR General Binding Rules
GDQW Guidelines for Drinking Water Quality
GIS Geographic Information System
GPS Global Positioning System
HOD Head of Department
IAH International Association of Hydrogeologists
IAHS International Hydrological Society
IWRM Integrated Water Resources Management
viii
LA Learning Alliances
LCBC Lake Chad Basin Commission
LGA Local Government Area
MDGs Millennium Development Goals
MMC Maiduguri Metropolitan Council
NBS Nigeria Bureau of Statistics
NGO Non-Governmental Organisation
NGWA National Groundwater Association
NPC National Population Commission
NUJ Nigeria Union of Journalists
NUT Nigeria Union of Teachers
RBDA River Basin Development Agency
RGS Royal Geographical Society
SDGs Sustainable Development Goals
SEPA Scottish Environment Protection Agency
SNM Strategic Niche Management
SSA Sub-Saharan Africa
SWA State Water Agency
TDS Total Dissolved Solids
UK United Kingdom
UN United Nations
UNDP United Nations Development Programme
UNEP United Nations Environment Programme
UNICEF United Nations International Children Endowment Fund
USA United States of America
USAID United States Aid Agency
USD United States Dollars
USEPA United Sates Environment Protection Agency
USGS United States Geological Survey
ix
WACDEP Water Climate and Development
WASH Water Sanitation and Hygiene
WFD Water Framework Directives
WHO World Health Organisation
x
Table of Contents
Abstract……………………………………………………………………………… Ii
Dedication…………………………………………………………………………… Iii
Author’s Declaration……………………………………………………………… Iv
AUD-Permission to Copy………………………………………………………… V
Acronyms and Abbreviations…………………………………………………… Vi
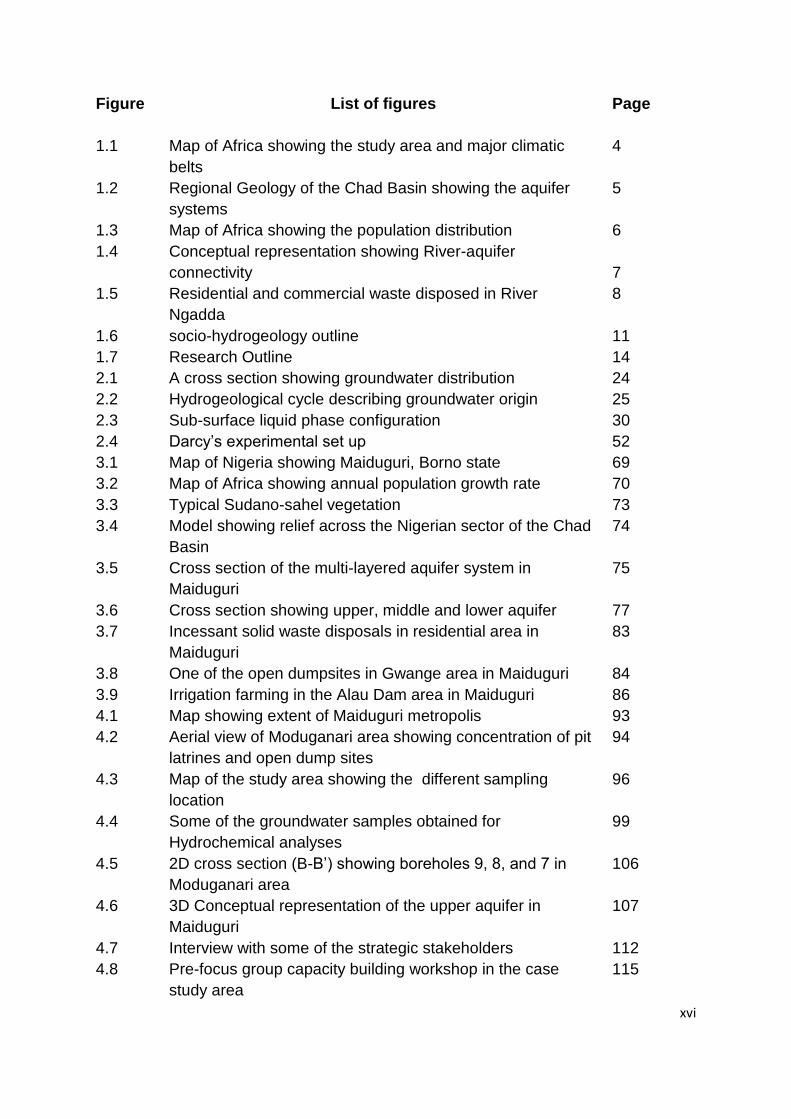
List of Figures……………………………………………………………………… Xvi
List of Tables………………………………………………………………………. Xvii
AUTHOR’S DECLARATION ............................................................................................... iv
Major research output ...................................................................................................... xx
3.3 Climate and Vegetation ........................................................................................................ 70
3.4 Relief and Drainage ............................................................................................................... 72
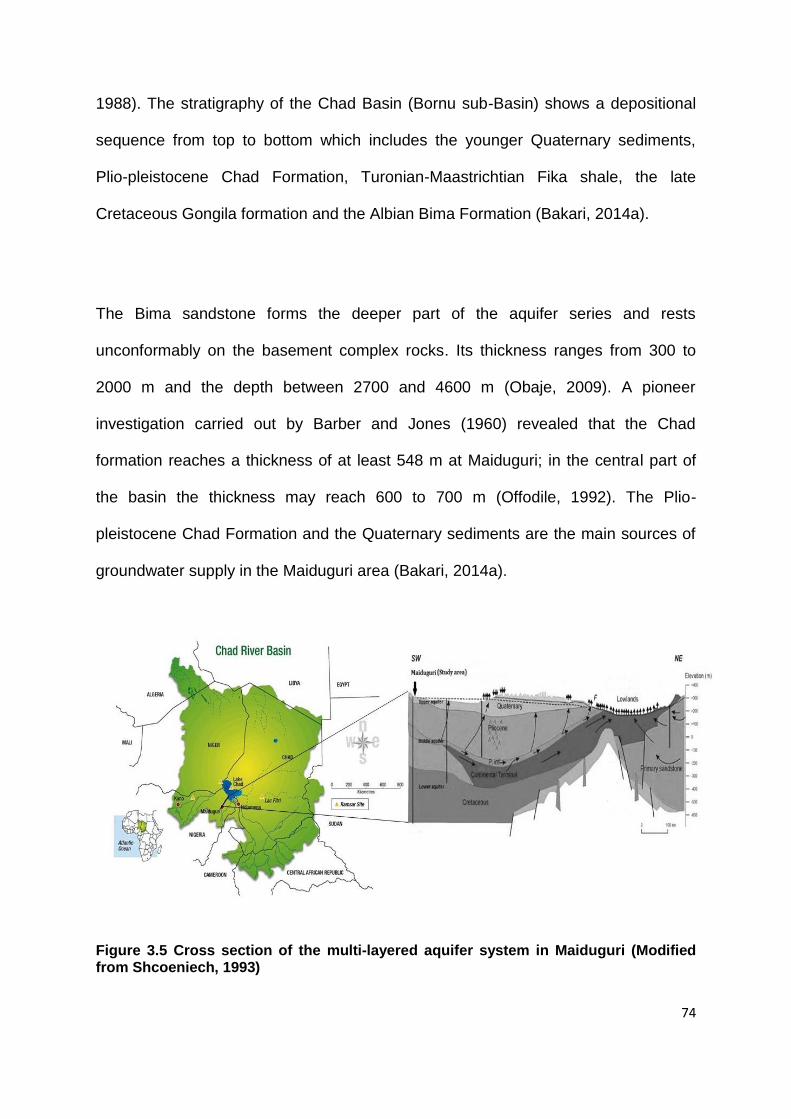
3.5 Geology and Hydrogeology of the Study Area ..................................................................... 73
3.6 Status of Water Supply Provisions in Maiduguri Metropolis ............................................... 79
xii
3.7 Environmental Problems in Maiduguri Metropolis .............................................................. 79
3.8 Potential Sources of pollution in Maiduguri ............................................................................... 80
3.8.1 Open Dumpsites ........................................................................................................................................ 82
3.8.2 Pit Latrines and Septic Tanks .............................................................................................................. 83
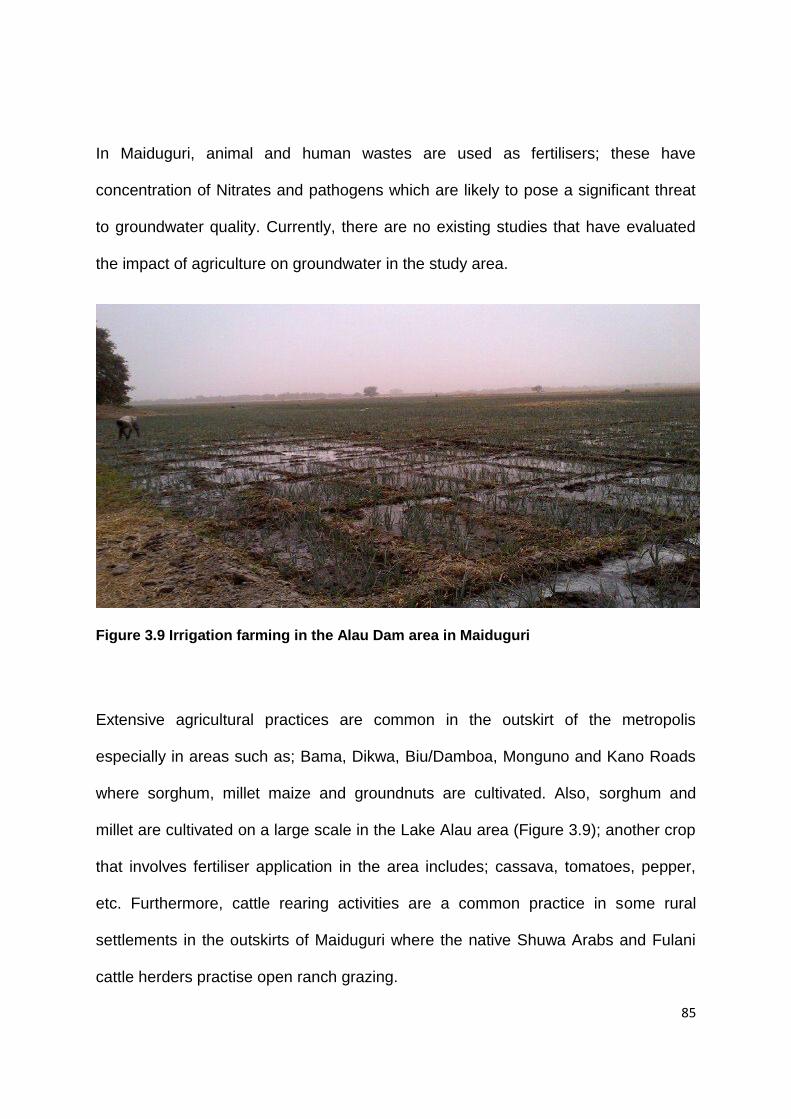
3.8.3 Cattle Markets and Abattoirs ............................................................................................................... 84
5.4 Socio-demographic characteristics of the households surveyed in the study area ................. 146
5.4.1 Sex of Respondents ................................................................................................................................ 146
5.4.3 Age of the Respondents ........................................................................................................................ 146
5.4.4 Educational attainment of the respondents ................................................................................ 147
5.4.5 Income of the households surveyed ............................................................................................... 147
xiv
5.4.6 Employment status of Respondents ............................................................................................... 147
5.8.1 Discussion of social aspects ................................................................................................................ 177
5.8.2 Discussion on hydrogeological aspects ......................................................................................... 184
5.9 Summary and conclusions ........................................................................................................ 189
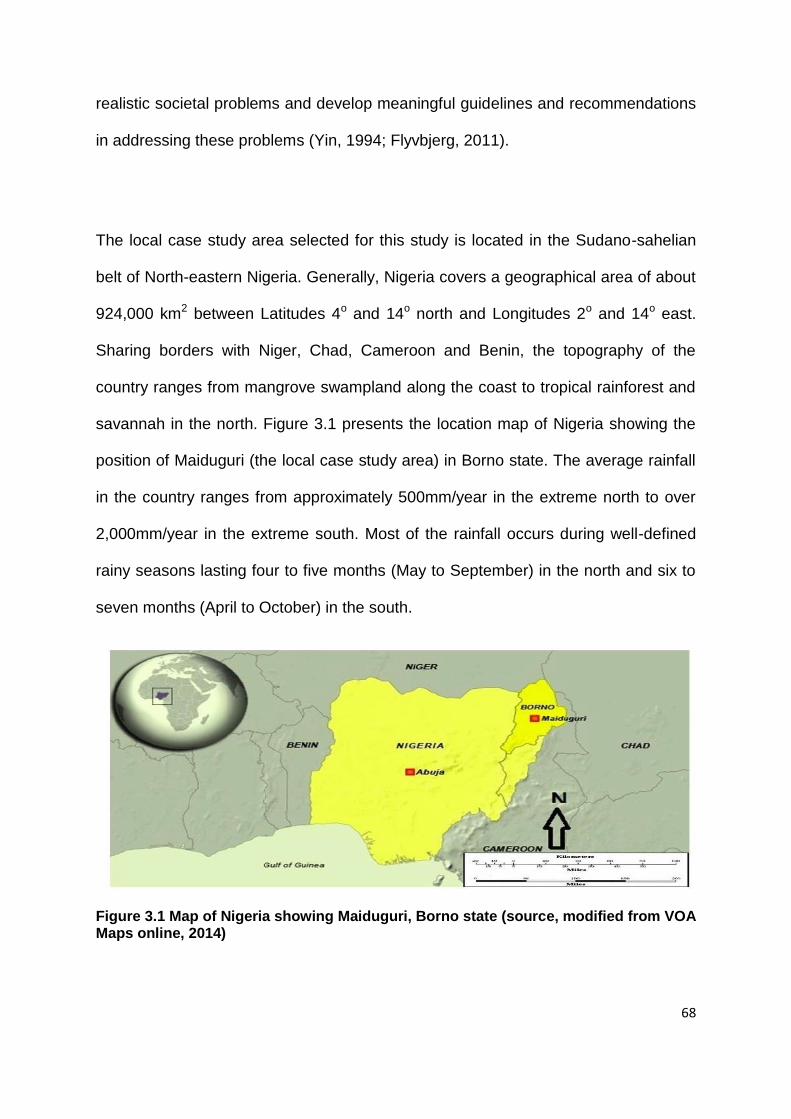
justification for the selection of this region is because it is one of the most water
stressed region in Africa (Figure 1.1), and it is grossly affected by environmental
problems attributed to above ground anthropogenic activities (AICD, 2011).
Secondly, another important factor that led to the selection of this case study area is
because of its socio-economic significance in sub-Saharan Africa region; it serves as
the commercial gateway of the entire Sahel region (area with the highest
anthropogenic pressure due to economic activities) hence, it is an excellent
representative of the regional generic problems attributed to socio-demographic
impacts across Africa.
This sub-region was chosen to provide insights into the broader problem of
groundwater contamination across sub-Saharan Africa region. Also, geological and
socio-economic characteristics are the key parameters that guided the selection of
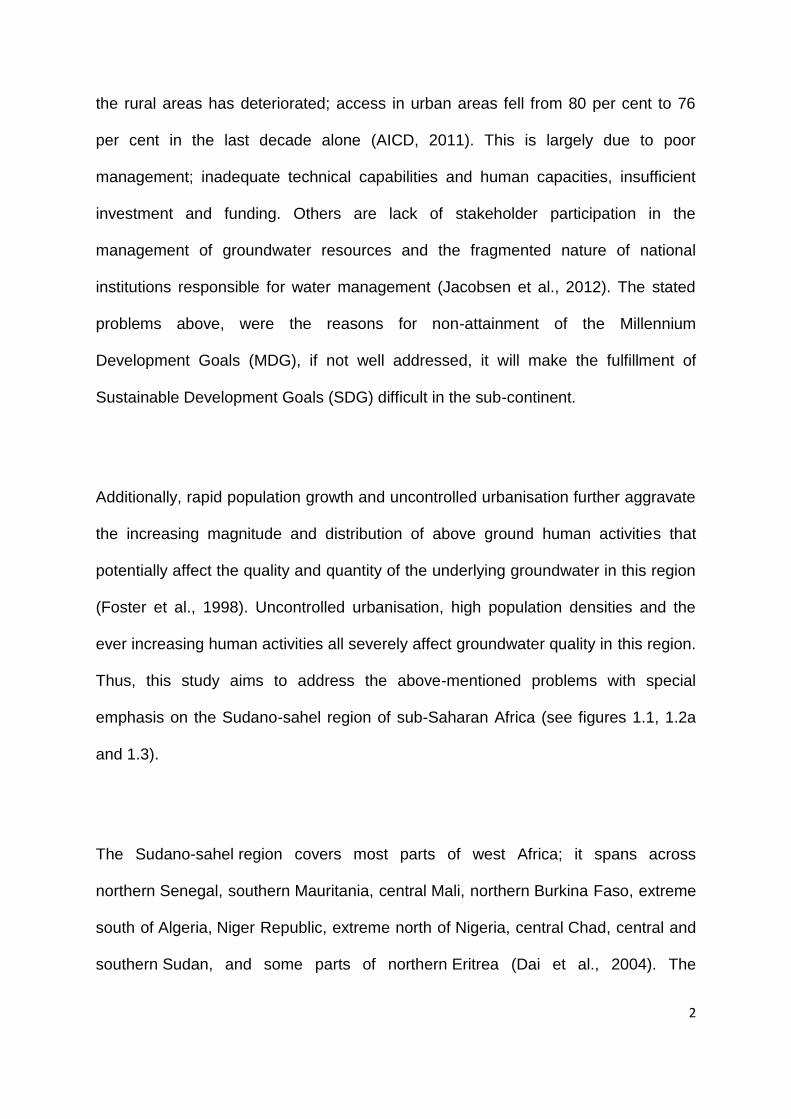
the case study area. Geologically, the Chad Basin is the largest sedimentary Basin
in the region with relatively uniform geology (Figure 1.2a &b). Hence, the study area
was selected to be representative of the larger sub-Saharan Africa region in terms of
geology, land use, demography, climatic and socio-economic conditions.
4
Figure 1.1 Map of Africa showing the study area and the major climatic belts (African
Atlas, 2010)
5
Figure 1.2a (upper) Regional Geology of the Chad Basin showing the SW-NE trend. Figure 1.2b (lower) cross section of (SW-NE) the multi-layered aquifer system of the Chad Basin. Modified from Schneider & Wolff (1992)
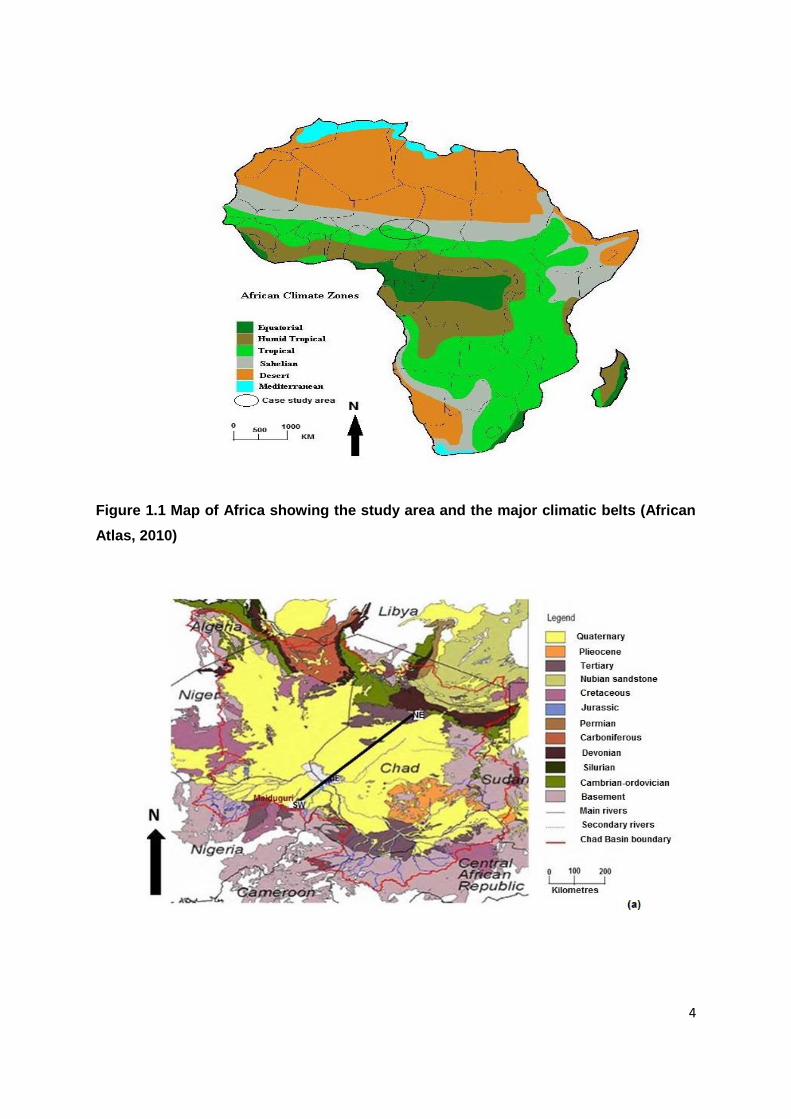
Socio-economically, Maiduguri metropolis is the largest city in the Nigerian sector of
the Sudano-sahel region of West Africa. Thus, they were selected to represent a
wide range of cases occurring in the region. Also, it is important to note that the
Sudano-sahel region is an area with uniform climate and vegetation (Figure 1.1),
similar hydrogeology, and comparable population distribution (Figure 1.3). Thus,
Maiduguri metropolis is no exception and it will be a very vital representative case
study for the whole region.
6
Figure 1.3 Map of Africa showing the Population distribution across the Sudano-sahel
region. Modified from World Bank (2012)
The case study methodology adopted by this study is good for understanding
contemporary societal problems that cannot be manipulated in real sense. Also, this
case study will be a useful tool for investigating the preliminary causes of
groundwater contamination which will serve as a basis for the development of a
feasible and a realistic groundwater protection framework in sub-Saharan Africa
region. Lastly, this case study will be useful in advancing the existing knowledge and
will proffer solutions to the existing and presumed future problems of groundwater
contamination in the region as no such study exists in the case study area.
7
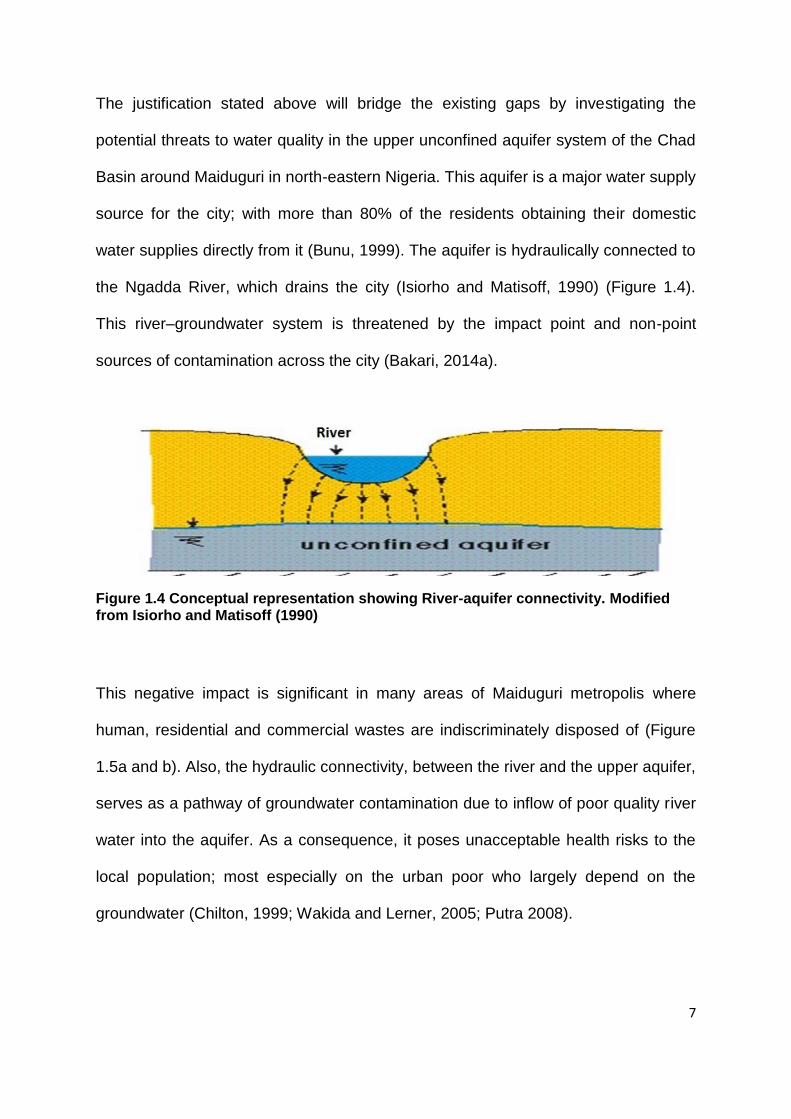
The justification stated above will bridge the existing gaps by investigating the
potential threats to water quality in the upper unconfined aquifer system of the Chad
Basin around Maiduguri in north-eastern Nigeria. This aquifer is a major water supply
source for the city; with more than 80% of the residents obtaining their domestic
water supplies directly from it (Bunu, 1999). The aquifer is hydraulically connected to
the Ngadda River, which drains the city (Isiorho and Matisoff, 1990) (Figure 1.4).
This river–groundwater system is threatened by the impact point and non-point
sources of contamination across the city (Bakari, 2014a).
Figure 1.4 Conceptual representation showing River-aquifer connectivity. Modified from Isiorho and Matisoff (1990)
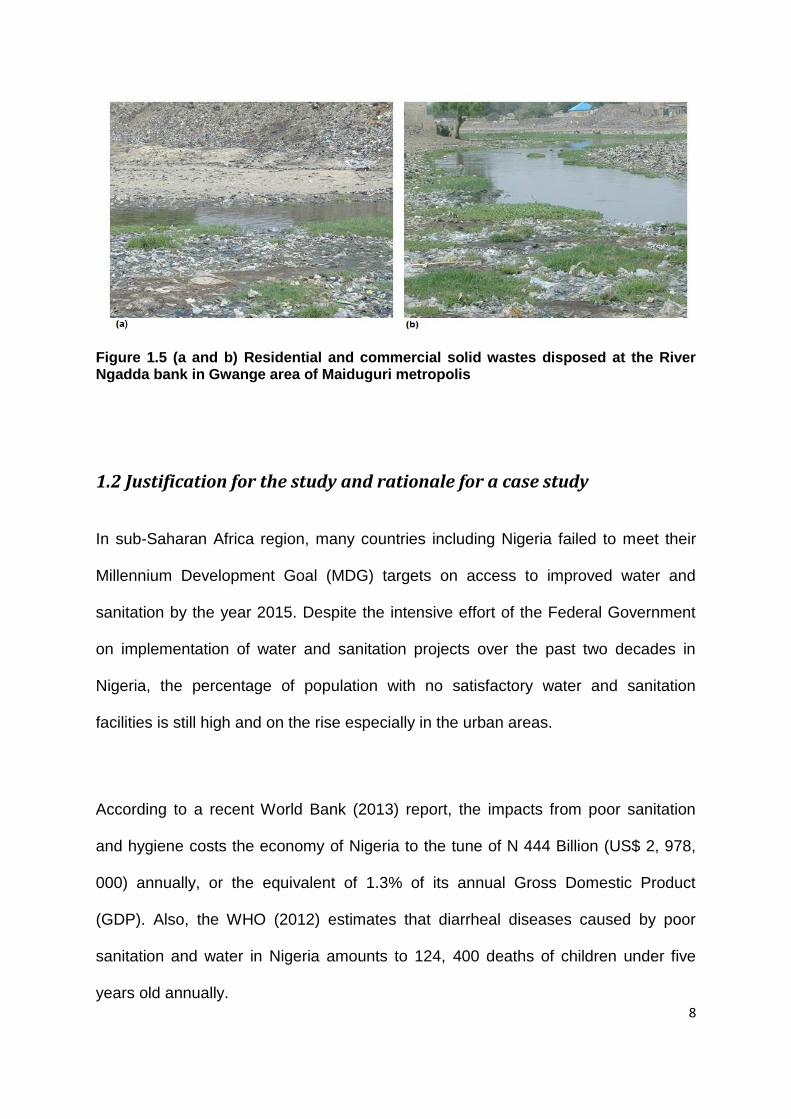
This negative impact is significant in many areas of Maiduguri metropolis where
human, residential and commercial wastes are indiscriminately disposed of (Figure
1.5a and b). Also, the hydraulic connectivity, between the river and the upper aquifer,
serves as a pathway of groundwater contamination due to inflow of poor quality river
water into the aquifer. As a consequence, it poses unacceptable health risks to the
local population; most especially on the urban poor who largely depend on the
groundwater (Chilton, 1999; Wakida and Lerner, 2005; Putra 2008).
8
Figure 1.5 (a and b) Residential and commercial solid wastes disposed at the River Ngadda bank in Gwange area of Maiduguri metropolis
1.2 Justification for the study and rationale for a case study
In sub-Saharan Africa region, many countries including Nigeria failed to meet their
Millennium Development Goal (MDG) targets on access to improved water and
sanitation by the year 2015. Despite the intensive effort of the Federal Government
on implementation of water and sanitation projects over the past two decades in
Nigeria, the percentage of population with no satisfactory water and sanitation
facilities is still high and on the rise especially in the urban areas.
According to a recent World Bank (2013) report, the impacts from poor sanitation
and hygiene costs the economy of Nigeria to the tune of N 444 Billion (US$ 2, 978,
000) annually, or the equivalent of 1.3% of its annual Gross Domestic Product
(GDP). Also, the WHO (2012) estimates that diarrheal diseases caused by poor
sanitation and water in Nigeria amounts to 124, 400 deaths of children under five
years old annually.
9
In the study area, groundwater resources are facing significant pressure to provide
for the socio-economic needs of the growing population. Also, the inadequate
institutional framework, constraints in policy formulation and stakeholder exclusion in
decision making in the management of water resources have been identified as the
major limiting factors for the attainment of sustainable groundwater management in
the study area and the entire region (Adelana, 2006). Also, the approaches to
groundwater management in the case study area is inadequate, guidelines for
mitigating the impacts of onsite sanitation systems on groundwater are non-existent.
Furthermore, the study comes at a critical moment when many countries across
Africa are transitioning from the Millennium Development Goals (MDGs) to the
Sustainable Development Goals (SDGs); in ensuring sustainable livelihood of their
citizenry.
Therefore, this study aims to address the abovementioned gaps by taking Maiduguri
metropolis as a local case study area in sub-Saharan Africa. This is because
guidelines for mitigating pollution sources impact on groundwater are absent in the
current management and operational system. Thus, effective strategies that will
ensure the achievement of the SDGs by 2030 are limited in the region. Strategies
that mitigate the negative impact of urbanisation and population growth are lacking.
These strategies if practically developed will be of paramount importance to the
region. These include sustainable strategies such as; mapping anthropogenic
pollution sources, identification and inclusion of key stakeholders in groundwater
management, educating and enhancing the capacities of water user groups, periodic
10
assessment and monitoring of water quality and the provision of adequate legislation
and enabling environment.
Additionally, the lack of relevant environmental, hydrogeological, and socio-
demographic data poses more challenge to the development of sustainable
groundwater management strategies in this region. In this respect, most
hydrogeological research in sub-Saharan Africa are focused on addressing technical
aspects of hydrogeology (Garduno et al., 2010; Foster et al., 2012; Taher et al.
2012) thereby giving less consideration to the social aspects. Consequently, the
increasing uncertainties linked to urbanisation and population growth remains a
critical issue on both local and global scale; therefore, it is necessary to adopt an
integrated science of the people and water, which will explore the impacts and
dynamics of human activities on the underlying groundwater systems.
Furthermore, the study was motivated by principle number 2 (Water development
and management should be based on a participatory approach, involving users,
planners and policy-makers at all levels) of the Dublin Statement on Water and
Sustainable Development 1992, and a more recent call in Hydrological Processes for
a new science of water in the new Scientific Decade 2013-2022 of the International
Association of Hydrological Science (IAHS) (Montanari et al., 2014). This is
dedicated to further the investigations on change in water system and society; it
treats humans and their activities as endogenous features of the water cycle.
Through water consumption, pollution and policies, it can address many and varied
11
water-related challenges in the Anthropocene (Sivapalan et al. 2011; Montanari et al.
2013; and Gober et al., 2014; Sivapalan et al., 2014; Re, 2016).
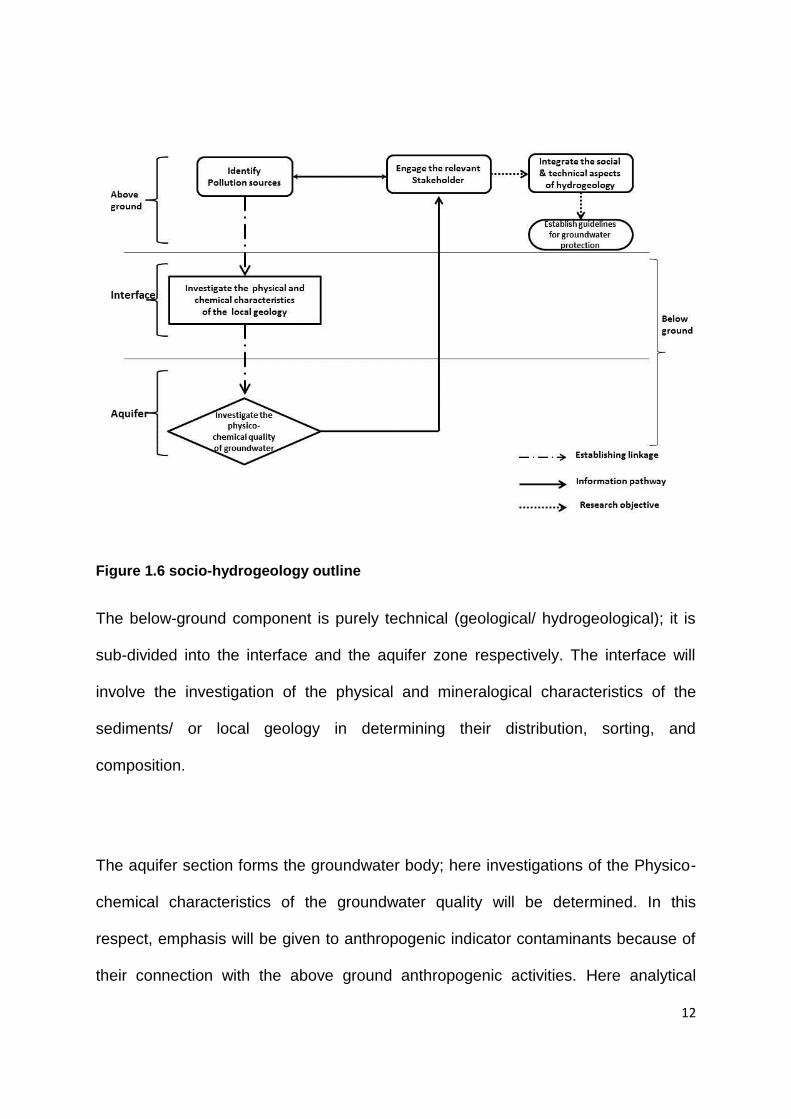
The examination of this integrated science will be achieved in this study by bringing
together the social and technical components of hydrogeology in addressing the
persistent societal problem of groundwater contamination; attributed to the impact of
above ground anthropogenic activities (Figure 1.6). As outlined (Figure 1.7), the
integrated methdology developed by this study has two major environments of
operation i.e. the above and the below ground environments respectively. The above
ground component is social sciences dominant, it constitutes the identification and
characterisation of pollution sources, engagement of relevant stakeholders for
groundwater protection decision-making, and the development of sustainable
framework; all take place at this level (above ground).
The social component allows the exploration of the sociological and socio-cultural
perceptions of the stakeholders towards the potential anthropogenic contaminant
sources. Additionally, the inclusion of stakeholders will enable the implementation of
management actions needed to ensure sustainability of groundwater resources.
Here, social tools or stakeholder participatory methods such as interviews, focus
group discussions and household questionnaires are employed in evaluating the
causes and remedies of groundwater contamination.
12
Figure 1.6 socio-hydrogeology outline
The below-ground component is purely technical (geological/ hydrogeological); it is
sub-divided into the interface and the aquifer zone respectively. The interface will
involve the investigation of the physical and mineralogical characteristics of the
sediments/ or local geology in determining their distribution, sorting, and
composition.
The aquifer section forms the groundwater body; here investigations of the Physico-
chemical characteristics of the groundwater quality will be determined. In this
respect, emphasis will be given to anthropogenic indicator contaminants because of
their connection with the above ground anthropogenic activities. Here analytical
13
techniques of hydro-geochemical analyses will be employed in determining the
extent of contamination across the study area. Also, a modelling of a selected
anthropogenic indicator parameter will be carried out in determining the future trends
of the contamination in the case study area. Particularly, chloride concentration will
be modelled to determine impact of pit latrine on groundwater. This is because
chloride is an excellent parameter that indicates faecal contamination.
The overall aim of the study will be achieved by tailoring the findings of both the
technical and social aspects in establishing sustainable guidelines that can be
practically applicable in the study area and other similar case studies across sub-
Saharan Africa region. These guidelines will provide realistic and practical solutions
to the existing problems in the case study area. The integrated and interdisciplinary
approach envisioned by this study is becoming increasingly accepted as a way
forward to addressing complex groundwater issues (Jakeman and Letcher, 2003;
Giupponi et al. 2006; Re, 2015).
The integrated approach adopted by this study will provide opportunity for
developing alternative guidelines for groundwater management, which cannot be
achieved from mono-disciplinary stances alone. In this respect, Croke et al. (2014)
have combined hydrological modelling with socio integrated assessment for water
management in Australia. However, it is worthy to note that the integration of human
and environmental issues remains a major problem in the policy world (Tress et al.,
2003). This integrative view point was also expressed by many authors (Parker et
14
al., 2002; Winder, 2000 and Costanza, 2003; Winder 2003; and Jakeman and
Letcher, 2003).
The schematic plan of this study (Figure 1.7) below shows the arrangement and
connections of the various chapters as presented in this thesis.
Figure 1.7 Research Outline
Additionally, it is worthy to note that the integration of the social and technical
aspects of hydrogeology as proposed by this study might be subject of criticism in
15
the future. This is because the study is exploratory in the case study area and aims
to contribute practically to the evolving subject of socio-hydrogeology.
The rationale for adopting the case study methodology is because it is more suitable
and practical in addressing societal problems (Oats, 2006). Another advantage is
that information obtained can be utilised to develop a theoretical proposition on the
study area (Hartley, 2004). In addition, Yin (2009) has further stated that the benefit
of a single case study is that the researcher has access to areas that were
previously not investigated, and the resulting information is revelatory.
Thus, the single case study approach adopted by this study will investigate the
coupled human-groundwater system including the physical and sociocultural
mechanisms that affect groundwater quality from multiple perspectives. The findings
of this study can be replicated in areas with similar characteristics across the sub-
Saharan Africa region, and can be utilised to understand the relationship between
above ground anthropogenic activities and below ground hydrogeological systems.
This is because access to safe, clean and affordable drinking water and sanitation
remains a mirage in many African countries.
The case study approach of this study endeavours to investigate the circumstances
and dynamic conditions of an interrelated hydrogeological system. According to
Stake (1988), the special aspect of the case study approach is that it focuses on one
phenomenon so as to understand it in-depth in its natural condition. Furthermore, the
16
case study‘s unique strength is its ability to deal with a variety of evidence from
multiple sources and questions about current set of events can be answered without
any control of the researcher, making the finding authentic. The case study protocol
increases the reliability of the case as it keeps the researcher focused on the subject
of the case study (Yin, 2003).
1.3 Aim and objectives
The overall aim of the study is to develop methodologies that can mitigate the impact
of above ground anthropogenic activities on groundwater resources in ensuring their
sustainability in sub-Saharan Africa region. Taking Maiduguri metropolis (the chad
basin) as a case study area, the following objectives have been formulated:
To investigate and assess the multitude of above ground anthropogenic
activities and their impact on groundwater quality in a typical sub-Saharan
Africa urban centre.
To critically evaluate the key factors that is responsible for both natural and
anthropogenic contamination and suggests ways of protecting the underlying
aquifers in the sub-region.
To evaluate the problems of groundwater contamination in the case study
area using a methodology for the engagement of the various stakeholders in
addressing the situation; which can be replicated across the sub-region.
17
To carry out modelling of anthropogenic indicator contaminant and establish
sustainable framework for the protection of vulnerable aquifers in selected
case study area.
1.4 Research questions
In addressing the myriads of existing gaps in the case study area, the study carried
out an extensive literature review (Chapter 2) and topically scaled down the relevant
issues identified therein; which the aim of the study intends to achieve. Thus, the
research questions of the study were informed by both the literature review and the
prevailing scenario of the case study area. They are intended to provide insights and
address the research problems as well as the existing gaps. The following are the
research questions:
What is the current situation with regards to groundwater management in sub-
Saharan Africa urban centre (Maiduguri metropolis)?
What is (are) the potential source(s) of contamination that is (are) likely to
affect the underlying groundwater resources in these countries?
How can individuals/organisations responsible for and affected by
contamination be involved in addressing the current and emerging problems?
What is the current management framework and what can be done to develop
a robust and a sustainable framework that will ensure the protection of
groundwater from anthropogenic sources of pollution?
18
1.5 Methodology
As stated earlier (section 1.2), the study adopts a case study strategy that utilises a
mixed (multiple) method research methodology that employs both quantitative and
qualitative tools of data collection. The quantitative strand; includes field
measurements, water level measurement and taking representative groundwater
and sediment samples using onsite field instruments and techniques, as well as their
subsequent laboratory analyses. Others are household survey data collection and
analysis.
The above named methods were achieved by carrying out a detailed
reconnaissance survey between 2012 and 2014. The first field work was carried out
between March and May 2012; during this period, topographical and geological
maps were used to determine the local geology and the various land use activities of
the area. Pictures of the various sites were taken, and field observations were made.
Also, during the second round of field work in Maiduguri, the researcher in
collaboration with a technologist from the University of Maiduguri and 2 independent
research assistants (ad-hoc) carried out a comprehensive inventory of the potential
pollution sources between January and February 2013. In this regard, the case study
was divided into two major sites; in order to enable phased and detailed assessment
of the aforesaid sources. In each case, detailed characteristics of the sites visited
were recorded in the field log book. This allowed the conceptualisation of the system
19
and practical linkages between the pollution sources and environmental degradation
were established. Lastly, sampling points for the collection of representative
groundwater and sediment samples were identified. A comprehensive detail of the
methodological approach of the study is outlined in chapter 4.
The qualitative strand includes an extensive desktop literature review carried out in
the early stage of the study from October 2011 to February 2012. This was aimed at
critically evaluating the existing situation and approaches to groundwater
management in the case study area and across sub-Saharan Africa. Step by step
details of the qualitative methodological approach is outlined in chapter 4.
1.6 Structure of the thesis
This thesis is presented in 10 distinct but interrelated chapters that are summarised
as follows:
Chapter 1 presents a background of the study and the case study area. It outlines
the problem statement, research justification, rationale for a case study, and aim &
objectives of the study.
Chapter 2 presents the literature review; the concepts of the origin and occurrence
of groundwater including the hydrological cycle, the evaluation of the types of
geological formations, assessment of the various groundwater pollution sources;
natural and anthropogenic and their potentials. The chapter also, assesses the
aspects of groundwater contamination and the need for effective management and
20
utilisation in Africa and sub-Saharan Africa. Lastly, various groundwater
management approaches and their challenges (institutional and socio-economic) to
effective management across sub-Saharan Africa region were synthesised.
Chapter 3 presents a detailed description of the case study area; location,
demography, climate and vegetation, relief, geology and hydrogeology, and the
current problems affecting the case study area.
Chapter 4 presents the design and methodology adopted for the study. It describes
the various fieldwork and the analytical techniques employed in the study.
Chapter 5 presents the results and discussions of the social and hydrogeological
dimensions of the study. Result from stakeholder engagement (the interviews, focus
group discussions and household surveys) and hydrogeological investigations were
presented and discussed in this chapter.
Chapter 6 aspects of chloride modelling and the development of the alternative
guidelines for protecting groundwater in the case study area are presented in this
chapter.
Chapter 7 presents the summary and conclusion, and recommendations for further
research.
21
1.7 Scope and limitations of the study
This study was undertaken with the following scope and limitations:
1. While the outcomes of the research can be applicable to other areas especially in
sub-Saharan Africa countries, the discussions presented are based mainly on the
findings investigated in a local case study (Maiduguri metropolis). Though, the
findings can be transferable across the region especially the Sudano-sahel region, it
is worthy to mention that the northern fringe of the region is surrounded by basement
complex environment which limits the assumptions on the type and nature of
processes occurring within the sedimentary environment. Taking this into
consideration, practical limitations exist in the application of the guidelines developed
by this study in the entirety of the sub-region thereby affecting the overall aim of the
study.
2. Although the significance of microbial contaminants to the assessments of
groundwater quality is greatly appreciated, this study‘s laboratory analytical
assessments of groundwater quality were limited to the physico-chemical
parameters. In this respect, the microbial parameters were not included in the first
design framework of the study. Subsequently, constraints of resources (funds) at the
stage of data collection compelled the researcher to exclude these parameters; this
will greatly limit the consideration of this study as a general standard for comparison
by other studies across the sub-region.
22
3. Chemical analyses conducted were only a snapshot of the local situation;
therefore, they are not sufficient to provide details of the regional-temporal and
spatial compositional variations of groundwater quality. Taking this into
consideration, it is vital to carry out regional assessment of groundwater quality
trends across the sub-region and compare it with the findings of this study.
4. The study is limited to models developed based on geological, hydrogeological
(primary and secondary) data obtained. It is noteworthy that the modelling herein is
theoretical, therefore major limitation exists and future studies need to test the
validity of this model.
1.8 Summary and conclusion
The importance of groundwater for sustainable development in sub-Saharan Africa
cannot be over emphasised. This chapter has made it clear that socio-hydrogeology
can be very useful tool for achieving sustainable groundwater management.
Incorporating social dimensions into hydrogeological problems in developing
sustainable guidelines for mitigating the impact of onsite sanitation system;
especially pit latrine in the study area. This chapter presented the background to the
current problems affecting groundwater resources in the study area, and suggests
strategies for addressing the challenges. The chapter outlined the aim and objectives
of the study, methodologies, and the justification of the study. Others are the scope
and limitations of the study and research outline. The next chapter presents the
literature review component of the study.
23
CHAPTER 2
ASPECTS OF GROUNDWATER CONTAMINATION,
MANAGEMENT, & UTILISATION IN SUB-SAHARAN AFRICA
2. Introduction
The objective of this chapter is to review the key aspects of groundwater occurrence
and contamination processes in sub-Saharan Africa region. The chapter outlines the
review of the aspects related to groundwater including their significance, as well as
the types and nature of the physical, chemical, and biological processes and
transformations occurring in the natural sedimentary environment. The chapter
continues with the outlining of the organic and inorganic contaminants found in a
typical hydrogeological environment. It also includes an assessment of the various
groundwater pollution sources; natural and anthropogenic and their potentials. Also,
the chapter presents a review of the groundwater quality standards and the adopted
groundwater sampling method in the study.
Besides, the chapter presents a synthesis on the issues related to occurrence and
aspect of contaminant processes in a typical sedimentary basin in sub-Saharan
Africa. Additionally, overview of the existing approaches to groundwater
management in sub-Saharan Africa, institutional frameworks and instruments
available for groundwater management are presented. Lastly, the chapter evaluates
the various sustainability based approaches used in the management of
groundwater resources.
24
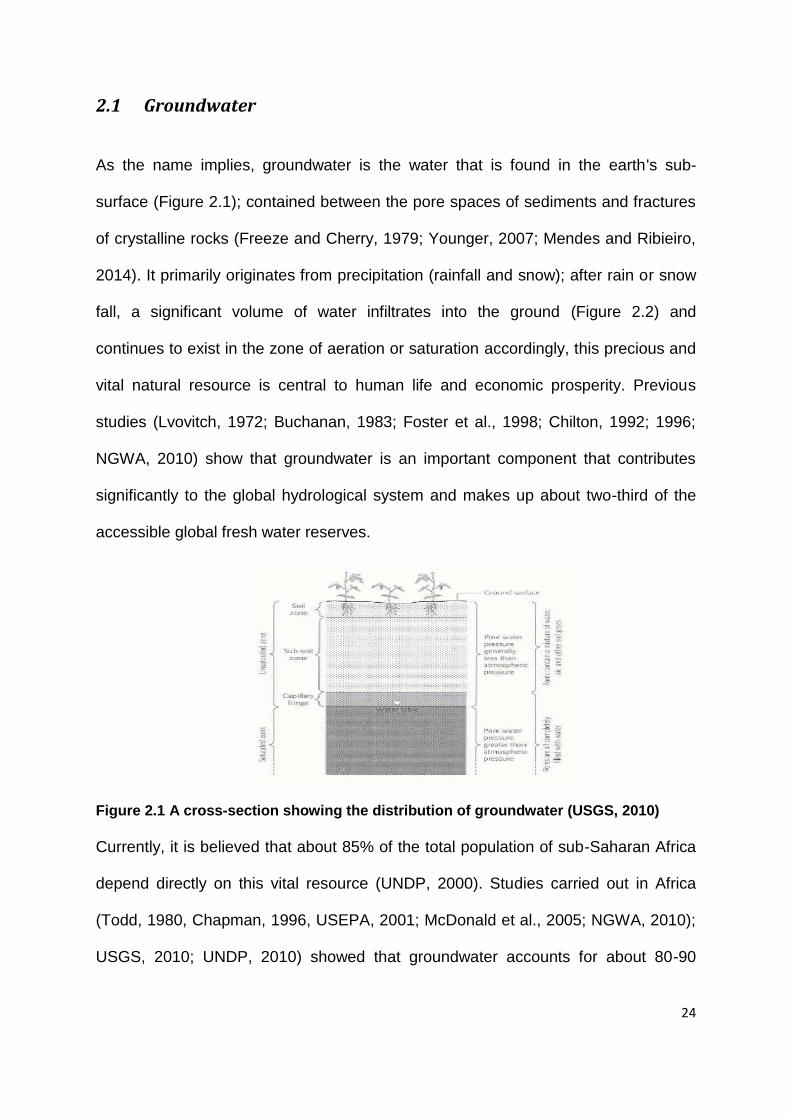
2.1 Groundwater
As the name implies, groundwater is the water that is found in the earth's sub-
surface (Figure 2.1); contained between the pore spaces of sediments and fractures
of crystalline rocks (Freeze and Cherry, 1979; Younger, 2007; Mendes and Ribieiro,
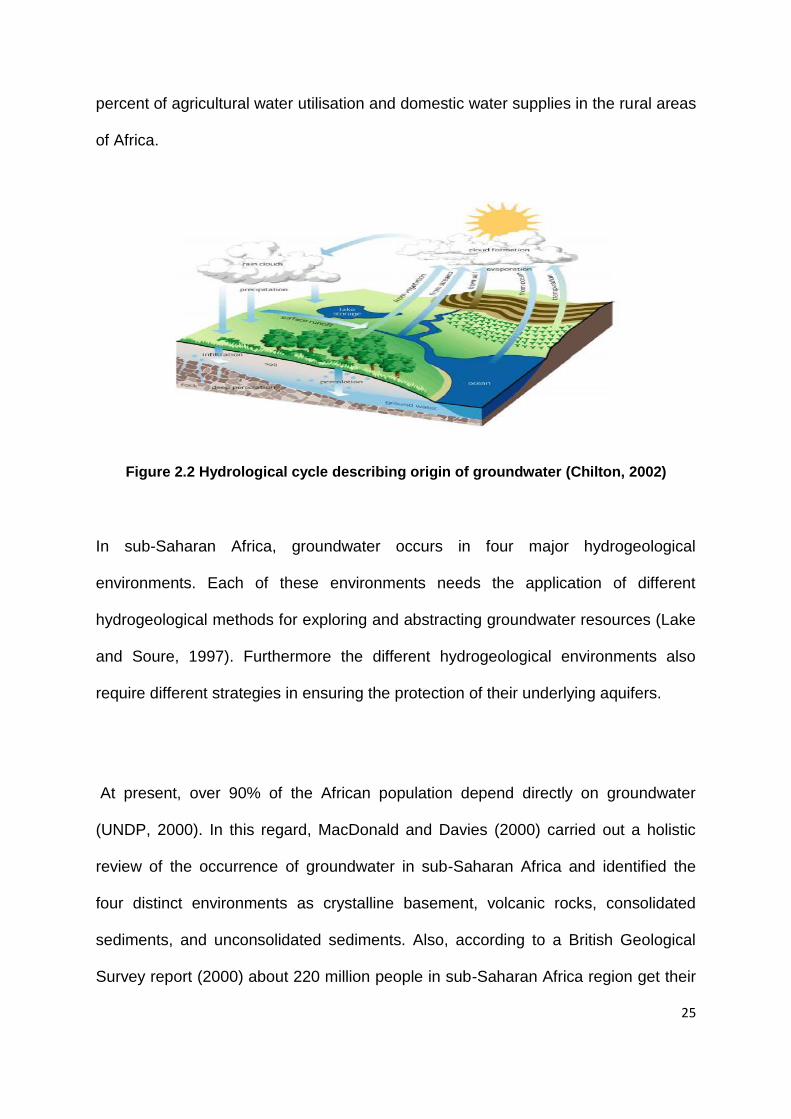
2014). It primarily originates from precipitation (rainfall and snow); after rain or snow
fall, a significant volume of water infiltrates into the ground (Figure 2.2) and
continues to exist in the zone of aeration or saturation accordingly, this precious and
vital natural resource is central to human life and economic prosperity. Previous
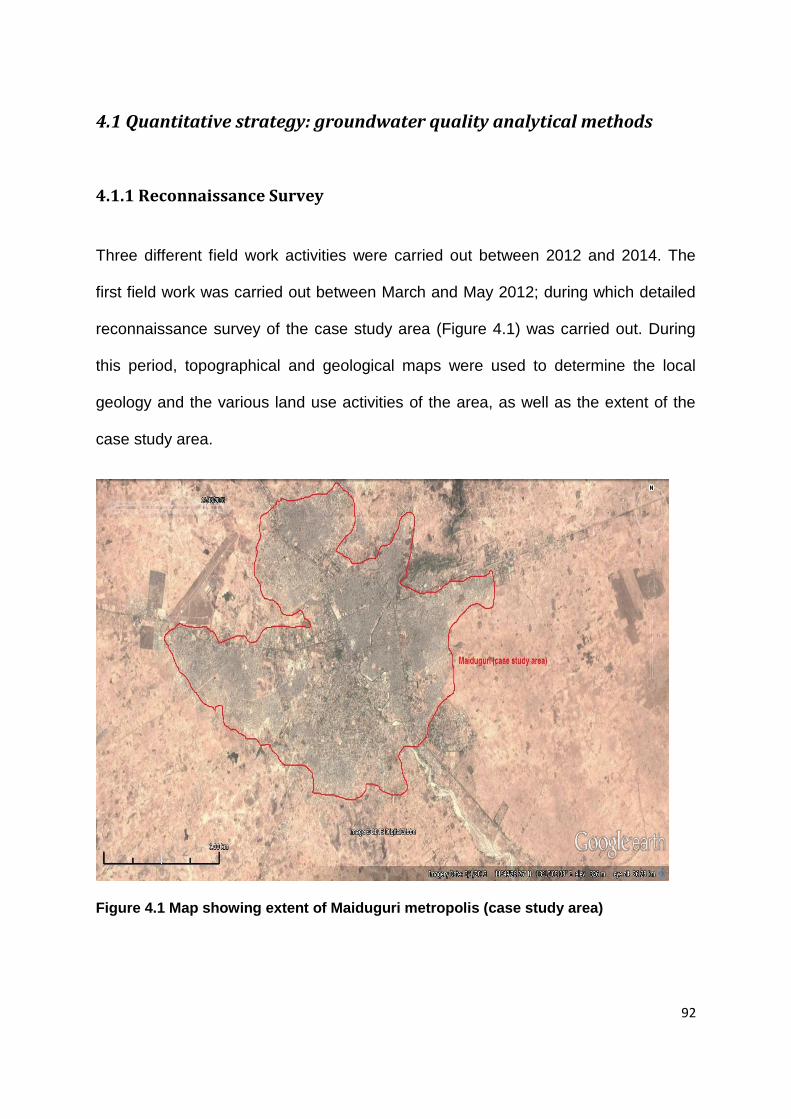
Three different field work activities were carried out between 2012 and 2014. The
first field work was carried out between March and May 2012; during which detailed
reconnaissance survey of the case study area (Figure 4.1) was carried out. During
this period, topographical and geological maps were used to determine the local
geology and the various land use activities of the area, as well as the extent of the
case study area.
Figure 4.1 Map showing extent of Maiduguri metropolis (case study area)
93
4.1.2 Pollution Sources Identification
During the second round of field work in Maiduguri, the researcher in collaboration
with a member of staff in the University of Maiduguri and 2 ad-hoc research
assistants carried out a comprehensive inventory of pollution between January and
February 2013. In this regard, the case study was divided into two major sites; in
order to enable phased and detailed assessment of the aforesaid sources. In each
case, detailed characteristics of the sites visited were recorded in the field log book.
This allowed the conceptualisation of the system and practical linkages between the
pollution sources and environmental degradation were established (Figure 4.2).
Figure 4.2 Aerial view of Moduganari area showing concentration of pit latrines and open dump sites (Google Map, 2012).
94
4.1.3 Selection of Groundwater Sampling Sites
Within the case study area, various groundwater supply sources (tube-wells) were
surveyed; in this respect, tube-wells that meet the following criteria as outlined in the
survey plan were selected:
The borehole or tube well must tap water from the A zone of the upper aquifer
(shallow).
It must be within the residential area and serves a sizeable number of
households (public).
Following the said criteria above, a total of 20 shallow tube-wells and hand pump
boreholes were identified and marked for groundwater sampling in two major areas
with the highest anthropogenic activities in Maiduguri (Figure 4.3). The location of
each of these water points was recorded by a hand held GPS device (Table 4.1). All
of the groundwater sampling sites were located across the case study area; this is to
enable the detection of anthropogenic impacts within the vicinity of the boreholes/
tube wells.
95
Figure 4.3 map of the study area showing the different sampling location
96
Table 4.1 Summary of borehole location in the two sampling sites
Sampling site/boreholes Location coordinates
Borehole 1 N11°49.580‘ E013°07.675‘
Borehole 2 N11°49.492‘ E013°08.994‘
Borehole 3 N11°48.815‘ E013°08.361‘
Borehole 4 N11°49.440‘ E013°07.602‘
Borehole 5 N11°49.319‘ E013°07.061‘
Borehole 6 N11°47.029‘ E013°06.021‘
Borehole 7 N11°46.971‘ E013°07.897‘
Borehole 8 N11°46.231‘ E013°06.101‘
Borehole 9 N11°46.900‘ E013°06.425‘
Borehole 10 N11°45.901‘ E013°05.215‘
Borehole 1 N11°49.185‘ E013°10.633‘
Borehole 2 N11°49.102‘ E013°10.312‘
Borehole 3 N11°48.685‘ E013°11.203‘
Borehole 4 N11°49 477‘ E013°10.733‘
Borehole 5 N11°49.573‘ E013°10.551‘
Borehole 6 N11°49.631‘ E013°10.616‘
Borehole 7 N11°49.692‘ E013°10.731‘
Borehole 8 N11°49.385‘ E013°10.133‘
Borehole 9 N11°48.716‘ E013°10.878‘
Borehole 10 N11°49.064‘ E013°09.883‘
97
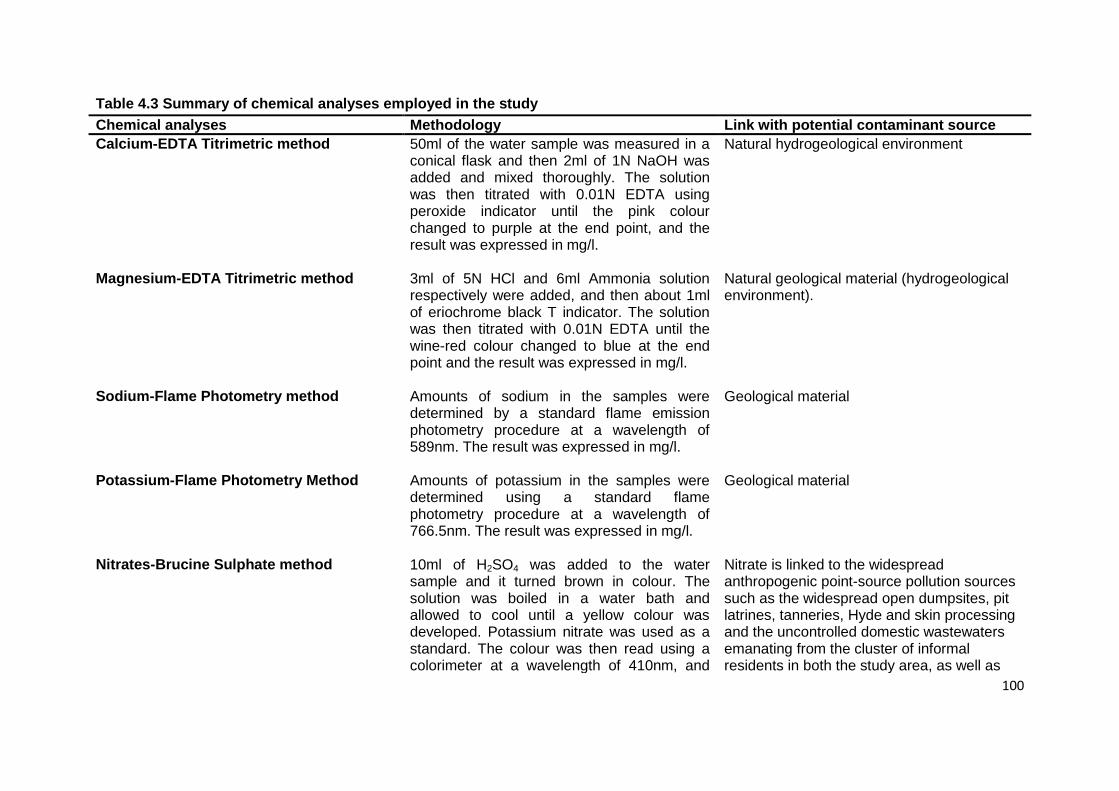
4.1.4 Experimental approach
In achieving the objectives of the Hydrochemical analyses of the study, the analytical
techniques outlined in APHA (1998) and USGS (2010) were adopted to investigate
the physico-chemical quality of the groundwater samples obtained across the study
area. Table 4.3 summarises the various chemical analyses employed.
4.1.4.1 Onsite Measurements
The selection of the onsite parameters such as pH, EC, TDS and Temperature were
based on the outlined procedure of USGS (2010). They are measured in the field
due to their relatively unstable nature (USGS, 2010). The pH and temperature of the
water sample were measured with a digital HANNA pH-meter (Model HI 98129). EC
and TDS were measured with a portable conductivity, TDS and salinity meter (Model
EC400 Ex Stik II). Summary of the error levels of the onsite measurement equipment
used in this study as well as their precision comparison with similar studies are
presented below (Table 4.2).
Table 4.2 summary of equipment error levels
Equipment Error level Precision comparison with other studies
HANNA pH meter ± 0.1 to 0.2 pH unit3 USGS 2002, Stewards,
2011
Thermometer ± 0.2°C Singh, 2004, Edmunds et al.
2002
EC 400 (conductivity) meter ± 3 percent for EC, ± 5
percent for TDS
Jackson, 2013, USGS, 2010
98
4.1.4.2 Chemical Analyses
The groundwater samples (Figure 4.4) were analysed for chemical parameters such
as; Ca2+, Mg2+, Na+, K+, Cl-, NO3-, SO42-, PO4
2-, CO3-, and CaCO3
- ions. The reason
for selecting these cations and anions is because they are the potential natural and
anthropogenic contamination indicator parameters in residential areas. Detailed
justifications on these elements are documented in the APHA (2002) manual of
water quality analyses.
Also, various experimental and instrumental techniques were employed to analyse
the different chemical components. Summaries of these methods are presented in
Table 4.4, while a complete description of the methods can be found in Standard
Methods for the Examination of Water and Waste Water, 20th Edition (APHA, 1998)
and USGS (2010) protocol for groundwater quality analysis. The physico-chemical
analyses were carried out at the Geochemistry laboratory, the Department of
Geology, University of Maiduguri.
99
Figure 4.4 some of the groundwater samples obtained for Hydrochemical analyses
100
Table 4.3 Summary of chemical analyses employed in the study
Chemical analyses Methodology Link with potential contaminant source
Calcium-EDTA Titrimetric method 50ml of the water sample was measured in a conical flask and then 2ml of 1N NaOH was added and mixed thoroughly. The solution was then titrated with 0.01N EDTA using peroxide indicator until the pink colour changed to purple at the end point, and the result was expressed in mg/l.
Natural hydrogeological environment
Magnesium-EDTA Titrimetric method 3ml of 5N HCl and 6ml Ammonia solution respectively were added, and then about 1ml of eriochrome black T indicator. The solution was then titrated with 0.01N EDTA until the wine-red colour changed to blue at the end point and the result was expressed in mg/l.
Natural geological material (hydrogeological environment).
Sodium-Flame Photometry method Amounts of sodium in the samples were determined by a standard flame emission photometry procedure at a wavelength of 589nm. The result was expressed in mg/l.
Geological material
Potassium-Flame Photometry Method Amounts of potassium in the samples were determined using a standard flame photometry procedure at a wavelength of 766.5nm. The result was expressed in mg/l.
Geological material
Nitrates-Brucine Sulphate method 10ml of H2SO4 was added to the water sample and it turned brown in colour. The solution was boiled in a water bath and allowed to cool until a yellow colour was developed. Potassium nitrate was used as a standard. The colour was then read using a colorimeter at a wavelength of 410nm, and
Nitrate is linked to the widespread anthropogenic point-source pollution sources such as the widespread open dumpsites, pit latrines, tanneries, Hyde and skin processing and the uncontrolled domestic wastewaters emanating from the cluster of informal residents in both the study area, as well as
101
the result was expressed in mg/l.
the agricultural inputs from upstream manure application in farm lands.
Chloride-Argentometric Method 100ml of the water sample was measured, and 1ml of potassium dichromate (K2Cr2O7) was added as an indicator. The solution was then titrated against 0.01N Silver Nitrate (AgNO3) solution until the yellow colour changed to brown at the end point, and the result was expressed in mg/l.
Chloride is linked to the widespread open dumpsites and waste water flowing uncontrollably in the informal settlements of the study area.
Sulphates-Gravimetric Method 250ml of the sample was measured, and its pH was adjusted with 1N HCl to about 5, using a pH meter. It was brought to a boil while slowly adding barium chloride solution and stirring gently until precipitation appeared to be complete. The precipitate was digested at about 80°C to 90°C for 2 hours. The precipitate was filtered with filter paper, washed with distilled water and placed in a crucible along with the filter paper, and then heated in a muffle furnace at 800°C for 1 hour. It was allowed to cool in a desiccator, and the barium sulphate precipitate weighted. The result was expressed in mg/l
Attributed to domestic wastes and decomposition of organic matter, sometimes emanates from industrial wastes, but mostly from the bacterial reduction of sulfate. Others are tanneries
Phosphate To 100-mL sample add 0.05 mL (1 drop) phenolphthalein indicator solution. If a red colour develops, add strong acid solution dropwise, to just discharge the color. Then add 1 mL more. Boil gently for at least 90 min, adding distilled water to keep the volume between 25 and 50 mL. Cool, neutralise to a faint pink color with NaOH solution, and
They are found in sewage from body wastes and food residues, and also may found as orthophosphates in agricultural and residential areas.
102
restore to the original 100-mL volume with distilled water.
Carbonate and Bicarbonate
25 to 50 mL of the sample was measured in a conical flask, and its pH was adjusted to 4.3 about 2 to 3 drops of phenolphthalein indicator was added. H2SO4 was standardised against 40.00 mL 0.05N Na2CO3 with about 60 mL distilled water, in a beaker by titrating potentiometrically to pH 5. The electrodes were lifted out, rinsed into the same beaker and boiled gently for 3 to 5 min under a watch glass cover. It is then allowed cool to room temperature; cover glass rinsed into beaker and titration finished (pH 4.3). The result was calculated and expressed in mg/l.
Geological material
103
4.1.5 Sediment Sample Collection
As outlined in Bakari (2014c), representative sediment samples (sandstone and
siltstone units) that constitute bulk of the Quaternary Chad formation were
systematically collected at two varying depths of 5 and 10 metres in two different
locations (sites 1 and 2) respectively. Simple hand held auger and sampling tools
such as shovel, digger, plastic bucket, polyethylene bags, and measuring tape were
used. This method is adequate for carrying out preliminary investigations on
superficial deposits (USGS, 2010).
Hand augering was carried out at systematic depths of 5 and 10 m respectively, at
each depth about 1kg of the sediment sample was collected, the sample is then
divided into 2 portions (for granulometric and mineral content analyses) and poured
into a properly labelled plastic bucket in each case. This procedure is repeated at the
depth of 10 metres and in site 2. All the samples were transported to the
sedimentary petrology laboratory at the Geology department, the University of
Maiduguri for analyses.
4.1.5.1 Sieve Analysis
The portion of sediment sample retained on the No. 10 sieve is tested for grain size
distribution by passing the sample through a number of sieves of different size
openings as outlined by ASTMD (2000). The sieves are stacked in order, with a
104
sieve with 2 mm aperture size at the top. The sieves are agitated by mechanical
means for about 10 minutes. When this mechanical process is completed, the weight
of the particles retained in each sieve is determined using the Ohaus (Model T31P)
digital balance, from which the individual and cumulative percentage weights were
computed (Bakari, 2014c).
4.1.5.2 Mineral Content Analysis
The required amount of sediment sample with constant size was separated in the
plastic bag, debris and organic matters were removed. Then, the samples were
spread out carefully on a picking tray in such a way that particles do not overlap with
one another. A magnifying microscope (Model WestburySP40) was used to observe,
identify and count the various minerals in the sample based on their physical
properties. Four specimen slides were prepared for each sample and the
percentages of each mineral was calculated separately. Also, average percentage of
each mineral was calculated from the aforesaid calculations (Bakari, 2014c).
4.1.6 Hydrogeological Model Data
A total of 20 shallow boreholes log data covering the study area was obtained from
local drillers. The raw data was entered into Microsoft Excel spread sheet based on
the sub categories outlined in Table 4.4.
105
Table 4.4 Summary of data requirement for EnvironInsite hydroanalysis
Table Fields
Wells Name, location, surface/bottom elevation, class
Screens Well/screen name and bounding elevation interval
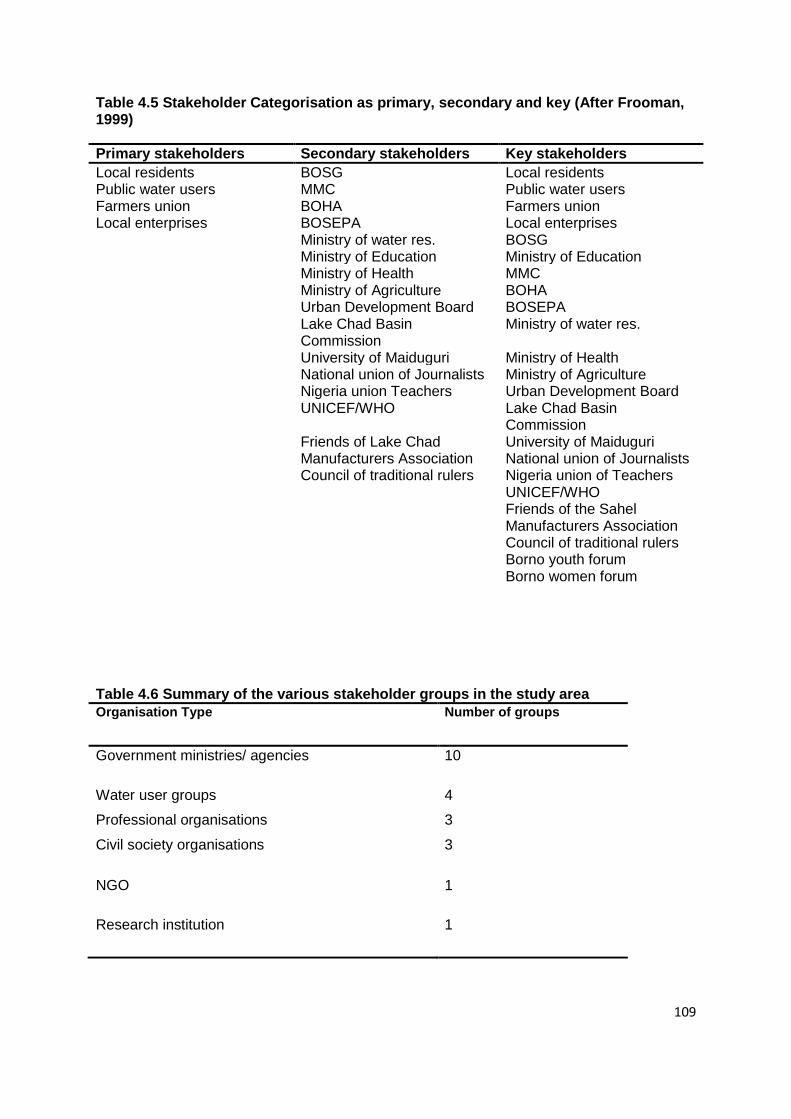
Local residents BOSG Local residents Public water users MMC Public water users Farmers union BOHA Farmers union Local enterprises BOSEPA Local enterprises Ministry of water res.
Ministry of Education BOSG Ministry of Education
Ministry of Health MMC Ministry of Agriculture BOHA Urban Development Board BOSEPA Lake Chad Basin
Commission Ministry of water res.
University of Maiduguri Ministry of Health National union of Journalists Ministry of Agriculture Nigeria union Teachers Urban Development Board UNICEF/WHO Lake Chad Basin
Commission Friends of Lake Chad University of Maiduguri Manufacturers Association National union of Journalists Council of traditional rulers Nigeria union of Teachers UNICEF/WHO Friends of the Sahel Manufacturers Association Council of traditional rulers
Borno youth forum Borno women forum
Table 4.6 Summary of the various stakeholder groups in the study area
Organisation Type Number of groups
Government ministries/ agencies 10
Water user groups
Professional organisations
4
3
Civil society organisations 3
NGO 1
Research institution 1
110
4.2.2 Interviews
Interviews are very useful, particularly for getting the story behind participants‘
experiences. The interviewer, according to McNamara (1999), can pursue in-depth
information around the topic and can be useful as follow-up to certain respondents to
questionnaires with a view to investigating their responses.
Interviews, according to Fontana and Frey (2005), can be divided into three
categories, viz: structured interviews, semi-structured interviews, and unstructured
interviews. Semi-structured interview is relatively more flexible than a structured
interview, and it consists of both closed-ended and open-ended questions (Fontana
and Frey, 2005).
During the field work conducted in March to July 2013, a semi-structured interview
with certain flexibility was conducted with the key stakeholders identified in the
stakeholder analysis. A total of twelve strategic stakeholders as representatives of
their organisations; one each from the eight government ministries/ departments &
agencies and the municipal council, one research institution, a non-governmental
organisation and the one civil society groups were interviewed from April to June
2013 (Figure 4.7).
111
Figure 4.7 Interview with some of the strategic stakeholders
Table 4.7 Summary of strategic stakeholders interviewed and their affiliations (after Reeds et al., 2009)
Stakeholder Affiliation
Director groundwater services Ministry of water resources Deputy director sanitation Borno state environment protection agency Director engineering services Assistant Director
Borno state Urban development board Ministry of Education
Senior staff Ministry of health Senior staff Ministry of environment Council secretary Maiduguri metropolitan council Staff member Borno state house of assembly Senior lecturer University of Maiduguri Coordinator Friends of the Sahel Chair woman Forum of women Hrdrogeologists Chad basin development authority
The researcher interviewed the strategic stakeholders on a one-on-one format in
their various offices and exceptional few in their homes. Prior to the interview;
appointments for the interviews were requested and booked by telephone calls, texts
messages and personal visits. At the first contact with the interviewees, the
researcher explained the purpose of the study and why he or she was identified as a
potential interview candidate. After this step, permission to be interviewed at their
112
convenience were sought; at this stage a copy of the research protocol and
introductory letter approved by the Abertay University was made available to the
interviewee in advance of the slated date. The interview questions were not
disclosed to them at this point, because this will influence the level of stakeholder
responses during the interview.
4.2.3 Pre-focus Group Capacity Building Workshops
The researcher carried out a pre-focus group capacity building workshops (Figure
4.8) for the primary stakeholders taking into account their level of education and
limited capacity. These stakeholders are comprised of the local residents, group of
small scale farmers, and local business owners (Johnson et al., 2004).
Figure 4.8 Pre-focus group capacity building workshop in the case study area
113
The objective of the capacity building workshop was to increase the awareness level
of the stakeholders and to provide them with a simplistic overview of the complex
physical and hydrogeological systems and how each of these systems is affected by
their activities, to identify a strategy that will contribute to sustainable management of
groundwater in the context of an IWRM approach in the case study area, and to
develop a coping strategy that will mitigate future uncertainties of climate change,
and urban & population growth.
The decision support tools used include simple illustrations showing the relationship
between p
ollution sources, pathways and the underlying groundwater. Vulnerability maps were
produced from the water quality result obtained. This is because such maps are
simple and an essential tool for better understanding of the resources base, and in
making informed decisions. Overall, the capacity workshops have provided better
understanding of scientific processes to the marginalised stakeholders, and on how
the interaction with the physical system affect the quality of the groundwater
resource.
4.2.4 Focus Group Discussions
Focus group discussions were chosen as a method to provide a forum for primary
stakeholders as water users to discuss their concerns, understanding and opinion
towards groundwater management issues in the study area. Focus group
discussions have the advantage of allowing a lot of data to be collected in a short
period (Morgan, 1997). They allow the researcher to develop an understanding
114
about why people feel the way they do, participants are able to bring up issues they
feel are important to them, and are able to challenge each other‘s views and the
researcher may benefit by having a more realistic account of what people think of the
current system (Miller and Glassner, 1997; Morgan, 1997). Focus groups are also an
effective way of advancing a study subject (Madriz, 2003).
A total of six (6) focus group discussions were conducted with the local water user
groups on the potential two sites of the study area. The focus group discussions
were held across the different communities of sites 1 and 2 (Moduganari and
Gwange areas) respectively. In total there were 52 individuals; 40 males and 12
females drawn from the local residents and water user groups as well as groups of
youths; this is because they constitute majority of the population, and they can
provide valuable contributions to the research questions (Graiser, 2008).
Each focus group comprised of about 8 to 9 residents from each of these
communities. According to Krueger and Casey (2000), the ideal size of a focus
group for non-commercial research ranges from six to eight. To increase
representativeness, the participants were drawn by random sampling from different
walks of life; this selection is based on a combination of demographic information
and professional guidance tool.
The focus group discussions were carried out at the community level the;
participants were contacted prior to the meeting, purpose of the study and the
115
significance of their contribution were highlighted at this point. Two research
assistants were hired among the local community members for the duration of the
focus group discussions. A copy of the research protocol and introductory letter
approved by Abertay University was made available to them. Participants were also
informed of the meeting time and place at this point.
The researcher also made it clear to the participants that refreshment will be
provided at the meeting, and a token of £2 (N500) will be available for
reimbursement to cover their transportation costs. The focus group discussions took
place within 5KM radius of the residences of participants; the aforementioned token
is sufficient for fares within this radius.
On the day of the focus group discussion, the researcher briefed the participants
about the purpose of the study and why their contribution is important to the study.
The researcher made sure that participants were aware that there are no wrong or
right answers during the focus group session, and the ground rules for discussion
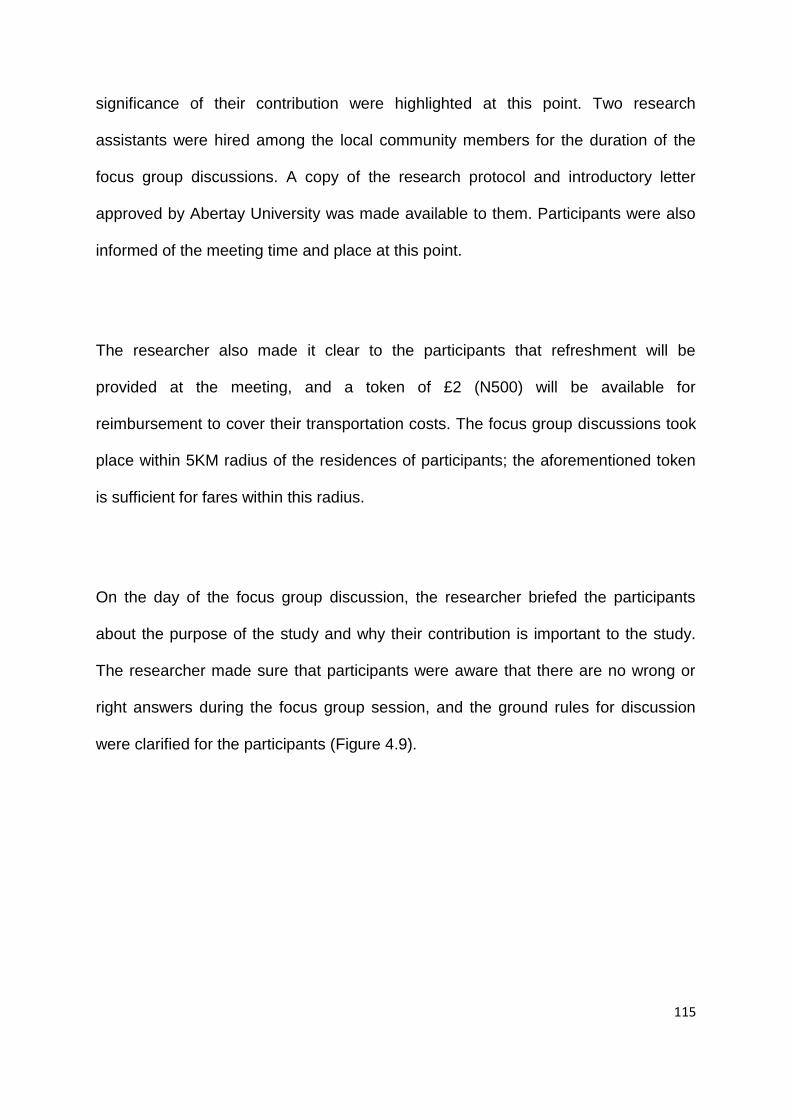
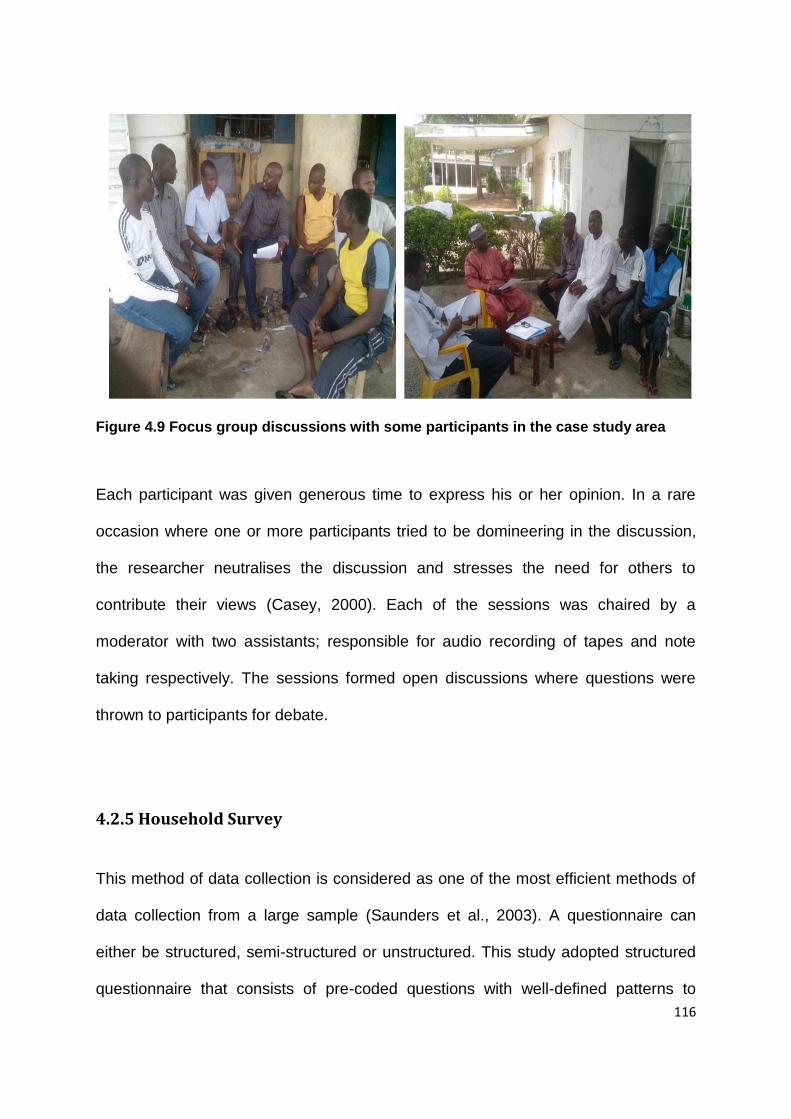
were clarified for the participants (Figure 4.9).
116
Figure 4.9 Focus group discussions with some participants in the case study area
Each participant was given generous time to express his or her opinion. In a rare
occasion where one or more participants tried to be domineering in the discussion,
the researcher neutralises the discussion and stresses the need for others to
contribute their views (Casey, 2000). Each of the sessions was chaired by a
moderator with two assistants; responsible for audio recording of tapes and note
taking respectively. The sessions formed open discussions where questions were
thrown to participants for debate.
4.2.5 Household Survey
This method of data collection is considered as one of the most efficient methods of
data collection from a large sample (Saunders et al., 2003). A questionnaire can
either be structured, semi-structured or unstructured. This study adopted structured
questionnaire that consists of pre-coded questions with well-defined patterns to
117
follow the sequence of questions. According to Acharya (2010) most qualitative data
collection, activities use a structured questionnaire. Structured questionnaire has the
advantage of being easy to administer, consistency in answers and easy for data
management (Acharya, 2010).
Stratified systematic sampling was used in identifying the various households for the
study. Patten (2001) argues that, when this method is used properly, systematic
sampling produces a sample that is as valid as a sample obtained using simple
random sampling. A respondent was identified in every third house at the two sites
(Moduganari and Gwange) of the case study area; participants were selected based
on the sub divisions of the study area. For instance, the potential sites (Moduganari
and Gwange) were selected based on their socio-economic and demographic
context. Thus, these divisions were taken into consideration to ensure that
respondents were drawn to represent the various households of the study area.
Unlike the personal interviews and focus groups, the survey method allowed efficient
data collection from a larger sample of the residents in a relatively sensible manner.
A total of 600 household questionnaires (Figure 4.10) were distributed for 600
households (300 each) in Moduganari and Gwange. In total, 81 % response rate was
achieved for both sites. Also, a follow up survey on the vertical and horizontal depths
of on-site sanitation systems and water levels and points were administered in the
same manner as stated above. The rationale for carrying out the follow-up survey is
to provide support for the development of realistic and sustainable guidelines that will
118
mitigate the impact of the onsite sanitation systems on the local aquifers of the case
study area. This provides a framework within which practical solutions of achieving
sustainable groundwater management can be implemented; in line with the overall
aim of the study.
Figure 4.10 the researcher sorting out the filled household survey questionnaires
Since the centre piece of this study is focused on low income individuals (urban
poor) whom are mostly individuals with little formal education, the survey questions
were read and interpreted to about two third of the respondents, while those with
good formal education filled the questionnaires on their own. In each case, research
assistants with good education were recruited from within the local areas that were
responsible for the tedious task of interpreting the questions to local language of the
household respondent. The research assistants were trained to ask the questions
(interpret from the local language to English) properly and in filling out the
questionnaires for the households with little or no formal education. Methods used in
identifying the survey participants were also clarified to them.
119
In addition, gender sensitive steps were taken to ensure representation of both
males and females in the survey. This is because women play a significant role in
water related issues particularly in developing countries (Shiva, 2002). Women,
therefore, hold very vital information when it comes to water management issues in
their homes and communities. Furthermore, men were also included because they
hold key information on water supply and utilisation. Therefore, both male and
female respondents were engaged.
Once respondents were identified, he or she is read the survey participant statement
on the questionnaire as approved by Abertay University. The statement gave a brief
description of the research, nature of participation and the confidentiality of
participants.
4.3 Methods of Data Analysis
In this study, both parametric and non-parametric tests were employed in evaluating
the quantitative and qualitative data. Generally, parametric tests are often used in
the scientific study and are more robust than non-parametric tests. While in social
sciences non parametric tests are the preferred choice. The following are the steps
taken in analysing the data obtained for this study:
120
4.3.1 Thematic Analysis Procedure
Each manuscript was transcribed verbatim into a separately identified folder. The
digitally recorded focus group discussions or individual interviews were re-played
many times to ensure the adequate understanding of obtained data. As a standard
digital recorder was used, it was possible to minimise the background noise and
change the sound tones to maximise the clarity of voices.
The manuscripts were read through frequently, to become familiar with the overall
picture of data (deductive analysis). That is; this approach was used to discern an
overall and fundamental meaning of experiences (Hall, 2004). Then, line by line a
search of manuscripts was undertaken to scan central themes (e.g. environmental
problems, sustainable options, etc.). This included repeated ideas or statements
―that say something‖ (Brunard, 1991). This process was accompanied by making
notes about each manuscript.
Once again, the manuscript was re-read to check for common themes in the
manuscripts. Indeed, so doing allowed the current author to become immersed in the
data and thus the ―life world‖ of participants (Gillis and Jackson, 2002). Once the
author has become aware of the main issues found, as many headings as necessary
were highlighted, then irrelevant materials which are referred to as ―dross‖ (Brunard,
1991) were identified and excluded from the analysis (e.g. talking in a detailed way
about the ownership sources of water supply).
121
Once the main themes were highlighted, a category system was created for each
manuscript (e.g. Category One: all themes about issues related to environmental
problems). Initially, as many categories as possible were generated, and materials of
relevance were linked accordingly. Then the number of categories was reduced
(collapsing stage) i.e. some of the ones that have similar contents (Brunard, 1991).
Once the final version of categories was finalised, each of them was examined within
the context of each question reported in the interview schedule.
As qualitative analysis is an on-going and dynamic process, during the writing up
phase, if there is some doubt about certain findings, the current author checks the
manuscript to ensure the credibility of analysis.
4.3.2 Axial Coding
Axial coding is a process of relating categories to their subcategories in qualitative
data analysis (Strauss and Corbin, 1997). This data analysis technique is normally
preceded by open coding, where the raw interview data or field notes are reduced
into many ideas and concepts. They are identified and labelled accordingly, which
sets the stage for axial coding.
In axial coding the data are regrouped so that the researcher may identify existing
relationships more quickly. In this respect, the issues of groundwater management
122
are categorised based on the selected themes to represent the various opinions of
the stakeholders in the different interviews and focus group discussions. This has
allowed the exploration of all the different views and opinions of the stakeholders in a
tabular form. Much detailed description of the axial coding methodology can be
obtained from (West and Zimmerman, 1987; McMahon, 1995; Glaser, 1995).
4.3.3 Statistical analysis methods
The study has adopted the following statistical analyses:
4.3.3.1 General Linear Model (ANOVA)
This study fits the General linear model (GLM) for univariate responses of the
Hydrochemical data obtained (Appendix B). In matrix form, this model is Y = XΒ + E,
where Y is the response vector, X contains the predictors, Β contains the
concentration of ions to be estimated, and E represents errors assumed to be
normally distributed with mean vector 0 and variance Σ. By means of the general
linear model, the study performed a univariate analysis of variance and examines the
differences among means of the concentration of cations and anions in the various
boreholes using multiple comparisons.
In this regard, statistical test was carried out on the groundwater samples collected.
The samples were tested for determining the differences in concentration of cations
and anions across the different boreholes using analysis of variance (ANOVA); using
Groundwater contamination Knowledge about contamination
Likely to occur due to solid waste disposal in open dumpsites Due to domestic wastewater and pit latrines Contamination can occur due to multiple activities Stakeholder is fully knowledgeable about contamination issues Stakeholder is fairly knowledgeable Stakeholder is totally not knowledgeable about contamination issues
Concerns about
contamination Stakeholder is extremely concerned about contamination Stakeholder is reasonably concerned about contamination Stakeholder is totally unconcerned about contamination
What follows is the detailed presentation of the results (Table 5.1) above:
136
5.1.1.1 Groundwater Contamination
The problem of groundwater contamination can be attributed to a multitude of
sources across the metropolis; open dumpsites, pit latrines, and other sources. The
severity of these sources, according to the stakeholders interviewed, varies from
place to place in the city. Consequently, the entirety of the local residents utilise pit
latrines due to its affordability and traditional attachment to the people in the case
study area.
Also, most government officials and the academia attribute the use of fertiliser and
organic manure as a potential source of groundwater contamination. Also, the
proliferation of petrol stations and the concentration of cottage industries such as
tanneries and dying works can also constitute a significant threat to the shallow
groundwater system.
5.1.1.2 Knowledge about Groundwater Contamination
The officials from the ministries of water, environment, and health, and those from
the academia were more knowledgeable about the issues related to groundwater
contamination. This acquaintance was due to their professional experience or the
relevance of their respective ministries in relation to management of water
resources.
137
Also, some interviewees from other agencies and organisations such as the urban
development board, the metropolitan council, women forum, and an NGO the Sahel
green belt were fairly knowledgeable about the status quo; however, at present the
groundwater quality is good. However, this group of stakeholders stressed the
importance of the availability of real time groundwater data/ information for the
various stakeholder groups and organisations. From the foregoing, it can be claimed
that knowledge about groundwater contamination issues is very good among the
strategic stakeholders interviewed. Despite their knowledge, some of institutional
stakeholders, except for handful in the academia, they are not familiar with
groundwater modelling tools including their application.
5.1.1.3 Concerns about Groundwater Contamination
Despite the disparity of knowledge among the stakeholders interviewed, concerns
about groundwater contamination were very high (Figure 5.1). Majority of the
interviewees were worried that contaminated water can be harmful to human life,
and they attest that they are willing to be involved in addressing the situation.
However, despite their concern, an interviewee confirmed that there is no cause for
alarm at present, but warned that people should avoid unwholesome environmental
attitude towards waste disposal.
138
Figure 5.1 Stakeholder concerns about groundwater contamination
Noteworthy at present, none of the stakeholders interviewed was affected by the
problems of contamination. Interviewees from the academia and the ministries
responsible for water supply and healthcare service delivery were the extremely
concerned; while those representing individual groups were the least concerned
about the issue.
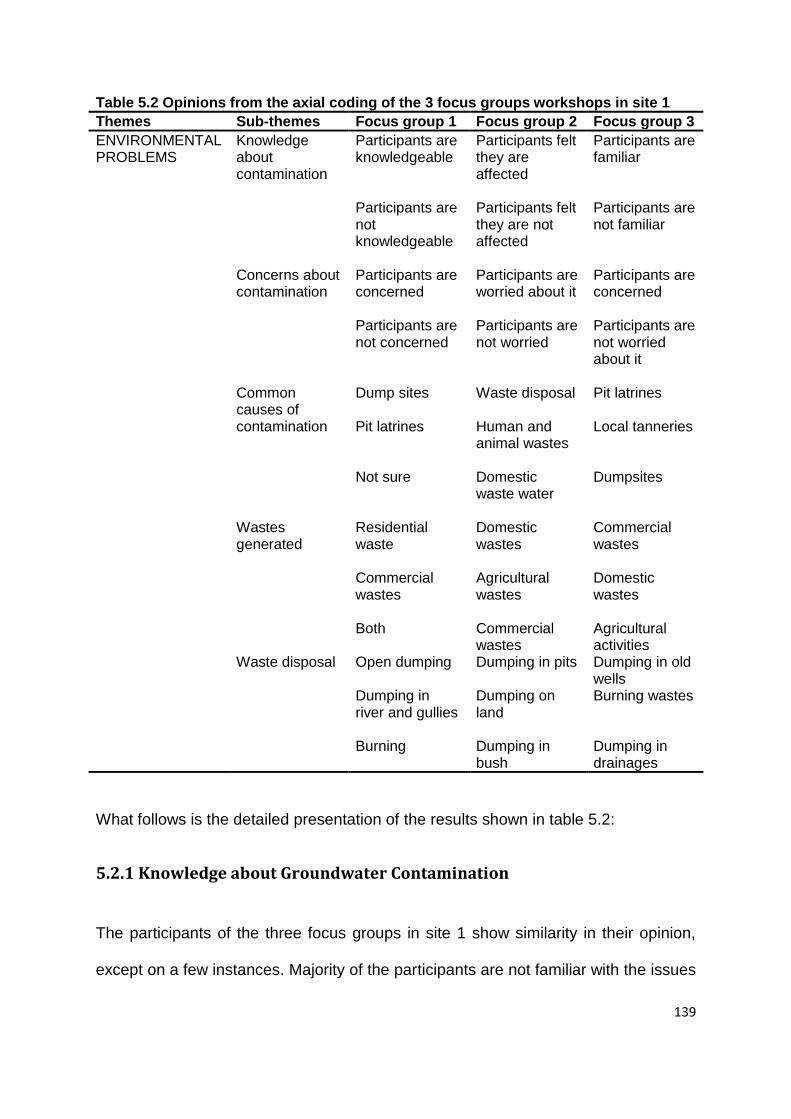
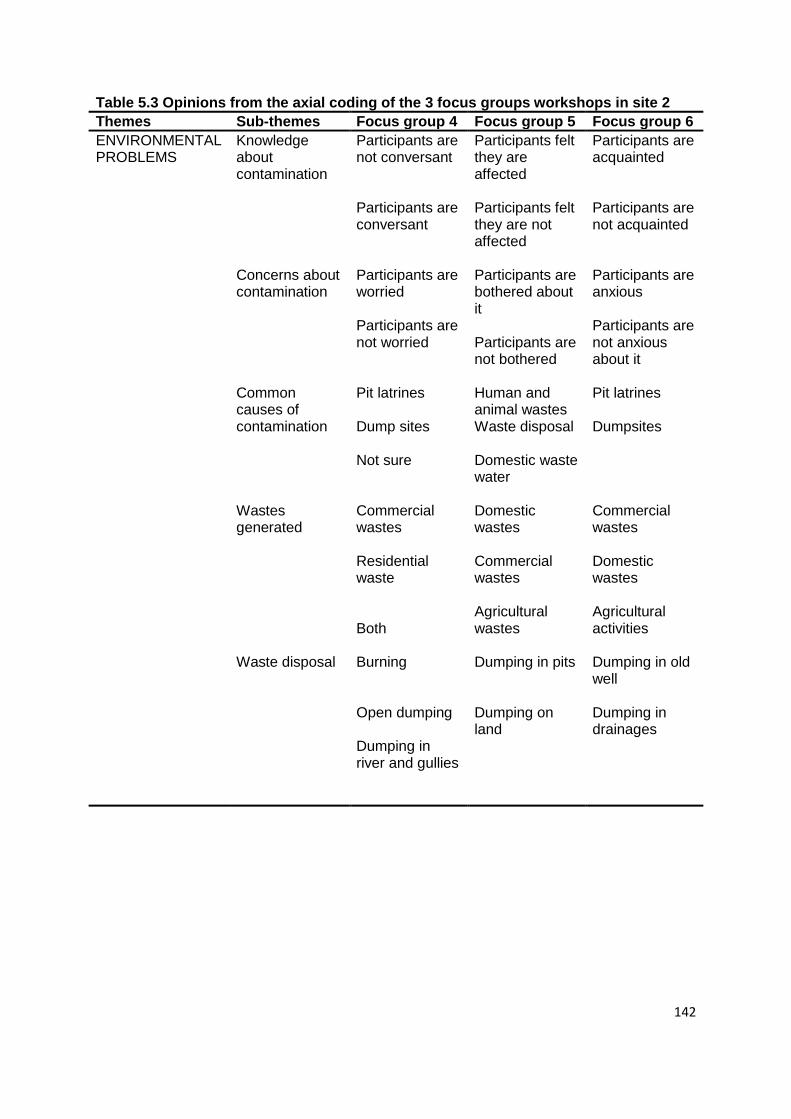
5.2 Stakeholders opinion from the various Focus Group Discussions
The results of the six focus group discussions (three each from the two sites) as
carried out by the study are presented in Tables 5.2 and 5.3. The result suggests
that the opinions of the primary stakeholders are vital for the development of a
sustainable framework in managing groundwater resources in the case study area.
139
Table 5.2 Opinions from the axial coding of the 3 focus groups workshops in site 1
Themes Sub-themes Focus group 1 Focus group 2 Focus group 3
ENVIRONMENTAL PROBLEMS
Knowledge about contamination
Participants are knowledgeable Participants are not knowledgeable
Participants felt they are affected Participants felt they are not affected
Participants are familiar Participants are not familiar
Concerns about
contamination Participants are concerned Participants are not concerned
Participants are worried about it Participants are not worried
Participants are concerned Participants are not worried about it
Common
causes of contamination
Dump sites Pit latrines Not sure
Waste disposal Human and animal wastes Domestic waste water
Pit latrines Local tanneries Dumpsites
Wastes
generated Residential waste Commercial wastes Both
HCO3 183b±0.04 164.7h±0.60 250.2c±0.85 195.3f±0.35 244.1d±0.10 219.7e±0.75 268.5b±0.25 299a±4.00 168h±3.00 264b±1.00 Results are Mean of triplicates ± SD. Results on the same row followed by different superscript letter (a-h) indicate significant difference (p ≤ 0.05) by (ANOVA) using Tukey grouping test.
Table 5.17 Chemical parameters mean values with standard deviation for boreholes in site 2
HCO3 119j±0.53 160g±0.80 230c±0.58 176i±1.73 191d±2.08 242b±0.70 219e±0.49 293a±2.51 172f±1.00 217h±1.00 Results are Mean of triplicates ± SD. Results on the same row followed by different superscript letter (a-h) indicate significant difference (p ≤ 0.05) by (ANOVA) using Tukey grouping tes
176
Also, in site 1 of the study area, sulphate has highest and lowest concentration of
5.47 and 0.07 mg/L in BHM8 and BHM2 respectively, while phosphorous recorded
highest concentration of 0.89 mg/l in BHM6 at the same site and lowest
concentration of 0.12 mg/L in BHM1 (Table 516). Similarly in site 2, sulphate has
highest mean concentration of 7.3 mg/l in BHG8, and BHG2 has the lowest sulphate
concentration of 0.12 mg/l (Figure 5.15); also in the same site, phosphorus has
highest concentration of 2.6 mg/l and lowest of 0.29 mg/L in BHG6 and BHG2,
respectively.
BHG1
BHG10
BHG2
BHG3
BHG4
BHG5
BHG6
BHG7
BHG8
BHG9
W-1
Wells
230
250
270
290
310
330
Ele
va
tio
n (
me
ters
)
C C'BHG7
BHG8
Sand and Clay
Sand
Gravel
Silt
Borings
S
I
ClNO3
SO4
Figure 5.15 Cross section (C-C’) showing profile of boreholes 7and 8 including their
constituents (anions) in Gwange area
177
5.7.1.4 Groundwater Chemical Quality Concentration of Other Ions
The concentration of other ions such as carbonate and bicarbonate in groundwater
of both sites vary considerably; in site 1 the concentration of bicarbonate vary
between 299 and 164 mg/l in BHM8 and BHM2 respectively; in site 2 it varies from
293 mg/l in BHG8 and 119 mg/l in BHG1. Similarly the concentration of carbonate
varies considerably across the boreholes of the two sites; in site 1, lowest
concentration of 73 mg/l was recorded in BHM9 and the highest 0f 181 mg/l in
BHM4. In site 2, lowest and highest concentrations of 72 mg/l 178 mg/l were
recorded for BHG4 and BHG8 respectively.
5.8 Discussions
This section provides a detailed discussion on the results of both the social and
hydrogeological dimensions. Sub-section 5.8.1 presents the social aspects
discussion, while sub-section 5.8.2 presents the hydrogeological aspects discussion.
5.8.1 Discussion of social aspects
More frequently, the quantity of water used is related to the household size and
household income, hence the households with highest number of inhabitants and
those with high income are likely to consume significant volume of water in the study
area. In view of this, AICD (2011) reveals that annual income of most individuals
inhabiting less affluent settlements in Sub-Saharan African countries and other
developing nations is often generally low. In the study areas, the situation is not quite
178
different. This skewed income distribution can be attributed to the differences in
socio-economic activities of the various households. The low to moderate income
earnings in these areas will also have implication for the willingness to pay for the
provision of extra sanitation activities and this will ultimately affect the sustainability
of managing wastes generated.
Likewise, in Sub-Saharan Africa most households are relatively large because of the
polygamous and extended family structure. However, this century long tradition is
presently losing popularity due to the economic liability associated with it, and
modernism. Household size has implication for the amount of wastes generated and
the quantity of water consumed per day. Considering the existing low level of
sanitation facilities in the study area, household wastes generated are often left
unattended by communities.
A discussion of the issues identified, building on the findings of Bakari et al. (2014),
shows that environmental problems, impacting negatively on groundwater resources,
are widespread in the study area, so accordingly most interviewees are familiar with
these is-sues, at least at a basic level. However, in a few instances some of the
interviewees failed to give convincing accounts of these issues. The interviewees
from academia, ministries of Water, Environment and Health were the most
knowledgeable; likely related to their high level of education and professional
involvement in dealing with environmental issues in their respective roles. Despite
the differences in their understanding, all interviewees were keen to be involved in
addressing the environmental problems; this is probably because they are in a
179
position of authority, hence they see it as a vested responsibility as far as their
organisations are concerned.
Conversely, awareness about groundwater contamination is very limited in the
general population focus group category. Participants in this category are typically
individuals with little relevant education such as farmers, local business owners and
traders that constitute the bulk of the urban, less-affluent populace. Similarly, the
household survey revealed that most of the respondents are not knowledgeable
about groundwater contamination; with more than 87% (n=288) of the households
unfamiliar, only a minority (12.2%) of the respondents are informed about this issue.
Survey results clearly indicated a low level of environmental awareness among the
general populous.
The majority of those interviewed from a relatively highly educated background were
worried that consuming contaminated groundwater can be very harmful to human
health. The respondents from the relatively poorly educated background typically
showed little interest in issues related to the causes of groundwater contamination in
their respective areas. It can be generally observed that level of education is a
decisive factor in showing concern for the environment.
Public health issues are universally of greater concern than the environment. In
general interviewees were wary of the effect of consuming contaminated water
because of their familiarity with health risks. Water-related illnesses are prevalent in
180
most developing countries, particularly in sub-Saharan Africa. The general lack of
concern over groundwater contamination, among poorly educated focus group
participants/survey respondents, was related to the potable status of their current
water supplies. It also however relates to their increased concern of other socio-
economic issues which affect their lives, in particular poverty. In this context, it is
important to note that most participants and households surveyed live on less than
the global benchmark of $1 per day, indicating extreme poverty. As previously noted
the poor level of education plays a significant role in the ability of low-income
individuals to make informed decisions on issues related to groundwater
contamination.
The common causes of groundwater contamination drawn from the interviews and
focus groups are largely due to the widespread utilisation of pit latrines and open
dumpsites, commercial activities and agricultural practices. Domestic and
commercial wastes are prevalent and widespread, while agricultural wastes are also
generated, albeit in smaller amounts. The population density is estimated to be
around 300-400 inhabitants per square kilometre, with a high number of inhabitants
per household. The household survey revealed that 48.3% of the respondents affirm
that pit latrine is the biggest causal factor of groundwater contamination, open
dumpsites was next in rank with 28.5%; other sources such as domestic wastewater,
tanneries, dyeing works constitute about 15.3%, and chemical and fertiliser
application upstream of the residential areas make up the remaining 8.0%.
181
Open dumping and burning of all forms of waste in pits and in open spaces are
common. The preference of these methods in the area has been practiced for a very
long period. As previously identified it is obvious that the general public have little
regard for the environment due to the predominant lack of awareness. Adequate
waste collection facilities are lacking, and this has greatly influenced the attitude of
the people towards poor waste disposal practices. Thus, it can be concluded that an
attitude of indiscriminate waste disposal exists among the people.
The prevalence of these contamination sources in the study are is due to the cultural
affiliation of the people towards on-site sanitation facilities, the unequal service
provision rendered by the government, poverty, low level of public awareness, and
lack of hygiene education among others. Thus, reversing these trends will require a
shift from the current system to a more integrated and sustainable one.
5.8.1.1 Other issues stressed by stakeholders
Other issues highlighted by the institutional stakeholders include, low capacities by
the local water user groups, poor institutional collaboration at both state and national
levels. This has resulted in overlapping of functions between the three tiers of
government and their agencies. Also, the study has identified a huge gap at the
institutional levels; poor knowledge about modelling tools for decision making.
Taking into consideration, existing conflicting institutional irregularity between the
different agencies has undesirably affected the efficiency of water supply in the
entirety of the case study area.
182
The above statement is in line with the judgement of the Word Bank (2012) that poor
coordination between the National and regional level as well as among different
water agencies and allied organisations is a major constraint in achieving
sustainable groundwater management in developing countries. Hence, the different
approaches adopted by the various agencies responsible for water supply have
undermined the utilisation of groundwater resources in Nigeria. This is in harmony
with the investigations of Hanidu (2003) and Goni (2006) in the country.
Other key impediments for institutional sustainability according to the institutional
stakeholder‘s include shortage of skilled manpower for the development of
appropriate local technology and the adoption of new technologies. Conversely, the
availability of a sizeable number of qualified manpower to deal with hydrogeological,
engineering, environmental and managerial aspects of groundwater resource
management is extremely low in the case study area. This component is paramount
in achieving sustainability. Another important issue related to technical problem is
the lack of reliable management information system and monitoring network. Goni
(2006) and Offodile (2006) argued that the number of well-trained professionals
(hydrogeologists, water engineers, and technicians) responsible for handling and
managing water projects is extremely low.
Lastly, the stakeholders attest that inadequate funding is a major problem in Borno
state; funds and subvention allocated to the state ministry of water resources are
extremely insufficient, considering its current low level of operation and the ever
increasing water demand across the state. In this regard, the current insufficiency
183
funding has affected the maintenance and repair of ageing utilities, spare parts of
water works, boreholes pumps and generating sets in the case study area (Bakari
and Jefferies, 2013). In relation to this, the AICD (2011) carried out an investigation
and confirmed that most utilities across Nigerian cities operate poor infrastructure
and about two-thirds of Africa‘s urban population is served by ageing water utilities.
Adequate funding is not available to the public water agency for expansion or
rejuvenation of its ageing infrastructure in the case study area; expansion of urban
utilities in Nigeria could not keep up with the population growth due to poor
budgetary provision for the water sector by all the three tiers of government in the
country. Funding issues in the water sector is a major problem in Nigeria and in most
developing countries. This situation conforms with the view of Lloyds (1994) that
funding of water schemes in developing countries is often difficult and extremely
hard to obtain. This issue have been highlighted by Offodile (2003) and Tijani (2006)
in Nigeria. Also inadequacies of funds affect the maintenance and expansion of
water utilities across the country; this is in agreement with the judgment of Helwig
(2000).
184
5.8.2 Discussion on hydrogeological aspects
5.8.2.1 Pollution Pathways
The pore spaces of the overlying sedimentary formation (the Quaternary Chad
Formation) are the most probable pathways through which contaminants travel into
the underlying aquifers. The stratigraphy of the study area is mainly constituted of
sand, silt and clay, and gravel in descending order. This chronological arrangement
seems to suggest fluvial depositional sequence, the gravely nature of the lower unit
suggest sedimentation under high energy environment with the upper silt and clay
units deposited later as the energy of the transporting medium subsided, gravely
materials thus being deposited at the base.
The degree of angularity of the sediment samples, as highlighted in the results,
expresses the ratio of the average radius of curvature of the edges of the respective
grain classification categories to the radius of curvature of their maximum inscribed
sphere. The dominance of angular and very angular grains as presented in the grain
morphology analyses probably had direct relationship with the attenuation capacity
of the sediments of the study area; thereby increasing the attenuation capacities of
the sedimentary unit which provide protective cover for the upper unconfined aquifer
system.
Arguably, it is possible that the heterogeneity and complexity of the sediment‘s
interlocking pattern restricts the vertical movement of contaminants, thereby affecting
185
the fate of anthropogenic contaminants within the geo-system and hence the limited
amount of contaminants in the groundwater. However, it is noteworthy that fractures
and secondary pore spaces that exist within the geo-system can be a potential
pathway for contaminant migration and movement in the sub-surface.
5.8.2.2 Groundwater Physical Quality
pH is a measure of the hydrogen ion concentration in solution and is also referred to
as the degree of acidity or alkalinity. The distribution of pH for the two areas
suggests that the groundwater in site 1 is alkaline while that of site 2 is acidic-
alkaline in nature. Both mean pH values obtained are within WHO permissible limit.
The alkalinity and acidity of the pH values in both sites may be due to the presence
of dissolved carbon dioxide and organic acids (fulvic and humic acids) in the
groundwater, which might be derived from the decay and subsequent leaching of
plant materials and other biological processes (Langmuir, 1997; Stuart and Reeder,
2008).
Also, the relatively low to moderate values of EC and TDS in both sites signifies
lower residence time of ground water within the Chad formation; this is because the
upper aquifer is continuously recharged by rainfall; which causes significant dilution.
Also, the occurrence of low EC values indicates a low degree of mineralisation and
input from the agricultural activities upstream of both sites. Consequently, the low
TDS values also suggest that inputs of salts from the anthropogenic sources of
pollution in both sites are minimal.
186
The temperature of the groundwater of the study area is slightly higher than the
natural background levels of 22 to 29°C for waters in the tropics which is not
preferred. Mostly, cool waters are more potable for drinking purposes; waters with
temperature above the normal human body temperature are usually preferred in the
tropics, though not totally objected. High temperature conditions may not be
desirable for water samples as it encourages the growth of micro-organisms, which
have the potentials of altering the odour, taste and colour to the water (Stumn and
Morgan, 1981). Metal corrosion problems are also associated with high temperature
especially when the pH of the water happens to be skewed to extreme.
5.8.2.3 Chemical Quality non-anthropogenic Parameters
The distribution of sodium, calcium, potassium and magnesium indicates that their
concentrations across all the samples of both sites are significantly different (p<0.05)
across the various boreholes. The results suggest that natural processes occurring
within the geological formations such as ion-exchange processes, silicate weathering
and calcium carbonate dissolution are the major factors affecting their concentration
in varying proportions in the groundwater samples of the study area (Lakshmanan et
al., 2003).
5.8.2.4 Chemical Quality Anthropogenic Indicator Parameters
In both sites, the concentration of chloride varied across the boreholes (p<0.05). The
source of chloride in the study area can be correlated with the widespread
187
anthropogenic point-source pollution sources such as the widespread occurrence of
pit latrines, open dumpsites, and the uncontrolled domestic wastewaters emanating
from the cluster of informal settlements of the case study area, as well as agricultural
inputs from upstream manure application in farm lands. Nolan et al. (2002), Squillace
et al. (2002) and Singleton et al. (2005) estimate that chloride concentration in the
range of 13 to 18 mg/l indicate anthropogenic input.
The variation in concentration of chloride in site 1 is due to the location of a dumpsite
in the south-eastern part of the area, while the borehole (BHM5) furthest away from
the dumpsite is having minimal concentration of chloride, thus, this showed
significant difference in their concentration. Hence, the dumpsites have impacted
negatively on the groundwater system. This is also true for site 2, where elevated
chloride concentration was observed in the borehole (BHG8) located in the western
part of the area (dense pit latrine concentration), and the lowest concentration was
found in the northern part which receives less impact (less dense). These differences
can be related to the dissimilarity of anthropogenic activities in the two locations; the
former location receives high chloride probably because it is very close to the river
Ngadda Bank where huge amount of solid wastes are disposed in dumpsites, and
residential areas served by pit latrines.
Elevated concentration (> 250 mg/L) of chloride in waters is an indication that the
waters are at the risk of pollution (Atabey, 2005). The levels of chloride in waters are
of particular importance for use in drinking water. Also, chloride ions can be
introduced as atmospheric inputs from rainfall recharge. The latter assumption was
validated by a previous study carried out by Edmunds et al. (1999), where they
188
measured chloride concentration of 2.1 mg/l in the present day rainfall of the study
area.
Also, Edmunds and Street-Perrott (1996) and Gaye and Edmunds (1996) have
analysed the rainfall chemistry in this region and estimated concentration of chloride
as 1.28 and 0.61 mg/l for dry and wet seasons, respectively. The moderate level of
chloride in all the samples of sites 1 and 2 suggests that the anthropogenic input due
to the furthest distance of this inland aquifer from the coastal zone where chloride
concentration is very high.
Thus, the concentration of both sulphate and phosphorous varied and hence
concentrations are significantly different (p<0.05). Sulphate occurs naturally in
geological materials, in igneous rocks; sulphur occurs mostly as metallic sulphides
and is fairly distributed in the various rock types. In arid sedimentary basins, the
highest abundance is in gypsum and anhydrite (van Helvoort et al., 2009). The main
anthropogenic sources of sulphate in groundwater of the study area can be
attributed to application of agrochemicals, the mining of gypsum in the western part
of the Basin and contemporary acid rain (Quevauviller et al., 2009). However, in the
study area, Goni et al. (2001) have analysed the rainfall geochemistry of the region,
and posits that sulphate in the region is derived from atmospheric mixing of aerosols,
and from ash of burnt forests.
Anthropogenic sources of phosphate in the study area include human sewage and
the routine use of non-biodegradable detergents. As a result of the monotonous
agricultural activities up stream of both sites especially near the Lake Alau Dam and
189
Biu/Damboa Road, phosphates derived from the application of fertiliser in these
areas are continuously added to soil and leaches to underlying aquifers gradually as
observed during the field work. Long-term over-application of manure and chemical
fertiliser has been known to contribute to phosphorus movement into the
groundwater system (Domagalski and Johnson, 2012).
5.8.2.5 Concentration of other Ions
The bicarbonate and carbonate ions in the groundwater samples of both sites
originate from the solution of CaCO3 in groundwater made by acid dissolving CO2
gas from the atmosphere and soil. Also, their concentration can be linked to the
dissolution and ion exchange processes occurring within the huge limestone deposit
sources in the south-western part of the Basin.
5.9 Summary and conclusion
This chapter presented the views and opinions of both strategic and primary
stakeholders in addressing the issues of groundwater contamination in the case
study area. Stakeholder‘s knowledge, opinions and concerns with respect to
environmental problems are explored in this regard. Knowledge about groundwater
contamination issues is very high among the strategic stakeholders interviewed; and
they are keen to be part of addressing this problem. Also, awareness and concerns
on the above-mentioned issue is unconvincingly low among the primary stakeholders
engaged via focus group and household surveys.
190
According to all the categories of stakeholders engaged, the major environmental
problems occurring in the case study area are principally related to anthropogenic
activities; the proliferation of pit latrines, incessant waste disposal, and other non-
point sources of contamination across the city. Accordingly, pit latrines and open
dumpsites constitute the highest negative impacts on groundwater resources of the
case study area. None of the stakeholders mentioned industrial sites as sources of
contamination. Likewise, all the stakeholders confirm that residential and commercial
wastes from local businesses are dominating the scene. Lastly, open dumping,
burying in pits, and burning are the most preferable waste disposal methods in the
case study area.
Also, other important issues acknowledged by the participants of the interview
include funding issues, and the inadequacy of technical and human capacities.
Hence, capacities to deal with pollution threats are extremely insufficient and needed
to be strengthened. This can be ensured by training members of staff on water
quality issues and implementation of groundwater monitoring networks. On the other
hand, sensitisation of the general public about pollution threats, identification of
potential threats to groundwater systems will enhance their capacities. Furthermore,
the stakeholders suggested that the problems can be addressed through active
community participation, increase in investment, controlling waste from the source,
and strict legislations.
Almost all the institutional stakeholders engaged are of the view that there is no
evidence of contamination in the study area. Likewise, despite their limited
knowledge about groundwater contamination, the water user groups engaged via
191
focus group discussions and household surveys confirmed that they are not affected
by groundwater contamination problems. Table 5.18 below presents the major
summary from the social engagement aspect of this study.
Table 5.18 summary of key points opined by the various stakeholder groups
Institutional stakeholders Interviews Stakeholders are knowledgeable about issues related to groundwater contamination The groundwater quality is currently good and safe for consumption
Concerns about groundwater
contamination is extremely high
Major environmental
problems are due to the influence of anthropogenic activities
Pit latrine and open
dumpsites constitutes the highest impact
Funding in the water sector
is limited Technical and human
capacities to curtail contamination are low
Poor institutional
collaboration at local, state and federal levels. Hence the need for further commitment and streamlining of responsibilities
Current legislations are weak
and existing approaches to waste management are inadequate
192
Primary stakeholders as water user groups
Focus groups
Knowledge about contamination is very low
Concerns about groundwater
contamination is extremely low
Participants confirm that pit
latrines and dumpsites are the major perceived sources of contamination Participants are not affected by issues of groundwater contamination
Open dumping and pit burial
is the most common waste disposal method
Wastes generated are
commonly residential and commercial
Local residents as water user groups
Household survey
Wastes generated are mostly from local businesses and households
Dumping on land, in
drainages and communal bin are the preferred options. Other mode of disposal includes burial, burning and the use of old wells
Household respondents are
unaware of any issue related to groundwater contamination Respondents are not affected by problems of groundwater contamination
Households were of the
193
opinion that both government and private investment in the water and sanitation sector is needed
Respondents are not willing
to pay for any amount in exchange of improved services
Respondents are of the
opinion that community participation is the best strategy for addressing the current problem
Statistical relationship exists
between household income and willingness to pay for extra sanitation services by respondents
Statistical relationship exists
between awareness about groundwater contamination and the education status of respondents.
There is statistical
relationship between household level of education and respondents awareness on the implication of dumping of waste
Household respondents
opted for increase in investment in water sector, introduction of strict laws, community participation and controlling of wastes as the viable ways of attaining sustainable system
194
Furthermore, groundwater contamination can be attributed to the above-ground
anthropogenic activities especially pit latrines and open dump sites. The chapter
concludes that sediments pore-spaces control the vertical movement of
contaminants. However, the fractures and secondary pore spaces due to continued
geological processes can be potential pathways for contaminant migration and
movement in the sub-surface.
Additionally, the potential sources of anthropogenic contamination in the case study
area include the proliferation of pit latrines, incessant domestic and municipal waste
disposal. The concentration of sodium, calcium, potassium, and magnesium
indicates that they are occurred due to silicate weathering processes occurring within
the hydrogeological environment. Typically, this process is dominant in a
sedimentary environment with abundant clastic materials. The concentrations of the
above named non-anthropogenic parameters are well within the WHO safe limit for
consumption and their levels are consistent with the natural occurrence levels of the
key elements that make up the aquifer material. Thus, they are correlated with the
mineral content analysis result.
Also, the concentrations of chloride, nitrate, phosphate, and sulphate are far below
the limits set aside by WHO for safe consumption. In this respect, chloride recorded
average concentration of 9 mg/l in the case study area, while nitrate recorded 17
mg/l, sulphate recorded 2.77 mg/l, and phosphate recorded 1.01 mg/l. In this
respect, the WHO safe limit for chloride is 250 mg/l, sulphate is 400 mg/l, phosphate
is 300 mg/l, and nitrate is 50 mg/l.
195
Overall, the hydrogeological investigation of this study confirmed that the
groundwater quality is presently good. This validated the opinions of the strategic
stakeholders. In furtherance to this, the next chapter investigates the fate of chloride
(as a contamination indicator parameter) in the hydrogeological environment and
develops the alternative guidelines for mitigating contamination of aquifers. This is
aimed at achieving the overall objectives of the study.
This chapter presented and discussed the results from the social and
hydrogeological dimensions; the next chapter (6) presents the aspects of chloride
modelling and the development of the new guidelines applicable in the case study
area.
196
CHAPTER 6
MODELLING CHLORIDE CONTAMINATION AND NEW
GUIDELINE DEVELOPMENT
6. Introduction
The previous chapter focused on the social and hydrogeological aspects of the
study. This chapter is divided into two components; the first part presents the
modelling of chloride contamination due to the impact of above pit latrines. The
second part presents outlines the development of the new guidelines for mitigating
the impact of pit latrine on the underlying aquifer in the study area. The rationale for
carrying out the modelling is to predict the behaviour/occurrence of contaminants
based on the source-pathway scenario and, to enable develops sustainable
guidelines in the case study area. In this respect, the MODFLOW/ MT3DMS code
was implemented to achieve the above mentioned modelling. Vital hydrogeological
(primary and secondary) data were obtained from different sources for the modelling
exercise. Likewise, secondary data from the World Bank and UNICEF/WHO reports
were used for comparison of (guidelines) global standards to those developed by the
study. This provides a framework within which practical solutions of achieving
sustainable groundwater management can be implemented; in line with the overall
aim of the study.
197
6.1 Modelling chloride contamination due to pit latrine impact
In order to investigate the impact of pit latrine on groundwater resources of the case
study area, a modelling was conducted with processing MODFLOW/MT3DMS
software to demonstrate the possibility for chloride contamination of the shallow
aquifer due to the influence of above-ground onsite sanitation system.
MODFLOW/MT3DMS was used because it includes an implicit iterative solver based
on generalised conjugate gradient (GCG) that implicitly solves advection, dispersion,
and sink source without any restrictions. The general purpose of the modelling in this
study is to help address groundwater contamination problems, design valuable
contamination mitigation strategies, and provide information for decision making.
In achieving the objectives of the modelling, a reference borehole (BHM1) with the
highest chloride concentration of 16 mg/l (see Table 5.16 in chapter 5) was selected
to conceptualise the system (Figure 6.1). The justification for selecting chloride as an
indicator parameter is provided in section 2.8.17. The study area is characterised by
water table ranging between 10-15 m below the bottom of the pit latrine. Important
hydrogeological parameters for the local case study area which are required by
MODFLOW were collected from different sources (existing literature, the Borno State
Water Agency, Nigeria Hydrological Services Agency, and primary data of this
study). Other information such as pit latrine characteristics, number of latrine users
and their frequency was obtained via a follow-up survey.
198
Figure 6.1 Conceptual model showing the impact of pit latrine on groundwater
In carrying out the modelling, a representative model domain with 25 columns and
50 rows was selected. The modelled aquifer dimensions are 800 m in length, 200 m
wide and 25 m deep. It was confirmed through the survey that there was an average
of 15 users per pit latrine. The water flux and soil moisture of the study area were
documented as 0.002 and 0.3 m3/ m2/day respectively; hence the pore velocity is
0.01 m/day. These values were obtained for the sediments of the study area by
gravimetric methods (NIHSA, 2013).
The retardation coefficient for chloride was assumed to be 1.0, dispersion assumed
to be 2.4 x 10⁻⁷ m2/s (Fetter, 1994). The hydraulic conductivity of 0.0002 m/s and
0.0006 m/s was measured for units A and B respectively by previous studies (Goni
et al., 1996 and Akujieze et al., 2003). The effective porosity of the aquifer is set in
the MODFLOW model as 30 percent (the maximum equated effective pore space for
clastic sediments). The study adopted an estimated recharge of 0.0001 m3/ m2/ day.
199
This was calculated for the study area; the value was estimated by means of using
chloride mass balance method by Goni and Edmunds (2006).
According to the British Geological Survey (BGS, 2002) each person excretes about
4g of chloride per day (urine 90–95%, faeces 4–8%, and sweat 2%). Taking this into
consideration, if we multiply this estimate by the total number of latrine users per pit
(15 people per day) latrine and the total number of households (300) in the modelled
site, we will have chloride concentration of about 18000 mg/l within the modelled
domain. Lastly, a chloride half-life of 190,000 days (Bentley et al., 1986) was
considered for this study.
6.1.1 Modelling approach
In providing quantitative assessment of the impact of pit latrine on the underlying
aquifers of the case study area, an integrated modelling approach that combines the
outputs from MODFLOW/MT3DMS, and Model muse was used. The standard
advection-dispersion-reaction model (Harbaugh and McDonald, 1996; Butler et al.,
2003; Templeton et al., 2015) as outlined below was adopted:
…………………….. (1)
Where;
C = the concentration of chloride in unsaturated geological material (g/m3) (which is
equivalent to [mg/L]),
200
dL = the longitudinal dispersivity (m),
v = the mean pore water velocity (m/day),
R= the retardation coefficient (> 1 where sorption present),
ʎ= the linear decay coefficient (1/day), which is related to the half-life by T½ = log
(2)/ʎ (days).
For unchanging conditions, with a chloride concentration at the bottom of the pit
latrine of C0, then the concentration Cpw at a depth zw, the depth of the water table
below the base of the pit, is given as:
………………………………………………………………. (2)
Where:
………………………………….. (3)
The solution was implemented in MODFLOW/MT3DMS. In this regard, water flow
balance and chloride mass balance were modelled to estimate the dilution of the
chloride in the aquifer of the area and the resultant total concentration in the aquifer
(Cao) after different elapsed times 1825 days (1.577e+8) to 7300 days (6.307e+8)
i.e. 5-20 years from present.
Water flow balance: ………................ (4)
201
Chloride mass balance: … (5)
…….…………………………… (6)
Where:
Qai = inflow into the aquifer (m3/day),
Qao = outflow of the aquifer (m3/day),
Cpw = chloride concentration reaching the top of the water table (obtained from the
advection-dispersion-reaction model, in g/m3),
Cao = chloride concentration in the aquifer outflow
Cai = chloride concentration in the aquifer inflow (assumed to be 0),
Cr = chloride concentration from surface runoff (assumed to be 0),
qp = water flux from the pit latrine (0.002 m/d),
qr = groundwater recharge rate (m3/m2/day),
Ap = total surface area of the pit latrines (m2),
Ar = surface area of aquifer recharge (m2),
W = width of the aquifer (m),
H = height of the aquifer (m),
K = hydraulic conductivity (m/d) and
ii = hydraulic head gradient.
The above mentioned are represented in Figure 6.2 below;
202
Figure 6.2 Schematic descriptions of the imputed model parameters in the study area
A range of chloride concentration was observed based on the advection-dispersion-
reaction model. Chloride half-life of 190,000 days was used to capture the range of
Cpw values entering the aquifer at the depth of 10 m (Figure 6.2). This value is the
mean life time generally used to describe the exponential decay of chloride in
geological environment. The result of the simulation for the different periods and their
outcomes were summarised in Table 6.1. A range of chloride concentration was
observed based on the advection-dispersion-reaction model (Figure 2). The result of
the simulation for the different periods shows that chloride concentration will reach
37 mg/l and 42 mg/l in the years 2021 and 2026 respectively. Also, within the
modelled domain, a chloride concentration of 80mg/l will be attained in 2031.
203
Table 6.1 Summary of model simulation results and key outcomes
Model parameters Values Outcome (Cpw predicted)
Scenario 1 Stress period (days) 1.577e+8 Chloride concentration in the
upper aquifer reaches about 40 mg/l by the year 2021
ii (m/day) 0.01 qr (m
3/m2) 0.0001 Scenario 2 Stress period (days) 3.154e+8 Chloride concentration in the
aquifer reaches 80 mg/l in the year 2026
ii (m/day) 0.01 qr (m
3/m2) 0.0001 Scenario 3 Stress period (days) 4.173e+8 Chloride concentration in the
upper aquifer ranges up to 100 mg/l in 2031
ii (m/day) 0.1 qr (m
3/m2) 0.0001 Scenario 4 Stress period (days) 6.307e+8 Chloride concentration in the
modelled aquifer reaches about 300 mg/l by 2046
ii (m/day) 0.1
qr (m3/m2) 0.0001
Equally, a gradual increase in the concentration of chloride was observed during this
period. Furthermore, the concentration of chloride within the upper aquifer will reach
up to 100 mg/l in 2036. Lastly, the model show that chloride concentration in the
upper aquifer will reach up to 300 mg/l by the end of 2066, thereby exceeding the
maximum tolerable limits (250 mg/l) outlined by the WHO (2011). This trend is likely
going to be aggravated by population growth in the study area.
204
Figure 6.3 range of chloride concentration over different periods
Thus, based on the results presented above, the guidelines for protecting the
groundwater system in the study area will be developed in the next chapter (chapter
9). This will mitigate the impact of pit latrines on groundwater resources of the study
area. Despite the significance of the result of this modelling, it is noteworthy that
model results can never represent the natural system they represent. This is
primarily attributed to the predictive improbability of the modelling. Notwithstanding, it
is worthy to stress that the result of the prediction could be used to inform decision
provided that appropriate monitoring is put in place so that predicted results can be
checked. However, limitation exists as the predicted results are not checked in this
study due to constraints in resources. Therefore, further studies can take advantage
of this limitation.
205
6.2 Follow-up (household) survey data used for developing the new guidelines
The results of the survey (Table 6.2) below show that there is significant variation in
the depth of pit latrines among the various households surveyed. In this regard,
majority of the households (23.9%) have their pit latrines reaching the depth of 6
metres (Figure 6.4). Also, about 22.8% and 20.8% of the households surveyed have
their pit latrine depths in the range of 5 and 4 metres respectively. Others pit latrine
depths include 3 metres (12.7%), 2 metres (13.2%), and 1 metre (4.1%).
Figure 6.4 Percentage distributions of different pit latrine depths in the case study area
206
Table 6.2 Summary of household survey data (n=196)
Parameter Average Maximum Minimum
Depth of pit latrine
(metres)
4.92±9.54 6 1
Distance between pit
latrine & water point
(metres)
7.77±12.34 167 1
Distance between
dumpsite and water
point (metres)
73.8±77.6 800 10
Likewise, the distance between the pit latrines and the household‘s water supply
points varied significantly as summarised in Table 6.2 above. In this respect, majority
of the households (13.7%) fall within the range of 9 metres as the distance between
their pit latrines and water supply points. Also, about 10.7% and 10.2% of the
households have 2 and 8 metres as the maximum distance between their onsite
sanitation system and water points. Others are 7 metres (9.6%), 3 metres (6.6%),
and lastly the maximum distance recorded was 167 metres (0.5%).
Furthermore, the distance between the households and the dumpsites were also
determined. In this regard, varying distances were observed as summarised in Table
6.2 above. The result show that majority of the households (12.2%) are within 50
metres distance. Two households have the distance of about 800 and 500 metres
respectively. Also, about 1% and 2% of the households are within 300 and 200
metres limits respectively. Those within the moderate distance category include 55
Lastly, the survey result on the number of persons using the pit latrines daily
indicates that pit latrine with 1-10 persons per day constitutes about 35%, those in
the category of 11-20 persons per day make up about 55%, and those with more
than 20 persons per day constitutes the remaining 10%. The average number of
persons (users) per pit latrine per day is 15 people.
6.3 Establishing Sustainable Guidelines for Unconsolidated Sediment Hydrogeological Environment
In developing the guidelines for mitigating the impact of pit latrines on groundwater,
this section integrates the outcomes of the stakeholder engagement chapter (chapter
5), the modelling of chloride contamination presented in this chapter (see section
6.1), and the follow up survey results presented in Table 6.2. The results of the
modelling shows that at the depth of 10 metres, the potentials for chloride
contamination of the upper aquifer is evident. Accordingly, in the next 30 years,
chloride concentration in this aquifer will reach 300 mg/l. Thus, this information is
vital for the establishment of the guidelines for mitigating the impact of pit latrine on
groundwater in the study area. This type of sedimentary environment is the most
dominant and widespread hydrogeological environment in most parts of the Sudano-
sahel belt of West Africa. The guidelines can be used by the various stakeholder
groups in the region to protect the integrity of the underlying aquifers.
208
Table 6.3 Summary of key outcomes of foregoing chapters used in developing the new guidelines
Chapter Key outcomes/ findings Justification for using the outcomes in this section
Chapter 5 Identifies different stakeholder groups
The identified stakeholder groups will be assigned key roles in the management, maintenance and construction of onsite sanitation systems (Table 6.6).
Engages the different stakeholders groups in groundwater management decision making
Outlines the different views and opinions of the stakeholders engaged
This chapter (section 6.1) Chloride modelling
shows potentials for groundwater contamination of the shallow aquifer in different time scales
This information will be useful in developing the new guidelines; this is crucial for determining the overall desired mitigation framework
Chloride concentration will reach 300 mg/l in the next three decades
This chapter (section 6.2) Reveals the different
households pit latrine depths
This outcome is useful for benchmarking the tolerable pit latrine depths in avoiding potential contamination effects (Table 6.4).
Estimates average number of pit latrine users per day
Furthermore, secondary data were obtained from published papers and other grey
literatures for the purpose of comparing the new guidelines to globally accepted
standards. Also, the justification for the development of these guidelines by the study
was necessitated by the inadequacy of existing frameworks to mitigate the impact of
pit latrines on the groundwater system in the sub-region. Thus, this chapter identifies
a window of opportunity where sustainable guidelines aimed at protecting the
209
underlying aquifers can be developed and implemented locally, and across the sub-
region.
Additionally, these guidelines can complement those developed by the World Bank
and the UNDP; as mitigation framework for open dumpsites are not provided
currently. Therefore, adherence to the activities described in this study (Tables 6.4,
6.5, 6.6, and 6.7) will assist in achieving the overall aim of the study. The figure
below (Figure 6.5) explains the steps taken to develop the guidelines and the
activities involved in the different phases of the guideline development. Detailed
information on the development of the guidelines is outlined in the methodology
chapter (see sub-section 4.4).
Figure 6.5 Steps for developing the guidelines for mitigating the impact of on-site sanitation systems in groundwater
210
6.3.1 Mitigation Framework for Unconsolidated Sediment Hydrogeological
Environment
As previously evaluated in chapter 5, unconsolidated sediments consisting of gravel,
coarse sand, siltstone and clay (2mm to <2µm) dominate the hydrogeological
environment of the study area. Also, the modelling output indicates that chloride
concentration of about 300 mg/l will be recorded in the next three decades in the
study area. Thus, this chapter outlines different phases for the construction of pit
latrines in the unconsolidated sediments of the study area. The first phase is
regarded as the investigation phase, the second, and the third phase is considered
operation and maintenance phases respectively.
Taking the abovementioned into consideration, when citing a pit latrine in
unconsolidated sedimentary environment, firstly, it is important to carry out
systematic lithological/ sediment sampling at varying interval (vertical and horizontal)
to ascertain the type and distribution of the sedimentary materials. This will allow the
conceptualisation of the hydrogeological environment and the prediction of the
resultant processes occurring in the subsurface.
The second phase is the design and construction phase. This is the most important
stage at which sustainable design parameters for the construction of pit latrines and
open dumpsites are selected. Taking the surveyed households pit latrines shows
that most of the households have deep pit latrines (up to 6 metres). Thus, taking the
output of the modelling as a decision support tool, the study recommends that the
211
depth of the pit should not exceed 3 meters. This is because the modelling indicates
the potentials of chloride contamination of the local aquifer at the depth of 10 metres.
Also, the vertical distance between the pit and water table should be at least 10
meters in gravels and sandstones, 5-6 meters in siltstones and clays, and the lateral
distance between the pit and borehole (water well) should correspond to 10-15
meters for gravels and sandstones (up-gradient) and 25-30 meters (down gradient)
(Table 6.4). Comparison of the design parameters of this study were carried with
other studies (similar sites) and internationally standards (Table 6.5). The design
parameters for open dumpsites are; depth of dumpsite pit 0.5-1 meter, vertical
distance between bottom of dumpsite and water table should be at least 5 meters for
all unconsolidated materials, and lateral distance to water source should be at the
minimum of 10 and 15 meters for up-down gradients respectively (Figure 6.6).
Figure 6.6 Conceptual models for mitigating anthropogenic impact in unconsolidated sediments
Likewise, for unconsolidated materials with high porosity and permeability (coarse
sandstone), both pit latrines and dumpsites should be properly lined. In each case,
212
there is a need to create enough space for the emptying of the contents of the pit
latrines and dumpsites when they are full to their capacities.
The third phase is the operation and maintenance phase; this is a very vital stage for
ensuring the sustainability of the on-site sanitation systems. Efficient use of pit
latrines and dumpsites are recommended. When the contents of the pit latrine is full,
it is recommended that the sludge should be collected and mixed with other organic
wastes (composting) for beneficial use by local farmers. This will discourage the use
of chemical fertilisers, and it will provide job opportunities. Also, it is vital to develop
simple communal rules that will ensure the sustainable operation and maintenance
of these systems. The relevant stakeholders identified in chapter 4 (see section
4.2.1) can be engaged to carry out the functions summarised in Table 6.4.
Table 6.4 Best management guidelines for unconsolidated sediments
Phases Best management practices
Phase I (Exploration stage) Carry out systematic lithological sampling & investigation
Carry out geophysical/geotechnical investigation to determine the depth to the water table & groundwater flow direction
Ensure local stakeholder participation in investigations
Phase II (Design and construction) Total depth of the pit should not exceed 3 meters
The vertical distance between the pit and water table should be at least 10 meters in gravels and sandstones
Vertical distance between pit and water table should be between 5-6 meters in siltstones and clays
The lateral distance between the pit and borehole (water well) should correspond to 10-15 meters for gravels and sandstones (up-gradient)
213
and 25-30 meters (down-gradient) For dumpsites, depth of the pit should
vary between 0.5-1 meter depending on local condition
Vertical distance between the bottom of dumpsite and water table should be at least 5 meters for all unconsolidated materials
Lateral distance to water source should be at the minimum of 10 and 15 meters for up-down gradients respectively.
Consideration of adequate spacing for emptying purposes
Accommodate stakeholder inputs and suggestions in design
Phase III (Operation and maintenance) Efficient use of pit latrines and dumpsites in a sustainable way
Educate & engage local stakeholders in operation and maintenance
Develop local communal rules to guide operation & maintenance activities
Carry out periodic water quality monitoring excercise
Routine addition (at least monthly) of other organic wastes to enhance decomposition of faecal matter
Sealing of pit covers to enhance denitrification.
When the contents of the pit latrine is full, it is recommended that the sludge is collected and mixed with other organic wastes (composting) for beneficial use by local farmers.
214
Table 6.5 Comparison of the design parameters developed by this study to established standards
Local authorities, officials of the ministries of environment and health, community leaders, representatives of water user, youth and women groups, CSOs, NGOs
Inspection of environmental & sanitary conditions
Routine monitoring sanitary conditions of latrines Inspection and assessment of local water supply sources Educating residents on hygienic behaviour
√
√
√
State and local authorities, residents, CSOs, NGOs, professional organisations and
Design, building and repair works of latrines
Provision of sustainable designs for upgrading existing latrines
†
217
research institutions Routine repair and maintenance of existing latrines Awareness creation on adoption of new designs
†
√
State and local authorities, local businesses, residents, youth groups, officials of the ministries of water, environment and health
Facilitate small-scale enterprises participation in latrine emptying activities Effective emptying of pit latrines Latrine contents and sludge management
Investment, provision of loans, and enabling business environment for local businesses Provide training on effective emptying technologies Subsidising costs of emptying operations Providing employment opportunities for youths in latrine emptying technologies and sludge management
£ † £
£ √
State and local authorities, farmers & youth groups, NGOs, CSOs, and Community leaders
Adoption and implementation of policies that discourages the use of chemical fertilisers Adoption and implementation of policies that enables the use of composted or organic fertilisers
Providing incentives to farmers that use organic fertilisers Establish small scale composting plants in communities and compost pit contents for use by local farmers
State and local authorities, community leaders, residents, water user groups, NGOs, CSOs
Environmental community association Provision of stringent Legislation and their enforcement Sensitisation of communities on the implications of incessant waste disposal
Provision and enforcement of common rules on incessant waste disposal Review and implement laws on environmental protection Gender-sensitive awareness and education campaign on environmental protection
√
√
√
Residents, NGOs, CSOs, and all water user groups
Beneficiaries and dump site users
Adoption of effective waste management & disposal in dumpsites Mobilisation and coordination of environmental vigilance activities
√
State and local authorities, government agencies, water user groups, CSOs and NGOs
Inspection of environmental & sanitary conditions
Routine monitoring of dumpsites Inspection and assessment of dumpsites sanitary conditions Educating residents on effective waste management strategies
√
√ †
√
State and local authorities
Provision of incentives and welfares
Development of suitable local household waste incentive scheme (food-for-waste, waste-for-money programmes etc.)
This section presents the discussions on the aspects of chloride contamination
modelling due to the impact of pit latrine and the socio-technical aspects of the new
guidelines developed herein.
6.5.1 Chloride modelling
The ever increasing uses of both pit latrines and groundwater resources in Maiduguri
causes concerns that pit latrines may ultimately cause human and ecological health
impacts associated with microbiological and chemical contamination of groundwater.
Safe human excreta disposal is a vital component of environmental sanitation. In
both developing and developed countries of the world, proper excreta disposal is
amongst the most persistent public health problems. Concern about groundwater
contamination due to the impact of on-site sanitation system relates principally to
unconfined and, to some extent semi-confined aquifers. On-site sanitation systems
can have an adverse effect on underlying aquifers, because faecal matter
accumulates in-situ and leaching of contaminants into the geosystem may possibly
occur.
In the study area, pit latrines are the most common forms of onsite sanitation
facilities. In most cases they are regarded as the suitable means of disposing human
wastes, however, the excessive use and proliferation of onsite sanitation system
greatly raises concern about contamination of groundwater. A lot of this problem
221
arises in rural areas, and in densely populated peri-urban areas where local,
shallower, and often untreated, groundwater sources are used. In such conditions,
microbial contamination is possibly as a result of poor well design and/or
construction. In recent years, this situation has caused increased nitrate and chloride
concentrations in the underlying aquifers of Dhaka, Greater Buenos Aires, Lagos,
and Nairobi (World Bank, 2002). Therefore, the use of onsite systems is not
recommended unless the water table is extremely low and sediment conditions are
not likely to contribute to susceptibility of groundwater pollution.
Noteworthy, the analyses presented in this chapter depicts chloride as an important
indicator parameter of faecal contamination rather than toxic contaminant with
greatest health effects on humans. Chloride concentration in groundwater is
commonly investigated due to its high concentrations in human excreta and its
relative mobility in the geosystem. It is characteristically transported in the
subsurface with minimal retention during groundwater flow, and chloride
concentrations are tracked with nitrate levels (Banks et al., 2002; Ahmed et al.,
2002).
Similarly, nitrate and ammonia are among the most important parameters used in
determining groundwater contamination due to the influence of pit latrine. They are
widely investigated due to their health risks (WHO 2006). Both nitrate and ammonia
are derived directly or indirectly from latrine wastes, organic wastes, fertilizers and
farm animal operations. Their concentrations in shallow aquifers in sub-Saharan
Africa are reported by some authors (Ndambuki et al., 2012; Graham et al., 2013;
222
and Templeton et al., 2015). Different technologies for reducing the impact of nitrate
and ammonia exist.
Technologies such as permeable reactive barrier, phytoremediation, ion exchange
processes will help to reduce the concentration of these contaminants to tolerably
safe limits. However, these engineered solutions alone cannot address the situation.
They need to be integrated with non-engineering solutions; such as preventative
measures of best management practices in a holistic fashion. It is worth mentioning
that these technologies are often expensive in nature and are difficult to implement,
especially at the household and community levels in resources scarce countries.
Hence, the need to develop a local strategy contained herein the study.
Equally, the advances in technology and their practical application may greatly
reduce the microbial and chemical threats to underlying aquifers. However, despite
the advances, it is still unclear whether these options are economically viable and
culturally acceptable to people in low-income countries (Dzwairo et al., 2006). Due to
this reason, the study proffers a pragmatic (socio-technical) methodology that is
simple and straight forward to implement at the different levels of pit latrines design,
construction, and management in the study area. This methodology will mitigate the
impact of onsite sanitation systems on groundwater in sub-Saharan Africa.
As the contaminants are released from their sources, the unsaturated zone above
the aquifer acts as buffer that reduces pollution effects of aquifers. The local geology
223
of the study area has demonstrated the ability to remove faecal microorganism and
chemical compounds by retarding their movement towards the saturated zone. Thus,
rock types and the degree of consolidation of sediments are key factors to consider
in assessing the vulnerability of an aquifer to pollution in a particular area.
Furthermore, within the saturated zone, dispersion and dilution play an important role
in reducing the concentration of the contaminants dissolved in the groundwater.
The thick Chad Formation (alluvium cover) acts like a natural filter; it has the
potentials to impede the movement of the invading contaminants. The physical and
chemical characteristics of the sand and silt-stones aid ion exchange processes
within the local geological environment. In this respect, the alkali metals derived from
the primary minerals react with the various anions and cations derived from the
above ground anthropogenic sources. Equally, in this type of geological
environment, most inorganic contaminants are adsorbed to the surfaces of the larger
sediment particles while the organic contaminants are adsorbed to the surfaces of
the secondary mineral particles.
Therefore, in view of the local geology of the study area, the development and
application of an integrated approach; that combines both technical (review of design
and construction parameters) and social dimensions (stakeholder inclusions and
defining their stakes) will address the situation. Others are systematic lithological and
hydrogeological mapping in determining the depth to the water table, investigating
the geological material characteristics prior to installing on-site systems.
224
Furthermore, given the siting standards for latrine construction, it is important to re-
evaluate the vertical and lateral separation between the groundwater supply source
and the pit latrines. This is because different hydrogeological environments require
different strategies in addressing local problems. A limited number of field studies
(World Bank, 2002; Graham et al., 2013) have shown that a lateral and vertical
separation distance of about 10 and 2-4 metres respectively between the source and
the receptor is sufficient enough to reduce the concentrations of faecal indicator
contaminants to the minimum levels.
Therefore, balancing the risks of onsite sanitation systems and their potentials for
impacting groundwater resources negatively is fundamental in the study area.
Therefore, more efforts are needed to develop sustainable and more robust
approaches to siting pit latrines. Sustainable guidelines should be developed and
tested empirically to ensure protection of groundwater quality after their
implementation under local conditions.
Chloride concentration is one of the best ways of measuring the effectiveness of the
existing operational frameworks for pit latrines design, management, and operation.
The assessment of chloride concentration in groundwater due to the impact of pit
latrine is best carried out by predicting their future concentrations. This can be
carried out with different modelling techniques. The MODFLOW codes developed by
225
the United States Geological Survey (USGS) is one of the best modelling tools that
performs this function (USGS, 2000), .
The modelling carried out in this study shows that the depth of the upper aquifer of
the study area ranged between 15 and 25 metres. This implies that the local aquifer
is not likely to be impacted negatively by the existing onsite systems in the study
area. Theoretically, the chances of contamination increases significantly in
geological settings where the water table is shallow (1m-10m). The output of the
modelling indicates that the hydraulic heads and recharge rates are having
significant influence on the amount of predicted chloride concentrations in the
boreholes of the study area.
The result of groundwater modelling can be used by the local water managers and
other relevant stakeholders who need to make informed decision on groundwater
management (Rushton and Skinner, 2012). In the study area, the interplay between
the density of pit latrines and booming population will further increase chloride
concentration in the groundwater.
Despite the low adverse health effects by chloride, when they react with sodium
found in the natural environment, they will form salts. Groundwater with
concentrations of chloride in excess of 230 mg/l that discharges to surface water
may cause toxic effects to aquatic life (USEPA, 2002). However, too much intake of
226
sodium chloride salt is a major known risk factor for hypertension or high blood
pressure (USGS, 2000).
In addressing this problem, there are a wide range of mitigation frameworks that can
be adopted in the short-medium-and long terms that will provide solutions to the
perceived risks posed by pit latrines on the underlying aquifers. Mitigation
frameworks such as keeping the pit well above the water table, well head protection,
standard design and construction parameters were suggested by various authors
(Almasri, 2007; Tredoux et al., 2000; Templeton et al., 2015).
In view of the above, site-specific analyses of safe sanitation options suitable for
developing countries have been outlined by the British Geological Survey (BGS)
(Lawrence et al. 2001). The BGS guidelines provide a set of rules for determining the
optimum horizontal separation between sanitation facilities and drinking-water
sources for a variety of geological environments. These guidelines have been tested
in Bangladesh (Ahmed et al. 2002), Uganda (Howard et al. 2003), and Argentina
(Blarasin et al. 2002) and have been advocated as sensible practice for aquifers
limited measured data.
The possibilities for extensive groundwater contamination from the influence of
onsite sanitation systems can be controlled by factors such as design and
construction technology, operation and maintenance, and other social factors such
as sustainable use. Also, pit latrine depth, presence of liners, and the quality of
227
construction can greatly influence contaminant leaching and containment (Graham et
al., 2013).
Lastly, the problems of the existing on-site sanitation systems can be addressed by
involving all the relevant stakeholders in addressing the situation. This can be
achieved by providing simple training activities, capacity building, and gender
sensitive awareness-creation for the primary stakeholders (local residents). While
the state and local authorities and other strategic stakeholders‘ needs to focus on the
aspects of technical and financial capacities. Also, the local council and the relevant
state agencies needs to carry out a comprehensive inventory of the households with
pit latrine depth ranging between 6-10 metres (Table 6.2). This will help in the
comprehensive assessment of the likely treats to groundwater. Short term solutions
of emptying the contents of the existing pit latrines in the households affected and
the provision of subsidy to them by the government in constructing improved pits will
be vital.
6.5.2 Follow-up survey and new guidelines development
Considering the results obtained from the household survey, an average pit latrine
depth of 4.92 metres and maximum depth of 6 metres were obtained across the
various households. This suggests that most households have overlooked the
implications of greater pit latrine depths on groundwater quality. Most likely the
households believe that the greater the depth, the longer the time it takes to fill. Also,
an average distance of 7.77 metres was recorded between pit latrines and water
228
points. This result is at variance with the recommended World Bank/UNDP/UNICEF
guidelines between pit latrines and water points. The shorter distances between
dumpsites and water points across the various households obtained in the case
study area may be ascribed to the poor sanitary practices of the local communities.
Thus, there is the need for adequate and proper awareness campaign programme in
the area. Also, it is worthy to note that short lateral distance between onsite
sanitation systems and water points in many parts of sub-Saharan Africa and the
poor sanitary practices such as open defecation by individuals as well as the
dumping of wastes near water supply points may lead to contamination and its
associated water- borne diseases.
Although, the guidelines developed by the World Bank, UNDP, and UNICEF are
aimed at mitigating the impact of onsite systems on groundwater. Such criteria may
not be suitable for all localities due to the differences in natural geological conditions
and this may not guarantee total groundwater protection. Therefore, the guidelines
developed by this study can be suitable for the case study area and other similar
sites across the region. Likewise, they can be integrated with the existing guidelines
in ensuring sustainable groundwater protection.
In view of the above, the guidelines proposed in this chapter are an important step
towards ensuring the sustainable management of groundwater resources in sub-
Saharan Africa region. This is because unconsolidated sediments (sandstones,
229
siltstones, and clays) serves as an important hydrogeological environment; that
directly supply water for about 70-100 million people mostly rural dwellers in sub-
Saharan Africa.
The possibilities for extensive groundwater contamination from the above ground
anthropogenic activities (pit latrines and open dumpsites) can be controlled by
factors such design and construction technology, operation and maintenance, and
other social factors such as sustainable use. Also, pit latrine depth, presence of
liners, and the quality of construction can greatly influence contaminant leaching and
containment. This view was also expressed by Graham et al. (2013) in his
assessment of pit latrine design criteria.
Lastly, the problems of the existing on-site sanitation systems can be addressed by
involving all the relevant stakeholders in addressing the situation. This can be
achieved by providing simple training activities, capacity building, and gender
sensitive awareness-creation for the primary stakeholders. While the state and local
authorities and other strategic stakeholders should focus on the aspects of technical
and financial capacities. Also, the local council and the relevant state agencies need
to carry out a comprehensive inventory of the households with pit latrine depth
ranging between 4-6 metres. This will help in the comprehensive assessment of the
likely threats to groundwater. Short-term solutions of emptying the contents of the
deep pit latrines in the households affected and the provision of subsidy to them by
the government in constructing shallow pits will be vital.
230
6.6 Summary and conclusion
The first part of the chapter modelled the concentration of chloride in the
groundwater across different time scales. Making the best case assumptions, the
modelled aquifer as analysed in this chapter is currently safe for consumption and
other domestic use. However, the tolerable limits of chloride concentration (250mg/l)
are likely to be exceeded in the next three decades (30 years). This can be greatly
influenced by demographic factors in the study area.
However, recommendations for mitigating groundwater impacts can be both
qualitative and quantitative. Many countries across sub-Saharan Africa are already
having developmental challenges attributed to poor infrastructure. Therefore, an
alternative guideline for the mitigation of the impact of onsite sanitation system is
important in the study area.
The second part of the chapter reveals that both vertical depth and horizontal
spacing play significant role in mitigating the impact of onsite sanitation systems on
groundwater aquifers. It discloses that shorter vertical depths and longer lateral
separation between the onsite sanitation systems and water table as well as supply
points will significantly reduce the risk of chloride contamination of underlying water
resources.
231
The dependence on groundwater as a primary water supply source is increasing in
sub-Saharan Africa region. Equally, the provision of unsustainable sanitation
facilities threatens the available groundwater resources. Accordingly, there is the
need to understand how pit latrines and open dumpsites affect available
groundwater in the various hydrogeological environments and develop guidelines for
their protection. Therefore, careful siting of pit latrines and the adoption appropriate
local technology and the management of existing onsite sanitation systems will go a
long way in addressing the situation.
Also, the second part of this chapter has developed a realistic and sustainable
guideline that will mitigate the impact of pit latrines on the groundwater of the study
area. In general, unconsolidated sedimentary environments (sandstone, siltstone,
and clay) have the highest attenuation capacities of contaminants. However, it is
worthy to note that there are multitudes of guidelines and design criteria developed
by World Bank joint programmes across the globe, but gap exists in developing
suitable guidelines for mitigating the impact of dumpsites as offered by this study.
Lastly, this chapter has investigated the concentration of chloride in the groundwater
of the study area in assessing the impacts of pit latrine, the chapter stresses that the
involvement of the local stakeholders in the design, operation, and maintenance of
the onsite sanitation systems will ensure sustainability and the achievement of
sustainable groundwater management. It concludes that the implementation of the
appropriate guidelines for the management of existing on-site sanitation systems will
232
protect the integrity of the underlying aquifer. The next chapter presents the
conclusions, policy and future studies recommendations respectively.
233
CHAPTER 7
CONCLUSIONS AND RECOMMENDATION FOR FUTURE WORK
7. Introduction
In this concluding chapter, it is imperative to review and discuss the overall research
undertakings reported in the thesis; in order to ascertain whether or not the research
objectives and questions guiding the study have been addressed adequately.
Therefore, the objective of this chapter is to present the conclusion on all the key
findings of the study and provide recommendation for future work.
7.1 Conclusions
This PhD research was set out to develop a sustainable groundwater management
strategy to de implemented in the Nigerian sector of the Chad Basin. This study has
found out that stakeholder exclusion in the management of groundwater is a key
feature of the current system. The study has identified and engaged the various
stakeholder groups (including women groups). As a practical consequence, the
study carried out a local capacity building and enhancement workshops for the
primary water users with low capacities. This has built local institution for
groundwater management in the study area and enhanced communication between
the different stakeholder groups. The stakeholder participation has generated real
benefits, fostered cooperation in developing the alternative guidelines. Hence, there
is the need for greater participation by all the stakeholders.
234
Consequently, the study used realistic evaluation to show that the current
approaches to groundwater management in the case study area are not making the
desired impact. Based on the observations from the engagement of the strategic
stakeholders (government officials) it was observed that there is the need for
developing alternative guidelines that is suitable for the case study area. As a result,
the study developed new guidelines and offered some policy recommendations (see
sub-section 7.2) that will bring the desired change.
Also, another major important aspect of the study is that it has built new knowledge
on the status quo and has established a synergy between science and society in the
case study area. This synergy can be replicated across the various sedimentary
basins (Sokoto, Bida, Benue and Gongola) of Nigeria. Furthermore, the socio-
hydrogeological approach outlined in this study can bridge the gap between the local
stakeholders (water users) and groundwater scientists (hydrogeologists). This can
stimulate the perception of the citizenry towards the importance of hydrogeology to
the society.
The major groundwater contamination problems are mainly attributed to the impact
of pit latrines, open dump sites, and other non-point sources across the case study
area. This study has identified and ranked the potential sources of groundwater
contamination in the case study area in mitigating their impact on the underlying
aquifer.
235
Geologically, the study has provided base line data on the petrographic,
Granulometric, and mineralogical characteristics of the Quaternary sediments of the
Nigerian sector (SW) of the Chad Basin. The study has identified and classified the
primary, secondary, and accessory minerals that made up the Chad Formation, it
has determined the grain sizes of the various aquifer materials as well as their
chemical compositions.
The groundwater quality results suggest that the water quality is presently good for
consumption and other domestic uses. The petrographic analyses suggests that the
upper horizon of the sedimentary units of the case study area is dominated by fine
grained materials which likely provided better physico-chemical barriers; due to their
higher sorption capacity and relatively lower permeability than the coarse sands
occurring at the base. In the case study area, it is likely that the above factors helped
in minimising the amount of contaminants concentration in the groundwater.
This study modelled chloride concentration to provide better understanding on how
they affect the quality of groundwater. The model is first of its kind in the study area
and can be used as a decision support tool to solve existing and emerging
groundwater management problems. The outputs of the model will be useful to the
local stakeholders; especially the state policy makers and other relevant
stakeholders in making informed management decisions.
236
Methodologically, the study has integrated the scientific (hydrogeological) and the
social-strands in developing an alternative guidelines for the management of
groundwater resources. This has strengthened the synergy between the two
methodological dimensions. Therefore, by combining the two methodologies,
groundwater scientists can manage the hydrogeological and social boundaries in
ways that will simultaneously enhance the creditability and the legitimacy of their
investigations. This can expand the new concept of people and water (socio-
hydrogeology) in the case study area; this has great significance because this study
has produced a base line data for achieving sustainable development in the region.
Overall, the study has incorporated social dimensions into Hydrochemical
investigations in addressing societal problems and in achieving sustainable
management of vulnerable aquifers into the future.
In this study, the combination of the descriptive and inferential statistical methods
and content analysis presented in the study are robust. This has informed the study
about the relationships that exists between the various socio-environmental variables
and it has enabled the researcher to test the accuracy of the different views of the
stakeholders. Additionally, this view was also validated by the content analysis
employed in the qualitative aspect of the study; where stakeholders expressed their
views and opinions in the interviews and focus group discussions. The combination
of multiple approaches to analysing quantitative and qualitative data enabled the
development of the new guidelines presented herein.
237
Taking all the above mentioned statements into consideration, limitations exist in the
study. The major limitations of the study as far as the Hydrochemical analyses is
concerned is that the parameters selected and analysed are limited to anthropogenic
activities related to the effects of urbanisation and population growth. These
parameters are chloride, nitrate, phosphate and sulphates. Thus, it is noteworthy that
complex hydrocarbons and their derivatives are not included. This aspect has not
been addressed in the study because of the non-existent nature of the activities of
the petroleum industry. However, the current agitation for harnessing the petroleum
potentials in the Chad Basin (case study area) might likely affect the groundwater
system in the future.
Moreover, some possible limitations that have not been discussed extensively are
related to issues of groundwater management in the context of climate change.
Although, aspects related to climate change conditions are greatly appreciated, their
details in the context of this study are limited. It is paramount to stress that climate
change in water governance needs to be considered in the context of sub-Saharan
Africa in order to reduce vulnerability of the poor people of the region in maintaining
decent and sustainable livelihoods.
Another limitation of this study is that it has not covered legal aspects related to the
development and management of groundwater resources. Water legislation is
usually difficult to craft, and therefore studies covering aspects of groundwater
legislation should commence as soon as possible. Furthermore, the study is limited
to the aspects related to the economics of groundwater management.
238
Major limitation exists in the modelling aspect of the study; the modelling exercise is
theoretical at the moment; therefore, the comprehensiveness of the model can be
questionable as the results of the model were not tested in real sense. Additionally,
the guideline developed by the study has not been used by the primary stakeholders.
However, the strategic (institutional) stakeholders have promised to integrate the
guideline recommendations into their existing policies. It is noteworthy that these
guidelines are not only limited to the Chad Basin alone, they can be transferred and
applied in many sedimentary Basins of Africa. In this respect; it can be applicable in
the Iullemmeden Basin, Benue Basin, Tindouf and Taudeni Basins in West Africa.
Other Basins are Oulad Abdoun Basin, and the Sirte Basin in North Africa, and
Congo Basin in East Africa. Also, the concepts of the study can be applicable in the
sedimentary environments of the southern Africa region. On the basis of country by
country the guidelines developed by the study can be applicable in almost all the
sedimentary basins of the 53 countries of the African continent.
This is because most African countries are experiencing similar challenges attributed
to uncontrolled urbanisation and population growth. Also, except for few countries,
almost all the countries are confined to arid and semi-arid climates. Thus, the scope
of the study in terms of implementation can go beyond the local case study area to
cover all the areas of the semi-arid climate. The implementation of the guidelines
developed herein requires incremental and radical approach to address the
differences in opinion of the various stakeholder groups, in achieving sustainable
development in the study area and the continent as a whole.
239
The recommendations proffered by this study can be implemented by the various
local, state, national, and regional governments in collaboration with the relevant
stakeholders across the study area and the continent. At, the local level,
communities can be empowered by the local authorities to participate actively in
groundwater management activities. Time scales of 1-30 years, can be set as short
(1-10 years), medium (16-20 years), and long (21-30 years) terms respectively.
These projections can be set to start the process of implementation. In this respect,
detailed explanations on how to ensure the implementation of each policy is outlined
below.
7.2 Policy Recommendations for Attaining a Viable groundwater System in Sub-Saharan Africa
Taking into account the analysis of the stakeholder engagement presented in
chapter 5. It can be concluded that the solutions to the intractable issue of
groundwater contamination as opined by the various stakeholder groups in the study
requires an integrated approach and are urgently required. It can be assumed that
the problems of groundwater management in Nigeria and many other countries in
sub-Saharan Africa are similar in nature. In this regard, the following
recommendations need to be considered in achieving sustainable management of
water resources.
240
7.2.1 Educating the Citizenry on Groundwater Protection
Taking into consideration, evidences presented in the study on the lack of knowledge
about groundwater contamination; especially in the focus group and household
survey. There is the need to educate the citizenry on issues of groundwater
protection. The first step of achieving this is by educating the general populous to
create awareness among the general population on the benefits of safe, clean water
and the environment. If not controlled, the water sources needed for future
development and population growth are likely going to be degraded by current waste
disposal practices and the stakeholders (especially those with low capacities) needs
to be made aware of this to help curb contaminating practices. In this regard, the
state government, through the ministry of education and the state primary education
board, has an important role to play by reviewing the current curriculum to
incorporate environmental education to the existing curriculum of education so that
future actors (pupils) will recognise the importance of sustainability. At present, the
National School Curriculum only recognised health education and social studies at
pre and post-primary school levels.
7.2.2 Provision of Adequate Legislation for Participatory Water
Management
The institutional stakeholders engaged via the interviews opined that current
legislative framework is not very clear on the role of stakeholders in the management
of groundwater resources. Also, the primary stakeholders engaged via the focus
group and household surveys suggested that the adoption strict laws will address the
241
current problem. Thus, federal, state and local government authorities in Nigeria
must liaise with the citizenry to introduce legislation that will define the role of
stakeholders in groundwater development and legislations that will constrain the
activities that might compromise groundwater quantity and quality.
7.2.3 Waste Management
Lack of concerns on issues of waste management was also pointed out by the
interviewees, the focus group participants, and the household survey respondents.
Thus, developing a robust waste management framework that considers the ethics,
beliefs and cultural norms of the people is essential. For this reason, the state and
local governments, and all other relevant institutions should adopt and implement
programmes that will empower local women and youth groups through beneficial
waste management activities. This has multiple benefits as it will ensure the
protection of groundwater resources and the environment, this will help to prevent
illnesses related to poor sanitary conditions. As an ancillary benefit it will create
employment opportunities for the jobless women and youths who are typically the
lowest income earners across the sub-region.
7.2.4 Institutional Integration and Streamlining of Responsibilities
The institutional stakeholders are of the opinion that there is no proper coordination
among the local, national and international institutions on integrative management of
water resources. Also, they pointed out that existing structure (top-down
242
governance) is a major impediment and often results in inconsistency of government
policy implementation. Therefore, a more integrated governance framework that
brings together the relevant stakeholders (government ministries, water user groups,
academia/technical experts and all other relevant institutions) should be put in place,
so that water and waste management are handled as a subsystem of a larger
planning system, each impacting on the other. Additionally, the institutional
framework for solid-waste management must be addressed, with a view of bringing
together the relevant institutional players and clarifying their responsibilities in each
case.
7.2.5 Additional Commitment by the Various Tiers of Government
All the institutional stakeholders are of the opinion that there is the need for further
commitment by the various tiers of government in Nigeria. Thus, the federal, states,
and local governments needs to further commit their resources as contained in the
national water policy in improving the access to safe, clean, and affordable water in
the country. However, despite their commitments, the Millennium Development Goal
(MDG) on access to water and sanitation remained unrealistic. Different countries
have started the adoption and implementation of the Sustainable Development
Goals (SDGs). There is the need for the various governments in the sub-region to
fully localize the SDGs in prioritising the post-2015 development agenda for water
resource management in their national and regional developmental policies. Also, it
is equally important, for the sake of sustainable water resource management, to
243
ensure that there are adequate returns from cost recovery to finance data collection,
monitoring of system status, and resources management.
7.3 Recommendations for Future Research
While the research activities reported in this thesis have addressed a number of
critical issues relating to sustainable groundwater management in sub-Saharan
Africa region, it is imperative to identify some key areas of research that would
complement and progress the findings of the study. Consequently, the following
recommendations are made for future research work;
In the case study area and sub-Saharan Africa region, groundwater is strongly
precipitation-dependent. This study has not directly investigated the impacts
of climate variability on groundwater resources. Hence it is important to carry
out further hydrological/hydrogeological research on the large-scale effects of
climate change on the water resources (on a temporal and spatial scale)
across the case study area and the entire sub-region.
It is also imperative to evaluate the possibilities of groundwater contamination
as a result of organic chemicals and heavy metals that have not been covered
in this study. There is an urgent need to assess the extent of the problem and,
ultimately, develop guidelines for the detection and evaluation of
contamination caused by these chemicals.
244
As groundwater is still viewed as a free good in the study area and many
parts of Africa, there is the need for studies to focus on the aspects related to
economics and accounting of groundwater resources. This will enable the
derivation of the maximum benefits from the available groundwater resources.
Therefore, studies that will focus on the opportunity costs involved in current
and future allocation patterns are vital in this region.
Socio-hydrogeology is still at its infancy, this study has attempted to take it to
the next level. However, there is more to be done in this regard. Thus, social
scientists, engineers, geologists and other relevant disciplines needs to take
the social aspects of this study to the next level in understanding the
sociology of groundwater management.
Future studies should focus on extending the comprehensiveness of the
model developed by this study. This should include testing the model
including the determination of its effectiveness.
Studies that focus on the monitoring and implementation of the guidelines
developed by this study should be considered in the future. This will provide
more details on the effectiveness of the guidelines in the future.
245
References
Abdo, G., & Salih, A. (2012). Challenges Facing Groundwater Management in Sudan.
Acharya, B. (2010). Methodology: social exclusion and group mobilization. Contributions to Nepalese Studies 36, Special Issue, pp. 23-47.
Adelana, S. M. (2006). A quantitative estimation of groundwater recharge in parts of the Sokoto Basin, Nigeria. Environ. Hydrol. 14(5):105-119.
Adelana, S. M., Olasehinde, P. I., Vrbka, P. (2003). Isotope and geochemical characterization of surface and subsurface waters in the semi-arid Sokoto Basin, Nigeria. Afric. J. Sci. Tech., (AJST), 4(2): 80-89.
Africa Infrastructure Country Diagnostic (AICD) (2011). Africa‘s Infrastructure: A Time for Transformation. African Development Bank Group, World Bank. Available: http://www.infrastructure.org/aicd/library/doc/552/africa‘s-infrastructure-time transformation [01/01/ 2013].
Ahmed, M. F. (2002). A low cost technique of arsenic removal from drinking water by coagulation using ferric chloride salt and alum. Water Science and Technology: Water Supply, 2(2), 281-288.
Akujieze, C. N., Coker, S. J., Oteze, G. E. (2003). Groundwater in Nigeria- a millennium experience-distribution, practise, problems and solutions. Hydrogeology 11(2):259-274.
Al‐Ahmari, M. (2006). Measuring Groundwater Contamination in Agricultural & Urban Areas Using GIS. [Online] available: http://faculty.kfupm.edu.sa/crp/bramadan/Term_051_CRP‐ [01/09/2014].
Alexander, M. (2000), Aging, bioavailability and overestimation of risk from environmental pollutants. Environ Sci Technol 34:4259–4265
Ali, A. F. (2012). Groundwater Pollution Threats of Solid Waste Disposal in Urban Kano, Nigeria: Evaluation and Protection Strategies. A PhD thesis submitted to The University of Manchester (unpublished).
Aller, L., Bennett, T., Lehr, J. H., Petty, R. J., Hackett, G. (2003). DRASTIC: A standardized system for evaluating groundwater pollution potential using hydrogeologic settings. EPA-600/2-87-035.
Alley, W. M., and Leake, S. A. (2004). The journey from safe yield to sustainability. Ground Water, Vol. 42, No.1, January-February, 12-16.
Almasri, M. N. (2007). Modeling nitrate contamination of groundwater in agricultural watersheds. Journal of Hydrology, 343(3), 211-229.
Anderson, D.M., Kaoru, Y. & White, A. (2010). Estimated Annual Economic Impacts from Harmful Algal Blooms (HABs) in the United States. Woods Hole Oceanographic Institution Technical Report.
Andrews, R. (2003). Research questions. Bloomsbury Publishing.
APHA (2013). Standards Methods for the Examination of water and wastewater (20th Ed.) Washington, DC: Am. Public Health Assoc.
Arnell, N. W. (1999). A simple water balance model for the simulation of stream flow over a large geographic domain. Journal of Hydrology 217, 314–335.
Atabey, E. (2005). In: Atabey, E. (ed) Publications of chamber of geology engineers of Turkey. TMMOB, Ankara.
Atmadja, J., and Bagtzoglou, A. C. (2001). Pollution Source Identification in Heterogeneous Porous Media. Water Resour. Res. 37, 2113-2125.
Ayenew, T., Masersha, P., and Seleshi, B. A. (2004) Ethiopia Country Report prepared for project: Groundwater in Sub-Saharan Africa: Implications for food security and livelihoods‘ International Water Management Institute, Sri Lanka.
Bagtzoglou, A. C. (1990). Particle-grid methods with application to reacting flows and reliable solute source identification. Ph.D. Dissertation, University of California Irvine, 246.
Bakari, A. (2014a). Hydrochemical assessment of groundwater quality in the Chad Basin around Maiduguri, Nigeria. Journal of Geology and Mining Research, 6(1), 1-12.
Bakari, A. (2014b). Assessing the Impact of anthropogenic activities on groundwater quality in Maiduguri, Nigeria.
Bakari, A. (2014c). An investigation of the physical and mineralogical characteristics of the quaternary formation of the Chad Basin, Nigeria.International Journal of Scientific & Technology Research 3 (8).
Barber, W., Jones, D. G. (1960). The Geology and Hydrogeology of Maiduguri, Borno Province. Records of the Geological Survey of Nigeria, pp. 5-20.
Barcelona, M. J. (1984). Chemical Problems in Ground-Water Monitoring Programs. In: Proceedings of the 3rd National Symposium on Aquifer Restoration and Ground-Water Monitoring, Columbus, OH, May 25-27, 1983, p. 263-271, D. M. Nielsen, cd., National Water Well Association, Water Well Journal Publishing Company, Worthington, Ohio, 461 pp.
Barcelona, M. J., Gibb, J. A. Hellfrich E. E. (2004). Practical Guide for Ground-Water Sampling; U.S. Environmental Protection Agency, EPA/600/2-85/104, 169 pp.
Barcelona, M. J., Helfrich, J. A., and Garske, E. (2005). Sampling tubing effects on groundwater samples. Anal. Chem., 57: 460.
Barry, B., and Obuobie, E. (2011) Status report on groundwater in Mali: Country Report prepared for project: ‗Groundwater in Sub Saharan Africa: Implications for food security and livelihoods‘ International Water Management Institute, Sri Lanka.
Belton, V., & Stewart, T. (2002). Multiple criteria decision analysis: an integrated approach. Springer.
Benbasat, I., Goldstein, D. K., Mead, M., (1987). The case research strategy in studies of information systems. MIS Quart. 11 (3), 369–386.
247
Benjamini, Y., and Hochberg Y. (1995). Controlling the false discovery rate: a practical and powerful approach to multiple testing. Journal of the Royal Statistical Society. Series B (Methodological) 57 (1), 289–300.
Benjamini, Yoav; Yekutieli, Daniel (2001).The control of the false discovery rate in multiple testing under dependency. Annals of Statistics29 (4): 1165–1188
Bentley, R. A. (1986). The characterization of biologically available strontium isotope ratios for the study of prehistoric migration. Archaeometry, 44(1), 117-135.
Berkes, F., Colding, J., and Folke, C., eds. (2003). Navigating Social-Ecological Systems: Building Resilience for Complexity and Change. Cambridge, UK: Cambridge Univ. Press
Berkowitz, B., Dror, I., & Yaron, B. (2008). Characterization of the Subsurface Environment. Contaminant Geochemistry: Interactions and Transport in the Subsurface Environment, 3-26.
Berkowitz, B., Dror, I., & Yaron, B. (2014). Selected Research Findings: Contaminant Transport. In Contaminant Geochemistry (pp. 285-345). Springer Berlin Heidelberg.
Bhaduri, B., Minner, M., Tatalovich, S. and Harbor, J. (2001). Long-term hydrologic impact of urbanization: A tale of two models. Journal of Water Resources Planning and Management 127(1), 13-19.
Biswas, A. K. (2004). Appraising the Concept of Sustainable Development: Water Managementand Related Environmental Challenges (Oxford: Oxford University Press).
Blöschl G. (2011). Scaling in hydrology. Hydrological Processes 15: 709–711.
Bolan, N. S., Duraisamy, V. P., et al. (2003). Role of inorganic and organic soil amendments on immobilisation and phytoavailability of heavy metals: a review involving specific case studies. Soil Research, 41(3), 533-555.
Bollag, M. T., Liu, L. (1999). Fate of herbicides influenced by biotic and abiotic interactions. Chemosphere, 39(2), 333-341.
Borno State Government (BOSG) (2014). Information guide (online) pamphlet.
Borno State Government (BOSG). (2013). Borno state information and guide (online) available: http://www.bornostate.gov.ng/ [12/04/2013].
Bouraoui, F., Vachaud, G. and Chen. T. (2008). Prediction of the effect of climatic changes and land use management on water resources. Physics and chemistry of the earth 23(4), 379-384.
Braune, E., Hollingworth, B., Xu, Y., Nel, M., Mahed, G., and Solomon, H. (2008). Protocol for the Assessment of the Status of Sustainable Utilization and Management of Groundwater Resources with Special Reference to Southern Africa, Water Research Commission. WRC report no TT 318/08.
Braune, K., Rual, J. F., Vazquez, A., Stelzl, U., Lemmens, I., Hirozane-Kishikawa, T., & Vidal, M. (2008). An empirical framework for binary interactome mapping. Nature methods, 6(1), 83-90.
Bregnard, T. P., Haner, A., Hohener, P., & Zeyer, J. (1997). Anaerobic degradation of pristane in nitrate-reducing microcosms and enrichment cultures.Applied and Environmental Microbiology, 63(5), 2077-2081.
British Geological Survey (BGS) (2002) Groundwater Fact Sheet: The Impact of Urbanisation.
British Geological Survey (BGS) (2003). Groundwater Quality: Nigeria
British Geological Survey, (2012). Groundwater in Africa. A strategic study. Groundwater issues. Report prepared by the British Geological Survey.
Broderick, J. et al. (2011). Shale gas: an updated assessment of environmental and climate change. A report commissioned by the co-operative. Tyndrall centre, University of Manchester: Manchester
Broholm, M. M., & Arvin, E. (2000). Biodegradation of phenols in a sandstone aquifer under aerobic conditions and mixed nitrate and iron reducing conditions.Journal of contaminant hydrology, 44(3), 239-273.
Brown, R., Keath, N., & Wong, T. (2008). Transitioning to Water Sensitive Cities: Historical, Current and Future Transition States.
Buchanan, I. (1983). Ground Water Quality and Quantity Assessment. J. Ground Water. pp. 193-200.
Buede, D. (2013). Using multi criteria decision making in analysis of alternatives for selection of enabling technology.Systems engineering, 17(3), 288-304.
Bunu, Z. M. (1999). Groundwater Management Perspectives for Borno and Yobe States. Journal of Environmental Hydrology Vol. 7 Paper 19.
Burmaster, D. E. (1982). The new pollution: groundwater contamination.Environment: Science and Policy for Sustainable Development, 24(2), 6-36.
Burnard, P. (1991). A method of analysing interview transcripts in qualitative research. Nurse Education Today 11 (6), 461–466.
Burrell, G. and Morgan, G. (1979). Sociological Paradigms and Organisational Analysis. London: Heinemann.
Butler Jr, J. J. (2003). Hydrogeological methods for estimation of spatial variations in hydraulic conductivity. In Hydrogeophysics (pp. 23-58). Springer Netherlands.
Calabrese, E. J., Tuthill, R. W. (1985) The Massachusetts blood pressure study III. Experimental reduction of sodium in drinking water: effects on blood pressure. Toxicol Ind Health 1:19 – 34
Cannavo, P., Richaume, A., & Lafolie, F. (2004). Fate of nitrogen and carbon in the vadose zone: in situ and laboratory measurements of seasonal variations in aerobic respiratory and denitrifying activities. Soil Biology and Biochemistry, 36(3), 463-478.
Carrey, R., Otero, N., Vidal-Gavilan, G., Ayora, C., Soler, A., & Gómez-Alday, J. J. (2014). Induced nitrate attenuation by glucose in groundwater: Flow-through experiment. Chemical Geology, 370, 19-28.
249
Casey, F. X., Simunek, J., Lee, J., Larsen, G. L., & Hakk, H. (2005). Sorption, mobility, and transformation of estrogenic hormones in natural soil. Journal of environmental quality, 34(4), 1372-1379.
Casey, M. M. (2008). Using a socioecological approach to examine participation in sport and physical activity among rural adolescent girls. Qualitative Health Research, 19(7), 881-893.
Cervantes, C. (2001). Interactions of chromium with microorganisms and plants. FEMS Microbiology Reviews, 25(3), 335-347.
Chapman, D. (1996). Water quality assessments: a guide to the use of biota, sediments and water in environmental monitoring. Second edition. UNESCO/WHO/UNEP publication. (London: E & F N Spon.)
Chen, Z., Grasby, S. E., & Osadetz, K. G. (2004). Relation between climate variability and groundwater levels in the upper carbonate aquifer, southern Manitoba, Canada. Journal of Hydrology, 290(1), 43-62.
Chiang, W. H., Kinzelbach, S. (2001). 3D-groundwater modeling with PMWIN (Vol. 346, pp. 67744-5). Berlin, Heidelberg, New York: Springer-Verlag.
Chilton, P. J. (1998). Groundwater recharge and pollution transport beneath waste water irrigation: the case of León, Mexico. 153–168 in Groundwater pollution, aquifer recharge and vulnerability. Robins, N. S. (editor). Geological Society of London Special Publication, No. 130.
Chilton, P.J. (1992). Aquifers as environments for microbial activity. In: Proceedings of the International Symposium on Environmental Aspects of Pesticide Microbiology, Sigtuna, Sweden, 293-304.
Chilton, P.J. (1996). The impact of tropical agriculture on groundwater quality. In: H. Nash and G.J.H. McCall [Eds] Groundwater Quality, Chapman & Hall, London, 113-122.
Cho, J-C., Cho, H. B., and Kim, S-J. (2000). Heavy contamination of a subsurface aquifer and a stream by livestock wastewater in a stock farming area, Wonju, Korea. Environmental Pollution, 109, 137-146.
Cook, J M, Edmunds, W M, Kinniburgh, D K and Lloyd, B. (1989). Field techniques in groundwater quality investigations. British Geological Survey Technical Report WD/89/56.
Costanza, R. (2003). A vision of the future of science: reintegrating the study of humans and
the rest of nature. Futures, (35), pp. 651–671.
Council of Canadian Academies (2009). The Sustainable Management of Groundwater in Canada. Available: http://www.scienceadvice.ca/en/assessments/completed/groundwater.aspx [23/01/2013].
Cox, L. A., (2008). What‘s wrong with Risk Matrices? Risk Analysis, Vol. 28, No.2. DOI:10.1111/j.1539-6924.2008.01030.x
Croke, B. F. W., & Jakeman, A. J. (2014). An open software environment for hydrological model assessment and development.Environmental Modelling & Software, 26(10), 1171-1185.
Cronin, A., Pedley, S., Hoadley, A., Haldin, L., Gibson, J., & Breslin, N. (2004). Urbanisation effects on groundwater chemical quality: findings focusing on the nitrate problem from 2 African cities reliant on on-site sanitation. Journal of water and health, 5(3), 441-454.
Datta, S. P. (2005). Long-term impact of irrigation with sewage effluents on heavy metal content in soils, crops and groundwater—a case study. Agriculture, Ecosystems & Environment, 109(3), 310-322.
De Carvalho, S. C. P., Carden, K. J., & Armitage, N. P. (2009). Application of a sustainability index for integrated urban water management in Southern African cities: case study comparison-Maputo and Hermanus. Water SA, 35(2), 144-151.
De Vaus, D. (2001). Research design in social research. Sage.
Dempster, H. S., Sherwood-Lollar, B., and Feenstra, S. (1997). Tracing organic contaminants in groundwater: a new methodology using compound specific isotopic analysis. Environ. Sci. Technol. 31, 3193-3197. No. 11.
Denzin, N. K. (1978). The research act: A theoretical Introduction to Sociological Methods. New York: McGraw-Hill.
Dexcel, (2004). Dexcel economic survey of New ZealandDairy Farmers 2003-04. Hamilton, Dexcel.
Diagana, B. (1994). Improving Water Supply Systems in Rural West and Central Africa, IDRC, workshop held in December 1994 in Cairo, Egypt.
Dinar, A., and Saleth, R. M., (2005). Water institutional reforms: theory and practice. Water Policy, 7(1), 1-19.
Diodato, N., and Ceccarelli, M. (2005). Interpolation processes using multivariate geostatistics for mapping of climatological precipitation mean in the Sannio Mountains (southern Italy), Earth Surface Process, Landforms, 30, pp.259–268.
Domagalski, J. L, Johnson, H. (2012). Phosphorus and Groundwater: Establishing links between agricultural use and tansport to streams: U.S. Geological Survey Fact Sheet 2012-300, 4 p.
Dzwairo, B., Hoko, Z., Love, D. and Guzha, E. (2006). Assessment of the impacts of pit latrines on groundwater quality in rural areas: a case study from Marondera district,
Zimbabwe. Phys Chem Earth, 31 (15–16), pp. 779–788.
Dzwairo, B., Hoko, Z., Love, D., & Guzha, E. (2006). Assessment of the impacts of pit latrines on groundwater quality in rural areas: A case study from Marondera district, Zimbabwe. Physics and Chemistry of the Earth, Parts A/B/C, 31(15), 779-788.
Eckhardt, K., & Ulbrich, U. (2003). Potential impacts of climate change on groundwater recharge and streamflow in a central European low mountain range. Journal of Hydrology, 284(1), 244-252.
Edmunds, W. M., Fellman, E., & Goni, I. B. (1999). Lakes, groundwater and palaeohydrology in the Sahel of NE Nigeria: evidence from hydrogeochemistry.Journal of the Geological Society, 156(2), 345-355.
251
Edmunds, W. M., Street-Perrott, G. (1996). Solute profile techniques for recharge estimation in semi-arid and arid terrain. In: Estimation of natural groundwater recharge. NATO ASI Series. Reidel, Dordrecht, pp 139–158.
Eugster, H. P., Maglione, G. (1979). Brines and evaporites of the Lake Chad basin, Africa. Geochimica et Cosmochimica Acta 43(7):973-981.
Evans, B., Gorelick, S. M & Remson, I. (2000). Identifying sources of groundwater pollution: An optimization approach. Water Resources Research, 19(3), 779-790.
Fan, A.M. and Steinberg, V.E. 1996. Health implications of nitrate and nitrite in drinking water: An update on methemoglobinemia occurrence and reproductive and developmental toxicity. Regulatory Toxicology and Pharmacology, 23, 35-43.
Ferrier, R. C., Wright, R. F., Cosby, B. J., and Jenkins, A. (1995). Application of the MAGIC
model to the Norway spruce stand at Solling, Germany. Ecol. Model., (83), pp. 77–84.
Fetter, K., Van Wilder, V., Moshelion, M., & Chaumont, F. (2004). Interactions between plasma membrane aquaporins modulate their water channel activity. The Plant Cell Online, 16(1), 215-228.
Fetter, S.(1994). The hazard posed by depleted uranium munitions. Science & Global Security, 8(2), 125-161.
Finegan, B. (1996). Pattern and process in neotropical secondary rain forests: the first 100 years of succession. Trends in Ecology & Evolution, 11(3), 119-124.
Flyvbjerg, B. (2011). Case study. In: Denzin N. K, Lincoln Y. S, editors. The SAGE handbook of qualitative research. 4th ed. Thousand Oaks, CA: Sage; 2011. pp. 301–316.
Fontana, A., & Frey, J. (2005). The art of science. The handbook of qualitative research, 361-376.
Fontana, V., Radtke, A., Bossi Fedrigotti, V., Tappeiner, U., Tasser, E., Zerbe, S., & Buchholz, T. (2013). Comparing land-use alternatives: Using the ecosystem services concept to define a multi-criteria decision analysis.Ecological Economics, 93, 128-136.
Fordyce, F. M. (2013). Selenium deficiency and toxicity in the environment (pp. 375-416). Springer Netherlands.
Foster, S. (2002). Groundwater quality protection: a guide for water utilities, municipal authorities, and environment agencies. Washington, DC: World Bank.
Foster, S. S. D., Chilton, P. J., Moench, M., Cardy, F., and Schiffler, M. (2000). Groundwater in rural development: facing the challenges of supply and resource sustainability. World Bank Technical Paper, No. 463 (Washington DC: World Bank), ISBN 0-8213-4703-9.
Foster, S. S. D., Lawrence, A. R., and Morris, B. L. (1998). Groundwater in urban development: assessing management needs and formulating policy strategies. World Bank Technical Paper, No. 390 (Washington DC: World Bank.)
Foster, S. S. D., Morris, B. L., and Lawrence, A. R. (1993). Effects of urbanisation on groundwater recharge. Procs of ICE International conference on groundwater problems in urban areas, London, June 1993. (London: Thomas Telford.)
252
Foster, S., & Garduño, H. (2013). Groundwater-resource governance: Are governments and stakeholders responding to the challenge? Hydrogeology Journal, 1-4.
Foster, S., Breach, M. & Mulenga, M. (2012). Urban groundwater use and dependency: Baseline Review of State of Knowledge and Possible Approaches to Inventory. Internal report to FAO Rome 33p
Foster, S., Garduno, H., Evans, R., Olson, D., Tian, Y., Zhang, W., & Han, Z. (2004). Quaternary aquifer of the North China Plain—assessing and achieving groundwater resource sustainability. Hydrogeology Journal, 12(1), 81-93.
Freeze, R. A., and Cherry. J. A. (1979). Groundwater, Prentice Hall. Inc, Upper Sadle River, New Jersey.
Friedman, A. L., & Miles, S. (2006). Stakeholders: Theory and practice. Oxford: Oxford University Press.
Galloway, D., David, R. J., and Ingebritsen, S. E. (1999). Land Subsidence in the United States, Washington, D.C., United States Geological Survey, Circular 1182, 177 pp.
Garduño, H., et al. (2013). Irrigated agriculture and groundwater resources–towards an integrated vision and sustainable relationship. Integrated Water Resources Management in a Changing World: Lessons Learnt and Innovative Perspectives, 35.
Garduño, H., van Steenbergen, F., & Foster, S. (2010). Stakeholder participation in groundwater management. GW Mate Briefing Note Series, Note,6.
Garduño, P. Y. (2012). Social Safeguards for REDD+ in Mexico‘s Watershed Management Program.
Gaye, C. B., Edmunds, W. M. (1996). Groundwater recharge estimation using chloride, stable isotopes and tritium profiles in the sands of northwestern Senegal. Environmental Geology, 27 (3). 246-251.
Gibb, J. P., R. M. Schuller, and R. A. Griffin. (1981). Procedures for the Collection of Representative Water Quality Data from Monitoring Wells. Cooperative Groundwater Report 7, Illinois State Water Survey and Illinois State Geological Survey, Champaign, Illinois.
Gibs, J. and ImbrigiottaT. E. (2002). Well-Purging Criteria for Sampling Purgeable Organic Compounds; Ground Water, Vol. 28, No. 1, pp 68-78.
Gillis, A and Jackson, W. (2002). Research for nurses: Methods and interpretation. Philadelphia: F.A Davis Company
Giordano, M., and Villholth, K. G. (eds.) (2007). The Agricultural Groundwater Revolution: Opportunities and Threats to Development. Wallingford: CABI.
Giupponi, C. (Ed.). (2006). Sustainable management of water resources: an integrated approach. Edward Elgar Publishing.
Glaser, F. (1997). Grounded theory: An exploration of process and procedure. Qualitative health research, 16(4), 547-559.
253
Gleeson, T., Wada, Y., Bierkens, M. F., & van Beek, L. P. (2012). Water balance of global aquifers revealed by groundwater footprint. Nature, 488(7410), 197-200.
Global Water Partnership (GWP). (2012). Integrated water resources management. TAC Background Paper No. 4. GWP, Stockholm, Sweden.
Gober, P., & Wheater, H. S. (2014). Socio-hydrology and the science–policy interface: a case study of the Saskatchewan River basin. Hydrology and Earth System Sciences, 18(4), 1413-1422.
Goldstein, B. D., Kriesky, J., and Pavliakova, B. (2012). Missing from the table: role of the environmental public health community in governmental advisory commissions related to Marcellius shale drilling. Environ Health Perspect, 120 (4): p. 483-6.
Goni, I. B. (2006). The challenges of meeting domestic water supply in Nigeria. J. Min. Geol. 42(1):51-55.
Goni, I. B., Fellman, E., Edmunds, W. M. (2001). Rainfall geochemistry in the Sahel region of northern Nigeria. Atmospheric Environment, 35(25), 4331-4339.
Google earth (2014) Map of Maiduguri Nigeria [online] available: https://www.google.com/maps/@37.0625,-95.677068,4z [02/03/2014].
Graham, J. P., & Polizzotto, M. L. (2013). Pit latrines and their impacts on groundwater quality: a systematic review. Environmental health perspectives, 121(5), 521-530.
Greacen, J and Slivia, K. (2012). A comparison of low flow vs high flow sampling methodologies on groundwater metals concentrations. The Eighth National Outdoor Action Conference and Exposition, Minneapolis Convention Center, Minneapolis, Minnesota.
Grey, D. R. C., Kinninburgh, D. G., Barker, J. A. & Bloomfield, J. P. (1995). Groundwater in the U.K.A Strategic Study. Issues and Research Needs. Report FR/GF 1 (Marlow, UK: Groundwater Forum).
Guan, T. Y., and Holley, R. A. (2003). Pathogen survival in swine manure environments and transmission of human enteric illness: a review, J Environ Qual, 32(3):1153.
Guérin, V., Roy, S., & Ghestem, J. P. (2014). Quality assurance/quality control in groundwater sampling. Quality assurance, 128-144.
Gunderson, L. (1999). Resilience, flexibility and adaptive management: antidotes for spurious certitude? Conserv. Ecol. 3
Haliru, S. L, and Umar, D. A., (2012). Climate Change and Rural Water Supply Planning in Nigeria (eds) Walter, F. Climate Change and the Sustainable Use of Water resources, Springer-Verlag Berlin.
Hall, E. (2004). A double concern: grand mothers‘ experiences when a small grand child is critically ill. Journal of Pedantic Nursing. 19, pp. 61-69.
Hall, G E M, Bonham-Carter, G F, Horowitz, A J, Lum, K, Lemieux, C, Quemerais, B and Garbarino, J.R. (2006). The effect of using different 0.45µm filter membranes on ‗dissolved‘ element concentrations in natural waters. Applied Geochemistry, Vol 11, 243-249.
Hallberg, G. R., & Keeney, D. R. (2003). Nitrate. In W. M. Alley (Ed.), Regional ground-water quality. US Geological Survey.
Hanley, N., Spash, C., & Walker, L. (1993). Problems in valuing the benefits of biodiversity protection. Environmental and Resource Economics, 5(3), 249-272.
Hanratty, M. P. and Stefan, H. G. (1998). Simulating climate change effects in a Minnesota agricultural watershed. Journal of Environmental Quality 27, 1524-1532.
Hare, M., Pahl-Wostl, C. (2002). Stakeholder categorization in participatory integrated assessment processes. Integrated Assessment 3, 50–62
Haria, H. A., Hodnett, M. G., Johnson, A. C. (2003). Mechanisms of groundwater recharge and pesticide penetration to a chalk aquifer in southern England. J Hydrol 275:122–137.
Hartley, J. (2004). Case study research, Sage Publishing, London.
Hartog, N., Van Bergen, P. F., De Leeuw, J. W., & Griffioen, J. (2004). Reactivity of organic matter in aquifer sediments: geological and geochemical controls. Geochimica et Cosmochimica Acta, 68(6), 1281-1292.
Hassett, J. J., & Banwart, W. L. (2009). The sorption of nonpolar organics by soils and sediments. Reactions and movement of organic chemicals in soils, (reactionsandmov), 31-44.
Hayes, M. H. B., Clapp, C. E., & Mingelgrin, U. (2001). Measurements of sorption-desorption and isotherm analyses. Humic substances and chemical contaminants, (humicsubstancesa), 205-240.
Hem, J.D. (1985). Study and interpretation of the chemical characteristics of natural water (3d ed.): U.S. Geological Survey Water-Supply Paper 2254, 263 p.
Henley, D. (2000). Nigeria Water Supply and Sanitation Strategy; Nigeria Water Sector. [Online] available: www.nws.org/henley/Nwss/strategy.pdf [03/04/2013].
Hirschheim, R. and Klein, H. (1994). Realising Emancipatory Principles in Information Systems Development: The Case of Ethics, MIS Quarterly, 18(1), 83-109.
Holling, C. S. (1978). Adaptive Environmental Assessment and Management. London: Wiley
Houghton, J. T., et al. (2001). Climate Change 2001: The Scientific Basis. Cambridge university press.
Howard, K. James, W., and White, F. (2003). Incorporating policies for groundwater protection into the urban planning process. In Chilton, J. et al. (Eds), Groundwater in the urban environment: problems, processes and management (pp. 31-40). Rotterdam: Balkema Publishers.
Huntjens, P., Kool, J., Lasage, R., Sprengers, C., Ottow, B., & Kerssens, P. (2013). Preferred Climate Change Adaptation Strategy for the Lower Vam Co River Basin, Long An Province.
International Association of Hydrogeologists (IAH). (2006). Groundwater in Fractured Rocks: IAH Selected Paper Series, Volume 9.
IPCC (International Panel on Climate Change) (2007). Climate Change and Water. Technical Paper of the intergovernmental Panel on Climate Change. Geneva, Switzerland, IPCC Secretariat.
IPCC. (2007). Climate change 2007: The IPCC fourth assessment report. Cambridge: IPCC reports, Cambridge University Press.
Jacks, G., F. Sefe, M. Carling, M. Hammar, and P. Letsamao. "Tentative nitrogen budget for pit latrines–eastern Botswana." Environmental Geology38, no. 3 (1999): 199-203.
Jaekel, D. (1984). Rainfall patterns and lake level variations at Lake Chad: in climatic changes on a yearly to millennial basis, Geological, Historical and Instrumental Records, Morner N, and Karlen W, Eds D. Reidel Publ. co. Dordrecht, Netherlands, pp. 191-200.
Jakeman, A. J., Letcher, R. A. (2003). Integrated assessment and modelling: features, principles and examples for catchment management. Environmental Modelling and
Software, (18), pp. 491–501.
Johnson, N., Lilja, N., Ashby, J.A., Garcia, J.A., (2004). Practice of participatory research and gender analysis in natural resource management. Natural Resources Forum28, 189–200.
Journel, A. G., Huijbregts, C.J. (1978). Mining Geostatistics. Academic Press, London (1978), p. 600.
Kashaigili, J .J. (2003). Current Utilization and Benefits Gained from Wetlands in the Usangu Plains (Draft reportHRPWET3) 49p.
Kearl, P M, Korte, N E, Stites, M and Baker, J. (2012). Field comparison micropurging vs. traditional ground water sampling. Groundwater Monitoring & Remediation, Vol.14, No. 4, 183-190.
Keeney, D. R., DeLuca, T. H., & McCarty, G. W. (2002). Effect of freeze-thaw events on mineralization of soil nitrogen. Biology and Fertility of Soils, 14(2), 116-120.
Kelle, L. (2006). Strategic brand management: Building, measuring, and managing brand equity. Pearson Education India.
Kelly, W., Ray, A. (1999). Impact of irrigation on the dynamics of nitrate movement in a shallow sand aquifer, Illinois state water survey Chittaranjan Ray, University of Hawaii at Manoa, Research report 128.
Kemper, E., Stringfield. S., & Teddlie, C. (2004). Mixed methods sampling strategies in social science research. In A. Tashakkori & C. Teddlie (Eds.), Handbook of mixed methods in social & behavioural research (pp. 273-296). Thousand Oaks, CA: Sage.
Kemper, K., & Alvarado, O. (2001). Water in Mexico A Comprehensive Development Agenda for the New Era. Washington, DC, USA: World Bank, 619-643.
Khazai, E., and Riggi, M. G. (1999). Impact of urbanization on the Khash aquifer, an arid region of south east Iran. In Ellis J. B. (Ed.), Impacts of urban growth on surface water and groundwater quality: proceedings of an international symposium held during IUGG 99, the XXII General Assembly of the International Union of Geodesy and Geophysics, at
256
Birmingham, UK 18-30 July 1999. Wallingford: IAHS.
Kinzelbach, W., Schaffer, W., Herzer, J. (2003): Numerical modelling of natural and enhanced denitrification in aquifers. Water Resour. Res. 27(6), 1123-1135.
Kiptum, C. K., & Ndambuki, J. M. (2012). Well water contamination by pit latrines: a case study of Langas. International Journal of Water Resources and Environmental Engineering, 4(2), 35-43.
Klein, H. and Myers, M. (1999). A Set of Principles for Conducting and Evaluating Interpretive Field Studies in Information Systems. MIS Quarterly, 23(1), 67-94.
Knüppe, K. (2011). The challenges facing sustainable and adaptive groundwater management in South Africa. Water SA, 37(1), 67-79.
Knüppe, K., & Pahl-Wostl, C. (2012). Requirements for adaptive governance of groundwater ecosystem services: insights from Sandveld (South Africa), Upper Guadiana (Spain) and Spree (Germany). Regional Environmental Change, 13(1), 53-66.
Konikow, L. F., Sanford, W. E., & Campbell, P. J. (1996). Constant‐concentration boundary condition: Lessons from the HYDROCOIN variable‐density groundwater benchmark problem. Water Resources Research, 33(10), 2253-2261.
Kretsinger, V. G., Narasimhan, T. N. (2005). Sustaining groundwater resources: California‘s shift toward more effective groundwater management. Southwest Hydrol., 4: 18-19.
Krueger, R.A., & Casey, M.A. (2000). Focus groups: A practical guide for applied research (4th Ed.).Thousand Oaks, CA: Sage Publications.
Kundzewicz, Z. W., Mata, L. J., Arnell, N. W., Döll, P., Jimenez, B., Miller, K., and Shiklomanov, I. (2008). The implications of projected climate change for freshwater resources and their management.
Lacroix, E., Brovelli, A., Holliger, C., & Barry, D. A. (2014). Control of groundwater pH during bioremediation: Improvement and validation of a geochemical model to assess the buffering potential of ground silicate minerals. Journal of contaminant hydrology, 160, 21-29.
Lake, W. B. and Souré, M. (1997). Water and Development in Africa. International Development Information Centre. Available: http://www.acdi [03/05/2012].
Lakshmanan, E., Kannan, R., Kumar, M. S. (2003). Major ion chemistry and identification of hydrogeochemical processes of ground water in a part of Kancheepuram district, Tamil Nadu, India. Environmental geosciences, 10(4), 157-166.
Langman, P., Nicholson, A. G., Rice, A., & Addis, B. (2008). Interobserver variation in the classification of thymic tumours–a multicentre study using the WHO classification system.Histopathology, 53(2), 218-223.
Lapworth, D. J., Baran, N., Stuart, M. E., & Ward, R. S. (2012). Emerging organic contaminants in groundwater: a review of sources, fate and occurrence. Environmental Pollution, 163, 287-303.
Lavoie, R., Joerin, F., & Rodriguez, M. J. (2014). Incorporating groundwater issues into regional planning in the Province of Quebec. Journal of Environmental Planning and Management, 57(4), 516-537.
Leavesley, G. H. (1994). Modeling the effects of climate change on water resources--A review, Clim. Change, 28, 159-177.
Levallois, P., Thériault, M., Rouffignat, J., Tessier, S., Landry, R., Ayotte, P., et al. (1998). Groundwater contamination by nitrates associated with intensive potato culture in Québec. The Science of the Total Environment, 217, 91–101. Doi:10.1016/S0048-9697(98) 00191-0.
Lewis, W. J., Farr, J. L., & Foster, S. S. (1980). THE POLLUTION HAZARD TO VILLAGE WATER SUPPLIES IN EASTERN BOTSWANA. Proceedings of the Institution of Civil Engineers, 69(2), 281-293.
Ligmann-Zielinska, A., & Jankowski, P. (2014). Spatially-explicit integrated uncertainty and sensitivity analysis of criteria weights in multicriteria land suitability evaluation. Environmental Modelling & Software, 57, 235-247.
Ligmann-Zielinska, A., & Jankowski, P. (2014). Spatially-explicit integrated uncertainty and sensitivity analysis of criteria weights in multicriteria land suitability evaluation. Environmental Modelling & Software, 57, 235-247.
Lindenberg, M.M., Crosby, B.L. (1981). Managing Development: the Political Dimension. Kumarian Press, West Hartford, CT
Llamas, M. R., Martinez-Santos, P., & de la Hera, A. (2006). The manifold dimensions of groundwater sustainability: An overview. In The global importance of groundwater in the 21st Century: Proceedings of the international symposium on groundwater sustainability (pp. 24-27).
Llamas, M. R., Martinez-Santos, P., & de la Hera, A. (2006). The manifold dimensions of groundwater sustainability: An overview. In The global importance of groundwater in the 21st Century: Proceedings of the international symposium on groundwater sustainability (pp. 24-27).
Loucks, D. P. (2000) Sustainable water resources management. Water Int. 25 (1) 3-10.
Loucks, D. P., and Gladwell, J. S. (1999). Sustainability criteria for water resource systems, Cambridge, UK.
Lovely, D.R., (1993). Dissimilatory metal reduction. Ann. Rev. Microbiol 47, 263-290.
Mabin, S., &Beattie, J. (2006). Ranking and rating multi-criteria decision-making method for facility site selection. The International Journal of Production Research, 59(12), 2313-2330.
MacDonald, A. M., & Davies, J. (2000). A brief review of groundwater for rural water supply in sub-Saharan Africa.
258
MacDonald, A. M., Lapworth, D. J., Hughes, A. G., Auton, C. A., Maurice, L., Finlayson, A., & Gooddy, D. C. (2014). Groundwater, flooding and hydrological functioning in the Findhorn floodplain, Scotland.
Maconachie, R. (2009). Diamonds, governance and ‗local‘development in post-conflict Sierra Leone: Lessons for artisanal and small-scale mining in sub-Saharan Africa? Resources Policy, 34(1), 71-79.
MacQuarrie, K. T., Sudicky, E. A., & Robertson, W. D. (2001). Numerical simulation of a fine-grained denitrification layer for removing septic system nitrate from shallow groundwater. Journal of contaminant hydrology, 52(1), 29-55.
MacRae, J. D., & Hall, K. J. (1998). Biodegradation of polycyclic aromatic hydrocarbons (PAH) in marine sediment under denitrifying conditions. Water science and technology, 38(11), 177-185.
Madriz, E. (2003). Focus groups in feminist research. In N. K. Denzin & Y. S. Lincoln (Eds.), Collecting and interpreting qualitative materials, 2nd edition (pp. 363-388). Thousand Oaks, CA: Sage Publications.
Maduabuchi, C., Faye, S., Maloszewski, P. (2006). "Isotope evidence of palaeorecharge and palaeoclimate in the deep confined aquifers of the Chad Basin, NE Nigeria. Environment 370(1):467-479.
Mahar, P. S., & Datta, B. (2001). Identification of pollution sources in transient groundwater systems. Water Resources Management, 14(3), 209-227.
Mahvi, A. H., Nouri, J., Babaei, A. A., Nabizadeh, R. (2005). Agricultural activities impact on groundwater nitrate pollution. Int. J. Environ. Sci. Tech., 2 (1), 41-47
Mansuy, L., Philp, R. P., and Allen, J. (1997). Source identification of oil spills based on the isotopic composition of individual components in weathered oil samples. Environ. Sci. Technol. 31, 3417-3425. No. 12.
Maps online. (2014). Administrative and Political Map of Nigeria [online]. Available: http://www.nationsonline.org/oneworld/map/nigeria_map2.htm [22/04/2014].
Masiyandima, M. (2002) Sub-Saharan Africa: opportunistic exploitation. In: Giordano M and Villholth K (eds.) the Agricultural Groundwater Revolution: Opportunities and Threats to Development. Comprehensive Assessment of Water Management in Agriculture Series 3. IWMI and CAB International, Wallingford.
Mason, R. (1996). Computer-mediated communication. Handbook of research for educational communications and technology, 2, 397-431.
Matsunaga, L. J., & Liss, P. S. (1993). Photochemically induced redox reactions in seawater, I. Cations. Marine chemistry, 49(2), 201-213.
McBride, M. B. (1994). Environmental chemistry of soils. Oxford University Press
McDonald, M. G., & Harbaugh, A. W. (1988). A modular three-dimensional finite-difference ground-water flow model.
McDowell-Boyer L, Hunt JR, Sitar, N. (1986), Particle transport through porous media. Water
Mcgrath, D., & Zhang, C. (2003). Spatial distribution of soil organic carbon concentrations in grassland of Ireland. Applied Geochemistry, 18, 1629–1639. doi:10.1016/ S0883-2927(03)00045-3.
McMahon, M. (1995). Conversations on clinical supervision: Benefits perceived by school counsellors. British Journal of Guidance and Counselling, 28(3), 339-351.
McNamara, C. (1999) General Guidelines for Conducting Interviews. [Online] available: http://www.mapnp.org/library/evaluatn/intrview.htm [03/05/2014].
Meissner, R., Seeger, J., Rupp, H. and Balla, H. (1999). Assessing the impacts of agricultural land use changeson water quality. Water Science Technology 40(2), 1-10.
Mendes, M. P., & Ribeiro, L. (2014). The importance of groundwater for the delimitation of Portuguese National Ecological Reserve. Environmental Earth Sciences, 1-11.
Miller, J. and Glassner, B. (1997) The ―Inside‖ and the ―Outside‖: Finding Realities in Interviews‘, in D. Silverman (ed.) Qualitative Research: Theory, Method and Practice. London, Thousand Oaks, CA & New Delhi: Sage Publications.
Miller, R. E., Johnston, R. H., Olowu, J. A. I., Uzoma, J. U. (1968). Groundwater hydrology of the Chad Basin in Borno and Dikwa Emirates, with special emphasis on the flow life of the artesian system. USGS Water Supply Paper. 1757.
Milly, P. C., Betancourt, J., Falkenmark, M. (2008). Climate Change: Stationarity Is Dead: Whither Water Management? Science 319 (5863): 573 – 574.
Ministry of Water of Zimababwe (1987). Zimbabwe National Water Master Plan. Hydrogeology Vol. 1987. Harare.
Mitchell, R. K., Agle, B. R., and Wood, D. J. (1997). Toward a theory of stakeholder identification and salience: Defining the principle of who and what really counts. Academy of Management Review 22(4): 853–886.
Molle, F. (2009). River-basin planning and management: the social life of a concept. Geoforum, 40(3), 484-494.
Mondal, N. C., Singh, V. P., Singh, V. S., & Saxena, V. K. (2010). Determining the interaction between groundwater and saline water through groundwater major ions chemistry. Journal of Hydrology, 388(1), 100-111.
Montanari, A., Young, G., Savenije, H. H. G., Hughes, D., Wagener, T., Ren, L. L. .& Belyaev, V. (2013). ―Panta Rhei—Everything Flows‖: Change in hydrology and society—The IAHS Scientific Decade 2013–2022. Hydrological Sciences Journal, 58(6), 1256-1275.
Morgan, D.L. (Ed.) (1997). Successful focus groups: Advancing the state of the art.
Morgan, J. A., King, J. Y., LeCain, D., & Milchunas, D. G. (2002). Soil-atmosphere exchange of CH4, CO2, NOx, and N2O in the Colorado shortgrass steppe under elevated CO2. Plant and Soil, 240(2), 201-211.
Morris, B. L., Lawrence, A. R., Chilton, P.J., Adams, B., Calow, R.C., and Klinck, B.A. (2003). Groundwater and its susceptibility to degradation: A global assesment of the problem
and options for management. Early Warning and Assesment Report Series, RS.03-3. United Nations Environment Programme, Nairobi, Kenya.
Mumma, A., Lane, M., Kairu, E., Tuinhof, A., & Hirji, R. (2011). Kenya Groundwater Governance Case Study.
Narasimhan, T.N. and V. Kretsinger. 2003. Developing, managing and sustaining California‘s groundwater resources. A White Paper for the Groundwater Resources Association of California available: http://www.grac.org/CA_GW_Resources.pdf [01/11/2013].
National Groundwater Association, (2010) Facts about Global Groundwater Usage. Available: http://www.ngwa.org/Fundamentals/use/Documents/global-groundwater-use-fact-sheet.pdf [22/01/2014].
National Population Commission Nigeria. (2009). Nigeria Demographic and Health Survey 2009, Abuja, Nigeria/Calverton, MD: National Population Commission/ICF Macro.
National Research Council, (2003). Groundwater vulnerability assessment, contamination potential under conditions of uncertainty. Committee on Techniques for Assessing Ground Water Vulnerability, Water Science and Technology Board, Washington, D. C.
Ndirirtu, P. G., and Gitahae, I. T. (2011) Kenya. Country Report prepared for project: ‗Groundwater in Sub-Saharan Africa: Implications for food security and livelihoods‘ International Water Management Institute, Sri Lanka.
Newson, M. (2009). Land, water and development: sustainable and adaptive management of rivers. Routledge.
Nichols, D. S., Prettyman, D., & Gross, M. (2003). Movement of bacteria and nutrients from pit latrines in the boundary waters canoe area wilderness. Water, Air, and Soil Pollution, 20(2), 171-180.
Nonde, A. (2011) Zambia. Country Report prepared for project: ‗Groundwater in Sub-Saharan Africa: Implications for food security and livelihoods‘ International Water Management Institute, Sri Lanka.
Nwankwoala, H. O. (2011). The role of communities in improved rural water supply systems in Nigeria: management module and its implications for vision 20: 2020. Journal of Applied technology in Environmental Sanitation, 1(3), 295-302.
Oades, J. M., and Muneer, M. 1989). The role of Ca-organic interactions in soil aggregate stability. I. Laboratory studies with glucose 14C, CaCO3 and CaSO4. 2. H2O. Soil Research, 27(2), 389-399.
Oats, R. (2006). Organizational ambidexterity in action: how managers explore and exploit, California Management Review, 53(4), 5-22.
Obaje, N. (2009). Geology and Mineral Resources of Nigeria. Springer-verlag, Berlin Heildelberg. ISBN 978-3-540-92684-9.
Obuobie, E and Barry, B. (2004). Groundwater Socio-Ecology of Ghana. IWMI-OPEC funded groundwater project studies in selected Sub-Sahara African countries. Ghana country report. IWMI Ghana. 41pp.
Odada, E. O., Oyebande, L., Oguntola, J. A. (2006). Lake Chad. Experience and Lessons Learned Brief. Lake Basin Management Initiative (LBMI) Experience and Lessons Learned Briefs.
Offodile, M. E. (1992). An approach to groundwater study and development in Nigeria. Mecon Services Ltd. pp. 66-78.
Olshansky, Y., Polubesova, T., Vetter, W., & Chefetz, B. (2011). Sorption–desorption behavior of polybrominated diphenyl ethers in soils. Environmental Pollution, 159(10), 2375-2379.
Onemano, J. I., and Otun, J. A. (2003). Problems on water quality standards and monitoring in Nigeria: Towards the millennium development goals. 29th WEDC International Conference, Abuja, Nigeria.
Oteze, G. E., Fayose, S. A. (1988). Regional development in the Hydrology of Chad basin. Water Resourc. 1(1):9-29.
Pabich, W. J., Valiela, I., & Hemond, H. F. (2001). Relationship between DOC concentration and vadose zone thickness and depth below water table in groundwater of Cape Cod, USA. Biogeochemistry, 55(3), 247-268.
Pahl-Wostl, C. (2007). Transitions towards adaptive management of water facing climate and global change. Water Resources Management 21: 49-62.
Pahl-Wostl, Tabara, C. D., Bouwen, R., Craps, M., Dewulf, A., Mostert, E., Ridder, D., and Tailleu, T. (2008). The importance of social learning and culture for sustainable water management. Ecological Economics 64: 484-495.
Pallant, J. F. (2005). An introduction to the Rasch measurement model: an example using the Hospital Anxiety and Depression Scale (HADS).British Journal of Clinical Psychology, 46(1), 1-18.
Parker, L V and Clark, C H. (2002). Study of five discrete interval type groundwater sampling devices. US Army Corps of Engineers Technical Report, ERDC/CRREL TR-02-12.
Parker, P., Letcher, R., Jakeman, A., Beck, M. B., Harris, G., Argent, R. M., ... & Bin, S. (2002). Progress in integrated assessment and modelling.Environmental Modelling & Software, 17(3), 209-217.
Patten, M.Q. (2001). Qualitative evaluation and research methods (2nd ed.). Newbury Park, CA: Sage.
Paul, D. R., & Clark, R. (2002). Modeling of modified atmosphere packaging based on designs with a membrane and perforations. Journal of Membrane Science, 208(1), 269-283.
Pavelic, P., Smakhtin, V., Favreau, G., and Villholth, K. G. (2012) Water-balance approach for assessing potential for small holder groundwater irrigation in Sub-Saharan Africa. Water SA Vol. 38 No. 3.
Pavelic, Paul; Villholth, Karen G.; Verma, Shilp. (Eds.) (2013). Sustainable groundwater development for improved livelihoods in Sub-Saharan Africa. Part 2. Water International, 38(6):790-863. (Special issue with contributions by IWMI authors).
262
Peach, D. W., Adams, B., Bloomfield, J. P. & Wheater, H. S. (2000) Support for integrated groundwater/surface water monitoring and sustainable catchment management, in: Sillio, O. et al. (Eds) Groundwater: Past Achievements and Future Challenges, pp 1017–1021 (Balkema).
Petersen, C. J., Graybosch, R. A., Baenziger, P. S., & Shelton, D. R. (1995). Environmental modification of hard red winter wheat flour protein composition. Journal of Cereal Science, 22(1), 45-51.
Phillips, R. (2003). Stakeholder Theory and Organizational Ethics, Berrett-Koehler Publishers Inc.
Pierzynski, G. M., Vance, G. F., & Sims, J. T. (2005). Soils and environmental quality. CRC press.
Preskill, H. (2006). Background and Foundational Information. Health Informatics: An Interprofessional Approach, 7(3), 83.
Price, M., Low, R. G., & McCann, C. (2000). Mechanisms of water storage and flow in the unsaturated zone of the Chalk aquifer. Journal of Hydrology, 233(1), 54-71.
Pujari, S., Keaton, M. A., Chaikin, P. M., & Register, R. A. (2012). Alignment of perpendicular lamellae in block copolymer thin films by shearing. Soft Matter, 8(19), 5358-5363.
Punch, S. (1998). Interviewing strategies with young people: the ‗secret box‘, stimulus
material and task‐based activities. Children & Society, 16(1), 45-56.
Quevauviller, P. (2009). From the 1996 groundwater action programme to the 2006 groundwater directive–what have we done, what we learnt, what is the way ahead? J Environ Monit 10:408–421
Rabus, R., & Widdel, F. (1996). Anaerobic oxidation of the aromatic plant hydrocarbon p-cymene by newly isolated denitrifying bacteria. Archives of microbiology, 172(5), 303-312.
Rachdawong, P., and Christensen, E. (1997). Determination of PCB sources by a principal component method with nonnegative constraints. Environ. Sci. Technol. 31, 2686-2691. No. 9.
Radhakrishna, R. B. (2007). Tips for developing and testing questionnaires/instruments. Journal of Extension, 45(1), 1-4.
Re, V. (2015). Incorporating the social dimension into hydrogeochemical investigations for rural development: the Bir Al-Nas approach for socio-hydrogeology. Hydrogeology Journal, DOI 10.1007/s10040-015-1284-8.
Reed, M. S. (2009). Stakeholder participation for environmental management: a literature review. Biological conservation, 141(10), 2417-2431.
Reed, M. S., Stringer, L. C., Fazey, I., Evely, A. C., & Kruijsen, J. H. J. (2014). Five principles for the practice of knowledge exchange in environmental management. Journal of environmental management, 146, 337-345.
263
Reed, M.S., Graves, A., Dandy, N., Posthumus, H., Hubacek, K., Morris, J., Prell, C., Quinn, H. C., and Stringer, L. C. (2008). Who‘s in and why? A typology of stakeholder analysis methods for natural resource management. Journal of Environmental Management 90, 1933-1949.
Reineke, T. M. (2001). Modular chemistry: secondary building units as a basis for the design of highly porous and robust metal-organic carboxylate frameworks. Accounts of Chemical Research, 34(4), 319-330.
Remenyi, D., Williams, B., Money, A. and Swartz, E. (2002). Doing Research in Business and Management: An Introduction to Process and Methods. London: Sage.
Resour Res 22:1901–1921.
Rodvang, S., & Simpkins, W. (2001). Agricultural contaminants in Quaternary aquitards: A review of occurrence and fate in North America. Hydrogeology Journal, 9(1), 44-59.
Ross, C., and Donnison, J. (2003). Economics and adoption of conservation biological control. Biological control, 45(2), 272-280.
Rotmans, J. (2000). More evolution than revolution: transition management in public policy. Foresight 3, no. 1: 15–31.
Sabatier, P. A. (1999).The advocacy coalition framework, an assessment. In: Sabatier PA (ed) Theories of the policy process. Westview Press, Oxford.
Salman, M. A. (1999). Groundwater: Legal and Policy Perspectives. Proceedings of World Bank seminar. The World Bank, Washington D. C.
Sanni et al. (2012) Spatio-Temporal Variation of Drought Severity in the Sudano-Sahelian Region of Nigeria: Implications for Policies on Water Management. Springer-Verlag Berlin.
Saunders, M. R., Markie‐Dadds, C., Rinaldis, M., Firman, D., & Baig, N. (2007). Using household survey data to inform policy decisions regarding the delivery of evidence‐based parenting interventions. Child: Care, Health and Development,33(6), 768-783.
Savenije, H. H. G., and Van der Zaag, P. (2008). Integrated water resources management:
Concepts and issues. Physics and Chemistry of the Earth 33. 290–297.
Schlager, E. (2007). Community management of groundwater. In The Agricultural Groundwater Revolution: Opportunities and Threats to Development, ed. Mark Giordano and Karen G. Villholth: 131-152. Cambridge, MA: CABI.
Schmoll, O. et al., (Ed.). (2006). Protecting groundwater for health: managing the quality of drinking-water sources. World Health Organization.
Schot, J., and Geels, F. W. (2008). Strategic niche management and sustainable innovation journeys: theory, findings, research agenda, and policy. Technology Analysis & Strategic Management Vol. 20, No. 5, 537–554.
Schwartz, F. W. and M. Ibaraki (2011). Groundwater: A Resource in Decline. Elements 7(3): 175-179.
264
Seiler, M., Vomberg, J. (2005). Nitrate occurrence and attenuation in the major aquifers of England and Wales.Quarterly Journal of Engineering Geology and Hydrogeology, 40(4), 335-352.
Seth, O. N., Tagbor, T. A., & Bernard, O. (2014). Assessment of chemical quality of groundwater over some rock types in Ashanti Region, Ghana.
Shah, T., Molden, D., Sakthivadivel, R., & Seckler, D. (2000). Groundwater: Overview of Opportunities and Challenges. IWMI.
Shiklomanov, I.A. (1999). World Water Resources and their Use, Paris, UNESCO.
Shiva, V. (2002). From water crisis to water culture. Cultural Studies, 22(3-4), 498-509.
Shove, E., & Walker, G. (2007). CAUTION! Transitions ahead: politics, practice, and sustainable transition management. Environment and Planning A, 39(4), 763-770.
Siebert, S., Burke, J., Faures, J. M., Frenken, K., Hoogeveen, J., Döll, P., & Portmann, F. T. (2010). Groundwater use for irrigation–a global inventory.Hydrology and Earth System Sciences Discussions, 7(3), 3977-4021.
Simes RJ (1986) An improved Bonferroni procedure for multiple tests of significance. Biometrika 73:751–754.
Simon, G. M. (2009). Activity-based proteomics of enzyme superfamilies: serine hydrolases as a case study. Journal of Biological Chemistry, 285(15), 11051-11055.
Singleton, M. J, Woods, K. N., Conrad, M. E., Depaolo, D. J., Dresel, P. E (2005). Tracking sources of unsaturated zone and groundwater nitrate contamination using nitrogen and oxygen stable isotopes at the Hanford site, Washington. Environ. Sci. Technol. 39:3563-3570.
Sivapalan, M., Konar, M., Srinivasan, V., Chhatre, A., Wutich, A., Scott, C. A. & Rodríguez‐Iturbe, I. (2014). Socio‐hydrology: Use‐inspired water sustainability science for the Anthropocene. Earth's Future, 2(4), 225-230.
Sivapalan, M., Yaeger, M. A., Harman, C. J., Xu, X., & Troch, P. A. (2011). Functional model of water balance variability at the catchment scale: 1. Evidence of hydrologic similarity and space‐time symmetry. Water Resources Research, 47(2).
Smedana, L. K., and Shiati, K. (2002). Irrigation and salinity: a perspective review of the salinity hazards of irrigation development in the arid zone. Irrigation and Drainage Systems 16 (2) 161-174.
Smith, H., Blackstock, K., and Wall, G. (2011). River basin planning meets spatial planning. Knowledge Scotland.
Smith, S. C., Fredrickson, J. K., & Liu, C. (2001). Dissimilatory bacterial reduction of Al-substituted goethite in subsurface sediments. Geochimica et Cosmochimica Acta, 65(17), 2913-2924.
Snodgrass, M. F., and Kitanidis, P. K. (2007). A geostatistical approach to contaminant source identification. Water Resour. Res. 33, 537-546. No. 4.
265
Song, Y., & Müller, G. (1999). Sediment-Water interactions in anoxic Freshwater sediments. Lecture Notes in Earth Sciences, Berlin Springer Verlag, 81.
Squillace, P. J, Scott, J. C., Moran, M. J., Nolan, B. T., Kolpin, D. W. (2002). VOCs, pesticides, nitrate, and their mixtures in groundwater used for drinking water in the United States. Environ. Sci. Technol. 36:1923-1930.
Stake, R. E. (1988). The art of case study research, Thousand Oaks: Sage Publications.
Strang, V. (2006). Integrating the social and natural sciences in environmental research: a discussion paper. Environment, Development and Sustainability, 11(1), 1-18.
Strauss, A. and Corbin, J. (1990). Basics of Qualitative Research: Grounded Theory Procedures and Techniques. Newbury Park: Sage.
Strauss, l., Corbin, M. C. (1997). Choosing qualitative research: A primer for technology education researchers.
Stuar,t M., Lapworth D, Crane E, Hart, A. (2012). Review of risk from potential emerging contaminants in UK groundwater. Sci. Total Environ. 416:1-21
Stuart, M., Reeder, D. (2008). Review of risk from potential emerging contaminants in UK groundwater. Science of the Total Environment, 416, 1–21
Stumn, W., Morgan, J. I. (1981). Aquatic chemistry: an introduction emphasizing chemical equilibria in natural waters. New York: Wiley-Interscience, 780 p.
Subramanian, L., & Siromony, P. M. V. (2014). Drinking water issues in Rural India: Need for stakeholders‘ participation in Water resources management.Future of Food: Journal on Food, Agriculture and Society, 2(1), 93-110.
Tabor, G. M. (2001). Conservation biology and the health sciences. Conservation biology: research priorities for the next decade, 155-173.
Taher, T. Bruns, B., Bamaga O., Al-Weshali A., & van Steenbergen F. (2012). Local groundwater governance in Yemen: building on traditions and enabling communities to craft new rules. Hydrogeology Journal. 20, (6) pp. 1177-1188
Takounjou, A. F., Kuitcha, D., Fantong, W. Y., Ewodo, M. G., Haris, H. K., & Issa, T. O. (2013). Assessing groundwater nitrate pollution in Yaoundé, Cameroon: modelling approach. World Applied Sciences Journal, 23(3), 333-344.
Templeton, M. R., Hammoud, A. S., Butler, A. P., Braun, L., Foucher, J. A., Grossmann, J., ... & Jourda, J. P. (2015). Nitrate pollution of groundwater by pit latrines in developing countries.
Tewari, D. D. (2009) A brief historical analysis of water rights in South Africa. Water Int. 30 (4) 438-445.
The Environment Agency, (2009). Environmental Permitting Guidance on Groundwater Activities (England and Wales) Regulations 2010, version 1.0.
266
The Environment Agency, (2012). Groundwater Protection Principles and Practise (GP3) LIT 7562, version 1.
Tindimugaya, C. (2010) Assessment of groundwater availability and its current and potential use and impacts in Uganda. Country Report prepared for project: Groundwater in Sub-Saharan Africa: Implications for food security and livelihoods‘ International Water Management Institute, Sri Lanka.
Todd, K. (1980). Groundwater Hydrology. Published by John Wiley & Sons, New York Chichester, - 2nd Edition.
Tran, N. H., Hu, J., Li, J., & Ong, S. L. (2014). Suitability of artificial sweeteners as indicators of raw wastewater contamination in surface water and groundwater. Water research, 48, 443-456.
Tredoux G, Cave L, Engelbrecht P. (2004). Groundwater pollution: Are we monitoring appropriate parameters? Water SA 30(5): 114–119.
Tredoux, G. (2003). Nitrate and associated hazard quantification and strategies for protecting rural water supplies. Water Research Commission.
Trick, J. K., Stuart, M., & Reeder, S. (2008). Contaminated groundwater sampling and quality control of water analyses. Environmental geochemistry site characterization, data analysis and case histories. Elsevier, London, 29-57.
U.S. Environmental Protection Agency, (2010). Ground Water Sampling-A Workshop Summary, Dallas, Texas, November 30-December 2, EPA/600/R- 94/025, 146 pp.
UNDP (United Nations Development Programme) (2012). The Rise of the South: Human Progress in a Diverse World. New York, UNDP.
United Nations Development Programme, (2000). World Resources 2000-2001. Washington DC, World Resources Institute
United Nations Environment Programme, (1989). Environmental Data Report 1989/90, Blackwell Reference, Oxford, 547 pp.
United Nations Environment Programme, (1996). Groundwater: a threatened resource. UNEP Environment Library, No.15. (Nairobi, Kenya: UNEP.)
United Nations Population Division, (2001). World Population Prospects 1950-2050 (The 2000 Revision). New York, United Nations.
United Nations, (2012). Review of the contributions of the MDG Agenda to foster development: Lessons for the post-2015 UN development agenda. UN System Task Team on the Post-2015 UN Development Agenda. New York, UN.
United Nations, (2015). The United Nations World Water Development Report 2015: Water for a Sustainable World. Paris, UNESCO.
United States Environment Protection Agency, (2001). Risk Assessment Guidelines for Superfund (RAGS), vol. 1, part D, US Government Printing office, Washington, DC.
267
United States Environment Protection Agency, (2002). Risk Assessment Guidelines for Superfund (RAGS), vol. 1, part E, US Government Printing office, Washington, DC.
United States Environmental Protection Agency, (2010) Pavillion Groundwater Superfund Site Assessment, Pavillion, Fremont County, Wyoming.
United States Environmental Protection Agency, (2011). National Menu of Best Management Practices for Storm Water Phase II, United States Environmental Protection Agency[ on-line] Available: http://www.epa.gov/npdes/menuofbmps/menu.htm. [17/12/2011].
United States Geological Survey Agency (2010) Nutrients in the Nation‘s streams and Groundwater: National Findings and Implications, Fact sheet 2010–3078.
USAID (2009). Nigeria: Water and Sanitation Profile. [Online] Available: http://pdf.usaid.gov/pdf_docs/PNADO937.pdf [12/01/2013].
USEPA. (2013). Methods for Chemical Analysis of Water and Wastes. EPA-600/4-79- 020, USEPA-EMSL, Cincinnati, Ohio 45269, March.
Van Genuchten, M. T, Simunek, J., & Sejna, M. (2005). The HYDRUS-1D software package for simulating the one-dimensional movement of water, heat, and multiple solutes in variably-saturated media. University of California-Riverside Research Reports, 3, 1-240.
Van Lanen, H. A. J. (1999). Monitoring for groundwater development in arid regions. International conference on on regional aquifer system in arid zones. Managing non-renewable resources in Tripoli (Libya).
Velasquez EV , Creus S , Trigo RV , et al. (2013). Pituitary-ovarian axis during lactational amenorrhoea. II. Longitudinal assessment of serum FSH polymorphism before and after recovery of menstrual cycles. Hum Reprod. 21:916–923.
Wada, Y., van Beek, L. P., van Kempen, C. M., Reckman, J. W., Vasak, S., & Bierkens, M. F. (2010). Global depletion of groundwater resources. Geophysical Research Letters, 37(20).
Wakida, F. T., & Lerner, D. N. (2005). Non-agricultural sources of groundwater nitrate: a review and case study. Water research, 39(1), 3-16.
Walsham, G. (1995). The Emergence of Relativism in IS Research. Information Systems Research, 6(4), 376-394.
Wang, M., Zhang, L. M., Prosser, J. I., Zheng, Y. M., & He, J. Z. (2009). Altitude ammonia‐oxidizing bacteria and archaea in soils of Mount Everest. FEMS microbiology ecology, 70(2), 208-217 water. J Chem Phys 109:373–384.
Waylen, K. A., Blackstock, K., and Cooksley, S. (2011). Encouraging land-manager contributions to protecting and enhancing the water environment. Policy brief forScotland. The James Hutton Institute, Aberdeen.
Weinhold, F. (1998). Quantum cluster equilibrium theory of liquids: Illustrative application to
West, S., and Zimmerman, L. (2008). Redoing gender through divorce. Journal of Social and Personal Relationships, 25(1), 5-21.
White, I., and Howe, J. (2003). Planning and the European Union Water Framework Directive. Journal of Environmental Planning and Management 46(4):621–631.
WHO (2006). Protecting Groundwater for Health: Managing the Quality of Drinking-water Sources. Edited by O. Schmoll, G. Howard, J. Chilton and I. Chorus. ISBN: 1843390795. Published by IWA Publishing, London, UK.
WHO (2011). Guidelines for drinking-water quality. 4th ed. WHO Press Geneva, Switzerland. 541p. [Online] Available: www.who.int/water_sanitation_health/publications. [12/11/203].
WHO and UNICEF (2000). Global Water Supply and Sanitation Assessment 2000 Report. Geneva and New York, World Health Organization and United Nations Children‘s Fund.
WHO and UNICEF (2014). Progress on drinking water and sanitation: 2014 update. New York, WHO/UNICEF Joint Monitoring Programme for Water Supply and Sanitation.
Wilson, J. L., and Liu, J. (2004) Backward tracking to find the source of pollution, Waste Management Risk Remediation, (1), 181-199.
Wilson, S. (2014). Eyrewell Forest groundwater system investigation.
Winder, N. (2000). Modelling within a thermodynamic framework: a footnote to Sanders (1999). Cybergeo: European Journal of Geography.
Wood, W. W. (2013). Guidelines for Collection and Field Analysis of Groundwater Samples for Selected Unstable Constituents. In: U.S. Geological Survey Techniques for Water Resources Investigations, Book 1, and Chapter D-2.
World Bank (2002). Urbanization in developing countries. The World Bank Research Observer, 17(1), 89-112.
World Bank (2010). Sociodemographic, urbanisation and Disasters. Washington, DC: World Bank.
World Bank (2012). Managing the Invisible: Understanding and Improving Groundwater Governance.
World Bank, (2000). Strategic Environmental Assessment and Integrated Water Resources Management and Development, the World Bank, Washington D. C.
World Health Organisation (1984). Guidelines for drinking-water quality, health criteria and other supporting information. World Health Organization, Geneva.
World Health Organisation (2011). Guidelines for drinking water quality (4th edn), World Health Organisation.
Wyatt, J. and Wyatt, S. (2003). When and How to Evaluate Health Information Systems? International Journal of Medical Informatics, 69, 251-259.
Yaron, B., Dror, I., & Berkowitz, B. (2012). Soil-subsurface change: chemical pollutant impacts. Springer.
Yaron, U., Gammel, P. L., Ramirez, A. P., Huse, D. A., Bishop, D. J., Goldman, A. I., ... & Eskildsen, M. R. (1996). Microscopic coexistence of magnetism and superconductivity in ErNi2B2C.
Yearley, S. (2005). Cultures of environmentalism. Empirical Studies in Environmental Sociology.
Yin, R. K. (2009). Case study research. Design and methods. Thousand Oaks, CA: Sage.
Yin, R. K., (1994). Case Study Research: Design and Methods. Sage Publications, Thousand Oaks, California.
Young, C. P., Blackmore, K. M., Reynolds, P. J. and Leavans, A. (1999). Pollution Potential of Cemeteries. Water Research Center R&D. Project Record P2/024/1 for the Environment Agency. 105.
Younger, P. L. (2007). Groundwater in the Environment. Blackwell publishing, London.
Zaporezec, A. (1994). Guidebook on mapping groundwater vulnerability. IAH (International contributions to hydrogeology). Verlag Heinz Heise, Hannover
Zekster, A., and Everett, I. (2004). Groundwater Resources of the World and their Use. UNESCO, IHP-VI Series in Groundwater No 6.
Zheng, C., & Kinzelbach, W. (2000). Calibration of a regional groundvvater flow model using environmental isotope data. In Tracers and Modelling in Hydrogeology: TraM'2000; Proceedings of TraM'2000, the International Conference on Tracers and Modelling in Hydrogeology Held at Liège, Belgium, in May 2000 (No. 262, p. 439). IAHS Press.
Zheng, C., & Wang, P. P. (1999). MT3DMS: a modular three-dimensional multispecies transport model for simulation of advection, dispersion, and chemical reactions of contaminants in groundwater systems; documentation and user's guide.