+ All Categories
Home > Documents > Developing Normative Data for Three Unilateral Lower ...

Developing Normative Data for Three Unilateral Lower ...

Date post: 01-Feb-2022
Category:
Upload: others
View: 1 times
Download: 0 times
Share this document with a friend
89
Grand Valley State University ScholarWorks@GVSU Masters eses Graduate Research and Creative Practice 1997 Developing Normative Data for ree Unilateral Lower Extremity Functional Tests Brian Fulton Grand Valley State University Kathleen Hegyan Grand Valley State University Troy Wieling Grand Valley State University Follow this and additional works at: hp://scholarworks.gvsu.edu/theses Part of the Physical erapy Commons is esis is brought to you for free and open access by the Graduate Research and Creative Practice at ScholarWorks@GVSU. It has been accepted for inclusion in Masters eses by an authorized administrator of ScholarWorks@GVSU. For more information, please contact [email protected]. Recommended Citation Fulton, Brian; Hegyan, Kathleen; and Wieling, Troy, "Developing Normative Data for ree Unilateral Lower Extremity Functional Tests" (1997). Masters eses. 316. hp://scholarworks.gvsu.edu/theses/316
Transcript

Grand Valley State UniversityScholarWorks@GVSU

Masters Theses Graduate Research and Creative Practice

1997

Developing Normative Data for Three UnilateralLower Extremity Functional TestsBrian FultonGrand Valley State University

Kathleen HegyanGrand Valley State University

Troy WielingGrand Valley State University

Follow this and additional works at: http://scholarworks.gvsu.edu/theses

Part of the Physical Therapy Commons

This Thesis is brought to you for free and open access by the Graduate Research and Creative Practice at ScholarWorks@GVSU. It has been acceptedfor inclusion in Masters Theses by an authorized administrator of ScholarWorks@GVSU. For more information, please [email protected].

Recommended CitationFulton, Brian; Hegyan, Kathleen; and Wieling, Troy, "Developing Normative Data for Three Unilateral Lower Extremity FunctionalTests" (1997). Masters Theses. 316.http://scholarworks.gvsu.edu/theses/316

Developing Normative Data for Three Unilateral Lower Extremity Functional Tests

By

Brian Fulton Kathleen Hegyan

Troy Wieling

THESIS PROPOSAL

Submitted to the Department of Physical Therapy at Grand Valley State University

Allendale, Michigan in partial fulfillment of the requirements

for the degree of

MASTER OF SCIENCE IN PHYSICAL THERAPY

1997

THESIS

Chai

^ O V A L :

Member: Gore n Aider!

Member/Timothy t ^ i c k ^■/.nh

Date

DEVELOPING NORMATIVE DATA FOR THREE UNILATERAL LOWER EXTREMITY FUNCTIONAL TESTS

ABSTRACT

The purpose of this research study was to gather normative data on three

unilateral extremity functional tests: single-leg triple hop for distance, single-leg timed

hop, and single-leg cross-over triple hop for distance. A total o f ninety-six male and

female subjects between the ages of 18-30 volunteered to participate in this study. The

variables looked at in this study were: age, gender, height, weight, leg dominance,

activity level, and order o f tests performed. Data from the three functional hop tests were

divided into aggregated data and non-aggregated data. The data were analyzed using

SPSS© for Windows and SAS® software packages. Gender, activity level, and leg

dominance influenced the results of the functional tests. This study may assist

rehabilitation professionals in evaluating and documenting functional progression.

ACKNOWLEDGMENTS

The authors would like to express their appreciation to the following individuals for generously giving their time and assistance, as well as their much needed support:

Jolene Bennett, M.A., P.T., OCS, A.T.C. for her suggestions for the topic for this study, and her continued support with completion o f this study as well as her dedication to enhancing the field of Physical Therapy.

Gordon Alderink, M.S., P.T. for his commitment to research and his commitment to excellence in furthering the education of physical therapy students.

Timothy Lesnick, M.Sc. for his statistical expertise and explanations of our data analysis and for taking the extra time to ensure completion of our thesis.

Angela Fought and Tonya Adams, statistics students, for their patience and their statistical knowledge in analyzing our data.

To our families for their much needed love and support not only for completion of our thesis, but throughout our entire college career. We couldn’t have done it without you!

t i l

TABLE OF CONTENTS

PageABSTRACT...........................................................................................................................ü

ACKNOWLEDGEMENTS.................................................................................................üi

DEFINITION OF TERMS...................................................................................................vi

CHAPTER1. INTRODUCTION................................................................................................1

Context and Background................................................................................. 1Significance, Problem, and Purpose o f Study...............................................5

2. LITERATURE REVIEW.................................................................................... 6

Kinematic/Kinetic Chain................................................................................ 6Closed Kinematic Chain......................................................................7Open Kinematic Chain........................................................................7Open and Closed Kinematic Chain................................................... 7

Kinematic Chain o f the Lower Extremity.................................................... 8Joints of the Low Back................................................................................... 8Hip Joint.......................................................................................................... 9

Open Kinematic Chain.......................................................................9Closed Kinematic Chain.....................................................................9

Knee Joint.................................................................................................... 10Open Kinematic Chain.....................................................................11Closed Kinematic Chain...................................................................13

Ankle and Foot Joints................................................................................. 17Open Kinematic Chain.....................................................................17Closed Kinematic Chain...................................................................18

Joint Proprioception.................................................................................... 19Simulation and Replication of Functional Activities............................... 19Testing Methods.......................................................................................... 20

Isokinetics....................................................................................... 20Functional Testing...........................................................................23Functional Testing versus Isokinetic Testing...............................27

Normative Values....................................................................................... 29

3. Methods and Materials....................................................................................... 30

Subjects.......................................................................................................30Materials......................................................................................................32

IV

Methods........................................................................................................33Data Analysis............................................................................................... 34

4. Results................................................................................................................. 37

5. Discussion and Conclusions............................................................................... 46

Clinical Significance.....................................................................................50Implications for Future Research................................................................ 51Limitations.................................................................................................... 52Conclusion......................................................................................................55

REFERENCES.........................................................................................................56

APPENDIX A- INFORMED CONSENT............................................................. 59

APPENDIX B- PRESCREEN QUESTIONNAIRE............................................. 62

APPENDIX C- SPORTS ACTIVITY RATING SCALE..................................... 64

APPENDIX D- PRETEST FLEXIBILITY SCREEN.......................................... 65

APPENDIX E- SUBJECT EXCLUSION CRITERIA......................................... 66

APPENDIX F- WARM-UP STANDARD PROTOCOL..................................... 67

APPENDIX G- FUNCTIONAL TESTING INSTRUCTIONS PROTOCOL....70

APPENDIX H- DATA COLLECTION SHEET....................................................73

APPENDIX I- SCATTERPLOTS (TABLES 4.8-4.12)........................................ 75

APPENDIX J- SCATTERPLOT (TABLE 4.13)...................................................80

DEFINITION OF TERMS

Closed Kinetic Chain (CKC): "Occurs when the terminal segment of the limb is fixed,

such as during a squat, leg press, step up, stair climber machine" (Wilk, Escamilla, Flesig,

Arrigo, & Barrentine, 1995, p.337).

Fryette's Laws:

Law I- Side bending and rotation o f the thoracic, lumbar, and sacral vertebrae

occur in the opposite direction when in the neutral spine position.

Law n-Side bending and rotation o f the cervical spine always occur in the same

direction. Side bending and rotation of the thoracic, lumbar, and sacral

vertebrae occur in the same direction when the spine is in full flexion or

extension.

Law ni-Vertebral motion in any plane will reduce the available motion in

another plane.

*It is theorized that cervical motion as described in Law 11 actually encompasses

vertebrae extending firom the first cervical vertebra to the third or fourth thoracic

vertebra. It is also theorized that the fifth lumbar vertebra and the first sacral ver­

tebra always move in the same direction regardless o f the spinal position

(Kaltenbom, 1993).

Functional Testing: "The performance of x number of trials of a functional activity or

series of activities, to indirectly assess muscle strength and power, and attempt to

quantify functional ability" (Bandy, 1994, p. 108).

VI

Leg Length: The length of the lea measured from the floor to the subject's anterior

superior iliac spine on the pelvis. The subject will not be wearing shoes for this

measurement.

Normal population: Subjects that have not had any surgeries o f the back, hip, knee,

ankle, or foot; have not had any injuries o f the same structures that required care by a

physician within the last year; a range of motion of at least 65“-70° of the hip flexors,

quadriceps, and hamstring muscle groups; a range o f motion of at least 10° o f the

gastrocnemius, and at least 10° o f the soleus muscle groups; no known knowledge of any

pathologies; are not currently pregnant or have given birth within the last six months, and

are currently not involved in intercollegiate sports.

Normative values: Those values collected from unilateral functional tests performed by

the normal population.

Open Kinetic Chain (OKC): "Occurs when the terminal segment is free to move, such

as with knee extension, knee flexion, or kicking" (Wilk et al., 1995, p.337).

Partially Kinetic Chain Exercises: "Occurs when the distal segment meets resistance

but is not completely fixed or stationary, such as during use o f the slide board, cross­

country skiing, or swimming" (Wilk et al., 1995, p.337).

SLR: Subject lies down with low back and sacrum flat on the table and one leg flexed

with foot flat on the table. Subject then raises the other leg with knee straight and foot

relaxed. An angle o f approximately 80° between the table and the raised leg is considered

normal hamstring length (Kendall, F., Kendall, E., Provance, 1993).

vu

Succession of CKC -OKC Drills: "Occurs when the distal or terminal segment

repeatedly and rapidly opens and closes, such as during plyometrics, high-stepping agility

drills, running, and Jumping" (Wilk et al., 1995, p.337).

Thomas Test: "Subject is seated at end of table with thighs halfway off table. The

examiner places one hand behind subject's back and the other hand under one knee,

flexing subjects thigh toward their chest and giving assistance as the subject lies down.

The subject then holds thigh, pulling knee towards chest only enough to flatten the low

back and sacrum on table" (Kendall et al., 199-31, p.333). The subject allows the

unsupported thigh to drop towards the table with the knee flexed over the end of the table.

If subject's posterior thigh touches the table and knee is flexed approximately 80°, hip

flexors are considered normal in length (Kendall et al., 1993).

vm

CHAPTER I

INTRODUCTION

Context and Background

Within the medical field, assessment and accountability o f treatment methods as

well as method effectiveness, is growing in importance. This push for quality and

effectiveness of health care has even been dubbed "the third revolution in medical care"

by Arnold Reiman (Jette, 1993, p. 528). This "Era o f Assessment and Accoimtability"

follows the "Era of Expansion" and "Era of Cost Containment" as major shifts in how

medical care has been looked upon since the end of World War II (Jette, 1993, p. 528;

Jette, 1995, P. 965).

The governmental expenditures for health care have been continuously rising

during the past thirty years. In 1965, the total expenditure for health care was $5.6 billion

(Jette, 1995). In 1989, this increased to $620 billion encompassing 11.2% of the Gross

National Product (GNP) (Jette, 1995). Although costs decreased to $150 billion in 1990

(Jette, 1995), 13% of the GNP was spent on health care concerns (Jette, 1995). The

major factors contributing to these high costs include the increasing incidence of chronic

disease, the increasing proportion of the elderly in the population, and the high costs of

healthcare (Jette, 1990).

Physical therapy is one of the largest nonphysician groups of health professionals

(Jette, 1993) that has shown marked growth as a profession in recent years. With this

growth, utilization of services has increased and is projected to increase even more in the

future (Jette, 1995). As in medicine, which uses outcome assessments that look at

function and quality of life as well as disease and mortality rates (Jette, 1995), physical

therapy needs to address the pros and cons o f different interventions to better contain cost

expenditures. Governmental agencies and third-party payers have recently been

addressing cost issues by carefully scrutinizing therapeutic interventions and procedures

and the resulting outcomes of patient care. The Joint Commission on Accreditation of

Health Care Organizations' (JCAHCO) emphasis has shifted from traditional structural

measures to patient outcomes and quality assurance (Jette, 1993). The Agency for Health

Care Policy and Research (AHCPR) was developed to examine the impact of health care

services and procedures on patient's survival, health status, functional capacity, and

quality of life (Jette, 1993). As a consequence of the changing outlook on health care,

outcomes of physical therapy are being used to justify policies regulating practice as

standards for reimbursement. These outcomes have started to shift from a traditional

impairment basis (e.g. limits in range of motion and muscle weakness) to one that is

thought to more optimally reflect functional status (Jette, 1995) (e.g. hop tests, shuttle run

no pivot shift and pivot shift, carioca, stairs running, etc.) (Barber, Noyes, Mangine,

McCloskey, & Hartman, 1990; Risberg & Ekeland, 1994; Tegner, Lysholm, Lysholm, &

Gillquist; 1986).

Physical therapists, as well as other rehabilitation experts, need practical

functional evaluation methods that are easy to use and relatively inexpensive. A large

proportion of functional performance activities used for assessment in the clinic include

the use of the lower extremities. Examples of these activities include walking, squatting

and going up and down stairs. Development o f reliable and valid measures o f lower

extremity functional status is greatly needed for documenting changes in rehabilitation,

for follow-up studies, and for quality assurance (Oberg, U., Oberg, B., & Oberg, T.,

1994).

The lower extremity (LE) is made up o f a series o f rigid links (bones)

interconnected together to form a system. The lower spine, hip, knee, and ankle-foot

complex work together in a kinematic chain to produce functional movements. There are

two types of kinematic chain systems, open and closed. Each type affects the lower

extremity functions differently. During closed kinematic chain (CKC) activities whereby,

the distal end of the segment is fixed, (Bunton, Pitney, Kane, Cappaert. 1993; Norkin &

Levangie, 1992; Fu, Woo & Irrgang, 1992; Wilk & Andrews, 1992; Wilk, Escamilla,

Fleisig, Arrigo, Barrentine, 1995), multiple joints within the system work together to

provide the movement (Bunton et al., 1990; Norkin & Levangie, 1992; Wilk & Andrews,

1992). One example is rising from a squatting position, where the lower spine, hips, and

knees extend while the ankles plantarflex. Ligaments and muscles interconnect the

segments within the LE. Ligaments provide passive elastic moments, whereas, muscles

dynamically accelerate and decelerate the limb during CKC multiplanar move-ments

(Bunton et al., 1993). Bunton also emphasized that a wide variety of muscle actions are

possible with CKC activities: isometric, concentric, and eccentric contractions. Open

chain systems (OKC) function when the distal segment is free to move as with isolated

knee flexion and extension, for example in sitting. (Bimton et al., 1993; Norkin &

Levangie, 1992; Fu et al., 1992; Wilk et al., 1995).

Many functional activities that use the lower extremities, such as those previously

mentioned, include closed kinematic chain systems, exclusively or in part. Although

methods o f evaluating lower extremity functional performance should include CKC

activities, many physical status measures that incorporate open chain movements have

been used in the past. These include goniometry for ROM assessments, isokinetic testing

for muscle strength, functional score questionnaires, joint laxity and limb girth measure­

ments. Isokinetic testing, which operates as an OKC system, is a common tool for

assessing functional performance due to its inherent safety, objectivity, and

reproducibility. Recently, this technique's ability to objectively assess lower extremity

function, and do it safely, has been questioned. (Wilk, Romaniello, Soscia, Arrigo. &

Andrews, 1994). Research results have indicated that isokinetic testing may actually

increase the amount o f anterior shear forces occurring at the knee joint. This method uses

open kinetic chain motions that do not produce as much compressive stabilizing forces as

with functional testing. The increased compressive forces associated with closed kinetic

chain testing appear to reduce the amount of shearing at the joint (Bunton et al., 1990;

Graham, Gehlsen, & Edwards, 1993; Wilk & Andrews, 1992; Wilk et al., 1995; Wilk et

al., 1994). The use o f CKC testing, such as hop tests, has been shown to be potentially

safer and more accurate in simulating functional movements and activities as compared to

tests that use OKC motions (Bunton et al., 1993; Fu et al., 1992; Graham et al., 1993;

Wilk & Andrews, 1992; Wilk et al., 1995). CKC movements may transmit more

compressive versus shearing forces through the joints of the lower extremity which

increases joint stability. This reduces the risk o f trauma or injury to joint structmes.

Functional performance also is thought to include a series of OKC and CKC

actions (Wilk et al., 1995). Events such as walking and running in which a proportion of

the gait cycle is spent in either OKC or CKC systems demonstrates this. Functional

testing of performance should reflect the actual activity the individual will perform, in

addition to functional stability and strength. Bandy emphasized that evaluation of an

extremity must include functional testing to reduce the risk that future participation in

activities may "cause major problems and increase the incidence of re-injury" (1994, p.

108).

Significance, Problem, and Purpose of Study

Andrews, Thomas, and Bohannon stated that there needed to be reference values

against which a patient's performance could be compared (1996, p. 248). These authors

explained that patient performance could be assessed by comparing outcome measure­

ments to those obtained from apparently unimpaired individuals. However, there is a

lack of adequate information on normative values for unilateral lower extremity

functional testing of the general population. The purpose o f this study was to gather

normative values for three unilateral lower extremity functional tests: single-leg triple

hop for distance, single-leg timed hop, and single-leg cross-over triple hop, in a normal

population between the ages o f 18-30. These values can then be used clinically during

assessments o f lower extremity functional performances

CHAPTER 2

LITERATURE REVIEW

Kinematic/Kinetic Chains

How segments o f bodies move and the forces behind those movements has been

an area of interest for researchers for many years. Kinematics describes motions of

segments without making references to the forces producing the motion. Movements can

be described kinematically by the type of motion that is occurring, as well as location,

magnitude and direction. For example, general plane motions of the knee include flexion

and extension in the sagittal plane. The amount of movement about the axis of the knee

can be measured in degrees. Kinetics studies the internal and external forces producing

motion or maintaining the segments a body in equilibrium (Norkin & Levangie, 1992).

The concepts of kinetic and kinematic chains are most often referred to in

engineering terms. Kinematic chains are a series of rigid links that are interconnected in

a mechanical system. Motion occurring at one joint within the system would produce a

predictable motion in other joints in the system (Bunton et al., 1993; Norkin & Levangie,

1992; Wilk and Andrews, 1992). Kinetic chains represent the linkage of muscles and

ligaments that dynamically and passively accelerate and decelerate the limb during

locomotion in the sagittal, fi'ontal and transverse planes (Wilk and Andrews, 1992).

Within the body, this system appears when some joints are linked together in a series in

which motion at one joint produces motion at an adjacent joint (Bimton et al., 1993;

Norkin & Levangie, 1992; Wilk et al., 1995). Often in the literature the definitions of

kinematic and kinetic chains are used interchangeably. For the purpose of this study, the

use o f kinematic and kinetic chains will also be used interchangeably.

Closed Kinematic Chain

Closed kinetic chains (CK.C) have been described by Steindier in 1973 (Wilk and

Andrews, 1992) as having both the proximal and distal joints being fixed to an

immovable framework. Other authors have differing opinions about whether proximal

joint segments are free to move or are also fixed within the system (Bunton et al., 1993;

Fu et al., 1992; Wilk et al., 1995). The general consensus is that closed chain systems

arise through weight bearing or other activities in which the distal end of the segment is

fixed.

Open Kinematic Chain

Open kinematic chains (OKC) consist o f the distal end of the segment(s) being able

to freely move and not necessarily inducing movement on any other joint (Bunton et al.,

1993; Norkin & Levangie, 1992; Fu et al., 1992; Wilk & Andrews, 1992).

Open and Closed Kinematic Chain

When a body part is fixed or meets resistance, there are certain patterns o f muscle

recruitment and proximal motions that vary based upon the desired functional activity.

These recruitment patterns and joint motions also vary from open kinematic chain

movements in which the distal segment is free to move. These two types o f kinematic

motions can also produce different forces at the joints as a result of the position the body

segment is in and type and location o f muscles recruited.

Many functional activities may be thought of as containing a combination of OKC

and CKC motions. Wilk et al. (1995) referred to these movements as succession CKC-

OKC drills. These movement patterns are often seen in activities such as basketball and

volleyball that require an individual to run, jump, and change directions. These

movements greatly challenge the ability of the LE and spine to control and absorb

tremendous ground reaction forces, maintain balance, and to perform the skill with a high

degree of coordination. Though gait is not usually thought to be as challenging as those

sports mentioned above, it too possesses successions of CKC and OKC motions. During

walking, 60% of the gait cycle is in stance phase (CKC) and 40% in the swing phase

(OKC). As speed increases, time spent in stance decreases to 30% and 20% and 70% and

80% in swing during running and sprinting respectively.

Kinematic Chain of the Lower Extremity

The Joints o f the lower spine, hip, knee, ankle and foot form an interdependent

kinematic system. Norkin & Levangie (1992) emphasized that during CKC movements,

a change in function or structure in one joint will usually cause a change in the function

of another joint within the system. For example, when a person who is standing erect

bends over from the waist, the muscles, passive ligamentous structures and bones of the

spine and hips all contribute to the motion. Also, how particular joints are involved in

OKC-CKC activities impacts the range of motion (ROM), positioning, and function of

each joint.

Joints of the Low Back (Lum bar Spine)

Often during weight bearing or CKC activities, movements of the hip cause

accompanying motions of the pelvis and compensatory motions in the spine. These

movements of the vertebrae within the spine affect positions o f vertebral bodies, facet

joints, intervertébral joints and spaces, soft tissues nervous system structures in

relationship to vertebrae above and below. A few examples of the relationships between

the hip, pelvis, and lumbar spine will be addressed in CKC patterns, but it should be

noted that these motions are usually the opposite during OKC activities and both

kinematic patterns are dependent upon Fryette's laws of spinal motion. During hip

flexion, the pelvis initially tilts anteriorly while the lumbar spine extends. Posterior tilt o f

the pelvis and lumbar flexion initially occurs with hip extension. When the right hip

adducts, the pelvis drops to that side and the spine bends to the left. Opposite actions of

the spine and pelvis occur with right hip abduction (Norkin & Levangie, 1992).

Hip Joint

Open Kinematic Chain

The hip joint, which comprises the pelvic acetabulum and the head of the femur,

primarily ftmctions to support the head, arms and trunk in static and dynamic positions

such as standing, running, and stair climbing. The hip uses OKC and CKC motions in

order to correctly perform these and other ftmctional activities. The hip primarily uses

OKC movements in order to initiate and terminate rotary movements of the lower

extremity about the axis o f the hip joint. Any forces occurring at the hip joint result

mainly through muscular activity approximating the femoral head and acetabulum. The

amount and direction of these compressive and shearing forces depend upon the position

of the joint and what muscles are facilitated (Norkin & Levangie, 1992).

Closed Kinematic Chain

The supportive ftmctions o f the hip during activities mainly represents the joint in a

CKC pattern. Norkin & Levangie stated that these supportive functions that often occur

10

during weight bearing activities, not only influence stresses placed across the hip joint,

but also results in a predominance of CKC responses, such as translatoric and accessory

motions at the interdependent joints within the lower extremity kinematic system (1992).

The muscles, ligaments, and tendons at the hip work to support the leg during

stance phase by balancing out body weight forces, joint reaction forces, and ground

reaction forces that produce joint torques and compression, shear and torsional stresses.

These structures also help to maintain the orientation o f the articular surfaces.

Maintained joint congruency decreases the chances o f joint subluxation, excessive and/or

abnormal stresses on the joint capsule, and abnormal forces on the articular cartilage

(Norkin & Levangie, 1992).

During bilateral stance, two-thirds of the body weight is supported by each femoral

head. During one-legged stance, as much as five-sixths o f the body weight is supported

by one femoral head. As a result, joint reaction and compressive forces are

approximately two and a half to three times the body weight. Therefore, activities

consisting of CKCs, such as walking and stair climbing can produce forces up to five to

seven times the body weight (Norkin & Levangie, 1 992).

Knee Joint

The knee is one of the largest joints in the body and is very complex. The

tibiofemoral and patellofemoral joints, which share a single capsule, make up the knee.

The knee joint depends on its ligaments, menisci, capsule and musculotendinous

insertions to provide the needed stability for functional activities. Although the knee is

capable of withstanding large loads to provide dynamic and static support to the body, it

I l

is vulnerable to injuries. The ligaments and menisci are placed under the most stress and

are most likely to be injured (Norkin & Levangie, 1992).

As with the hip, function at the knee can be affected by limitations in other joints.

If the ankle has restricted dorsiflexion, the knee would either be restricted in flexion, or

compensate by becoming hypermobile and be able to flex despite the ankle limitation.

Also, movements occurring distally, as with pronation and supination at the subtalar joint

causes the tibia to medially or laterally rotate. This places valgus and/or varus stresses

and rotational stresses at the knee (Norkin & Levangie, 1992).

Open Kinematic Chain

Whether the knee joint moves in OKC or in CKC motions determines its

functional ability, the types and magnitude of forces occurring at the knee, which muscles

are activated, and the overall force produced. During OKC movements, the knee

primarily provides mobility for the foot in space. Although eleven muscles act on the

knee joint, the ligaments primarily help to provide stability of the knee during OKC

activities by preventing excessive movements including hyperextension, varus and valgus

stresses, anterior-posterior (A-P displacements), and medial and lateral rotations of the

tibia. These ligaments include the anterior cruciate ligament (ACL), posterior cruciate

ligament (PCL), medial and lateral collateral ligaments (MCL and LCL) and the oblique

and popliteal ligaments (Norkin & Levangie, 1992).

A study by Wilk, Escamilla, Plesig, Arrigo and Barrentine (1995) looked at what

types of forces were present at the knee and the EMG activity o f surrounding muscles

during OKC movements of knee extension. The three types of forces studied included

12

compressive, anterior tibiofemoral shear and posterior tibiofemoral shear forces.

Maximal compressive forces were found to be 4598 +/- 2546 Newtons (N) at 90° +/- 5° of

knee flexion. No compressive forces were found at the knee joint once the influence of

muscle activity was excluded. Anterior tibiofemoral shear force was found to be more

apparent from 40° to 0° o f knee flexion. The greatest force o f 248 +/- 259 N occurred at

14° of knee flexion. These forces as well as greater anterior translation o f the tibia on the

femur, seemed to place the most stress upon the ACL. Posterior tibiofemoral shear forces

were greatest from 100° to 40° o f knee flexion. The maximum posterior shear force of

1178 +/- 594 N was at 91° +/- 9° o f knee flexion.

The researchers also looked at the EMG activity of the quadriceps femoris and

hamstring muscle groups. The subject sat and performed isolated knee extension

exercises. It was discovered that hamstring activity was almost silent during knee

extension whereas quadriceps femoris activity increased with knee extension. At 0° to

30° of knee flexion, the quadriceps to hamstring EMG peak amplitude ratio reached

5/6:1.

Torque production by the knee musculature, tendons and ligaments depends on

the moment arm (MA) of the lever system and the length-tension relationship in the

muscles. When the MA o f the muscle decreases in length from the axis o f the joint, more

force is required to move the limb through the available range of motion (ROM). This

condition is evident during OKC knee extension activities. As the knee approaches

terminal extension without added resistance, the distance of the quadriceps tendon from

the axis of the knee shortens. With extension of the knee, the patella moves deeper into

the intercondylar groove. Because the patella cannot continue to increase the quadricep's

leverage, more force needs to be generated by the quadriceps to fully extend the knee

(Norkin & Levangie, 1992). This increased force may overstress the ligaments and

menisci causing damage or rupture.

OKC activity (via isometric and isotonic quadriceps contraction) produces

increased ACL strain from 75° flexion to maximum stress at 0° (Fu et al, 1992).

Terminal extension creates a stress that is 5.5% more than with passive motion. The

greatest amount o f anterior tibial translation occurs between 30° - 0° knee flexion during

OKC activities (Wilk and Andrews, 1992). In a study by Wilk et al. in 1995, quadriceps

to hamstring activity was greater in OKC isokinetic extension exercises between 0° - 40°

o f knee flexion. Also in this study, the authors documented that the ACL was stressed by

248 ± 259N between 40° - 0° o f knee extension during the exercise.

Closed Kinematic Chain

In activities, the knee works with the hip and ankle to support body weight in static

postures and to dynamically support and transfer weight bearing forces during sitting,

squatting, locomotion, and other activities. Norkin & Levangie (1992) suggested that

dynamic compressive forces at the knee could increase from two to three times body

weight in normal gait to at least five to six times body weight during running and stair

climbing. Wilk et al.(1995) showed that with level walking, the ground reaction forces at

heel strike were about two to three times body weight, and three to five times body

weight during running.

Wilk et al. (1995) also looked at forces occurring at the tibial femoral joint and

14

EMG activity o f muscles during the vertical squat and horizontal leg press. Compressive

joint forces occurred with both activities. The squat produced a maximal force of 6,139

+/- 1,708 N at 91° +/- 12° of knee flexion, while the leg press produced its greatest force

o f 5,762 +/1,508 N at 89° +/- 7° of knee flexion. No noticeable anterior shear forces

occurred at the joint, but posterior shear forces occurred throughout the knee's complete

ROM. The greatest posterior shear forces were 1,783 +/- 634 N at 900 +/- 170 of knee

flexion during the squat and 1,167 +/- 55 N at 940 +/- 120 of knee flexion with the leg

press. These forces were most noticeable for both activities from 70° to 100° of knee

flexion (Wilk et al, 1995).

EMG activity o f the quadriceps was compared to hamstring activity during the

vertical squat and horizontal leg press. It was found that quadriceps activity was highest

at greater angles o f knee flexion and not towards terminal knee extension. Also, with the

vertical squat more co-contraction between the quadriceps femoris and hamstrings was

seen at 45 to 0 degrees of knee flexion. The horizontal leg press primarily produced

concentric quadriceps contractions (Wilk et al, 1995).

Graham et al. looked at EMG activity during OKC and CKC exercises. At 60°

per second the quadriceps to hamstring ratios were 4.65:1 and 2.25:1 during 30° per

second isokinetic speeds. The high quadriceps to hamstring ratio indicated that the

quadriceps activity was placing high anterior shear forces on the tibia. During assessment

of the following CKC activities: unilateral one quarter squats to 60° knee flexion, lateral

step up (20.3cm step), and movements on the Fitter, Stairmaster 4000 and a slide board

revealed a ratio o f only 1.41:1 to 1.64: 1. It was foimd the speed of the activities didn't

15

influence the ratios. Graham et ai. cited limitations in this study and concluded that the

CKC exercises used in their study resulted in minimal A/P shear forces at the knee joint

(1993).

Wilk et al. (1995) discovered through EMG testing that positioning of LE

components altered the magnitude o f force about the knee and muscle activity produced.

When the LE were placed in a narrower stance, an increase in PCL stress, and muscle

activity and torque production of the quadriceps and gastrocnemius occurred. A wider

stance increased compressive forces and muscle activity o f the hamstrings and gluteus

maximus.

In addition to muscles and ligaments, correct biomechanical alignment (posture)

o f the femur and tibia equalizes body weight forces and ground reaction forces that occur

at the knee joint in order to provide additional amount o f knee stability during CKC

activities. Also, maintenance of correct skeletal alignment may be thought of as

providing the needed compensations for decreased muscle activity during functional

activities. For example, if there is decreased quadriceps muscle activity, knee extension

can be maintained in standing because the body' center o f gravity passes anterior to the

joint axis and the groimd reaction forces passively maintain the knee in extension

(Bimton, et al., 1993; Norkin & Levangie, 1992; Fu et al., 1992).

Several authors have indicated that closed kinetic chain exercises have been used

in knee rehabilitation in recent years instead of traditional OKC methods, e.g.: isokinetics

(Bimton et al., 1993; Graham et al., 1993; Fu et al., 1992; Wilk & Andrews, 1992; Wilk

et al., 1995). The premises for using CKC exercises include the following: (1) reduced

16

anterior/posterior stress on the ACL (2) decreased patellofemoral joint reaction forces (3)

re-education of joint proprioceptors (4) better simulation and replication o f functional

movements and activities (Bunton et al., 1993 ; Fu et al., 1992; Graham et al., 1993; Wilk

et al., 1995).

There are two main theories on how ACL stress is reduced during CKC. The first

occurs through dynamic and co-contraction activity of the hamstring muscles. The

hamstring muscles contract to minimize anterior tibial displacement produced by the

quadriceps. Also during weight bearing exercises, such as a squat, hamstring activity

increases to stabilize hip flexor movements and consequently the knee. The second way

shear forces are minimized is by CKC activities increasing the joint compression forces.

Electromyographic analyses of muscle activity at certain OKC isokinetic speeds

and during certain functional activities have confirmed the CKC tend to reduce anterior-

posterior shear forces across the knee joint (Wilk et al., 1995). CKC activities can also

specifically affect the patellofemoral joint. Ground reaction forces during 0° to 15° of

knee flexion can produce forces on the patella that equal as much as 50% of the body

weight. This is due to decreased surface area of the patella making contact with the

femur. The same amount of total force acting on a smaller area increases the force per

unit area. Flexor and extensor muscle activity during stair climbing and running hills

may increase the joint reaction forces to 3.3 times the body weight at 60° o f knee flexion

(Norkin & Levangie, 1992). During deep knee bends when the knee flexes to 130°, the

reaction forces may be 7.8 times the body weight (Norkin & Levangie, 1992).

Bunton et al. describe the importance of re-education of joint proprioceptors during

17

rehabilitation to increase functional ability. Engram patterning of the central nervous

system can be accomplished by using a progression of slow to quicker CKC movements.

These movements should be precise and specific to the functional performance desired.

Increased proprioceptive awareness improves neuromuscular coordination of acceleration

reducing risks o f further injury.

Ultimately, how the knee joint functions depends upon the position of the knee

joint, how stresses are applied, and which structures are intact (Norkin & Levangie,

1992). Compressive forces are greatest with CKC movements, especially if the body is

vertical in relation to the knee joint. Posterior shear forces are also significantly greater

during CKC versus OKC activities. Anterior shear forces are greatest during OKC

terminal knee extension (40°-O° of flexion) in which more anterior translation of the tibia

on the femur occurs. These findings suggest that CKC movements are best to test and

exercise ACL reconstructed knees due to the minimal shear forces on the ACL. Also,

with respect to muscle activation, in order to facilitate hamstring activity and co­

contractions o f the hamstrings and quadriceps, CKC movements should be included in

the exercises and testing procedures.

Ankle and Foot Joints

The ankle and foot are often thought o f as forming a complex that functions together. It

is made up of the proximal and distal tibiofibular joints, talocrural joint, subtalar joint,

talocalcaneonavicular joint, transverse tarsal joint, tarsometatarsal joints, metatarso­

phalangeal joints and interphalangeal joints.

Open Kinematic Chain

18

This ankle-foot complex must meet demands o f OKC and CKC movements. In

OKC motions, the ankle-foot complex work together to clear the foot during swing phase

of gait and to position the foot for initial contact. During the swing phase of gait, dorsi-

flexion occurs in the talocrural joint. The arthrokinematics o f the subtalar joint itself, is

unique in OKC movements. Pronation produces calcaneal eversion and abduction and

dorsiflexion o f the talus. Supination involves calcaneal inversion with adduction and

plantar flexion of the talus. These movements also affect movement of the transverse

tarsal joint because the talus and calcaneus are part o f both joints (Norkin & Levangie,

1992).

Closed Kinematic Chain

This complex must also meet CKC demands to allow the LE to function

optimally. This complex provides a stable base of support for numerous weight bearing

postures without excessive muscle activity or energy expenditure. The ankle-foot

complex must also act as a rigid lever for push off during gait. The ankle-foot complex

needs to meet the following mobility demands: to dampen rotation created by more

proximal joints, have the flexibility to absorb body weight forces during loading

response, and permit the foot to conform to altered terrain (Norkin & Levangie, 1992).

Tremendous compressive forces are transmitted through the talocrural joint during gait,

as much as 450% o f body weight (Norkin & Levangie, 1992). During weight bearing, the

subtalar joint motion absorbs the lower extremity rotations that would otherwise spin the

foot or injure the ankle joint. During normal gait, the calcaneus itself takes 85 to 100% of

the body weight load during loading. In running, forces can increase to 250% of body

19

weight (Norkin & Levangie, 1992).

The arthrokinematics o f subtalar pronation and supination also differ with OKC

and CKC activities. In an open system, supination involves adduction and plantar flexion

of the calcaneus. Functioning in a closed system, supination involves abduction and

dorsiflexion of the talus. Basically, the determination of how one bone moves in

conjunction with another at the site of articulation is whether the connected segments are

in open or closed chain systems (Norkin & Levangie, 1992).

Joint Proprioception

Rehabilitation is based upon optimizing functional capacity. Deciding whether or

not to use OKC or CKC interventions and assessment measures has been a topic o f

concern in recent years. According to Bunton et al. (I 993), there is not a strong

relationship between OKC and functional activities. CKC activities allow for

accelerating and decelerating movements in sagittal, frontal and transverse planes. Due

to the position of the body during activity, CKC exercises allow for more functional

patterns o f movement with regard to athletics, and provide for multiplanar isometric,

concentric, and eccentric contractions (Bunton et al., 1993). CKC exercises can also

address factors influencing function such as weight, terrain. Joint hypermobility and

hypomobility, ground reaction forces and limb pathologies (Bunton et ai., 1993).

Simulation and Replication of Functional Activities

CKC exercises also simulate "psuedoisometric" contraction during functional

activities requiring a muscle to lengthen over one joint and shorten over a second while

its antagonist does the opposite. This occurs with the quadriceps femoris and hamstring

20

muscles as one rises from a squatting position (Fu et al., 1992).

Wilk et al. suggested that CKC movements did not completely replicate

functional activities. These authors suggested that there were actually four kinematic

classifications: OKC, CKC, partially kinetic chain exercise, and succession CKC-OKC

drills (1995). Examples o f succession CKC-OKC include plyometrics, high-stepping

agility drills, running and jumping. These activities are part o f many sports activities.

Gait analyses can also be used to advocate this classification. During walking, 60% of

the gait cycle is in stance phase and 40% in the swing phase. As speed increased, time

spent in stance decreased to 30% and 20% and 70% and 80% in swing during running

and sprinting respectively.

The use o f CKC or Succession OKC-CKC exercises during rehabilitation are

more efficient, effective, and economical. They most closely resemble functional

activities as compared to OKC activities (Bunton et al., 1993). Therefore, tools to assess

functional performance of the lower extremities must also show specificity to the

functional activity, as well as addressing issues of efficiency, effectiveness, and safety.

Testing Methods

Isokinetics

The goal o f rehabilitation professionals is to return the patient to a pre-injury level

of function. One of the more commonly utilized tools in assessing muscular strength in

an orthopaedic setting is isokinetic testing (Wilk et al., 1994). "Isokinetics are frequently

chosen because of their inherent patient safety, objectivity, and reproducibility in testing

measures" (Wilk et al., 1994, p. 60). Isokinetic testing uses isokinetic dynamometers.

21

machines that are designed to be set at constant angular velocities and to provide

accommodating resistance throughout the full ROM, to assess muscle strength (e.g. as

torque), work, power, and endurance.

There are advantages and disadvantages to using isokinetic machines to evaluate

joint function. Some of the advantages include being able to produce maximal muscle

tension throughout the full ROM, moving about an axis at a fixed rate and inherent safety

due to the accommodating resistance. The disadvantages include the joint moving about

a non-physiological axis, the production of maximal speed and muscle tension during the

entire ROM, and the decreased ability to produce accelerating and decelerating

movements. These disadvantages feed into abnormal proprioceptive input at the joint and

decreased carry-over to functional activities. Reliability of measurements also vary based

on the position the limb is tested in as well as the speed it is tested at (Schwarz, personal

communication, June 18, 1996).

It is also a concern as to whether functional capacity can be evaluated effectively

with isokinetics because velocities achieved during functional activities are much higher

than can be produced by the dynamometers. According to Prentice ( 1994), velocities

produced during hip and knee movements while kicking a soccer ball exceeded

400°/second and 12007second, respectively. The Biodex and Lido Active isokinetic

machines can attain 450° and 400° /second respectively, but only as the maximal

concentric speed. The Merac can attain up to 500° /second in concentric mode only.

These machines approach the speeds joints can attain, but can not provide optimal speeds

specific to many functional activities (Prentice, 1994).

■}-)

Another area o f concern about whether isokinetics adequately assesses functional

performance arises because it uses OKC movements and many functional activities use

CKC movements entirely or in part. Examples of these functional activities include

walking and stair climbing in which the distal joints are fixed. While several authors

have questioned the correlation o f isokinetic testing to functional activities, others have

found correlations between peak torque test results and functional test maneuvers rated

using subjective knee scores such as the Noyes scale (Noyes et al., 1989), the Marshall

scale, the Modified Noyes scale. Wilk et al. (1994) found positive relationships and good

correlations between subjective knee scores (based on the modified Noyes scale) and

knee extension peak torque values at 180° and 300°/second. Subjective knee scores of

more than 85 represents an individual being able to resume jumping, hard pivoting and

cutting at least three times a week. A statistical trend (fair correlation) was shown

between knee extensor peak torque at 300° and 450° /second and knee scores. As a result

of the study, it was also found that at 180° and 300° /second of knee extension significant

antagonist muscle contraction developed. It was suggested by the authors that this may

help to decelerate the limb and better control ACL stress.

Wilk et al. (1995) also cited many authors that found positive correlations

between subjective knee scores and peak concentric quadriceps torque at 30° and

60°/second. Other studies were cited that suggested no correlation between isokinetic

testing and athletic performance drills such as sprinting, jumping, and agility drills. Wilk

et al. (1995) also cited studies that used Kin-Com dynamometers that test knee flexion

and extension separately and in two different positions instead o f reciprocally like the

Cybex and Biodex machines do. The authors suggested that those machines that tested

more reciprocal motions showed more positive correlations with functional performances.

Functional Testing

For the purposes o f this paper, functional testing has been defined as the performance

of X number of trials o f a functional activity or series of activities, to indirectly assess

muscle strength and power, and attempt to quantify functional ability (Bandy, 1994). In

physical therapy "there is a need for practical evaluation methods, suitable for the

everyday practice, that are easy to use and that can be used with equipment that’s not too

expensive" (Oberg et al., 1994, p. 861).

Methods of assessment used to record changes in functional status between

admission and discharge, in follow-up studies, and for quality assurance need to be valid

and reliable (Oberg et al., 1994). In the past, physical assessment measures have included

goniometry, force plates, and x-ray exams (Oberg et al., 1994). Other assessment tools

include isokinetic testing for muscle strength (Arnold, Perrin, & Hell wig, 1993; Barber et

al., 1990; Brinks, DeLong, Stout, 1995; Lephart, Perrin, Fu, Gieck. McCue, & Irrgang,

1992; Magnusson, Geismar, Gleim, Nicholas, 1993; McCleary & Andersen, 1992; Perrin,

1986; Reilly, Atkinson, & Coldwells, 1991; Wilk et al., 1994); subjective functional

score questionnaires (Lephart et al., 1992, Noyes, Barber, & Mooar, 1989; Noyes, Mooar,

& Barber, 1991; Risberg & Ekeland, 1994); joint laxity measurements (Lephart et al.,

1992; Noyes, Barber, Mangine, 1991; Risberg & Ekeland, 1994); muscular girth (Lephart

et al., 1992; Reilly et al., 1991; Risberg & Ekeland, 1994); and gait assessments (Noyes

et al., 1991). These methods of assessment should, but do not, reflect physical.

24

sociability, and quality of life (Oberg et al., 1994). "Current methods of clinical

examination do not always provide an adequate assessment of these primary treatment

goals: restoration of function in the shorter term and prevention of long-term pathological

changes" (Andriacchi & Birac, 1993, p. 40).

Functional testing is a tool found to be useful in providing unique and important

information relevant to the therapeutic treatment. The purposes of functional testing

include screening to determine asymmetry in the extremities that may predispose

someone to injury, objectively assessing patient progression in a rehabilitation program,

indirectly assessing muscle strength, power, and aerobic fitness, attempting to quantify

function in order to establish team norms, and as an assessment of the ability of the

extremity to tolerate external forces (Bandy et al, 1994, p. 108). They can evaluate

present and expected physical status and indicate the need for physical therapy (Oberg et

al, 1994).

There are a large variety of functional tests, both single limb and double limb that

can be used to assess the lower extremity. The double limb tests include: shuttle run no

pivot, shuttle run pivot, figure-of-eight, stairs running, broad jump, and slope running

(Barber et al., 1990; Risberg & Ekeland, 1994; Tegner et al., 1986). A study by Risberg

and Ekeland (1994), indicated that double limb testing should occur early in the

rehabilitation process as indicators of "daily life" function. The single limb tests include:

one-legged single hop for distance, one-legged timed hop, one-legged crossover triple

hop, one-legged triple hop, one-legged vertical jump, side jump test, triple jump, stairs

hopple and lateral step-up (Bandy, 1994; Barber et al., 1990; Booher et al., 1993; Brinks

25

et al., 1995; Noyes et al., 1991; Wilks et al., 1994). These single-limb tests should be

used to assess functional strength and stability in the affected leg later in the therapeutic

process (Risberg & Ekeland, 1994).

Many functional activities, such as walking, running, and jumping, include CKC

or a succession of CKC-OKC movements (Wilk et al., 1995). These kinematic and

kinetic chain movements are included in single-limb hop tests. Single-limb hop tests,

therefore, may more accurately simulate functional activities by replicating forces across

joint structures (Wilk et al., 1995) and providing the needed proprioceptive information

in order to time and coordinate neuromuscular actions (Bunton et al., 1993). According

to Noyes et al. (1991), hop tests are valuable as a general screening assessment in the

clinical setting. These authors stated that hop tests were economical because they did not

involve expensive equipment, they were efficient, and allowed one to use the opposite leg

for a control (1991). Three single-limb tests were chosen for this study: the one-legged

single hop for distance, the one legged timed hop, and the one-legged cross-over hop.

These tests were chosen based upon the findings mentioned above and previous research

by Barber et al. (1990), Noyes et al (1991), Booher et al (1993), Bandy (1994), and Wilk

et al (1994) that indicated these tests were reliable and correlated with performance

during functional activities.

Determining the reliability of tests used to evaluate a patient is very important to

ensure accuracy o f assessments (Bandy, 1994). Due to the lack of data on the reliability

of lower extremity hop tests, Booher et al. (1993) and Bandy et al. (1994) looked at the

test-retest reliability o f several functional tests. Booher et al. (1993) looked at the:

26

single-leg hop for distance, single-leg timed hop, and 30m single-leg agility hop. The

results of the study indicated that correlation values of .77 to .94 were acceptable and

proven reliable (Booher et al, 1993). In their study, the subjects had one practice trial and

two test trials. These authors found that with this many trials the results appeared

acceptable and differences were small. Booher et al. (1993) also noticed, however, that

scores were improving which indicated that the measures were not stable. These authors

suggested that in future studies, researchers should use a greater number of trials to see if

the measures stabilized (Booher et al, 1993). A study performed by Bandy (1994),

addressed the reliability o f five functional tests: one-legged vertical hop, one-legged

horizontal hop, timed one-legged vertical hop, one-legged triple hop, and one-legged

cross-over hop. This author indicated that correlations ranging from .85 to .94 appeared

appropriate to meet the standard necessary for clinical evaluation and obtaining objective

measurement o f a patient's progress during a rehabilitation program" (Bandy, 1994, p.

III).

There are two lower extremity functional tests that have been proven unreliable

and invalid. Although Bandy (1994) found the one-legged vertical jump to be reliable, a

more recent study by Barber et al (1994) found this test to be unreliable. In this test, the

participant jumps off o f a particular limb, touches the wall, and lands on the same limb.

The distance that the participant jumped is then measured and recorded. The vertical

jump test was proven not reliable due to the fact that a large number of normal subjects

scored outside the normal limb symmetry range, which was 85% (Barber et al., 1994).

The authors concluded that this test could not be reconunended for use in detecting lower

27

limb function (Barber et al., 1994). The second test proven unreliable was the shuttle run

test. This test consists of a 6m course marked off with cones on each end. The time it

takes for the patient to complete two laps is recorded (Barber et al., 1994). The

researchers concluded that validity and reliability have been difficult to determine due to

the fact that subjects could compensate by running at half speed and guarding both legs

during the cutting and turning movements (Barber et al., 1994).

A study conducted by Noyes et al. (1991), indicated that the single-leg hop for

distance and the single-leg timed hop could be used to assess abnormal limb symmetry or

lower extremity functional limitation. These tests, however, could not be used to confirm

which of the many variables involved in lower extremity function were deficient. The

authors also concluded that although these tests have a low sensitivity rate, the high

specificity and low false-positive rates allow them to be used as confirmation tools. The

authors suggested "that these tests be used in conjunction with other clinical assessment

tools to provide confirmation o f the extent of lower limb function limitations" (Noyes,

1991, p. 518). A study by Barber et al. (1990), also indicated that the single-leg timed

hop and the single-leg cross-over hop to be the most sensitive and best indicators of

function. These authors advised clinicians "to use two one legged hop tests as a

screening procedure to determine lower-limb function" (1990, p. 211). A study

performed by Wilk et al. (1994), had results that were similar to those of Barber (1990)

and Noyes et al. (1991). In Wilk's study "A relationship and positive correlation existed

between knee extension torque at 1807sec and the timed hop, hop for distance, and triple

cross-over hop" (1994, p. 66). Wilk suggested "that clinicians performing functional hop

28

tests should include the single-leg hop for time and the single-leg cross-over triple hop

and possibly the single-leg hop for distance" (1994, p. 67).

Functional Testing versus Isokinetic Testing

Isokinetic testing operates as an OK.C system and has been reliable and commonly

used to determine muscular force and strength throughout a joint's ROM and at specific

joint angles (Arnold et al., 1993; McCleary & Anderson, 1992; Perrin. 1986). Recent

research on isokinetic testing has indicated that potentially damaging forces on knee joint

structures may be produced (Bimton et al.. 1993; Graham et al., 1993; Wilk & Andrews,

1992; Wilk et al., 1995; Wilk et al., 1994). The use of isokinetics has also been

questioned as to whether it provides "the specificity of training that is necessary to ensure

restoration of function" (Fu et al.. 1992). Reasons behind this specificity training

assumption include that patients are restrained when doing isokinetic testing (Arnold et

al., 1993; McCleary et al., 1992; Magnusson et al., 1993); testing does not duplicate the

same proprioceptive joint inputs (Bunton et al., 1993); testing does not duplicate the same

forces across joints (Bunton et al., 1993; Fu et al., 1992; Wilk et al., 1995); and testing

does not produce a "psuedoisometric" contraction of opposing muscles to help stabilize

joint structures (Fu et al., 1992).

Functional testing is able to operate as CKC or a succession of CKC-OKC

systems (Wilk et al., 1995) and can simulate multi-planar movements inherent in a lot of

functional activities (Bunton et al., 1993). Functional activities that contain CKC

systems, in part or exclusively, produce movements at all joints within the system.

29

Functional testing allows for these multi-planar movements whereas isokinetic testing,

with the patient restrained, is unable to do this. Functional testing may also reduce shear

forces on knee joint structures, help in the re-education of joint proprioceptors, and may

better simulate and replicate functional movements and activities (Bunton et al., 1993; Fu

et al., 1992; Graham et al., 1993; Wilk et al., 1995). Specificity of training to the

activities the patient needs to perform has become very important. It only makes sense

that specificity in evaluating functional performance should be as or more important to

ensure the patient will be able to optimally function in the desired activity and to screen

for any potential risk factors.

Normative Values

Andrews, Thomas, and Bohannon stated that there needed to be reference values

against which a patient's performance can be compared (1996, p. 248). These authors

explained that patient performance could be assessed by comparing outcome measure­

ments to those obtained from apparently unimpaired individuals. The problem is that

there is a lack of adequate information on normative values for unilateral lower extremity

functional testing of the general population. The purpose of this study was to gather

normative values for three unilateral lower extremity functional tests: single-leg triple

hop for distance, single-leg timed hop, and single-leg cross-over triple hop for distance, in

a normal population between the ages o f 18-30. These values can then be used clinically

during assessments of lower extremity functional performances.

CHAPTERS

METHODS AND MATERIALS

Subjects

A total o f ninety-six male and female subjects ages 18-30 years old were the

participants in this study. Participants were from a nonprobability sample. The par­

ticipants were volunteers from local geographical areas of western Michigan including

Grand Valley State University and Lakeshore Athletic Club .

The age range for the subjects was primarily chosen on the basis of convenience,

although other factors were taken into consideration. There would be decreased

hormonal influences in the female subjects if under the age of 45. Ninety percent o f post

menopausal American women have osteoporosis or decreased bone density (Lewis,

1996). Decreased bone density increases the risk for bone fractures if placed under

enough stress. Also bone mass generally decreases in both sexes after the age o f 40 due

to more osteoclastic activity versus osteoblastic activity. The body has an imbalance

between calcium in the bones and the serum. Altered protein metabolism due to

decreased levels o f androgens and estrogen that occurs over 40 years contributes to this

imbalance and the risk of osteoporosis (Brashear & Raney, 1986). The age of when

skeletal maturity occurs was also taken into consideration. Generally, girls reach

maturity at 15 years of age while boys reach it at the age of 17. Bones have finished

forming and therefore should not be influenced by the forces produced by the unilateral

hop tests (Brashear & Raney, 1986).

30

31

Each participant signed the informed consent (Appendix A) and filled out a pretest

questionnaire (Appendix B) that included items regarding medical history, present

activity level, age, weight, height and gender. Leg dominance was determined by having

the subjects kick a ball placed squarely in firont o f them. The subjects were then put

through a flexibility screen (Appendix D) to assess muscle tightness and ROM in the hip

flexors, quadriceps, hamstring, gastrocnemius, and soleus muscle groups. The Thomas

Test, Straight Leg Raise Test (SLR), and other flexibility measurements were utilized

during the screening procedure.

The criteria that excluded the subject fi-om this study included the following: 1.)

Any previous surgeries of the back, hip, knee, ankle or foot; 2.) Injuries requiring care by

a physician within the last year of the back, hip, knee, ankle or foot; 3.) Less than 80° of

knee flexion evaluated using the Thomas Test position; 4.) A SLR o f less than 65°;

5.) Less than 10° of dorsiflexion with the knee extended; 6.) Less than 10° of dorsiflexion

with knee bent to 90°; 7.) If currently participating in intercollegiate sports; 8.) Any path­

ology affecting muscle, bone or nervous system. For example, multiple sclerosis,

Parkinson’s disease, CVA, cancer, rheumatic diseases; 9.) Current pregnancy; and 10.)

Given birth within the last six months. I f the subjects met the criteria, they proceeded to

participate in the warm-up and testing procedures. Twelve subjects that participated in

this study did not follow flexibility and warm-up protocols. This occurred at the end of

subject data collection under the pretense of acquiring more subjects under limited time

constraints. In order to ensure that the name of the subject and information gained

through his or her participation was kept strictly confidential, each subject was assigned

32

an identification number.

Materials

Three single-limb tests were chosen for this study: one-legged triple hop for

distance, the one legged timed hop, and the one-legged cross-over triple hop for distance.

The names of these tests were changed in this study to single-leg triple hop for distance,

single-leg timed hop, and single-leg cross-over triple hop to more accurately describe

them.

The single-leg triple hop for distance and the single-leg cross-over triple hop for

distance are tests to determine the total distance a subject can hop three times on one leg

either in a straight line or by alternately crossing over a piece o f tape. During the single­

leg cross-over triple hop test, a subject jumped the length and alternately crossed over a

strip of tape six meters long and 15 centimeters wide. These distances were measured

with a standard tape measure and recorded in centimeters (cm). Measurements began

where the subjects’ toes touched a starting line to the back of the heel where the foot

lands firmly on the ground on the third hop. The single-leg timed hop is a test to deter­

mine the length o f time it takes a subject to cover a distance of 10 feet using a series of

hops in a straight line. The time was measured using a stop-watch and recorded in

seconds (sec). Timing began when the subjects' toes crossed a starting line and ended

when the back of their heel crossed a piece of tape indicating the end o f the 10 feet.

Methods

33

Volunteers were randomly placed into one o f two groups. The first group

consisted o f subjects using their dominant leg first to perform the tests. The second

group consisted of subjects using their non-dom inant leg first to perform the tests. The

order was randomly assigned by having the subject pick one of two labeled pieces of

paper firom a hat. Leg dominance was determined when the subject filled out the

questionnaire, as was explained earlier, and recorded on the prescreen questionnaire and

the data collection sheets (Appendix H).

Each subject went through a warm-up session prior to testing. This warm-up

session included five minutes of low resistance cycling on a stationary bike at a rate o f 20

revolutions per minute (RPM) followed by 30 second self-stretches to the hip flexor,

quadriceps, hamstring, gastrocnemius and soleus muscles of each leg. Based on the

researchers' personal experience, a rate o f 20 RPM was chosen because it was easily

attained and could be maintained without excessive perceived exertion for five minutes.

Two to five minutes after the warm-up session was completed, the subject was

taken to the testing station. Each subject performed three unilateral lower extremity

fimctional tests on each leg. The tests included the single-leg triple hop for distance, the

single-leg timed hop, and the single-leg cross-over triple hop for distance. The order the

tests were performed was randomized by the subject picking labeled pieces o f paper firom

a hat. There were three strips of paper in the hat. Each piece of paper contained the name

of one test. The order the tests were to be performed were recorded on each subject's data

collection sheet. Before each test was performed, two practice trials were allowed to

familiarize the subject with the test. All data firom the three unilateral lower extremity

34

functional tests were measured and determined by the methods previously described in

the materials section.

The researchers involved in this study instructed the subjects on how to perform

the tests via the functional testing instructions protocol in Appendix G. Each instruction

and data collection procedure was not performed by the same researcher during each data

collection session. To address concerns of reliability, each researcher performed all data

collection procedures on the first ten subjects. An interrater reliability statistical analysis

was performed to determine the reliability for measurements o f distance and time

between each of the three researchers.

The explanations on how the single-leg triple hop for distance, single-leg timed

hop, and single-leg cross-over triple hop for distance were described to the subjects and

performed are listed in Appendix G. The subjects performed three trials in each of the

three tests. The best o f the three scores was taken to determine aggregated data results

and each score firom the trials was used to analyze the non-aggregated data. If the subject

lost his or her balance, the trial was counted as a zero and not included in analyses.

Data Analysis

Data firom the three functional hop tests were divided into aggregated and non­

aggregated data and analyzed separately. Aggregated data used the best results firom each

hop test per individual for analysis. Non-aggregated data represented repeated measures,

or results firom each trial firom all hop tests per individual for analysis. The data were

analyzed using SPSS® for Windows and SAS® software packages.

SPSS® software was used to summarize the demographic information. Age,

35

height, weight, and activity levels were determined for both males and females. Descrip­

tive statistics and multiple regression analyses were done using the aggregated data. The

descriptive statistics determined the mean, standard deviation, and total number of results

o f outcomes within each individual's group of trials and over all trials o f data collection.

Multiple regression analyses were used to test for and describe significant relationships

between predictors and outcomes. Potential predictors were gender, age, weight, height,

activity level, leg dominance, and order o f hop test performed. Outcomes were the

single-leg triple hop for distance, single-leg timed hop, and single-leg cross-over triple

hop for distance tests. Scatterplots, tests for significance (p-values), and goodness-of-fit

tests (R^) were used to determine relationships between predictors and outcomes.

Relation-ships were determined to be significant with p <0.05. Practical significance of

the proportion of the variation in the outcome was explained by the predictors during

regression analyses. If (R^) was close to 1.00 a good-fit resulted, but R^ closer to 0.00

reflected a poor fit. A good-fit reflected that, that predictor primarily determined

outcomes of the test.

Non-aggregated data were analyzed using descriptive statistics and linear regres­

sions with Type I Generalized Estimating Equations (GEE's). Descriptive statistics were

as for aggregated data. GEE's were used for regression analyses for correlated data.

Correlated data reflected that trials between individuals were considered as independent,

but repeated trials per individual were not. Parameter estimates and tests for significance

(p <0.05) were calculated with GEE's for the three functional tests.

GEE's used repeated measures from each trial per individual which provided extra

36

data that made the analysis more sensitive, for example, able to detect smaller relation­

ships between predictors and outcomes. The extra data reflected an effective sample size

that was used to determine working correlations between these variables. Working corre­

lations close to 1.00 or -1.00 indicated that trials per individual showed highly correlated

values. Each trial could be considered almost identical to the other and therefore would

not provide extra information necessary to detect small relationships between the data.

Values closer to 0.00 reflect that results per individual could be considered as if firom

separate individuals. Values closer to zero; therefore, reflect significant differences

between data to determine small relationships.

Pearson's Correlation Coefficient Test was used to determine interrater reliability

of the researchers in performing the data collection for the three functional hop tests.

Coefficients below 0.50 represented poor reliability, values 0.50-0.75 represented moder­

ate reliability, and values greater than 0.75 indicated good reliability.

CHAPTER 4

Results

Normative data from three unilateral lower extremity functional tests were

collected from 51 males and 45 females ranging in age from 18 to 30 years. See Table

4.1 for full demographic information.

Table 4.1: DEMOGRAPfflC SUMMARY

Variable Mean StandardDeviation

Ranges

Male(n=51)

Age (yrs.) 24.12 2.71 18-30Height (cm.) 180.30 6.62 165.1-190.5Weight (kg.) 83.72 11.60 63.63-121.43Activity Level 78.82 8.98 55-95

Female (n=45)

Age (yrs.) 23.40 2.36 18-28Height (cm.) 168.24 6.25 160-170.8Weight (kg.) 64.93 9.61 52.22-82.54Activity Level 80.44 10.43 65-95

Although twelve subjects did not participate in the flexibility and warm-up

protocols, they were included in the statistical analysis. Tables 4.2 through 4.4 show

descriptive statistics results using non-aggregated data from the single-leg triple hop for

distance, single-leg timed hop, and single-leg cross-over triple hop for distance. These

tables include results based upon gender, leg dominance, and order of functional test

performed. Means, standard deviations, as well as total number of results (n) with values

37

38

> 1 are included. Although each subject performed each hop test three times, not every

jump was counted due to subject violating the established jumping protocol ie; losing

balance, therefore, the values o f (n) are different for each category. Use o f the non­

dominant lower extremity usually resulted in the subject observationally jumping farther

distances than when using the dominant lower extremity. During the timed hop tests, use

of the non-dominant lower extremity usually resulted in observationally quicker times to

completion by approximately 0.02 seconds.

Tables 4.5 through 4.7 summarize the descriptive statistics of the three functional

hop tests mentioned above using aggregated data. Aggregated data is data that uses the

longest jump and the fastest time firom each test trial. The table includes results based

upon gender, leg dominance, and order of functional test performed. Means, standard

deviations, and total number of results are included. Again, results indicated that the

males tended to jump farther in distance than the females. Use of the non-dominant

lower extremity resulted in the subject jumping farther than when using the dominant

lower extremity during the single-leg cross-over triple hop for distance. Use o f the

dominant lower extremity during the single-leg triple hop for distance resulted in farther

distances than use of the non-dominant extremity, however. During the single-leg timed

hop, use of the dominant lower extremity resulted in faster time to completion o f the test.

39

Table 4.2: Summary of Descriptive Statistics of the S3H Test Using Non-aggregatedData.

Grouping Values S3H(cm) S3H(cm) S3Hmean std. dev. n

Total 428.36 92.77 417Gender Male 490.17 67.61 226

Female 355.23 59.22 191Dominance Dominant 425.62 91.35 205

Non-Dominant 431.02 94.25 212S3H Order First 432.89 103.88 184

Second 407.53 92.70 114Third 441.33 68.93 119

STH= Single- eg Triple Hop for Distance

Table 4.3: Summary of Descriptive Statistics of the STH Test Using Non-aggregated Data.Grouping Values STH(sec) STH(sec) STH

mean std. dev. nTotal 1.36 .28 629Gender Male 1.31 .27 353

Female 1.43 .28 276Dominance Dominant 1.34 .27 313

Non-Dominant 1.38 .29 316STH Order First 1.39 .30 204

Second 1.37 .22 219Third 1.34 .31 206

STH=Singleleg Timed Hop

40

Table 4.4: Summary of Descriptive Statistics of the SC3 Test UsingNon-aggregated Data.Grouping Values S3H(cm) S3H (cm) S3H

mean std. dev. nTotal 428.36 92.77 417

Gender Male 490.17 67.61 226Female 355.23 59.22 191

Dominance Dominant 425.62 91.35 205Non-Dominant 431.02 94.25 212

SC3 Order First 432.89 103.88 184Second 407.53 92.70 114Third 441.33 68.93 119

SC3= Single-leg Cross-over Triple Hop for Distance

Table 4.5: Summary of Descriptive Statistics of the S3H Test Using the Aggregated Data.

Grouping Values S3H (cm) S3H (cm) S3Hmean std. dev. n

Total 451.57 93.35 96Gender Male 502.11 68.99 51

Female 394.28 84.20 45Leg Dominance Dominant 450.06 92.87 85

Non-Dominant 463.22 100.89 11S3H Order First 457.02 104.58 39

Second 426.46 97.00 28Third 468.47 68.45 29

S3H= Single-leg ' riple Hop for Distance

41

Table 4.6: Summary of Descriptive Statistics of the STH Test Using theAggregated Data.

Grouping Values STH(sec) STH(see) STHmean std. dev. N

Total 1.55 .28 96Gender Male 1.50 .25 51

Female 1.61 .130 45Leg

DominanceDominant 1.55 .27 85

Non-Dominant 1.57 .32 11STH Order First 1.57 .32 32

Second 1.53 .23 29Third 1.56 .28 35

STH= Single-leg Timed Hop

Table 4.7: Summaiy of Descriptive Statistics of the SC3 Test Using the Aggregated Data.

Grouping Values SC3(cm) SC3(cm) SC3mean std. dev. n

Total 398.17 103.64 96Gender Male 459.07 78.19 51

Female 329.14 84.08 45Leg Dominance Dominant 400.55 99.48 85

Non-Dominant 379.77 135.96 11SC3 Order First 344.90 94.56 18

Second 403.61 99.56 39Third 417.31 105.78 39

SC3= Single-leg Cross-over Triple Hop for Distance

4 2

Tables 4.8 through 4.12 (see Appendix I) include scatterplot distributions which

show the pairwise relationships between independent (predictor) and dependent

(outcome) variables using aggregated data. In all the scatterplots, the three functional

tests were the dependent variables. In Tables 4.8 through 4.12 the independent variables

were as follows: age, weight, height, activity number, and leg dominance, respectively.

These tables suggest that there was not a significant relationship between the independent

and dependent variables. These findings were derived from the fact that there was a

random pattern in the plots rather than a definitive linear relationship. Also these plots

represent relationships between one predictor and one outcome at a time. Other

predictors could therefore influence the visual pattern and not represent a significant

relationship between the predictor and outcome analyzed.

Table 4.13 (see Appendix J) shows a scatterplot with the dependent variable being

the functional tests and the independent variable reflecting gender. This table shows a

significant relationship between gender and the three functional hop tests. This was the

only independent variable to show what appeared to be a significant relationship.

Table 4.14 reflects non-aggregated variable results from generating generalized

estimating equations (GEE 1) for predicting the actual distances and time of the three

functional tests. Using values from the intercept and gender variables, distances for the

single-leg triple hop and single-leg cross-over triple hop tests could be determined.

Values from the intercept, gender, and dominant or non-dominant leg variables could be

used to determine time for the single-leg timed hop tests.

43

The last 12 subjects in this study did not participate in the flexibility screen nor

warm-up protocol. A binary predictor variable was used to determine significant

variations in results between those last 12 subjects who did not follow the above

protocols to those that did. Values fiom the last 12 subjects had predicted times in the

single-leg timed hop test to be faster by 0.15 seconds compared to those that did

participate in these protocols.

Table 4.14: Variables for Generalized Estimated Equations (GEE 1) for Predicting Actual Distances and TimeOutcomes Predictors Param eter

Estimatesp-Values W orking

CorrelationsS3H Intercept 489.49 (cm) <0.0001 0.86

Gender -132.38 (cm) <0.0001STH Intercept 1.30 (sec) <0.0001 0.67

Gender 0.13 (sec) 0.0047Dominant/Non-Dominant 0.04 (sec) <0.0001

SC3 Intercept 440.65 (cm) <0.0001 0.67Gender -153.28 (cm) <0.0001

S3H= Single-leg Triple Hop for DistanceSTH= Single-leg Timed HopSC3= Single-leg Cross-over Triple Hop for Distance

Table 4.15 reflects aggregated variables from regressions for generating equations

to predict maximal distance values for the single-leg triple hop and single-leg cross-over

triple hop functional tests. No significant predictors were found to predict m inim al times

for the single-leg timed hop. The results indicated gender and activity level to be signifi­

cant predictors in determining the outcome of the single-leg triple hop functional test

(p<.0001 and p<.0102, respectively). For the single-leg cross-over triple hop functional

test only gender was a significant predictor of outcome at p<.0001. Using an equation

including gender and activity level values, it could be predicted what an individual could

44

jump in the single-leg triple hop for distance test. Using gender values, maximal

distances for the single-leg cross-over hop test could be predicted. Goodness-of-fit was

=.38 for the single-leg triple hop and R^=.40 for the single-leg cross-over triple hop

functional test which indicated a poor fit. This meant the regression only explained 38%

and 40% of the variability in the single-leg triple hop and single-leg crossover triple hop

for distance tests, respectively. These results suggested that other important factors were

involved. Also, age, height, weight, and leg order were examined, but were not found to

be statistically significant predictors for outcome.

Table 4.16 shows p-values and working correlations for the prediction variables

used to predict distances and time values for the three functional tests. The p-values of

<0.05 were chosen to reflect significant results. The working correlation represents

correlations between each test trial for all data collected. The values closer to 0.00 reflect

smaller relationships indicating more significant correlations between the variables.

Table 4.15: Variables for Multiple Regression Analysis Equations for Predicting Maximal Distances and Minimal TimeOutcomes Predictors Parameter Estimates p-Values

S3H Constant 338.79 (cm) 0.38Gender -111.19 (cm) <0.0001

Activity Level 2.07 (cm) <0.0102STH No significant PredictorsSC3 Constant 459.07 (cm) 0.40

Gender -129.93 (cm) <0.0001S3H= Single-leg Triple Hop for Distance STH= Single-leg Timed Hop SC3= Single-leg Crossover Triple Hop

45

Table 4.16: p-Values and Working Correlations for Predictor Variables Used to Develop the GEEl Equations for Actual Distances and TimeOutcome Predictor p-Value Working CorrelationS3H Intercept <.0001 0.86

Gender <.0001STH Intercept <.0001 0.67

Gender <0047Leg Dominance <0001

SC3 Intercept <0001 0.67Gender <0001

S3H= Single-leg Triple Hop for DistanceSTH= Single-leg Timed HopSC3= Single-leg Cross-over Triple Hop for Distance

Table 4.17 shows intertester test reliability for the single-leg triple hop for

distance, single-leg timed hop, and single-leg cross-over triple hop for distance.

Reliability is shown for leg dominance for each of the three functional hop tests.

Table 4.17: Intertester Test Reliability for the Three Functional Hop TestsFunctional Test Leg Dominance Reliability

S3H Dominant .99Non-Dominant .99

STH Dominant .69Non-Dominant .92

SC3 Dominant .99Non-Dominant .99

S3H= Single-leg triple Hop for Distance STH= Single-leg Timed Hop SC3= Single-leg Cross-over Triple Hop for Distance

CHAPTERS

DISCUSSION AND CONCLUSIONS

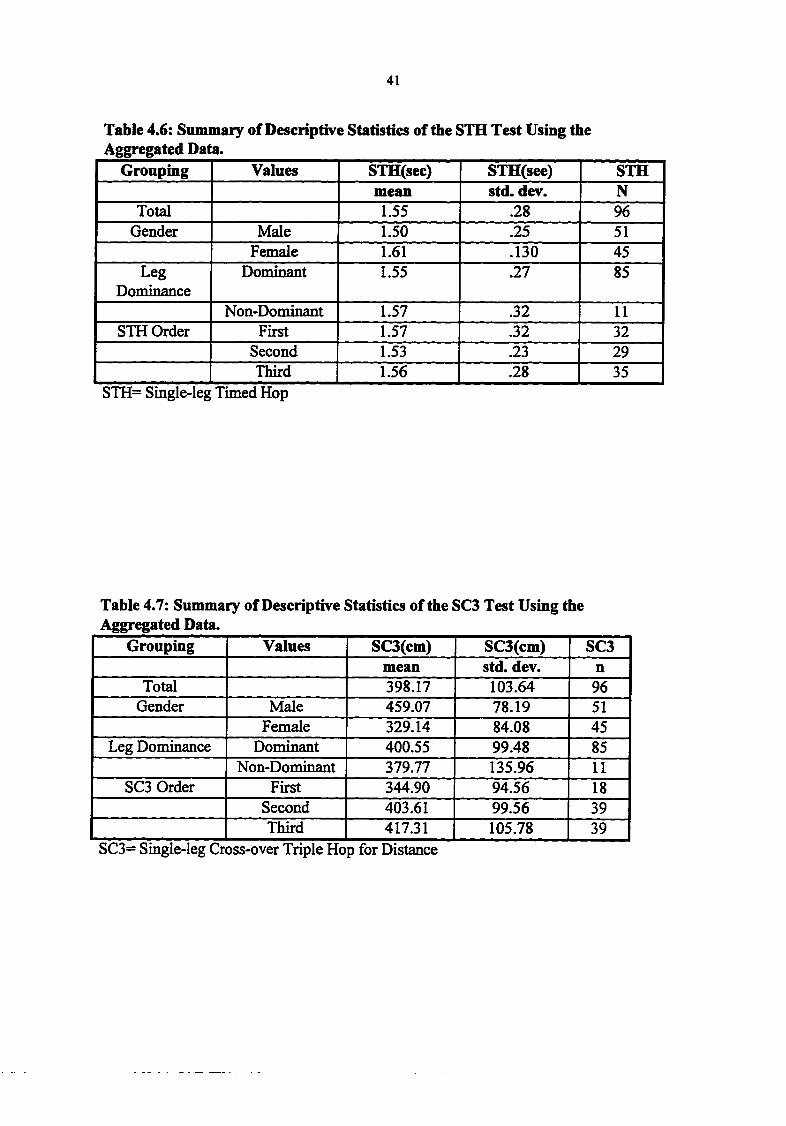
Based on the descriptive statistics, males jumped farther than the females in both

the single-leg triple hop and single-leg cross-over triple hop for distance tests. Males also

had faster times than the females in the single-leg timed hop tests. In looking at leg

dominance using the non-aggregated data, use of the non-dominant lower extremity

reflected observationally farther distances than the dominant lower extremity during the

single-leg triple hop for distance tests. All the above values, however, were not statisti­

cally significant. Differences in results were seen during analysis o f leg dominance use

during the single-leg cross-over triple hop for distance and the single-leg timed hop.

Aggregated results, however, indicated that use o f the dominant lower extremity resulted

in observationally farther distances and faster times than use o f the non-dominant

extremity. These values, again, were not found to be statistically significant.

From our observations, the third test trial usually produced the greatest distance

for the single-leg triple hop and single-leg cross-over triple hop for distance using both

the non-aggregated and aggregated data. The fastest times were also seen on the third test

trial o f the single-leg timed hop when using non-aggregated data. The results mentioned

above were not found to be statistically significant. These results could be due to the

learning effect, which allowed the subject to become more familiar and confident with the

46

4 7

test as the trials progressed. Taking the values firom the variables in using non-

aggregated data, equations could be developed to predict the actual distances and times

for the three functional hop tests. These equations are as follows:

(1) Single-leg triple hop for distance= 489.49 cm + (-132.38 cm)(gender).(2) Single-leg timed hop= 1.30 sec + (0.13 sec)(gender) + (0.04 sec)(dom/nondom

leg) + (-.15)(protocol/nonprotocol).(3) Single-leg cross-over triple hop for distance= 440.65 cm + (-153.28 cm) x

(gender)*Gender= 0 for males and 1 for females. Dominant= 0 and non-dominant= 1. Protocol= 0 and nonprotocol=l.

The following table represents approximate distances and times using the non-aggregated

equations:

Single-leg Triple Hop for DistanceMales Females

489.49 cm 357.11 cm

Single -leg Timed HopMales Females

Protocol: 1.30 sec (Dominant Leg)

1.34 sec (Non-dominant Leg)

Protocol: 1.43 sec (Dominant Leg)

1.47 sec (Non-Dominant Leg)

Non-Protocol: 1.15 sec (Dominant Leg)

1.19 sec (Non-Dominant Leg)

Protocol: 1.28 sec (Dominant Leg)

1.32 sec (Non-Dominant Leg)

Single-leg Cross-over Triple Hop for DistanceMales Females

440.65 cm 287.37 cm

4 7

48

Taking the values from the variables in table 4.15, equations could be developed

to predict the maximal distances for the single-leg triple bop for distance and single-leg

cross-over triple bop for distance tests. These equations are as follows:

(1) Single-leg triple bop for distance= (338.79 cm) + (-111.19cm)(gender) +(2.07cm)(activity level)

(2) Single-leg timed bop= No equation due to no significant predictors found.(3) Single-leg cross-over triple hop for distance= (459.07 cm) + (-129.93 cm

(gender).*Gender= 0 for males and 1 for females. Activity level= 55-100)

These tables below reflect the maximal distance values using the aggregated equations;

Single-leg Triple Hop for DistanceMales FemalesActivity Level: 100 = 545.79 cm Activity Level: 100 = 434.60 cm

95 = 535.44 cm 95 = 424.25 cm90 = 525.09 cm 90 = 413.90 cm85 = 514.74 cm 85 =403.55 cm80 = 504.39 cm 80 = 393.20 cm75 = 494.04 cm 75 = 382.85 cm65 =473.34 cm 65 = 362.15 cm60 = 462.99 cm 60 = 351.80 cm55 = 452.64 cm 55 = 341.45 cm40 = 421.59 cm 40 = 310.40 cm20 = 380.19 cm 20 = 269.00 cm

0 = 338.79 cm 0 = 227.60 cm

Single-leg Cross-over Triple Hop for DistanceMale Female

459.07 cm 329.77 cm

In the single-leg triple bop and single-leg cross-over triple bop for distance tests,

gender was the only significant variable in predicting actual distances (p<0.0001). In the

48

49

single-leg timed hop test, gender and use of dominant or non-dominant leg were signifi­

cant variables in predicting actual times for the protocol and nonprotocol groups

(p=0.0047 andp<0.0001, respectively).

GEE’s used repeated measures fiom each trial per individual which provided extra

data that made the analysis more sensitive to detect smaller relationships between predic­

tors and outcomes. Values closer to 0.00 reflect that results per individual could be

considered as though they were taken fiom separate individuals. Values closer to zero,

therefore, reflect significant differences between data to determine small relationships. In

the single-leg triple hop for distance, the working correlation was 0.86, which meant that

each test trial could be considered almost identical to the other and therefore would not

provide extra information necessary to detect small relationships between the data. For

the single-leg timed hop and single-leg cross-over triple hop for distance tests, the

working correlation was 0.67. These values were closer to zero, which indicated that it

could be possible to detect significant differences between potential predictors and the

STH and SC3 tests to show small relationships.

Gender and activity level were determined to be the significant variables in deter­

mining maximal distances for the single-leg triple hop test (p<0.0001 and p<0.0102, res­

pectively). Gender was the only predictor for the single-leg cross-over triple hop for dis­

tance test (p<0.0001). It makes sense that males would jump farther distances than

females. Those with increased activity levels may also be more aerobically and

anaerobically fit leading to increased distances.

Correlation coefficients to determine interrater reliability for data collection

49

50

revealed values of 0.99 for the single-leg triple hop and single-leg cross-over triple hop

for distance tests for all three authors. Values for data collection during the single-leg

timed hop differed for dominant and non-dominant LE and between the two authors

responsible for this data collection. During collection o f dominant LE data, the

correlation coefBcient between the two authors was 0.69. A correlation coefficient of

0.92 was found between the two authors when collecting data during use o f the non-

dominant lower extremity.

These correlation coefficients reflect that data collection among the three authors

were very comparable and reliable for the single-leg triple hop and single-leg cross-over

triple hop for distance tests. Values for the coefficients were lower for the single-leg

timed hop test due to the fact that data contained smaller numbers than the distance tests.

More emphasis was placed on tenths or hundredths o f a number. Therefore, even small

differences between data values reflected great changes. Due to this fact, even the lower

correlation coefficients found with the single-leg timed hop tests show good reliability

between the two authors. Also, correlation coefficients were lower because the amount of

human reaction time of the authors at the beginning and end of each jump and subtle

mechanical defects of the stopwatch could not be controlled.

Clinical Significance

Clinicians could use the functional hop tests performed in this study because they

have been proven valid and reliable (Bandy et al., 1994; Barber et al., 1990; Booher et al.,

1993; Noyes et al., 1991; Wilkes et al., 1994). These tests also contain a combination of

OKC and CKC motions to better simulate many functional activities. Based on the

50

51

results o f this study, depending on the person’s gender and activity level, a person within

the ages o f 18-30 should be able to jump similar distances or times as determined using

the estimated equations regardless o f his/her height, weight, and order o f tests performed.

Clinicians could use the equations developed in this study to predict distances and

times that a person between the ages o f 18-30 could perform with these functional hop

tests. The equations developed using the non-aggregated data would most likely

represent true distances and times that the patients would be able to perform. The only

variables needed to complete these equations would be the knowledge of a person’s

gender and if the dominant or non-dominant LE was used. It is important to remember,

however, these tests reflect values o f normal subjects between the ages o f 18-30, and

clinicians might see a difference in values with injured persons.

Implication for Future Research

Further research on gaining normative data for the single-leg triple hop for

distance, single-leg timed hop, and single-leg cross-over triple hop for distance tests is

still needed because this was the first study to look at gaining normative values for these

three tests. The authors recommend using these three functional hop tests with a larger

sample size and age range. With a larger sample size, additional small, significant

relationships between potential predictors and outcomes would be more easily detected.

Also, including subjects from a multi-cultural background, varied activity levels, and age

ranges would make the results from this study more generalizable to the public at large.

Research using these functional hop tests with injured subjects is also needed as

these test are assumed to reflect their functional progression with therapy. Future re­

51

52

search should also include more sensitive methods to reflect the subject’s activity level

and leg dominance. This knowledge may then have more implications when comparing

outcomes o f the three tests. More reproducible and reliable set-up methods to more

accurately assess the results of the three functional hop tests needs to be included in

future research. Also, if there is a proven method to measure leg length, this would be a

valuable asset to include in the next research paper. Although height was not found to be

a predictor for outcomes, leg length differences may be.

Future research should also look at comparing subjects who go through a warm­

up session and those that do not with these three functional hop tests. These authors

suggest this idea as a significant difference was noted between those that had the warm­

up and those who did not in the STH test. Also, future researchers should look at whether

the number o f test trials is significant with these three tests. It was unknown to these

authors whether or not the results and equations would have been altered if subjects were

allowed unlimited number of trials in order to have three trials meet requirements to be

used for analysis. Some subjects in this study were not able to complete acceptable

jumps on one to three o f the three allowed test trials and this may have impacted the

results.

Limitations

There were several limitations to this study. The authors did not obtain 150

subjects secondary to lack of subjects willingness to participate and time constraints. The

total number of subjects that participated in the study was 96. By obtaining a larger sam­

ple, the authors may have seen more significant relationships between the independent

52

53

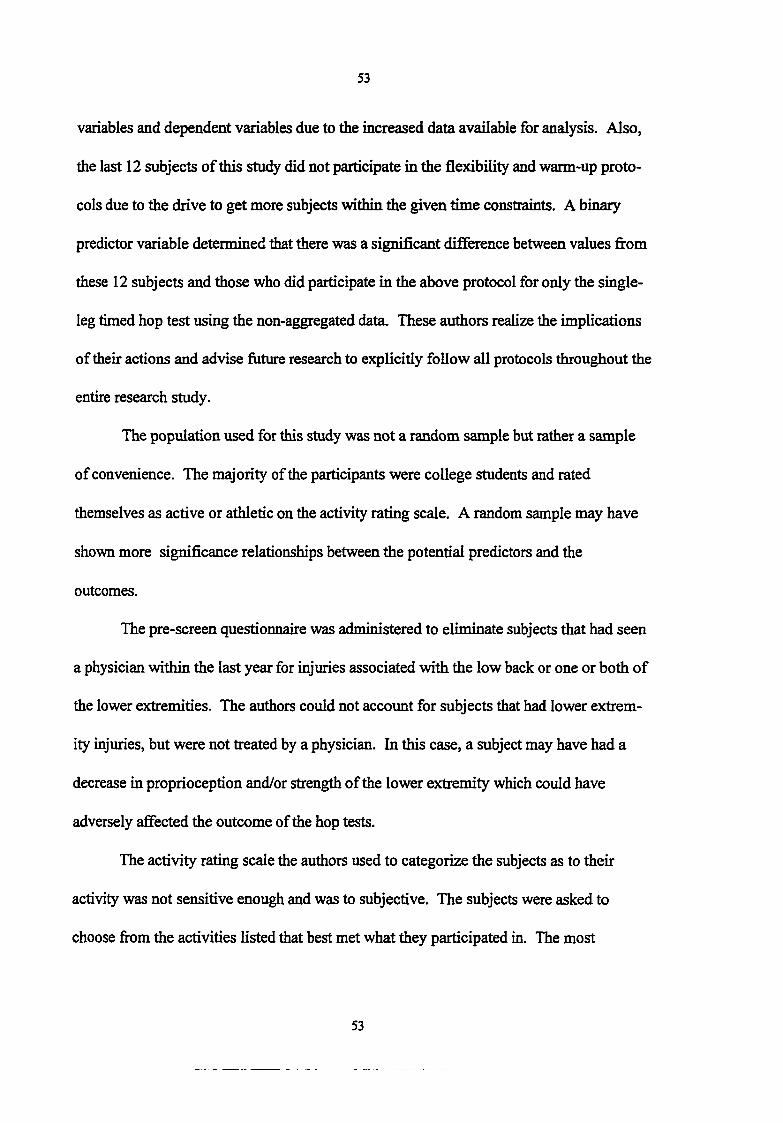
variables and dependent variables due to the increased data available for analysis. Also,

the last 12 subjects o f this study did not participate in the flexibility and warm-up proto­

cols due to the drive to get more subjects within the given time constraints. A binary

predictor variable determined that there was a significant difference between values firom

these 12 subjects and those who did participate in the above protocol for only the single­

leg timed hop test using the non-aggregated data. These authors realize the implications

of their actions and advise future research to explicitly follow all protocols throughout the

entire research study.

The population used for this study was not a random sample but rather a sample

of convenience. The majority of the participants were college students and rated

themselves as active or athletic on the activity rating scale. A random sample may have

shown more significance relationships between the potential predictors and the

outcomes.

The pre-screen questionnaire was administered to eliminate subjects that had seen

a physician within the last year for injuries associated with the low back or one or both of

the lower extremities. The authors could not account for subjects that had lower extrem­

ity injuries, but were not treated by a physician. In this case, a subject may have had a

decrease in proprioception and/or strength of the lower extremity which could have

adversely affected the outcome of the hop tests.

The activity rating scale the authors used to categorize the subjects as to their

activity was not sensitive enough and was to subjective. The subjects were asked to

choose firom the activities listed that best met what they participated in. The most

53

54

common problem that occurred with this was that the subjects had a difficult time

choosing their sport or work activity from the activities listed on the scale. For example,

many subjects participated in a form of weight training, but this was not one of the

activities listed on the activity rating scale. An activity rating scale that was more reliable

and valid would have been more valuable to identify a person’s activity level and thus a

better prediction of the subjects performance on the hop tests.

The measuring tape set-up used to measure the distances jumped was not as

accurate as the authors would have liked. Each time a group o f subjects were tested the

experimental test design had to be reconstructed. This included measuring and marking

off ten feet to perform the timed test, laying down the 15 centimeter strip which is used

for the cross-over triple hop, and laying down three sets o f tape measures in order to

reach the required 18 meter distance to record the distances jumped. An error could have

occurred while laying down the three measuring tapes each time as well as the strip used

to jump over if they were not laid down exactly the same each time. A better solution

would have been to use a strip that had distances pre-measured that could have been

rolled out or unfolded each time to ensure reliability and validity.

Measurement methods for measuring the outcome o f the single-leg timed hop

were also fotmd to be a limitation of this study. Errors in measuring could have occurred

at both the initiation and end of the jumping sequence. Errors included the vantage point

o f the testers when determining when the toe crossed the starting line and when the heel

crossed the finish line. An author standing behind or in front of the starting line or finish

line may not be as accurate when measuring the times as someone standing on the

54

55

respective lines. An error o f one-tenth does not seem to be that significant, but in this

times measured to the one-hundredths were used and that one-tenth becomes very

significant The best method for recording the outcomes of the single-leg timed hop may

be using lasers at both the start and finish lines. This method would be more accurate and

eliminate the inherent errors that may occur using manual method, such as stop watches

as the authors used.

Conclusion

The purpose of this study was to gather normative values for three unilateral

lower extremity functional tests: single-leg triple hop for distance, single-leg timed hop,

and single-leg cross-over triple hop for distance, in a normal population between the ages

of 18-30. The results indicated that individuals between the ages o f 18-30 will have

similar results regardless of height, weight, and the order of the tests performed.

Knowledge of a person’s gender, activity level, dominant/non-dominant leg could be

used in regression equations developed in this study to predict distances and times for the

three functional hop tests.

55

REFERENCES

Andrews, A.W., Bohannon, R.W., & Thomas, M.W. (1996). Normative values for isometric muscle force measurements obtained with hand-held dynamometers. Phys Ther. 76, (3), 248-259.

Andriacchi, T., & Birac, D. (1993). Functional testing in the ACL-deficient knee.Clin Ortho. 288. 37-42.

Arnold, B.L., Perrin, D.H., & Hell wig, E.V. (1993). The reliability of three isokinetic knee-extension angle-specific torques. Journal of Athletic Training. 28. (3), 227-228.

Bandy, W.D., Rusche, K.R., & Tekulve, F.Y. (1994). Reliability and limb symmetry for five unilateral functional tests o f the lower extremity. Isokinetics and Exercise Science. 4. f3T 108-111.

Barber, S.D., Noyes, F.R., Mangine, R.E., McCloskey, & Hartman, W. (1990). Quantitative assessment of functional limitations in normal and anterior cruciate ligament-deficient knees. Clin Ortho. 255 .204-214.

Bernstein Lewis, C. (1996). Aging the health care challenge. (3rd ed.). Philadelphia: F.A. Davis Company.

Booher, L.D., Hench, K.M., Worrell, T.W., & Stikeleather, J. (1993). Reliability of three functional hop tests. J Sports Rehab. 2. 165-170.

Brashear, Jr., H.R., Raney, Sr., R.B. (1986). Handbook of orthopaedic surgery.(10th ed.). St. Louis: The C.V. Mosby Company.

Brinkes, K., DeLong, R., & Stout, T. (1995). The relationship among isokinetic knee parameters and three functional tests. Unpublished master's thesis, Grand Valley State University.

Bunton, E.E., Pitney, W.A., Kane, A.W., & Cappaert, T.A. (1993). The role of limb torque, muscle action and proprioception during closed kinetic chain rehabilitation of the lower extremity. Journal of Athletic Training. 28. 10-19.

Fu, F.H., Woo, S.L-Y., & Irrgang, J.J. (1992). Current concepts for rehabilitation following anterior cruciate ligament reconstruction. J Orthop Sports Phvs Ther. 15. (6), 270-278.

Graham, V. L., Gehlsen, G.M., & Edwards, J.A. (1993). Electromyographic evaluation of closed and open kinetic chain knee rehabilitation exercises. Journal of Athletic Training. 28. (1), 23-30.

56

57

Hu, H.S., Whitney, S.L., Irrgang, J., & Janosky, J. (1992, January). Test-retest reliability o f the one-legged vertical jump test and one-legged standing hop test. J Orthop Sports Phys Thgr..l5.51.

Jette, A.M., (1993). Using health-related quality of life measures in physical therapy outcomes research. Phys Ther. 75. (8), 528-537.

Jette, A.M. (1995). Outcomes research: Shifting the dominant research paradigm in physical therapy. Phys Ther. 75. (11), 965-970.

Kaltenbom, F. M. (1993). The spine: Basic evaluation and mobilization techniques. (2nd ed.). Minneapolis, MN: OPTP.

Kendall, P.P., McCreary, E., & Provance, P.O. (1993). Muscles testing and function. Philadelphia: Williams & Wilkins.

Kisner, C., & Colby, L.A. (1990). Therapeutic exercise: Foundations and techniques (2nd ed.). Philadelphia.: F.A. Davis.

Lephart, S.M., Perrin, D.H., Fu, F.H., Gieck, J.H., McCue, F.C., & Irrgang, J. J.(1992). Relationship between selected physical characteristics and functional capacity in the anterior cruciate ligament-insufBcient athlete. J Orthop Sports Phys Ther. 16. (4), 174-181.

Levangie, P.K., & Norkin, C.C. (1992). Joint structure and function: A comprehensive analysis (2nd ed.). Philadelphia: F.A. Davis.

Magnusson, S.P., Geismar, R.A., Gleim, G.W., & Nicholas, J.A. (1993). The effect of stabilization of isokinetic knee extension and flexion torque production. Journal of Athletic Training. 28. (3), 221-224.

McCleary, R.W., & Andersen. J.C. (1992). Test-retest reliability o f reciprocal isokinetic knee extension and flexion peak torque measurements. Journal o f Athletic Training. 27. (4), 363-364.

Noyes F.R. Barber, S.D., & Mangine, R.E. (1991). Abnormal lower limb symmetry determined by function hop tests after anterior cruciate ligament rupture. Am J Sports M edaS , (5), 513-518.

Noyes, F.R., Barber, S.D., Mooar, L.A. (1989). A rationale for assessing sports activity levels and limitations in knee disorders. Clin Ortho. 246.240-249.

Noyes, F.R., Mooar, L.A., Barber, S.D. (1991). The assessment of work-related activities and limitations in knee disorders. Am J Sports Med. 19. (2), 178-190.

58

Oberg, B., Oberg, T., & Oberg, U. (1994, September). Validity and Reliability of a new assessment of lower-extremity dysfunction. Phys Ther. 74. (9), 861-870.

Perrin, D.H. (1986). Reliability o f isokinetic measures. Athletic Training. 21. (4), 319-322.

Portney, L.G., & Watkins, M.P. (1993). Foundations o f clinical research: Applica­tions to practice. Norwalk: Appleton & Lange.

Reilly, T., Atkinson, G., & Coldwells, A. (1991). Isokinetic strength and standing broad jump performance. Perceptual and Motor Skills. 72. 1346.

Risberg, M.A. & Ekeland, A. (1994, April). Assessment of functional tests after anterior cruciate ligament surgery. J Orthop Sports Phvs Ther. 19. (4), 212-216.

Tegener, Y., & Lysholm, J. (1985, September). Rating systems in the evaluation of knee ligament injuries. Clin Ortho. 198.43-49.

Tegner, Y., Lysholm, J., Lysholm, M., & Gillquist, J. (1986). A performance test to monitor rehabilitation and evaluate anterior cruciate ligament injuries. Am J Sports Med. 14, (2), 156-159.

Wilk, K.E., & Andrews, J.R. (1992). Current concepts in the treatment of anterior cruciate ligament disruption. J Orthop Sports Phys Ther. 15. (6), 279-292.

Wilk, K.E., Escamilla, R.F., Flesig, G.S., Arrigo, C.A., & Barrentine, S.W. (1995). Open and closed kinetic chain exercise for the lower extremity: Theory and clinical application. Athletic Training: Sports Health Care Perspectives. 1. (4), 336-346.

Wilk, K.E., Romaniello, W.T., Soscia, S.M., Arrigo, C.A., Andrews, J.R. (1994, August). The relationship between subjective knees scores, isokinetic testing, and functional testing in the ACL-reconstructed knee. J Orthop Sports Phys Ther. 20. (2), 60- 70.

APPENDIX ATitle of StudyDeveloping Normative Data For Three Unilateral Lower Extremity Functional Tests

InvestigatorsThe investigators of this study are Grand Valley State University Masters of Physical Therapy students Brian Fulton, Kathleen Hegyan and Troy Wieling. This research study is being carried out under the advisement of Jolene Bennett, M.A., P.T., DCS, A.T.C., Gordon Alderink, M.S., P.T. and Timothy Lesnick, M.Sc. This study will be performed at Grand Valley State University, surrounding local western Michigan colleges, and Lakeshore Athletic Club in Holland, Michigan. This study will include a total of 150 male and female subjects.

Purpose of StudyThe purpose o f this study is to gather normative values for three unilateral lower extremity functional tests: single-leg triple hop for distance, single-leg timed hop and single-leg cross-over triple hop, in a normal population. The results gained in this study will help rehabilitation experts and physicians more accurately assess lower extremity functional performance.

Study ProceduresIf you agree to participate in this study, you will be asked to complete a pre-test questionnaire that includes items regarding medical history, present activity level, age, weight, height and gender. You will be screened to assess muscle tightness and range o f motion in the hip flexors, quadriceps, hamstrings, gastrocnemius and soleus muscle groups. Criteria that excludes you from this study include the following: 1.) Any previous surgeries of the back, hip, knee, ankle or foot; 2.) Injuries requiring care by a physician within the last year o f the back, hip, knee, ankle or foot; 3.) Less than 80° of knee flexion evaluated using the Thomas Test position; 4.) A SLR Test of less than 65°.5.) Less than 10° o f dorsiflexion with the knee extended; 6.) Less than 10° of dorsiflexion with the knee bent to 90°; 7.) If currently participating in intercollegiate sports; 8.) Any pathology involving muscles, bones, nervous system. For example, multiple sclerosis, parkinsons disease, cancer, CVA, or rheumatic diseases; 9.) Current pregnancy; and 10.) Given birth within the last six months.

Volunteers will randomly be placed into one of two groups. The first group consists o f subjects using their dominant leg first to perform the tests. The second group consists o f subjects using their nondominant leg first to perform the tests. The order will be assigned by having the subject pick a labelled strip of paper from a hat. Each subject will perform three unilateral functional tests on each leg: single-leg triple hop for distance, single-leg timed hop and single-leg cross-over triple hop for distance. The order the tests will be performed in will be randomized by the subject picking labelled strips of paper from a hat. The best score out of the three attempts on each leg will be used for data analysis.

59

60

A warm-up session prior to the tests will include five minutes o f low resistance cycling on a stationary bike followed by 30 second self-stretches to the hip flexor, quadriceps, hamstring, gastrocnemius and soleus muscles of each leg. Two practice attempts followed by three test repetitions will be performed for each of the three functional tests.

DurationEach research session will take one hour to complete.

BenefitsThe warm-up session and performance of these unilateral functional tests are a one time event and no increase in strength or functional ability should be anticipated by agreeing to participate in this study.

RisksIt is not anticipated that this study will lead to any physical injury and every attempt will be made to insure the safety of the subjects. This includes implementing the following precautions:

1. Pregnant women should not participate in this study.2. You may experience soreness after the tests, but this is a normal response after

physical activity.3. The environment will be free of any hazards that may cause a fall.

PrivacyThe information gained during this study will be kept strictly confidential. You will be assigned an identification number for privacy. Your name will never be used throughout the study. If this study is published in a scientific journal, no names will be used.

V oluntary P artic ipa tionParticipation in this study is strictly voluntary and you may withdraw from the study at any time.

C ontacts/Q uestionsIf you have any questions about the procedures involved in this research study or would like a summary o f the results, feel firee to contact the researchers listed below.

NAME Brian Fulton, Kathleen Hegyan, or Troy WielingADDRESS 1 Campus Dr.

GVSU Physical Therapy Department Allendale, MI 49401

TELEPHONE# (616) 895-3356

If you have any questions concerning your rights as a subject in this study, feel free to contact the person listed below:

61

NAME

ADDRESS

TELEPHONE#

Professor Paul HuizengaChair o f Human Subjects Review Committee1 Campus Dr.GVSUAllendale, MI 49401 (616) 895-2472

Inform ed C onsent"As a subject, I acknowledge that I have read and understand the above information. In my judgment, there was sufficient access to information, including risks and testing procedures, to make an informed decision."

D A T E S U B J E C T S N A M E

D A T E W I T N E S S ’ N A M E

( S I G N A T U R E )

( P R I N T )

( S I G N A T U R E )

( P R I N T )

APPENDIX B

PRESCREEN QUESTIONNAIRE

Identification #:

I. GENERAL INFORMATION:

AGE:_______ WEIGHT:_SEX: HEIGHT:

II. MEDICAL HISTORY:Please circle "Y" for yes and "N " for no for all areas that apply.

• Have you had any of the following injuries that required treatm ent by a physicianwithin the past year? (First Column)

• Have you ever had any of the following conditions that required treatm ent by aphysician? (Second Column)

Back injury: Y/ N Cardiac condition: Y/ NHip injury: Y/ N Pulmonary condition: Y/ NKnee injury: Y/ N Neuromuscular condition (i.e.:MS): Y/ NAnkle injury: Y/ N Rheumatic condition (i.e.:Arthritis): Y/ NFoot injury: Y/ N

Have you ever had any surgeries on the following?

Back surgery: Y/ N Hip surgery: Y/ NKnee surgery: Y/ N Ankle surgery: Y/ NFoot surgery: Y/ N

Do you have any other medical conditions that you feel will limit your ability to participate in this study?Y/ N (If "Y", please explain.)_____________________________________________

Are you currently taking any medication? Y/ NIf "Y", please list all (Over the counter and Prescription):

62

63

Are you pregnant? Y/ NHave you given birth within the last six months? Y/ N

III. CURRENT ACTIVITY LEVEI.:

Are you currently participating in intercollegiate sports? Y/ N

W hat point value would you rate your current activity level based upon the Sports Activity Rating Scale categories?_______ (See Appendix C)

IV. LEG DOMINANCE:

Leg dominance: RIGHT LEFTThe dominant leg will be circled.A ball will be set in front o f you. The researcher will say, "kick the ball to me."
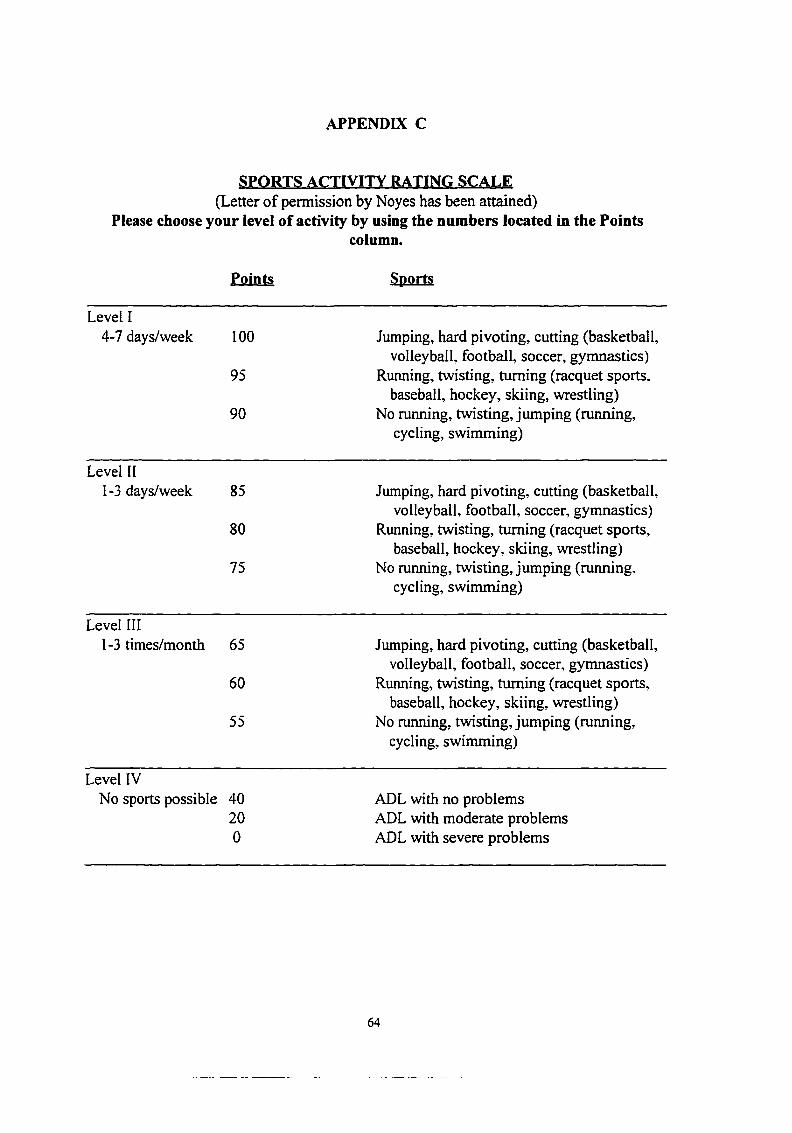
APPENDIX C

S P O R T S A C TIV ITY RA TIN G S C A L E (Letter o f permission by Noyes has been attained)

Please choose your level of activity by using the numbers located in the Pointscolumn.

Points Sports

Level I4-7 days/week 100 Jumping, hard pivoting, cutting (basketball,

volleyball, football, soccer, gymnastics)95 Running, twisting, turning (racquet sports,

baseball, hockey, skiing, wrestling)90 No running, twisting, jumping (running,

cycling, swimming)

Level II1-3 days/week 85 Jumping, hard pivoting, cutting (basketball,

volleyball, football, soccer, gymnastics)80 Running, twisting, turning (racquet sports,

baseball, hockey, skiing, wrestling)75 No running, twisting. Jumping (running,

cycling, swimming)

Level III1-3 times/month 65 Jumping, hard pivoting, cutting (basketball,

volleyball, football, soccer, gymnastics)60 Running, twisting, turning (racquet sports,

baseball, hockey, skiing, wrestling)55 No running, twisting, jinnping (running,

cycling, swimming)

Level IVNo sports possible 40 ADL with no problems

20 ADL with moderate problems0 ADL with severe problems

64

APPENDIX D

PRETEST FLEXIBILITY SCREEN

Identification #: EXAMINER:

Date:

GENERAL INFORMATION:

AGE; HEIGHT: cm.

LEG LENGTH: WEIGHT: lbs.RIGHT (R): _______ cm.LEFT (L): _______ cm.

FLEXIBTITTY T E ST IN G :

HIP/KNEE/ANKLEThomas Test (Hip Flexor and Quadriceps muscles):

R LEG— Subject can attain Thomas Test Position: Y NThomas Test Position with knee flexed: <80° >80'L LEG—Subject can attain Thomas Test Position: Y NThomas Test Position with knee flexed: <80° >80'

Straight Leg Raise (Hamstrings): R LEG— <65° >65°L LEG- <65° >65°

Gastrocnemius/Soleus:R LEG— Dorsiflexion with knee extended: <10° >10°

Dorsiflexion with knee flexed to 90°: <10° >10°L LEG— Dorsiflexion with knee extended: <10° >10°

Dorsiflexion with knee flexed to 90°: <10° >10°

65

APPENDIX E

SUBJECT EXCLUSION CRITERIA

1. Any previous surgeries o f the back, hip, knee, ankle or foot.

2. Injuries requiring care by a physician within the last year o f the back,

hip, knee, ankle or foot.

3. Less than 80° of knee flexion evaluated using the Thomas Test position.

4. A Straight Leg Raise Test o f less than 65°.

5. Less than 10° of dorsiflexion with the knee extended.

6. Less than 10° of dorsiflexion with the knee flexed to 90°.

7. If currently participating in intercollegiate sports.

8. Any pathology involving muscle, bone, nervous system. For example,

multiple sclerosis, parkinson's, cancer, CVA, or rheumatic diseases.

9. Current pregnancy.

10. Given birth within the last six months.

66

APPENDIX F

Warm-up Standard Protocol:

The purposes o f stretching and riding the stationary bike during the warm-up session includes increasing the general flexibility of your lower extremities, and to prevent or minimize the risk o f musculotendinous injuries that may be related to performing the three types of unilateral hop tests included in this study.

The warm-up session will start with five minutes o f low resistance cycling on a stationary bike at a rate o f 20 revolutions per minute.

After you are done cycling, you will participate in self-stretching activities. The researcher will first read the following steps involved in stretching the muscle group, demonstrate the steps, and the read the steps again. The subjects will then perform self­stretches to the hip flexors, hamstrings, quadriceps, gastrocnemius, and soleus muscle groups. Any questions the subjects have during this session will be answered by the researcher. These stretches were taken from Therapeutic Exercise: Foundations and Techniques by Kisner and Colby.

STRETCHES:HIP FLEXOR STRETCH:To stretch the muscles in the front portion of your hip, assume a fencer’s squatlike post­ure.

1. Bring one leg behind you and keep your toes pointing forwards.2. Bring your other leg out in front of your body and bend your knee

while keeping your front foot flat on the floor.3. Shift your weight onto the front leg.4. A stretching sensation should be felt in the front part of your hip of the

back leg.5. Hold this position while you slowly count to 30.6. Slowly shift your weight off the front leg and come up to an erect

standing posture.7. Switch legs and repeat the steps one time.

6 7

68

QUADRICEPS STRETCH:To stretch your front thigh muscles, sit on the floor.

1. Bring one leg straight out in front of you.2. Bend your other knee, and grab your ankle with your hand.3. Bring the foot of the bent leg towards your bottom until you start to

feel a stretching sensation.4. Release your ankle and lean towards the opposite side and rest your

weight on your elbow.5. Hold this position while you slowly count to 30.6. Slowly sit up and straighten your bent leg.7. Switch legs and repeat the steps one time.

HAMSTRINGS STRETCH:To stretch the muscles in the back of the thigh, sit in one of the chairs that are provided for you.

1. Bring one leg up and rest it on the chair that is in front of you.2. Keep your other foot flat on the floor.3. Lean your trunk towards the leg on the chair while keeping your back

straight until you start to feel a stretching sensation in the back of that thigh.

4. Hold that position while you slowly count to 30.5. Slowly sit up straight. If a stretch is still felt, you can take your leg off

the chair and put your foot on the floor.6. Switch legs and repeat the steps one time.

GASTROCNEMIUS STRETCH:To stretch the big calf muscles, stand with arms outstretched at shoulder level so your hands are flat against a wall. Place your feet shoulder width apart.

1. Keep your knees straight and heels on the floor.2. Lean towards the wall, allowing your elbows to bend.3. Stop moving forward when you start to feel a stretching sensation in

the calf muscles.4. Hold this position while you slowly count to 30.5. Slowly return to standing upright.6. Repeat steps one through five one time.

69

SOLEUS STRETCH:To stretch the smaller calf muscles, again stand with your arms outstretched at shoulder level with hands flat against a wall. Place your feet shoulder width apart.

1. Bend your knees slightly, but keep your heels flat on the floor.2. Lean towards the wall, allowing your elbows to bend.3. Stop moving forward when you start to feel a stretching sensation in

the calf muscles.4. Hold this position while you slowly count to 30.5. Slowly return to standing upright.6. Repeat steps one through five one time.

APPENDIX G

FUNCTIONAL TESTING INSTRUCTIONS PROTOCOL

Single-Leg Triple Hop for Distance

The purpose of this test is to determine the total distance hopped on a single leg in

three consecutive hops. You will be given two practice trials to familiarize yourself with

the test and then you will complete three test trials. The best one o f the three trials will

be recorded.

You must land firmly on the leg you are hopping on. If the opposite leg or any

arm touches the ground during the single-leg triple hop test, that trial will not be counted.

You must return to the start line for another trial.

1. Stand on the leg to be tested with your toes at the line.

2. When instructed to do so, hop as far as you can three times in a straight line.

3. Remain of the leg that is being tested until instructed to put the your opposite

leg on the ground.

4. Return back to the starting position for the next trail

5. You may now take three hops when you are ready.

Remember: Your opposite leg or any arm may not touch the floor during you

jumps or that trial will not count and you will not have the chance to repeat that

trial. Also, you must land firmly on the leg you are hopping on with no extra hop

for balance or the trial will not count.

70

71

Single-Leg Timed Hop

The purpose of this test is to determine the time a distance of 10 feet can be

covered using a series o f hops. You will be given two practice trials to familiarize

yourself with the test and then you will complete three test trials. The best one o f the

three trials will be recorded.

If the opposite leg or any arm touches the ground during the single-leg timed hop

test, that trial will not be counted. You must return to the start line for another trial.

1. Stand on the leg to be tested with the toes at the line.

2. When instructed to do so, hop as fast as you can in a straight line. Your goal is

reach the end o f the tape that marks 10 feet as fast as you can.

3. Remain on the leg being tested until instructed to put you opposite leg on the

ground.

4. Return to the starting position for the next trial

5. You may now take your hops when you are ready.

Remember: Your opposite leg or any arm may not touch the floor during any of

your jumps over the 10ft. or that trial will not count and you will not have the

chance to repeat that trial. Also, you must land firmly on the leg you are hopping

on with no extra hop for balance or the trial will not count.

72

Single-Leg Cross-Over Triple Hop for Distance

The purpose o f this test is to determine the total distance hopped crossing over a

15cm wide strip for each of three consecutive hops. You will be given two practice trials

to familiarize yourself with the test and then you will complete three test trials. The best

one of the three trials will be recorded..

If the opposite leg or any arm touches the ground during the single-leg cross-over

triple hop test, that trial will not be counted. You must return to the start line for another

trial. You will be required to complete three test trials.

1. Stand on the leg to be tested with the toes at the line.

2. Do a series of three hops crossing over the center line with each hop.

Hop as far as you can each time and your foot may not touch h the center line

or that trial will not be counted.

3. Remain on the leg being tested until instructed to put your opposite leg on the

ground

4. Return back to the start position for the next trial.

5. You may now take three hops when you are ready.

Remember: Your opposite leg or any arm may not touch the floor during your

jumps or that trial will not count and you will not have the chance to repeat that

trial. Also, you must land firmly on the leg you are hopping on with no extra hop

for balance or the trial will not count.

APPENDIX H

Data Collection SheetIdentification #:

Date: Age: Sex:

Circle "R" for right and "L" for left:

DOMINANT LEG: R L

LEG ORDER: R L

TEST ORDER: (number I to 3)

Single-Leg Triple Hop for Distance:

Single-Leg Timed Hop:

Single-Leg Cross-Over Triple Hop for Distance:

SINGLE-LEG TRIPLE HOP FOR DISTANCEData will be collected in centimeters (cm).Dominant leg is represented by DOM and the nondominant leg is represented by NON.

DOM NON

Trial 1: _______ _____

Trial 2: _______ _____

Trial 3: _______ _____

BEST SCORE:

73

74

SINGLE-LEG TIMED HOPData will be collected in seconds (s).DOM and NON will be used as for the first test results.

DOM NON

Trial 1: _______ _____

Trial 2: _______ _____

Trial 3: _______ _____

BEST SCORE:

SINGLE-LEG CROSS-OVER TRIPLE HOP FOR DISTANCEData will be collected in centimeters (cm).DOM and NON will be used as in the previous test results.

DOM NON

Trial 1: _______ _____

Trial 2:____________ _______ _____

Trial 3: _______ _____

BEST SCORE:

74

Appendix 1

Scatter Plots (Table 4.8-4.12)

Table 4.8 Dependent Variable= Functional Hop Tests; IndependentVariable= Age

S3H d ist

a o o o o.y 'KS 9 O

**0 °0 o^oog

W ' v -

: ÿ d - .

“o°

STH tim e r / i .

W - 'o =

oBo “# .

“oS □

S Ç 3 d ist

0 • ° °

O OO 0 0 OO OO OOI o o ec oanno o

OO « 0 o o o OODOOMB O

o oooa eOO 03 o m*oo o

a eraocD mo a wo to txo ox O 0

o a o OO oQOtD o OtflO OO O

■ D moo OBOAGE_1

75

76

Table 4.9 Dependent Variable= Functional Hop Tests; Independent Variable= Weight

0 °

S3H d isto “

a o o o

o S o a J

o # O ^

o 0 O

STH tim e¥ - k - j

o = 8

o 0

" 8 o “ ®0 0 Q

S C 3 d ist

f " o o

. JP " » o o

O

- C f :

• % • •

o rf> “

W T_1

77

Table 4.10 Dependent Variable= Functional Hop Tests; Independent Variable= Height

S3H d ist

o o 0 a 0

O a<tf “

cP m

^ •o °

STH tim e

a ° ° ° o °

oB o ° *>Oo o

S C 3 d ist i i f ' f

° ° Oo a

. . 4 ^o“ j » > " o o s » o o

OO "o

0

■ - JHT_1

78

Table 4.11 Dependent Variable= Functional Hop Tests; IndependentVariable= Activity Number

S3H disto “ °=

. niilliii

°o“

STH tim e

a °

oBo ° " o S o

S C 3 d ist" l i l l f s i

° Bo

0 a o am o o ■ o oiaoa

aosooiiM oo 0

moo oo

o oo UllJ

O O OOO oo 0

a oooo

o oo o uoumi

oo ooo mm activity #

79

Table 4.12 Dependent Variabie= Functional Hop Tests; Independent Variable= Leg Dominance

S 3H d ist

CD O

STH timeOqO Bf

OD

SC3 distO Q

OOo o o o a o

leg dom

Appendix J

Scatter Plot (Table 4.13)

Table 4.13 Dependent Variable= Functional Hop Tests; IndependentVariable= Gender

S3H d ist

# .# O o o

0

1 1 •

^ •

STH a m e

'o “ 1 i

» 8 o °

-■ '« ‘I v " -

**Oo o

S C 3 d ist i iB 1

OS o o

OOOOKW HWOO

mmmmÊmam o

o o momaumm a c

SEX_1

80


Recommended