+ All Categories
Home > Documents > DEVELOPING SAENS: DEVELOPMENT AND VALIDATION OF A …

DEVELOPING SAENS: DEVELOPMENT AND VALIDATION OF A …

Date post: 16-Feb-2022
Category:
Upload: others
View: 1 times
Download: 0 times
Share this document with a friend
115
DEVELOPING SAENS: DEVELOPMENT AND VALIDATION OF A STUDENT ACADEMIC ENGAGEMENT SCALE (SAENS) by DISHA DEEPAK RUPAYANA B.A., Pune University, 2002 M.A., Devi Ahilya Vishwavidhyalaya, 2004 M.S., Kansas State University, 2008 AN ABSTRACT OF A DISSERTATION submitted in partial fulfillment of the requirements for the degree DOCTOR OF PHILOSOPHY Department of Psychology College of Arts and Sciences KANSAS STATE UNIVERSITY Manhattan, Kansas 2010 brought to you by CORE View metadata, citation and similar papers at core.ac.uk provided by K-State Research Exchange
Transcript

DEVELOPING SAENS: DEVELOPMENT AND VALIDATION OF A STUDENT

ACADEMIC ENGAGEMENT SCALE (SAENS)

by

DISHA DEEPAK RUPAYANA

B.A., Pune University, 2002 M.A., Devi Ahilya Vishwavidhyalaya, 2004

M.S., Kansas State University, 2008

AN ABSTRACT OF A DISSERTATION

submitted in partial fulfillment of the requirements for the degree

DOCTOR OF PHILOSOPHY

Department of Psychology College of Arts and Sciences

KANSAS STATE UNIVERSITY Manhattan, Kansas

2010

brought to you by COREView metadata, citation and similar papers at core.ac.uk

provided by K-State Research Exchange

Abstract

Student engagement has become an important way of assessing student outcomes for college and

is used to provide information to accreditation agencies, for internal accountability as well as to

assess impact of college on students. However, current measures of student engagement do not

assess the core process underlying student engagement, instead focusing on antecedents and

consequences of engagement. The current research addressed this gap by first developing a new

measure of student engagement called SAENS (Student Academic ENgagement Scale), which is

strongly grounded in theory derived from the work engagement literature. Two dimensions of

engagement were found: enjoyment and effort. A second study validated this measure by

forming a nomological net of relationships with other variables and testing these antecedents and

consequences of engagement. Results indicated that engagement effort is strongly related to

student grades for their classes and the dimension of enjoyment is related to the teaching style of

collaborative learning. However, engagement was not related to students’ levels of critical

thinking.

DEVELOPING SAENS: DEVELOPMENT AND VALIDATION OF A STUDENT

ACADEMIC ENGAGEMENT SCALE (SAENS)

by

DISHA DEEPAK RUPAYANA

B.A., Pune University, 2002

M.A., Devi Ahilya Vishwavidhyalaya, 2004 M.S., Kansas State University, 2008

A DISSERTATION

submitted in partial fulfillment of the requirements for the degree

DOCTOR OF PHILOSOPHY

Department of Psychology

College of Arts and Sciences

KANSAS STATE UNIVERSITY Manhattan, Kansas

2010

Approved by:

Major Professor Dr Clive Fullagar

Abstract

Student engagement has become an important way of assessing student outcomes for

college and is used to provide information to accreditation agencies, for internal accountability as

well as to assess impact of college on students. However, current measures of student

engagement do not assess the core process underlying student engagement, instead focusing on

antecedents and consequences of engagement. The current research addressed this gap by first

developing a new measure of student engagement called SAENS (Student Academic

ENgagement Scale), which is strongly grounded in theory derived from the work engagement

literature. Two dimensions of engagement were found: enjoyment and effort. A second study

validated this measure by forming a nomological net of relationships with other variables and

testing these antecedents and consequences of engagement. Results indicated that engagement

effort is strongly related to student grades for their classes and the dimension of enjoyment is

related to the teaching style of collaborative learning. However, engagement was not related to

students’ levels of critical thinking.

v

Table of Contents

List of Figures ............................................................................................................................... vii

List of Tables ............................................................................................................................... viii

Acknowledgements ........................................................................................................................ ix

CHAPTER 1 - General Introduction............................................................................................... 1

Student Engagement ................................................................................................................... 5

CHAPTER 2 - Developing a New Measure of Student Engagement ........................................... 13

Positive Psychology .............................................................................................................. 14

Engagement....................................................................................................................... 15

Job Satisfaction ................................................................................................................. 18

Commitment ..................................................................................................................... 18

Job Involvement ................................................................................................................ 19

Flow .................................................................................................................................. 20

CHAPTER 3 - Scale Development Method ................................................................................. 25

Step 1: Item Development .................................................................................................... 25

Step 2: Questionnaire Administration .................................................................................. 26

Participants and Procedure ................................................................................................ 26

Step 3: Item Reduction .......................................................................................................... 27

Step 4: Scale Evaluation ....................................................................................................... 28

Step 5: Replication ................................................................................................................ 28

CHAPTER 4 - Scale Development Results .................................................................................. 29

Descriptive Statistics ......................................................................................................... 31

Factor Analysis Results..................................................................................................... 31

Replication. ....................................................................................................................... 36

CHAPTER 5 - Scale Development Discussion ............................................................................ 39

Factor Structure ................................................................................................................. 40

Theoretical Implications ................................................................................................... 42

Practical Implications........................................................................................................ 43

Limitations ........................................................................................................................ 44

vi

Conclusion and Directions for future research ................................................................. 45

CHAPTER 6 - Study 2: Validation Study .................................................................................... 47

The Nomological Context of Student Engagement .............................................................. 47

Outcomes of Engagement ................................................................................................. 56

CHAPTER 7 - Study 2: Method ................................................................................................... 59

Participants and Procedure ................................................................................................ 59

Measures Used .................................................................................................................. 60

Procedure .......................................................................................................................... 63

Analysis............................................................................................................................. 64

CHAPTER 8 - Study 2: Results .................................................................................................... 66

Descriptive Statistics ......................................................................................................... 67

Hypothesized Findings...................................................................................................... 69

CHAPTER 9 - Study 2: Discussion .............................................................................................. 76

Predictors of Engagement: ................................................................................................ 76

Consequences of Engagement .......................................................................................... 79

Theoretical Implications ................................................................................................... 83

Practical Implications........................................................................................................ 86

Limitations ........................................................................................................................ 88

Directions for future research ........................................................................................... 88

Conclusions ....................................................................................................................... 89

References ..................................................................................................................................... 91

Appendix A - Instructions read to students (2008) or on the online form (2009) ...................... 101

Appendix B - Sample CAAP Item (from the ACT website) ...................................................... 102

Sample Items for Passage 1 ................................................................................................ 103

Appendix C - NSSE items as they appeared on the survey ........................................................ 104

vii

List of Figures

Figure 6.1: I-E-O model (Astin, 1984) ......................................................................................... 49

viii

List of Tables

Table 3.1 Gender Breakdown by class for Fall 2008 .................................................................... 27

Table 4.1 Means(M), Standard Deviations(SD), and Correlations for the Initial 16 Items .......... 30

Table 4.2 Initial Factor Analysis, Factor loadings and Communalities ........................................ 32

Table 4.3: Pattern Matrix Loadings and Communalities for Oblique Factor Analysis ................ 34

Table 4.4: Confirmatory Factor Analysis Results ......................................................................... 35

Table 4.5: Cronbach’s Alpha Reliability Statistics for Enjoyment ............................................... 36

Table 4.6: Cronbach’s Alpha Reliability Statistics for Effort ....................................................... 36

Table 4.7: Confirmatory Factor Analysis for the Replication Sample ......................................... 37

Table 4.8: Means (M), Standard Deviations(SD), and Correlations for the Replication Sample . 38

Table 7.1: Demographics, Breakdown of Gender by Class for Fall 2009 .................................... 60

Table 7.2: IDEA scores means (M), Standard Deviations (SD) and Reliabilities (α) Across

Classes. .................................................................................................................................. 62

Table 8.1: Means (M), Standard Deviations (SD) and Correlations for Variables in Study 2 ..... 67

Table 8.2: Means(M), Standard Deviations(SD) and Correlations for the SAENS and NSSE

Items ...................................................................................................................................... 68

Table 8.3: ANOVA Comparing Effect of Gender on Engagement .............................................. 69

Table 8.4: ANOVA Comparing Effect of First Generation to Go To College on Effort and

Enjoyment ............................................................................................................................. 69

Table 8.5: Parameter Estimates and Variance Components of Null Models Tested .................... 70

Table 8.6: Parameter Estimates and Variance Components of Substantive HLM Model Testing

the Relationships for Effort and IDEA Teaching Styles ....................................................... 71

Table 8.7: Parameter Estimates and Variance Components of Substantive HLM Model Testing

the Relationships for Enjoyment and IDEA Teaching Styles ............................................... 72

Table 8.8: Hierarchical Regression Predicting Grades from the SAENS ..................................... 73

Table 8.9: Regression Results for Critical Thinking and SAENS Dimensions ............................ 74

ix

Acknowledgements

Getting my PhD has been an incredible journey, which has taken me from Indore, MP,

India to Pune, MH, India to Manhattan, KS, US. Along this journey, there have been many

people who have believed in me, supported me and sometimes pushed, kicked, dragged or

carried me to this point. Thank you all.

Nothing would have been possible without my parents: my father, Deepak Rupayana and

my mother, Dr Yeshomati Rupayana. Their unwavering belief in me and my abilities continues

to astound me at every step of the way. Thanks goes to my extended family as well, for never

pressuring me into doing anything and for supporting every endeavor.

Journeys of this magnitude are only possible when someone gives you an opportunity. I

have been given many opportunities and I am grateful for those who thought I could reach this

point. My advisor, Dr Fullagar, for inviting me to KSU. Thank you for introducing me to flow,

the theory and the experience, supporting me, and letting me trip at certain points, it was all for

the best. Dr Downey, thank you for your belief in me, for giving me opportunities I didn’t think

would come my way, and for being my mentor. I would also like to extend my gratitude to my

other committee members, Dr Saucier, Dr Procter, and Dr Gwinner for their support, feedback

and the lively academic discourse.

Along the way, I have met many fellow travelers and others who cheered from the

sidelines. Thank you my friends, for being sounding boards, rocks to lean on, ears to whine to,

soothers of cases of extreme worry, prodders for cases of extreme procrastination and excellent

cheerleaders. You all know who you are. You have made this journey fun, exciting, and a trip of

a lifetime. Even though our paths may separate now, postcards of our adventures will always

find their way to each other.

1

CHAPTER 1 - General Introduction

Attending college is thought to be an important developmental phase of an individual’s

life. College attendance has a far reaching effect on an individual’s life and causes a person to

grow and change. Even though growth and change does take place in the form of maturation,

whether an individual chooses to attend college or doesn’t, the type of change that takes place is

different when college becomes a part of the picture (Astin, 1993). College has been found to

impact several factors including individuals’ critical thinking, attitudes, values and moral

development (Pascarella & Terenzini, 2005). College also affects career choices, quality of life

as well as economic status of college attendees (Pascarella & Terenzini, 2005). However, the

extent to which college impacts students is determined by multiple factors. Students bring

certain characteristics to college, some of which are modified, and others stay the same through

college (inputs), such as demographic characteristics, family background as well as their

academic and social experiences. These inputs affect what students get out of college (Outputs).

All of these outputs are moderated by several factors. Some of these are the college social and

academic environment, and include institutional characteristics such as size, diversity, faculty

student ratios, students’ interaction with faculty, interaction with other students, policies as well

as student effort and engagement (Astin, 1984). The most important of these is student

engagement. For example Astin (1984) believes that “students learn by becoming involved”

(Astin, 1984, p. 133) . Pascarella & Terrenzini (2005) in their influential book “How College

Impacts Students” assert “…because individual effort and involvement are the critical

determinants of college impact, institutions should focus on the ways they can shape their

academic, interpersonal, and extracurricular offerings to encourage student engagement” (In

Kuh, 2009, p 5).

Research on college student development shows that the time and energy students devote

to educational activities is the single best predictor of their learning and personal development

(Kuh, 2001; Astin, 1993; Pascarella & Terenzini, 2005; Pace, 1980). Student engagement has

been found to be strongly related to several important college outcomes. Kuh (2003) asserts that

more students study a subject, the more they learn. Also the more time they invest in practice and

get feedback on their writing, analyzing or problem solving, the more adept they become. More

2

engaged students develop lifelong habits of learning and development. Engaged students also

have higher psychological as well as physical well being (Steele & Fullagar, 2008). Students

who are more engaged experience “flow”, a concept of complete involvement in activities, and

thereby invest more effort into their work (Rupayana, 2008). Students’ academic engagement has

also been found to influence decisions to persist in college, with highly engaged students being

more likely to persist through college and reach completion (Pascarella & Terenzini, 2005).

Academic involvement has also been found to be strongly related to students’ development of

career related competencies (Davis & Murrell, 1993). Higher academic engagement also

indicates higher gains in knowledge and cognitive growth as well as increased autonomy and

intellectual orientation.

Due to this positive impact of engagement on students, an increasing amount of attention

is being given to college students’ engagement at college, its outcomes and precursors, as well as

categorizing colleges on the basis of engagement they engender in students (Carini, Kuh, &

Klein, 2006). The most popular measure of student engagement is the National Survey of

Student Engagement (NSSE) which is increasingly being used to measure and assess student

engagement as well as for external accountability and accreditation processes that are important

issues for universities (Hu & Kuh, 2002).

Accountability and accreditations are important processes for higher education

institutions for a number of reasons. Firstly, higher education is dependent on external sources

which control important resources, such as accreditators, legislators, alumni, prospective students

and parents. As a result of this, higher education institutions are accountable to these external

sources and have to provide information about organizational performance for continued

availability of resources. Secondly, assessment results have to be reported in the interest of

transparency (McCormick, 2009). In a report of the Education Commission “A Test of

Leadership” on the Future of Higher Education (called the Spelling commission) that discusses

accountability, A Test of Leadership (Commission of Higher Education, 2006), asserts that

colleges and universities must become more transparent about cost, price and student success

outcomes and be willing to share this information”. Bennet (2007) cites five norms that guide

public disclosures. The first is that colleges and universities have a professional obligation to

disclose information that is relevant to students making decisions about college. Secondly,

information should be disclosed according to published professional standards and have validity,

3

reliability and audit-ability. Third, it should include information about student learning. Fourthly,

it should represent student experiences, and lastly it should contain information on price of

college attendance.

Apart from external accountability, there is another type of accountability, reflective

accountability, which is not coerced by external resources, but is based on the mission of the

institution. Assessment provides a way for the institution to measure whether they are meeting

their mission objectives or not (McCormick, 2009). As mentioned earlier, student engagement

mediates the impact college has on students, and has therefore become an important way of

assessing institutions, providing accountability to external sources as well as reflective

accountability (McCormick, 2009).

Accrediting agencies, even though they are an accountability system, have focused more

on peer review rather than public reporting. Their initial goals included demonstrating that the

institution satisfies minimum capacity and infrastructure. Now these goals have shifted towards

the institutional plans for assessment and improvement of educational effectiveness. Even

though public disclosure, as expected by the Spelling Commission (Commission of Higher

Education, 2006), is different from internal dialogues about effectiveness, and accreditation

approval (Burke, 2005), engagement is considered to be one of the ways of assessing and

satisfying all these requirements. Due to increasing pressure for accountability and in order to

satisfy accreditation agencies requirements, more and more universities have started reporting

student engagement data (Kuh, 2009).

Whether the purpose is reflective accountability or external accountability, a good

assessment tool should meet certain criteria. McCormick (2009) points out that to improve

institutional performance through assessment the first necessary condition is a focus toward

objective performance information, which should be gathered using appropriate assessment

tools. Improvement can only take place by defining essential performance information and using

the results from these assessments. Secondly, the assessment tool that is used should provide

relevant and useful data. Therefore, before assessment, it should be ascertained that the

assessment tool is grounded in theory about the topic of interest. It should provide information

about factors that are controllable and can be changed. The tool should also meet validity and

reliability standards. The data from the assessment should support comparison of institutions in

4

terms of performance, past performance as well as intra-institutional analysis by supporting

subunits such as colleges, subpopulations etc.

The above criteria are applicable not just to institution’s internal assessment for reflective

accountability, but also for external accountability. By using well established assessment tools

for these purposes, an institution indicates its interest, attention as well as commitment towards

important outcomes’ assessment and improvement. As discussed earlier, student engagement and

overall student involvement has been found to affect students’ success at college ( (Pascarella &

Terenzini, 2005), and engagement has become a way of assessing institutional effectiveness for

both reflective and external accountability.

Many instruments are available for assessing student engagement, such as the College

Student Experience Questionnaire (CSEQ; Pace, 1980) and Cooperative Institutional Research

Program's Entering Student Survey and the College Senior Survey (Astin, 1993). These

instruments were mainly designed for research rather than assessing accountability and

effectiveness. More recently, The National Survey of Student Engagement (NSSE) has emerged

as a popular method for assessing student engagement. Kuh (2009) cites that the purpose for the

NSSE was to provide high quality, actionable data that can be used by institutions to improve the

undergraduate experience. Over the past decade NSSE has gone from being used by 140 schools

to being used by more than 700 institutes in 2008 (Kuh, 2009).

The NSSE is used as an indicator of college performance and other accountability

functions. Second, it is used to document effective educational practices in postsecondary

education. Its third and final use is as an empirically derived measure of collegiate quality

intended for use by the public (Kuh, 2009). To this purpose the NSSE collects information in 5

areas. First it assesses participation in educationally purposeful activities. Second, it determines

institutional requirements in academic arenas such as reading requirements and nature of

coursework. The third set of indicators assess students’ perceptions of the college environment

associated with achievement, satisfaction and persistence. Fourthly, the NSSE collects

information about student's background such as age, gender, socioeconomic status. Last, NSSE

assesses students’ perceptions of learning, by asking students about their growth in the areas of

general knowledge, intellectual skills, communication skills and vocational preparation. Based

on these assessment clusters, certain benchmarks have been established to expedite and simplify

comparisons of institutions. These are academic challenge, active and collaborative learning,

5

student faculty interaction, enriching educational experiences and supportive campus

environment (Kuh, 2009).

The NSSE has recently also been used for providing consumer information. The US

News & World Report and its America's Best Colleges report have added NSSE results from

institutions that agreed to the inclusion of their engagement data (McCormick, 2009). As of May

2008 about 400 institutions have agreed to participate in the USA Today program (McCormick,

2009).Therefore the NSSE solves the multiple purposes of providing accountability through

public reporting of institutional quality, also providing a way for institutions to assess themselves

in terms of meeting their student learning outcomes, and lastly providing accreditation agencies a

way of assessing institutional focus on effectiveness.

However, as can be seen from the above descriptions, NSSE is a measure of overall

student involvement with the college experience and how it impacts their learning. It is not a

measure of the processes underlying student engagement and does not assess actual engagement

but the result of this engagement, which is involvement in college. The question then remains as

to what is student engagement, what are the dimensions of student engagement in the classroom

and how students become academically engaged. The next section addresses the issue of student

engagement and how it is defined and studied.

Student Engagement The premise of engagement has been in the literature for a very long time, with a

constantly evolving definition and meaning. The first mentions of student engagement can be

found in the 1940's, Tyler (1949) demonstrated that time spent on the task has a positive effect

on students' learning. According to Tyler (1949), “Learning takes place through the active

behavior of the student; it is what he does that he learns, not what the teacher does (p. 63).”

Effort is the common factor between all the conceptualizations of student engagement and it is

still a central part of the concept of student engagement. The most current definition of student

engagement by NSSE defines student engagement as the “quality of effort and involvement in

productive learning activities” (Kuh, 2009; pg 9). The evolution of this definition and the NSSE

measure are described next

This concept of effort is further elaborated by Pace (1980), who developed the College

Student Experiences Questionnaire (CSEQ; Pace 1980) based upon the concept of quality of

6

effort. He asserted that quality of effort determines the experience students get from college and

by measuring the effort we can judge the quality of the educational process. The CSEQ was the

first measure of its kind, which was used to assess higher education institutes as well as assess

student outcomes and shift responsibility of student achievement toward student engagement

rather than institutional issues (Pace, 1984). In this measure, effort was measured as the

frequency of students’ use of the major resources and opportunities for learning and personal

growth provided by the college. He included measures of use of facilities such as classroom,

library, science, cultural facilities, student union, athletic and recreation facilities as well as

residence facilities. The other types of activities included in the measure were social experiences,

faculty and peer interaction, as well as the extent of conversations with other people. Quality of

effort was defined as the extent of influence of these resources on learning or personal growth.

Items ranged from low quality and low effort to high quality and high effort and were weighted

by time invested in these activities. The main aim of this scale was research and it contributed to

the area of assessment of learning outcomes. Pace (1984) found that "… the more aspects of

college experience one participates in at above an average level of quality of effort, the more...

above average progress is made towards educational goals. Breadth of involvement and breadth

of attainment go hand in hand" (Pace, 1984, pg 75). This measure has been used extensively to

assess higher education institutes as well as study differential outcomes of college for students

and the impact of the college environment on learning (Pascarella & Terenzini, 2005). However,

certain questions remain about this measure. Astin (1984) asks, to what extent can high quality

involvement compensate for lack of quantity and what are the causes of low quality involvement.

Astin also poses the question as to whether time expended is expended wisely or is it just

inefficient time waste on the part of the student? These methodological questions with the CSEQ

rendered it problematic for use with large inter university comparisons and it never gained the

same level of popularity as the NSSE.

Another similar definition of engagement was responsible for making the study of student

engagement popular (Kuh, 2009). Astin(1984) suggested that students learn by becoming

involved. Involvement is used by Astin (1984) to denote engagement. He suggests that learning

takes place due to the time spent on a task, as well as by investing energy into the task. Based on

this, there are five basic postulates of student involvement. The first is that involvement requires

the investment of psychological and physical energy; secondly different students will invest

7

varying amounts of energy in different things. Thirdly, involvement has both quantitative and

qualitative features. Fourthly the amount of learning is directly proportional to the quality and

quantity of involvement. Lastly, the educational effectiveness of any institutional policy or

practice is related to its capacity to induce student involvement. Student effort thus determines

the overall impact of college (Astin, 1993).

This theory resulted in the Cooperative Institutional Research Program (CIRP; Astin,

1993) and Astin (1984) specifies different forms of involvement which have been found to

impact different aspects of college students. On campus residence as a form of engagement was

found to impact persistence, seeking further degrees as well as higher involvement in on-campus

extracurricular activities. Another area of involvement is honors programs which affect student

satisfaction, and faculty student interactions. Academic involvement here is defined as a complex

set of traits and behaviors such as extent of working hard at studies, hours of studying and

interest in their courses. Other forms of involvement are athletic involvement and involvement in

student government. This theory of student involvement was explored by Astin (1993) using the

CIRP longitudinally over the college career of UCLA students. However, this was intended for

research purposes to study impact of college on students and never became a popular method for

studying student engagement across universities or even for comparing engaged student with

other disengaged ones.

Another student outcome model that has influenced the area of student engagement to a

great extent and also contributed to the development of the NSSE measure (Kuh, 2009) is the

Chickering & Gamson’s (1987) seven categories of effective educational practices. These

practices were intended to improve undergraduate education. First is improving student-faculty

contact which increases student likelihood of graduation and encourages thinking about future

plans. The second practice is of cooperation among students as working together to improve

student involvement in learning. Thirdly, students learn better by writing and applying subject

matter to their lives, so effective practice would have to include active learning. Prompt feedback

is the fourth effective practice; assessment and feedback are importance determinants of

improving performance. The fifth effective practice is time on task. Students need to learn to

spend time effectively and the more time that is spent on tasks the more students learn. “Time

plus energy equals learning” (Chickering & Gamson, 1987; pg 3). Communicating high

expectations is the sixth effective practice and this acts as a self fulfilling prophecy in that

8

students tend to do better when expected to do well. Lastly, effective practice should include

respect for diverse talents and ways of learning. This is important because students bring

different talents and styles of learning to college, and letting them learn in their diverse ways can

help them perform better. Thus all these seven categories influence student learning and the

quality of their educational experiences (Kuh et al., 2004) and form the base of the national

Survey of Student Engagement (NSSE; Kuh, 2009).

The NSSE began as a way of shifting away from college rankings as a way of expressing

collegiate quality. College rankings emphasize institutional resources and reputation. What was

needed was evidence of student learning and effective educational practice. Thus began the

National Survey of Student Engagement, which was developed using the above mentioned

CSEQ and the CIRP. About 2/3 of the first NSSE was derived from the CSEQ (Kuh, 2009). The

NSSE has now become one of the most popular methods of institutional assessment with more

than 700 higher education institutes using it in 2008 and is often thought of as "institutional

research in a box" (Kuh, 2009).

Overall, the NSSE has three purposes. First is to provide data that can be used by

institutions to improve the undergraduate experience. The engagement measure acts as process

indicators that can be used to improve student and institutional performance (Kuh, 2009). The

second purpose of the NSSE is to document effective educational practices in post secondary

settings. Thirdly NSSE advocates for public acceptance and use of empirically derived

conceptions of collegiate quality (Kuh, 2009).

To fulfill these purposes the NSSE is divided into 5 benchmarks and a number of

subscales. The NSSE collects information about students' background, including age, gender,

ethnicity, living situations, major as well as educational status. They assess student engagement

by asking students to report the frequency with which they engage in activities that represent

good educational practices, for example use of resources, curricular programs, and opportunities

for learning and development as well as the effort they expend for classes (Kuh, 2001). The

benchmarks are based on forty two key questions from the NSSE that focus on many of the

important student experiences during college.

The first benchmark is academic challenge, which taps into the Chickering & Gamson's

(1987) effective practice of setting high expectations. If students are challenged academically

they perform better. This benchmark includes questions on preparing for class, number of

9

assigned textbooks, number of written papers or reports, nature of coursework and emphasis of

campus environment on academic work and study time.

The second benchmark is active and collaborative learning. Again a part of the

Chickering & Gamson’s (1987) effective practices. Students learn more when they are intensely

involved through active learning and collaborating with others helps with mastering difficult

material and also helps in solving problems in real life. Questions in this benchmark include

asking questions in class, working with other students, working on community based projects,

and discussing ideas from classes outside of class (Kuh, 2001).

The third benchmark is student faculty interaction, where students are posited to learn

better by interacting with faculty members inside and outside the classroom. Questions include

extent of communication with faculty in terms of grades, discussing career plans, discussing

class readings outside of class, working with faculty on non class related activities and receiving

feedback from faculty.

The fourth benchmark is enriching educational experiences, which deals with activities

outside of class. Questions on this benchmark include topics such as participation in co-

curricular activities, internship or practicum experiences, community service or volunteer work

as well as questions related to technology and diversity experiences.

The final benchmark of the NSSE is supportive college environment. Students perform

better and are more satisfied at colleges that provide positive social and working environments.

This benchmark includes questions on campus environment as well as quality of relationships

with peers, faculty and administrative personnel (Kuh, 2001).

The above benchmarks are used by schools to estimate the efficacy of their improvement

efforts. Banta, Pike & Hansen (2009) specify the different ways in which NSSE is used by higher

education institutes. The first step for universities is to set goals for student learning and

engagement. The next step is deciding which assessments accurately measure these goals. These

include direct assessments in the form of exams and research papers and indirect assessment

through the NSSE. The scalelets and benchmarks of NSSE provide these assessments, such as

communication skills, critical thinking, integration and application of knowledge, intellectual

depth, breadth and adaptiveness as well as an understanding of society and culture. Based on the

results of these assessments, institutions modify programs and create new ones. New goals and

strategic planning is also an outcome of NSSE results. NSSE data is also used by institutions in

10

their accreditation process to show that the university is meeting its educational objectives.

Accountability reports also include NSSE results to show that the university is meeting goals

related to access, retention and graduation, student learning and campus environments (Banta et

al, 2009). NSSE has also been used as a method for comparing across colleges. Pike (2003) also

found that NSSE benchmarks and US news college ranking are not strongly related to each other,

indicating that college reputation and resources are not an indicator of student engagement, while

the NSSE is a good indicator of overall student involvement in college.

Thus the NSSE is used for a variety of purposes that cater to multiple assessment issues

that universities face, such as accountability, accreditation as well as internal assessment and

planning. NSSE provides them with data to help assess whether educational effectiveness goals

as well as student outcomes are being fulfilled or not. However, NSSE, even though it is thought

of as a measure of student engagement, it is not a measure of the same. It is a measure of overall

college involvement and includes academic as well as extracurricular involvement of students

during their college years (Kuh, 2009). Kuh (2003, 2009) asserts that NSSE is a measure of

student outcomes as well as effective educational practices. Engaged students are an outcome of

effective educational practices. Thus the NSSE measures outcomes and antecedents of student

engagement and does not assess the underlying psychological aspects of what is meant by an

academically engaged student. This becomes clearer on examination of the NSSE benchmarks.

The first benchmark is academic challenge. Challenge has been found to be a precursor of

engagement. When students’ challenges balance the skills they have, they experience “flow”

which is a form of engagement (Rupayana, 2008; Shernoff, Csikzentmihalyi & Shernoff, 2003).

Thus the NSSE is measuring a precursor of engagement with this benchmark rather than

engagement itself. The second and third benchmarks are collaborative learning and faculty

student interaction. Both assert “students learn better when intensely involved due to

collaborative and active learning as well as more interaction with faculty” (Kuh, 2009, pg 6).

This again indicates that collaborative learning and faculty interaction set up the stage for an

academically involved student. However they do not measure student engagement directly. The

fourth and fifth benchmarks are involvement with activities outside of class and supportive

college environment respectively, direct attention towards overall college involvement rather

than academic engagement.

11

Other NSSE questions assess how much time and effort students put into academic

activities. Effort is an outcome of engaged students. If a student is disengaged he/she is less

likely to put effort into an activity. Previous research supports this finding (Rupayana, 2008). At

the same time, by using effort and time spent as a measure of student engagement, brings to

mind Astin’s (1984) criticism of the Pace (1984) CSEQ. Astin (1984) poses the question,

whether time expended is expended wisely or is it just inefficient time waste on part of the

student. Is time spent an indicator of engagement or the process by which students become

engaged.

Thus, even though NSSE serves several higher education assessment issues admirably, it

cannot be called a measure of student engagement. It is too broad in scope and is more of a

survey of student experiences rather than a theoretical explanation of student engagement. Such a

broad reference makes it impractical for developing action plans aimed at enhancing student

engagement. Due to it’s atheoretical nature, NSSE is unable to explain any of the differences that

occur between students. Such as why student background is a predictor of NSSE benchmarks

(Pike, 2003) and also why effort and time does not always explain gains in student learning

(Kuh, 2009). NSSE also does not have a sound conceptual basis and confuses processes of

engagement with its outcomes and antecedents. NSSE can serve to assess student outcomes as

well as students’ overall engagement in college, however it cannot explain student engagement

in the classroom and in academic activities or the processes underlying it. At the same time, there

are other areas, such as work engagement, that have been explored extensively and many

theories of work engagement exist which can shed some light on student engagement in the

classroom and its underlying processes. These theories have produced diverse conceptualizations

and assessments of engagement but have not been used to develop a comprehensive

understanding of student engagement. Use of these theoretical foundations will lead to a better

understanding and operational definition of student engagement.

The current study utilized some of the literature from work engagement and its related

processes to develop a measure of student engagement and to assess some of the outcomes and

antecedents underlying the process of student engagement. By so doing I formalized the

definition of students’ academic engagement and standardized its measurement. Secondly, it

made it possible to test higher order models regarding mechanisms for increasing engagement

12

and the process by which it generates positive outcomes. Last, this allowed for advancement of

the literature and application of theory aimed towards increasing student engagement.

13

CHAPTER 2 - Developing a New Measure of Student Engagement

The concept of engagement has been a part of psychology for a long time in different

forms especially in the area of work related behavior. Organizations consider engagement to be

an important aspect of a productive workforce. Engagement in the workplace and with the work

itself has been found to be related to critical work outcomes such as performance (Harter,

Schmidt, & Hayes, 2002), lower stress (Salanova, Bakker & Llorens, 2006; Britt, Castro &

Adler, 2005) and increased commitment toward work and the organization (Schaufeli & Bakker,

2004). Due to the positive impact of engagement on the workforce, engagement has been studied

extensively in the industrial organizational psychology literature. Not unlike student engagement,

workplace engagement has gone through a process of evolution with different conceptualizations

and definitions of engagement over time. Due to this evolution process as well as the increasing

amount of attention being paid to engagement, the characteristics of work that engage workers

have emerged much more clearly than in the area of student engagement. Therefore workplace

engagement can contribute to assessing student engagement and the characteristics that cause

students to be engaged in their work.

Factors of engagement that apply to workers are applicable to students as well. Research

has shown that students share many characteristics of workers and being a college student can be

conceptualized as a job (Cotton, Dollard, & DeJonge, 2002). Like workers, students work in

hierarchical structures, they have defined job task for which they have variable levels of control

and support from outside. Students are also required to meet deadlines, and progress is dependent

on performance. One major goal of university work is attainment of qualifications through

performance, so even though students do not get paid for their performance, performance results

in a secondary important outcome of obtaining qualifications. Therefore student work is similar

to work in organizations. This has also been corroborated by the use of workplace engagement

measures to assess student engagement and its outcomes (Schaufeli, Salanova, Gonzalez-Roma,

& Bakker, 2002). Engagement has been found to impact outcomes such as student performance,

well being, and student satisfaction (Steele & Fullagar 2008; Schaufeli et al., 2002). From this

research it is evident that student engagement is similar to workplace engagement and students

have been used to study engagement outcomes important to the workplace. However, most of

this research uses engagement items modified for use with students and not developed

14

specifically for use with student populations. This necessitates the development of a measure of

engagement expressly directed at students.

Hinkin (1995) describes a process of scale development where development goes

through several stages, including item generation, scale construction, reliability and validity

before a scale is ready for use. The first step is item generation where the focus is on content

validity, that is, the extent to which the measure assesses the domain of interest. Item generation

can take place in an inductive or deductive manner. An inductive process has very little theory

involved and is based on participants’ responses. On the other hand, a deductive process of item

generation indicates that a typology is developed before data is collected which ensures that the

measure is strongly grounded in theory. Hinkin (1998; pg 968) says “This approach requires an

understanding of the phenomenon to be investigated and a thorough review of the literature to

develop the theoretical definition of the construct under examination. The definition is then used

as a guide for the development of items”. A deductive process will be used in this case due to the

large amount of literature that exists on engagement. Additionally engagement is a part of

positive organizational behavior constructs, some of which have strong overlaps with

engagement. Facets of these constructs are relevant to students and can be utilized in the

theoretical underpinnings of student engagement. These definitions of engagement and the

associated constructs are discussed next in a context of positive psychology.

Positive Psychology The concept of engagement belongs to a set of positive psychology constructs,

specifically to positive organizational behavior. Seligman & Csikszentmihalyi (2000) in a special

issue of the American Psychologist stated "the purpose of positive psychology is to "...begin to

catalyze a change in the focus of psychology from preoccupation only with repairing the worst

things in life to also building positive qualities” (p.5). Different levels of analysis for positive

psychology include the subjective level comprising of constructs such as well being, contentment

with the past, flow, happiness, hope and optimism. Second, the individual level consists of traits

such as capacity for love, courage, talent, and wisdom. Lastly, the macro level comprises of

characteristics such as positive civic virtues, altruism, strong work ethic etc. These levels of

positive psychology have been applied to the workplace in the form of positive organizational

behavior (Luthans, 2002).

15

Positive psychology in the workplace is defined as “the study and application of

positively oriented human resource strengths and psychological capacities that can be measured,

developed and effectively managed for performance improvement in today's workplace."

(Luthans, 2002, p 175). Criteria for a positive organizational constructs include measurability,

state like, as well as changeability of this state to manage and optimize performance in the

workplace. Work engagement is a part of this set of positive organizational behaviors at the

subjective individual level of positive psychology which include other variables such as job

satisfaction, flow, organizational commitment, job involvement and vigor. All these are job

attitudes and have been found to have a certain amount of shared variance. Research on job

satisfaction, involvement, engagement, vigor, and positive organizational support shows that

they are distinct and do contribute uniquely to the area of job attitudes and impact performance

and productivity of an organization (Steele, Rupayana, Mills, Smith, Wefald, & Downey, 2010;

Halleberg & Schaufeli, 2006). Other research contradicts this view, asserting that job satisfaction

and engagement measures do not contribute uniquely to the study of organizational variables

(Wefald & Downey, 2009). At the same time engagement is often measured as a combination of

satisfaction, commitment, and involvement (Newman & Harrison, 2008). To design a new

measure of engagement, it is important to assess the way engagement is defined and measured as

well as its overlap with other variables which can contribute to the current measure. This is done

next.

Engagement

Although engagement is a work-based concept and has been found to be related to

important outcomes in the workplace, it still lacks a common definition and operationalization

(Kahn, 1990; Harter, et al., 2002; Saks, 2006; Shirom, 2003). Kahn (1990) was the first to study

engagement and proposed that engagement is comprised of three components, namely physical,

cognitive, and emotional. Kahn studied students as well as architects for his 1990 ethnographic

study of engagement. For engagement to occur, the situation has to involve meaningfulness,

safety, and availability. Meaningfulness is a function of work elements such as the nature of the

task, roles played by the person etc. Safety is created by the social systems such as group and

inter-group dynamics, and interpersonal relationships. For safety these systems need to have

predictability, consistency, and should be non-threatening. The last criterion of engagement is

availability. Availability is the sense of possessing emotional, physical and psychological

16

resources necessary for investing in the work. In an empirical study based on Kahn (1990)

work, May, Gibson,& Harter (2004) found that meaningfulness, safety, and availability enhance

engagement in the workplace and concluded that engagement has three components, physical,

emotional and cognitive.

After the Kahn (1990) work, Maslach and colleagues (Maslach & Leiter, 1997; Maslach,

Schaufeli, & Leiter, 2001) proposed that engagement is the positive antipode of burnout.

Burnout has characteristics of exhaustion, cynicism and lack of professional efficacy. If

engagement is lack of burnout then engagement is characterized by energy, involvement, and

efficacy. However, research has not upheld this view of engagement. Lack of efficacy develops

separately from exhaustion and cynicism, also exhaustion and cynicism may deal with external

factors such as resource availability and may not have anything to do with the task itself

(Schaufeli & Salanova, 2007), while engagement is focused on the work itself.

Due to this (Schaufeli, Salanova, Gonzalez-Roma, & Bakker, 2002) proposed a

somewhat different conceptualization of engagement. They described engagement as a

“persistent and pervasive affective cognitive state not focused on any particular object, event,

individual or behavior”. Schaufeli and his colleagues also proposed that engagement is a

multidimensional construct. However, their dimensions varied from those offered by Maslach &

Leiter (1997), as engagement was no longer seen to be the opposite ends of a burnout-

engagement continuum. The most widely used definition of engagement defines it as a,

“positive, fulfilling, work related state of mind that is characterized by vigor, dedication and

absorption” (Schaufeli, et al., 2002). Schaufeli and colleagues hold the prevailing view that

engagement consists of three dimensions; vigor, dedication and absorption. Work vigor is

characterized by high levels of energy and mental resilience, the willingness to invest effort in

one's work, and persistence even in the face of difficulties. Dedication is characterized by a sense

of significance, enthusiasm, inspiration, pride and challenge in one’s work. Lastly, absorption is

characterized by being fully concentrated and deeply engrossed in one's work, whereby time

passes quickly and one has difficulties detaching oneself from work (Schaufeli, et al., 2002).

This is the most widely used definition and conceptualization of engagement in the work

literature and forms the basis for the most commonly used measure of engagement, the Utrecht

Work Engagement Survey (UWES, Schaufeli et al, 2002). A recent metaanalysis in the area

reported that the UWES has been used for a variety of samples such as students, managers,

17

executives, entrepreneurs, farmers, blue collar workers, police officers and home care staff

(Christian & Slaughter, 2007). However, UWES is often criticized for being atheoritical and as

having considerable overlap with other measures and measures of related job attitudes (Shirom,

2003; Newman & Harrison, 2008) and its three dimensions have very strong correlations and

often do not separate out as different dimensions.

A new construct that has been increasingly highlighted as an alternative measure of

workplace engagement is workplace vigor (Shirom, 2003). According to Shirom (2003), vigor

aims to merge positive psychology with workplace affect to capture the interplay of worker well-

being and organizational effectiveness in the organizational context. Pulling from other theories

including Kahn’s (1990) Engagement Theory, Shirom emphasizes the importance of cognitive,

physical, and emotional energy expressed in the work environment. Cognitive liveliness deals

with mental agility, cognitive awareness, and one’s feeling of flow in thought. Physical abilities

and physical strength are the second key component. Finally, emotional energy refers to the

interpersonal expressions of sympathy, empathy, and emotional sustenance. Thus, when

physical, emotional, and cognitive resources are properly allocated, the corresponding result is

an increased expression of workplace energy toward the fulfillment of organizational outcomes.

Overall, vigor is seen as a better measure of engagement, with Shirom (2003) asserting that vigor

is more grounded in theory and has less overlap with preexisting constructs than the Schaufeli et

al. (2002) definition of engagement. However, the confirmation of vigor adding incremental

validity beyond engagement and other similar constructs has not been realized.

Thus there are varying definitions of engagement and how it is measured. At the same

time, engagement in the workplace belongs to a set constructs that are often thought of as

overlapping to the extent that it has been proposed that there is just one single construct that

manifests itself in different forms (Newman & Harrsion, 2008). Recent research on workplace

engagement by academic and organizational research has done little to squelch the arguments of

those who argued that workplace engagement is essentially, ‘old wine in new bottles’ (Saks,

2006). In the literature, workplace engagement has been measured by combining elements of

workplace commitment, workplace involvement, flow, and job satisfaction (Harter, Schmidt, &

Hayes, 2002; Macey & Schneider, 2008; Saks, 2006). These constructs, their overlaps with

engagement and the various definitions of engagement are described next.

18

Job Satisfaction

Job satisfaction has been of great interest to psychologists and many other researchers.

Job satisfaction is an emotional reaction to a job resulting from comparisons of actual outcomes

with desired outcomes (Hulin & Judge, 2003). Locke (1976) defined job satisfaction as a positive

emotional state stemming from an appraisal of one's job and associated experiences, or the

perception of the ability of one's job to fulfill needs and important values. Job satisfaction has

been described as a state that changes over the course of an individual’s employment (Boswell,

Shipp, Payne, & Culbertson, 2009).

Both job satisfaction and job engagement focus on enjoyment of work. In engagement,

this enjoyment is thought to lead to involvement, while in satisfaction, enjoyment is expressed as

satiation or contentment, but affective reactions to the job are present in both definitions. If

engagement is distinct from satisfaction and is a unique construct, then engagement should

uniquely predict outcomes, (e.g., employee turnover intentions, performance, well-being, etc.)

beyond other similar constructs such as job satisfaction. Work in this area asserts that there is

significant overlap between engagement and satisfaction, and engagement does not add any

unique variance beyond that of satisfaction (Wefald & Downey, 2009). Macey & Schneider

(2008) in their article on state of the engagement concept try to sort some of the overlap between

the constructs by asserting that when satisfaction is assessed as satiation it is not the same as

engagement, but if it is measured as a feeling of energy, enthusiasm and positive affect, it

becomes a measure of engagement. Thus the main difference between satisfaction and

engagement is energy, with engagement meaning activation and investment of energy into work

and satisfaction denoting satiation (Macey & Schneider, 2008). Recent research exploring the

overlaps between satisfaction and engagement found that they are unique variables loading on to

separate latent constructs (Steele et al, 2010). In addition to job satisfaction, there are other

constructs related to engagement including commitment, vigor (Shirom, 2003), and flow

(Rupayana, 2008).

Commitment

There are several forms of commitment; There is commitment to the organization as well

as to the occupation. In both form, commitment can be of several types. Affective commitment

describes the emotional attachment that an individual has to their occupation. Continuance

commitment is an individual’s desire to remain in the occupation as a result of the perceived

19

costs of leaving. Finally, normative commitment is the obligation one feels to remain in the

occupation. Vance (2006) argued for the linkage between engagement and commitment, stating

that both can be increased in the same way. For example, engagement can be heightened by

making jobs meaningful and allowing workers some degree of both variety and autonomy.

Likewise, commitment can be increased by facilitating acquisition of knowledge and skills on

the part of the worker. In fact, engagement and commitment have been found to have such a

strong positive correlation that Saks (2006) attempted to clarify a definitional issue regarding the

great similarity of the two, although he ultimately argued that they are not one and the same, as

commitment is more attitudinal, whereas engagement may be more behaviorally-based. Hallberg

and Schaufeli (2006) reached a similar conclusion, again judging the two constructs as distinct

and thus reflecting different aspects of positive attachment to one’s work. Snape & Redman

(2003) suggested that an individual who is affectively and/or normatively committed to an

occupation may be more inclined to actively engage themselves in the occupation than would an

individual who is experiencing continuance commitment, and therefore may have little desire to

engage themselves in the intricacies of the occupation more than is

necessary. Fleming, Coffman, and Harter (2005) identified commitment as an integral

component in the measurement of workplace engagement. Similarly, Robinson, Perryman and

Hayday (2004) looked at engagement and commitment as overlapping constructs which operate

in a repetitive loop. Thus engagement and commitment overlap to a great extent. However, they

represent different aspects of attachment to one’s organization.

Job Involvement

Kanungo (1982) and Blau (1985) defined involvement in terms of psychologically

identification with the job and further suggested a multidimensional construct that operates at

both the general and specific levels. Accordingly, work involvement offers an evaluation of the

work environment in general, incorporating the person’s past experiences and normative beliefs.

Alternatively, specific job involvement focuses on the normative beliefs about one’s current job

(Kanungo, 1982). May, Gilson, and Harter (2004) suggested the distinctiveness of job

involvement and work engagement lies in the employment of different cognitive, emotional, and

behavioral strategies. They explain that although both job involvement and work engagement

require the use of cognitive judgments, work engagement also emphasizes the use of emotions

and behaviors in individual role performance. Therefore, they suggest work engagement is an

20

antecedent to job involvement. Macey & Schneider (2008) assert that involvement is an aspect of

engagement but does not encompass the entire conceptual space that engagement does. Morrow

(1983) suggests that job involvement and organizational commitment are distinct constructs,

emphasizing the reliance of each on distinctive referent foci – job involvement on the job and

organizational commitment on the organization. However, Saks (2006) supported the

antecedents and consequences of job engagement as paralleling those of organizational

commitment and job satisfaction. These findings lend tentative support to the notion that

engagement, commitment, and job involvement are largely redundant, and thus confounded, a

notion that several researchers support (Hallberg & Schaufeli, 2006; Meyer, Stanley,

Herscovitch, & Topolnytsky, 2002).

Flow

“Flow” was first penned by Csikszentmihalyi (1975) who defined it as the “holistic

sensation that people feel when they act with total involvement” (p.4). Flow has been described

as the experience of working at full capacity, with intense engagement and effortless action,

where personal skills match required challenges (Nakamura & Csikszentmihalyi, 2002). It is

regarded as an “optimal experience” to such an extent that the two terms are often used

interchangeably. Thus, flow is an experience where individuals lose themselves in the task at

hand. The absorption in the activity is so enjoyable that it becomes worth doing for its own sake

without any extrinsic contingencies (Csikszentmihalyi, 1999). Flow has been operationally

defined as consisting of multiple facets (Csikszentmihalyi, 1988; Jackson & Eklund, 2002). Nine

dimensions of flow have been identified and measured: challenge skill balance, action awareness

merging, lack of self consciousness, complete concentration, feeling of control, time distortion,

goal clarity, feedback, and autotelic experience. However comparison of several

operationalizations reveals three core components. First, there is an optimal balance between the

challenges presented by the task, and the skills necessary to meet those challenges. If the task is

too challenging, then it becomes stressful. If it is too easy then it becomes boring

(Csikszentmihalyi, 1975, 1990; Csikszentmihalyi & Rathunde, 1993). Second, flow is a state of

total absorption. Individuals report being totally focused on, and immersed in, the activity that

they are performing (Bakker, 2005; Csikszentmihalyi, 1990; Ghani & Deshpande, 1994). The

third core element is that flow experiences are reported as being so enjoyable and optimal that

individuals are intrinsically motivated by the task itself. In other words, people perform the task

21

for the sake of the process rather than for any external reward (Bakker, 2005; Csikszentmihalyi,

1990)

Even though flow and engagement conceptually overlap, the literature has tended to

focus on their differences. Flow has been described as a short-term, acute, absorption in a

specific kind of activity, whereas engagement has been thought to be a more pervasive and

persistent involvement in a broad range of activities (Schaufeli & Salanova, 2007). Kahn (1990)

wrote, “…such (engagement) underlies what researchers refer to as effort, involvement,

mindfulness, flow and intrinsic motivation” (p. 701). Bakker (2005) stated that flow transfers

from music teachers to their students and culminates in engagement. Macey & Schneider (2008)

have suggested that autotelic personality, which is a trait manifestation of flow, can be

conceptualized as trait engagement. Due to the similarity between the two constructs and in the

way they have been defined, there are differing viewpoints in the literature as to whether flow

causes engagement or engagement results in flow. Although Steele and Fullagar (2008) offered

only cross-sectional data, they supported a model in which flow totally mediated the relationship

between engagement and well-being.

In addition to overlapping conceptually, operationalizations and measures of engagement

and flow also overlap. Bakker’s (2005) flow measure, known as the Work reLated Flow

inventory (WOLF; Bakker, 2005) has several similarities with the Utrecht Work Engagement

Scale (UWES; Schaufeli et al., 2002). For example, the dimension absorption in WOLF includes

items such as, “I get carried away by my work”, and the UWES has items such as, “I am

immersed in my work”. Thus, both measures are measuring a similar aspect of absorption. The

dedication dimension from the engagement literature overlaps with the dimension of intrinsic

motivation because both dedication and intrinsic motivation are looking at work in terms of

internal reasons such as pride, inspiration and challenge for working rather than because of

external rewards. Recent research by Rupayana (2008) found that flow (as measured by WOLF)

and engagement (As measured by UWES) correlate strongly (uncorrected r =.72) and appeared

to be different manifestations of the same construct of engagement. Also, engagement was not

found to add incremental validity over flow in predicting student effort (Rupayana, 2008). Thus

engagement has a significant overlap with the domain of flow constructs as well.

Therefore engagement has been measured in many ways and has significant overlaps

with other constructs including job satisfaction, work involvement as well as flow and vigor.

22

However, none of these constructs or measures of engagement have been designed specifically

for students or operationalized for assessment of student engagement and the characteristics that

engender it. At the same time, the similarities in the definitions, conceptualizations, and

manifestations of these organizational attitudes indicate that they can be drawn upon to create a

measure of student engagement. From these overlapping definitions a new definition and

dimensions for a measure of student engagement can be deduced. These are described next.

A common aspect of all measures of work engagement, involvement and flow is

absorption. UWES defines absorption as being characterized by being fully concentrated and

deeply engrossed in one's work, whereby time passes quickly and one has difficulties detaching

oneself from work (Schaufeli, et al., 2002). One of the dimensions of WOLF is absorption and

workers exhibiting high work involvement show high amount of absorption in the task

(Kanungo, 1982). They become preoccupied with the task and stay involved in it for long

periods of time. Previous research using flow models has found that absorption and

concentration in work is an important aspect of the flow experience (Csikszentmihalyi, 1988). In

a study on students by Shernoff, Csikszenmihalyi, Schneider & Shernoff (2003) engagement was

represented by concentration in the task. Similar research by Csikszenmihalyi, Rathunde &

Whalen (1996) found that deep absorption in academic activities is an indicator of student

achievement and talent development. Since flow is a form of engagement, absorption should be

an important aspect of how students exhibit their academic engagement. Absorption can be seen

in the NSSE measure as well. The NSSE benchmark of time spent on academic activities is an

indicator of absorption in academic activities, it can be assumed that when students are absorbed

in a task, they spend more time involved with the task, with time on task as an indirect measure

of absorption. Therefore absorption is an integral part of engagement as well as flow literature

and has been shown to be important for student outcomes and should be one of the dimensions of

student engagement. Therefore, it was deduced that student engagement will contain aspects of

absorption.

Another important aspect of flow is challenge/skill balance. Bakker (2005) asserts that

challenge/skill balance is a precursor to flow, while Nakamura & Csikszentmihalyi (2002) assert

that challenge/skill balance is an essential element of flow. Only when a person’s skills match

the challenges they face, then they experience flow. If skills are too high and the challenge

minimal, boredom is experienced and if skills are too low to successfully master the task, anxiety

23

results. Previous research has also shown that flow can be pared down to a balance between the

skills of the person and the challenge of the task (Rupayana, Steele & Fullagar, 2008). Another

study by Rupayana (2008) also found that challenge/skill balance predicts student effort

indicating that challenge skill balance is an important part of student engagement. At the same

time the dimension of dedication from the UWES also contains aspects of challenge, Schaufeli et

al (2002) assert that dedication is characterized by a sense of significance, enthusiasm,

inspiration, pride and challenge in one’s work. Shernoff et al (2003) also found that

challenge/skill balance affected the amount of engagement students experienced in academic

activities, with perception of high challenge leading to higher engagement. Thus a balance of

skills and challenges is a part of being engaged. Therefore the second dimension of student

engagement was challenge/skill balance.

The third dimension of the current measure of student engagement was vigor. It

corresponds to the UWES dimension of vigor. Since engagement is characterized by affective,

cognitive as well as physical involvement, vigor represents the physical or energy oriented aspect

of engagement. (UWES) contains the dimension of vigor which is defined as high levels of

energy and mental resilience, the willingness to invest effort in one's work, and persistence even

in the face of difficulties. At the same time, a newer measure of engagement is vigor, which is

characterized by physical and well as mental energy in one’s work. Work involvement as well as

commitment also show aspects of being invested in one’s work. Flow also contains elements of

vigor, with the dimensions of loss of self consciousness (Csiksenmihalyi, 1988) indicating

investing of the self completely into work. Thus vigor is an important part of experiencing

engagement.

The final dimension of student engagement was intrinsic motivation. The variable with

which engagement has the most overlap and the strongest connection is flow. As mentioned

earlier, flow has often been considered to be a peak experience of engagement. An advantage of

WOLF over the UWES is that it measures flow as characterized by enjoyment, absorption and

intrinsic motivation. This adds to the measurement of engagement by adding a dimension of

enjoyment and intrinsic motivation.

Enjoyment and intrinsic motivation are pertinent to student engagement as research has

shown that student involvement goes hand in hand with their enjoyment of academic activities

(Pascarella & Terenzini, 2005). When students enjoy academic activities, engaging in these

24

activities becomes motivating for its own sake which is called intrinsic motivation. Intrinsic

motivation is an aspect of WOLF and has been shown to improve engagement as well as impact

student related outcomes (Deci, Vallerand, Pelletier, & Ryan, 1991). Students who are

intrinsically motivated have been found to be more likely to stay in school than externally

motivated students and are also more likely to perform better. They are also more likely to show

positive emotions in the classroom, enjoy academic work and be more satisfied with work. It has

also been asserted that internalizing uninteresting activities by giving them value also leads to

students that are actively engaged (Deci et al., 1991). Thus intrinsic motivation is an important

facet of engagement and was one of the dimensions of the current measure of student

engagement.

Taken together students academic engagement can be defined as a state of cognitive,

affective, and physical involvement in academic work and is characterized by intrinsic

motivation, absorption, challenge skill balance as well as vigor. Therefore, the current measure

was derived using these dimensions and the measure itself was called SAENS (Student

Academic ENgagement Scale). The process for constructing the items for the SAENS and

assessing them is described next in the method section.

25

CHAPTER 3 - Scale Development Method

The process of scale development using deductive reasoning involves a number of steps.

Hinkin (1998, 2005) provided a framework for scale development, which includes five steps 1)

item development 2) questionnaire administration 3) item reduction 4) scale evaluation 5)

replication with an independent sample. Each step and its results are described next.

Step 1: Item Development Deductive scale development was undertaken, based on the assumption that a theoretical

foundation provides the necessary information to generate items. First a definition of the

construct was developed, which is discussed in the introduction section. This was then used as a

guide for the development of items (Hinkin, 1998). A total of 24 items were developed that

assessed the engagement dimensions of intrinsic motivation, absorption, challenge skill balance

and vigor. Preexisting engagement, flow, and involvement items were examined and new items

were created to represent these dimensions. Items were rewritten or reworded to ensure face

validity and to establish consistency in tone and perspective across all of the items in the pool.

The final aspect of item generation is deciding upon item scaling. Research indicates that

likert type scales are the most commonly used response formats. Internal consistency (coefficient

alpha reliability) optimizes for scales that use a 5-point format, but levels off after that point

(Lissitz & Green, 1975). Accordingly, a 5-point Likert scale was used, ranging from 1 =

“Strongly disagree” to 5 = “Strongly agree.” Hinkin (2005) also suggests including a neutral

midpoint, in this case 3 = “neither agree nor disagree”, to ensure respondents the choice of being

neutral towards an item and still retaining the information for use in the final dataset.

The next part of the item generation process was to assess the content validity of the

items (Hinkin, 1998). This can be done using the method developed by Schriesheim and

collegues (Schreisheim, Powers, Scandura, Gardiner, & Lankau, 1993). In this process, first,

items are administered to respondents along with definitions of these constructs. Respondents are

then asked to rate the extent to which each item corresponds to each definition. Next, the

proportion of respondents who assign an item to its intended construct is assessed (Anderson &

Gebring, 1991). An acceptable limit of 75% agreement was specified prior to the administration.

Hinkin (1998) mentions that it is adequate to use a student sample for this purpose, as extensive

26

familiarity with the concept is not necessary. This procedure was followed in the current study as

well.

In the current study, 10 students from a psychology course were asked to serve as

assessors. Their year in college ranged from first year to senior, and they were either pre-

psychology or psychology majors. The 24 items were then presented to these 10 independent

respondents in random order, requesting them to sort the items into various dimensions of

absorption, intrinsic motivation, challenge skill balance, and vigor. An "other" category was also

included to eliminate the forced assignment of items to a category. Items that were categorized in

the same category by 70% or more of the participants were accepted as being representative of

the underlying construct. 8 items did not meet the criteria and were discarded and 16 items were

retained for the second step.

Step 2: Questionnaire Administration

Participants and Procedure

This step was undertaken after item generation. First a sample was selected. Since the

current measure is intended for students, a college student sample was chosen. Schwab (1980)

indicated that sample size affects the results of statistical techniques. Exploratory and

confirmatory factor analyses have been found to be susceptible to the effect of sample size. Use

of large sample sizes helps in obtaining stable estimates of standard errors to ascertain that factor

loadings accurately reflect true population values. For this purpose, item to response ratios of

1:10 is considered adequate. Since 16 items were retained, a sample size of at least 160 is

recommended (Schwab, 1980; Hinkin, 2005).

First year students at a large Midwestern university were approached for this study. Two

hundred and eighty three students enrolled in sixteen small first year seminar classes were asked

to complete the engagement survey as a part of their class. The response rate was quite high at

93.3%. The final sample size was 264 with 63.9% females and 84% Caucasian. Average age was

19 and ranged from 18 to 27. Table 3.1 shows students’ demographic information broken down

by class.

27

Table 3.1 Gender Breakdown by class for Fall 2008

Class N Male % Female

% AVERAGE AGE 1 Political Science 18 44.44 44.44 18.5

2 Medieval & Renaissance British Literature 5 0.00 80.00 19.0 3 American Literature 12 33.33 41.67 19 4 American Literature (B) 16 31.25 50.00 18.5 5 Introduction to Sociology 20 40.00 55.00 18.75 6 Introduction to Women's Studies 21 4.76 71.43 18.76 7 Great Books 17 17.65 64.71 18.71 8 Introduction to Literature 20 0.00 80.00 18.50 9 Insects & People 10 50.00 30.00 18.70 10 Introduction to Leadership Concepts 20 35.00 55.00 18.60 11 World Regional Geography 21 28.57 42.86 18.58 12 Classical Cultures 15 40.00 46.67 19.27 13 Foundations of Education 17 0.00 82.35 18.33 14 Mastering Academic Conversations 17 17.65 70.59 19.25 15 Introduction to Human Development 19 15.79 63.16 19.12 16 Natural Disasters 18 38.89 44.44 18.69 Total N= 264

Participation was voluntary and students were not penalized for deciding to opt out of the

survey or for leaving questions in the survey unanswered. Students were asked for their student

identification number so that the information from the survey could be matched with

demographic information collected separately. Also, only aggregated engagement information

was provided to instructors and confidentiality of individual student information was maintained.

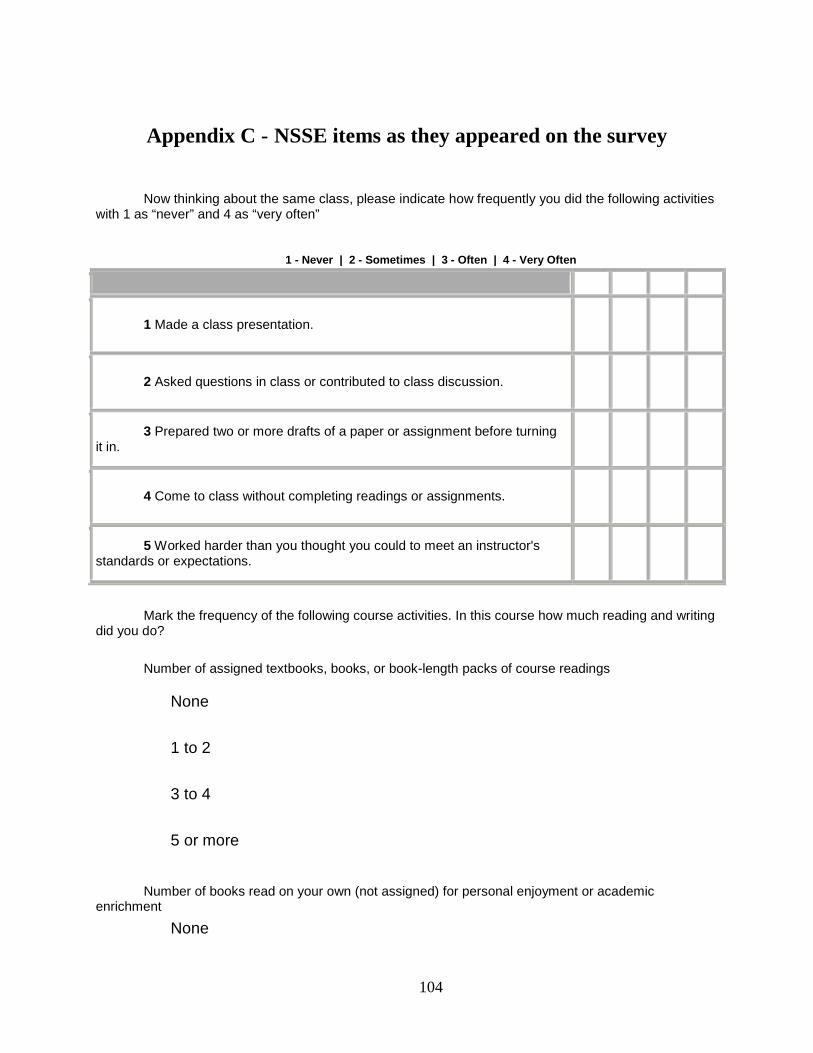
Students were given paper copies of the pilot engagement survey to complete at the

beginning of a class session. The same instructions were read out to all the classes, and can be

seen in appendix A.

Step 3: Item Reduction Once the data was collected, following Hinkin’s (2005) recommendations, an exploratory

factor analysis was conducted to further refine the scale. It has been asserted that the number of

factors to be retained depends on both underlying theory and quantitative results. The

examination of item loadings on latent factors provides a confirmation of expectations.

Eigenvalues greater than one, and a scree test of percentage of variance explained was used to

28

support the theoretical factor distinctions (Conway & Huffcutt, 2003). Factor loadings of over

.40 were used as a criterion along with strong loadings on the appropriate factor. Communality

statistics were also utilized to determine proportion of variance explained by each of the items.

Hinkin (2005) also recommends a minimum of 60% variance explained to retain an item.

Deletion of inappropriately loading items, and repetition of the analysis until a clear factor

solution emerges is also recommended. Keeping the above guidelines in mind, the scale was

modified and reduced. The results of this procedure are discussed further in the results section.

Step 4: Scale Evaluation As a part of this step, first a confirmatory factor analysis was conducted using AMOS 5,

where various models were contrasted to see whether or not the model generated by the

exploratory factor analysis was indeed the best fitting model. Joreskog & Sorbom (1980)

recommend contrasting a null model, where all items load on separate factors, a single common

factor model, and a multi factor model with the number of factors equaling the number of

constructs in the new measure. Chi square values, as well as goodness of fit indices including

GFI, NFI and RMSR were reported.

An important aspect of scale evaluation is internal consistency assessment. The reliability

should be assessed after the dimensionality of the scale has been established. The most

commonly accepted measure is internal consistency reliability using Cronbach’s Alpha. In this

step Cronbach’s Alpha was determined for the scale overall as well as for the dimensions that

emerged from the exploratory and confirmatory factor analysis.

Step 5: Replication The final step for scale development is replication. At this point, the scale was replicated

on an independent sample consisting of 350 students enrolled in a general psychology class. Data

was collected as a part of a larger data collection effort, and no identifying information was

collected. Instructions for the survey were the same as given to students in Step 2 (see appendix

A). The replication included a confirmatory factor analysis and assessment of internal

consistency reliability. Results from this replication, as well as the other steps of the process are

described in the results section.

29

CHAPTER 4 - Scale Development Results

Prior to analysis the negatively worded items were reverse scored, and the reverse scored

items were used in the rest of the analysis. First the data was examined for data entry errors and

the means of the variables were examined to check for the same. Data entry errors were

corrected and the data was analyzed for missing data. Missing data was minimal. Less than 5%

of the data points were missing, and cases with missing values were deleted from the analysis.

Once this was done, assumptions of the General Linear Model were tested. Specifically, tests

were done to assess skewness, multivariate outliers, multivariate linearity, normality and

homoscedasticity.

The dataset was tested for multivariate outliers. This was done by finding Mahalalobis

Distance for all variables of interest. 3 multivariate outliers were found (D (10)>= 29.59,

p<.001). However Cook’s distance for these cases was less than one, indicating that they did not

have much influence on the derivation of the regression line (Tabachnick & Fidel, 2006). It was

decided to retain the outlying cases for further analyses.

Skewness was tested by comparing the ratio of skewness to the standard error of

skewness to determine significance. Some items showed negative skew; However, the effect of

skew on the analysis is less with a larger sample size and the standard error of skewness is a

conservative estimate of skew (Tabachnick & Fidel, 2006). Therefore, skew was examined

further using frequency histograms, as well as normal probability plots and detrended expected

probability plots. Examination of the p-p plots showed that all items lined up against the diagonal

indicating low deviation from normality. Therefore, variables were not transformed as their skew

did not affect the analysis. Additionally, examination of the bivariate scatterplots showed no

instances of nonlinearity.

Next, the data was examined for multicollinearity. Multicollinearity is indicated by high

correlations between variables and low tolerance. As can be seen from table 4.1, none of the

items had correlations over .90. Multicollinearity diagnostics were also computed: tolerance

levels were acceptable; none of the conditioning indices exceeded 30, and no variance

proportions were over .50; further confirming that the items were not multicollinear.

30

Table 4.1 Means(M), Standard Deviations(SD), and Correlations for the Initial 16 Items

Items M SD 1 2 3 4 5 6 7 8 9 10 11 12 13 14 15 16

1 I find this class to be extremely enjoyable 4.01 0.80 --

2 I usually get very absorbed in my work for this class 3.42 0.85 .55 --

3 I find the work for this class to be meaningful 3.97 0.71 .51 .53 --

4 I usually am eager to go to this class 3.68 0.87 .61 .48 .49 --

5 I have to force myself to do work for this class (r) 3.57 0.86 .39 .27 .34 .43 --

6 I get carried away by the class assignments 2.70 0.73 .26 .37 .23 .23

-.01

--

7 This class requires very little effort on my part (r) 3.37 0.92 .14 .22 .14 .06 -.09

0.11 --

8 I often feel energized by the work in this class 3.29 0.81 .46 .42 .48 .46 .28 0.19 0.07 --

9 This class motivates me to work very hard 3.44 0.80 .52 .48 .54 .46 .32 0.26 0.21 0.54 --

10 I am bored by this class (r) 3.99 0.87 .65 .49 .41 .60 .37 0.20 0.23 0.44 0.50 --

11 I want to learn the skills needed to do what is needed for this class 3.94 0.73 .33 .32 .38 .24 .10 0.13 0.25 0.25 0.42 0.31 --

12 When things are not going well in this class, I want to work hard 3.84 0.73 .22 .27 .27 .30 .18 0.08 0.14 0.20 0.33 0.32 0.39 --

13 I feel good when doing work for this class 3.68 0.71 .43 .37 .49 .51 .35 0.18 0.09 0.47 0.51 0.39 0.37 0.42 --

14

When studying for this class, I think about little else 3.12 0.84 .33 .36 .39 .42 .29 0.24 0.10 0.30 0.30 0.35 0.22 0.25 0.37 --

15 I often feel proud of the work that I do for this class 3.68 0.74 .41 .35 .43 .41 .26 0.11 0.17 0.37 0.51 0.38 0.42 0.30 0.57 0.41 --

16

I spend a minimal amount of effort working for this class (r) 3.55 0.94 .19 .28 .26 .23 .09 0.11 0.57 0.15 0.39 0.29 0.33 0.32 0.24 0.17 0.32 --

M=mean; all correlations over |. 11 | are significant at .05 level and correlations equal to or greater that | .14 | are significant at .01 level,

N=264

31

Descriptive Statistics

Means, standard deviations, and inter-item correlations are presented in Table 4.1. For the

pilot study, the highest mean was found for the item “I find this class to be extremely enjoyable”

(M=4.01), the means of the other items ranged from 3.24 to 3.99. Correlations between items

ranged from r= .06 to r= .65, most items were moderately correlated and the correlations can be

seen in Table 4.1.

Factor Analysis Results

The initial exploratory factor analysis using a varimax rotation, showed a factor structure

of 3 factors and some problems with cross loadings. Examination of the scree plot and variance

accounted for showed a sharp drop after the first factor, with factor 3 accounting for only 7.23%

of the variance. Table 4.2 shows the factor loadings and communalities from this preliminary

analysis. Factor 3 contained just two items, so these two items were eliminated: item 7“This

class requires very little effort on my part” and item 16 “I spend a minimal amount of effort

working for this class”. During this analysis, four items with low communalities were also

eliminated. A modest communality estimate of .35 was used as a criterion for inclusion of the

item in later analysis. eliminating items 5, 6, 12 and 13 from further analysis.

32

Table 4.2 Initial Factor Analysis, Factor loadings and Communalities

Factor 1

Factor 2

Factor 3 h2

1 I find this class to be extremely enjoyable 0.76 0.24 0.08 0.65

2 I usually get very absorbed in my work for this class 0.66 0.20 0.23 0.53

3 I find the work for this class to be meaningful 0.56 0.42 0.13 0.50

4 I usually am eager to go to this class 0.68 0.36 -0.01 0.59

5 I have to force myself to do work for this class (rev) 0.41 0.29 -0.16 0.28

6 I get carried away by the class assignments 0.34 0.03 0.14 0.14

7 This class requires very little effort on my part (r) 0.08 0.04 0.77 0.60

8 I often feel energized by the work in this class 0.53 0.36 0.01 0.40

9 This class motivates me to work very hard 0.51 0.49 0.24 0.55

10 I am bored by this class (r) 0.66 0.28 0.19 0.55

11 I want to learn the skills needed to do what is needed for this

class 0.20 0.45 0.32 0.35

12 When things are not going well in this class, I want to work hard 0.14 0.49 0.20 0.30

13 I feel good when doing work for this class 0.35 0.72 0.01 0.63

14 When studying for this class, I think about little else 0.39 0.34 0.06 0.27

15 I often feel proud of the work that I do for this class 0.30 0.62 0.16 0.50

16 I spend a minimal amount of effort working for this class (r) 0.13 0.29 0.69 0.58

Eigenvalues 6.17 1.62 1.15

Variance accounted for 38.57 10.18 7.23

N=264

33

As the next step, another factor analysis was conducted using an oblique rotation. Table

4.3 shows the results from this factor analysis. Results indicated that a two factor solution was a

better fit for the data and yielded two interpretable factors, One severely crossloading item, item

3: “I find the work for this class to be meaningful” was eliminated. This yielded a final scale

with nine items. Upon examination of the items making up the two factors, it was found that the

items that make up factor one focused on the enjoyment of class activities, and items in factor

two focused on the effort and involvement in the work. Accordingly, the factors were labeled

enjoyment and effort. Enjoyment contains four items with a mean of 3.5 and work effort contains

five items with a mean of 3.6. The items’ factor loadings, eigenvalues and communalities can be

seen in Table 4.3.

34

Table 4.3: Pattern Matrix Loadings and Communalities for Oblique Factor Analysis

F1 F2 h2

1 I find this class to be extremely enjoyable 0.86 -0.03 0.71

2 I usually get very absorbed in my work for this class 0.72 0.04 0.54

3 I find the work for this class to be meaningful 0.42 0.48 0.63

4 I usually am eager to go to this class 0.84 -0.04 0.67

8 I often feel energized by the work in this class 0.56 0.21 0.49

9 This class motivates me to work very hard 0.38 0.47 0.56

10 I am bored by this class (r) 0.86 -0.09 0.66

11 I want to learn the skills needed to do what is needed for this class -0.14 0.84 0.59

13 I feel good when doing work for this class 0.23 0.63 0.60

15 I often feel proud of the work that I do for this class 0.06 0.77 0.64

Eigenvalues 5.11 0.99

Variance accounted for 51.40 9.88

Correlation between factors 0.54

N=264

F1= enjoyment

F2=effort

35

Next a confirmatory factor analysis comparing the fit of a one factor model and the two

factor model was conducted. AMOS 5 was used for this purpose, and results indicated that the 2

factor model (χ 2= 108.68, df= 26, RMSEA =. 10) when compared to the unifactor model (χ2 =

299.26, df=36, RMSEA =.16) was a much better fit (Δ χ2= 190.58, Δ df =10, p<.001). Table 4.4

shows the fit statistics for the two models. Comparison of the fit indices also indicated that a two

factor model is a better fit than a single factor model. Fit indices for the 2 factor model also

confirmed this. Fit indices for the 2 factor model were better, with CFI =0.91, and RMSEA

=0.10 as compared to the single factor model with CFI = 0.76, and RMSEA = 0.16.

Table 4.4: Confirmatory Factor Analysis Results

Model χ2 df CFIa PCFIa RMSEAa ∆ df ∆χ2 1 Uni-factor model 299.26 36 0.76 0.5 0.16

2 2nd order 2 factor model 108.67 26 0.91 0.53 0.10

Comparing 1 and 2

10 190.58**

N= 264 a CFI = Comparative Fit Index, PCFI= Parsimony Comparison Fit Index, RMSEA = Root Mean Square Error of Approximation

**p<.01

The next step of the analysis was to assess the internal consistency of the scales.

Cronbach’s alpha was calculated for both subscales. Examination of the scale statistics as well as

item variances and alpha if item removed, did not yield any questionable items and all items

were retained. Cronbach’s Alpha was calculated for the two subscales and enjoyment had a high

internal consistency at α=. 88 (see Table 4.5) and work effort showed a similar level of internal

consistency at α =. 82 (Table 4.6). Effort and enjoyment were correlated at r=.80.

36

Table 4.5: Cronbach’s Alpha Reliability Statistics for Enjoyment

Scale Mean if Item Deleted

Scale Variance if Item Deleted

Corrected Item-Total Correlation

Squared Multiple

Correlation

Cronbach's α if Item Deleted

1 I find this class to be extremely enjoyable. 14.08 9.38 0.81 0.68 0.83

2 I usually get very absorbed in my work for this class. 14.56 9.59 0.70 0.52 0.86

3 I usually am eager to go to this class. 14.44 8.94 0.77 0.60 0.84

4 I often feel energized by the work in this class. 14.77 10.11 0.59 0.36 0.79

5 I am bored by this class (r) 14.19 9.13 0.71 0.53 0.86

Cronbach’s α for the scale = .88, N= 264

Table 4.6: Cronbach’s Alpha Reliability Statistics for Effort

Scale Mean if Item Deleted

Scale Variance if Item Deleted

Corrected Item-Total Correlation

Squared Multiple

Correlation

Cronbach's α if Item Deleted

1 This class motivates me to work very hard. 11.26 3.87 0.66 0.44 0.77

2 I want to learn the skills needed to do what is needed for this class. 11.00 4.44 0.55 0.31 0.80

3 I feel good when doing work for this class. 11.13 4.02 0.69 0.50 0.76

4 I feel proud of the work I do for this class. 11.01 4.01 0.69 0.51 0.76

Cronbach’s α for the effort scale =. 82; N=264

Replication.

Using the second sample, the scale was tested again using a confirmatory factor analysis

and the same 2 dimensions were found to be a good fit (χ 2= 94.10, df= 26, RMSEA =. 09);

Table 4.7 shows the fit indices for the confirmatory factor analysis of this sample. Modification

indices were also computed and none of the modification indices were over 10.00 indicating that

the model was a moderately good fit for the data. Reliabilities of the subscales were .80 and .83

for effort and enjoyment respectively. Means, standard deviations and correlations between items

for this sample can be seen in Table 4.8.

37

Table 4.7: Confirmatory Factor Analysis for the Replication Sample

Model χ2 df CFIa PCFIa RMSEAa

1 Confirmatory model 94.10 26 0.95 0.69 0.09

N= 350

a CFI = Comparative Fit Index, PCFI= Parsimony Comparison Fit Index, RMSEA = Root Mean Square Error of Approximation

To conclude, the factor analysis indicated that student engagement comprises of

enjoyment of academic activities as well as effort put into academic work. The results were

confirmed using a second independent sample. The SAENS also demonstrated good internal

consistency reliability on both samples. The importance and the implications of these results is

further discussed in the next section.

38

Table 4.8: Means (M), Standard Deviations(SD), and Correlations for the Replication Sample

M SD 1 2 3 4 5 6 7 8 1 I find this class to be extremely enjoyable a 3.97 0.85 --

2 I usually get very absorbed in my work for this class a 3.58 0.88 .64 -- 3 I usually am eager to go to this class a 3.64 0.96 .67 .57 --

4 I often feel energized by the work in this class a 3.30 0.91 .58 .57 .56 -- 5 This class motivates me to work very hard b 3.51 0.95 .53 .57 .53 .57 --

6 I am bored by this class (r) a 3.76 1.01 .70 .51 .64 .51 .52 -- 7 I want to learn the skills needed to do what is needed

for this class b 3.79 0.81 .44 .40 .51 .41 .46 .39 -- 8 I feel good when doing work for this class b 3.74 0.79 .60 .53 .57 .61 .45 .53 .49 --

9 I often feel proud of the work that I do for this class b 3.83 0.79 .55 .48 .51 .51 .52 .51 .47 .59 All correlations are significant at p<.01, N=350

a: enjoyment item; b: effort item

39

CHAPTER 5 - Scale Development Discussion

Student engagement has become an important way of assessing collegiate effectiveness,

as well as for providing accountability to internal and external stakeholders such as accreditation

agencies, parents, and students themselves. Students' engagement levels have also been found to

be predictive of their success in college, their persistence (Pascarella & Terenzini, 2005, Kuh,

2001; Astin, 1993), outcomes from college (Kuh, 2003), as well as their subjective well-being

(Astin, 1993) during college. At the same time, the methods by which student engagement is

measured, such as the NSSE, focus on time expended in college related activities as well as

effort made for academic work. Even though effort has been found to be an outcome of

engagement (Rupayana, 2008), it is still affected by factors other than engagement. As discussed

earlier, the NSSE is an excellent measure of overall college involvement. However, it ignores the

underlying psychological characteristics of student engagement. This indicates a gap in the

literature with respect to measuring student engagement. At the same time, there is extensive

literature on workplace engagement which can be utilized to develop a measure directed towards

students.

The central purpose of this study was to develop a measure of student engagement using

a deductive scale development method, which included determining the dimensions of the

measure by referencing previous research in the area. On the basis of previous research on work

engagement and other work related constructs, it was argued that the student engagement process

is best measured by four interrelated dimensions and therefore student engagement was defined

as a state of cognitive, affective, and physical involvement in academic work, characterized by

intrinsic motivation, absorption, challenge skill balance as well as vigor.

The scale was developed using preexisting and new engagement items which were then

reduced using a Q-sort technique. The scale was further refined by administering the SAENS to

two separate samples of students. The first sample was used to assess the factor structure of the

scale and to further eliminate ill fitting items from the scale. The engagement data obtained from

the second sample was then used to verify the structure of the scale using confirmatory methods.

These results are discussed herein.

40

Factor Structure

The engagement scale was hypothesized as consisting of four dimensions: intrinsic

motivation, absorption, vigor and challenge-skill balance. The factor analysis indicated that two

correlated factors were a better fit. On further examination of the items that comprise the two

subscales, it can be seen that they assess different aspects of engagement. The first assesses

engagement as the extent of enjoyment found in the work and includes items such as “I find this

class to be extremely enjoyable” as well as “I am eager to go to this class” and the reverse scored

item “I am bored by this class”. On the other hand, the factor of effort includes items that result

from enjoying the class as well as the desire to put in the effort into the work for the class. Items

for this factor include “I feel energized by the class”, motivated to work for the class, desire to

learn the skills needed for the class as well as feeling good about doing the work for the class.

This finding, that student engagement is made up of the dimensions of effort and

enjoyment, has two main implications. First, it indicates that engagement is indeed a

multidimensional construct. This is something that is debated in the literature on engagement.

Second, the current measure is novel in the sense that it includes enjoyment as an aspect of

student engagement. Both of these contributions are discussed next.

Dimensionality of both flow and engagement has not been firmly established. For

example, research on flow scales shows a lack of conclusions on the dimensionality of flow.

FSS-II has been utilized unidimensionally as well as with 9 dimensions. Some researchers have

used the FSS-II in their research by producing a global flow score by totaling up the flow

dimensions (Allison & Duncan, 1988, Bryce & Hayworth, 2002), while others have used all nine

dimensions (Marsh & Jackson, 1999; Martin & Cutler, 2002). Some researchers have also argued

that flow is not nine dimensional and some dimensions are antecedents and consequences of the

flow experience (Quinn, 2005; Rupayana & Steele, 2008). Marsh & Jackson (1996, 2002)

suggested that the relative usefulness of a global flow construct, versus a profile of the nine

factors, may be dependent on the needs of the particular application of the flow scale. Similarly,

upon examination, the WOLF was found to consist of three highly intercorrelated factors. A two

factor fit was also found to be a reasonable fit (Bakker, 2004). It was assessed that the WOLF

dimensions of enjoyment and intrinsic motivation are strongly intercorrelated and can be easily

measured as one factor instead of two.

41

Similarly, engagement as measured by the UWES has been defined as consisting of the

three dimensions of absorption, vigor and dedication. However, research using these dimensions

has consistently found them to be very highly intercorrelated. Schaufeli and colleagues (2006) in

extensive research on the UWES, found a three dimensional structure for work engagement, but

the fit of the unifactor model was not much worse than the three factor model and Schaufeli et al

(2006) indicated that UWES can be used unidimensionally, and asserted that more research

needs to be undertaken on separating the three dimensions. Similar results have been found by

other researchers (Sonnentag, 2003, Rupayana, 2008, Wefald & Downey, 2009) who failed to

verify a three dimension structure for engagement.

All of the above indicates that dimensionality of engagement has not been established

clearly. By showing that there are two dimensions of engagement, at least in the student varietal,

the current study contributes to the literature in the area. This indicates that to experience high

engagement, a student would have to show facets of enjoyment of academic endeavors, find the

work meaningful, energizing and absorbing. Dedication, absorption and investment of energy,

perception of challenge in work do not occur in isolation, but are accompanied by enjoyment in

academic work. High engagement is then a result of both high enjoyment and high effort.

Students’ desire to expend effort does not occur in isolation and is connected to their enjoyment

of the class.

Further examination of the factor making up effort dimension in the SAENS shows that

here effort consists of items typically included in the UWES under the factors of absorption,

dedication and vigor. This indicates that the UWES facets of engagement are aspects of the same

dimension of putting effort, or the desiring to expend effort, into work. SAENS adds an extra

correlated dimension of enjoyment to the measurement of engagement. Therefore, the second

important contribution of the current study is the inclusion of enjoyment in engagement. Flow

has facets of enjoyment with one of the dimensions of the FSS-II being autotelic activity

(Nakamura & Csikszentmilhayi, 2002) and WOLF including intrinsic motivation (Bakker,

2004). However, engagement measures do not typically include enjoyment of the activity as a

part of engagement. Previous research comparing engagement and flow, found flow to be similar

to engagement, with WOLF being a better measure of the engagement experience (Rupayana,

2008). The current study supports this finding by demonstrating that enjoyment is indeed an

important and distinct aspect of the experience of engagement. Thus, being invigorated by the

42

work as well as being motivated to work hard at it is separate from perceptions of enjoyment of

academic work. Both contribute to the experience of academic engagement. At the same time,

the fact that effort can be separated from enjoyment is indicative of the fact that highly engaged

people put in effort into the work as well as enjoy the work they do. Effort and enjoyment go

together and just effort is not sufficient to result in high engagement.

This aspect of enjoyment differentiates the SAENS not only from the work engagement

literature but also from the NSSE. The NSSE focuses on student effort in classes. As mentioned

earlier, effort, as measured by time spent in academic tasks is an outcome of engaged students

but is also affected by external factors not controlled by the student, such as hours worked and

family responsibilities. On the other hand, the SAENS focus on student’s desire to invest work

into their classes and the inclusion of students’ enjoyment of academic work, takes it beyond the

NSSE and enhances how student engagement is measured. This has implications for research as

well as practical applications.

Theoretical Implications

Poorly defined and atheoretical constructs threaten understanding of psychological

phenomena. Schoenfeldt (1984, pg 80) states that “the construction of measuring devices is

perhaps the most important segment of any study. Many well-conceived research studies have

never seen the light of day because of flawed measures." It is important to have well developed,

theoretically defined measures that accurately represent these abstract constructs. As we have

discussed, there are many ways in which student engagement has been conceptualized and

measured in the past, however none of these have been particularly well grounded in theory or

focused on the psychological characteristics underlying academic engagement.

The SAENS is strongly grounded in theory by drawing from the preexisting literature in

the area of work engagement. If research is to be conducted on the mechanisms that underlie

student engagement or even to enhance it, one must focus on developing a measure of student

engagement that is grounded in theory. Conceptual bases do exist in the psychology literature in

flow theory (Csikzentmihalyi, 1988), and work engagement (Schaufeli et al, 2002). This measure

fills a gap in the area of assessment of student engagement. Theoretically grounded measures are

also more reliable and valid (Hinkin, 1996).

Second, establishing a link between measurement and theory contributes to the literature.

Now that a link is established between theory and measurement of the construct of student

43

engagement, further work can be undertaken to assess its outcomes and antecedents and to

establish characteristics of engaged students and for enhancing engagement in the classroom.

Third, the current measure is different from other engagement measures, including those

measuring engagement at work by assessing motivation/enjoyment as one of the dimensions.

Previous research by Rupayana & Fullagar (2009) found that both WOLF and UWES are

measures of the same underlying construct. However, engagement usually ignores the aspect of

enjoyment in activities. This measures adds to the evidence, showing that enjoyment of academic

work is indeed an important part of being engaged, and should not be ignored when measuring

and comparing engagement with other variables. This addition of enjoyment can help

differentiate engagement further from other interrelated constructs such as work involvement,

job satisfaction and commitment. All of these have aspect of being involved in the work and

wanting to invest one’s energy into work, but do not emphasize enjoying the work. The

enjoyment facet of engagement can not only make the distinctions between engagement and

other interrelated constructs clearer but also impact research on improving enjoyment which may

be more actionable and direct than trying to improve engagement via desire to expend

energy/effort into work.

Lastly, previous measures of student involvement have focused on assessing outcomes of

student effort, which is indicative of student engagement. At the same time engagement may be

affected by external factors out of student control, such as hours worked, other family

responsibilities, and relationship demands placed upon the student. Developing a student

engagement measure solely focused on the extent of effort students perceived themselves as

making can allow us to assess the processes by which this engagement occurs more clearly. This

contributes to the literature by allowing us to build a network of factors associated with student

engagement. For example, NSSE’s focus on effort, does not allow it to hypothesize the reasons

for lack of engagement, or to understand why this engagement takes place. However, by

focusing on students’ enjoyment and related characteristics of effort can facilitate the

understanding of what aspects of students’ personality, as well as the teaching environment,

contribute to their engagement in academic work.

Practical Implications

Assessment of student engagement has several practical implications as well. Since the

SAENS is grounded in theory, it will be a valid and reliable way to further assess the relationship

44

of student engagement with other factors, allowing us to get to the roots of the causes of

students’ engagement with academic work. Other measures use the outcome of engagement,

such as hours studied, which can be contaminated by other uncontrollable factors, such as: hours

worked and family responsibilities. These factors are becoming more common as the number of

nontraditional students increases. Since the SAENS is a measure of student engagement which

concentrates completely on the students’ levels of enjoyment as well as their desire to put effort

into the classes, using SAENS’ effort and enjoyment facets can allow us to better assess

characteristics of the classroom experience that cause this student engagement. Also, since

SAENS is not dependent upon indicators that are transient and change relatively quickly, for

example, hours studied changes frequently over the course of the semester, enjoyment of the

class and the desire to make the required effort may be more stable, we can use SAENS

longitudinally and assess the nature and variability of student engagement without interference

from external factors that plague measurement of engagement.

At the same time, assessment of the impact of students’ incoming characteristics on their

engagement levels and lead to further dialogue on how to enhance their engagement in academic

endeavors, and development of programs such as the First Year Seminar program that can offer

them that help as well as aim to increase the efficacy of pre-existing programs such as the

academic assistance center.

Also, the newly developed measure and its outcomes can be used as a part of an

assessment toolkit at the departmental level to provide evidence as to the academic engagement

of students in the classes they take as a part of their academic major. The NSSE, when correlated

with the SAENS, can provide interesting results for furthering the academic conversation on

academic engagement and how it relates to overall engagement of students in college life.

Last, the inclusion of enjoyment in academic engagement can be extrapolated to work

engagement. This can further translate into assessment of engagement at the workplace by using

a measure that assesses workers’ enjoyment of their work, and how this can be improved by

changing work and job fit characteristics.

Limitations

A strong point of the current study is that the factor structure of the scale was verified in

two different samples. However, like any other study the current study has certain constraints

and limitations. One possible cause of bias could be monomethod bias. A monomethod bias is

45

said to exist when the same source is used to collect all the information, making the effects an

artifact of the method. A potential monomethod bias was explored. Recent research has asserted

that monomethod bias is exaggerated in the literature and the problem is not as widespread as

claimed (Spector, 2006). However in the present research, monomethod bias was tested for using

Harman’s single factor test. The Harman’s single factor test is one of the most commonly used

techniques for testing the occurrence of common method variance. One can load all variables

into an exploratory factor analysis, with the logic being that if a substantial amount of common

method variance is present a single factor will emerge, or there will be one general factor

accounting for most of the variance (Podsakoff et al, 2003). The present study yielded a multiple

factor solution, with more than one factor accounting for large portions of the variance,

indicating monomethod bias may not be a problem.

Another limitation of the current study is that it is mainly based on results from students

engaged in similar level of seminar classes. At the same time, by studying students in college, we

have already reduced the available range of engagement because completely unengaged students

are not likely to go to college or persist if they do (Kuh, 2009). However by including first year

students in the study, this effect is lesser than when only including upper level students who have

already learnt to persist in college. Also, studying first year students also helps lessen the effect

of students’ preexisting notions about college classes because first year students haven't yet

developed patterns of disengagement or have existing perceptions of college classes.

The final limitation of the current study is that it was limited to a single university and the

validity of the results to other universities, community colleges and other academic settings is

unknown. The dimensions of engagement are expected to remain invariant across samples

because all students or workers experience a certain amount of energy in their work and also

experience a desire to put effort into it. But, this should be established empirically before

generalizing the use of the scale to varied samples. However, overall, the results are promising

and indicate directions for further research.

Conclusion and Directions for future research

To conclude, the current study developed and assessed a new scale of student

engagement called SAENS; which focused on students’ engagement in the classroom. Emphasis

of the study was on development of the scale and assessing its psychometric properties. This

study, however, is the first step of scale development. Hinkin (2005) indicated that scale

46

development procedures such as factor analysis, internal consistency, and test-retest reliability

provide evidence of construct validity, but it needs to be further corroborated by assessing the

convergent and predictive validity of the study. This can be done by demonstrating the existence

of a nomological network of relationships with other variables through criterion-related validity,

assessing groups who would be expected to differ on the measure, and demonstrating

discriminant and convergent validity All of these provide further evidence of the construct

validity of the new measure (Hinkin, 1995).

To this end, in the second part of the current research (study 2), convergent validity, as

well as predictive validity of the student engagement measure, was determined by assessing the

nomological relationship network using known antecedents and consequences of engagement.

These variables and their relationship with engagement and the hypothesis are discussed in the

next study.

47

CHAPTER 6 - Study 2: Validation Study

The next step in the process of scale development, after item generation and scale

construction, is to assess the psychometric properties of the scale by assessing its internal

consistency reliability as well as ascertaining its validity (Hinkin, 1995; 1998). Validity

assessment can take the form of content validation during the item generation process, which

was discussed in the last chapter. Validation can also take the form of construct validity through

criterion related validity. Criterion validity assesses the validity of a measure by demonstrating

the existence of a nomological network of relationships with other variables. Such validation

studies usually focus on specific relationships that were theoretically justified from the literature

(Hinkin, 1998). A similar process was used in this study as well, to validate the SAENS. A

network of relationships is described next.

The Nomological Context of Student Engagement Student engagement has become an important way of assessing universities, providing an

avenue for increased accountability to external sources as well as for internal goal setting and

improvement (Kuh, 2009). One of the reasons for the rise of engagement is that it is strongly

related to student outcomes. Both short term student outcomes as well as long term implications

have been found for engaged students (Kuh, 2009). Engagement acts as an important mediator of

what students take from the college experience. These aspects of engagement can be seen from

the various models of college impact where level of student engagement affects the extent of

college impact (Astin, 1993; Pascarella & Terenzini, 2005).

Pascarella & Terrenzini (2005) in their extensive review of the impact of college on

students, concluded that college has a far reaching impact on multiple areas of an individual’s

life. Change during college takes place in many forms. Learning and cognitive changes occur

across many dimensions including an increase in verbal skills, quantitative skills, specific subject

matter knowledge, speaking skills, written communication, reasoning, critical thinking skills and

understanding of conceptual complexity.

Along the same lines, changes take place in students’ psychosocial aspects (Pascarella &

Terenzini, 2005) in terms of increases in intellectual orientation, autonomy and independence

from family influences. Academic self concepts tend to shift in either positive or negative

directions. Students’ attitudes and values also change to a great extent, with people with college

48

experience more likely to volunteer than non-college goers. College students are also more likely

to have positive attitudes towards racial equality, more awareness of differences amongst

cultures and an increase in promoting racial understanding. However these changes do not take

place in every student or in every college situation, when student characteristics are accounted

for, some of these relationships become smaller (Pascarella & Terenzini, 2005).

College attendance also has a long term impact on students’ life (Astin, 1993, Pascarella

& Terrenzini, 2005). Research has found that having a bachelor’s degree confers a net advantage

of one standard deviation in occupational status, that is, college graduates have more desirable

jobs, also 20 to 40 percent higher earnings and higher returns in investment in a postsecondary

education (Astin, 1993).

However, not all impact on college students is positive or invariant across the board. Rate

of college completion, positive academic self concept, and involvement drops with increase in

institutional size. Student environment also has an effect on psychosocial changes, curriculum

design affects changes in learning as well as critical thinking. Also, not all experiences during

college have a positive impact. Students usually have lower psychological well-being and

experience stress during college (Astin, 1993). The stress and lower levels of well-being during

the college years can be due to a large number of factors such as lack of preparation for college,

problems integrating into college life, low involvement with social, and academic aspects of

college. (Astin, 1993).

All of this implies that change during college is not just a result of attending college but

is made up of many factors which affect students differently. The impact of college can depend

on inputs that students bring to college such as their age,gender, college preparation, as well as

socioeconomic status. These are further complicated by factors including engagement,

institutional characteristics, and peer effects. Engagement plays an important role in determining

students’ experience during college and what they take from it. There are several models of

college impact that emphasize different intervening variables that affect student outcome from

college including engagement and these are discussed next.

Models of college impact fall under several categories. The first of these is

developmental models which assess developmental changes that take place due to attending

college. They focus on identity, moral as well as cognitive development. A second set of models

is concerned with intra-individual origins of student change. These are known as college impact

49

models and focus on a number of variables that affect change during college, such as institutional

factors, student related factors, structural and organizational or environmental factors (Pascarella

& Terenzini, 2005). These college impact models emphasize the role of engagement in the

impact of college on students. Some of these influential models of college impact are discussed

next.

One of the most popular college impact models is the Input Environment Output (I -E-O)

model (Astin, 1984). Input refers to the characteristics of the students when they join the

institution, and includes demographic variables of age, race, gender, as well as previous

academic performance, and experience, social experience, and socio economic status.

Environment refers to the whole range of experiences during college years including interaction

with other students, faculty, university programs, policies, and culture, as well as other off

campus experiences during this time. Outcomes are the resulting students’ characteristics,

knowledge, skills, attitudes, values and beliefs as they exist after college. Inputs shape outputs

directly and indirectly through the engagement with the multifaceted environment of college

(See figure 1).

Figure 6.1: I-E-O model (Astin, 1984)

ENVIRONMENT

FACTORS

Program Personnel

Curriculum Instructor factors

Facilities Institutional climate

Teaching style Extracurricular

activities Organizational

affiliation

OUTPUTS

GPA

Exam scores

Course performance

Degree completion

Course satisfaction

INPUTS

Demographic

Educational Background

Degree Aspirations

Financial Status

Career choice

Field of Study

Life goals

50

At the same time students have varied levels of exposure to college based upon the

amount of time spent in college, and also varied intensity of exposure. Both level of exposure

and quality of exposure vary across institutions. Astin(1993), defines time of exposure as how

long a student stays in college, and intensity of exposure is defined as the quality of college

experience as measured by frequency of interaction with other students and faculty. These two

environmental factors have been studied extensively to assess whether college has a unique

impact on development when the effects of maturation and social change have been accounted

for (Astin, 1993). This implies that change during college does not take place merely because a

person is attending college, it takes place due to the degree of involvement in the college

experience (Pascarella & Terenzini, 2005).

Astin(1984) further emphasizes this by saying that students learn by becoming involved.

As discussed in the first Chapter, this was one of the first definitions of student engagement and

Astin (1984) defines student engagement as involvement. He suggests that learning takes place

due the time spent on a task, as well as by investing energy into the task. He suggests five basic

postulates of student involvement. The first is that involvement requires the investment of

psychological and physical energy; secondly different students will invest varying amounts of

energy in different things. Thirdly, involvement has both quantitative and qualitative features.

Fourthly the amount of learning is directly proportional to the quality and quantity of

involvement, and last, educational effectiveness of any institutional policy or practice is related

to its capacity to induce student involvement. Astin (1984) work assigns the college environment

an important role because it provides students academic and social opportunities to become

engaged with new ideas, people, and experiences. However change depends on the extent to

which the student uses these opportunities.

Student effort and investment of energy in college thus determines the overall impact of

college. If students make more effort in involving themselves with the opportunities provided by

the college environment, change occurs. This view is consistent with Pace’s (1980) view of

quality of student effort, and also led to the CIRP measure of student engagement mentioned in

the first chapter. Other theories also use forms of student involvement as their core process that

ties together student inputs and outcomes from college.

Tinto’s (1993) more complete model of institutional impact focuses more on college

withdrawal process or more positively, retention in a longitudinal fashion. Tinto (1993) asserts

51

that students enter college with a variety of patterns of personal, family and academic

characteristics and skills. These include their initial perceptions and intentions regarding college,

and how college pertains to their goals. These perceptions, intentions and commitment keep

changing over time due to students’ interaction with the college environment which includes

interaction with faculty as well as peers and non college related interactions during this time.

When students have rewarding encounters with formal and informal academic systems, it leads

to greater integration of the student, and thereby to persistence. As integration increases, it

strengthens student’s commitment to their personal goals as well as institutional goals. On the

other hand experiences that are unfavorable, lead to lower commitment to college and

persistence toward goals is lower, and leads to dropping out or attrition. Persistence and

commitment in this model are similar to Astin (1984) involvement (Pascarella & Terenzini,

2005). Integration here is also in terms of intellectual and value integration rather than racial

integration (Pascarella & Terenzini, 2005). Thus effort in the form of persistence is an important

factor in whether an individual completes college or not. Even this model however is rather

conceptual in nature and focuses on academic and social integration in college and not on the

results of this integration, namely, student commitment toward goals, which is the effort they

make to achieve their goals in college. Effort is again a key concept here which is not defined

very clearly but implied in student persistence (Pascarella & Terenzini, 2005). Due to this

implication of student involvement, the Tinto (1993) model has been used frequently to study

variables other than college persistence as it provides more concrete antecedents of the

involvement process than Astin (1984). However, this model is mainly interaction based, with

more emphasis on influence of faculty, peers and family on persistence.

In an even more extensive model of college impact, student effort plays a pivotal role.

Pascarella (1985) suggests that student growth is a result of five main sets of variables. The first

is the students’ background including aptitude, achievement, personality, aspiration and

demographic characteristics. The second is the organizational characteristics of institutions such

as enrollment, faculty student ratio, selectivity and residential characteristics. These two factors

together shape the third factor of institutional environment which affects the fourth factor,

namely interactions with agents of socialization such as faculty and peers. Taken together,

institutional environment, and interaction with peers and faculty affect quality of student effort,

which in turn is responsible for the fifth factor of student learning and cognitive development. Of

52

the five factors involved in student development and learning, student effort is one of the factors,

as noted in Chapter 1, in the student engagement literature, effort is used as a proxy for

engagement.

All of the above models focus on different inputs and outcomes from college, however

they have some similarities. First, engagement is the common intervening factor in all of the

above models. Another common factor in all of the above models is that students come to

college with certain attributes, which may or may not be changeable. These attributes include

gender, race, previous academic history, socioeconomic status, family education background,

that is, whether they are first generation college student as well as enrollment patterns. All of

these variables have been found to affect students' engagement in college (Kuh et al, 2006).

First generation students tend to be less engaged, due to lesser experience with college

environments and related activities and behaviors. Socioeconomic status influences prior

academic preparation and it has been shown that high school academic preparation affects

students' persistence in college. Also students who did well in high school are most likely to do

well in college, with high school grades acting as a strong predictor of college grades. If

students are from families with college education, they are likely to have higher postsecondary

ambitions and have greater likelihood of persisting through college. Student's expectations about

the college experience also affect how engaged they are in college. When students have

expectations about involving themselves in academic activities they are more likely to do so than

are students who begin with a low expectation from college. These factors, however important,

cannot be modified and have to be worked with (Kuh, Kinzie, Bukley, Bridges, & Hayek, 2006).

Therefore the first task of this study was to assess the extent to which these demographic

variables affect student engagement in academic endeavors. To this end, it was hypothesized:

HYP 1a: Gender has no effect on engagement effort

HYP 1b: Gender has no effect on engagement enjoyment

HYP 2a: Student’s status as the first generation to go to college has no effect on

engagement effort

HYP 2b: Students’ status as the first generation to go to college has no effect on

engagement enjoyment.

53

Another important common factor in the Astin (1984), Pascarella (1985), and Tinto

(1993) college impact model is the specific role that the college environment plays in creating

student outcomes. Institutional characteristics such as policies, programs, and services, as well as

the attitudes, values, and behaviors of those who exist in these environments, dictate the amount

of student participation which in turn defines what outcomes they would get from college. A lot

of attention is paid to the inputs students bring, such as student differences due to gender (Astin,

1993), race (Weidman, 1989), and socioeconomic characteristics (Astin, 1993). The differences

between student change due to these characteristics is empirically established (Pascarella &

Terenzini, 2005). However relatively little attention has been paid to the complex mediating

factors such as student effort, or involvement and persistence. These factors when manipulated

by institutional characteristics can have a high impact on student outcomes, such as retention,

student well being, and quality of life, academic achievement, and satisfaction with college

(Astin, 1993, Pascarella & Terenzini, 2005), and are therefore important to assess. As the current

study is based on a single institution, these factors cannot be assessed, however, these factors do

impact students’ engagement and are therefore discussed briefly below.

Research has shown that student engagement is affected by institutional selectivity

(Porter, 2006). Selectivity of institutions is viewed as a measure of average student quality; so

the more selective the institution, the higher the student quality. Engagement is hypothesized to

be higher at institutes that are more selective due to peer effects (Porter, 2006). Other studies on

selectivity and engagement have shown that when other factors are controlled for, the effect of

selectivity is minor and accounts for less than 2% of the variance in student outcomes (Ewell,

2002). Student body size, measured using the Carnegie classification, has suggested that size is

associated with negative outcomes because as size increases the number of people in a setting

also increases, resulting in redundancy in which the number of people outnumber the

possibilities for interaction and selectivity is also reduced. Hu & Kuh (2002) found that students

are less engaged at research universities and more engaged at liberal arts colleges. This is

attributed to the fact that at research institutes faculty spend more time in research than in student

interaction, therefore reducing overall student interaction and thereby engagement is also

reduced (Porter, 2006). Students’ perception of their college’s emphasis on practical and

vocational matters decreased engagement (Hu & Kuh, 2002). Perceptions of value placed by

54

institutions on scholarship and intellectual activities increased students’ engagement in scholarly

activities (Hu & Kuh, 2002).

However, in spite of the above research, the overall conclusion from extensive research

in this area is that student engagement varies more within an institution than amongst

institutions, indicating that engagement can be manipulated in the classroom (Porter, 2006; Kuh

et al, 2006). At the same time, one of the strongest predictors of student effort and engagement is

student faculty relationships and interaction as well as faculty teaching styles which are a part of

the institutional environment. For example, full time students, students who live on campus are

more likely to be engaged because they have more access to faculty members, other peer

interaction as well as institutional resources (Kuh, Kinzie, Buckley, Bridges, & Hayek, 2006).

Students have been found to be the most engaged when teachers structure and organize

class time well, are clear in their explanations, present the subject matter unambiguously, avoid

vague terminology, have a good command over the subject matter and are enthusiastic about it as

well as share a good rapport with students (Pascarella & Terenzini, 2005). Researchers have also

pointed out that students’ perception of teacher behaviors is correlated with student’s knowledge

acquisition. In a meta-analytic study by Feldman (1997), it was found that stimulation of interest

in the subject matter is correlated with student learning as well as perception of instructor,

indicating that if students perceive teachers positively, they are more likely to be interested in the

subject matter and therefore to learn more. Wood & Murray (1999) found that teacher

enthusiasm, interest in the subject matter affected students’ learning through motivation to learn.

Motivation and interest are all aspects of engaged students, therefore faculty interactions affect

student engagement.

Apart from affecting student engagement in terms of learning and motivation, faculty

interaction also affects students' persistence in college. Student persistence is related to the extent

to which students interact with faculty both inside and outside the classroom (Kuh, 2003). They

are also likely to benefit from mentoring by faculty members, which has been found to positively

impact persistence for minority students. Faculty criticism of written work is also associated with

students' time spent on academic activities due to the feeling of challenge generated by negative

criticism. Also high expectations of performance, and holding students accountable for reaching

their goals characterize institutions with higher levels of engagement (Kuh et al. 2006). Faculty

members provide appropriate challenge and support to students when they communicate high

55

standards to students and provide timely and apt feedback and support to meet their students’

needs (Kuh et al. 2006). Faculty members also improve engagement by encouraging students to

collaborate and work together. Active and collaborative learning approaches feature three

elements that matter to student learning: involving students, increasing their time on task and

taking advantage of peer influences (Kuh et al. 2006). Students learn better when they are

intensely involved and asked to apply what they have learnt to different settings. Students have

reported higher levels of attention, effort in classes which required them to report on their

progress. It has also been found to have some compensatory effects for lower ability students as

well. To sum, Kuh et al (2006, pg 67) state "student-faculty interaction is important because it

encourages students to devote greater effort to other educationally purposeful activities. Both the

nature and frequency of the contacts matter…" . Therefore student perceptions of faculty or

instructors are important, because these interactions and teaching style enhance student

engagement. One way of assessing students’ perception of teachers is using teaching evaluations.

From the above it was hypothesized that teaching style and interaction with faculty as measured

by IDEA teaching evaluations would affect students’ engagement as measured by the SAENS:

Hypothesis 3a: Stimulating students’ interest predicts higher effort

Hypothesis 3b: Stimulating students’ interest predicts higher enjoyment.

Hypothesis 4a: Establishing rapport with students predicts higher student effort.

Hypothesis 4b: Establishing rapport with students predicts higher student enjoyment.

Hypothesis 5a: Structuring classroom experiences predicts higher student effort.

Hypothesis 5b: Structuring classroom experiences predicts higher student enjoyment.

Hypothesis 6a: Encouraging student involvement predicts higher student effort.

Hypothesis 6b: Encouraging student involvement predicts higher student enjoyment.

Hypothesis 7a: Fostering student collaboration leads to higher student effort

Hypothesis 7b: Fostering student collaboration leads to higher student enjoyment.

The most direct way to assess the above aspects of student and faculty interaction is to

ask students about their perception of their instructors’ teaching style. To this end, the Individual

Development and Educational Assessment (IDEA) student evaluation instrument was used to

assess perceptions of students on factors like stimulating interest, structuring classroom

56

experiences and encouraging student involvement as well as fostering student collaboration. This

teaching evaluation survey is described in the methods section.

Outcomes of Engagement

Outcomes from college can be short term and long term as well. Short term outcomes

include learning, employment, graduate and professional school. Long term outcomes of college

attendance include quality of life, economic status and lifelong learning (Pascarella & Terenzini,

2005). One indicator of whether these gains from college will occur or not is students’ grade

during college (Pascarella & Terenzini, 2005).

Grades are the best predictors of student persistence, degree completion and graduate

school enrollment (Pascarella & Terenzini, 2005). Engagement and grades have been found to be

strongly related. GPA is positively related to all benchmarks of the NSSE, including the

benchmarks related to academic engagement (Kuh, Kinzie, Buckley, Bridges, & Hayek, 2006).

For example, GPA is associated with time spent preparing for class, asking questions in class,

maintaining high quality relationships with the faculty members as well as with having a

favorable evaluation of overall educational experiences (Kuh, Kinzie, Buckley, Bridges, &

Hayek, 2006). It can be assumed from the above research that students with high levels of

engagement in academic activities will have a high GPA when previous academic achievement

is controlled for. Therefore, GPA should be predicted by the SAENS.

Hypothesis 8a: Effort predicts GPA, even when high school GPA is controlled.

Hypothesis 8b: Enjoyment predicts GPA, even when high school GPA is controlled.

Another critical outcome of engaged students is learning and learning is also the goal of

college. Learning assessments are made in several forms, by assessing students’ grades, their

scores on tests of knowledge and thinking, their scores on tests of specific subject matter as well

as their admittance into institutes of higher learning through the GRE is assumed to be a result of

learning during the undergraduate years (Klein, Kuh, Chun, Hamilton, & Shavelson, 2005).

One such important aspect of learning is developing critical thinking, which is a more

general intellectual or cognitive skills, not tied to any subject matter, yet deemed to be an

important aspect of postsecondary education (Pascarella & Terenzini, 2005). Critical thinking is

defined in many ways. Common to these definitions is the focus on an individual’s capacity to

57

identify central issues and assumptions in an argument, recognize important relationships, make

correct inferences from data, derive conclusions, interpret whether conclusions are warranted and

make self corrections and problem solve (Erwin, 1997). Research has shown that students’

critical thinking skills increase during their time in college. One longitudinal study by Facione

(1997) that traced students from their sophomore year through their senior year reported an

average gain of .15 of a standard deviation. Other studies found similar results, reported gains are

in the range of .15 to .37 of a standard deviation (Mentkowksi, 2000; Pascarella, Edison,

Hagedorn, Nora & Terenzini, 1998). Thus attending college increases students’ cognitive skills,

specifically their critical thinking. One factor that affects this relationship is students’

involvement with academic activities, that is, their engagement. Pascarella & Terenzini (2005)

further emphasize this by saying “how much students learn is determined to a great extent by

how much personal effort and time they are willing to invest in the process of learning” (pg 186).

Studies on factors influencing critical thinking during college, found that factors such as

hours studied, number of unassigned books read as well as academic effort and involvement

significantly predicted gains in critical thinking at the end of their first year in college (Terenzini,

Springer, Yaeger, & Nora, 1996). This was true even when factors such as pre-collegiate levels

of critical thinking, student demographics, hours worked, and enrollment status (full time or part

time) were controlled for (Terenzini et al, 1995). Another study on reflective and judgmental

thinking found similar results (Kitchener, Wood, & Jensen, 1999). Students’ gains were linked to

their active involvement in learning experiences. This included dimensions such as involvement

in writing experiences, and engagement in course learning. May (1990) found that gains in

intellectual skills were strongly related to students’ efforts in the use of the library, writing

experiences as well as engagement in courses. More recently, Carini & Kuh (2003) used NSSE

data to find that student academic engagement and effort are linked to GRE scores as well as

measures of general cognitive development, even when SAT scores are controlled for.

At the same time a number of studies have found positive correlations between cognitive

complexity outcomes and the quality of relationships between students and faculty. Wilson et al.

(1975) reported that seniors who spent the most time with faculty outside of class also exhibited

the greatest gains in cognitive outcomes (Pascarella and Terenzini, 2006). Kuh (2009) reported

that twenty five percent of the gains in cognitive complexity were associated with academics and

faculty contact. In general, students reporting greater gains in cognitive development are those

58

who (a) perceive faculty as being concerned with teaching and student development, (b) have

developed a close, influential relationship with at least one faculty member. Since we have

already established that faculty perceptions and involvement affect students’ engagement, it can

be assumed that student engagement will affect critical thinking as well.

From all of the above it can be concluded that engagement is a significant factor in

students’ critical thinking with more engaged students showing higher levels of critical thinking.

Therefore critical thinking should be related to the SAENS.

Hypothesis 9a: Effort predicts scores on critical thinking.

Hypothesis 9b: Enjoyment predicts scores on critical thinking.

To assess critical thinking, scores on the Collegiate Assessment of Academic Proficiency

(CAAP) will be used. CAAP is a well established measure of critical thinking and is used

frequently to assess the same. It is described in more detail in the methods section.

As mentioned earlier, an important aspect of establishing the validity of a scale is to

assess its convergent validity as well as incremental validity in predicting outcomes. To this

purpose, the SAENS was compared to NSSE effort items. If SAENS effort measures student

effort, then it should be related to an established measure of the outcomes of student effort, such

as the time students invest in academic work, as measured by the NSSE. Also, the incremental

validity of SAENS in predicting grades over and above that of NSSE was also assessed.

To summarize, student engagement is affected by several factors, some are factors that

cannot be changed, such as gender, race, socioeconomic status and institutional factors such as

selectivity, size and other policies. Institutional factors that can be modified include faculty

student interaction and perceptions of which have been found to be a strong predictor of student

engagement. At the same time, student engagement predicts students’ grades, their cognitive

development in terms of their critical thinking skills. Since all of this should also hold true for

the SAENS, the confirmation of the hypothesis laid out in the above literature review can further

establish the construct validity of the SAENS.

59

CHAPTER 7 - Study 2: Method

Recently an increasing amount of attention is being directed towards student achievement

in college, and it is thought that student outcomes are dependent on student experiences during

their first year in college (Pascarella & Terenzini, 2005). To this end, Kansas State University

initiated a First Year Seminar (FYS) pilot study in Fall of 2008. The purpose of the FYS program

is to help students make transitions into university courses and college level learning. Therefore

these courses focus on developing the skills (intellectual and communication) that students need

to do well in college.

The FYS program enrolls only first year students and each seminar is a special version of

a regular general education class. The FYS classes emphasize critical thinking, communication,

community building, and the application of learning. Enrollment is limited to 22 students in each

class. It is however, random and students can be enrolled only in one FYS pilot class. FYS

classes encourage active learning and activities that encourage development of critical thinking

and communication skills. The data for this study came from the FYS classes from Fall 2008 and

Fall 2009. The participants, procedure, and methods used are described in more detail in the next

section.

Participants and Procedure

Participants in this study were students enrolled in small first year seminar classes in Fall

2008 and Fall 2009. In 2008, from the 283 students enrolled in 16 classes, 264 completed

surveys were returned, with a response rate of 93%. The demographic information can be seen in

Table 3.1. The sample had 63.9% females and was 84% Caucasian. Median age was 19 and

ranged from 18 to 27. This sample was also used as the initial sample for the SAENS in study 1.

The Fall 2009 administration saw an overall drop in the response rate, with 280 out of

406 students responding, yielding a response rate of 68.9%. 70.6% of the sample was female,

88.9 % was Caucasian. Age was fairly uniform with a mean of 18.65, median of 18 and ranged

from 17 to 22. More details of these statistics can be seen in table 7.1. The data from the two

administrations was aggregated, yielding a final sample size of 452.

60

Table 7.1: Demographics, Breakdown of Gender by Class for Fall 2009

Class N

Female % Male %

1 Introduction to Literature 12.0 75.0 25.0 2 American Literature 13.0 100.0 0.0 3 Insects and People 7.0 42.9 57.1 4 World Regional Geography 11.0 63.6 36.4 5 Honors/Introduction to the Humanities 16.0 56.3 43.8 6 Honors/Introduction to the Humanities 14.0 92.9 7.1 7 Honors/Introduction to the Humanities 7.0 57.1 42.9 8 Introduction to Women’s Studies 12.0 91.7 8.3 9 Honors/Ag Econ/Agribusiness 7.0 100.0 0.0 10 American Literature 12.0 41.7 50.0 11 Great Books 22.0 90.9 9.1 12 Introduction to Political Science 11.0 36.4 63.6 13 Introduction to Human Development 15.0 86.7 13.3 14 Natural Disasters 11.0 63.6 27.3 15 Introduction to Literature 7.0 42.9 57.1 16 Honors English 15.0 60.0 40.0 17 Introduction to American Ethnic Studies 14.0 64.3 35.7 18 Introduction to Sociology 12.0 58.3 33.3 19 Mass Communication in Society 11.0 63.6 36.4

N=280

Measures Used

Engagement Measure: The student engagement survey called SAENS (Student Academic

ENgagement Scale) developed in study 1 was used for this study. As reported earlier, the scale

was found to have two dimensions of effort and enjoyment, with effort consisting of five items

such as “ I want to learn the skills needed for this class” and enjoyment contained four items,

such as “ I am usually eager to go to this class.” As in the first study the scales were found to

have a high reliability with α for effort and enjoyment at .83 and .85 respectively.

Grades: Students’ grades for the same course as the engagement survey were obtained.

Their overall GPA at the end of the semester, as well as high school GPA, were obtained from

the Office of Assessment. Grades are on a four point scale, with an A grade in a course

indicating four points, B equaling three, a C grade worth two points, D indicating one point and

F equaling zero points for the course.

61

The Individual Development Evaluation Assessment (IDEA): It was developed in 1975

by Hoyt to study student evaluations of their instructors’ teaching styles. Students are asked to

indicate how frequently their instructor uses each of 20 teaching methods, using a scale of 1 =

Hardly Ever, 2 = Occasionally, 3 = Sometimes, 4 = Frequently, and 5 = Almost Always.

Teaching style refers to a combination of teaching methods. The teaching styles are further

divided into five categories. First is Stimulation of student interest. Faculty members who have

high scores on this dimension spend time and effort enlisting student interest and curiosity. They

try to establish an atmosphere that gets students excited about the subject matter. Items include

"stimulated students to intellectual effort, inspired students to set and achieve goals which

challenged them.”

Second is fostering student collaboration. Teachers scoring high on this scale find ways

for students to learn from each other. Items include "formed teams or discussion groups to

facilitate learning”, “asked students to share ideas and experiences with others.”

Third is establishing rapport. High scorers on this scale communicate caring through

establishing relationships with their students which encourages student effort and commitment.

Items include "displayed a personal interest in students and their learning", "encouraged student

faculty interaction outside of class.”

The fourth factor is that of encouraging student involvement. High scores on this factor

indicate that the instructor encourages students to become personally involved with the subject

matter and the classroom atmosphere emphasizes problem solving. Items include "encouraged

students to use multiple resources", " related course materials to real life situations.”

The last teaching style is that of Structuring classroom experiences. High scores are

characteristic of teachers who organize and plan their classes to facilitate student learning. Items

include "made it clear how each topic fits into the course", " explained course material clearly

and concisely.”

The reliabilities of the scales range between .78 to .94 (Hoyt & Lee, 2002). The

reliabilities were at a similar level with Cronbach’s alpha for stimulating interest, structuring

classroom experience, fostering student involvement, collaborative learning, and establishing

rapport ranging between .80 to .91 (see Table 7.2). These 5 subscales were utilized for the

current study.

62

Students also responded to additional questions about the course that pertain to the

relative amount of reading required, the relative amount of work in (non-reading) assignments,

and the relative difficulty of the subject matter. Other questions addressed their desire to take the

course, their effort, and their attitude about the field of study as a result of taking the course.

They also rated the overall quality of the teacher and the overall quality of the course. Finally,

students respond to additional questions regarding their typical effort in a class, the instructor’s

teaching methods and expectations, and to what extent the instructor used educational

technology. There is also space provided for students to write open-ended comments about the

class and instructor.

Table 7.2: IDEA scores means (M), Standard Deviations (SD) and Reliabilities (α) Across Classes.

IDEA teaching Style Mean SD Minimum Maximum α

1 Establishing Rapport 17.30 1.51 13.88 19.75 .80

2 Initiating Structure 21.99 1.80 18.21 24.85 .79

3 Stimulating Interest 16.90 1.74 13.68 19.80 .81

4 Collaborative Learning 12.32 2.06 7.00 14.90 .81

5 Encouraging Involvement 16.45 1.90 12.83 19.65 .76

Collegiate Assessment of Academic Proficiency (CAAP): CAAP is the standardized

assessment program from ACT. CAAP has 6 independent test modules which include writing

skills, mathematics, critical thinking, writing essay, reading and science tests. In the current

study scores from the CAAP critical thinking section was utilized. This Critical Thinking Subtest

consists of a 32-item, multiple-choice test that measures students’ skills in clarifying, analyzing,

evaluating, and extending arguments. The Critical Thinking test consists of four passages that are

representative of the kinds of issues commonly encountered in a college curriculum. Each

passage presents one or more arguments in a variety of formats, including case studies, debates,

dialogues, overlapping positions, statistical arguments, experimental results, or editorials. Each

passage is accompanied by multiple choice questions and an overall critical thinking score is

63

returned. A standard score is reported on a scale that ranges from 40 to 80, with a mean of 60 and

standard deviation of 5. A sample passage and items can be seen in Appendix B.

National Survey of Student Engagement (NSSE). The Fall 2009 student sample was also

asked to complete parts of the National Survey of Student Engagement. Some of the questions

from the NSSE were included in the survey to assess the incremental validity of the SAENS over

the NSSE in predicting student grade. Therefore, only the NSSE items pertaining to student

effort were used. NSSE is a measure of overall college experience and since the focus of this

survey was engagement in a specific class, not all the NSSE items were included. Items from the

NSSE measuring student effort in their studies and class characteristics were modified and

utilized for this research. Specifically, questions one through four were modified to query

students about the class rather than all the classes they were taking.

Although the original NSSE survey asks participants about all their classes for the current

semester, the instructions were modified to ask them about this specific FYS class. The first

question consisted of five items measuring effort in class in terms of assigned and unassigned

books read for class and papers written for class. The second question queried amount of time

spent on homework given for the class. The third question measured amount of challenge

experienced in examinations for the class on a 7 point likert scale where 1= “very little

challenge” and 7=”Very much challenged”. Question four contained 5 items that measured effort

expended for class through frequency of in class activities such as “making a class presentation”

on a 4 point likert type scale where 1= “Never” and 4= “Always”. Exact items used in the

survey can be seen in Appendix C. The above effort items in the NSSE survey were used to

assess the validity of the SAENS effort items.

Procedure

The study was conducted in two parts. Students enrolled in First Year Seminar courses

for Fall 2008 and 2009 were approached for this study. For the 2008 administration, students

were asked to complete the SAENS on paper, during class, in the last month of classes. Students

in the Fall 2009 administration were given the survey online during the last month of classes.

Emails were sent to students to solicit their participation. Instructors were asked to inform

students about the upcoming survey and to encourage participation.

Participation in both samples was voluntary. Students were not penalized for deciding to

opt out of the survey or for leaving questions in the survey unanswered. Students were asked for

64

their student ID number so that the information from the survey could be matched with

demographic information collected separately. Instructions were read out to the Fall 2008 sample

and were provided to the students in the online administration and can be seen in appendix A.

Students from both samples were given the CAAP in the first half of the semester as a

part of a larger university assessment project. Respondents from each class were randomly

chosen for the CAAP, thereby reducing the sample available for evaluating the effect of

engagement on critical thinking. CAAP scores were provided by ACT to the Office of

Assessment as well as other information for the students including their grades for the course,

grades for the semester, high school GPA was also obtained from this office.

Students routinely evaluate their instructors at the end of the semester. In the current

study, IDEA evaluations of instructors were utilized. Since the current study was part of a larger

study, it was possible to obtain instructors’ permission for use of their IDEA raw data. This data

was obtained from the Office of Advancement of Learning. Both Fall 2008 and Fall 2009

students’ IDEA assessments of their instructors were obtained.

Student evaluations are usually conducted anonymously, and permission could not be

obtained to do so otherwise. Due to this, students’ individual responses could not be associated

with their respective demographic and SAENS information. However, research shows that

students’ evaluations of their instructors remain unchanged during the course of the semester,

and instructors’ behavior also remains fairly uniform towards a class (Kuh, 2003). At the same

time, the main interest of the study was to assess instructors’ teaching strategies and how it

affects their students. Since these remain uniform for the whole class, it was decided that

aggregating information for a class and to assess engagement at the group level was the best

alternative and aggregated IDEA scores for each class were utilized.

NSSE items measuring student effort, namely, questions 1 through 4, were added to the

survey for the Fall 2009 administration, and students answered these questions along with the

other SAENS items to further assess the incremental validity of SAENS over NSSE in predicting

grades.

Analysis

A variety of analyses were utilized to test the relationships amongst the variables. First,

the effect of demographic information on engagement was tested using an ANOVA test.

65

Specifically, the relationship between gender and engagement as well as the relationship between

being a first generation student and engagement were tested using ANOVA.

The second set of predictors of engagement were the IDEA scores for each class. Since

student evaluations are usually conducted anonymously and permission could not be obtained to

do so otherwise, information from the IDEA was aggregated for each class, and Hierarchical

Linear Modeling was used to assess the differences between the groups. HLM 6 was used for

this purpose. Hypotheses 3 through 7 were assessed using this methodology. Hierarchical Linear

Modeling (HLM) is an analytic method used for multi-level data and originated from educational

research where students are nested within classes (Hofmann, Griffin, & Gavin, 2005). Similarly,

students in this analysis are nested within classes, and group level instructional styles (Level 2)

as measured by IDEA are expected to affect students’ level of engagement (Level 1).

To assess effect of engagement on grades as well as on critical thinking, regression

analysis was utilized. This is a common method used to assess relationships between variables.

Also the sample size for the critical thinking scores was smaller than that for the rest of the

analysis (n= 155), as students from each class were randomly selected to participate in the CAAP

data collection. This meant that relationship of critical thinking could not be examined as a part

of the analyses for the outcomes of engagement. Therefore, the effect of engagement on critical

thinking was observed using regression separately from the effect of engagement on grades.

Another separate analysis was conducted on the Fall 2009 sample to assess the

differences between the SAENS and the NSSE in their relationship with student grades. This was

done simply by assessing the various correlations between NSSE and SAENS items as well as

the magnitude of their correlation with grades. Results from these, the HLM model and the

regression analyses are further described in the results section.

66

CHAPTER 8 - Study 2: Results

First, the data from the two administrations was merged. Prior to analysis, the negatively

worded items were reverse scored and the reverse scored items were used in the rest of the

analysis. First, the data was examined for data entry errors and the means of the variables were

examined to check for the same. Data entry errors were corrected and the data was analyzed for

missing data. Missing data was minimal, less than 5% of the data points were missing, and cases

with missing values were deleted from the analysis. Once this was done, assumptions of the

General Linear Model were tested and the results are described next.

The data was tested for multivariate outliers. This was done by finding Mahalalobis

Distance for all variables of interest. Five multivariate outliers were found (D (6)>= 22.46,

p<.001), however their Cook’s distance was less than one, indicating that they did not have

much influence on the derivation of the regression line (Tabachnick & Fidel, 2001), and the

decision was made to keep them in the analysis.

Skewness was tested by comparing the ratio of skewness to the standard error of

skewness to determine significance. Some variables had significant skew. However, since

students do have a certain level of engagement in their classes, some skew had been expected.

Negative skew was also present in high school grades and class grades. This was also expected

due to a restriction in GPA (usually higher) for students who go to college, and overall small

sample size of the classes which restricted the type of grades students got, skewing it negatively.

Since the standard error of skew is a conservative estimate, the effect of skew was examined

using frequency histograms as well as normal probability plots and detrended expected

probability plots. Examination of the p-p plots showed that all items lined up against the

diagonal, indicating low deviation from normality. Therefore, variables were not transformed, as

they did not affect the analysis. Additionally, examination of the bivariate scatterplots showed no

instances of nonlinearity.

No instances of multicollinearity were found. Multicollinearity is indicated by high

correlations between variables and low tolerance. As can be seen from table 8.1, none of the

measures had correlations over .90. Multicollinearity diagnostics were also computed, tolerance

levels were found to be acceptable, none of the conditioning indices exceeded 30, and no

67

variance proportions were over .50, further confirming absence of multicollinearity. The above

tests yielded a final sample of 452 students with scores on all variables.

Table 8.1: Means (M), Standard Deviations (SD) and Correlations for Variables in Study 2

Variables M SD 1 2 3 4 1 Enjoyment 3.66 0.90 .83 2 Effort 3.65 0.76 .81** .80 3 HS GPA 3.51 0.44 -.04 -.01 -- 4 Course Grade 3.28 0.91 .16** .20** .51** -- 5 Critical Thinking a 63.35 4.89 .02 0.03 .32** .39**

N= 452, ** p<.01, bolded terms are reliabilities for the scales. a Sample size for critical thinking =155

Descriptive Statistics

Means and correlations were calculated for all the variables and can be seen in table 8.1.

Sample size was smaller for critical thinking scores (n=155), and scores ranged from 35 to 76

with a mean of 64. The mean of the engagement dimension of enjoyment was 3.66, close to the

midpoint of the scale. Effort showed a similar effect with a mean of 3.65. Mean of students’ high

school GPA was at 3.5 with a minimum of .68 and a maximum of 4.0, indicating that on the

average students had high GPA with maximum grades in the range of A’s and B’s. Students’

course grades were at a similar level with a mean of 3.2, and ranged from 0 (F) to 4.0 (A).

Zero order correlations were also computed and showed a significant correlation between

course grade and high school GPA, indicating that students who did well in high school also did

well in their classes during college (r= .51, p<.001). At the same time, a significant correlation

was observed between effort and course grade (r = .20, p<.001). A significant but smaller

correlation was observed between course grade and enjoyment (r= .16, p<.001). As expected,

engagement had a minimal, non significant correlation with high school GPA. Critical thinking

also showed low and non significant correlation with students’ effort and engagement scores.

However, students’ high school GPA was correlated with their critical thinking scores (r= .39,

p<.01). A separate table, Table 8.2, shows the relationships between the various NSSE items

and the SAENS survey. Results indicated that NSSE effort, question 5, shows a significant

correlation with the SAENS effort items (r=.44, p<.01) as well as the SAENS enjoyment facet

(r=.43, p<.01).

68

Table 8.2: Means(M), Standard Deviations(SD) and Correlations for the SAENS and NSSE Items

Variables 1 2 3 4 5 6 7 8 9 10 11 12 13 1 Q. 5 NSSE effort composite --

2 SAENS enjoyment .43** .83 3 SAENS effort .44** .85** .80 4 Class Grade -.02 .15* .15* -- 5 Q 1.1 assigned readings -.02 .05 .04 -.01 -- 6 Q 1.2Non assigned readings .13* .15* .12 .06 .19** -- 7 Q 2>20 pg reports -.02 .05 .01 -.09 .04 -.02 -- 8 Q 2.2 reports between 5-19 pgs -.05 -.08 -.04 .10 .07 .09 .06 -- 9 Q 2.3 <5 pages reports .04 .10 .11 -.03 .01 -.04 -.01 -.12 -- 10 Q 3.1homework > 1 hour .11 .06 .05 .04 .14* -.00 -.04 .19** .20** -- 11 Q 3.2 homework < 1 hour .11 .04 .09 .08 .06 .05 -.02 -.05 .20** .31** -- 12 Q 4.1challenge in examination .32** .38** .40** .05 0 -.03 .04 .00 .06 .25** .07 -- 13 Q 4.2 time spent preparing for

class .24** .23** .22** .06 .34** -.03 -.07 .17* .07 .23** .01 .32** --

N= 280

* p< .05, ** p< .01

69

Hypothesized Findings

Predictors of Engagement: First, the relationship between the demographic variables and

engagement was tested and the results can be seen in Tables 8.3 and 8.4. A oneway ANOVA

assessing the difference between genders in enjoyment of classes was not significant (F(1, 415)=

1.19, p = .28). However, the effect of gender on effort was significant (F(1, 415)= 6.19, p=.01),

with women showing slightly higher effort (M= 3.69, SD= .77) than men (M= 3.50, SD=.75).

Therefore, Hypothesis 1a was found to be true, namely gender has no effect on students’

enjoyment of their classes. Hypothesis 1b was found to be false, indicating that gender has a

significant effect on students’ effort in their classes.

Table 8.3: ANOVA Comparing Effect of Gender on Engagement

Sum of Squares df Mean

Square F

effort Between Groups 3.61 1 3.61 6.19**

Within Groups 241.28 414 0.58 Total 244.88 415 enjoyment Between Groups 0.99 1 0.99 1.19

Within Groups 345.81 415 0.83 Total 346.80 416

N= 452; **p < 0.01

The effect of whether the individual was first generation to go to college or not was not

significant for both effort (F= (1,415) = 1.19, p = .29) and enjoyment (F= (1, 415) = .477, p=

.490), thereby proving Hypothesis 2a and 2b, namely, being a first generation student has no

effect on students’ level of effort and enjoyment.

Table 8.4: ANOVA Comparing Effect of First Generation to Go To College on Effort and

Enjoyment

Sum of Squares df

Mean Square F

Effort Between Groups 0.64 1 0.64 1.12

Within Groups 251.71 440 0.57

Total 252.34 441 Enjoyment Between Groups 0.39 1 0.39 0.48

Within Groups 358.81 441 0.81

Total 359.20 442 N= 452

70

Next, the relationship between the instructor teaching styles and engagement was

assessed using hierarchical linear modeling (HLM). Before testing the hypotheses, systematic

within and between group variances in the ratings of student engagement were investigated. As

can be seen from Table 8.5, the results from these null models indicated that there was more

between group variance( denoted by τ) than within groups (denoted by σ2 ) in effort (σ2= 10.79,

τ= 3.18) as well as enjoyment (σ2= 9.08,τ = 3.82). Interclass correlations (ICC) were calculated

using the σ2 and τ .

ICC = 𝜏𝜏/(𝜏𝜏 + 𝜎𝜎2 ) (1)

This indicated that 22 % of the variance in effort was between groups, and similarly, 30%

of the variance in enjoyment was between groups. The chi-squared test of the between group

variance indicated that between groups variance was significant for enjoyment (χ2 = 200.71,

p<.001) and effort (χ2= 159.82, p<.001). This fulfilled the primary requirement for the HLM

analysis, that there be variation in the criterion variables (effort, enjoyment) at the group level.

Table 8.5: Parameter Estimates and Variance Components of Null Models Tested

Model Equations γ00 γ 00 σ2 τ00

Null Model I

Effortij= β0j+ rij 18.30 -- 10.80 3.18**

Enjoyij= β0j+ rij 14.74 -- 9.08 3.82**

Β0j = γ00 +U0j

β0j is the average level of effort/enjoyment for individual j; γ00 is the grand mean of effort /enjoyment scores; σ2 = var (rij), the within-group variance in effort/ enjoyment; τ00 = var(U0j) the between group variance in effort/enjoyment

**p<.01

In the next step, the 5 dimensions of IDEA were added to the analysis to see whether (1)

student faculty relationships, (2) initiating structure in the classroom, (3) stimulation of student

interest, (4) collaborative learning, and (5) encouraging student involvement, are significantly

related to effort. Basically, using HLM the following equation was tested:

71

β0j = γ00+γ01(rapport) + γ02(structure) + γ03(interest) + γ04(collaboration)+γ05(involvement)

+ U0j (2)

Where γ00 = intercept of level 2 regression predicting β0j, γ01 - γ05 = slopes of level 2

regression for each IDEA teaching style predicting β0j. σ2 = variance in level 1 residual (ie

variance in rij). τ00 = variance in level 2 residual for models predicting β0j (ie variance in U0j)

As can be seen in Table 8.6, none of these were significant predictors of student effort. A

similar model was computed for enjoyment and results (see Table 8.7) indicated that only

collaboration was significantly affects enjoyment (γ01= 0.29, t= 2.19, p<.05).

Table 8.6: Parameter Estimates and Variance Components of Substantive HLM Model

Testing the Relationships for Effort and IDEA Teaching Styles

Model Equations Intercepts as outcomes

L1: Effortij= β0j + rij

L2: β0j = γ00+γ01(rapport) + γ02(structure) + γ03(interest) + γ04(collaboration)+γ05(involvement) + U0j

γ00 γ01 γ02 γ03 γ04 γ05 σ2 τ00

One way analysis of variance 18.30 -- -- -- -- -- 10.80 3.18

Intercepts as outcome model 8.51 -0.37 0.19 0.18 0.68 0.21 10.8 2.41

Note: the regression coefficients presented are not standardized

γ00 = intercept of level 2 regression predicting β0j, γ01 - γ05 = slopes of level 2 regression for each IDEA teaching style predicting β0j. σ2 = variance in level 1 residual (ie variance in rij). τ00 = variance in level 2 residual for models predicting β0j (ie variance in U0j)

72

Table 8.7: Parameter Estimates and Variance Components of Substantive HLM Model

Testing the Relationships for Enjoyment and IDEA Teaching Styles

Model Equations

Intercepts as outcomes

L1: Enjoyij= β0j + rij

L2: β0j = γ00+γ01(rapport) + γ02(structure) + γ03(interest) + γ04(collaboration)+γ05(involvement) + U0j

γ00 γ01 γ02 γ03 γ04 γ05 σ2 τ00

One way analysis of variance 14.74 -- -- -- -- -- 9.08 3.82

Intercepts as outcome model 4.20 -0.46 0.07 0.75 0.30* 0.04 9.07 2.56

Note: the regression coefficients presented are not standardized

γ00 = intercept of level 2 regression predicting β0j, γ01 - γ05 = slopes of level 2 regression for each IDEA teaching style predicting β0j. σ2 = variance in level 1 residual (ie variance in rij). τ00 = variance in level 2 residual for models predicting β0j (ie variance in U0j)

73

Consequences of Engagement. The relationship between grade for the class and engagement was

examined first. Table 8.1 showed the correlation matrix. Table 8.8 displays the unstandardized

correlation coefficient (B) and the standardized coefficient (β), R2, and ∆ R 2 for the variables.

When considering the effect of engagement on course grades, a hierarchical regression

technique was utilized. In the first step, high school GPA was entered as a predictor of course

grades, as it is a known predictor of college grades (Astin & Lee, 2003). The regression

coefficient was found to be significant (R=.487, F (1,377) = 117.04, p < .001), showing that high

school GPA is strongly correlated with grade for the course and accounts for 23.7 % of the

variance in course grades.

In the second and third step, both the dimensions of engagement were entered. When

effort and enjoyment are added as factors in the regression, the change in R2 is significant for

effort (R= .532, Δ R2 = .047, p< .001). Δ F (1, 376) = 24.4; p<.001) accounting for 4% of the

variance. This significant change in ∆ R2 shows that the engagement dimension of effort has a

significant effect on grades, proving hypothesis 8a. However, the inclusion of the dimension of

enjoyment did not result in any change in R2, thus hypothesis 8b could not be proved, indicating,

enjoyment of class did not have a significant effect on students’ grades for the class.

Table 8.8: Hierarchical Regression Predicting Grades from the SAENS

Class Grades

β

Predictors

DV Class Grade

Step1 Step 2 Step 3

Step 1 High School GPA

.51** 0.49** 0.49** 0.49** Step 2 Effort

.20** 0.22** 0.22**

Step 3 Enjoyment .16** 0.07

Δ R2

0.24 0.04 0.0

ΔF

117.01** 24.42** 0.0

F

117.01** 74.35** 49.43**

R2 = 0.28

N=452, **p<.01

74

Next, the relationship between engagement and critical thinking was examined in a

separate analysis (Table 8.9). The regression coefficient for critical thinking was not significant

(R = .03, F (2,139) = 0.08, p > .05), with effort and enjoyment together accounting for only .1%

of the variance in critical thinking. Thus the hypothesis for the effect of engagement on critical

thinking could not be proved.

Table 8.9: Regression Results for Critical Thinking and SAENS Dimensions

Variables B β sr2

1 Effort 0.01 0.01 0.009 2 Enjoyment 0.04 0.02 0.01

Intercept= 62.46

R2 =.001

N=155

At this point, the relationship amongst the NSSE items and the SAENS dimensions of

effort and enjoyment were explored for the 2009 sample. Zero-order correlations indicated that

there is high correlation amongst the NSSE effort and the SAENS effort items (see Table 8.2).

Basically, question 4 of the NSSE measuring frequency of effort in inclass activities (NSSE

effort composite), showed significant correlation with the SAENS. Specifically, the item of

making class presentations were related to SAENS enjoyment (r=.18, p<.01) and to SAENS

effort (r= .16, p<.05). Asking questions in class showed a similar level of significant

relationship with SAENS effort (r= .38, p<.01) and SAENS enjoyment (r=.37, p<.01).

Preparing drafts of reports or assignments was related to SAENS effort (r=.21, p<.001) and to

SAENS enjoyment (r=.16, p<.05). Coming to class without preparing was significantly

negatively correlated to SAENS effort (r=-.13, p<.05). Working harder than anticipated was

strongly related to both SAENS effort (r= .32, p<.01) and SAENS enjoyment (r= .35, p<.01).

Next, the NSSE effort items were added together to form the NSSE effort composite. The

relationship of this composite and SAENS effort and enjoyment with the NSSE items was

assessed at this time (see Table 8.2). NSSE question 1 assessing number of assignments and

problems were unrelated to SAENS dimensions of effort, enjoyment and NSSE effort. However,

75

the question assessing amount of reading done on own was related to students’ SAENS

enjoyment (r= .15, p<.05) and SAENS effort (r= .12, p>.05) as well as the NSSE effort (r= .13,

p<.05). Question 2, preparing for class was significantly related to both SAENS effort (r=.23,

p<.01) and SAENS enjoyment (r= .22, p<.01) as well as NSSE effort composite (r=. 24,

p<.01). Question 3, challenge of the exam was similarly related to both effort ( r= .38, p<.01)

and enjoyment (r= .40, p<.01). The NSSE composite moderately correlated to the challenge

level of the exam (r= .32, p<.01). However none of the NSSE items showed any relationship

with student grades while effort and enjoyment show small but significant correlations of .14 and

.15 (p<.05) with grades in the 2009 sample.

To sum up, the current study found that women are more likely to make an engagement

effort, students’ status as generation to go to college does not affect their levels of engagement

and the teaching style of collaborative learning positively affects students’ engagement levels.

When assessing the outcomes of engagement, it was found that critical thinking is not affected

by individuals’ engagement in their academic work. However, engagement-effort does affect

grades for the course, while the dimension of enjoyment does not affect their grades for the

particular course. When comparing the NSSE items to the SAENS, a relationship was found

between SAENS effort, SAENS enjoyment and NSSE effort. However, a stronger relationship

was found between the SAENS dimensions and grades. The implications of these findings are

discussed in the next section.

76

CHAPTER 9 - Study 2: Discussion

College has far reaching impact on multiple areas of an individual's life (Pascarella &

Terenzini, 2005). Changes take place in students' level of cognitive skills, verbal and quantitative

skills, as well as changes in attitude and values. College students are more likely to volunteer and

have positive attitudes towards racial equality and higher cultural awareness (Astin 1993,

Pascarella & Terenzini, 2005). Students who are engaged have better performance in college

(Kuh, 2009) and this performance during college also results in better career prospects

(Pascarella & Terenzini, 2005). Also students who are engaged during their college years tend to

remain engaged even after college and develop a lifelong love of learning (Kuh, 2009).

Therefore, it is important to study factors affecting students’ engagement and its consequences.

However the extent of this impact depends on several factors such as the inputs students

bring to college, including their age, gender, college preparation, and socioeconomic status.

Engagement and college environment also interact with these factors to produce a lasting impact

on students (Astin, 1993). The current study focused on assessing the impact of demographic

variables and teaching styles on student engagement, as well as the impact of engagement on

performance in college. At the same time, a secondary purpose of the study was to assess the

incremental validity of SAENS over the NSSE effort items in explaining student experiences at

college.

Predictors of Engagement:

Gender. Results indicated that women show slightly higher levels of effort than men. No

such differences were found for enjoyment, with women and men showing similar levels of

enjoyment of their first year seminar classes. These results are similar to findings from previous

research. Astin (2006), reporting data from the CIRP program, asserted that females are more

likely to complete their degree. Also, research on first year seminar programs shows that smaller

seminars have more impact on women, with women in these seminars more likely to persist in

college (Porter & Swing, 2006).

First generation to go to college. Results from the analysis exploring the effect of

students’ status as first generation (to go to college) on engagement indicated that first generation

students do not show any differences in their level of effort and enjoyment. This is an interesting

finding, because previous research in the area consistently shows that the education level of

77

parents is a strong predictor of students completing their degree (Astin, 2006) and persisting in

college (Porter & Swing, 2006). Research using the NSSE also found that the odds are stacked

against first generation students, as these students are less likely to take advanced placement

classes, less knowledgeable about how to apply for college, have lower grades, and show lower

educational aspirations (Kuh et al, 2006). However, these results are more pronounced for

students of African-American and Latin origin than for Caucasian students.

The results from the current study indicate that there are no differences between first

generation students and non first generation students in the way they engage with their classes.

Therefore, the consistent differences between achievement levels cannot be attributed to

differences in engagement, but may be related to other factors that differentiate first generation

students from others, such as lower family support and less preparedness for college. Programs

directed toward first generation students should consider that there may not be a difference in

these students’ engagement level in college, and focus on changing other factors such as

providing a support system, and improving study skills to impact retention and performance of

first generation students.

Teaching style and engagement. The current study used students’ IDEA reports about

their instructors to evaluate the impact of teaching methods on student engagement. Five

different teaching styles were evaluated including stimulating student interest, fostering student

collaboration, establishing rapport, encouraging student involvement, and structuring classroom

experience. Results of the HLM analysis that explored the difference between classes on these

factors, indicated that the students’ level of enjoyment of the classes was significantly related to

the extent of student collaboration, and unrelated to other factors. Student effort was unrelated to

these five aspects of teaching styles.

This is an interesting finding for several reasons. First, on examination of the descriptive

statistics for IDEA scores by class (see table 7.2.), it can be seen that the highest amount of

variation between classes is in their level of fostering student collaboration. This indicates that

this is a factor that differentiates classes from each other, while other teaching styles are

relatively constant amongst all classes. This also indicates that encouraging collaborative

thinking may differentiate classes in terms of providing students with chances to engage.

Research on collaborative learning indicates that it is an important way of engaging students.

Nelson(1996) argues that when courses are taught in a traditional fashion, they are biased against

78

students who have lower preparation for classes. A study assessing the effect of collaborative

learning found that it reduced the number of D or F from 60% to 4% for African American

students (Fullilove & Treisman, 1990)

Further, this also shows that students experience higher levels of enjoyment of classes

when instructors encourage them to learn collaboratively and to learn in group settings. This also

indicates that students enjoy learning more when they are involved in learning experiences with

their peers. Extensive research in the field supports this finding. Collaborative learning is a part

of Chickering & Gamson (1987) seven categories of effective educational practices and has been

found to improve to student involvement in learning. Astin’s (1993) large CIRP study found that

two factors impact students’ academic development, namely, interaction amongst students and

interaction with faculty. One way to encourage interaction amongst students is by encouraging

student collaboration. A study examining qualitative data from instructors using collaborative

learning approach, found that instructors use these practices because they promote cognitive

elaboration, enhance critical thinking, provide direct feedback, promote social and emotional

development, teach appreciation of diversity, and reduce student absenteeism (Macgregor,

Cooper, Smith and Robinson, 2000). A meta-analysis comparing the effectiveness of students

working competitively and collaboratively found that collaborative learning results in

substantial increases in achievement, intrinsic motivation, time spent on task as well as working

towards goal accomplishment (Johnson, Johnson, & Smith, 1998). Cooperative learning has also

been found to promote greater liking between students and students perceive higher social

support from both peers and instructors. Research also indicates that students develop more

positive attitudes towards learning, the subject area, and the college, when learning in

cooperative groups (Johnson et al., 1998).

Another aspect of collaborative learning is students' sharing ideas and experiences with

others whose backgrounds and viewpoints differ from their own. One of the changes in college is

in terms of psychosocial change, attitudes and values. This is linked to increased involvement

with others from different backgrounds. Research with IDEA evaluations shows that this is an

aspect of the classroom that students want and enjoy (Theall, 2005) and similar results of higher

student enjoyment were found in the present study as well.

79

All of the above indicates that encouraging collaborative work in a classroom setting has

far reaching impact on students. One of the ways that this can be facilitated is by increasing

students’ engagement with their classes by impacting their enjoyment of the same.

It must be noted, however, that other aspects of teaching styles, including stimulating

interest, establishing rapport, encouraging student involvement and structuring classroom

experience are also important aspects of teaching, but are used more commonly in all classes and

did not differentiate classes. These aspects of teaching are used even in traditional lecture styles

and form the backbone of teaching effectiveness. For example research using the IDEA

evaluation process shows that faculty members report lecture as the most popular style, and the

learning objective emphasized in lectures is disseminating factual information or substantive

knowledge of the subject matter (Hoyt & Perera, 2000). These classes were also found to stress

upon the stimulating interest, establishing rapport and structuring classroom experiences as their

main teaching strategies (Hoyt & Lee, 2002). Since gains in factual knowledge is the aim of most

first year classes, these aspects should not vary too much across classes, which has been seen in

the current research as well.

However, had it been possible to connect individual student SAENS responses to their

IDEA evaluations, the relationships between these teaching styles and student engagement may

have become clearer as some information about individual engagement is lost by aggregating

information across the classes.

Taken together, the current research indicates that women are more likely to be engaged,

and there is no difference between the engagement levels of first generation and other students.

Teaching styles also affect students’ level of engagement, with encouragement of collaborative

learning resulting in higher levels of engagement. This increase in engagement also affects the

outcomes of classes and findings from that area are explored in the next section.

Consequences of Engagement

Grades. It was hypothesized that students’ engagement would predict their grades even

when their high school GPA is accounted for. When both enjoyment and effort were entered in

the regression equation, effort significantly accounted for the relationship between engagement

and grades, while enjoyment was not significant. This non significance of enjoyment can be

because enjoyment may be more predictive of other aspects of academic experience than grades.

For example, enjoyment may be more related to persistence or to continuing interest in the

80

subject matter, which were not explored in the current study. It must be noted that enjoyment and

effort are both important and correlated aspects of engagement. Therefore, even though effort

contributes more to the relationship between grades and engagement, enjoyment is necessary as

it is related to making effort and continuing effort in academic work.

The finding that the effort aspect of engagement accounted for variance in grades over

and above high school GPA has important implications. First, high School GPA was expected to

be related to grades because students don’t enter college as a blank slate. They have

preconceived expectations of college as well as previous academic experiences, and

socioeconomic and educational influences of their family. Research has shown that students'

grades in high school are strongly related to their grades in college, especially during the first

year of college (Cole & Kinzie, 2007). A recent metaanalysis by Robbins et al, (2007) found

that students' high school GPA and ACT scores are significant predictors of both retention and

first year GPA. Also, Astin & Lee (2003) found that precollege engagement, measured as hours

spent studying in high school, and academic ability, account for 61% of variance in hours spent

studying in college. Thus, students' high school engagement has been found to be highly

correlated to first year academic engagement (Astin & Lee, 2003). Thus some amount of

variance in grades in college should be accounted for by high school GPA, which was found to

be true.

However, the fact that engagement in classroom activities in college, in the form of the

dimension of effort, accounted for variance above that accounted for by high school GPA

indicates that some amount of engagement in the form of effort made by students in college is

modifiable. It is more than a feature of stable characteristics such as previous academic

experiences, socioeconomic status and high school engagement. This provides evidence for

importance of engendering engagement for furthering students’ academic achievement. It shows

that engaged students have higher grades irrespective of their previous academic achievement

and involvement, and that this engagement can be modified by instructional styles. The

enjoyment aspect of engagement was impacted by instructional styles, especially, collaborative

learning, and since enjoyment and effort aspects of engagement are related, enjoyment in turn

affects their effort in these classes leading to higher grades.

Critical Thinking. Results indicated that critical thinking is not related to students’

engagement in the class. There are several possible explanations for this lack of relationship.

81

First, the sample of the study was restricted to a randomly drawn smaller sample. The small

sample size may have resulted in non significant results because it lacked power to detect the

effect of students’ engagement on their critical thinking.

Secondly, the current study was cross-sectional and conducted during the first semester in

college. Moreover, CAAP data was collected during the first half of the semester and students

may not have had enough time or exposure to classes to improve their baseline critical thinking.

Therefore, changes in critical thinking may not be apparent at this time, but may be more clear

longitudinally as they continue their engagement in academic endeavors. This is supported by

research on changes in critical thinking in college, which indicates that changes in critical

thinking take place over a long period of time (Pascarella & Terenzini, 2005). Seniors show

higher levels of critical thinking than first year students. A study using the data from the National

Study of Student Learning by Doyle, Edison & Pascarella (1998) followed students from 18 four

year colleges through the end of their third year in college. Results from the CAAP indicated that

credit hours taken is a significant predictor of critical thinking, even when other factors such as

age, race, gender, and socioeconomic status are controlled for. Students with 72 or more credit

hours had a net advantage of 21 percentile points in critical thinking scores over students who

had completed 18 or fewer hours.

Yet another reason for the lack of relationship between critical thinking and engagement

is that students score best on critical thinking measures when the test content is similar to their

course material (Pascarella & Terenzini, 2005). CAAP is a generalized test of critical thinking,

while the engagement being assessed was in a particular class. Therefore engagement in a

particular class may not be related to students’ overall general critical thinking. Similarly,

research assessing the impact of academic major on critical thinking asserts that exposure to

natural sciences courses influences growth in critical thinking (Pascarella & Taerenzini, 2005).

The current study assessed a wide variety of courses and majors for first year students who have

not had much exposure to courses in any area.

Research also indicates that it is students’ overall exposure and involvement in college

that improves their critical thinking. Research on pedagogical approaches to learning and its

effect on critical thinking has mixed results with some researchers finding a consistent effect of

collaborative learning on critical thinking (Tsui, 1999), while others found only a chance effect

of pedagogy on critical thinking (Doyle et al, 1998). Therefore assessing the effect of students’

82

engagement in one class may not be the best indicator of increase in critical thinking, and a more

overall measure of college engagement, such as the NSSE, may be a better fit for assessing this

longitudinally. Research in the area supports this, with overall effort in college, and social and

extracurricular involvement during college leading to the highest gains in critical thinking

(Pascarella & Terenzini, 2005).

NSSE and SAENS relationship: Results of the correlation analysis indicated that SAENS

dimensions of effort and enjoyment both had a higher correlation with student outcome of grades

than the NSSE effort items. This indicates that SAENS may be a better measure of students’

engagement effort and enjoyment in a particular class, and show a stronger impact of

engagement on the grades for that particular class. This is supported by previous research where

Carini et al (2006) found a small relationship of NSSE items and GPA with none of the NSSE

items accounting for much variance in the outcome measures (less than 2%). Another study by

Gordon and collegues (2007) comparing student outcomes using the NSSE did not find

meaningful relationships between the NSSE and student outcomes such as grades and retention

(Gordon, Ludlum, & Hoey, 2007).

NSSE, however, may be more suited to its current purpose of measuring students overall

involvement in college rather than solely focusing on engagement in academic activities. NSSE

may provide information about whether classes are challenging students and whether students

are putting effort into these classes and engaging in extracurricular activities, but it does not

provide any information on what causes students to expend effort that results in grades.

At the same time, the correlation between the NSSE effort items and the SAENS effort

items indicates that SAENS is measuring student effort, which adds to the validity evidence for

the SAENS. The lack of correlation between SAENS effort and number of readings as well as

time spent doing homework indicates that students’ perception of engagement effort is

independent of the amount of work required of them in class. The NSSE measures effort as time

spent on activities, and effort and enjoyment are related experiences, therefore it was not

surprising that NSSE effort was related to the enjoyment aspect of the NSSE. The NSSE

measures some of the outcomes of student engagement effort such as the amount of time they

spend in academic activities. Since the SAENS measures the psychological characteristics of this

effort, NSSE effort outcomes should be related to SAENS effort and enjoyment, further

providing evidence that the SAENS measures engagement.

83

Research has already shown that highly engaged students tend to maintain lifelong

learning habits and tend to remain engaged (Pascarella & Terenzini, 2005), the current finding of

reading extra material may be one of the ways by which this process takes place. Students who

enjoy their classes, become engaged, put more effort into their work for the class and continue to

be engaged with the subject by reading more than is expected from them.

To summarize the above findings, results indicated that students’ level of engagement

effort predicts their grades in class. Also, SAENS effort is a better predictor of student grades

than the NSSE effort items. At the same time, student effort and enjoyment are not predictors of

student critical thinking. The above have several implications which are discussed in the next

section.

Theoretical Implications

The first study in the current research focused on developing a measure of student

engagement (SAENS), and one of the purposes of this study was to examine some of the

antecedents and consequences of engagement using the SAENS. This was done for two reasons;

first I wanted to establish the validity of the SAENS. Second, I wanted to broaden our

understanding of student engagement.

As for the validity, it was hypothesized that student engagement should be related to

teaching styles as well as to student grades above and beyond their previous academic

achievement. The antecedents of engagement were student characteristics and instructor

fostering of student collaboration, and consequently engagement being a predictor of student

grades is indicative of the fact that the SAENS is a valid measure of student engagement, thereby

contributing a new measure to the area of student engagement. A new and more valid measure

of student engagement can allow us to build better links between the various theories of student

learning and outcomes.

One of the persistent problems in the area of engagement has been the inability to

separate the dimensions of engagement from each other. This is a unique contribution of the

current research to the literature in the area. The UWES measures work engagement with three

dimensions of absorption, vigor and dedication which have often been used in a unidimensional

fashion because of their lack of distinction (Christian & Slaughter, 2007). Here, effort contains

all the items that pertain to vigor, challenge skill balance or dedication, as well as absorption in

the task. Enjoyment on the other hand contains aspects of intrinsic motivation or autotelic

84

activity. This research shows that engagement has two separate components, one of which is

oriented towards working on the task and another that focuses more on the enjoyment and

satisfaction derived from the work.

The above finding also sets the SAENS apart from other measures of engagement, as

most measures of engagement focus on the effort aspects of engagement. They do not perceive

enjoyment of the activity as an aspect of engagement. The current study shows that enjoyment

and effort are correlated, and to experience high engagement, one has to experience both

enjoyment and desire to put effort into an activity. This not only separates SAENS from other

scales of work engagement, but also from the NSSE. At the same time, the higher relationship

between student grades and SAENS indicates that it may be a better measure for assessing the

relationship between academic activities and student outcomes, rather than a more generalized

measure of student involvement in college.

Therefore, by using the SAENS, it may be possible to advance the literature in the area

by assessing specific characteristics of classes, apart from collaborative learning, that cause

students to have higher levels of enjoyment. This idea is neglected in the literature on student

engagement. Also the causes of student effort and the consequences of this high engagement in

academic activities can be assessed using the SAENS. Theory can benefit from a more in depth

look at characteristics of engaged students and long term implications of engaging students in the

classroom. This inclusion of enjoyment may also be helpful in separating the more stable aspects

of engagement from the more modifiable ones.

A major issue in the area of student learning and development is that of the difficulty in

separating effect of student characteristics from environmental and collegiate factors. Incoming

students bring with them various perceptions of college, study patterns, previous academic

histories as well as previous levels of student engagement. The question then becomes, to what

extent do colleges change or mold these perceptions and levels of engagement to ensure student

success and student retention? Astin (2006) asked, "How do we facilitate and enhance student

engagement..?". SAENS helps answer this question by focusing on class specific engagement,

and breaking engagement down to a level that can be studied more easily than overall college

engagement This study suggests that encouraging students to work in groups and using

collaborative learning may be one of the ways to increase student engagement in classes.

Confucius is typically credited with the Chinese proverb, “Tell me and I forget; show me and I

85

remember; involve me and I understand.” And one of the best ways to involve students seems to

be collaborative learning. The current research broadens the theory in the area by indicating a

way in which engagement in academic endeavors is not static, and is not a function of student

characteristics but something can be modified and encouraged in the classroom.

At the same time, results from this study indicated that students who are first generation

in their family to go to college do not differ in their engagement from other students. This has

implications for directing theory towards exploring other factors that may create differences in

achievement levels of first and second generation students, rather than assuming that first

generation students lack the skills to become engaged in academic endeavors.

The current study also contributes to the theory in the area of effect of engagement on

performance. The effect of engagement on grades was examined, and it was found that

engagement effort is related to grades. This has an important implication for theory building. The

finding that it is effort that impacts students’ grades further supports theory in the area of flow

and engagement, and that it is dedication or application that affects performance. Research in

work engagement and positive attitudes at work has consistently found that satisfaction has a low

relationship with performance (Judge, Thoresen. Bono, & Patton, 2001). Current results support

that, indicating that performance is indeed affected by effort more than it is by enjoyment of the

task. However, the fact that enjoyment is strongly correlated with effort indicates that they go

hand in hand. This furthers the theory in the area by showing that, even though enjoyment does

not impact performance directly, it is related to performance indirectly through its relationship

with effort.

Use of the SAENS will also further the literature because specific attributes of engaged

students and the teaching styles that engender these, can be assessed using this scale. For

example, individual student characteristics including perceived self efficacy, academic

performance as well as demographic indicators can be assessed. Instructional features including

evaluation of the teacher, teaching style, nature of the course material, as well as the impact of

the use of technology, can be assessed.

Outcomes of student engagement that can be assessed include factors like well being,

achievement of student learning outcomes, commitment to the work and the institution. Further

explorations can also be done to see if engagement is invariant across colleges and departments

or if course material and focus of the department also affects engagement. All of this will

86

contribute to furthering the study of engagement and will create many areas of exploration of the

construct. This exploration will also have practical implications for students as well as the

university as a whole.

Practical Implications

A recurring theme in the area of student learning and development is that of student

engagement. However, the way in which student engagement has been studied, (for example, as

hours studied every week, papers written for class) does not allow for pinpointing the factors that

cause this engagement. Using the SAENS has allowed us to uncover some of the ways by which

students become engaged. Therefore, the current study not only contributes to building up the

theory in the area, but also to practically enhancing student engagement. It was discussed earlier

that student engagement is enhanced by collaborative learning. This is a teaching style that can

be encouraged in the classroom and this may be related to engaging students more effectively.

Since students also seem to learn better when working collaboratively, using the collaborative

learning style has implications beyond that of engaging students through increasing their

learning. Encouraging collaboration was strongly correlated with the enjoyment aspect of

engagement, and since enjoyment is correlated to effort, students who enjoy classes more will

also put more effort in their work resulting in a higher level of learning and performance in terms

of grades.

Second, research has also shown that engagement is related to student retention. By

increasing student engagement via modifications in instructional styles, it may be possible to

change students’ attrition rate from college. Collaborative style of learning can also contribute to

this by providing students with peer support groups and improving student interaction, which is

another aspect of Chickering & Gamson (1987) effective educational practices. Research using a

collaborative teaching style indicates there are several ways in which collaborative learning can

be leveraged in the classroom.

Collaborative learning can be implemented the classroom in many ways. First is by

implementing informal cooperative learning. This consists of having students work together in

temporary adhoc groups (ranging from one class period to one minute) to achieve a joint goal.

Doing this results in less lecture time but re-engages students and allows for ensuring that

misconceptions and gaps in understanding are identified and corrected (Smith, Sheppard,

Johnson, & Johnson, 2005).

87

Another form of collaborative learning is that of formal cooperative learning groups

(Smith et al, 2005). These are more structured, have more complex tasks and stay together

longer. Key aspects of this method include positive interdependence, positive face to face

interaction, individual accountability and personal responsibility, teamwork skills as well as

group processing. Positive interdependence is where students are responsible for their own as

well as others’ learning and the focus is on joint performance. Individual accountability takes the

form of group members holding self and others accountable for high quality work. Positive

interaction is by encouraging group members to interact with the whole group in a positive

manner and improving group knowledge and effectiveness. Teamwork skills are encouraged by

teaching members to use communication skills are sharing leadership roles. Group processes

include the group processing their quality of work and effectiveness of the group.

Another practical implication from the current research is for improving the effect of

engagement on grades. If student engagement can be enhanced systematically, by uncovering

other aspects of instructional styles that encourage student engagement, it would result in higher

performance in classes by increasing the amount of effort students put into their work.

There are practical implications of this study for the use of the SAENS. This study shows

that SAENS can be used to study students’ engagement in specific academic activities, and

through regular use of the SAENS, it may be possible to pinpoint student and teacher

characteristics that encourage student engagement. Thereof this can also help to further study

incoming student characteristics that cause engagement or its lack. Longitudinal studies using the

SAENS can also help identify the processes by which students become disengaged, and what

causes them to retain their enjoyment and effort for some classes and not others. All of these can

help assess what causes student engagement, and how it can be facilitated, partially answering

some of the questions that trouble researchers in the area.

Last, the current study has specific implications for the FYS pilot program. The FYS pilot

program has been focused towards the use of smaller seminar classes to encourage student

integration into K-State as well as their engagement in academic activities. It is harder to

encourage student collaboration, to let students work together or even to change instructional

characteristics of very large seminar classes. Since engagement is strongly affected by the

collaborative nature of student work, the FYS pilot programs’ smaller, more collaborative classes

88

can improve student engagement in academic work as well as increase their feeling of

belongingness at K-State.

Limitations

Like any other study, this study has several limitations. One of the main limitations of

this study is the use of a first year sample. Therefore, results from the current research may not

be applicable to senior students. Using a first year sample, however, is beneficial in the sense

that it allows us to assess students before their perceptions of classes and college experiences

solidify. At the same time, these were special seminar classes and they may have had higher

levels of engagement than other larger lecture classes that are more the norm.

Another side effect of the sample being special seminar classes is the Hawthorne effect.

Since the classes were special, instructors may have used different instructional styles or paid

more attention to students than they normally do, restricting instructional styles. Also there was a

restriction of grades, with more grades of A’s and B’s, which may not be seen in very large

lecture classes.

Another limitation of the study was the small sample for critical thinking. If it had been

possible to measure the effect of engagement on critical thinking with more students, then some

relationships between students critical thinking and engagement may have emerged to further

support the research in the area.

A final limitation of the study was the inability to integrate individual student IDEA

responses with their SAENS items. It is thought that more relationships would have emerged

between student engagement and instructional characteristics if the loss of information, due to

aggregation had been preventable.

Directions for future research

One important direction for future research is the exploration of other variables that may

be related to enjoyment and effort. Theory, as well as practice, can benefit from research on what

enhances engagement in the classroom via enhancement of enjoyment and effort in academic

work. For example further research could benefit from examining the effect of other student

demographics such as ethnicity, hours students work, major chosen by the student, as well as the

lack of a clear major, on engagement. Similarly it would be beneficial to examine the differences

in various outcome variables, as a result of engagement such as student retention, interest in the

89

subject, increases in critical thinking over time, and students’ continued desire to study, such as

decision to go to graduate school.

A semester is a very short time in the college life of a student. Further research in the area

should use the SAENS longitudinally to assess the effect of class engagement on overall college

engagement, as well as student persistence and continuation of effort. Effects of disengagement

can also be examined longitudinally to assess the kind of decisions students make due to a lack

of enjoyment and effort in their classes.

Since one of the limitations of the current study was that the sample was constrained to

first year students at one university, further validation of the SAENS should be undertaken to

further assess the validity of this scale for the assessment of students at different stages of their

college career. Other exploration in the area can include factors such as differences in

engagement levels of seniors as compared to first year students and comparing differences in

factors of engagement as students progress in their college career. College major has been found

to affect students’ critical thinking and teaching styles used by instructors (Smith et al, 2005) and

research can benefit from comparing whether engagement also varies across various disciplines.

Last, the relationship between instructional styles and engagement can be explored in

greater depth by connecting individual responses to their engagement scores. More relationships

between engagement and instructional styles could emerge. This can be especially beneficial for

understanding the differences in engagement due to differences in majors or type of classes

students take. Other instructional variables, such as size of class and classroom settings, can be

explored as antecedents of student engagement.

Conclusions

Students are impacted heavily by their time in college (Astin, 1984). Many life changes

take place during this period. A lot of these changes hinge upon student engagement in academic

work and other college activities. The current research has contributed to the area by the

development and validation of a measure of student engagement. This particular study showed

that student engagement is affected by student characteristics and that it can be affected by

instructional characteristics as well. In turn engagement affects students’ grades through effort in

academic work. Proof for the validity of SAENS was also provided by comparing NSSE items to

the SAENS. SAENS showed higher relationship with student outcomes than the NSSE. At the

90

same time the NSSE has not been able to explain variation in student outcomes or the reason for

the effect of demographic characteristics on engagement.

Through the use of SAENS, the effect of incoming student characteristics can be further

separated from the effects of college and academic work. Studying academic engagement using

the SAENS can enable us to study students’ academic engagement as well as enhance it, which

can only lead to positive outcomes such as student physical and psychological well being,

commitment to their work and institution and better critical thinking, communication and

learning skills.

91

References

Allison, M.T. & Duncan, M.C. (1988). Women, work and flow. In Csikszentmihalyi, M.,Csikszentmihalyi, I. (Eds.). Optimal experience: Psychological studies of flow in consciousness. Cambridge: Cambridge University Press.

Anderson, J.C. & Gerbing, D.W. (1991). Predicting the performance of measures in a

confirmatory factor analysis with a pretest assessment of their substantive validities. Journal of Applied Psychology, 76, 732-740.

Astin, A. (1984). Student Involvement: A devlopmental theory for higher education. Journal of

college Student Personnel , 25, 297-308. Astin, A. (1993). What Matters in College. San Fransisco: Jossey-Bass. Astin, A. W., & Lee, J. (2003). How risky are one-shot cross-sectional assessments of

undergraduate students? Research in Higher Education, 44(6), 657-672. Astin, A.W. (2006). Making Sense of out of degree completion rates. Journal of College Student

Retention,7, (1),, 5-17. Bakker, A. B. (2005). Flow among music teachers and their students: The crossover of peak

experiences. Journal of Vocational Behavior, 66, 26-44. Banta, T. W., Pike, G. R., & Hansen, M. J. (2009). The use of engagement data in institutional

planning, assessment, and accreditation. In G. Kuh & R. Gonyea (Eds.), The use of student engagement data in institutional research (New Directions for Institutional Research Series, No. 141, pp. 21–34). San Francisco: Jossey-Bass.

Bennet, D. (2007). New Approaches to Public Disclosure. Bedford, Mass: New England

Association of Schools and Colleges. Blau, G. (1985). A multiple study investigation of the dimensionality of job involvement.

Journal of Vocational Behavior, 27, 19-36. Boswell, W.R., Shipp, A.J., Payne, S.C., & Culbertson S.S. (2009). Changes in newcomer job

satisfaction over time: Examining the pattern of honeymoons and hangovers. Journal of Applied Psychology, 94, 844-858.

Britt, T. W., Castro, C. A., & Adler, A. B. (2005). Self-engagement, stressors, and health: A

longitudinal study. Personality and Social Psychology Bulletin, 31(11), 1475-1486. Bryce, J., & Haworth, J. T. (2002). Wellbeing and flow in a sample of male and female office

workers. Leisure Studies, 21, 249-263.

92

Burke, J. (2005). The Many Faces of Accountability. In J. Burke, Achieving Accountability in Hgher Education: Balancing Public, Academic and Market Demands. San Francisco: Jossey- Bass.

Carini, R., & Kuh, G. (2003). 2002 NSSE-RAND Cross Validation Study. Some insights into the

role of student Engagement in learning. Bloomington: Indiana University Center for Psotsecondary Research.

Carini, R., Kuh, G., & Klein, S. (2006). Student Engagement and Student Learning: Testing the

Linkages. Research in Higher Education , 47(1), 1-32. Chickering, A. W., & Gamson, Z. F. (1987). Seven Principles for Good Practice in

Undergraduate Education. AAHE Bulletin , 3-7. Chickering, A., & Reisser, L. (1993). Education and Indentity. San Fransisco: Jossey-Bass. Christian, M. S., & Slaughter, J. E. (2007, August). Work engagement: A meta-analytic review

and directions for research in an emerging area. Paper presented at the sixty-seventh annual meeting of the Academy of Management, Philadelphia, PA.

Commission on the Future of Higher Education. (2006). A Test of Leadership: Charting the

Future of U.S. Higher Education. Washington D.C.: U.S. Department of Education. Conway, J.M. & Huffcutt, A.I. (2003). A review and evaluation of exploratory factor analysis

practices in organizational research. Organizational Research Methods, 6, 147-168. Cotton, S., Dollard, M., & DeJonge, J. (2002). Stress and Student Job Design: Satisfaction, well

bieng and performance in university students. International Journal of Stress Management , 9, 147-162.

Csikszentmihalyi, I. S, & Csikszentmihalyi, M. (Eds.) (1988). Optimal experience:

Psychological studies of flow in consciousness. New York: Cambridge University Press. Csikszentmihalyi, M. (1975). Beyond boredom and anxiety. San Francisco: Josey-Bass. Csikszentmihalyi, M. (1990). Flow: The psychology of optimal experience. New York: Harper &

Row. Csikszentmihalyi, M. (1999). If we are so rich, what aren’t we happy? American Psychologist,

54, 821–827. Csikszentmihalyi, M., & Rathunde, K. (1993). The measurement of flow in everyday life—

towards a theory of emergent motivation. Paper presented at the Nebraska Symposium on Motivation, Lincoln, NE.

93

Csikszentmihalyi, M., Rathunde, K. R., & Whalen S. (1993). Talented teenagers: The roots of success and failure. New York: Cambridge University Press.

Davis, T.M. and Murrell, P.H. (1993). Turning teaching into learning: The role of student

responsibility in the collegiate experience. ASHE-ERIC Higher Education Report No. 8. Washington, DC: The George Washington University, School of Education and Human Development.

Deci, E., Vallerand, R. J., Pelletier, L., & Ryan, R. M. (1991). Motivation and Education: The

Self Determination Perspective. Educational Psychologist , 26; 325-346. Erwin, T. (1997). Definitions and assessment methods for critical thinking, problem solving and

writing. Harrisonburg, VA: James Madison University. Center for Assessment and Research Studies.

Ewell, P. T. (2002). An Analysis of Relationships between NSSE and Selected Student Learning

Outcomes Measures for Seniors Attending Public institutions in South Dakota, National Center for Higher Education Management Systems, Boulder, CO.

Facione, N. (1997). Critical Thinking assessment in nursing education programs: An aggregate

data analysis. Millbrae, CA: California Academic Press. Feldman, K. (1997). Identifying exemplary teachers and teaching: Evidence from student ratings.

In R. Perry, & J. Smarts, Effective teaching in higher education: Reasearch and practice (pp. 368-395). New York: Agathon.

Fleming, J.H., C. Coffman & J.K. Harter (2005). Manage your human Sigma. Harvard Business

Review, 83, 106-115. Fullilove, R.E., & Treisman, P.U. (1990). Mathematics achievement among African American

undergraduates of the University of California, Berkeley: An evaluation of the Mathematics Workshop Program. Journal of Negro Education, 59(3).

Ghani, J. A., & Deshpande, S. P. (1994). Task characteristics and the experience of optimal flow

in human-computer interaction. Journal of Psychology, 128(4), 389-391. Gordon, J, Ludlum, J. & Hoey, J. (2008). Validating NSSE against student outcomes: Are they

related? Research in Higher Education, 49, 19-39. Hagedorn, L., Pascarella, E., Edison, M., Braxton, J., Nora, A., & Terenzini, P. (1999).

Institutional context and the development of critical thinking. A research Note. Research in Higher Education , 22, 247-263.

Hallberg, U. E., & Schaufeli, W. B. (2006). “Same same” but different? Can work engagement

be discriminated from job involvement and organizational commitment? European Psychologist, 11 (2), 119-127.

94

Harter, J. K., Schmidt, F. L., & Hayes, T. L. (2002). Business- unit-level relationship between

employee satisfaction, employee engagement, and business outcomes: A meta-analysis. Journal of Applied Psychology , 87, 268-279.

Hinkin (2005). Scale Development Principles and Practices. In Swanson & Holton (Eds.).

Research in Organizations: Foundations and Methods of Inquiry. San Fransisco: Berrett-Koehler Press.

Hinkin, T. (1995). A review of scale development practices in the study of organizations.

Journal of Management. , 21; 967-989. Hinkin, T. (1998). A brief tutorial on the development of measures for use in survey

questionnaires. Organizational Research Methods , 1 (1), 104-124. Hofmann, D.A., Griffin, M.A., & Gavin, M.B. (2000). The application of hierarchical linear

modeling to organizational research. In K. Klein & S. Kozlowski (Eds.), Multilevel Theory, Research, and Methods in Organizations: Foundations, Extensions, and New Directions (pp. 467-511). San Francisco: Jossey-Bass.

Hoyt, D.P. & Lee, E. (2002). Basic Data for the Revised IDEA System. Technical Report. Kansas

State University, IDEA Center, pp. 1-73. Hu, L.-T., & Bentler, P.M. (1999). Cutoff criteria for fit indices in covariance structure analysis:

Conventional criteria versus new alternatives. Structural Equation Modeling: A multidisciplinary Journal, 6,1-55.

Hu, S., & Kuh, G. (2002). Being (dis)engaged in Eductaionally purposeful activities: The

influence of student and institutional characteristics. Research in Higher Education , 43(5), 555-575.

Hulin, C. L., & Judge, T. A. (2003). Job attitudes. In I. B. Weiner (Ed. in Chief) & W. C.

Borman, D. R. Ilgen, & R. J. Klimoski (Vol. Eds.), Handbook of psychology: Vol. 12. Industrial and organizational psychology, (pp. 255-276). Hoboken, NJ: John Wiley & Sons.

Jackson, S. A., & Eklund, R. C. (2004). The flow scales manual. Morgantown, WV: Fitness

Information Technology, Inc. Jackson, S.A., & Eklund, R.C. (2002). Assessing flow in physical activity: The Flow State

Scale-2 and Dispositional Flow Scale-2. Journal of Sport and Exercise Psychology, 24, 133-150.

Johnson, D.W., Johnson, R.T., and Smith, K.A.(1998). Maximizing Instruction Through

Cooperative Learning, , ASEE Prism,7, 6, pp. 24–28.

95

Jöreskog, K. G., & Sörbom, D. (1986). LISREL user guide version VI (4th ed.). Mooresville, IL: Scientific Software International.

Judge, T. A., Bono, J. E., Thoresen, C. J., & Patton, G. K. (2001). The job satisfaction-job performance relationship: A qualitative and quantitative review. Psychological Bulletin, 127 (3), 376-407.

Kahn, W. A. (1990). Psychological conditions of personal engagement and disengagement at

work. Academy of Management Journal, 33 (4), 692-724. Kanungo, R. N. (1982). Measurement of job and work involvement. Journal of Applied

Psychology, 67, 341– 349. Kitchener, K., Wood, P., & Jensen, L. (1999). Curricular, cocurricular and institutional influence

on real world problem solving. Paper presented at the meeting of the American Psychological Association. Boston.

Klein, S. P., Kuh, G. D., Chun, M., Hamilton, L., & Shavelson, R. (2005). An approach to

measuring cognitive outcomes across higher education institutions. . Research in higher education , 46 (3); 251-276.

Kuh, G. D. (1995). The Other Curriculum: Out-Of-Class Experiences Associated With Student

Learning and Personal Development. Journal of Higher Education , 66 (2); 123-155. Kuh, G.D. (2001). Assessing what really matters to student learning: Inside the National Survey

of Student Engagement. Change

, 33(3), 10-17, 66.

Kuh, G. D. (2003). What we’re learning about student engagement from NSSE. Change, 35 (2), 24-32

Kuh, G. D. (2009). The National Survey of Student Engagement: Conceptual and Empirical

Foundations. New Directions For Institutional Research, , 141, 5-21. Kuh, G. D., & Hayek, J. C. (2004). Quality time: An in-depth look at the National Survey of

Student Engagement. Currents, 30 (9), 11-12. Kuh, G., Kinzie, J., Bukley, J., Bridges, B., & Hayek, J. (2006). What Matters to Student

Success:A review of the literature.Commissioned Report for the National Symposium on Postsecondary Student Success: Spearheading a Dialog on Student Success. Retrieved June 15, 2009, from NSSE: http://nsse.iub.edu/html/pubs.cfm?action=&viewwhat=Journal%20Article,Book%20Chapter,Report,Research%20Paper

Lei, P.W. , & Wu, Q. (2007). Introduction to Structural Equation Modeling: Issues and Practical

Considerations. Educational Measurement: Issues and Practice.26(3), 33-43.

96

Lissitz, R.W., & Green, S.B.(1975) Effect of the number of scale points on reliability: A Monte-Carlo approach. Journal of Applied Psychology, 60,10-13.

Locke, E.A. (1976), "The nature and causes of job satisfaction", in Dunnette, M.D. (Eds.), Handbook of Industrial and Organizational Psychology, Rand McNally, Chicago, IL, pp.1297-349.

Luthans, F. (2002). The need for and meaning of positive organizational behavior. Journal of

Organizational Behavior, 23, 695-706. Macey, W. H., & Schneider, B. (2008). The meaning of employee engagement. Industrial and

Organizational Psychology: Perspectives on Science and Practice, 1(1), 3-30. MacGregor, J., Cooper, J., Smith., K., & Robinson, P(2000).“Strategies for Energizing Large

Classes: From Small Groups to Learning Communities, New Directions for Teaching and Learning, 81. Jossey-Bass.

Marsh H.W. & Jackson, S.A. (1999). Flow Experience in Sport. Construct Validation of

Multidimensional, Hierarchical State and Trait responses. Structural Equation Modeling, 6, 343-71.

Martin, J. J., & Cutler, K. (2002). An exploratory examination of flow and motivation in theatre

actors. Journal of Applied Sport Psychology, 14, 344-352. Maslach, C., & Leiter, M. P. (1997). The truth about burnout: How organizations cause

personal stress and what to do about it. San Francisco: Jossey-Bass. Maslach, C., Schaufeli, W. B., & Leiter, M. P. (2001). Job burnout. Annual Review of

Psychology, 49, 24-33. May, D. (1990). Student Development: A longitudinal investigation of the relationship between

student effort and change in intellectual development. Memphis State University, Memphis, TN: Unpublished Doctoral Dissetation.

May, D. R., Gilson, R., & Harter, L. M. (2004). The psychological conditions of meaningfulness,

safety, and availability and the engagement of the human spirit at work. Journal of Occupational and Organizational Psychology, 77, 11-37.

McCormick, A. C. (2009). Towards Reflective Accountability: Using NSSE for Accountability

and Transparency. New Directions For Institutional Research , 141, 97-107. Mentkowski, M., & Associates. (2000). Learning That Lasts: Interpreting learning, development

and performance in college and beyond. San Francisco: Jossey-Bass. Meyer, J. P., Stanley, D. J., Herscovitch, L., & Topolnytsky, L. (2002). Affective, continuance,

and normative commitment to the organization: A meta-analysis of antecedents, correlates, and consequences. Journal of Vocational Behavior, 61 (1), 20-52.

97

Morrow, P. (1983). Concept redundancy in organizational research: The case of work

commitment.Academy of Management Review, 8, 486-500. Morrow, P.C (1993). The Theory and Measurement of Work Commitment, JAI Press,

Greenwich, CT. Nakamura, J., & Csikszentmihalyi, M. (2002). The concept of flow. In C. R. Snyder & S. J.

Lopez (Eds.), Handbook of positive psychology (pp. 89-105). New York: Oxford University Press.

Nelson, C.E. (1996). Student diversity requires different approaches to college teaching, even in

math and science. American Behavioral Scientist, 40(2), 165-175. Newman, D.A. & Harrison, D.A. (2008). Been There, Bottled That: Are State and Behavioral

Work Engagement New and Useful Construct “Wines”? Organizational Psychology. Perspectives on science and practice, 1,31-36.

Pace, C. (1980). Measuring the Quality of Student Effort. Current Issues in Higher Education ,

2, 10-16. Pace, C. (1984). Measuring the Quality of College Student Experiences: An Account of the

Development and Use of the College Student Experiences Questionnaire. Los Angeles: Higher Education Research Institute.

Pascarella, E. (1985). College environmental influences on learning and cognitive development:

A critical review and synthesis. In J. Smart, Higher Education: Handbook of theory and research (pp. Vol 1, 1-64). New York: Agathon.

Pascarella, E. T., Edison, M. I., Nora, A., Hagedorn, L. S., and Terenzini, P. T. (1998). Does

Work Inhibit Cognitive Development During College? Educational Evaluation and Policy Analysis, 20(2): 75- 93.

Pascarella, E., & Terenzini, P. (2005). How College Affects Students. San Fransisco: Jossey-

Bass. Pike, G. R. (2003, May). Measuring quality: A comparison of U.S. News rankings and NSSE

benchmarks. Paper presented at the annual meeting of the Association for Institutional Research, Tampa, FL.

Podsakoff, P.M., MacKenzie, S.B., Lee, J.Y., & Podsakoff, N.P.(2003). Common method biases

in behavioral research: A critical review of the literature and recommended remedies. Journal of Applied Psychology, 88, 879-903.

Porter, S. (2006). Institutional Structures and Student Engagement. Research in Higher

Education , 47, 521-559.

98

Porter, S. R., & Swing, R. L. (2006). Understanding how first-year seminars affect persistence. Research in Higher Education, 47, 89–109.

Quinn, R.W. (2005). Flow In Knowledge Work: High Perfromance Experience In The Design

Of National Security Technology. Administrative Science Quarterly, 50, 610-641. Robbins, S., Lauver, K., Le, H., Langley, R., Davis, D., & Carlstrom, A. (2004). Do

psychosocial and study skill factors predict college outcomes? A meta-analysis. Psychological Bulletin, 130, 261–288.

Robinson, D., S. P. Perryman & S. Hayday. (2004). The Drivers of Employee Engagement. IES

Report 408. Retrieved September 21, 2008, from studies.co.uk/summary/summary.php?id=408.

Rupayana, D. D., Steele, J. P., & Fullagar, C. (2008, May). Flow: Conceptualization and

construct validity. Poster presented at the annual meeting of the Midwestern Psychological Association (MPA), Chicago, IL.

Rupayana, D.D.(2008). Engagement and Flow: Different Degrees of the Same?. Unpublished

Master’s thesis Manuscript. Kansas State University. Saks, A. M. (2006). Antecedents and consequences of employee engagement. Journal of

Managerial Psychology, 21 (7), 600-619. Salanova, M., Bakker, A.B. & Llorens (2006). Flow at Work: Evidence for an Upward Spiral of

Personal and Organizational Resources. Journal of Happiness Studies, 7,1, 1-22. Schaufeli, W. B. & Salanova, M. (2007). Work engagement: An emerging psychological concept

and its implications for organizations. In Gilliland, S. W., Steiner, D. D., & Skarlicki, D. P. (Eds.), Research in Social Issues in Management (Volume 5): Managing Social and Ethical Issues in Organizations. (pp. 135-177). Greenwich, CT: Information Age Publishers.

Schaufeli, W. B., & Bakker, A. B. (2004). Job demands, job resources, and their relationship

with burnout and engagement: A multi-sample study. Journal of Organizational Behavior, 25, 293-315.

Schaufeli, W., Salanova, M., Gonzalez-Roma, V., & Bakker, A. (2002). The Measurement of

Engagement and Burnout: A Two Sample Confirmatory Factor Analytic Approach. Journal of Happiness Studies , 3; 71-92.

Schoenfeldt, L.F. (1984). Psychometric properties of organizational research instruments. In T.S.

Bateman & G.R. Ferris (Eds). Method and analysis in organizational research, 68-80. Reston. VA: Reston.

99

Schriesheim, C.A., Powers, K. J., Scandura, T.A., Gardiner, C.C., & Lankau, M.J. (1993). Improving construct measurement in management research. Comments and a quantitative approach for assessing the theoretical adequacy of paper-and-pencil and survey-type instruments. Journal of Management, 19, 385-417.

Schwab, D.P. (1980). Construct validity in organization behavior. In B.M. Staw & L.L.

Cummings (Eds). Research in Organizational behavior (Vol. 2, pp.3-43). Greenwich, Ct: JAI.

Seligman, M. E. P., & Csikszentmihalyi, M. (2000). Positive psychology: An introduction.

American Psychologist, 55, 5-14. Shernoff, D.J., Csikszentmihalyi, M., Schneider, B., Shernoff, E.S.(2003). Student Engagement

in High School Classrooms from the perspective of Flow theory. School Psychology Quarterly, 18, 158-176

Shirom, A. (2003). Feeling vigorous at work? The construct of vigor and the study of positive

affect in organizations. In D. Ganster & P. L. Perrewe (Eds.). Research in organizational stress and well-being. (Vol. 3, pp. 135-165). Greenwich, CN: JAI Press.

Smith, K.A, Sheppard, S.D., Johnson, D.W. & Johnson, R.T. (2005). Pedagogies of Engagement:

Classroom-Based Practices. Journal of Engineering Education, 1-15. Snape, E., & Redman, T. (2003). An evaluation of a three-component model of occupational

commitment: Dimensionality and consequences among United Kingdom human resource management specialists. Journal of Applied Psychology, 88 (1), 152-159.

Sonnentag, S. (2003). Recovery, work Engagement, and proactive behavior (2003): A new Look

at the interface between non-work and work. Journal of Applied Psychology, 88, 518-528.

Spector, P. E. (2006). Method variance in organizational research: Truth or urban legend?

Organizational Research Methods, 9(2), 221-232. Steele, J. P., & Fullagar, C. (2008, May). Flow, engagement, and quality of life: A student well-

being model. Paper presented at the annual meeting of the Midwestern Psychological Association, Chicago, IL.

Steele, J.P., Rupayana, D.D., Mills, M.J., Smith, M., Wefald, A.J. & Downey, R.G. (2010).

Relative Importance and Practical Utility of Positive Worker States. Manuscript under review.

Tabachnick, B.G. & Fidell, L.S.(2006). Using Multivariate Statistics (5th ed.) Allyn and Bacon.

Boston.

100

Terenzini, P., Springer, L., Yaeger, P. E., & Nora, A. (1996). First Generation college students: Characteristics, experiences, and cognitive development. Research in Higher Education , 37, 1-22.

Tinto, V. (1993). Leaving college: Rethinking the causes and cures of student attrition. Chicago:

University of Chicago Press. Tsui, L. (1999). Courses and instruction affecting critical thinking. Research in Higher

Education, 40(2), 185-200. Tyler, R. W. (1949). Basic Principles of Curriculum and Instruction. Chicago, University of

Chicago Press. Vance, R.J. (2006). Employee Engagement and Commitment: A Guide to Understanding,

Measuring, and Increasing Employee Engagement in Your Organization. Alexandria, VA: SHRM Foundation, http://www.shrm.org/foundation/1006EmployeeEngagementOnlineReport.pdf

Wefald, A. J., & Downey, R. G. (2009). The construct dimensionality of engagement and its

relationship with satisfaction. The Journal of Psychology: Interdisciplinary and Applied, 143 (1), 91-111.

Weidman, J. (1989). Undergraduate Socialization: A conceptual Approach. In J. Smart, Higher

Education: Handbook of theory and research. (pp. Vol 5, 289-322). New York: Agathon. Wilson, R. C., Gaff, J. C., Dienst, R. E., Wood, L., & Bavry, J. L. (1975). College Professors

and TheirImpact on Students. New York: Wiley-Interscience. Wood, A., & Murray, H. (1999, April). Effects of Teacher Enthusiasm on student attention,

motivation, and memory encoding. Paper presented at American Educational Research Association. Montreal.

101

Appendix A - Instructions read to students (2008) or on the online

form (2009)

The current survey will take approximately 5 minutes. Please think about your first year seminar class at Kansas State University and answer the following questions about your experience of the class.

Your responses are confidential and will not be shared with your instructor. However we do need your name and WID number to use the data as well as to enter participants into the drawing for the gift card. Answering questions is voluntary. If you feel that you do not wish to answer the questions, you don't have to. There are no right or wrong answers. We just want you to answer honestly and as accurately as possible.

If you have any questions about the survey, please contact [email protected].

102

Appendix B - Sample CAAP Item (from the ACT website)

Senator Favor proposed a bill in the state legislature that would allow pharmacists to prescribe medications for minor illnesses, without authorization from a physician (i.e., a "prescription"). In support of her proposal, Favor argued:

Doctors have had a monopoly on authorizing the use of prescription medicines for too long. This has caused consumers of this state to incur unnecessary expense for their minor ailments. Often, physicians will require patients with minor complaints to go through an expensive office visit before the physician will authorize the purchase of the most effective medicines available to the sick.

Consumers are tired of paying for these unnecessary visits. At a recent political rally in Johnson County, I spoke to a number of my constituents and a majority of them confirmed my belief that this burdensome, expensive, and unnecessary practice is widespread in our state. One man with whom I spoke said that his doctor required him to spend $80 on an office visit for an uncommon skin problem which he discovered could be cured with a $2 tube of prescription cortisone lotion.

Anyone who has had to wait in a crowded doctor's office recently will be all too familiar with the "routine": after an hour in the lobby and a half-hour in the examining room, a physician rushes in, takes a quick look at you, glances at your chart and writes out a prescription. To keep up with the dizzying pace of "health care," physicians rely more and more upon prescriptions, and less and less upon careful examination, inquiry, and bedside manner.

Physicians make too much money for the services they render. If "fast food" health care is all we are offered, we might as well get it at a good price. This bill, if passed into law, would greatly decrease unnecessary medical expenses and provide relief to the sick: people who need all the help they can get in these trying economic times. I urge you to vote for this bill.

After Senator Favor's speech, Senator Counter stood to present an opposing position, stating:

Senator Favor does a great injustice to the physicians of this state in generalizing from her own health care experiences. If physicians' offices are crowded, they are crowded for reasons that are different from those suggested by Senator Favor. With high operating costs, difficulties in collecting medical bills, and exponential increases in the costs of malpractice insurance, physicians are lucky to keep their heads above water. In order to do so, they must make their practices more efficient, relying upon nurses and laboratories to do some of the patient screening.

No one disputes the fact that medical expenses are soaring. But, there are issues at stake which are more important than money—we must consider the quality of health care. Pharmacists are not trained to diagnose illnesses. Incorrect diagnoses by pharmacists could lead to extended illness or even death for an innocent customer. If we permit such diagnoses, we will be personally responsible for those illnesses and deaths.

103

Furthermore, since pharmacies make most of their money by selling prescription drugs, it would be unwise to allow pharmacists to prescribe. A sick person who has not seen a physician might go into a drugstore for aspirin and come out with narcotics!

Finally, with the skyrocketing cost of insurance, it would not be profitable for pharmacists to open themselves up to malpractice suits for mis-prescribing drugs. It is difficult enough for physicians with established practices to make it; few pharmacists would be willing to take on this financial risk. I recommend that you vote against this bill.

Sample Items for Passage 1

1.Favor's "unofficial poll" of her constituents at the Johnson County political rally would be more persuasive as evidence for her contentions if the group of people to whom she spoke had:

I. been randomly selected. II. represented a broad spectrum of the population: young and old, white and non-

white, male and female, etc. III. not included an unusually large number of pharmacists.

A. I only B. II only C. III only D. I, II, and III

2.In her example of the man who paid $80 for an office visit to treat an uncommon skin problem, Favor seems to assume, but probably should not, that:

A. the man would have discovered this cure without the doctor's diagnosis. B. two dollars is the average price of the cortisone lotion. C. eighty dollars is the average price for an office visit of this kind. D. cortisone lotion is effective on all rashes.

3.Counter's concern that a sick person who has not seen a physician might go into a drugstore for aspirin and come out with narcotics is probably unfounded because:

A. sick persons often send others to get their drugs. B. narcotics are not normally prescribed for "minor ailments." C. most people do not buy aspirin at the drugstore. D. most people who need narcotics go to a physician to get them.

4.It is obvious from Favor's speech that she believes which of the following? A. Most prescriptions are unnecessary. B. Senator Counter will oppose the bill. C. If the bill is passed into law, it will greatly reduce the cost of all medical

treatment. D. If the bill is passed, the average costs for treatment of minor ailments would be

reduced significantly.

104

Appendix C - NSSE items as they appeared on the survey

Now thinking about the same class, please indicate how frequently you did the following activities

with 1 as “never” and 4 as “very often”

1 - Never | 2 - Sometimes | 3 - Often | 4 - Very Often

1 Made a class presentation.

2 Asked questions in class or contributed to class discussion.

3 Prepared two or more drafts of a paper or assignment before turning it in.

4 Come to class without completing readings or assignments.

5 Worked harder than you thought you could to meet an instructor's standards or expectations.

Mark the frequency of the following course activities. In this course how much reading and writing

did you do? Number of assigned textbooks, books, or book-length packs of course readings

None

1 to 2

3 to 4

5 or more

Number of books read on your own (not assigned) for personal enjoyment or academic

enrichment

None

105

1 to 2

3 to 4

5 or more

Number of written papers or reports of 20 pages or more

None

1 to 2

3 to 4

5 or more

Number of written papers or reports between 5 and 19 pages

None

1 to 2

3 to 4

5 or more

Number of written papers or reports of fewer than 5 pages

None

1 to 2

3 to 4

5 or more

106

Number of problem sets that took you more than an hour to complete

None

1 to 2

3 to 4

5 or more

Number of problem sets that take you less than an hour to complete

None

1 to 2

3 to 4

5 or more

Click the number that best represents the extent to which your examinations during this class

have challenged you to do your best work with 1= “Very Little” and 7= “Very Much”

1 - Very Little | 2 - - | 3 - - | 4 - - | 5 - - | 6 - -

7 - Very Much

The examination in this class has challenged me to do my best work.


Recommended