DEVELOPING THE NET METERING MARKET IN PAKISTAN SUSTAINABLE ENERGY FOR PAKISTAN (SEP) PROJECT Submission Date: February 11, 2019 Contract No.: AID-OAA-I-13-00028 Task Order: AID-391-TO-16-00005 Activity Start Date and End Date: August 3, 2017 to April 26, 2021 Submitted by: Tetra Tech ES, Inc. 1320 North Courthouse Road, Suite 600 Arlington, VA 22201 Tel. +1-703-387-2100 | Fax +1-703-243-0953 www.tetratech.com This report was produced for review by the United States Agency for International Development. It was prepared by Tetra Tech ES, Inc. for the Sustainable Energy for Pakistan (SEP) Project.
Transcript
DEVELOPING THE NET METERING
MARKET IN PAKISTAN
SUSTAINABLE ENERGY FOR PAKISTAN (SEP) PROJECT
Submission Date: February 11, 2019
Contract No.: AID-OAA-I-13-00028
Task Order: AID-391-TO-16-00005
Activity Start Date and End Date: August 3, 2017 to April 26, 2021
Submitted by: Tetra Tech ES, Inc.
1320 North Courthouse Road, Suite 600
Arlington, VA 22201
Tel. +1-703-387-2100 | Fax +1-703-243-0953
www.tetratech.com
This report was produced for review by the United States Agency for International Development. It was
prepared by Tetra Tech ES, Inc. for the Sustainable Energy for Pakistan (SEP) Project.
DEVELOPING THE NET METERING
MARKET IN PAKISTAN
FINAL REPORT
FEBRUARY 11, 2019
SUSTAINABLE ENERGY FOR PAKISTAN
(SEP) PROJECT
DISCLAIMER
This study/report is made possible by the support of the American people through the United States
Agency for International Development (USAID). The contents are the sole responsibility of the Tetra
Tech ES, Inc. and do not necessarily reflect the views of USAID or the United States Government.
DEVELOPING THE NET METERING MARKET IN PAKISTAN iii
EXECUTIVE SUMMARY
Pakistan introduced net metering regulations in 2015 (the “National Electric Power Regulatory Authority
Distributed Generation and Net Metering Regulations, 2015”) to promote power generation from
distributed Renewable Energy (RE) systems. The growth in net-metering installations is however slow,
with only 815 licenses issued by December 2018, adding 17.28 MW to the country’s installed power
generation capacity. Considering Pakistan’s RE potential, especially from solar PV installations, the slow
growth in net-metering is a missed opportunity for the country. In order to develop the net metering
market in Pakistan and to accelerate the proliferation of distributed generation (DG) technologies,
this report provides an assessment of the regulatory and market barriers that are limiting the
effectiveness of Pakistan’s net metering program and recommends specific interventions to address
these barriers.
Distributed generation produces electricity from small energy systems, at or near the point of
consumption and grid-connected distributed generators can be used to offset an electricity customer’s
energy consumption or provide grid support through peak-shaving, load shifting and ancillary services.
Although grid-scale generation has better economies of scale in most regions of the world, at least 63
countries had policies in place by 2017 to support distributed renewable energy generation.
Government support for DG in these countries is motivated by the additional benefits that DG
systems can potentially deliver to stakeholders (including consumers, distribution companies and
transmission network owners) such as mobilizing private finance, reducing transmission investments
and distribution losses, providing grid support and addressing land-use constraints where land for grid-
scale solar is limited or unavailable.
Driven primarily by public policy and financial incentives, global installed residential and commercial
photovoltaic (PV) capacity grew to 173GW in 2017, with Australia, Germany and Japan currently
producing more solar energy from DG than centralized, grid-scale solar. Compensation mechanisms
including net metering (in the US, Brazil, India and Sri Lanka) and Feed-in-Tariffs (FITs) offered in
conjunction with net-billing (in Germany, Italy, Japan, Thailand and Australia) are the most common
forms of policy support for grid-connected distributed generation.
GLOBAL LESSONS ON IMPLEMENTING NET-METERING
Traditional net metering allows a consumer’s electricity meter to spin backwards, effectively erasing
the cost of some of the electricity consumed from the grid. As a compensation mechanism, net-
metering is relatively simple to implement for electricity consumers, DISCOs and regulators and
delivers benefits to all stakeholders; customers with net metering save on electricity bills, DISCOs
benefit from new generation capacity and reduced distribution losses while policy-makers can promote
a sustainable source of energy with minimal regulatory change since net-metering is incorporated on
top of the existing retail electricity tariffs.
Countries around the world have implemented net-metering programs with varying degrees of
success. The effectiveness of net-metering schemes relies on a number of factors, including the design
parameters of net metering regulations, the institutional capacity of DISCOs and others involved in
implementing the program, the availability of additional incentives and the presence of an enabling
market environment. Important lessons from global net metering schemes include:
• Net-metering policies are only effective and economically efficient when designed to cater to
the local market environment and implemented through a carefully considered market rollout
plan.
• Market conditions should guide the choice of regulation design and the limits applied to each
regulatory element. The most important regulatory elements include the metering and billing
arrangement, electricity sell-rate design (or the tariff paid for electricity that a net-metered
customer supplies to the grid), the overall cap on net metered installations, the system-size
iv DEVELOPING THE NET METERING MARKET IN PAKISTAN
limit on individual installations, a local-level cap based on the capacity of distribution
transformers to accommodate DG without adverse impacts on the grid and the credit
reconciliation period.
• Distributed generation compensation schemes such as net metering face inherent challenges
and usually require supporting incentives to achieve policy objectives. In the past decade, the
most widely used supporting incentives were fiscal incentives and public financing through
capital subsidies, tax and duty reduction, taxes credits, public loans and grants etc.
• DG compensation schemes can fail to achieve targets if barriers linked to the enabling
environment, such as limited access to debt, lack of diversity in business models’ institutional
capacity issues and technical constraints (availability of transmission infrastructure for instance)
are not addressed. The slow growth of grid-connected DG in both China and India highlights
the relevance of the enabling environment, particularly in emerging markets.
• Increasing levels of DG on grid-networks produces costs and benefits that impacts energy
system stakeholders in different ways; electricity consumers with net metering installations
benefit through cost savings on electricity bills however, at higher levels of net metering
penetration, electricity customers without net metering assume a larger share of fixed
network costs, essentially cross-subsidizing net metered customers. Governments can face a
revenue loss from reduced tax collections while transmission and distribution companies face
impacts on revenues, network costs and grid stability. Although the negative impacts of DG
materialize at relatively high levels of DG uptake, prudent policy practice requires policy
makers and regulators to assess the technical and financial impacts of DG on all stakeholders
before implementing a DG support policy such as net metering.
NET METERING IN PAKISTAN: SITUATION ANALYSIS
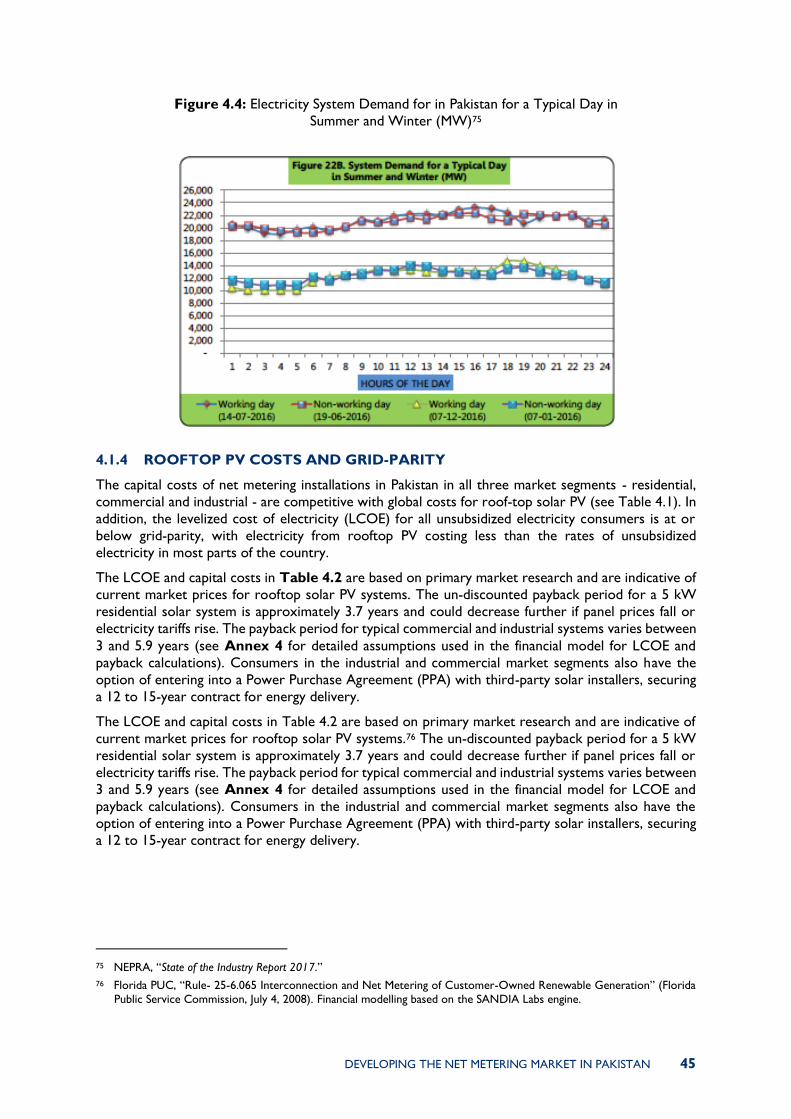
High cost of electricity, excessive system losses and good solar irradiation make the economic case
for distributed solar PV in Pakistan. The market for net metering in the country is predominantly urban
and caters mostly to demand from the residential segment. However, the levelized cost of electricity
(LCOE) for all three market segments (residential, commercial and industrial) is below grid-parity and
electricity from rooftop PV is cheaper than much of the current grid-supplied electricity in most parts
of the country. The proliferation of DG products and services in the local market is following the
pattern of DG growth in other emerging market countries such as Brazil, where incomes, population
and electricity tariff levels are the primary determinants of DG technology uptake. Given the current
tariff and taxation regime in Pakistan, the commercial segment of the market stands to benefit the
most from generating electricity on-site, at a lower cost than grid-supplied power in many cases.
Pakistan’s transmission infrastructure is barely adequate to serve the expected load in 2018 and losses
on both the transmission and distribution networks are high, leading to excessive wastage and chronic
revenue deficits at the DISCOs. The distribution system constraints in fact, represents an opportunity
where net metering could potentially alleviate some of the issues in the system operation by reducing
distribution losses, decreasing network congestion and providing additional power to eliminate or
reduce forced interruptions in electricity supply. Suitably placed net metered systems can also aid
voltage regulation on the distribution network, especially in locations where feeders are overloaded.
More than 90% of the equipment used in net metering installations in Pakistan is imported from other
countries (predominantly China) with system integration and installation services provided by several
small and mid-sized companies known locally as installers, solar companies or solar system providers.
At the high-end of the market, these companies offer a full suite of Engineering, Procurement and
Construction (EPC) services and post installation operation and maintenance (O&M) support.
Since net-metering regulations in Pakistan allow only 3-phase electricity customers to participate in
the net-metering program, the potential market for net-metering is limited to approximately 882, 707
customers, including 371,060 residential, 150,927 commercial and 360,721 industrial electricity
consumers, or approximately 3% of all grid-connected electricity customers in the country. Although
the potential market is small compared to the grid’s customer base, these customers consume
DEVELOPING THE NET METERING MARKET IN PAKISTAN v
approximately 35% of all electricity delivered by the distribution grid and provide more than 40% of
all revenues collected by public and private distribution companies.
CURRENT NET METERING SUPPORT PROGRAMS
The Alternative Energy Development Board (AEDB) has implemented several interventions in
collaboration with the German development organization (GIZ) and others, to address the barriers
limiting net metering proliferation in Pakistan: commissioned by GIZ, PV Passport is a certification
procedure for PV systems. The project will also organize training seminars for participating commercial
banks in Pakistan and is expected to run until September 2019. Pakistan Distributed Generation
Roadmap is a GIZ study for assessing the technical and financial impact of net metering on the
distribution system owned by the Islamabad Electric Supply Company (IESCO). PV Ecosys is an online
platform that Step Robotics, a Pakistan-based technology startup, is developing for AEDB. The
platform is designed to address issues associated with the net metering application and installation
process.
KEY ISSUES AND RECOMMENDATIONS
ADDRESS POLICY, LEGAL AND REGULATORY ISSUES
1) Pakistan’s RE policy lapsed in 2018 with no clear indication of whether net metering will receive policy
cover under a new policy regime.
The net metering policy framework should be embedded in a broader policy to encourage the
development of renewable energy sources. Given the low cost of energy generated from roof-top
solar installations and the rising cost of the tariff subsidy, government funded DG systems could also
provide an effective lower-cost alternative to electricity tariff subsidies. A detailed cost-benefit analysis
would be required to determine the exact impact of DG and net-metering on low-income, low-use
residential electricity consumers and gauge the potential of government funded DG systems to reduce
electricity subsidies.
2) The current net metering regulations do not reflect the changes in the NEPRA Act that could benefit
electricity customers with net metering installations.
Based on the NEPRA Act 2018, net metered installations should be excluded from the mandatory
generation license requirement and should not be restricted to sell surplus electricity to their host
DISCO only. Cooperative housing societies and consumer associations generating captive power
should also be allowed to subscribe to the net metering program.
3) Net metering regulations are missing local-level caps, include no provisions for information sharing between
the DISCOs and the regulator, and allocate all equipment and interconnection costs to consumers.
NEPRA should specify local caps on net metering, based on the capability of feeding system at the
distribution transformer (DT) and distribution-grid level. A system assessment would need to be
conducted by the regulator and DISCOs to arrive at a suitable DT level cap. DISCOs should provide
regular progress reports to NEPRA.
4) The interconnection standards are ambiguous on several accounts.
Small, RE-based distributed generators with a capacity of less than 500 kW, connecting to the
distribution grid at a voltage lower than 11kV should be included as a separate category in Schedule I
of the Interconnection Regulations, 2015. Subject to prior assessment of the feasibility of an exemption,
the regulator could exempt smaller systems (10 kW or smaller) from simulation studies. Net metered
customers connecting to a distribution network should be provided with the required interconnection
facility by the host DISCO.
vi DEVELOPING THE NET METERING MARKET IN PAKISTAN
DEVELOP A MARKET ROLL OUT AND IMPLEMENTATION PLAN
1) There is no clear implementation plan in place to guide market rollout of the net metering program.
The Ministry of Energy (MOE) should treat net metering as a provisional policy intervention, define
clear objectives for the program and provide an implementation plan for market rollout. An upfront
review of technical and financial impacts of net metering on distribution companies should be
conducted to reduce risks to the distribution companies and investors.
ADDRESS MARKET BARRIERS
1) High upfront costs and a lack of financing options make net metered systems unaffordable for most
electricity consumers.
Assist financial institutions to develop consumer finance products for the small-scale DG market and
improve their institutional capacity to process loans for net metered installations. Involving DISCOs
in PPAs between consumers and third-party installers and financing agreements between banks and
net metered customers will also improve the flow of financing to the sector.
2) Distribution companies have limited resources and administrative capacity to effectively manage the net
metering program.
Automate key processes for installing and managing net metered systems (application, interconnection
and billing etc.) and train DISCOs to conduct financial and technical impact assessment.
3) Some distribution companies are reluctant to support the net metering program due to concerns around
revenue loss.
The DISCOs’ concerns over revenue loss could be addressed through new business models. For
instance, DISCOs can participate in rooftop solar PPAs with third-party installers (by assuming agency
for credit collection or providing joint guarantees to financial institutions) or directly provide net
metering installation services to their customer base.
4) The installation process is unnecessarily complex
To simplify and expedite the process for installing net metered systems, key processes need to be
simplified and expedited.
5) Most consumers are unaware of the benefits of net metering or consider the technology ineffective and
unreliable.
The availability of net metering and risk reducing initiatives by AEDB and others need to be publicized
through a targeted consumer awareness campaign.
6) Rooftop space is not always available or adequate for solar PV installations.
Commercial net metered customers located in rented spaces or those requiring more space for
rooftop generation than available at their own premises should have the option of wheeling electricity
from a separate generation location through virtual net metering or meter-aggregation arrangements.
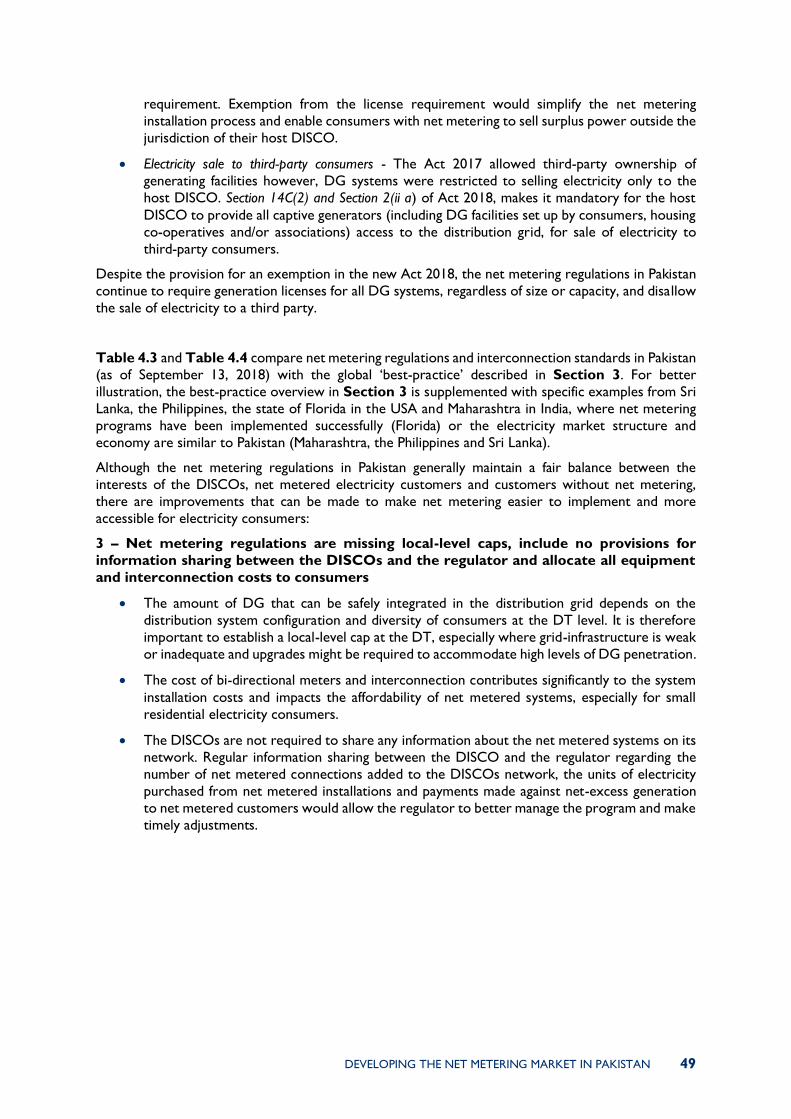
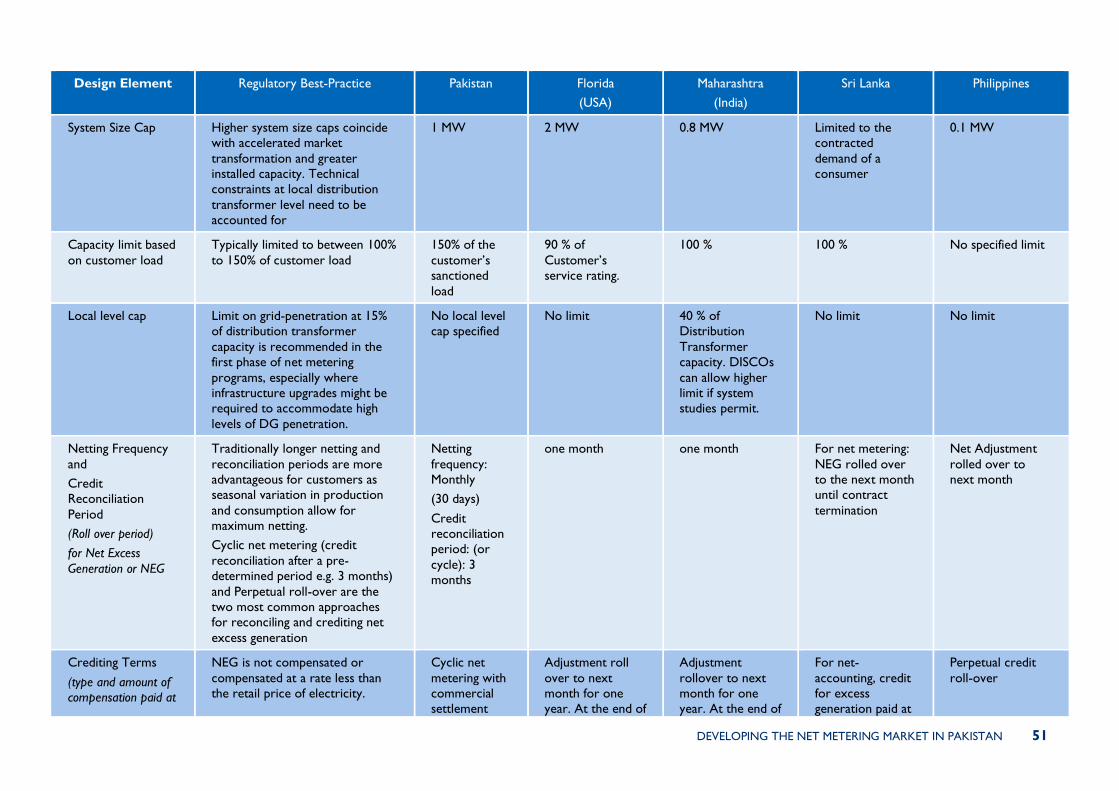
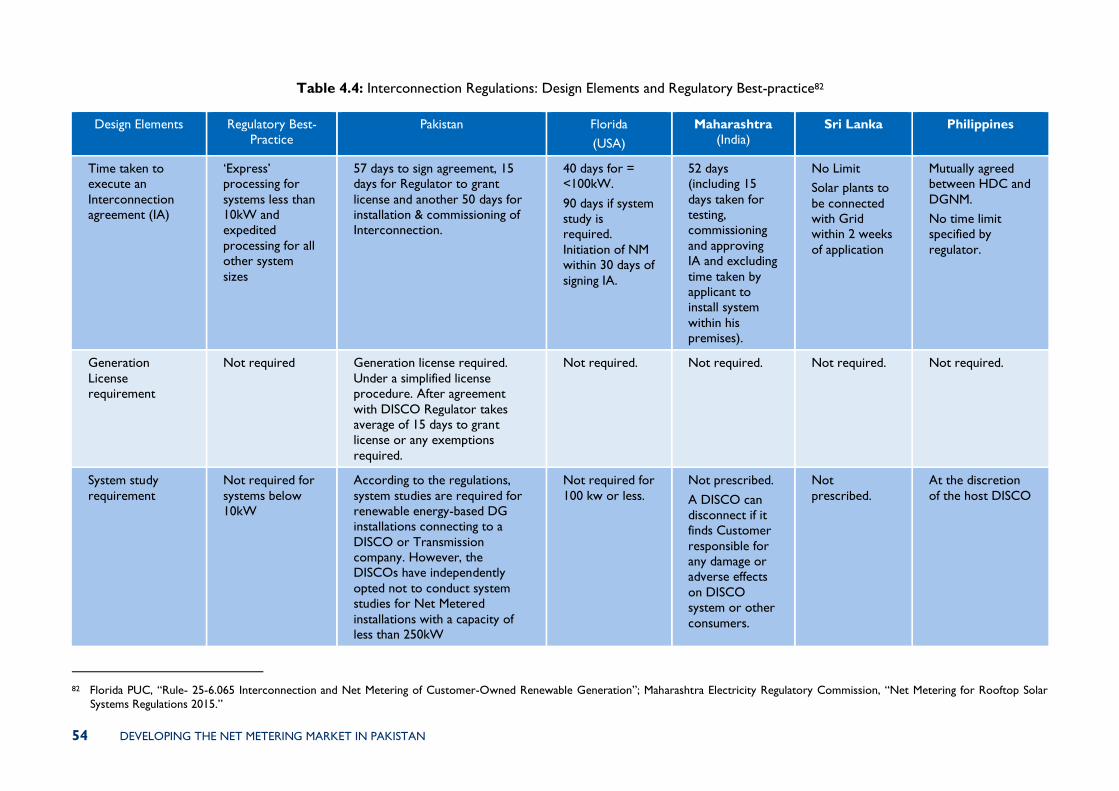
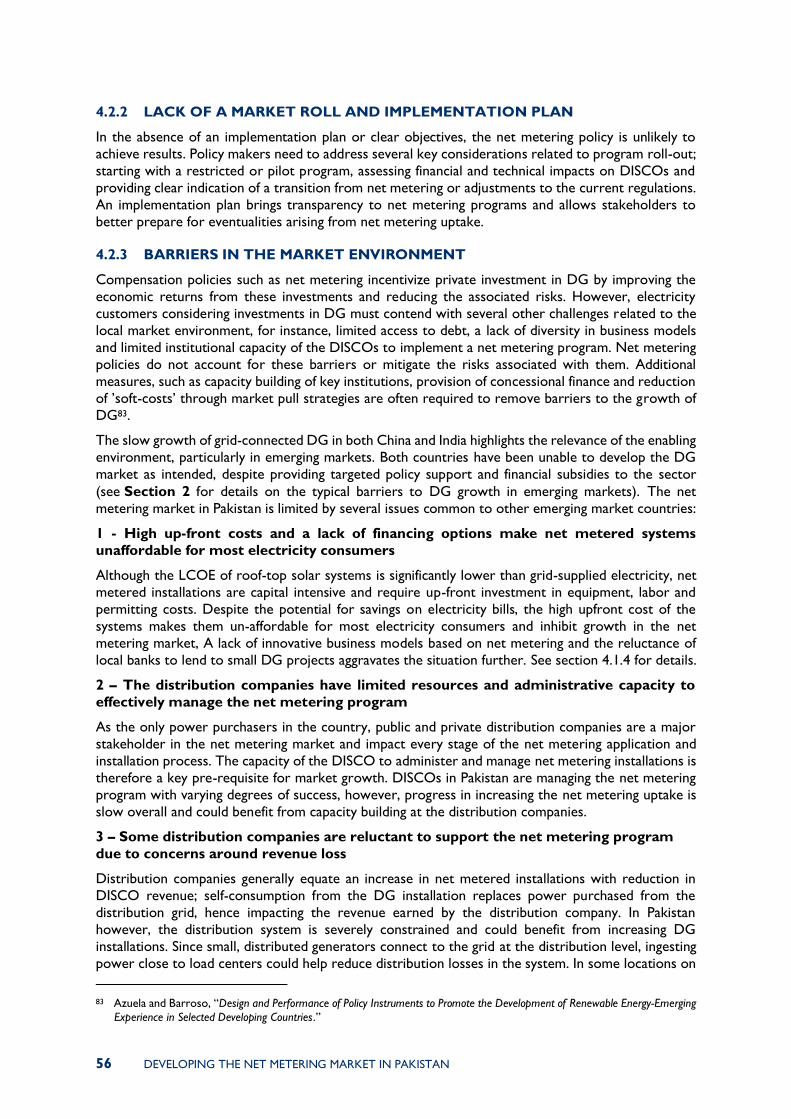
The main barriers curtailing the growth of net metering in Pakistan and recommendations to address
the barriers are summarized in the table below. The table also indicates existing interventions by the
Alternative Energy Development Board (AEDB) and others to resolve particular issues and proposes
SEP activities to either extend existing programs or implement new initiatives.
DEVELOPING THE NET METERING MARKET IN PAKISTAN vii
Table I: Developing the net-metering market in Pakistan: Summary Recommendations
Issue Recommendations Key Stakeholders
1 Lack of policy
cover • Include net metering in the new energy policy MOE, AEDB
2 Inconsistency of
the policy with the NEPRA Act 2018
• Exempt net metering installations from generation
licenses
• Allow sale of surplus electricity to any DISCO
• Allow net metering to cooperative housing societies
and consumer associations generating captive power
MOE, NEPRA
3 Deficiencies in
net metering regulations
• Conduct a system assessment to determine a suitable
local-level cap
• Assign the upfront cost of bi-directional meters and
interconnection to the DISCOs (to be recovered from the net metered consumer through a monthly charge)
• Require DISCOs to submit net metering subscription
information to regulator on a monthly basis.
NEPRA
4 Deficiencies in Interconnection
standards
• Assign a separate category in the Interconnection
Regulations to small generators connecting at a low voltage
• Clarify responsibility for simulation studies
• Assess feasibility of exempting small DG systems (10
kW or smaller) from simulation studies.
NEPRA
5 Lack of a net metering implementation
plan
• Apply net-metering as a provisional policy intervention with clear objectives and an implementation plan
• Perform an upfront review of technical and financial
impacts of net metering on distribution companies
• Assess the impacts of net metering on the energy
network performance
Ministry of Energy, NEPRA, AEDB, DISCOs
6 High capital cost of system
and limited access to debt
• Train financial institutions in processing small RE loans
• Develop standardized tools to assess rooftop solar
project risk
• Involve DISCOs in PPA between consumers and third-
party installers
AEDB
DISCOs
State Bank of Pakistan
International
Development Organizations
Financial Institutions
7 Limited administrative
capacity of the
distribution companies
• Train DISCOs in process implementation and financial/technical impact assessment
• Process automation
AEDB, GIZ
DISCOs, Step
Robotics
8 Resistance from
DISCOs • Incentivize DISCOs through innovative business
models involving DISCOs
DISCOs,
NEPRA, AEDB
viii DEVELOPING THE NET METERING MARKET IN PAKISTAN
Issue Recommendations Key Stakeholders
9 Lack of
awareness about net
metering among power consumers and
consumers’ perception of technology and
performance
risk
• Conduct an awareness-raising campaign AEDB
10 Complicated process
• Standardize SOPs across DISCOs
• Process automation
DISCOs, AEDB, Step Robotics
11 Limited availability of rooftop space
• Develop business models around wheeling Third party providers
2. OVERVIEW OF DISTRIBUTED GENERATION ........................................................ 17 2.1.1 POLICY SUPPORT FOR RENEWABLE ENERGY ...................................................................... 18
2.2 ADVANTAGES OF GRID CONNECTED DISTRIBUTED RENEWABLE ENERGY
GENERATION ................................................................................................................... 19 2.3 GLOBAL INVESTMENTS IN DISTRIBUTED GENERATION ...................................... 20 2.4 POLICY MECHANISMS FOR PROMOTING GRID-CONNECTED DISTRIBUTED
3. GLOBAL LESSONS ON IMPLEMENTING NET METERING ................................... 25 3.1 GUIDING PRINCIPLES FOR NET METERING POLICY DESIGN AND MARKET
ROLLOUT .......................................................................................................................... 26 3.1.1 GUIDING PRINCIPLES FOR PROGRAM ROLLOUT ............................................................... 27
3.2 BEST PRACTICE IN NET METERING REGULATION DESIGN AND INTERCONNECTION STANDARDS ............................................................................. 28 3.2.1 REGULATORY DESIGN .................................................................................................................. 28 3.2.2 INTERCONNECTION STANDARDS.......................................................................................... 28
3.3 ADDITIONAL INCENTIVES REQUIRED FOR SUCCESSFUL NET METERING
PROGRAMS ........................................................................................................................ 36 3.4 BARRIERS TO NET METERING MARKET GROWTH IN DEVELOPING
COUNTRIES....................................................................................................................... 37 3.5 IMPACTS ON STAKEHOLDERS ..................................................................................... 39
4. NET METERING IN PAKISTAN: SITUATION ANALYSIS ...................................... 41 4.1 LOCAL CONTEXT............................................................................................................ 41
4.1.1 RETAIL ELECTRICITY TARIFFS ..................................................................................................... 41 4.1.2 POTENTIAL MARKET FOR NET METERING ........................................................................... 43 4.1.3 RESOURCE AVAILABILITY AND COINCIDENCE WITH PEAK DEMAND...................... 44 4.1.4 ROOFTOP PV COSTS AND GRID-PARITY .............................................................................. 45 4.1.5 PERFORMANCE OF THE TRANSMISSION AND DISTRIBUTION NETWORKS ............ 46 4.1.6 ADDITIONAL FINANCIAL INCENTIVES ................................................................................... 47 4.1.7 QUALITY AND SAFETY STANDARDS ...................................................................................... 47 4.1.8 MARKET STRUCTURE .................................................................................................................... 47
4.2 KEY ISSUES ........................................................................................................................ 48 4.2.1 WEAKNESSES IN THE POLICY, LEGAL AND REGULATORY FRAMEWORK ................ 48 4.2.2 LACK OF A MARKET ROLL AND IMPLEMENTATION PLAN ............................................. 56 4.2.3 BARRIERS IN THE MARKET ENVIRONMENT .......................................................................... 56
x DEVELOPING THE NET METERING MARKET IN PAKISTAN
4.3 CURRENT NET METERING SUPPORT PROGRAMS................................................... 58
5. RECOMMENDATIONS ................................................................................................. 59 5.1 ADDRESS POLICY, LEGAL AND REGULATORY ISSUES .......................................... 59 5.2 DEVELOP AN IMPLEMENTATION PLAN .................................................................... 60 5.3 ADDRESS MARKET BARRIERS ....................................................................................... 60
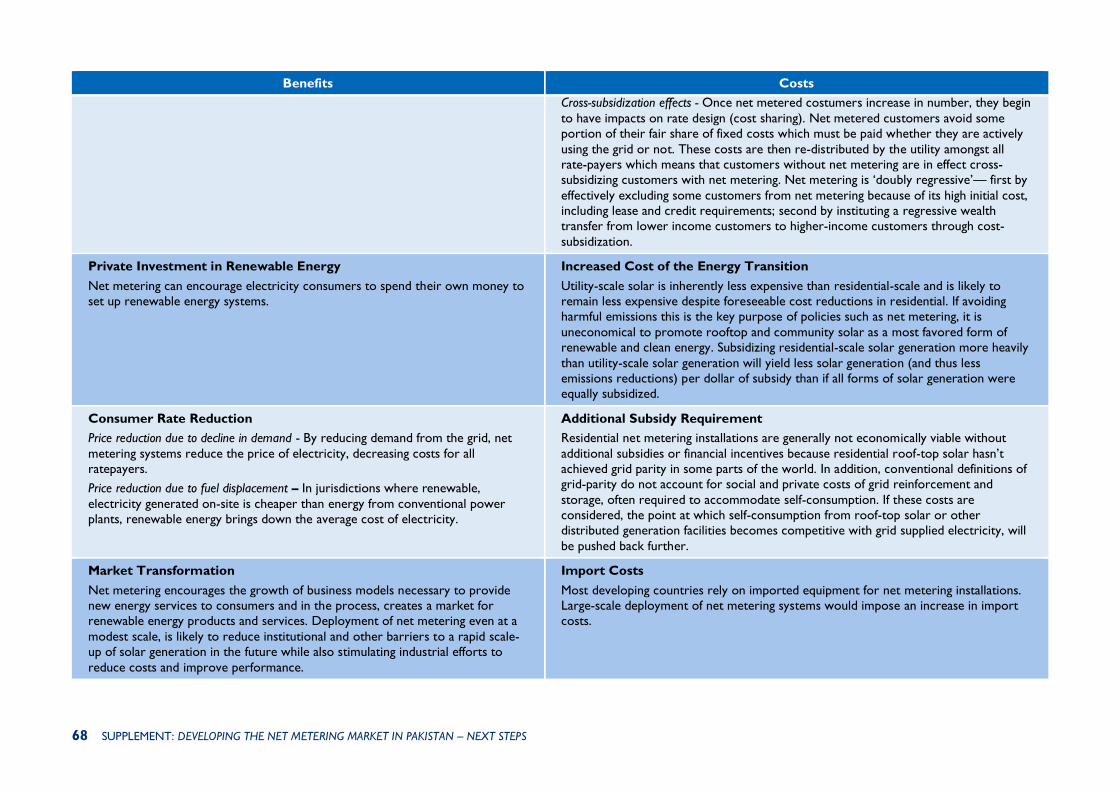
ANNEX 1: COSTS AND BENEFITS OF DISTRIBUTED GENERATION ..................... 64
ANNEX 2: COMPARISON OF METERING & BILLING ARRANGEMENTS ................ 70
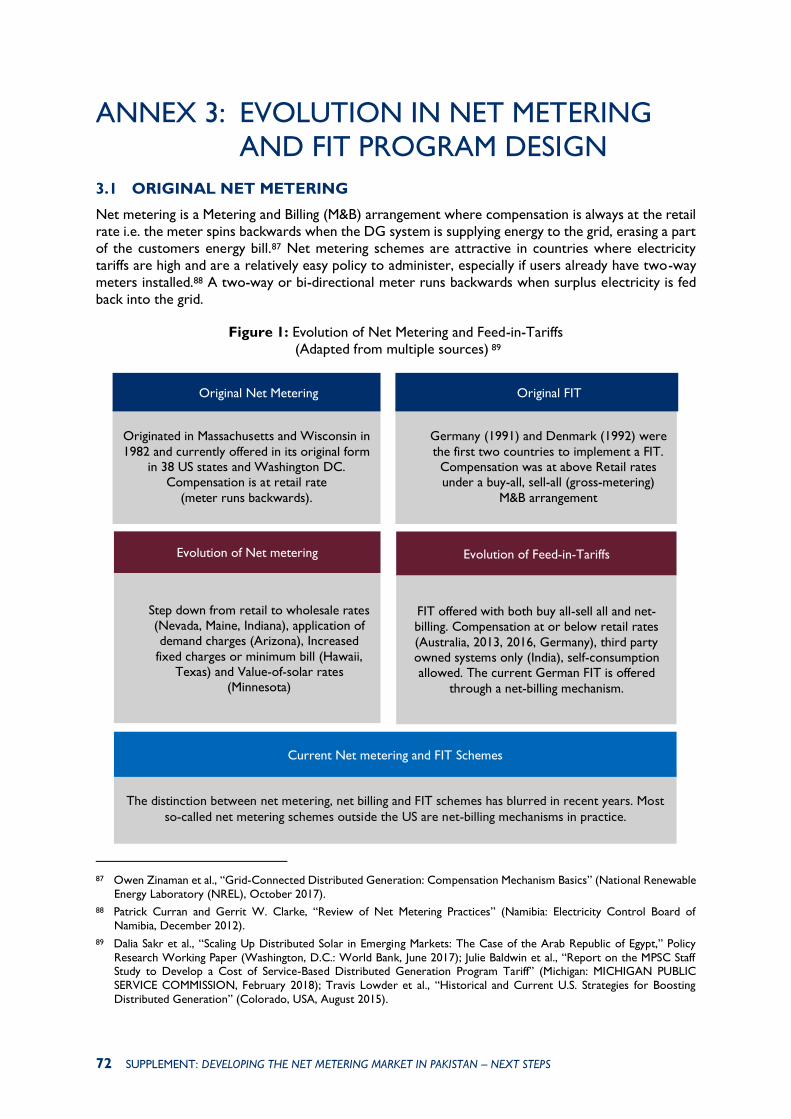
ANNEX 3: EVOLUTION IN NET METERING AND FIT PROGRAM DESIGN ............ 72
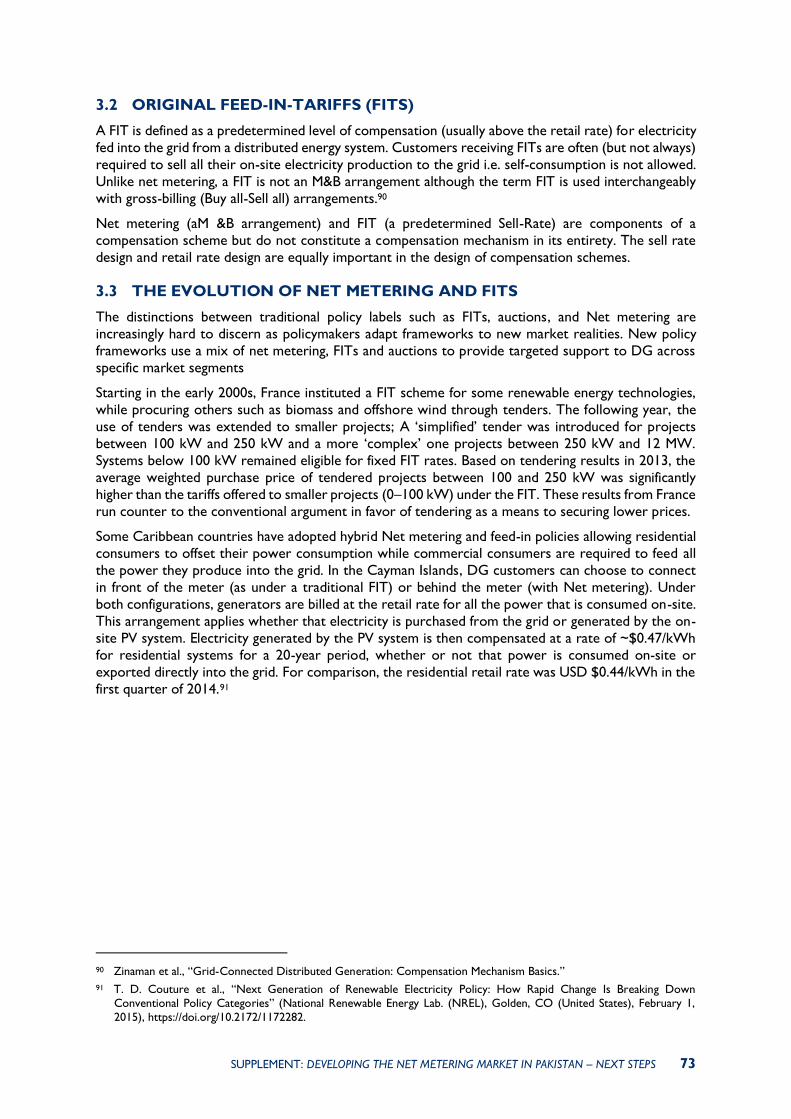
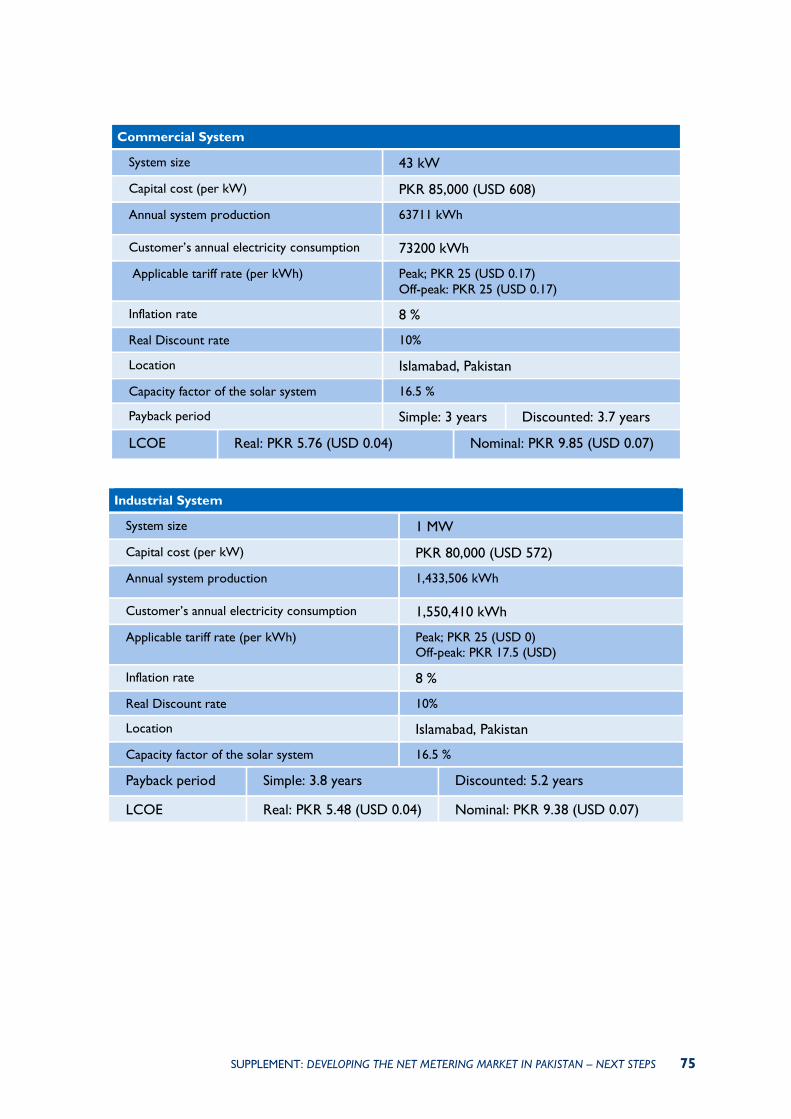
ANNEX 4: FINANCIAL MODEL ASSUMPTIONS FOR NET METERED SOLAR PV
SYSTEMS .......................................................................................................... 74
ANNEX 5: DRAFT SCOPE FOR A NET METERING PUBLIC AWARENESS
regulations facilitating grid access (by simplifying permitting, installation and inspection and
setting interconnection standards etc.) dispatch priority, building
codes
Financial Instruments
Investment-based Instruments
(Upfront subsidies to reduce the cost of
installing RE systems)
Financial instruments including grants, tax reduction, low-interest
loans, reduction in property taxes etc. and public loan guarantees, public equity, partial risk guarantees
on PPAs, counterparty guarantees as part of political risk insurance
(PRI)
Institutional Support
Policies to reduce the balance-of-
system costs e.g. below-cost provision of infrastructure or services and R&D funding for RE
technology
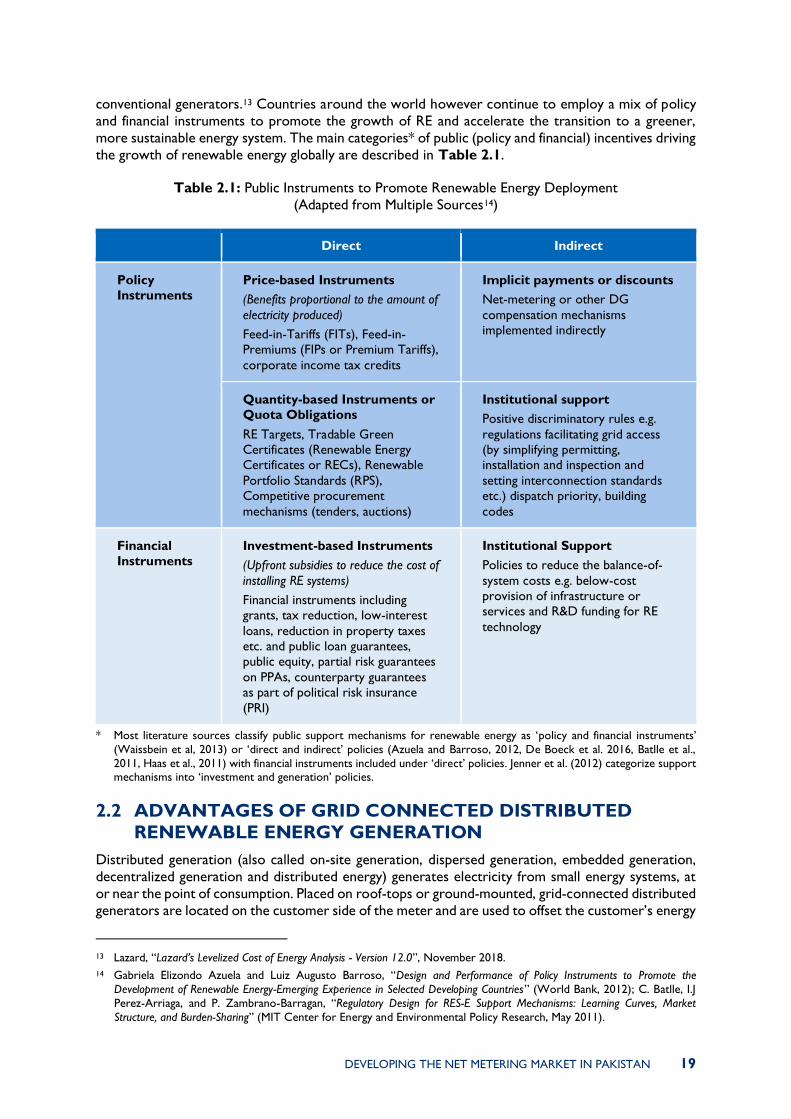
* Most literature sources classify public support mechanisms for renewable energy as ‘policy and financial instruments’
(Waissbein et al, 2013) or ‘direct and indirect’ policies (Azuela and Barroso, 2012, De Boeck et al. 2016, Batlle et al.,
2011, Haas et al., 2011) with financial instruments included under ‘direct’ policies. Jenner et al. (2012) categorize support mechanisms into ‘investment and generation’ policies.
2.2 ADVANTAGES OF GRID CONNECTED DISTRIBUTED
RENEWABLE ENERGY GENERATION
Distributed generation (also called on-site generation, dispersed generation, embedded generation,
decentralized generation and distributed energy) generates electricity from small energy systems, at
or near the point of consumption. Placed on roof-tops or ground-mounted, grid-connected distributed
generators are located on the customer side of the meter and are used to offset the customer’s energy
13 Lazard, “Lazard’s Levelized Cost of Energy Analysis - Version 12.0”, November 2018.
14 Gabriela Elizondo Azuela and Luiz Augusto Barroso, “Design and Performance of Policy Instruments to Promote the
Development of Renewable Energy-Emerging Experience in Selected Developing Countries” (World Bank, 2012); C. Batlle, I.J
Perez-Arriaga, and P. Zambrano-Barragan, “Regulatory Design for RES-E Support Mechanisms: Learning Curves, Market
Structure, and Burden-Sharing” (MIT Center for Energy and Environmental Policy Research, May 2011).
20 DEVELOPING THE NET METERING MARKET IN PAKISTAN
consumption or provide grid support through peak shaving, load shifting and ancillary services.
Distributed generation (DG), along with digitalization and decarbonization, make up key components
of the global energy shift.
Distributed solar PV is currently the only DG technology with significant market penetration, however
electric vehicles (EVs), combined heat and power generators, micro wind turbines and fuel cells all
have the potential to make bigger contributions to DG in the future. The economic case for DG is
primarily built on rapidly falling costs of solar PV technology and the fact that renewable energy
generation from distributed solar PV has reached, or will shortly reach, grid parity in many countries15.
Although grid-scale generation continues to have better economies of scale in most regions of the
world, 63 countries had policies in place by 2017 to support distributed renewable energy generation16.
In addition to the environmental benefits of DG from RE resources, government support for DG is
motivated by the additional benefits that DG systems can potentially deliver to stakeholders including
consumers, distribution companies (DISCOs) and transmission network owners (see Annex 1 for a
detailed list of benefits associated with DG systems). The benefits attributed to DG include:
• Mobilizing private finance - DG installations at private residences and industrial or
commercial locations are primarily financed through private funds. Policies to promote on-
site DG are therefore considered effective for mobilizing private finance to fund the green-
energy transition.17
• Reducing transmission investment - DG can reduce transmission investments, especially
when combined with batteries or other forms of storage. This ability however relies on the
location of DG, network topology, and power system technical constraints18.
• Providing grid support - Coupled with storage and demand response technologies, DG has
the potential to provide grid benefits such as frequency and voltage control19.
• Managing the role of ‘prosumers’ in the energy-transition - Energy consumers in
countries including Germany and Australia can profitably install and configure DG systems for
self-consumption without exporting power to the grid. With reductions in the cost of solar
PV and battery technologies, these so-called ‘prosumers’ could disrupt the existing energy
delivery systems. DG policies enable governments to better manage the growth of
prosumers20.
• Addressing land-use constraints - Rooftop PV installations can help address land use
constraints in island-nations and densely populated countries such as India21.
2.3 GLOBAL INVESTMENTS IN DISTRIBUTED GENERATION
Driven mainly by government policy in the form of financial subsidies, global investment in solar
projects of less than 1 MW (including off-grid units in remote areas) has grown significantly since 2004,
reaching a peak-investment of more than $75 billion in 2011, bolstered by generous DG support
schemes in EU countries (see Figure 2.2 and Figure 2.3). In 2017, investment in small-scale projects
15 Sakr et al., “Scaling Up Distributed Solar in Emerging Markets: The Case of the Arab Republic of Egypt.”
16 REN21, “RENEWABLES 2018 GLOBAL STATUS REPORT”, 21.
17 Elizabeth Doris, Sarah Busche, and Stephen Hockett, “Net Metering Policy Development in Minnesota: Overview of Trends in
Nationwide Policy Development and Implications of Increasing the Eligible System Size Cap”, Technical Report (Golden, Colorado: NREL, US Department of Energy, December 2009).
18 Junhua Zhao and John Foster, “Investigating the Impacts of Distributed Generation on Transmission Expansion Cost: An Australian
Case Study”, Energy Economics and Management Group Working Papers 2 (2010).
19 Travis Lowder, Ella Zhou, and Tian Tian, “Evolving Distributed Generation Support Mechanisms: Case Studies from United States, Germany, United Kingdom, and Australia”, Technical Report (National Renewable Energy Laboratory, 2017).
20 Rickerson et al., “Residential Prosumers - Drivers and Policy Options.”
21 Amy Rose et al., “Solar Power Applications in the Developing World” (Massachusetts Institute of Technology, 2015).
DEVELOPING THE NET METERING MARKET IN PAKISTAN 21
increased by 15% to $49.4 billion, with China alone recording $19.6 billion, a fivefold increase on 2016.
China accounted for almost 40% of the total global investment in small-scale solar projects in 201722.
Global installed residential and commercial PV capacity grew by 28GW to 173GW in 2017, recording
an increase of 27% on the 22GW added in 2016. The cumulative capacity of residential and commercial
PV has doubled since 2013 and grown more than five times since 2010.23
Japan leads the world in residential and commercial PV capacity, with 36GW installed by the end of
2017. With the exception of China, each of the top six countries listed in Figure 2.2 has achieved
‘commercial PV socket parity’ (i.e. commercial rooftop solar electricity in these countries is cheaper
than electricity from the grid), while Australia and Germany have also attained ‘residential PV socket
parity’. BNEF predicts China, the U.S. and almost all of Europe will be at socket parity by 2025.24
Figure 2.2: Top 10 Countries by Investment in Solar PV Projects Below 1MW, 2017,
and Growth on 2016, $BN25
22 BNEF, “New Energy Outlook.”
23 FS-UNEP/BNEF, “Global Trends in Renewable Energy Investment 2018.” (Frankfurt, Germany: Frankfurt School-UNEP Center, 2018).
24 FS-UNEP/BNEF
25 FS-UNEP/BNEF
22 DEVELOPING THE NET METERING MARKET IN PAKISTAN
Figure 2.3: Investment Growth in Solar PV Projects with Capacities
below 1 MW, 2004-2017, $BN26
Australia, Germany and Japan currently produce more solar energy from DG than centralized, grid-
scale solar (see Figure 2.4). Australian rooftop solar installations reached a record in April 2018, with
more than 100MW of solar installed each month, for seven consecutive months.27 Coupled with small-
scale batteries and grid-level demand response, DG is leading to increasingly decentralized energy
systems in the leading markets for distributed solar PV. According to BNEF, Australia could achieve
as much as 45% of total capacity located behind-the-meter by 2040 with Brazil, Japan, Mexico and
Germany each projected to have a decentralization ratio of more than 30%28.
Figure 2.4: Share of Utility-scale and Distributed Solar Globally and
in the Seven Largest Markets, Ordered by Total Market Size 29
26 FS-UNEP/BNEF.
27 Cole Latimer, “New Rooftop Solar Adding Equivalent of Coal-Fired Power Station Every Year”, Sydney Morning Herald, May 2018, sec. Energy.
28 BNEF, “New Energy Outlook.”
29 Sakr et al., “Scaling Up Distributed Solar in Emerging Markets: The Case of the Arab Republic of Egypt.”
DEVELOPING THE NET METERING MARKET IN PAKISTAN 23
PV comprises nearly a quarter of the installed generation capacity in Germany, and, on days of high
production, PV can meet over a third of Germany’s momentary peak demand30. The proportions for
Germany in Figure 2.4 represent DG connected to the low voltage (LV) grid only. However, a
significant share of DG in Germany is connected to the medium voltage (MV) grid. In 2016, the
country’s cumulative installed PV capacity reached 40 GW, of which 98% is ‘distributed’ (i.e.
interconnected at the low or medium voltage distribution level and serves loads close to the system)
and 50% is owned by private citizens31.
2.4 POLICY MECHANISMS FOR PROMOTING GRID-CONNECTED
DISTRIBUTED GENERATION
Compensation mechanisms are the leading form of policy support for distributed generation projects
worldwide. A compensation mechanism is a system of payments to residential, commercial and/or
industrial consumers for on-site production of energy, designed to improve the value proposition of
the DG investment for individual electricity consumers. Compensation mechanisms are one of several
policy and regulatory options that can address challenges associated with deploying DG systems.
Others include direct financial incentives (e.g., cash rebates, tax credits) and low-interest financing
programs. In 2017, 63 countries had a compensation mechanism in place to support DG, through
either a net-metering or net billing arrangement32.
A compensation mechanism is composed of three core elements (see Figure 2.5):
2.4.1 METERING & BILLING ARRANGEMENTS
This element defines how consumption and generation related electricity flows are measured and
billed. There are three generic options for metering & billing: Net metering, Buy All-Sell all (also known
as gross-metering) and net billing. The selection of a metering & billing arrangement only establishes
the measurement and billing of electricity flows to or from the grid and does not affect the rate of
compensation provided to a DG system owner. Each metering and billing arrangement is associated
with a different set of advantages and disadvantages (see Annex 2). In general, net metering or buy
all-sell all (with an associated FIT) are the preferred mechanism for nascent markets where DG
installations are negligible and compensation for DG owners is a relatively new policy. Policy makers
typically transition to net billing once a market for DG is successfully established and growing at an
acceptable pace.
2.4.2 RETAIL RATE DESIGN
The retail rate (known as the retail tariff in Pakistan) defines the retail tariff structure and precise
electricity purchase rates the DG system owner must pay for electricity received from the grid. The
retail rate design determines which costs the DG system owners can avoid if they consume self-
generated electricity instead of buying electricity from the grid.
30 Heinrich Boll, “Energy Transition - The Global Energiewende”, 2016; Harry Wirth, “Recent Facts about Photovoltaics in
Germany” (Fraunhofer ISE, June 14, 2016).
31 Wirth, “Recent Facts about Photovoltaics in Germany”; M.R. Weimar et al., “Integrating Renewable Generation into Grid
Operations” (Richland, WA: Pacific Northwest National Laboratory., 2016).
32 REN21, “RENEWABLES 2018 GLOBAL STATUS REPORT.”
24 DEVELOPING THE NET METERING MARKET IN PAKISTAN
Figure 2.5: Components of a Compensation Mechanism (Adapted from Original Source33)
2.4.3 SELL RATE DESIGN
This element defines the level of compensation a DG system owner receives for electricity exported
from the DG system to the distribution grid. Depending on the metering and billing arrangement
selected, the sell rate is applied to a set quantity of electricity that the DG system owner is authorized
to sell or export to the grid quantities. Sell rates can be static, remaining fixed over the length of an
interconnection contract or dynamic, changing with time (Time-of-Use rates) or by location, with
various degrees of granularity34. Feed-in-Tariffs or FITs are an example of sell-rate design.
In countries with significant installed capacity of distributed solar PV, the markets for distributed PV
grew rapidly as a result of government policies facilitating high rates of return on DG investment
(Grau, 2014). The most common form of policy incentives for grid-connected DG are net metering
(in the US, Brazil, India and Sri Lanka) and FITs (in Germany, Italy, Japan, Thailand and Australia)35.
Original net metering and FITs have been instrumental in establishing thriving markets for distributed
generation from solar PV. Prior to restructuring in 2012 and 2014 through the German Renewable
Energy Sources Act (EEG), Germany’s FIT was considered one of the strongest renewable energy
support policies in the world. FIT rates in the country were significantly reduced for all classes of PV
systems starting in 2012, resulting in an 80% decline in the annual PV installations by 201536.
* The terminology around compensation mechanisms varies across literature sources and is often misunderstood. Most
literature sources describe net metering, gross metering, net-billing, FITs and PPAs as compensation mechanisms without
addressing the distinctions in metering and billing arrangements or sell and buy rates. This report uses the framework and terminology defined by NREL in Zinaman et al., 2017 (see Figure 2.5).
33 Owen Zinaman et al., “Grid-Connected Distributed Generation: Compensation Mechanism Basics” (National Renewable Energy
Laboratory (NREL), October 2017).
34 Zinaman et al.
35 Sakr et al., “Scaling Up Distributed Solar in Emerging Markets: The Case of the Arab Republic of Egypt”; CNEE, “Net Metering
and Net Metering Aggregation” (Center For The New Energy Economy (CNEE), 2016).
36 Lowder, Zhou, and Tian, “Evolving Distributed Generation Support Mechanisms: Case Studies from United States, Germany,
United Kingdom, and Australia.”
Sell Rate Design
Static Rates Dynamic Rates
Net Billing Buy All, Sell All
or Gross Metering Net Metering
Metering & Billing Arrangements
Retail Rate Design
Large diversity of options
DEVELOPING THE NET METERING MARKET IN PAKISTAN 25
3. GLOBAL LESSONS ON IMPLEMENTING NET
METERING
The concept of net metering originated in the United States in 1983, due to requests from grid-
connected customers with micro-solar PV and wind facilities.17 The first formal pilot program was
established in 1995 and begun implementation in 1996 in California. Denmark became the second
country to adopt a pilot program in 199837. Net metering has proven to be an effective enabling policy
for the residential segment of the distributed generation market. Traditional net metering allows for
a consumer’s electricity meter to spin backwards, effectively erasing the cost of some of the electricity
consumed from the grid in exchange for injecting electricity produced by the consumer, back into the
grid. The mechanism relatively simple to implement for both DG system owners and DISCOs, can be
easily incorporated with existing retail electricity tariffs and does not always require utilities to
administer payments to electricity customers with net metering installations (see Table 3.1 for bill
settlement options available to DISCOs).
Net metering provides several benefits to various stakeholders;
• The policy promotes production of electricity, freeing up existing generation resources and
delivering benefits similar to demand side management or energy efficiency to DISCOs.
• Coupled with modern inverters, net metering can provide support for grid stabilization.
• Electricity consumers with net metering installations can save on electricity bills by reducing
power consumption from the grid (use self-generated electricity instead) and off-setting the
cost of grid-supply by feeding electricity back into the grid.
• Policymakers can leverage significant private investment for RE generation through net
metering policies since these installations are typically financed by individual consumers.
Although net metering can benefit all power system stakeholders, increasing levels of DG on grid-
networks can also induce costs that impact stakeholders and society at large in different ways. For
instance, DISCOs stand to lose revenue as consumption from the grid is replaced by self-generated
power, without the DISCO receiving any compensation for the ‘storage’ and balancing service it must
continue to provide to net metered customers. In addition, the benefits provided by DG to the
DISCOs can be location specific and vary based on the period during which electricity is sold back to
the grid, the demand profile of the producer and insolation levels at the point of generation, among
other factors. Over-capacity and un-planned proliferation of DG and net metering can therefore
impact grid stability and power supply quality (see Annex 1 for a comprehensive review of the costs
and benefits associated with generating renewable energy from DG installations).
Given these impacts, net metering schemes should ideally be developed in the context of the overall
power system plan. Key considerations for incorporating DG or net metering in power system
planning include the effects of the policy on consumers without net metering installations (cross-
subsidization concerns), financial and technical impacts on DISCOs and positive externalities such as
a reduction in environmental pollution.
This section of the report summarizes the net metering experiences of countries with developed DG
markets. Based on country case-studies and academic research, a set of ‘guiding principles for net
metering program implementation’ (Section 3.1) and ‘global best-practice in regulatory design’
(Section 3.2) are outlined first. Subsequent sections review the additional incentives required to
successfully implement net metering programs and market barriers that typically curtail the growth of
net metering in developing countries.
37 CNEE, “Net Metering and Net Metering Aggregation.”
26 DEVELOPING THE NET METERING MARKET IN PAKISTAN
3.1 GUIDING PRINCIPLES FOR NET METERING POLICY
DESIGN AND MARKET ROLLOUT
Policies such as net metering and FITs are used as cornerstone instruments* in countries where grid-
connected DG, especially distributed solar PV, has grown significantly. These policies and the
regulations associated with them are however only effective and economically efficient when designed
to cater to the local market environment and implemented through a carefully devised plan. Adequate
planning for program implementation (rollout) also mitigates many of the technical and financial
challenges associated with DG and net metering (see Annex 2 for a detailed discussion on the
technical and financial impacts of DG and net metering). Studies by international development
organizations and academic research identify several principles that can improve policy and regulatory
design and deliver better results from program implementation:
• Guiding principles for policy and regulatory design
Choice and complexity of the policy and regulations
Policy and regulatory design is a largely context-specific process; a compensation policy that
is successful in one part of the world can fail to achieve comparable results in other regions.
The choice and complexity of policies and regulations should therefore be tailored to the
context of the local market, including supply and demand volume, nature and level of risks and
institutional and administrative capacity. (see Table 3.1 for an overview of typical regulatory
design elements and the standards applied to these in successful, global DG compensation
programs). Individual regulatory elements should also be coordinated with wider conditions
in the energy market and potential impacts on stakeholders38.
Suitability of policies and regulations to sectoral maturity of the RE industry
Support or incentives provided to RE should be appropriate for sectoral maturity of the RE
industry in a country (Newbery et al, 2011) and the technologies receiving support39. For
instance, in nascent DG markets, policy instruments such as FITs and Net metering (in
combination with additional financial or fiscal incentives) can be very effective in establishing
and growing the market for DG. Once the incentives achieve their objective, policies can be
altered by reducing FIT payments, transitioning from net metering to net billing or withdrawing
incentives entirely.
Presence of technical and institutional prerequisites
Policy sequencing – having the basic legal, regulatory and technical prerequisites in place before
adopting a new policy – is an important principle for developing a market for distributed
generation. Institutional and administrative efficiency, frameworks for grid connection and
integration, land rights and the allocation of permits are examples of prerequisites for a DG
compensation policy to be effective40.
* A cornerstone instrument targets key investment risks and is the foundation upon which all complementary policy and
financial de-risking instruments are built.41.
38 Azuela and Barroso, “Design and Performance of Policy Instruments to Promote the Development of Renewable Energy-Emerging
Experience in Selected Developing Countries.”
39 Batlle, Perez-Arriaga, and Zambrano-Barragan, “Regulatory Design for RES-E Support Mechanisms: Learning Curves, Market
Structure, and Burden-Sharing.”
40 Azuela and Barroso, “Design and Performance of Policy Instruments to Promote the Development of Renewable Energy-Emerging Experience in Selected Developing Countries.”
41 Oliver Waissbein et al., “Derisking Renewable Energy Investment- A Framework to Support Policymakers in Selecting Public
Instruments to Promote Renewable Energy Investment in Developing Countries” (UNDP, April 2013).
DEVELOPING THE NET METERING MARKET IN PAKISTAN 27
3.1.1 GUIDING PRINCIPLES FOR PROGRAM ROLLOUT
Well-designed net metering policies and regulations can fail to achieve their objectives if the policy or
regulations are not accompanied by an appropriate implementation plan. In addition to providing
guidelines for regulations, policymakers should therefore stipulate implementation rules at the outset
of a net metering program, to improve the effectiveness of the policy and prevent or limit any
unintended impacts. Key considerations for an effective policy implementation plan include:
Treating policy and regulation as a dynamic process
Net metering should only be a provisional policy intervention, enabling the transition of an
energy system to a sustainable energy mix42. Policy adjustments or transition plans should
therefore be embedded in the policy design and made publicly available. Making stakeholders
aware in advance of planned or intended adjustments to the policy provides clarity to all
stakeholders and enables DISCOs and investors to manage program related risks and costs.
Starting with a restricted or pilot program
Pilot or restricted programs are helpful in testing the design limits of policies without significant
impact on any single stakeholder43. The limit or scope of a pilot net metering program can be
defined by a number of threshold criteria including the maximum allowable participants in the
program, the total installed capacity of the net metering installations in MW or by defining the
type of consumer eligible to participate in the program (for instance, limiting participation to
electricity consumers with 3-phase power supply connections).
Assessing technical and financial impacts on DISCOs
An upfront review of the technical impacts of net metering on low-voltage distribution
networks allows for systematic development of policy frameworks, reducing risks to
distribution companies and investors, and providing stability over the investment time frame.
Technical impacts that need to be analyzed and quantified include the impact of DG on
network harmonics (including voltage and frequency regulation) and the potential for reverse
power flow from the low-voltage to the medium-voltage network. A financial impact
assessment is useful in limiting the impact on DISCO revenues and consumers without net
metering installations.
Reviewing effects on energy network performance
The impact of net metering regulations on the energy network performance in the short-run
(operations) and in the long-run (expansion) should be considered and optimized across both
time horizons. When planned and implemented correctly, net metering programs can relieve
nodal congestion on electricity networks in the short-term and reduce the cost of network
expansion in the long-term.
Transitioning to alternatives to net metering
The penetration level of DG should be the leading criteria for altering or terminating net
metering programs. Penetration levels can be defined in terms of the cumulative capacity of
net metered installations, as a percentage of a network’s generation capacity or a percentage
of peak-demand on a network. Once a network achieves a predefined level of net metered
installations, compensation for DG can be adjusted (by offering an alternative compensation
scheme) or phased-out entirely. Common alternatives to net metering programs include net
billing or value-of-solar (VoS) tariffs and the application of fixed and variables charges to net
metered customers, among other options.
42 Azuela and Barroso, “Design and Performance of Policy Instruments to Promote the Development of Renewable Energy-Emerging
Experience in Selected Developing Countries.”
43 CNEE, “Net Metering and Net Metering Aggregation.”
28 DEVELOPING THE NET METERING MARKET IN PAKISTAN
3.2 BEST PRACTICE IN NET METERING REGULATION DESIGN
AND INTERCONNECTION STANDARDS
3.2.1 REGULATORY DESIGN
Net metering regulations define the scope and impact of a net metering program. Generally, the
differences between net metering regulations across countries stem from local market conditions, the
structure of the power sector and the policy objective behind the scheme. Other important
considerations for setting regulatory design parameters include the availability of supporting financial
incentives and the expected impacts of the program on DISCOs and consumers without net metering
installations (cross-subsidization impact). Net metering programs in most jurisdictions define and set
limits on:
• Metering and billing arrangements
• Sell-rate design
• Contract length
• Program size cap
• System size cap
• Local level cap
• Netting frequency (or credit reconciliation period)
• Crediting terms and
• Allowable net excess generation (NEG)
Additional elements that are also included in regulatory design, although less frequently, include
technology eligibility, customer eligibility, ownership of renewable energy credits (where available),
identifying DISCOs to participate in the scheme, assigning or disallowing additional fees and specifying
business models that can be implemented based on net metering. Table 3.1 describes the various
regulatory elements and global best-practice in designing net metering regulations.
3.2.2 INTERCONNECTION STANDARDS
Interconnection standards set out the legal, technical and procedural requirements that electricity
consumers, system installers and DISCOs must follow when connecting a distributed generator to the
grid. While net metering and interconnection standards are different regulatory components, both are
essential to increase the deployment of DG installations and should be designed to supplement each
other. The interconnection of distributed generation is an important regulatory issue because of the
safety and reliability issues associated with DG connecting to the electricity grid, however
unnecessarily lengthy or complex interconnection rules can lead to delays and increase the cost of
DG installations. By setting out a clear and efficient process for grid connection, interconnection
standards mitigate some of the risks associated with DG grid connection while encouraging the
development of the DG market.44.
Historically, a lack of interconnection standards has been a major barrier to the development of the
DG market in the United States and several entities at the federal and state levels have developed
interconnection rules to streamline DG grid connection. In 2005, the Interstate Renewable Energy
Council (IREC) compiled best-practices from state and federal actions on small generator
interconnection to develop IREC’s first ever interconnection procedures. Comprising model
interconnection rules, model interconnection agreements and application forms, and technical
44 Clean Coalition, “Streamlining the Interconnection of Advanced Energy Solutions to the Grid” (California Energy Commission,
September 2017).
DEVELOPING THE NET METERING MARKET IN PAKISTAN 29
interconnection procedures, IREC promotes its interconnection rules as the best model for expedited,
low-cost DG interconnection45. The IREC model is based on the IEEE 1547 quality and UL 1741 testing
standards standard which allows distribution companies in the US to expedite the review of several
protective functions of DG systems; for generators that comply with IEEE 1547, the Federal Electricity
Regulatory Commission, FERC, allows the expedited interconnection of systems up to 10 kW. The
interconnection procedures contained in the IREC model are divided into four areas46:
• Level 1: 10 kilowatts (kW) and smaller for certified inverters (residential-sized systems)
• Level 2: 2 MW and smaller, certified (commercial net metering and other systems)
• Level 3: 10 MW and smaller, certified, non-exporting (designed for combined-heat-and-power
facilities)
• Level 4: All others up to 10 MW, including generators that do not qualify for other standards
The first three levels in the IREC model require a preliminary review by an independent third-party
testing laboratory. The fourth category includes all DG installations that do not meet the criteria of
the first three categories or require a complete review of their custom protection equipment. The
goal of the IREC rules is to categorize all possible DG interconnections from least complex to most
complex so that the fees and process for an interconnection application can be minimized while
maintaining the highest level of safety and reliability 47. Several countries have used the IREC model
to develop their own interconnection rules.
45 Chris Cook and Rusty Haynes, “Analysis of US Interconnection and Net-Metering Policy” (North Carolina Solar Center, n.d.).
46 IREC, “Model Interconnection Procedures” (Interstate Renewable Energy Council (IREC), 2013).
47 Chris Cook and Rusty Haynes, “Analysis of US Interconnection and Net-Metering Policy” (North Carolina Solar Center,
n.d.).
30 DEVELOPING THE NET METERING MARKET IN PAKISTAN
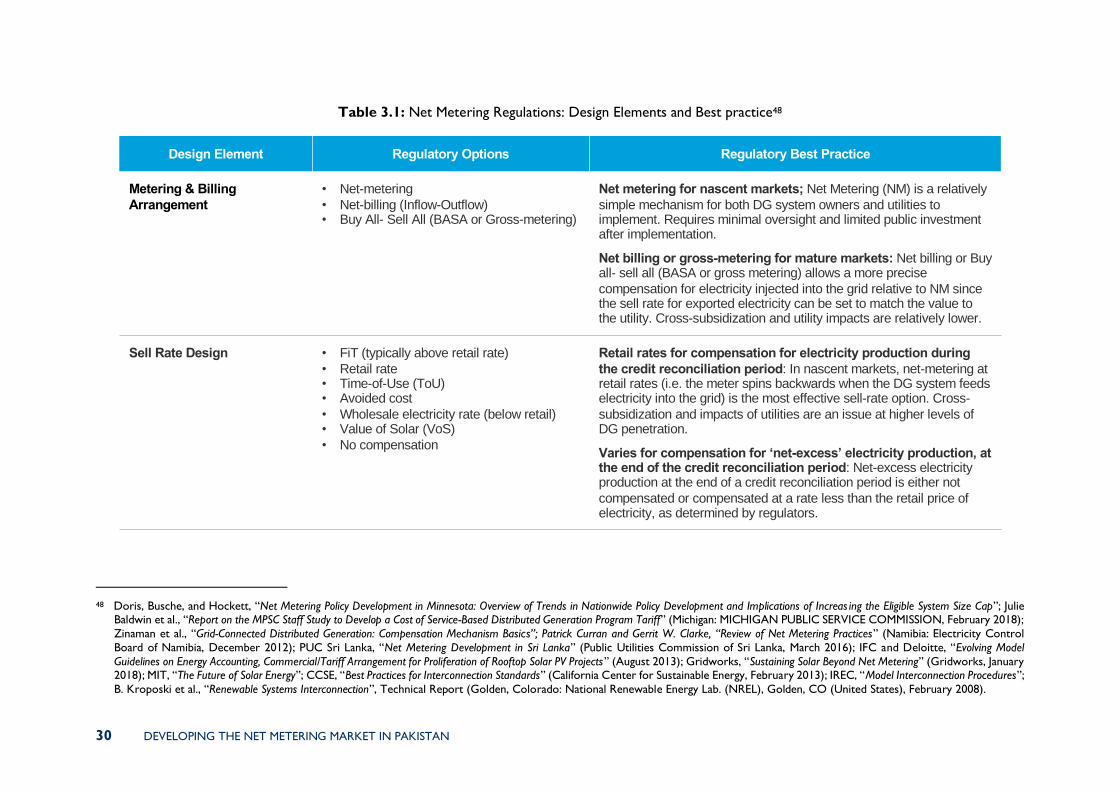
Table 3.1: Net Metering Regulations: Design Elements and Best practice48
48 Doris, Busche, and Hockett, “Net Metering Policy Development in Minnesota: Overview of Trends in Nationwide Policy Development and Implications of Increas ing the Eligible System Size Cap”; Julie
Baldwin et al., “Report on the MPSC Staff Study to Develop a Cost of Service-Based Distributed Generation Program Tariff” (Michigan: MICHIGAN PUBLIC SERVICE COMMISSION, February 2018);
Zinaman et al., “Grid-Connected Distributed Generation: Compensation Mechanism Basics”; Patrick Curran and Gerrit W. Clarke, “Review of Net Metering Practices” (Namibia: Electricity Control
Board of Namibia, December 2012); PUC Sri Lanka, “Net Metering Development in Sri Lanka” (Public Utilities Commission of Sri Lanka, March 2016); IFC and Deloitte, “Evolving Model
Guidelines on Energy Accounting, Commercial/Tariff Arrangement for Proliferation of Rooftop Solar PV Projects” (August 2013); Gridworks, “Sustaining Solar Beyond Net Metering” (Gridworks, January 2018); MIT, “The Future of Solar Energy”; CCSE, “Best Practices for Interconnection Standards” (California Center for Sustainable Energy, February 2013); IREC, “Model Interconnection Procedures”;
B. Kroposki et al., “Renewable Systems Interconnection”, Technical Report (Golden, Colorado: National Renewable Energy Lab. (NREL), Golden, CO (United States), February 2008).
Design Element Regulatory Options Regulatory Best Practice
Metering & Billing
Arrangement
• Net-metering
• Net-billing (Inflow-Outflow)• Buy All- Sell All (BASA or Gross-metering)
Net metering for nascent markets; Net Metering (NM) is a relatively
simple mechanism for both DG system owners and utilities to implement. Requires minimal oversight and limited public investment after implementation.
Net billing or gross-metering for mature markets: Net billing or Buy all- sell all (BASA or gross metering) allows a more precise
compensation for electricity injected into the grid relative to NM since the sell rate for exported electricity can be set to match the value to the utility. Cross-subsidization and utility impacts are relatively lower.
Sell Rate Design • FiT (typically above retail rate)
• Retail rate• Time-of-Use (ToU)• Avoided cost
• Wholesale electricity rate (below retail)• Value of Solar (VoS)
• No compensation
Retail rates for compensation for electricity production during
the credit reconciliation period: In nascent markets, net-metering at retail rates (i.e. the meter spins backwards when the DG system feeds electricity into the grid) is the most effective sell-rate option. Cross-
subsidization and impacts of utilities are an issue at higher levels of DG penetration.
Varies for compensation for ‘net-excess’ electricity production, at the end of the credit reconciliation period: Net-excess electricity production at the end of a credit reconciliation period is either not
compensated or compensated at a rate less than the retail price of electricity, as determined by regulators.
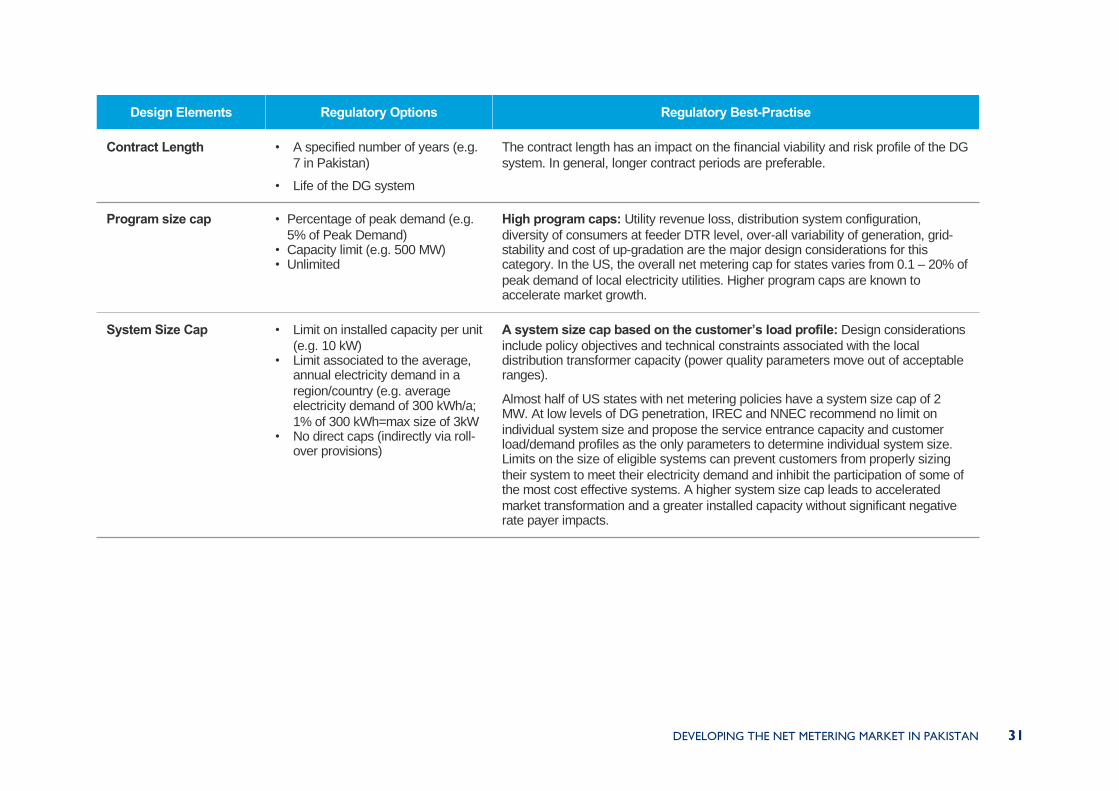
DEVELOPING THE NET METERING MARKET IN PAKISTAN 31
Design Elements Regulatory Options Regulatory Best-Practise
Contract Length • A specified number of years (e.g.
7 in Pakistan)
• Life of the DG system
The contract length has an impact on the financial viability and risk profile of the DG
system. In general, longer contract periods are preferable.
Program size cap • Percentage of peak demand (e.g.
High program caps: Utility revenue loss, distribution system configuration,
diversity of consumers at feeder DTR level, over-all variability of generation, grid-stability and cost of up-gradation are the major design considerations for this category. In the US, the overall net metering cap for states varies from 0.1 – 20% of
peak demand of local electricity utilities. Higher program caps are known to accelerate market growth.
System Size Cap • Limit on installed capacity per unit
(e.g. 10 kW)• Limit associated to the average,
annual electricity demand in a
region/country (e.g. average electricity demand of 300 kWh/a;
1% of 300 kWh=max size of 3kW• No direct caps (indirectly via roll-
over provisions)
A system size cap based on the customer’s load profile: Design considerations
include policy objectives and technical constraints associated with the local distribution transformer capacity (power quality parameters move out of acceptable ranges).
Almost half of US states with net metering policies have a system size cap of 2 MW. At low levels of DG penetration, IREC and NNEC recommend no limit on
individual system size and propose the service entrance capacity and customer load/demand profiles as the only parameters to determine individual system size. Limits on the size of eligible systems can prevent customers from properly sizing
their system to meet their electricity demand and inhibit the participation of some of the most cost effective systems. A higher system size cap leads to accelerated
market transformation and a greater installed capacity without significant negative rate payer impacts.
32 DEVELOPING THE NET METERING MARKET IN PAKISTAN
Design Elements Regulatory Options Regulatory Best Practise
Local Level Cap • Percentage of Distribution
Transformer capacity
15% of DT capacity initially: Design considerations include distribution system
configuration and diversity of consumers at feeder DTR level. Limit on grid-penetration at 15% of Distribution Transformer capacity is recommended in the first phase of net-metering programs especially where grid-infrastructure is weak or inadequate and
upgrades might be required to accommodate high levels of DG penetration.
Netting Frequency and
Credit Reconciliation
Period (Roll over
period) for Net Excess
Generation (NEG)
• Yearly
• Monthly• Daily• Hourly
• Continuous roll-over
Indefinite roll-over of NEG; The main design considerations include the commercial
interest of the utility and the available metering technology (e.g. smart or ToU meters). Electricity imports & exports are netted monthly in most US states, and reconciled annually. Longer reconciliation periods balance production against consumption and
improve customer economics.
More granular netting (e.g. daily or hourly) generally reduces solar customer
economics, but may be considered when penetration levels increase, or in conjunction with deployment of other DG resources as storage.
Driven by commercial interests and administrative capacity of the utility, cyclic net-
metering and Perpetual roll-over are the two most common approaches for reconciling and crediting net excess generation.
Cyclic net metering requires reconciliation of net-production after a pre-determined
period (usually monthly or annually). At the end of the reconciliation period, the DG customer is compensated for excess kWh fed into the grid, at a rate lower than the
retail price of electricity, with compensation provided as bill credits (energy settlement) or cash pay-outs (commercial settlement).
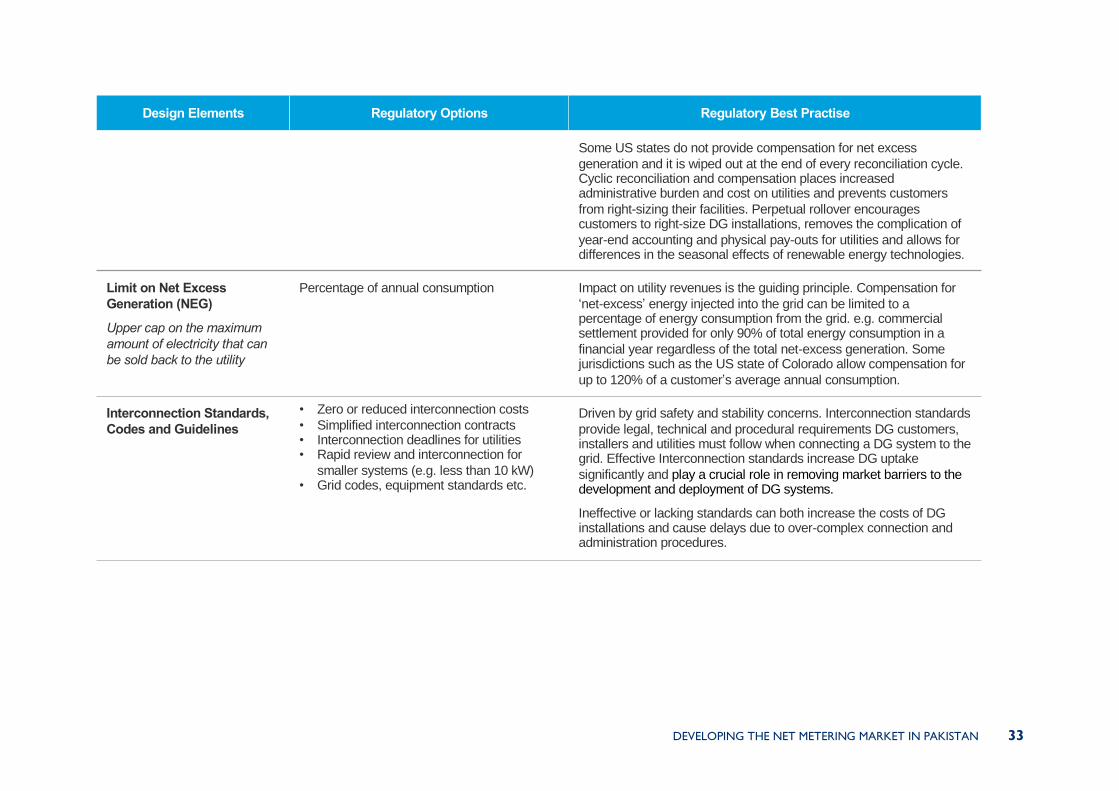
DEVELOPING THE NET METERING MARKET IN PAKISTAN 33
Design Elements Regulatory Options Regulatory Best Practise
Some US states do not provide compensation for net excess
generation and it is wiped out at the end of every reconciliation cycle. Cyclic reconciliation and compensation places increased administrative burden and cost on utilities and prevents customers
from right-sizing their facilities. Perpetual rollover encourages customers to right-size DG installations, removes the complication of
year-end accounting and physical pay-outs for utilities and allows for differences in the seasonal effects of renewable energy technologies.
Limit on Net Excess
Generation (NEG)
Upper cap on the maximum
amount of electricity that can
be sold back to the utility
Percentage of annual consumption Impact on utility revenues is the guiding principle. Compensation for
‘net-excess’ energy injected into the grid can be limited to a percentage of energy consumption from the grid. e.g. commercial settlement provided for only 90% of total energy consumption in a
financial year regardless of the total net-excess generation. Some jurisdictions such as the US state of Colorado allow compensation for
up to 120% of a customer’s average annual consumption.
Interconnection Standards,
Codes and Guidelines
• Zero or reduced interconnection costs
• Simplified interconnection contracts• Interconnection deadlines for utilities • Rapid review and interconnection for
smaller systems (e.g. less than 10 kW)• Grid codes, equipment standards etc.
Driven by grid safety and stability concerns. Interconnection standards
provide legal, technical and procedural requirements DG customers, installers and utilities must follow when connecting a DG system to the grid. Effective Interconnection standards increase DG uptake
significantly and play a crucial role in removing market barriers to the development and deployment of DG systems.
Ineffective or lacking standards can both increase the costs of DG installations and cause delays due to over-complex connection and administration procedures.
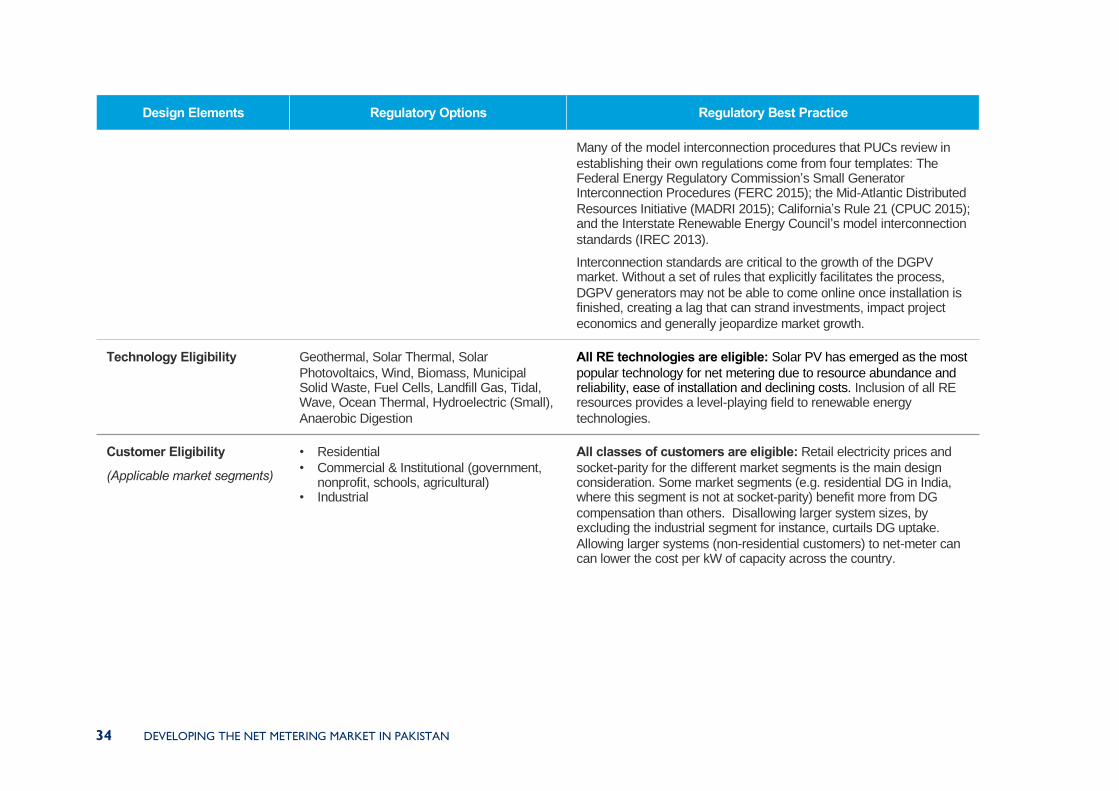
34 DEVELOPING THE NET METERING MARKET IN PAKISTAN
Design Elements Regulatory Options Regulatory Best Practice
Many of the model interconnection procedures that PUCs review in
establishing their own regulations come from four templates: The Federal Energy Regulatory Commission’s Small Generator Interconnection Procedures (FERC 2015); the Mid-Atlantic Distributed
Resources Initiative (MADRI 2015); California’s Rule 21 (CPUC 2015); and the Interstate Renewable Energy Council’s model interconnection
standards (IREC 2013).
Interconnection standards are critical to the growth of the DGPV market. Without a set of rules that explicitly facilitates the process,
DGPV generators may not be able to come online once installation is finished, creating a lag that can strand investments, impact project
economics and generally jeopardize market growth.
Technology Eligibility Geothermal, Solar Thermal, Solar
All RE technologies are eligible: Solar PV has emerged as the most
popular technology for net metering due to resource abundance and reliability, ease of installation and declining costs. Inclusion of all RE resources provides a level-playing field to renewable energy
All classes of customers are eligible: Retail electricity prices and
socket-parity for the different market segments is the main design consideration. Some market segments (e.g. residential DG in India, where this segment is not at socket-parity) benefit more from DG
compensation than others. Disallowing larger system sizes, by excluding the industrial segment for instance, curtails DG uptake.
Allowing larger systems (non-residential customers) to net-meter can can lower the cost per kW of capacity across the country.
DEVELOPING THE NET METERING MARKET IN PAKISTAN 35
Design Elements Regulatory Options Regulatory Best Practise
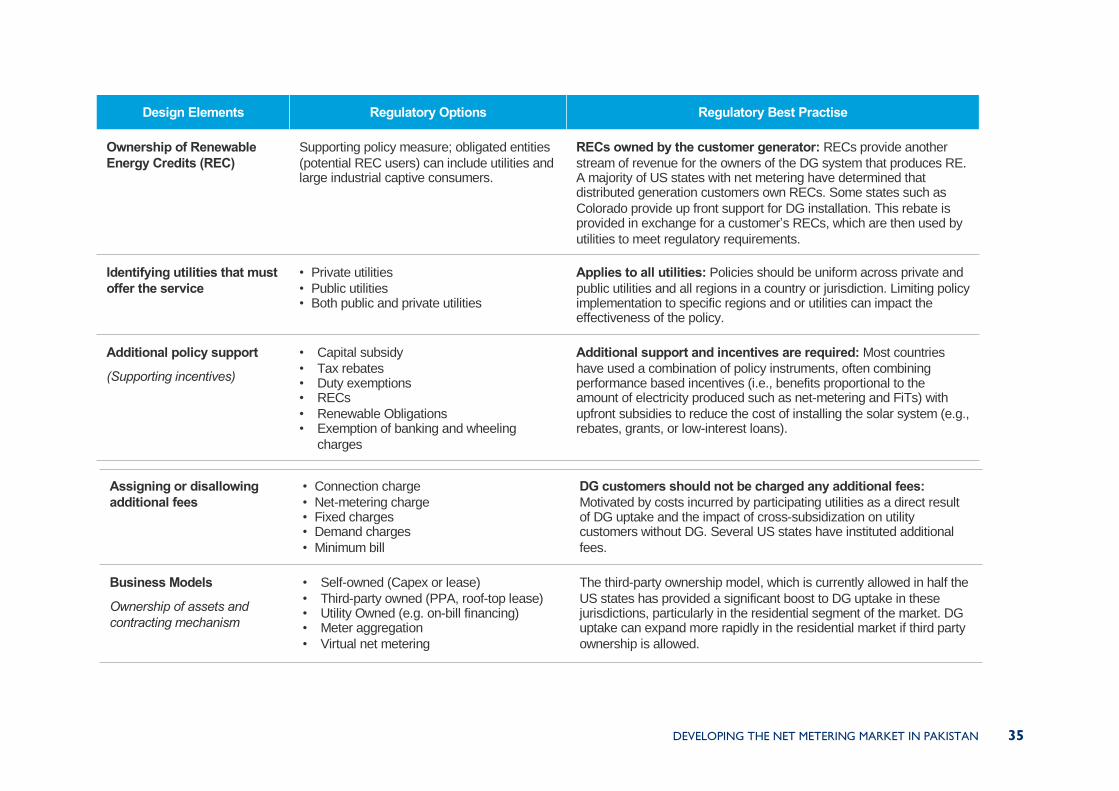
Ownership of Renewable
Energy Credits (REC)
Supporting policy measure; obligated entities
(potential REC users) can include utilities and large industrial captive consumers.
RECs owned by the customer generator: RECs provide another
stream of revenue for the owners of the DG system that produces RE. A majority of US states with net metering have determined that distributed generation customers own RECs. Some states such as
Colorado provide up front support for DG installation. This rebate is provided in exchange for a customer’s RECs, which are then used by
utilities to meet regulatory requirements.
Identifying utilities that must
offer the service
• Private utilities
• Public utilities• Both public and private utilities
Applies to all utilities: Policies should be uniform across private and
public utilities and all regions in a country or jurisdiction. Limiting policy implementation to specific regions and or utilities can impact the effectiveness of the policy.
Additional policy support
(Supporting incentives)
• Capital subsidy
• Tax rebates• Duty exemptions• RECs
• Renewable Obligations• Exemption of banking and wheeling
charges
Additional support and incentives are required: Most countries
have used a combination of policy instruments, often combining performance based incentives (i.e., benefits proportional to the amount of electricity produced such as net-metering and FiTs) with
upfront subsidies to reduce the cost of installing the solar system (e.g., rebates, grants, or low-interest loans).
DG customers should not be charged any additional fees:
Motivated by costs incurred by participating utilities as a direct result of DG uptake and the impact of cross-subsidization on utility customers without DG. Several US states have instituted additional
The third-party ownership model, which is currently allowed in half the
US states has provided a significant boost to DG uptake in these jurisdictions, particularly in the residential segment of the market. DG uptake can expand more rapidly in the residential market if third party
ownership is allowed.
36 DEVELOPING THE NET METERING MARKET IN PAKISTAN
3.3 ADDITIONAL INCENTIVES REQUIRED FOR SUCCESSFUL
NET METERING PROGRAMS
Distributed generation compensation schemes, such as net metering, face inherent challenges and can
rarely support the growth of DG without additional policy and financial incentives. In many countries,
the market, for distributed solar PV for instance developed rapidly only after the government provided
high rates of return on distributed solar investments through additional financial or fiscal incentives49.
A 10-state case study in the US found that customer-owned distributed wind generation systems are
not promoted through net metering policies alone, and additional incentives and educational programs
are required to improve the uptake of DG50.
As a result, net metering is often a single component of a suite of policy options to incentivize DISCO
customers to install DG systems. Most countries use a combination of policy instruments
(performance-based incentives where benefits are proportional to the amount of electricity produced
e.g. FITs and net metering) and upfront subsidies that reduce the cost of installing the DG system (e.g.
rebates, grants, or low-interest loans)51. Some countries provide additional incentives to specific
market segments only. In Taiwan, for instance, a FIT based compensation scheme is employed to
encouraging investment in systems under 10 kW52. The effectiveness of DG compensation schemes is
strongly linked to the availability of fiscal and financial incentives in developing countries specifically,
where RE investment risks are higher and more diverse53.
Figure 3.1: Policy Incentives Provided to Renewable Energy in Countries
around the World in 2018 (Adapted from REN21, 2018)
During the last decade, the most widely used incentives for increasing private investment in distributed
solar PV installations include fiscal incentives and public financing thorough capital subsidies, VAT
49 T. Grau, “Responsive Feed-in Tariff Adjustment to Dynamic Technology Development” (Energy Economics, 2014),
http://doi.org/10.1016/j.eneco.2014.03.015.
50 T.L. Forsyth, M. Pedan, and T. Gagliano, “The Effects of Net Metering on the Use of Small-Scale Wind Systems in the United
States” (Golden, Colorado: National Renewable Energy Laboratory (NREL), 2002); Sanya Carley and Tyler R. Browne,
“Innovative US Energy Policy: A Review of States’ Policy Experiences”, WIREs Energy and Environment, February 2012, https://doi.org/10.1002/wene.58.
51 Sakr et al., “Scaling Up Distributed Solar in Emerging Markets: The Case of the Arab Republic of Egypt.”
52 T. D. Couture et al., “Next Generation of Renewable Electricity Policy: How Rapid Change Is Breaking Down Conventional Policy
Categories” (National Renewable Energy Lab. (NREL), Golden, CO (United States), February 1, 2015), https://doi.org/10.2172/1172282.
53 Azuela and Barroso, “Design and Performance of Policy Instruments to Promote the Development of Renewable Energy-Emerging
Experience in Selected Developing Countries.”
0 20 40 60 80 100 120 140 160
RETargets(Power)
Netmetering/billing
Quotaobligations/RPS
TradableREC
Investmentorproductiontaxcredits
Othertaxreductions
Publicsubsidies,loans,rebatesetc.
DEVELOPING THE NET METERING MARKET IN PAKISTAN 37
reduction, taxes credits and public investment, loans, or grants etc.54. Figure 3.1 shows the various
policy incentives, in addition to FITs and net metering, that are offered in countries around the world
to support renewable energy55.
3.4 BARRIERS TO NET METERING MARKET GROWTH IN
DEVELOPING COUNTRIES
Net metering policies can fail to deliver results if other critical aspects of the enabling environment
for DG are not considered in parallel. Challenges related to the enabling environment or market
conditions in emerging markets include system financing barriers (such as limited access to debt, lack
of diversity in business models and financing risks associated with consumers and off-takers) and non-
financial barriers (including institutional capacity issues and technical constraints such as the
unavailability of adequate transmission infrastructure). Compensation policies such as net metering do
not account for these barriers or mitigate the risks associated with them. Additional measures -
capacity building of key institutions, provision of concessional finance and reduction of ‘’soft-costs’
through market pull strategies among others - are often required to remove the barriers limiting net
metering uptake and reduce the investment risk associated with DG projects in developing countries56.
The slow growth of grid-connected DG in both China and India highlights the relevance of this issue
in emerging markets. Both countries have been unable to develop the DG market as intended, despite
providing targeted policy support (net metering in India and FITs in China) and financial subsidies to
the sector57. India has set ambitious targets for distributed solar PV, aiming to achieve 40 GW by 2022
however, the rooftop solar capacity in India was only 0.7 GW at the end of March 201658 and the
country has recently scaled down its original target of 40 GW of rooftop solar power. The main
challenges facing the growth of DG in India are well documented and include technology and market
maturity, commercial viability, grid interconnection issues, resistance from incumbents (such as
DISCOs and power sector operators), availability of financing and a general lack of public awareness
about the utility and benefits of net metering 59.
China set a target to install 20 GW of DG capacity by 2015 and 35 GW by 2017. But similar to the
DG experience in India, total DG installations stood at only 7.03 GW by the first quarter of 2016.
Financing and interconnection issues are identified as the main barriers impacting the growth of
distributed solar PV in China. The financing challenges stem from several issues, some inherent to the
DG technology60:
• There is an inherent mismatch between the standard financing instruments on offer from the
financial sector and the requirements of DG installations; The size of a typical net metered,
DG installation is too small to attract capital market or fund investment and too big to be
easily self-funded.
54 L. Dusonchet and E. Telaretti, “Comparative Economic Analysis of Support Policies for Solar PV in the Most Representative EU
Countries”, Renewable and Sustainable Energy Reviews, no. 42 (2015): 986-98.
55 REN21, “RENEWABLES 2018 GLOBAL STATUS REPORT.”
56 Azuela and Barroso, “Design and Performance of Policy Instruments to Promote the Development of Renewable Energy-Emerging
Experience in Selected Developing Countries.”
57 ADB, “Lesson Learnt from ADB India Solar Power Generation Guarantee Facility”, Volume II: Assessment of Alternate Financing
Products, II (Asian Development Bank, 2015); X. Liang, “Lost in Transmission - Distributed Solar Generation in China” (China Environment Forum., 2014).
58 Sandeep Gupta, Jai Sharda, and Gireesh Shrimali, “The Drivers and Challenges of Third Party Financing for Rooftop Solar Power
in India” (India: Climate Policy Initiative, September 2016).
59 Sarah Martin and Joshua N. Ryor, “Prosumers in Bengaluru: Lessons for Sclaing Rooftop Solar PV”, Working Paper (Washington, D.C.: World Resources Institute, 2016).
60 Travis Lowder et al., “Historical and Current U.S. Strategies for Boosting Distributed Generation” (Colorado, USA, August
2015).
38 DEVELOPING THE NET METERING MARKET IN PAKISTAN
• Rooftop and land ownership issues makes DG more challenging; Residential projects are
typically installed on apartment buildings and require the consensus of all building occupants.
For commercial projects, the turnover of business ownership is more frequent than the life of
the solar project itself. As a result, there are difficulties in using the solar project as collateral
to obtain a bank loan61.
• Low electricity tariffs discourage DG uptake; Despite the relatively high FIT rate offered in
China, the DG photovoltaic (PV) market in the residential sector has not taken off. This is
primarily due to low electricity prices for residential consumers, which in effect reduce the
savings from using self-generated electricity and diminish the economic value of the DG
installation.
• The high cost of financing DG systems is unaffordable for most electricity consumers; The
financing cost for solar is generally above 8% and can be as high as 10% to12%. This is primarily
due to the risks associated with the quality of the solar panels and the ability of the power
consumer to repay the loan62.
Many barriers to net metering, linked to the enabling environment or market are common across
developing market countries. Figure 3.2 provides an overview of the barriers that typically curtail
the diffusion of DG and net metering technologies in developing countries:
Figure 3.2: Common Barriers to Net Metering Proliferation in Developing Countries
Financial Barriers Technical Barriers
• High System cost: The cost of solar panels
and other system hardware as well as the
‘soft costs’ associated with customer acquisition, labor rates, permitting etc.
• Market distortions due to subsidized
electricity rates
• Lack of additional financial incentives (e.g.
tax rebates, quotas, subsidized loans and grants etc.) or low and ineffective capital
• Limited access to debt and high cost of financing due to risk associated with DGPV
installations (quality of equipment, consumer credit risk, counterparty risk etc.)
• Technical impacts on the power-grid: Grid
reliability issues and capacity limitations
• Limited technical capacity of the program administrator
• Grid interconnection challenges
• Technology Maturity: Inverters have historically been the leading cause of PV
systems failures.
• Lack of access to data and knowledge.
Uncertainly in projects developer selection (perceived performance risk.)
61 Lijia Wang, “Financing Difficulties for Distributed Solar PV”, Energy (Chinese) 2 (2014): 65–67.
62 L. Dai, “China’s Solar PV Station and Distributed PV Both Facing Financing Problems”, Energy Conservation and Environmental
Protection, 2014.
DEVELOPING THE NET METERING MARKET IN PAKISTAN 39
Institutional Barriers Other Barriers
• Resistance from power sector incumbents
such as utilities and power sector operators
• Limited institutional capacity of the
distribution companies to administrator the program
• Complicated process for subscribing and
lack of standardization across utilities
• Market maturity
• Limited reach and appeal of the net-metering
program, lack of public awareness about the availability of the program
• Inadequate understanding of regulations, PV performance, cost, and payback amongst electricity consumers
• Limited availability of suitable roof space
• Land-ownership issues.
(Adapted from multiple sources63)
3.5 IMPACTS ON STAKEHOLDERS
Increasing levels of DG on grid-networks produces costs and benefits that impacts energy system
stakeholders and society at large in different ways (See Annex 1 for an overview of costs and benefits
associated with distributed renewable energy generation). Important impacts of DG on power sector
stakeholders include:
3.5.1 PROSUMERS
Prosumers (electricity consumers with DG or net metering installations) benefit from DG through
cost savings on utility bills. There is broad support globally for the ability of consumers to install and
operate DG systems on their own property and ‘prosumers’ are a growing consumer category in
many countries.
3.5.2 GOVERNMENTS
Government decisions that constrain or enable prosumers can have significant financial implications
on stakeholders and technical impacts on the electricity grid. Governments could also face a revenue
loss from reduced tax collections.
3.5.3 INCUMBENT GENERATORS
Prosumers compete with incumbent generators and can impact their dispatch order and the revenues
they generate from electricity supply. However, the emergence of prosumers could also provide new
business opportunities to generation companies.
3.5.4 SUPPLY CHAIN (TECHNOLOGY PROVIDERS)
The growth of DG markets can significantly benefit technology providers in the DG industry with a
positive impact on both services and manufacturing for distributed generation.
3.5.5 CONSUMERS
Net metering shifts a portion of the DG customer’s allocated share of fixed and variable costs to
customers without DG, creating a cross-subsidy effect. However, a recent study by Lawrence Berkley
National Labs (LBNL) found that cost-shifting occurs when DG penetration exceeds 10% of grid-
63 PUC Sri Lanka, “Net Metering Development in Sri Lanka”; Sakr et al., “Scaling Up Distributed Solar in Emerging Markets: The
Case of the Arab Republic of Egypt”; JSF, “Renewable Energy in Jordan”, (October 2017); Lowder, Zhou, and Tian, “Evolving
Distributed Generation Support Mechanisms: Case Studies from United States, Germany, United Kingdom, and Australia”; BNEF, “Accelerating India’s Clean Energy Transition: The Future of Rooftop PV and Other Distributed Energy Markets in India”
(Bloomberg New Energy Finance, November 2017); Kroposki et al., “Renewable Systems Interconnection”; Martin and Ryor,
“Prosumers in Bengaluru: Lessons for Sclaing Rooftop Solar PV.”
40 DEVELOPING THE NET METERING MARKET IN PAKISTAN
supply. Currently only three states in the US are close to that level of DG penetration and even at
10%, the rate impact is only an increase of $0.005/kWh64.
3.5.6 TRANSMISSION AND DISTRIBUTION COMPANIES
As consumption form the grid is replaced by distributed generation, transmission and distribution
companies face impacts on revenues, network costs and grid stability:
• Impact on utility revenue
With growing penetration of DG, utilities stand to lose revenue (to the extent that recovery of
distribution costs or charges is decreases) while incurring the same or increased costs for
maintaining transmission and distribution capacity. Network companies also have to bear the cost
of the difference in energy costs between the hours of generation and hours of consumption under
net metering. However, the decrease in revenue can be compensated by revenue de-coupling
mechanisms. Utilities can also benefit from DG if systems are appropriately situated within the
grid, reducing congestion, curtailing transmission losses or decreasing transmission costs.
Distribution companies are also potentially affected by administrative costs, but these can be offset
at least partially by fees charged to DG customers.
• Impact on network costs
Distribution network energy losses and associated costs generally decline as the share of PV
energy in a distribution network increases up to nearly 25%. At very high levels of PV penetration
(beyond 25%), losses start to increase, and new investments are required to maintain quality of
service. In areas of low insolation, without specific mitigating measures, distribution costs could
of DG can also lead to stress on conventional units from increased cycling. Although additional
operations and maintenance costs due to increased cycling were found to be small compared to
overall system production cost savings in one recent study66.
• Impact on grid stability
The increased use of intermittent DG sources can affect grid stability. DG compensation programs
such as net metering should therefore be incorporated in overall power system planning. Both
technical and regulatory capacity is needed to ensure that net metering systems are installed
correctly, that distribution networks are able to accommodate net metered systems and that the
appropriate regulation is developed and implemented. Increased PV penetrations can cause voltage
issues that could exceed the tolerance levels of installed equipment and cause frequency variations.
Interconnection rules have traditionally been designed to assume that these impacts would be
negligible below 15% of peak load on a distribution circuit, although in some cases higher levels
have been achieved with no impacts on the circuit67.
64 Galen Barbose, “Putting the Potential Rate Impacts of Distributed Solar into Context”, LBNL-1007060 (California, USA:
Lawrence Berkley National Laboratory (Berkeley Lab), 2017).
65 MIT, “The Future of Solar Energy.”
66 D. Lew et al., “The Western Wind and Solar Integration Study Phase 2” (National Renewable Energy Laboratory (NREL),
September 2013).
67 M. Coddington et al., “Updating Technical Screens for PV Interconnection” (Austin, Texas: Institute of Electrical and
Electronics Engineers (IEEE), June 2012).
DEVELOPING THE NET METERING MARKET IN PAKISTAN 41
4. NET METERING IN PAKISTAN: SITUATION
ANALYSIS
Given the high cost of electricity, excessive system losses and above average solar insolation levels in
most of the country’s land area, distributed power generation, particularly from solar PV, has the
potential to achieve substantial scale in Pakistan. In addition, DG from renewable resources can deliver
clean, sustainable and indigenous electricity to the national grid, reducing the country’s energy import
dependence. Strategically placed DG can also alleviate congestion on the network and provide voltage
support to the distribution grid (see Annex-1 for more details on the benefits of DG from renewable
resources). Recognizing the advantages of grid connected DG, the Government of Pakistan included
net metering in the country’s RE policy (Policy for Development of Renewable Energy Power Generation,
2006), enabling the regulator to adopt comprehensive net metering regulations in 2015 (Alternate and
Renewable Energy, Distributed Generation and Net metering Regulations, 2015). Growth in net metered
installations has however been markedly slow, with only 815 licenses issued by December 2018, adding
17.28 MW to the country’s installed solar capacity.68
This section of the report evaluates the policy, regulatory and market issues limiting net metering
growth in Pakistan. The objective of the analysis is to provide a basis for future interventions to support
net metering and ensure that the recommendations made by this report are effective in addressing
local barriers to net metering proliferation. By reviewing net metering support programs implemented
by AEDB and international development organizations, the analysis will also help avoid duplication or
overlap between net metering initiatives by various entities.
4.1 LOCAL CONTEXT
The electricity network in Pakistan delivered 99609 GWh of energy in 2016-17 from an installed
generation capacity of 28400 MW. The per capita electricity consumption in the country during the
period was approximately 480 kWh; in comparison, India and China’s per capita consumption in 2014
was 805 kWh and 3927 kWh respectively. Generation capacity in Pakistan frequently falls short of
demand, leading to forced outages. The most recent capacity shortfall began in 2012 and lasted five
years until 2017 with power shortages during the period reaching 6328 MW or 22% of peak-demand.
In addition, while the electricity supply network covers a significant portion of the country, the
infrastructure is weak or inadequate in many locations and upgrades are considered necessary to
improve the reliability of power supply and reduce system losses. The distribution grid comprises ten
state-owned distribution companies or DISCOs and the privately owned K-Electric. 69
4.1.1 RETAIL ELECTRICITY TARIFFS
Electricity rates for residential consumers in Pakistan are based on an ascending block-rate structure,
with added rate differentiation for 3-phase customers (Time-of-Use or ToU rates). Residential
customers are classified in two different ‘tariff categories’ based on sanctioned load - ‘above 5kW’ and
‘below 5kW’ - with six tariff-slabs or blocks defined within the first load category and a uniform ToU
tariff applied to the second load category. Commercial and industrial electricity consumers are
classified into three and four tariff categories respectively, based on sanctioned load. Consumers in all
three market segments are also required to pay a minimal fixed or demand-based monthly charge.
Residential customers consuming less than 300 kWh of electricity each month and all agricultural
customers receive a tariff subsidy while residential customers using more than 300 kWh a month and
all commercial and industrial customers pay unsubsidized tariffs and are subject to an additional tariff
surcharge that varies by tariff slab or category. As a result, residential electricity tariffs vary significantly
68 Dr. Irfan Yousaf, Director, AEDB
69 NEPRA, “State of the Industry Report 2017” (Islamabad, Pakistan: National Electric Power Regulatory Authority (NEPRA),
2017).
42 DEVELOPING THE NET METERING MARKET IN PAKISTAN
between tariff blocks and can range from Rs.2.00 (US cents 1.4) per kWh to Rs.20.00 (US cents 14)
per kWh. Representing approximately 15% of the DISCO customer base, high-tariff consumer
categories or tariff blocks cross-subsidize electricity consumption by low-volume, low-income
residential and all agricultural consumers.
Net-metering in Pakistan is currently allowed to 3-phase electricity customers only, effectively limiting
the market for net-metering to un-subsidized residential and all commercial and industrial electricity
consumers connected to the state-owned DISCOs and K-Electric. Table 4.1 summarizes tariffs
applicable to electricity customers eligible for net-metering on the IESCO grid.
Table 4.1: Tariffs Applicable in the IESCO Service Area to
Electricity Consumers Eligible for Net-metering 70
Market Segment Variable charges
Rs./kWh (US cents/kWh)
Fixed charges
Rs./kW/Month (USD)
Residential (sanctioned load above 5kW)
Time of Use (Peak) 20.70 (15.00) None
Time of Use (Off-peak) 14.38 (10.00)
Commercial (sanctioned load above 5kW)
Regular 19.68 (14.00) 400 (2.86)
Time of Use (Peak) 21.60 (15.00) 400 (2.86)
Time of Use (Off-peak) 15.63 (11.00)
Industrial
B1 15.28 (11.00)
B1 (Peak) 18.84 (13.00)
B1 (off-peak) 13.28 (9.50)
B2 14.78 (11.00) 400 (2.86)
B2 (Peak) 18.78 (13.00) 400 (2.86)
B2 (off-peak) 13.07 (9.30)
B3 (Peak) 18.78 (13.00) 380 (2.72)
B3 (off-peak) 12.98 (9.30)
B4 (Peak) 18.78 (13.00) 360 (2.58)
B4 (off-peak) 12.88 (9.20)
Given the current tariff and taxation regime in Pakistan, residential electricity customers paying
unsubsidized tariffs and all commercial and industrial consumers can derive some economic benefit
from generating electricity on-site, at a lower cost than grid-supplied power. Since industries benefit
more from self-consumption than supplying electricity to the grid, net metering policies will be more
effective in promoting DG in the high-consumption residential and commercial market segments.
70 IESCO website: Tariff Schedule notified on January 1, 2019. Conversion rate: 139.80 Pak. Rupees to 1 USD.
DEVELOPING THE NET METERING MARKET IN PAKISTAN 43
4.1.2 POTENTIAL MARKET FOR NET METERING
Since net-metering regulations in Pakistan allow only 3-phase electricity customers to participate in
the net-metering program, the potential market for net-metering is limited to approximately 882, 707
customers, including 371,060 residential, 150,927 commercial and 360,721 industrial electricity
consumers, or approximately 3% of all grid-connected electricity customers in the country.71 Although
the potential market is small compared to the grid’s customer base, these customers consume
approximately 35% of all electricity delivered by the distribution grid and provide more than 40% of
all revenues collected by public and private the distribution companies (see Figure 4.1 and Figure 4.2
below). 72 Since customers eligible for net-metering pay the highest tariffs and cross-subsidize low-
income consumers, wide-scale adoption of DG or net-metering could lead to a reduction in subsidy
collection, undermining the current subsidy regime in Pakistan.
Figure 4.1: Electricity Consumption by DISCO Customers in Pakistan
(Total consumption: 97197400 MWh)
Figure 4.2: Revenue Generation from DISCO Customers in Pakistan
(Total revenue: 1,087.6 Billion Pak Rupees or 7.8 Billion USD)
Given the low cost of energy generated from roof-top solar installations (see section 4.14 for more
details) and the rising cost of the tariff subsidy, government funded DG systems could provide an
effective lower-cost alternative to electricity tariff subsidies. A detailed cost-benefit analysis would be
71 PEPCO (2018), DISCOS Performance Statistics, Pakistan Electric Power Company (Pvt) Limtied (PEPCO), June 2018 and
NEPRA (2017), State of Industry, 2017. These figures include customers of state-owned DISCOs and K-Electric. The
figures for each customer segment within K-Electric are approximated from customer distribution in the state-owned
DISCOs.
72 PEPCO (2018)
44 DEVELOPING THE NET METERING MARKET IN PAKISTAN
required to determine the exact impact of DG and net-metering on low-income, low-use residential
electricity consumers and gauge the potential of government funded DG systems to reduce electricity
subsidies.
4.1.3 RESOURCE AVAILABILITY AND COINCIDENCE WITH PEAK DEMAND
Solar irradiance levels recorded in most of Pakistan exceed global irradiance averages. Estimated peak
irradiance values in western Baluchistan province are over 2700 kWh per square meter per year, while
83% of the land area exceeds the threshold values of 2000 kWh/m2 and 3,000 hours of sunshine a
year. The estimated irradiance values only decrease gradually from south to north and exceed
1500 kWh/m2 per year in more than 90% of the land area73.
Figure 4.3: Global Horizontal Irradiation (GHI) Levels in Pakistan (globalsolaratlas.info)
Solar irradiance levels are highest in the south and south-west of the country (see Figure 4.3 above),
however even regions with relatively lower levels of solar resource have a better insolation profile
than Germany, the largest distributed PV market in the world 74. Consumption or demand peaks occur
in the evenings between 4 to 6 pm during summers and 6 to 8 pm in winters. Although peak solar
insolation is not coincident with peak-demand, there is significant potential for replacing expensive
day-time generation (between 10 am and 2 pm) with low-cost, solar power (see Figure 4.4).
73 World Bank-ESMAP, “Renewable Energy Resource Mapping Pakistan”, 2014, www. esmap.org/re_mapping_Pakistan.
74 Umar Mustafa, Tobias Marz, and Gerwin Dreesmann, “Roadmap for the Rollout of Net Metering Regulations in Pakistan”
(Lahore, Pakistan: GIZ, September 2016).
DEVELOPING THE NET METERING MARKET IN PAKISTAN 45
Figure 4.4: Electricity System Demand for in Pakistan for a Typical Day in
Summer and Winter (MW)75
4.1.4 ROOFTOP PV COSTS AND GRID-PARITY
The capital costs of net metering installations in Pakistan in all three market segments - residential,
commercial and industrial - are competitive with global costs for roof-top solar PV (see Table 4.1). In
addition, the levelized cost of electricity (LCOE) for all unsubsidized electricity consumers is at or
below grid-parity, with electricity from rooftop PV costing less than the rates of unsubsidized
electricity in most parts of the country.
The LCOE and capital costs in Table 4.2 are based on primary market research and are indicative of
current market prices for rooftop solar PV systems. The un-discounted payback period for a 5 kW
residential solar system is approximately 3.7 years and could decrease further if panel prices fall or
electricity tariffs rise. The payback period for typical commercial and industrial systems varies between
3 and 5.9 years (see Annex 4 for detailed assumptions used in the financial model for LCOE and
payback calculations). Consumers in the industrial and commercial market segments also have the
option of entering into a Power Purchase Agreement (PPA) with third-party solar installers, securing
a 12 to 15-year contract for energy delivery.
The LCOE and capital costs in Table 4.2 are based on primary market research and are indicative of
current market prices for rooftop solar PV systems.76 The un-discounted payback period for a 5 kW
residential solar system is approximately 3.7 years and could decrease further if panel prices fall or
electricity tariffs rise. The payback period for typical commercial and industrial systems varies between
3 and 5.9 years (see Annex 4 for detailed assumptions used in the financial model for LCOE and
payback calculations). Consumers in the industrial and commercial market segments also have the
option of entering into a Power Purchase Agreement (PPA) with third-party solar installers, securing
a 12 to 15-year contract for energy delivery.
75 NEPRA, “State of the Industry Report 2017.”
76 Florida PUC, “Rule- 25-6.065 Interconnection and Net Metering of Customer-Owned Renewable Generation” (Florida
Public Service Commission, July 4, 2008). Financial modelling based on the SANDIA Labs engine.
46 DEVELOPING THE NET METERING MARKET IN PAKISTAN
Table 4.2: Indicative Figures for LCOE and Capital Costs in the Residential, Commercial and
Industrial Roof-top Solar Market Segments77
(All Figures Based on Primary Research and Levelized Over 25 years)
Residential
Installations
Commercial
Installations
Industrial
Installations
System size 5kW 43kW 1MW
Levelized Cost of Electricity (per kWh)
LCOE (Real) PKR 8.47
(US Cents 6.00)
PKR 5.76
(US Cents 4.10)
PKR 5.48
(US Cents 3.91)
LCOE (Nominal) PKR 14.48
(US cents10.3)
PKR 9.85
(US cents 7.04)
PKR 9.38
(US cents 6.71)
Capital cost
(per kW)
PKR 105,000
(USD 751)
PKR 85,000
(USD 608)
PKR 80,000
(USD 576)
Payback (simple) 3.7 years 3 years 3.8 years
Payback (discounted) 5.2 years 3.7 years 5.2 years
4.1.5 PERFORMANCE OF THE TRANSMISSION AND DISTRIBUTION
NETWORKS
In its current state, the transmission infrastructure in Pakistan was barely adequate to serve the load
in 2018. Losses in the transmission system are high in comparison to global standards and the
transmission network recorded 126 ‘loss of supply’ incidents in 2016-17 alone, causing major
interruptions in electricity supply. Ranging from 9.03% to 32.6 %, losses on the distribution network
are excessively high, leading to chronic revenue deficits at the DISCOs.
Constrained by high system losses and low revenue recovery rates, DISCOs are generally reluctant
to take on the perceived revenue loss from electricity consumers installing net metering systems. The
capacity of the DISCOs to assess and quantify the positive impacts of DG on system losses and
administer net metering programs is also limited, leading to misconceptions around the impacts of DG
and delays in application processing.
The ability of strategically placed DG systems to reduce distribution losses provides a strong
justification for net metering in a country such as Pakistan, where average T&D losses are close
to18%.78 The transmission and distribution system constraints in Pakistan represent an opportunity
where net metering could potentially alleviate some of the issues in system operation. For instance,
since small, distributed generators connect to the grid at the distribution (or sub-transmission voltage)
level, ingesting power close to load centers could help reduce transmission and distribution losses in
the system, incurred when delivering power over long distances from centralized generators located
far from the load centers.
77 Step Robotics, 2019; The simulations were run by the Islamabad based technology startup, Step Robotics, using Islamabad,
Pakistan as the project location on the SANDIA LABS simulation engine. The simulation assumes an energy settlement
only and does not account for any commercial settlement (cash compensation) for Net Excess Generation (NEG). See
Annex 4 for detailed modelling assumptions associated with each market segment.
78 NEPRA, “State of the Industry Report 2017.”
DEVELOPING THE NET METERING MARKET IN PAKISTAN 47
Net metered DG can also deliver several other benefits to DISCOs. For instance, in some locations
on the distribution grid, net metering could decrease network congestion or provide additional power
to eliminate or reduce forced interruptions in electricity supply. Suitably placed DG or net metered
systems can also aid voltage regulation on the network, especially in locations where feeders are over-
loaded.
4.1.6 ADDITIONAL FINANCIAL INCENTIVES
Pakistan allows duty-free imports of renewable energy equipment including solar panels, inverters and
batteries etc. This translates into a significant cost reduction at the wholesale and retail levels and
helps drive down the LCOE associated with net metered installations. There are no additional fiscal
or financial incentives available for net metering installations.
4.1.7 QUALITY AND SAFETY STANDARDS
Pakistan adopted IEC quality, safety and environmental standards as ‘Pakistan Standard’ in 2015
however there is no single agency responsible for enforcing these standards across the supply chain,
resulting in frequent quality lapses. AEDB is implementing various programs to address quality control
issues and improve the standard of both net metering equipment and services through process
automation and other mechanisms (see Section 4.3 for details).
4.1.8 MARKET STRUCTURE
The market for net metering is predominantly urban and caters mostly to demand from the residential
segment. The proliferation of DG products and services is following the pattern of DG growth in
other emerging market countries such as Brazil, where incomes, population and electricity tariff levels
are the primary determinants of DG technology uptake79.
Several small and mid-sized PV system integrators (known as installers, solar companies or solar
system providers in Pakistan) design and install net metering systems through a service-provision
model. At the high end of the market, these companies offer a full suite of Engineering, Procurement
and Construction (EPC) services and post installation operation and maintenance (O&M) support.
Service delivery at the low end of the market is limited to system-sizing, equipment installation and
after-sales support for a limited period (typically one year).
Local manufacturing of solar equipment is limited to solar-panel assembly and manufacturing of AGM
batteries by local industrial groups, including Daewoo. Treet, Eco Star (DWP and Gree) and Homage.
Solar companies or installers rely mainly on imports for fulfilling orders. The supply chain consists of
equipment importers, wholesalers and retailers that provide equipment including solar panels,
inverters, batteries and charge controllers to the installation companies. Chinese solar equipment has
the largest market share in Pakistan with more than 90 % of PV panels and over 80 % of deep-cycle
batteries imported from China. The dominance of Chinese imports is partly due to the price-
competitiveness of the products, however extensive dealership networks and product selection also
plays a role; Chinese equipment is available at a wide variety of price-points, corresponding to different
quality levels and can therefore cater to a much broader customer base. Other countries supplying
solar equipment to the local market include Germany, Hong Kong, UAE, Malaysia, UK, Finland, Italy
and others.
79 Juliano Assunção and Amanda Schutze, “Developing Brazil’s Market for Distributed Solar Generation” (Climate Policy Initiative,
September 2017).
48 DEVELOPING THE NET METERING MARKET IN PAKISTAN
4.2 KEY ISSUES
4.2.1 WEAKNESSES IN THE POLICY, LEGAL AND REGULATORY FRAMEWORK
1 - Pakistan’s current RE policy lapsed in 2018 with no clear indication of whether net
metering will receive policy cover under a new policy regime
The Government of Pakistan’s (GoP) most recent energy policy, the National Power Policy 2013
covers a broad spectrum of activities in the power sector, including solar, wind and bagasse power
generation projects, however, the policy makes no specific mention of DG or net metering from
renewable resources. The only policy direction for net metering comes from the Policy for Development
of Renewable Energy for Power Generation 2006 (the 2006 RE Policy). Section 8.4.2 of this policy relates
specifically to net metering, providing the following guidelines for electricity generation from net
metered systems80:
• RE power projects of 1 MW or less capacity, set up for self-consumption (captive use) or
dedicated use may also supply surplus electricity to the power utility while at other times
drawing electricity from the utility to supplement its own production for local use.
• The net electricity supplied by the power producer to the utility in a month is equal to units
supplied by the producer minus units received by the producer, if greater than zero, or the
net electricity supplied by the utility to the power producer in a month, i.e., units received by
the producer minus units supplied by the producer, if greater than zero, shall be paid for by
the utility or the producer, respectively, at the applicable retail tariff (e.g., industrial,
commercial, or residential rates).
• Such net metering arrangements may involve separate sets of unidirectional meters for
recording the electricity received and supplied to the utility by the power producer, or special
bidirectional meters capable of instantaneously recording net power transfers. This facility
would be particularly suitable for incentivizing dispersed small-scale RE generation, such as
rooftop PV panels, helping optimize their utilization and payback rates and obviating the need
for expensive on-site storage batteries.
The 2006 RE policy lapsed in 2018, following which, there is no applicable policy in Pakistan for net
metering.
2 – The current net metering regulations do not reflect the changes in the NEPRA Act
that could benefit electricity customers with net metering installations
The regulatory law applicable to the provision of electricity in Pakistan, the NEPRA Act, also applies
to DG and net metered installations. The NEPRA Act was recently amended (Act 2018), to modify
the previous version of the act (Act 1997). Several changes in the new law have implications for DG
and net metering:
• Exemption from the generation license requirement - In Act 1997, all power generation facilities
expecting to sell electricity to another entity were required to obtain a power generation
license from the regulator. This included net metering systems that sold surplus power to
their host DISCO. Section 14 B (5) of Act 2018 however makes an allowance for the Federal
Government (in consultation with NEPRA) to withdraw the generation license requirement
for certain types of generators as early as 2018. Under the new act, no new power generation
facility will require a generation license post 2023 (the date set for market de-regulation in
Pakistan). In addition, Section 2(ii-a) of Act 2018 designates power plants set up by housing co-
operatives or ‘association of persons’ as captive generating plants and Section 2(xi) and also
exempts these from the generation license requirement.
Small RE based generation facilities, particularly residential solar generators and captive power
plants, would be good candidates for immediate exclusion from the mandatory license
80 Government of Pakistan, “Policy for Development of Renewable Energy for Power Generation, 2006”, 2006.
DEVELOPING THE NET METERING MARKET IN PAKISTAN 49
requirement. Exemption from the license requirement would simplify the net metering
installation process and enable consumers with net metering to sell surplus power outside the
jurisdiction of their host DISCO.
• Electricity sale to third-party consumers - The Act 2017 allowed third-party ownership of
generating facilities however, DG systems were restricted to selling electricity only to the
host DISCO. Section 14C(2) and Section 2(ii a) of Act 2018, makes it mandatory for the host
DISCO to provide all captive generators (including DG facilities set up by consumers, housing
co-operatives and/or associations) access to the distribution grid, for sale of electricity to
third-party consumers.
Despite the provision for an exemption in the new Act 2018, the net metering regulations in Pakistan
continue to require generation licenses for all DG systems, regardless of size or capacity, and disallow
the sale of electricity to a third party.
Table 4.3 and Table 4.4 compare net metering regulations and interconnection standards in Pakistan
(as of September 13, 2018) with the global ‘best-practice’ described in Section 3. For better
illustration, the best-practice overview in Section 3 is supplemented with specific examples from Sri
Lanka, the Philippines, the state of Florida in the USA and Maharashtra in India, where net metering
programs have been implemented successfully (Florida) or the electricity market structure and
economy are similar to Pakistan (Maharashtra, the Philippines and Sri Lanka).
Although the net metering regulations in Pakistan generally maintain a fair balance between the
interests of the DISCOs, net metered electricity customers and customers without net metering,
there are improvements that can be made to make net metering easier to implement and more
accessible for electricity consumers:
3 – Net metering regulations are missing local-level caps, include no provisions for
information sharing between the DISCOs and the regulator and allocate all equipment
and interconnection costs to consumers
• The amount of DG that can be safely integrated in the distribution grid depends on the
distribution system configuration and diversity of consumers at the DT level. It is therefore
important to establish a local-level cap at the DT, especially where grid-infrastructure is weak
or inadequate and upgrades might be required to accommodate high levels of DG penetration.
• The cost of bi-directional meters and interconnection contributes significantly to the system
installation costs and impacts the affordability of net metered systems, especially for small
residential electricity consumers.
• The DISCOs are not required to share any information about the net metered systems on its
network. Regular information sharing between the DISCO and the regulator regarding the
number of net metered connections added to the DISCOs network, the units of electricity
purchased from net metered installations and payments made against net-excess generation
to net metered customers would allow the regulator to better manage the program and make
timely adjustments.
50 DEVELOPING THE NET METERING MARKET IN PAKISTAN
Table 4.3: Net Metering Regulations: Design Elements and Regulatory Best-practice81
Design Element Regulatory Best-Practice Pakistan Florida
(USA)
Maharashtra
(India)
Sri Lanka Philippines
Metering & Billing Arrangement
Traditional net metering (compensation at retail rates) is a
relatively simple compensation mechanism for DG system owners and DISCOs to
implement and more effective in nascent markets
Net metering Net metering Net metering Net metering
The program
offers three variations:
1. Net metering
2. Net-accounting (or
net-billing)
3. Net-Plus (Direct sale to DISCO)
Options 2 and 3
are available for
Solar PV systems only.
Net metering
Sell Rate Design
(Compensation for electricity produced during the netting
period)
In nascent markets, compensation
at retail rates i.e. the meter spins backwards
For electricity
exported to the grid during the netting
period, the energy
compensation rate is the same as the
one at which the consumer is billed (Peak
against peak and off-peak
against off-peak rates)
Offsetting
customer’s consumption allowed. Peak off-
peak not specifically
mentioned
Peak off-peak not
specifically mentioned but ToU metering
allowed to consumers billed
under a ToU arrangement.
Peak off-peak not
specifically mentioned.
Adjustment of bills
based on export/ import.
81 Florida PUC, “Rule- 25-6.065 Interconnection and Net Metering of Customer-Owned Renewable Generation”; Maharashtra Electricity Regulatory Commission, “Net Metering for Rooftop Solar
Systems Regulations 2015,” n.d.
DEVELOPING THE NET METERING MARKET IN PAKISTAN 51
Design Element Regulatory Best-Practice Pakistan Florida
(USA)
Maharashtra
(India)
Sri Lanka Philippines
System Size Cap Higher system size caps coincide with accelerated market
transformation and greater installed capacity. Technical constraints at local distribution
transformer level need to be accounted for
1 MW 2 MW 0.8 MW Limited to the contracted
demand of a consumer
0.1 MW
Capacity limit based
on customer load
Typically limited to between 100%
to 150% of customer load
150% of the
customer’s
sanctioned
load
90 % of
Customer’s
service rating.
100 % 100 % No specified limit
Local level cap Limit on grid-penetration at 15% of distribution transformer
capacity is recommended in the
first phase of net metering
programs, especially where infrastructure upgrades might be required to accommodate high
levels of DG penetration.
No local level cap specified
No limit 40 % of Distribution
Transformer
capacity. DISCOs
can allow higher limit if system studies permit.
No limit No limit
Netting Frequency
and
Credit Reconciliation
Period
(Roll over period)
for Net Excess
Generation or NEG
Traditionally longer netting and
reconciliation periods are more advantageous for customers as seasonal variation in production
and consumption allow for maximum netting.
Cyclic net metering (credit
reconciliation after a pre-determined period e.g. 3 months)
and Perpetual roll-over are the two most common approaches for reconciling and crediting net
excess generation
Netting
frequency: Monthly
(30 days)
Credit reconciliation period: (or
cycle): 3 months
one month one month For net metering:
NEG rolled over to the next month until contract
termination
Net Adjustment
rolled over to next month
Crediting Terms
(type and amount of compensation paid at
NEG is not compensated or
compensated at a rate less than the retail price of electricity.
Cyclic net
metering with commercial settlement
Adjustment roll
over to next month for one year. At the end of
Adjustment
rollover to next month for one year. At the end of
For net-
accounting, credit for excess generation paid at
Perpetual credit
roll-over
52 DEVELOPING THE NET METERING MARKET IN PAKISTAN
Design Element Regulatory Best-Practice Pakistan Florida
(USA)
Maharashtra
(India)
Sri Lanka Philippines
the end of the credit reconciliation period)
Compensation can be provided as energy credit (energy settlement)
or cash compensation (commercial settlement)
(cash compensation)
after every three months OR Perpetual
roll-over
The rate paid for electricity
produced at the end of the
credit reconciliation period (NEG)
is equal to the National
Average Power Purchase Price
(PPP) for DISCOs,
aggregated for the billing period, as
determined by the regulator.
each calendar year, any NEG will
be payable by the DISCO at the average annual
sale tariff
each financial year any net energy
credit will be payable by the DISCO at the
average power purchase cost
Rs.22.0 per unit for first 7 years
and Rs.15.50 per unit for next 13 years
No payment for any net energy credit upon
termination
Rate paid for NEG is based on the
DISCO’s blended Generation purchase cost
Cost of
Interconnection arrangement and
metering
Customer pays the cost.
However, examples exist of DISCOs paying for the costs and
recovering the expense through an additional charge applied to the
monthly electricity bills of net
metered customers
Customer
pays the cost
The DISCO pays
the cost
Cost of additional
meters required for claiming RECs
to be borne by the
customer
DISCO
responsible for specifications,
supply, installation and testing cost of
interconnection
and metering arrangement.
Customer pays
the cost
DISCOs pay but
are allowed to recover the cost
from consumers through a monthly
net metering
charge added to electricity bills
DEVELOPING THE NET METERING MARKET IN PAKISTAN 53
4 – Interconnection standards are ambiguous on several accounts
Interconnection for Renewable Generation Facilities Regulation, 2015 (IC Reg 2015) is the applicable
interconnection standard for net metered installations in Pakistan. Although the interconnection
standards comply with many of the best-practices described in Section 3.3, there are deficiencies
that need to be addressed:
• The regulation specifies an interconnection at 11 kV for systems between 500 kW to
12.5 MW, however, interconnections at a voltage less than 11 kV or load less than 500 kW
are not addressed. Since most net metering systems, particularly residential and commercial
installations, are less than 500kW and connect to the distribution network at 0.4 kV, this is
an important omission the interconnection rules.
• Customers applying for net metering require approval from the host DISCO or transmission
network operator on simulation studies. However, the responsibility for carrying out
simulation studies is not prescribed to a particular entity; It is not clear whether the simulation
study is to be carried out by the DISCO or by the net metered customer (through an
independent third-party).
• The Standard Operating Procedures (SOPs) followed by the DISCOs when processing
applications are not clearly defined. Each DISCO has therefore developed its own processes,
creating complications for system installers working across the jurisdictions of multiple
DISCOs.
54 DEVELOPING THE NET METERING MARKET IN PAKISTAN
Table 4.4: Interconnection Regulations: Design Elements and Regulatory Best-practice82
Design Elements Regulatory Best-Practice
Pakistan Florida
(USA)
Maharashtra (India)
Sri Lanka Philippines
Time taken to execute an
Interconnection agreement (IA)
‘Express’ processing for
systems less than 10kW and expedited
processing for all other system
sizes
57 days to sign agreement, 15 days for Regulator to grant
license and another 50 days for installation & commissioning of Interconnection.
40 days for = <100kW.
90 days if system study is required.
Initiation of NM within 30 days of
signing IA.
52 days (including 15
days taken for testing, commissioning
and approving IA and excluding
time taken by applicant to install system
within his premises).
No Limit
Solar plants to
be connected with Grid within 2 weeks
of application
Mutually agreed between HDC and
DGNM.
No time limit specified by
regulator.
Generation
License requirement
Not required Generation license required.
Under a simplified license procedure. After agreement
with DISCO Regulator takes average of 15 days to grant
license or any exemptions
required.
Not required. Not required. Not required. Not required.
System study
requirement
Not required for
systems below
10kW
According to the regulations,
system studies are required for
renewable energy-based DG installations connecting to a
DISCO or Transmission company. However, the DISCOs have independently
opted not to conduct system
studies for Net Metered
installations with a capacity of less than 250kW
Not required for
100 kw or less.
Not prescribed.
A DISCO can
disconnect if it finds Customer
responsible for any damage or adverse effects
on DISCO system or other
consumers.
Not
prescribed.
At the discretion
of the host DISCO
82 Florida PUC, “Rule- 25-6.065 Interconnection and Net Metering of Customer-Owned Renewable Generation”; Maharashtra Electricity Regulatory Commission, “Net Metering for Rooftop Solar
Systems Regulations 2015.”
DEVELOPING THE NET METERING MARKET IN PAKISTAN 55
Design Elements Regulatory Best-Practice
Pakistan Florida
(USA)
Maharashtra (India)
Sri Lanka Philippines
Standard Interconnection
agreement (SIA)
Specified Yes, specified in Regulations. Approved by the regulator for
each DISCO
specified specified specified
Inter connection
Standard and
Conformance Test procedure
IEC, IEEE 1547
standards
IEEE 1547, IEC, EN or other
International applicable
standards.
Approval of HDC required before allowing interconnection.
IEEE 1547
IEEE 1547.1
Under writer Laboratories (UL) 1741
Inspection and approval by
Local Code implementation officials.
Technical
standards for
connectivity specified by Central
Electricity
Authority
(CEA).
IEEE 1547
IEC 61400-21
Quality of supply) 61000-3-7
Standards specified
by Regulator,
based on IEC and IEEE Quality and Safety standards.
Certification for allowing
interconnection
Required Interconnection testing certification by Electrical
Inspector and commissioning test carried out by host DISCO before allowing interconnection
Certification by Nationally
recognized testing laboratory
Testing, Certification by
host DISCO
Testing/ Certification to
be carried out by Consulting Chartered
Electrical Engineer and
witnessed by host DISCO’s engineer
Commissioning tests witnessed
and approved by host DISCO
Automatic Isolation of Generation
equipment in case of Loss of Power
Required Required based on IEC, IEEE standards.
Required Required Required Required. Minimum time limits for
• Involve DISCOs in PPA between consumers and third-party
installers
State Bank of Pakistan
International
Development Organizations
Financial Institutions
7 Limited administrative
capacity of the
distribution companies
• Train DISCOs in process implementation and
financial/technical impact assessment
• Process automation
AEDB, GIZ
DISCOs
Step Robotics
Pakistan DG Roadmap
PV Ecosys
(AEDB/Step Robotics)
8 Resistance from DISCOs
• Incentivize DISCOs through innovative business models involving DISCOs
DISCOs, NEPRA, AEDB None
9 Lack of awareness about net
metering among power consumers and consumers’
perception of technology and
performance risk
• Conduct an awareness-raising campaign
AEDB None
10 Complicated process
• Standardize SOPs across DISCOs
• Process automation
DISCOs, AEDB, Step Robotics
PV Ecosys (AEDB/Step
Robotics)
11 Limited availability
of rooftop space • Develop business models
around wheeling
Third party providers None
64 SUPPLEMENT: DEVELOPING THE NET METERING MARKET IN PAKISTAN – NEXT STEPS
ANNEX 1: COSTS AND BENEFITS OF
DISTRIBUTED GENERATION85
Net metering is a policy mechanism for supporting the growth of renewable energy generation. The
mechanism incentivizes consumers to produce renewable electricity on-site for their own
consumption and selling back to the grid. Introduced in the US state of Minnesota and Iowa in the
early 1980s, original Net metering policies provided compensation at retail rates for any electricity
sold back to the grid. However, once penetration of distributed renewable energy generation in some
jurisdictions reached a level where the economic and technological costs of net metering were no
longer considered tenable, net metering policies saw a significant shift to lower compensation levels,
increased fixed charges, Time-of-Use rates for electricity consumption and limits on power fed back
into the grid. The list below describes the costs and benefits of net metering most frequently cited in
academic and professional literature. Although net metering is a well-researched subject, a few
important caveats should be considered;
• A cost-benefit analysis of net metering is a complex task that must quantify the impacts of net
metering on the utility grid, electricity tariffs and various externalities that benefit society.
Depending on the valuation approach and method, assessments are at times carried out under
widely varying assumptions, resulting in inconsistent or conflicting outcomes.
• The benefits provided by distributed generation mechanisms (such as net metering) to the
utility system can be very location specific and vary based on the period during which
electricity is sold back to the grid, the demand profile of the producer, insolation levels at the
point of generation and other factors.
• Most benefits attributed to net metering are not exclusive to these installations and can be
derived equally and sometimes more effectively from other types of renewable energy
installations (e.g. grid-scale RE generators).
85 PUC Sri Lanka, “Net Metering Development in Sri Lanka”; MIT, “The Future of Solar Energy”; Lynne Kiesling, “Alternatives to
Net Metering: A Pathway to Decentralized Electricity”, R Street Policy Studies 2016 (Washington, DC: R Street, February
2016); Deloitte, “Rooftop Solar - Garnering Support from Distribution Utilities” (India: Deloitte Touche Tohmatsu India LLP,
December 2016); Michael Barnard, “The Net Metering Disconnect”, CleanTechnica, January 2016, www.cleantechnica.com;
Robert E. Curry, “The Law of Unintended Consequences”, Public Utilities Fortnightly, March 2013, www.fortnightly.com; MEI, “Net Metering in Missouri: The Benefits and the Costs” (Missouri Energy Initiative, 2015); Julia Pyper, “Ditching Net
Metering Is in the ‘Best Interest’ of Solar, Say MIT Economists”, May 5, 2015,
https://www.greentechmedia.com/articles/read/mit-economists-say-we-should-ditch-net-metering; Rickerson et al.,
“Residential Prosumers - Drivers and Policy Options”; Metin Celebi and Philip Q. Hanser, “Marginal Cost Analysis in Evolving Power Markets: The Foundation of Innovative Pricing, Energy Efficiency Programs, and Net Metering Rates”, Newsletter, Current
Topics in Energy Markets & Regulation (Brattle Group, 2010); Michael G. Pollitt and Wadim Strielkowski, “Consumer Solar
Distributed Generation (DG): Net Metering and Some Competition Issues” (University of Cambridge, Energy Policy Research
Group, August 2016).
SUPPLEMENT: DEVELOPING THE NET METERING MARKET IN PAKISTAN – NEXT STEPS 65
Benefits Costs
Technical Impact
Grid management benefits
Voltage and Frequency Regulations - By encouraging electricity generation near the
point of consumption, net metering reduces the strain on distribution systems, maintains the stability of grid frequency and improves the distribution voltage
profile.
Peak Load Management - Net peak-loads can be reduced if peak-demand is coincident with net metered power generation. Coordinating net metered generation with energy storage and techniques of demand management can also
contribute to peak load management.
Grid Efficiency and Reliability - Energy generation closer to the point of
consumption improves grid efficiency and reliability and reduces consumption issues.
Grid Management issues
Grid Balancing - Solar installations can create issues for balancing loads if the quantity of
installations does not match the size of the local service transformer. Grid balancing is especially problematic in developing countries with weak and inadequate transmission
and distribution equipment.
Incompatibility with grid architecture - The grid is not designed to cope with complications arising from intermittent renewable energy resources. Intermittent, distributed generation in particular, affects power flow patterns in the grid, causing
various well-documented (and predominantly local) problems that may require
significant network upgrades and modifications. Many countries with high levels of
renewables in their energy mix regularly curtail energy from renewable generators to avoid over-loading the grid. High levels of distributed generation will require modernization of the existing distribution system, which was designed, built, and
operated for centralized generation.
Energy-banking
Net metering maximizes the utility of rooftop PV systems that do not have storage batteries installed. Consumers can ‘bank’ surplus energy on the grid to off-set metered supply.
Impact on land-use constraints
Land-constraints for diffuse natural resources such as solar and wind pose a
major barrier to scaling energy generation from these resources. This is a particular barrier to large-scale deployment in densely-populated, developing countries where land availability is limited, or ownership is not clearly defined. In
such situations, roof-top solar can off-set domestic gas consumption with positive effects on the economy.
Capacity building at utilities
New technology is driving innovative models of electricity generation and
consumption and future developments in the sector (improvements in storage
solutions for instance) can have a critical impact on the current utility business model. Policies such as net metering provide utilities with the opportunity to gain insight into new energy generation technologies and acquire expertise in
accommodating and managing energy from un-conventional resources.
66 SUPPLEMENT: DEVELOPING THE NET METERING MARKET IN PAKISTAN – NEXT STEPS
Benefits Costs
Financial and Economic Impact
Financial Benefits to Utilities
Avoided energy cost - By reducing overall demand for electricity, net metering
helps utilities avoid the cost of purchasing or generating energy to meet electricity demand.
Avoided capacity and transmission infrastructure investment – Reduction in overall
demand and on-site generation through net metering can translate into a reduced need for utilities to invest in capacity and transmission expansion.
Reduced transmission losses – On-site generation reduces transmission and
distribution losses. Energy lost in generation, long-distance transmission and
distribution can amount to a significant cost.
Costs to Utilities
Reduced revenue and profits – In the absence of revenue decoupling regulations, an
overall reduction in electricity demand would decrease utility revenues. In addition, net metering causes the utility to lose their most profitable customers; Most
developing countries electricity rates for low income consumers are kept artificially
low. Rates for domestic consumers are set in inclining blocks where high-income consumers using more electricity pay higher rates to cross subsidize low income consumers. Since net metering installations are relatively expensive, high income
consumers are most likely to subscribe to the service and in the process, reduce their
electricity consumption and the revenue they provide to utilities.
Under-recovery of grid costs – In addition to the cost of energy, retail electricity rates include the cost of transmission, distribution and the utility’s cost of providing electric service; cost of maintaining the grid, administration costs and other infrastructure
costs that ensure grid safety and reliability. Net metering at retail rates allows net
metered customers to avoid paying these largely fixed grid costs. Under-recovery has
the potential to materially weaken the utility’s financial integrity and its ability to attract investor capital, which in turn can lead to higher rates.
Increased System Operation Costs - Even if the customer’s total energy production over
a billing cycle nets out its consumption over that time, the customer is still using grid
services during that period. Utilities incur significant costs in providing these services:
• Balancing costs: Utilities incur additional costs to integrate renewable generation resources, such as roof-top solar, if grid balancing facilities are not adequate to mitigate the impact of intermittent renewables in the system. The Law of
Unintended Consequences Energy flows on the grid from distributed locations can
be absorbed and balanced if the distributed generation resources are a small enough proportion of the energy portfolio. Balancing is harder and more expensive as that
proportion rises. Balancing the network is the main operational cost that varies as the share of distributed generation on the grid changes.
• Back-up capacity costs: The intermittency of renewable energy resources such as
solar implies that a kW or solar cannot displace a kW of conventional power; in the absence of storage, some conventional back-up power will always be required on
systems with intermittent renewable energy resources.
• Cycling costs: The cost-reducing effects of increased renewable generation is partly
counterbalanced by an increased need to cycle existing thermal plants as renewable energy output varies, reducing their efficiency and increasing wear and tear. The cost impact of this secondary effect depends on the existing generation mix: it is less
SUPPLEMENT: DEVELOPING THE NET METERING MARKET IN PAKISTAN – NEXT STEPS 67
Benefits Costs
acute if the system includes sufficient gas-fired combustion turbines or other units
with the flexibility to accommodate the ‘ramping’ required by fluctuations in solar output. At high levels of solar penetration, it may even be necessary to curtail
production from solar facilities to reduce cycling of thermal power plants. Thus, regulations that mandate the dispatch of solar generation, or a large buildout of distributed renewable energy capacity that cannot be curtailed, can lead to
increased system operating costs and even to problems with maintaining system reliability. There are also limits on the rate at which the output from thermal plants can be increased. In contrast, output from some renewable technologies,
particularly PV and wind, can be varied without incurring additional costs. A requirement that renewable energy sources always have priority thus implies that
costs associated with changing the output levels of conventional generating plants must be ignored in dispatch decisions.
Interconnection Costs - Interconnection costs are incurred to link net metering
installations to existing distribution systems in a way that ensures safety and reliability. These include capital costs related to service connections; circuit breakers to
disconnect net metering installations when needed to protect utility workers and first responders; distribution circuits and substation upgrades; as well as metering, sensors, controls, and communication infrastructure needed to accommodate the increasing
amount of two-way power flows on the distribution network.
Costs from increased losses at very high levels of DG penetration - Although it seems
reasonable to expect that generating electricity close to loads brings energy losses down and requires less network infrastructure to carry energy from other regions, these benefits are not realized in situations where distributed generators are not
controllable; where mismatches exist between load and generation, both in terms of location and time; and where networks continue to be managed in the usual way.
Costs from such losses have a general tendency to decline as the share of PV energy in
a distribution network increases up to nearly 25%. At very high levels of PV penetration, losses start to increase.
Investment Displacement
Net metering schemes generating clean energy can reduce the need for
investment in expensive, polluting conventional power plants. The savings from
displacing conventional power plants can be significant if net metered electricity is coincident with grid peak loads or expensive conventional power (from diesel
generators for instance) can be displaced.
Costs to Consumers
Increase in the price of electricity - In most jurisdictions, the compensation for net
metered power sold back into the grid is higher than the cost of competing electricity
production, usually from utilities or from the spot power market. Accordingly, higher cost net metered electricity is substituted in place of less costly electricity and overall
power prices are forced above the level that would prevail in the absence of the net metering system. The combination of the installation subsidies and the excessive prices
paid for power fed into the grid maintains an upward pressure on prices as net
metering deployment increases and more expensive power is fed into the grid.
68 SUPPLEMENT: DEVELOPING THE NET METERING MARKET IN PAKISTAN – NEXT STEPS
Benefits Costs
Cross-subsidization effects - Once net metered costumers increase in number, they begin
to have impacts on rate design (cost sharing). Net metered customers avoid some portion of their fair share of fixed costs which must be paid whether they are actively
using the grid or not. These costs are then re-distributed by the utility amongst all rate-payers which means that customers without net metering are in effect cross-subsidizing customers with net metering. Net metering is ‘doubly regressive’— first by
effectively excluding some customers from net metering because of its high initial cost, including lease and credit requirements; second by instituting a regressive wealth transfer from lower income customers to higher-income customers through cost-
subsidization.
Private Investment in Renewable Energy
Net metering can encourage electricity consumers to spend their own money to set up renewable energy systems.
Increased Cost of the Energy Transition
Utility-scale solar is inherently less expensive than residential-scale and is likely to remain less expensive despite foreseeable cost reductions in residential. If avoiding harmful emissions this is the key purpose of policies such as net metering, it is
uneconomical to promote rooftop and community solar as a most favored form of renewable and clean energy. Subsidizing residential-scale solar generation more heavily
than utility-scale solar generation will yield less solar generation (and thus less emissions reductions) per dollar of subsidy than if all forms of solar generation were equally subsidized.
Consumer Rate Reduction
Price reduction due to decline in demand - By reducing demand from the grid, net
metering systems reduce the price of electricity, decreasing costs for all ratepayers.
Price reduction due to fuel displacement – In jurisdictions where renewable,
electricity generated on-site is cheaper than energy from conventional power
plants, renewable energy brings down the average cost of electricity.
Additional Subsidy Requirement
Residential net metering installations are generally not economically viable without
additional subsidies or financial incentives because residential roof-top solar hasn’t achieved grid parity in some parts of the world. In addition, conventional definitions of grid-parity do not account for social and private costs of grid reinforcement and
storage, often required to accommodate self-consumption. If these costs are
considered, the point at which self-consumption from roof-top solar or other distributed generation facilities becomes competitive with grid supplied electricity, will
be pushed back further.
Market Transformation
Net metering encourages the growth of business models necessary to provide new energy services to consumers and in the process, creates a market for renewable energy products and services. Deployment of net metering even at a
modest scale, is likely to reduce institutional and other barriers to a rapid scale-up of solar generation in the future while also stimulating industrial efforts to
reduce costs and improve performance.
Import Costs
Most developing countries rely on imported equipment for net metering installations. Large-scale deployment of net metering systems would impose an increase in import costs.
SUPPLEMENT: DEVELOPING THE NET METERING MARKET IN PAKISTAN – NEXT STEPS 69
Benefits Costs
Social Impact
Energy Independence
Contributes to the diversification of a country’s energy portfolio and helps
improve energy security by displacing imported fuel with an indigenous resource.
Increase in Conventional Effluents
To avoid interruption in electricity supply, intermittent renewable energy generation
requires backup generation capacity provided by conventional units usually powered by coal or natural gas. The backup facilities must be cycled up and down depending on
sunlight (and wind) conditions in the various regional markets. Such cycling of
conventional units means that they cannot be operated efficiently, the result of which is an increase in the output of conventional effluents and greenhouse gases per MWh generated. The cycling problem is sufficiently severe that it yields an increase in the
absolute amount (not merely the amount per MWh) of conventional effluents and
greenhouse gases emitted as the market share of renewables rises.
Pollution Reduction
Global greenhouse gas emissions drive climate change. Widespread international adoption of new, non-emitting technologies will help phase out polluting, fossil
fuel-based plants and deliver substantial public benefit.
Production of energy from these sources often satisfies environmental regulatory
requirements such as RPS requirements for utilities, and any future greenhouse gas emission reduction requirements from a carbon-tax or a cap-and-trade scheme.
Pollution from Production Processes
Unless production of renewable energy equipment, especially solar panels, is shifted to countries with more stringent environmental standards, renewable energy can be
expected to substitute one set of environmental effects with another.
Impact on ‘Public Goods’ Programs
Regulatory public goods programs, such as low-income assistance or subsidies are
included in retail rates and are not recovered when net metered customers are reimbursed at the retail rate.
Interaction with Pricing Principles
Net metering runs counter to the principles of network pricing; Wealthier consumers, who can afford to install net metering facilities and who make more use of the network (by both buying and selling electricity through the network) make less of a
contribution to the costs of the network.
Net metering also conflates two issues that can be logically separated: (1) the desire of
society to pay extra for certain types of distributed generation on the grounds of reaching renewable and decarbonization targets; and (2) public utility pricing principles for the recovery of network costs, which balance fairness and efficiency in network
pricing.
70 SUPPLEMENT: DEVELOPING THE NET METERING MARKET IN PAKISTAN – NEXT STEPS
ANNEX 2: COMPARISON OF METERING & BILLING ARRANGEMENTS86
Net Metering Original net metering policies applied standard retail-rate
to a customer’s ‘net’ electricity purchases. A single, bi-
directional meter could run backward and erase electricity
consumption with electricity generated from the NM installation. Electricity production and consumption is ‘netted’ over a pre-defined period (year/month/day/ hour).
• Relatively simple mechanism for
both DG system owners and
DISCOs to understand and
implement, especially for users that already have two-way meters installed, that can run backwards
when surplus electricity is fed back
into the grid.
• Savings on electricity bills for consumers with net metered installations.
• Net metering schemes are attractive where electricity tariffs
are high.
• Does not require significant regulatory changes; can easily be
incorporated on top of existing retail electricity rates.
electricity prior to export, net metering can lead to reduced DISCO sales (unless the DISCO can sell the same electricity to a new
consumer).
• DISCOs may suffer revenue sufficiency issues
if the retail rate paid to customers for excess generation is higher than the actual DG value. This challenge is negligible at low levels
of DG adoption but may materialize as adoption levels increase.
• Non-DG-system owners may experience retail rate increases if DG deployment increases DISCO costs and/or reduces
DISCO electricity sales. Again, this may be negligible at low levels of DG adoption.
Buy-all Sell-all (BASA)
A buy-all, sell-all arrangement offers a standard sell rate to a DG system owner for all of the DG electricity they
generate. Unlike net metering, buy-all, sell-all customers
do not physically consume the electricity their DG systems produce. The level at which the sell rate is set
• Buy-all, sell-all mechanisms provide simple and predictable value
propositions to both DG system
owners and DISCOs over an agreed-upon contract length.
• If the value of DG is not well understood, buy-all, sell-all mechanisms can potentially
over-or undercompensate DG system
owners, leading to cost-shifting if buy-all, sell-all program costs are higher than whole-sale
86 Sakr et al., “Scaling Up Distributed Solar in Emerging Markets: The Case of the Arab Republic of Egypt”; Zinaman et al., “Grid-Connected Distributed Generation: Compensation Mechanism Basics”; J. Heeter, R.
Gelman, and L. Bird, “Status of Net Metering: Assessing the Potential to Reach Program Caps” (National Renewable Energy Laboratory, September 2014); Weimar et al., “Integrating Renewable Generation
into Grid Operations.”
SUPPLEMENT: DEVELOPING THE NET METERING MARKET IN PAKISTAN – NEXT STEPS 71
will influence the value proposition for the customer,
which will impact DG deployment level. • Because buy-all, sell-all
mechanisms do not change customer electricity consumption
patterns, there is less of an incentive for DISCOs to attempt to recover costs through
additional fixed charges.
• Cross-subsidization issues are also
minimized for this reason.
• Buy-all, sell-all mechanisms do not require retail rate redesign.
• Buy-all, sell-all prices can be adjusted throughout the lifetime of
a program for new customers to steer the market toward the desired level of DG deployment.
electricity rates and fully passed through to
the consumer.
• If a buy-all, sell-all mechanisms rate is lower
than the retail rate (a very common practice), customers may be incentivized to illegally wire their DG system to self-
consume electricity instead of exporting it all to the utility grid, potentially leading to
traditional revenue sufficiency and cross-subsidization issues.
• High ‘feed in’ or ‘value of solar’ credits
needed to provide adequate economic payback.
Net Billing Economical compensation of your PV electricity production value over your consumption value
during a pre-defined period of time.
In net billing, a DG system owner can consume electricity
generated by their DG system in real time and export any
generation in excess of on-site consumption to the utility grid. In this way, net billing is similar to net metering, however, under net billing, energy banking is not allowed
and all energy exports to the grid are compensated at a
pre-determined sell rate as soon as the export is
recorded.
Neither the net electricity export meter nor the net electricity consumption meter have the ability to ‘spin
backward’ during a billing cycle under net billing—the
meters can only spin forward when measuring net
consumption and net exports in real time. These quantities are measured in real time and billed/credited separately at the end of the billing cycle.
• Net billing allows for a more precise approach to compensating
electricity being injected into the grid relative to NM because the
sell rate for exported electricity
can be set to match the value to the utility.
Net billing can encourage self-consumption (particularly by setting
sell rates as less than retail rates), if
desired by regulators and policymakers NREL compensation mechanism basics
• Because net billing requires self-consumption of electricity prior to export, it can lead to
lost DISCO sales.
• DISCOs may suffer revenue sufficiency issues
if the net export rate paid to customers for
excess generation is higher than the actual DG value. This challenge is negligible at low
levels of distributed generation penetration but may materialize as penetration levels
increase.
72 SUPPLEMENT: DEVELOPING THE NET METERING MARKET IN PAKISTAN – NEXT STEPS
ANNEX 3: EVOLUTION IN NET METERING
AND FIT PROGRAM DESIGN
3.1 ORIGINAL NET METERING
Net metering is a Metering and Billing (M&B) arrangement where compensation is always at the retail
rate i.e. the meter spins backwards when the DG system is supplying energy to the grid, erasing a part
of the customers energy bill.87 Net metering schemes are attractive in countries where electricity
tariffs are high and are a relatively easy policy to administer, especially if users already have two-way
meters installed.88 A two-way or bi-directional meter runs backwards when surplus electricity is fed
back into the grid.
Figure 1: Evolution of Net Metering and Feed-in-Tariffs
88 Patrick Curran and Gerrit W. Clarke, “Review of Net Metering Practices” (Namibia: Electricity Control Board of
Namibia, December 2012).
89 Dalia Sakr et al., “Scaling Up Distributed Solar in Emerging Markets: The Case of the Arab Republic of Egypt,” Policy
Research Working Paper (Washington, D.C.: World Bank, June 2017); Julie Baldwin et al., “Report on the MPSC Staff Study to Develop a Cost of Service-Based Distributed Generation Program Tariff” (Michigan: MICHIGAN PUBLIC
SERVICE COMMISSION, February 2018); Travis Lowder et al., “Historical and Current U.S. Strategies for Boosting
Distributed Generation” (Colorado, USA, August 2015).
The distinction between net metering, net billing and FIT schemes has blurred in recent years. Most
so-called net metering schemes outside the US are net-billing mechanisms in practice.
Step down from retail to wholesale rates (Nevada, Maine, Indiana), application of demand charges (Arizona), Increased
fixed charges or minimum bill (Hawaii, Texas) and Value-of-solar rates
(Minnesota)
Evolution of Net metering
Germany (1991) and Denmark (1992) were
the first two countries to implement a FIT. Compensation was at above Retail rates under a buy-all, sell-all (gross-metering)
M&B arrangement
Originated in Massachusetts and Wisconsin in
1982 and currently offered in its original form in 38 US states and Washington DC.
Compensation is at retail rate
(meter runs backwards).
Original Net Metering Original FIT
FIT offered with both buy all-sell all and net-billing. Compensation at or below retail rates
(Australia, 2013, 2016, Germany), third party owned systems only (India), self-consumption allowed. The current German FIT is offered
through a net-billing mechanism.
Evolution of Feed-in-Tariffs
Current Net metering and FIT Schemes
SUPPLEMENT: DEVELOPING THE NET METERING MARKET IN PAKISTAN – NEXT STEPS 73
3.2 ORIGINAL FEED-IN-TARIFFS (FITS)
A FIT is defined as a predetermined level of compensation (usually above the retail rate) for electricity
fed into the grid from a distributed energy system. Customers receiving FITs are often (but not always)
required to sell all their on-site electricity production to the grid i.e. self-consumption is not allowed.
Unlike net metering, a FIT is not an M&B arrangement although the term FIT is used interchangeably
with gross-billing (Buy all-Sell all) arrangements.90
Net metering (aM &B arrangement) and FIT (a predetermined Sell-Rate) are components of a
compensation scheme but do not constitute a compensation mechanism in its entirety. The sell rate
design and retail rate design are equally important in the design of compensation schemes.
3.3 THE EVOLUTION OF NET METERING AND FITS
The distinctions between traditional policy labels such as FITs, auctions, and Net metering are
increasingly hard to discern as policymakers adapt frameworks to new market realities. New policy
frameworks use a mix of net metering, FITs and auctions to provide targeted support to DG across
specific market segments
Starting in the early 2000s, France instituted a FIT scheme for some renewable energy technologies,
while procuring others such as biomass and offshore wind through tenders. The following year, the
use of tenders was extended to smaller projects; A ‘simplified’ tender was introduced for projects
between 100 kW and 250 kW and a more ‘complex’ one projects between 250 kW and 12 MW.
Systems below 100 kW remained eligible for fixed FIT rates. Based on tendering results in 2013, the
average weighted purchase price of tendered projects between 100 and 250 kW was significantly
higher than the tariffs offered to smaller projects (0–100 kW) under the FIT. These results from France
run counter to the conventional argument in favor of tendering as a means to securing lower prices.
Some Caribbean countries have adopted hybrid Net metering and feed-in policies allowing residential
consumers to offset their power consumption while commercial consumers are required to feed all
the power they produce into the grid. In the Cayman Islands, DG customers can choose to connect
in front of the meter (as under a traditional FIT) or behind the meter (with Net metering). Under
both configurations, generators are billed at the retail rate for all the power that is consumed on-site.
This arrangement applies whether that electricity is purchased from the grid or generated by the on-
site PV system. Electricity generated by the PV system is then compensated at a rate of ~$0.47/kWh
for residential systems for a 20-year period, whether or not that power is consumed on-site or
exported directly into the grid. For comparison, the residential retail rate was USD $0.44/kWh in the
first quarter of 2014.91
90 Zinaman et al., “Grid-Connected Distributed Generation: Compensation Mechanism Basics.”
91 T. D. Couture et al., “Next Generation of Renewable Electricity Policy: How Rapid Change Is Breaking Down
Conventional Policy Categories” (National Renewable Energy Lab. (NREL), Golden, CO (United States), February 1,
2015), https://doi.org/10.2172/1172282.
74 SUPPLEMENT: DEVELOPING THE NET METERING MARKET IN PAKISTAN – NEXT STEPS
ANNEX 4: FINANCIAL MODEL ASSUMPTIONS
FOR NET METERED SOLAR PV
SYSTEMS
The simulations were run using the SANDIA Labs simulation engine and the system generation or
production numbers are within 1% of the production numbers from the Solar GIS atlas for Pakistan.
Assumptions in the financial model include a real discount rate of 10%, all capital costs are paid for by
the customer (capital investment is unleveraged) and the system does not include storage batteries.
The simulation assumes an energy settlement only and does not account for any commercial
settlement (cash compensation) for Net Excess Generation (NEG)
LCOE levelized over 25 years.
A corporate tax rate of 35% is applied to the commercial and residential financial models.
The equipment specifications in the financial model are based on mono-silicon solar panels
manufactured by Yingli Energy; Model no. Yl270 D-30B.
The orientation of the panels is 180 degrees due south.