Developing the Processing Maps Using the Hyperbolic Sine Constitutive Equation AMIR MOMENI, KAMRAN DEHGHANI, GOLAM REZA EBRAHIMI, and SHAHAB KAZEMI Hot compression tests were performed on a duplex stainless steel at temperatures ranging from 1223 K to 1473 K (950 °C to 1200 °C) and strain rates from 0.001 to 100 s 1 . The constitutive analysis of flow stress was carried out using the hyperbolic sine function, and the material constants were determined at two typical strains of 0.3 and 0.7. The power dissipation map, instability map, and processing map for the material were developed for strains of 0.3 and 0.7. The developed processing maps were based on the hyperbolic sine as well as the conventional power-law constitutive equations. The efficiency of power dissipation (g) varied from 12 to 60 pct over the studied temperature and strain rate. The highest value of g was obtained at strain rates below 0.01 s 1 , whereas the lowest value of g was observed at the intermediate strain rates. The instability region in sin h-based processing map was only observed in the range of 1423 K to 1473 K (1150 °C to 1200 °C) and at a strain rate of 100 s 1 , while the conventional processing map did not predict any instability region. Optical microscopy observations were more consistent with the results of the sin h-based processing map and indicated that the instability regime at high temperatures and high strain rates was due to the development of adiabatic shear bands. DOI: 10.1007/s11661-013-1841-5 Ó The Minerals, Metals & Materials Society and ASM International 2013 I. INTRODUCTION THE prediction of flow stress and load needed for the deformation of an alloy is an important step for the design of an industrial hot-working operation. The flow stress is closely related to the both intrinsic and extrinsic workabilities of the material being deformed. The intrinsic workability is governed by the mechanisms of microstructural changes at a given deformation condi- tion. However, the processing variables, i.e., strain, strain rate, and temperature actually control the micro- structural evolutions and thereby the intrinsic and extrinsic workabilities of a material. Different constitu- tive equations have been used to interconnect the mentioned workability factors and derive an applicable formula for measuring the flow stress as a function of processing variables. [1–3] Even though the constitutive equations are widely used to estimate the deformation loads, the behavior of the material in terms of stable or unstable flow should be also analyzed. One of the well- developed practical methods to avoid the occurrence of an unstable flow and premature fracture is plotting a processing map. The approach of processing map, originally proposed by Raj. [4] is defined as a represen- tation of microstructural changes and restoration mech- anisms of a given material. However, some questions still arise about the reliability of this method. [5] A processing map illustrates a superimposition of power dissipation map (PDM) and instability regions which are depicted on the basis of dynamic materials model (DMM). [6] DMM is a continuum model in which an instability criterion based on the principles of irrevers- ible thermodynamic, as applied to large plastic flow, is utilized to mark flow instability regimes. [7] The power dissipation and the instability maps are plotted in terms of deformation temperature and logarithm of strain rate to correlate different regions with the processing vari- ables. The principles of this approach and its applica- tions to the hot deformation of a wide range of materials were described by Prasad and other researchers. [8–11] In the DMM model, the constitutive equation used to relate the flow stress to strain rate and temperature is of power-law type, as follows: r ¼ K_ e m ½1where K is a temperature-dependent constant and m stands for the strain rate sensitivity parameter. This equation gives a good measurement of the behavior of the workpiece when it consumes the energy as a visco- plastic material. While in case of many metallic materi- als, Eq. [1] is actually applicable at high temperatures and low strain rates, such as creep, not at hot working conditions. It has been well-documented that many AMIR MOMENI, Assistant Professor, is with the Department of Materials Science and Engineering, Hamedan University of Technology, Hamedan, Iran. Contact e-mail: [email protected]KAMRAN DEHGHANI, Associate Professor, is with the Depart- ment of Mining and Metallurgy, Amirkabir University of Technology, Tehran, Iran. GOLAM REZA EBRAHIMI, Associate Professor, is with the Department of Materials and Polymer Engineering, Hakim Sabzevari University, Sabzevar, Iran. SHAHAB KAZEMI, Assistant Professor, is with the D. M. S. E., Bu Ali Sina University, Hamedan, Iran. Manuscript submitted October 14, 2012. METALLURGICAL AND MATERIALS TRANSACTIONS A
Transcript
Developing the Processing Maps Using the Hyperbolic SineConstitutive Equation
AMIR MOMENI, KAMRAN DEHGHANI, GOLAM REZA EBRAHIMI,and SHAHAB KAZEMI
Hot compression tests were performed on a duplex stainless steel at temperatures ranging from1223 K to 1473 K (950 �C to 1200 �C) and strain rates from 0.001 to 100 s�1. The constitutiveanalysis of flow stress was carried out using the hyperbolic sine function, and the materialconstants were determined at two typical strains of 0.3 and 0.7. The power dissipation map,instability map, and processing map for the material were developed for strains of 0.3 and 0.7.The developed processing maps were based on the hyperbolic sine as well as the conventionalpower-law constitutive equations. The efficiency of power dissipation (g) varied from 12 to60 pct over the studied temperature and strain rate. The highest value of g was obtained atstrain rates below 0.01 s�1, whereas the lowest value of g was observed at the intermediate strainrates. The instability region in sin h-based processing map was only observed in the range of1423 K to 1473 K (1150 �C to 1200 �C) and at a strain rate of 100 s�1, while the conventionalprocessing map did not predict any instability region. Optical microscopy observations weremore consistent with the results of the sin h-based processing map and indicated that theinstability regime at high temperatures and high strain rates was due to the development ofadiabatic shear bands.
DOI: 10.1007/s11661-013-1841-5� The Minerals, Metals & Materials Society and ASM International 2013
I. INTRODUCTION
THE prediction of flow stress and load needed for thedeformation of an alloy is an important step for thedesign of an industrial hot-working operation. The flowstress is closely related to the both intrinsic and extrinsicworkabilities of the material being deformed. Theintrinsic workability is governed by the mechanisms ofmicrostructural changes at a given deformation condi-tion. However, the processing variables, i.e., strain,strain rate, and temperature actually control the micro-structural evolutions and thereby the intrinsic andextrinsic workabilities of a material. Different constitu-tive equations have been used to interconnect thementioned workability factors and derive an applicableformula for measuring the flow stress as a function ofprocessing variables.[1–3] Even though the constitutiveequations are widely used to estimate the deformationloads, the behavior of the material in terms of stable orunstable flow should be also analyzed. One of the well-developed practical methods to avoid the occurrence of
an unstable flow and premature fracture is plotting aprocessing map. The approach of processing map,originally proposed by Raj.[4] is defined as a represen-tation of microstructural changes and restoration mech-anisms of a given material. However, some questionsstill arise about the reliability of this method.[5] Aprocessing map illustrates a superimposition of powerdissipation map (PDM) and instability regions whichare depicted on the basis of dynamic materials model(DMM).[6] DMM is a continuum model in which aninstability criterion based on the principles of irrevers-ible thermodynamic, as applied to large plastic flow, isutilized to mark flow instability regimes.[7] The powerdissipation and the instability maps are plotted in termsof deformation temperature and logarithm of strain rateto correlate different regions with the processing vari-ables. The principles of this approach and its applica-tions to the hot deformation of a wide range of materialswere described by Prasad and other researchers.[8–11]
In the DMM model, the constitutive equation used torelate the flow stress to strain rate and temperature is ofpower-law type, as follows:
r ¼ K_em ½1�
where K is a temperature-dependent constant and mstands for the strain rate sensitivity parameter. Thisequation gives a good measurement of the behavior ofthe workpiece when it consumes the energy as a visco-plastic material. While in case of many metallic materi-als, Eq. [1] is actually applicable at high temperaturesand low strain rates, such as creep, not at hot workingconditions. It has been well-documented that many
AMIR MOMENI, Assistant Professor, is with the Departmentof Materials Science and Engineering, Hamedan University ofTechnology, Hamedan, Iran. Contact e-mail: [email protected] DEHGHANI, Associate Professor, is with the Depart-ment of Mining and Metallurgy, Amirkabir University of Technology,Tehran, Iran. GOLAM REZA EBRAHIMI, Associate Professor, iswith the Department of Materials and Polymer Engineering, HakimSabzevari University, Sabzevar, Iran. SHAHAB KAZEMI, AssistantProfessor, is with the D. M. S. E., Bu Ali Sina University, Hamedan,Iran.
Manuscript submitted October 14, 2012.
METALLURGICAL AND MATERIALS TRANSACTIONS A
alloys subjected to hot deformation obey a hyperbolicsine constitutive equation,[12–16] that was originallyproposed by Garofalo[17] as follow:
Z ¼ _e expQ
RT
� �¼ A ½sin hða � rÞ�n: ½2�
Here, Z denotes the Zener–Hollomon parameter; Q isthe activation energy; and A, a, and n are the materialconstants. This widely used equation is indeed reduced topower-law [Eq. 1] and exponential equations, respec-tively, at low and high stress levels.[18] Although thisequation is proved to give a better description of flowstress than the exponential or power-law equations, it hasnot been used as a basic constitutive equation to developthe processing maps. Narayana Murty et al.[19–22] in a setof publications on developing processing maps, tried tosimplify the corresponding calculations and used othermethods instead of the power-law equation. But theydidn’t report a considerable difference between theprocessing maps developed by different methods.
The present investigation has been therefore devotedto study the development of processing maps using thehyperbolic sine constitutive equation. In this research, avery applicable duplex stainless steel designated as 2205has been analyzed. This alloy is widely used in differentindustries and its hot working behavior is challengingdue to the duplex nature of its microstructure.
II. EXPERIMENTAL PROCEDURES
The material used in this study is 2205 duplex stainlesssteel with the composition: 0.025 pct C, 22.80 pct Cr,5.20 pct Ni, 2.60 pct Mo, 0.30 pct Si, 1.50 pct Mn,0.001 pct S, 0.025 pct P, 0.088 pct V, 0.23 pct Cu,0.03 pct W, 0.068 pct Co, 0.028 pct Al, and the rest ofFe (all in wt pct). The starting microstructure of thestudied material consisting of about 54 pct ferrite and45 pct austenite is illustrated in Figure 1. The cylindrical
specimens, 10-mm diameter and 15-mm height, wereprepared from the as-received hot-rolled plate with thelongitudinal axis parallel to the rolling direction. Beforetesting, all specimens were reheated to 1473 K(1200 �C), soaked for 5 minutes, and then subjected tohot compression tests at the temperatures ranging from1223 K to 1473 K (950 �C to 1200 �C) and strain ratesfrom 0.001 to 100 s�1 using a Gleeble 3800 thermome-chanical simulator. Graphite powder was applied onboth surfaces of specimens to reduce friction coefficientbetween the specimen ends and the anvils. To preservemicrostructures developed during hot deformation,samples were quenched within three seconds after hotdeformation. Hotdeformed specimens were cut alongthe longitudinal axis and electrochemically polished.Following this, electrolytical etching in a 60 pct solutionof HNO3 was adopted to reveal microstructures.Finally, an optical microscopy was used to characterizethe microstructures of the deformed samples.
III. RESULTS AND DISCUSSION
A. Constitutive Analysis
Figure 2 demonstrates the flow curves obtained fromhot compression testing at different deformation condi-tions. The flow curves approve the generally acceptedrules that the flow curve increases as temperaturesdecreases or strain rate rises. Moreover, the flow curvesare different with the flow curves that are typicallyobserved when either dynamic recrystallization (DRX)or dynamic recovery (DRV) are controlling. The typicalflow curves of DRX are usually characterized by a peakfollowing which flow softening attains a steady-statebehavior. In case of DRV, flow curve indicates a longplateau after work hardening stage. The obtained flowcurves indicate that most of them have shapes inbetween the typical DRX and DRV curves.The special form of the curves can be directly related
to the duplex structure of 2205 steel and has beenanalyzed by Momeni and Dehghani.[23] Because austen-ite is prone to DRX and ferrite is instead softened byDRV, the flow curves of 2205 inherit some aspects fromthe two different kinds of DRV and DRX flow curves.At a high temperature like 1373 K (1100 �C) andespecially at low strain rates where ferrite is dominant,flow curves are analogous to the DRV curves with along plateau of steady-state flow. On the contrary, atlow temperature of 1223 K (950 �C) and high strainrates, the harder phase that is austenite starts to workharden, and the flow curve is characterized by thetypical form of DRX flow curves.In general, the hyperbolic sine function [Eq. 2] is the
most applicable equation that connects the flow stress ata given strain value to strain rate and temperature over awide range of applied deformation conditions. In orderto determine the material constants, the logarithmicform of Eq. [2] that is given below is more useful:
ln _e ¼ lnA� Q
RT
� �þ n ln sin hða � rÞ: ½3�
Fig. 1—Starting microstructure of the 2205 duplex stainless steelused in this investigation.
METALLURGICAL AND MATERIALS TRANSACTIONS A
The value of n is simply determined as the partialdifferentiation of strain rate with respect to the flowstress at a constant temperature, given by
n ¼ @ ln _e@ ln sin hða � rÞ : ½4�
In a similar way, Q is evaluated from the firstderivative of stress respecting the inverse of temperature,as follows:
Q ¼ nR@ ln sin hða � rÞ
@ð1=TÞ : ½5�
Using this procedure, the obtained experimental datawere processed at two strain values of 0.3 and 0.7 toshow the behaviors of the material at both low and highstrain levels. Figure 3 indicates the plot of strain rate vsflow stress according to Eq. [4].
The high value of correlation factor reflects thatEq. [2] suitably fits the experimental data. The average
value of n at both strain levels is nearly the same as 3.4.However, as the authors declared in the previouspublications, n value actually depends on the deforma-tion temperature because it is sensitive to the dominantphase in the microstructure.[23] Through the mentionedprocedure, a was adjusted as 0.012 so that it brings thecurves to the most linear and parallel condition.The plots of flow stress against 1/T, shown in
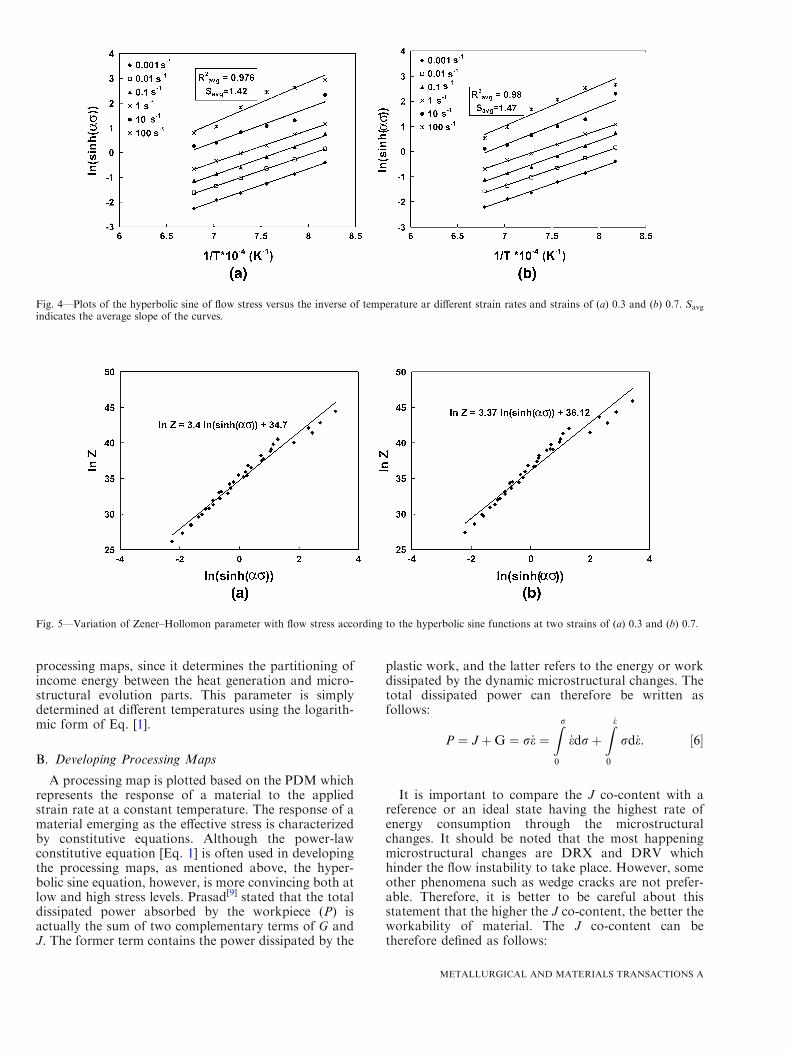
Figure 4, are depicted according to Eq. [5] and used todetermine the value of the apparent activation energy.By using the average slope of the curves (Savg) that isequal to ¶ln sin h(ar)/¶(1/T), the values of Q werecalculated as 405 and 420 kJ mol�1 for strains of 0.3and 0.7, respectively. Figure 5 indicates how the exper-imental data of flow stress at two strains of 0.3 and 0.7fit to the frame of the hyperbolic sine function.In order to make a comparison between the conven-
tional processing maps based on Eq. [1] and the sin h-based processing map, the average values of the strainrate sensitivity parameter (m) are determined and shownin Figure 6 for two strains of 0.3 and 0.7. It should benoted that m is a key parameter in developing the
Fig. 2—True stress–true strain curves obtained at (a) 1223 K (950 �C) and (b) 1373 K (1100 �C).
Fig. 3—Variations of flow stress with strain rate in the frame of the hyperbolic sine functions and at strains of (a) 0.3 and (b) 0.7.
METALLURGICAL AND MATERIALS TRANSACTIONS A
processing maps, since it determines the partitioning ofincome energy between the heat generation and micro-structural evolution parts. This parameter is simplydetermined at different temperatures using the logarith-mic form of Eq. [1].
B. Developing Processing Maps
A processing map is plotted based on the PDM whichrepresents the response of a material to the appliedstrain rate at a constant temperature. The response of amaterial emerging as the effective stress is characterizedby constitutive equations. Although the power-lawconstitutive equation [Eq. 1] is often used in developingthe processing maps, as mentioned above, the hyper-bolic sine equation, however, is more convincing both atlow and high stress levels. Prasad[9] stated that the totaldissipated power absorbed by the workpiece (P) isactually the sum of two complementary terms of G andJ. The former term contains the power dissipated by the
plastic work, and the latter refers to the energy or workdissipated by the dynamic microstructural changes. Thetotal dissipated power can therefore be written asfollows:
P ¼ JþG ¼ r_e ¼Zr
0
_edrþZ _e
0
rd_e: ½6�
It is important to compare the J co-content with areference or an ideal state having the highest rate ofenergy consumption through the microstructuralchanges. It should be noted that the most happeningmicrostructural changes are DRX and DRV whichhinder the flow instability to take place. However, someother phenomena such as wedge cracks are not prefer-able. Therefore, it is better to be careful about thisstatement that the higher the J co-content, the better theworkability of material. The J co-content can betherefore defined as follows:
Fig. 4—Plots of the hyperbolic sine of flow stress versus the inverse of temperature ar different strain rates and strains of (a) 0.3 and (b) 0.7. Savg
indicates the average slope of the curves.
Fig. 5—Variation of Zener–Hollomon parameter with flow stress according to the hyperbolic sine functions at two strains of (a) 0.3 and (b) 0.7.
METALLURGICAL AND MATERIALS TRANSACTIONS A
J ¼ r_e� G ¼ r_e�Z _e
0
rd_e: ½7�
Therefore, the J co-content can be determined if anappropriate constitutive description of r is presented forthe studiedmaterial. Asmentioned in the previous section,the hyperbolic sine function suitably describes the connec-tion between flow stress, strain rate, and temperature. Theflow stress can be determined from Eq. [2] as follows:
r ¼ 1
asin h�1 _e
1
Aexp
Q
RT
� �� �� �1=n: ½8�
Figure 7 indicates that Eq. [8] gives a reasonablemeasurement of flow stress at different strain rates anddeformation temperatures.
The accuracy of this model is satisfactory enough toimply the combination of this constitutive equation offlow stress with Eq. [7]. Hence, after some algebraicoperations, the G content can be written as follows:
G ¼Z _e
0
rd_e ¼Z _e
0
1
asin h�1 _e
1
Aexp
Q
RT
� �� �� �1=nd_e
¼ 1
a_e sin h�1
1
Aexp
Q
RT
� �_e
� �1=n
�1A exp
QRT
� �_e
� �1=nf _eð Þ
h i1þ n
8<:
9=;
0@
1A
24
35
½9�
where,f _eð Þ is a hypergeometric function, given by
fð_eÞ ¼ Hypergeometric 2F1
"1=2; ð1þ nÞ=2; ð3þ nÞ=2;
� 1
Aexp
Q
RT
� �_e
� �2=n !#½10�
The value of the hypergeometric function of Eq. [10]is calculated using the values of n, Q, and A determined
in the previous section. Table I summarizes the values ofthe hypergeometric function at different temperatureand strain rates.According to DMM, the J content of a material can
be evaluated with respect to that of an ideal lineardissipater which is as G = J = (1/2)re. Using thisdefinition, the dimensionless efficiency of power dissi-pation, g, can be written as follows:
g ¼ J
Jmax¼ J
r_e=2: ½11�
Therefore, to construct the PDM of a material basedon the hyperbolic sine equation a combination ofEqs. [7], [9], and [11] are to be used to determine g atdifferent deformation conditions. In conventional pro-cessing maps which are based on Eq. [1], g is simplywritten as a function of m, given by
g ¼ J
Jmax¼ 2m
mþ 1: ½12�
It should be noted again that a high value of g (e.g.,>60 pct) is not always preferable because some insta-bility mechanisms such as wedge cracks may contributein such a high efficiency of power consumption.[24]
Figure 8 demonstrates the values of g calculated basedon the sin h equation at different deformation conditionsin the frame of strain rate and temperature. In this figure,the counter numbers represent the efficiency of powerdissipation. The calculated g values range between 12 and60 suggesting fairly good workability of the studiedmaterial. Higher g values are observed at low strain rates(actually below 1 s�1) where DRV in ferrite seems to beresponsible for the extension, unraveling the strain energy.Although, more than likely, the regions with higher g
values can be regarded as the safer regions for hotworking, DMM is capable of introducing the regions oflow stability. Ziegler[7] considered the stability of a givenmaterial during hot deformation via DMM approach
Fig. 6—Variations of flow stress with strain rate in a logarithmic scale according to the power-law constitutive equation at strains of (a) 0.3 and(b) 0.7.
METALLURGICAL AND MATERIALS TRANSACTIONS A
and proposed that stable flow is ensured if the followinginequality is satisfied:
dJ
d_e>
J
_e: ½13�
Therefore, the stability condition can be summarizedas the following inequality:
d ln J
d ln _e>1: ½14�
In conventional processing maps based on Eq. [1],Eqs. [1], [7], and [14] are combined to define a stabilityparameter (n) that simplifies the stability condition asfollows:
Fig. 7—Comparison of experimental flow stress and predicted values using the developed hyperbolic sine constitutive equations at differentstrain rates and strains of (a) 0.3 and (b) 0.7.
Table I. Values of the Hypergeometric Function in Eq. [10] at Different Deformation Temperatures and Strain Rates
0.001 s�1 0.01 s�1 0.01 s�1 1 s�1 10 s�1 100 s�1
1223 K (950 �C) 0.899 0.727 0.481 0.272 0.143 0.731273 K (1000 �C) 0.955 0.856 0.651 0.406 0.223 0.1161323 K (1050 �C) 0.98 0.93 0.791 0.558 0.328 0.1751373 K (1100 �C) 0.99 0.966 0.885 0.701 0.455 0.2541423 K (1150 �C) 0.995 0.983 0.938 0.815 0.588 0.3521473 K (1200 �C) 0.998 0.992 0.968 0.892 0712 0.465
Fig. 8—Sin h-based power dissipation map developed at strains of (a) 0.3 and (b) 0.7. Each counter number represents the efficiency of powerdissipation in pct.
METALLURGICAL AND MATERIALS TRANSACTIONS A
nð_eÞ ¼@ ln m
mþ1
� @ ln _�e
þm>0: ½15�
In order to use Eq. [2] as the constitutive equation, thestability condition should be considered in its originalform [Eq. 14]. However, it is possible to present anumerical approach to solve the inequality of Eq. [14]using the definition of first order derivation as follows:
ln Jð_e1Þ � ln Jð_e2Þln _e1 � ln _e2
e;T
>1: ½16�
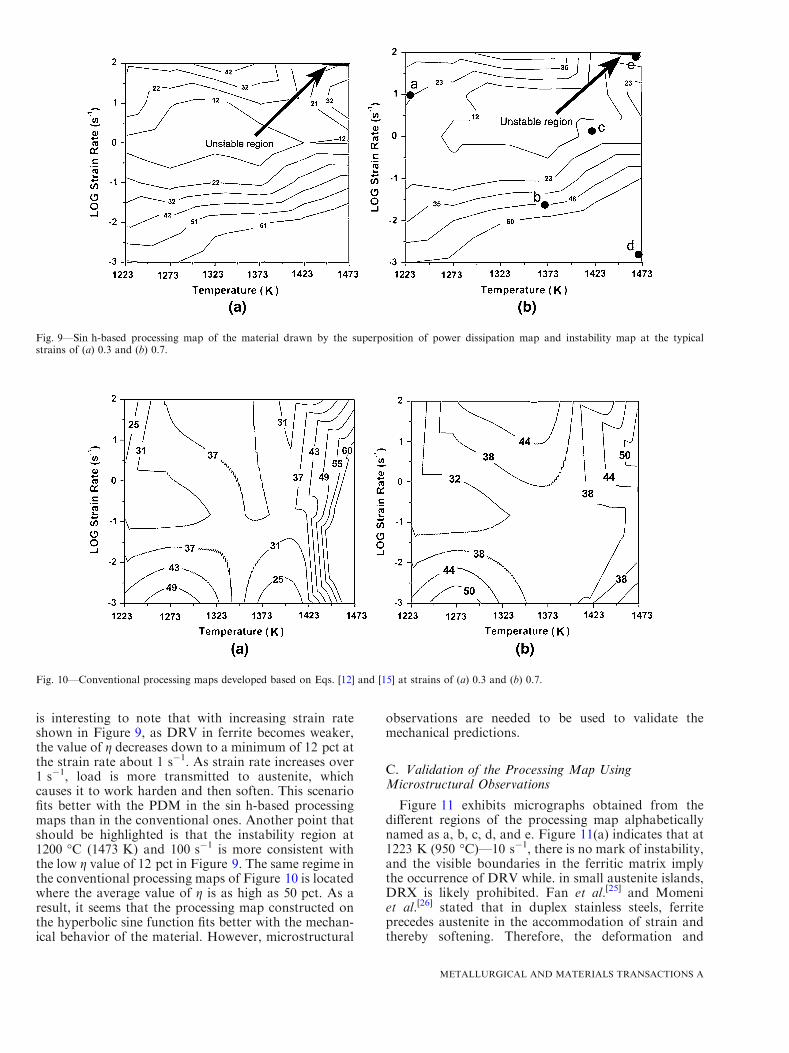
Table II summarizes the values of d ln J=d ln _e ascalculated from Eq. [16] at different deformationregimes. It is observed that except at 1473 K (1200 �C)and 100 s�1, at other deformation conditions, thecondition of stability according to Eq. [14] is met. Thecomplete processing maps exhibited in Figure 9 havebeen plotted by superimposing Figure 8 and the insta-bility predictions according to Eq. [16].
The hot deformation regimes out of the dark regionson the processing map of the material indicated in
Figure 9, should result in a stable flow due to theoccurrence of different dynamic restoration processes,i.e., DRX in austenite and DRV in ferrite. It is wellknown that the dynamic softening mechanisms releasethe stored deformation energy by dislocation annihila-tion or by the formation of new dislocation-free grains.The structural modifications caused by dynamic soften-ing mechanisms degrade the strain accumulation andtherefore prevent the formation of voids, triple-junction(wedge) cracking, or shear bands.In a parallel way, the processing map of the material
was also developed, as shown in Figure 10, using theconventional method described by Eqs. [12] and [15]. Asobserved, the conventional processing map predicts thestable flows at all the studied deformation conditions.This indicates that the conventional processing mapshave more optimistic predictions regarding instabilitycompared with the processing maps of Figure 9. More-over, the contours of g in the conventional processingmap are more irregular than in Figure 9. Meanwhile, itshould be taken into account that, at low strain rates,DRV in the ferritic matrix is expected to proceedexpeditiously and therefore cause a higher g value that ismore consistent with the sin h-based processing maps. It
Table II. Values of d ln J=d ln _e at Two Typical Strains of 0.3 and 0.7 Calculated Using the Numerical Approach of Eq. [16]
Temperature Strain Rate (s�1) (d ln J=d ln _e) at e = 0.3 (d ln J=d ln _e) at e = 0.7
is interesting to note that with increasing strain rateshown in Figure 9, as DRV in ferrite becomes weaker,the value of g decreases down to a minimum of 12 pct atthe strain rate about 1 s�1. As strain rate increases over1 s�1, load is more transmitted to austenite, whichcauses it to work harden and then soften. This scenariofits better with the PDM in the sin h-based processingmaps than in the conventional ones. Another point thatshould be highlighted is that the instability region at1200 �C (1473 K) and 100 s�1 is more consistent withthe low g value of 12 pct in Figure 9. The same regime inthe conventional processing maps of Figure 10 is locatedwhere the average value of g is as high as 50 pct. As aresult, it seems that the processing map constructed onthe hyperbolic sine function fits better with the mechan-ical behavior of the material. However, microstructural
observations are needed to be used to validate themechanical predictions.
C. Validation of the Processing Map UsingMicrostructural Observations
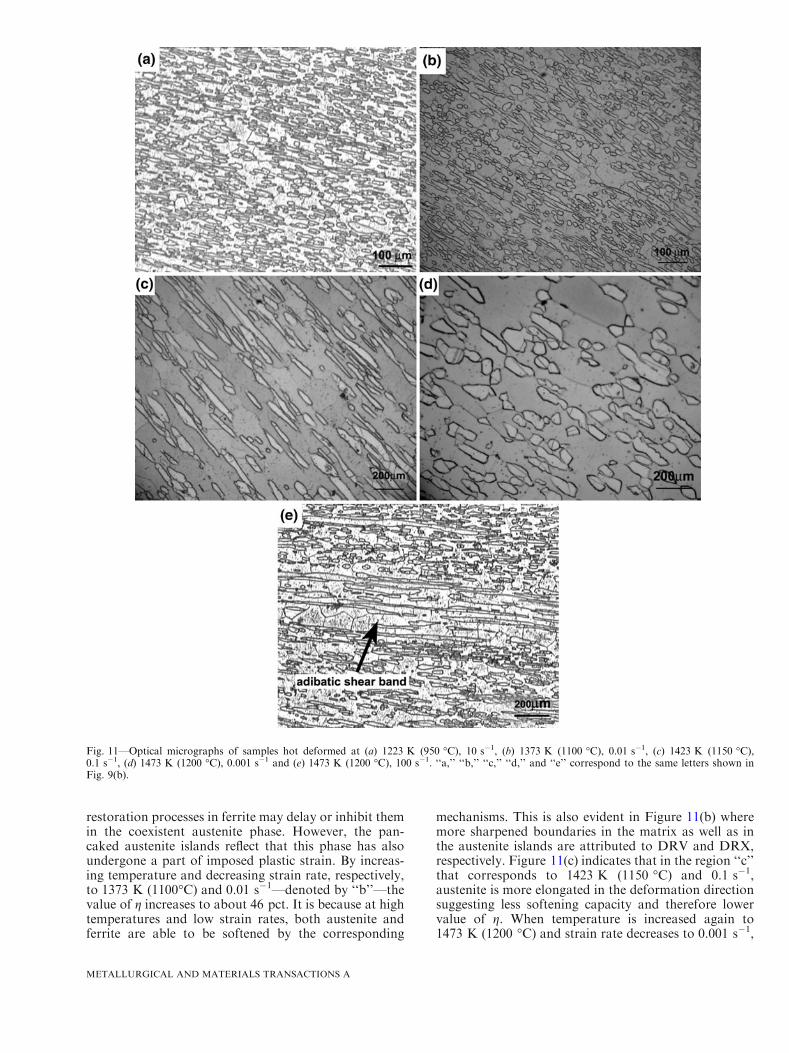
Figure 11 exhibits micrographs obtained from thedifferent regions of the processing map alphabeticallynamed as a, b, c, d, and e. Figure 11(a) indicates that at1223 K (950 �C)—10 s�1, there is no mark of instability,and the visible boundaries in the ferritic matrix implythe occurrence of DRV while. in small austenite islands,DRX is likely prohibited. Fan et al.[25] and Momeniet al.[26] stated that in duplex stainless steels, ferriteprecedes austenite in the accommodation of strain andthereby softening. Therefore, the deformation and
Fig. 9—Sin h-based processing map of the material drawn by the superposition of power dissipation map and instability map at the typicalstrains of (a) 0.3 and (b) 0.7.
Fig. 10—Conventional processing maps developed based on Eqs. [12] and [15] at strains of (a) 0.3 and (b) 0.7.
METALLURGICAL AND MATERIALS TRANSACTIONS A
restoration processes in ferrite may delay or inhibit themin the coexistent austenite phase. However, the pan-caked austenite islands reflect that this phase has alsoundergone a part of imposed plastic strain. By increas-ing temperature and decreasing strain rate, respectively,to 1373 K (1100�C) and 0.01 s�1—denoted by ‘‘b’’—thevalue of g increases to about 46 pct. It is because at hightemperatures and low strain rates, both austenite andferrite are able to be softened by the corresponding
mechanisms. This is also evident in Figure 11(b) wheremore sharpened boundaries in the matrix as well as inthe austenite islands are attributed to DRV and DRX,respectively. Figure 11(c) indicates that in the region ‘‘c’’that corresponds to 1423 K (1150 �C) and 0.1 s�1,austenite is more elongated in the deformation directionsuggesting less softening capacity and therefore lowervalue of g. When temperature is increased again to1473 K (1200 �C) and strain rate decreases to 0.001 s�1,
Fig. 11—Optical micrographs of samples hot deformed at (a) 1223 K (950 �C), 10 s�1, (b) 1373 K (1100 �C), 0.01 s�1, (c) 1423 K (1150 �C),0.1 s�1, (d) 1473 K (1200 �C), 0.001 s�1 and (e) 1473 K (1200 �C), 100 s�1. ‘‘a,’’ ‘‘b,’’ ‘‘c,’’ ‘‘d,’’ and ‘‘e’’ correspond to the same letters shown inFig. 9(b).
METALLURGICAL AND MATERIALS TRANSACTIONS A
the region indexed as ‘‘d’’ is characterized by a g value ashigh as 60 pct. The corresponding microstructure inFigure 11(d) exhibits mostly the globular austeniteisland instead of the string-form at high strain ratesand sharp boundaries in both ferrite and austenite,reflecting expeditious contributions of DRV and DRXtoward a kind of superplastic deformation. As acomparison, in Figure 10(b), the same region denotedby ‘‘d’’ [1473 K (1200 �C)—0.001 s�1] corresponds toabout 38 pct energy consumption through microstruc-tural changes. It is therefore concluded that the exten-sive microstructural changes that were observed inFigure 11(d) are more consistent with the value of60 pct for g in the sin h-based processing map than withthe value of 38 pct in Figure 10(b).
At the same temperature of 1473 K (1200 �C) andvery high strain rate of 100 s�1 indicated by ‘‘e’’ in thesin h-based processing map (Figure 9(b)), the onlyregion of flow instability is predicted by the mechanicaltesting. Figure 11(e) shows microstructure obtainedfrom the instability region denoted by ‘‘e.’’ As observed,although there is no indication of cracking or voidformation in the matrix or the in the austenite islands,but the austenite phase has been locally elongated thatintroduces the formation of an adiabatic shear band.Meanwhile, the ferrite grains in the adiabatic shear bandare considerably larger and are separated by very sharpboundaries. Momeni et al.[26] observed that ferrite canbear a kind of continuous dynamic recrystallization(CDRX) when DRV extends to high strains. Thisprocess becomes possible by the micromechanism ofsubgrains growth and coalescence. At high temperaturesand high strain rates the conduction rate of deformationheating to the adjacent tools cannot keep pace with thedeformation rate. Therefore, it gives rise to the entrap-ment of extra heat into the sample and the local declineof flow stress. The adiabatic shear band is a regionwhere the local decline of flow stress due to adiabaticheating causes the strain to be localized. As ferrite issofter than austenite at hot working temperatures, inthis region, the extra strain is preferably accommodatedby ferrite and results in extended DRV and CDRX. Ingeneral, due to the localization of strain the adiabaticshear band is known as a variant of instability duringhot working. In Figure 9(b), this region is accompaniedby a the lowest value of g as 12 pct; while inFigure 10(b), not only has the region not been markedas instable, but also a high average value of g rangingfrom 40 to 50 pct is observed. Consequently, themetallographic observations are more consistent withthe results of the sin h-based processing maps.
IV. CONCLUSIONS
The processing maps of 2205 duplex stainless steelwere developed based on the hyperbolic sine and power-law constitutive equations. The most important resultsare listed below:
1. The flow stress of the studied material was connectedto strain rate and temperature by the hyperbolic sinefunction at both low and high strain levels.
2. The PDM, instability map, and processing mapwere developed for the strains of 0.3 and 0.7 basedon the hyperbolic sine constitutive equation as wellas by the conventional method.
3. The efficiency of power dissipation (g) varied from12 to 60 pct over the studied temperatures andstrain rates. The highest value of g was obtained atstrain rates below 0.01 s�1, whereas the lowest valueof g was observed at the intermediate strain rates.
4. The only instability region on the sin h-based pro-cessing map was observed in the range from 1423 Kto 1473 K (1150 �C to 1200 �C) and at the strain rateof 100 s�1. This was found to be due to the develop-ment of adiabatic shear bands. The conventionalprocessing map did not predict any instability region.
5. The power dissipation and instability maps devel-oped by the hyperbolic sine function were moreconsistent with the microstructural observationsthan the corresponding maps developed by the con-ventional method.
REFERENCES1. G.R. Ebrahimi, H. Keshmiri, A. Momeni, and M. Mazinani:
Mater. Sci. Eng. A, 2011, vol. A528, pp. 7488–93.2. A. Dehghan-Manshadi, M.R. Barnett, and P.D. Hodgson: Metall.
Mater. Trans. A, 2008, vol. 39A, pp. 1359–70.3. M. Yazdani, S.M. Abbasi, A. Momeni, and A. Karimi Taheri:
Mater. Des., 2011, vol. 32, pp. 2956–62.4. R. Raj: Metall. Trans. A, 1981, vol. 12A, pp. 1089–97.5. B. Bozzini and E. Cerri: J. Nucl. Mater., 2002, vol. 328, pp. 344–47.6. Y.V.R.K. Prasad, H.J. Gegel, S.M. Doraivelu, J.C. Malas, J.T.
Morgan, L.A. Lark, and D.R. Barker: Metall. Trans. A, 1984,vol. 15A, pp. 1883–92.
7. H. Ziegler:, in Progress in Solid Mechanics, I.N. Sneedon and R.Hill, eds., Wiley, New York, NY, 1963, vol. 4, pp. 63–193.
8. Y.V.R.K. Prasad: Ind. J. Technol., 1990, vol. 28, pp. 435–51.9. Y.V.R.K. Prasad and T. Seshacharyulu: Int. Mater. Rev., 1998,
vol. 43, pp. 243–58.10. Y.V.R.K. Prasad: J.Mater. Eng. Perform., 2003, vol. 12, pp. 638–45.11. I. Philipart and H.J. Rack: Mater. Sci. Eng., 1998, vol. A254,
pp. 253–67.12. A. Momeni, S.M. Abbasi, and H. Badri: Appl. Math. Model.,
2012, vol. 36, pp. 5624–32.13. Y.C. Lin, M.S. Chen, and J. Zhong: Comp. Mater. Sci., 2008,
vol. 42, pp. 470–77.14. Y.C. Lin and X.M. Chen: Mater. Des., 2011, vol. 32, pp. 1733–59.15. A. Momeni, K. Dehghani, G.R. Ebrahimi, and H. Keshmiri:
Metall. Mater. Trans. A, 2010, vol. 41A, pp. 2898–904.16. M. Mirzaee, H. Keshmiri, G.R. Ebrahimi, and A. Momeni:Mater.
Sci. Eng., 2012, vol. 551, pp. 25–31.17. F. Garofalo: Fundamentals of Creep and Creep-Rupture in Metals,
Macmillan Company, New York, NY, 1966.18. A. Momeni and K. Dehghani: Metall. Mater. Trans. A, 2011,
vol. 42A, pp. 1925–32.19. S.V.S. Narayana Murty, B. Nageswara Rao, and B.P. Kashyap:
Model. Simul. Mater. Sci. Eng., 2002, vol. 10, pp. 503–20.20. S.V.S. Narayana Murty and B. Nageswara Rao: Mater. Sci. Eng.,
1998, vol. A254, pp. 76–82.21. S.V.S. Narayana Murty and B. Nageswara Rao: Mater. Sci.
Technol., 1998, vol. 14, pp. 835–37.22. S.V.S. Narayana Murty, M.S. Sarma, and B. Nageswara Rao:
Metall. Mater. Trans. A, 1997, vol. 28A, pp. 1581–82.23. A. Momeni and K. Dehghani: Mater. Sci. Eng., 2011, vol. 528,
pp. 1448–54.24. R. Ebrahimi and A. Najafizadeh: Int. J. ISSI, 2004, vol. 1, pp. 1–7.25. G.W. Fan, J. Liu, P.D. Han, and G.J. Qiao: Mater. Sci. Eng.,
2009, vol. A515, pp. 108–12.26. A. Momeni, K. Dehghani, and X.X. Zhang: J. Mater. Sci., 2011,