Nigel W.T. Quinn PhD, P.E., D.WRE, F.ASCE Research Group Leader, HEADS Berkeley National Laboratory/US Bureau of Reclamation Oussama El Ghazlane HEADS, Berkeley National Laboratory Ayman Alzraiee, PhD Karl Longley, PhD, P.E. California State University, Fresno HYDROECOLOGICAL ENGINEERING ADVANCED DECISION SUPPORT (HEADS) Lawrence Berkeley National Laboratory • Earth Sciences Division 1 Cyclotron Road, MS 14-134C • Berkeley, CA 94720 • 510-486-7056 May 5, 2016 Developing Water Quality Objectives for Salinity Diversions to Agriculture using Steady-state and Transient Models
Transcript
Nigel W.T. Quinn PhD, P.E., D.WRE, F.ASCEResearch Group Leader, HEADS
Berkeley National Laboratory/US Bureau of Reclamation
Oussama El GhazlaneHEADS, Berkeley National Laboratory
Ayman Alzraiee, PhDKarl Longley, PhD, P.E.
California State University, Fresno
HYDROECOLOGICAL ENGINEERING ADVANCED DECISION SUPPORT (HEADS)
Lawrence Berkeley National Laboratory • Earth Sciences Division1 Cyclotron Road, MS 14-134C • Berkeley, CA 94720 • 510-486-7056
May 5, 2016
Developing Water Quality Objectives for Salinity Diversions to Agriculture using Steady-state and
Transient Models
Salinity regulation in the San Joaquin Basin
HYDROECOLOGICAL ENGINEERING ADVANCED DECISION SUPPORT (HEADS)
The Central Valley Regional Board adopted a stakeholder-centric approach to salinity planning and regulation – CVSALTS.
Tasked with rewriting the Basin Plan for water quality
Basin Plan includes provision for real-time salinity management
Requires dischargers (otherwise subject to WDR’s) to adopt a “Board approved” real-time salinity management program
Program includes continuous monitoring, data access and sharing, modeling and real-time decision support
Reliance on sensor networks and the development of a stakeholder supported sensor web.
Need to develop protective water quality (salinity) objectives for irrigation diversions from the San Joaquin River
HYDROECOLOGICAL ENGINEERING ADVANCED DECISION SUPPORT (HEADS)
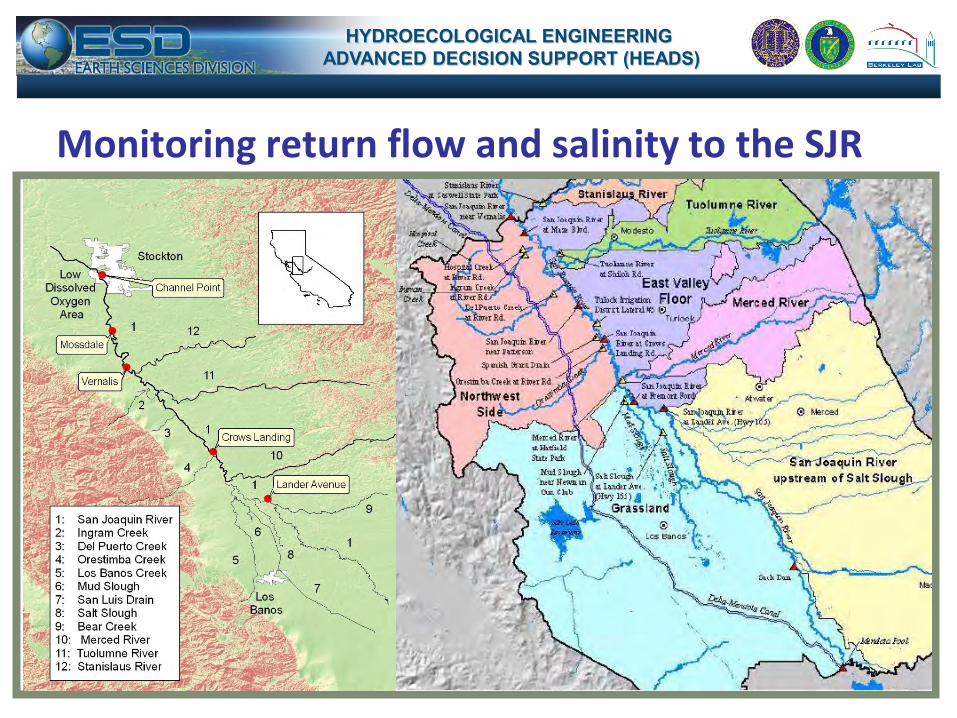
Monitoring return flow and salinity to the SJR
HYDROECOLOGICAL ENGINEERING ADVANCED DECISION SUPPORT (HEADS)
Management of riparian diversion salinity
HYDROECOLOGICAL ENGINEERING ADVANCED DECISION SUPPORT (HEADS)
Comparison of EC at three SJR monitoring stations
HYDROECOLOGICAL ENGINEERING ADVANCED DECISION SUPPORT (HEADS)
Salt Tolerance of Crops in the Southern Sacramento-San Joaquin Delta, Hoffman, 2010
HYDROECOLOGICAL ENGINEERING ADVANCED DECISION SUPPORT (HEADS)
• SalinityOsmotic stress on plants
• SodicityLoss of soil permeability
• ToxicityDirect toxic effect on plants
Criteria affecting water quality for crop production
Units of Measure for Electrical Conductivity1 dS/m = 1,000 µS/cm = 1 mmho/cm1 dS/m ≈ 640 mg/l or 640 ppm total dissolved solids
Salt Tolerance of Crops in the Southern Sacramento-San Joaquin Delta, Hoffman, 2010.
HYDROECOLOGICAL ENGINEERING ADVANCED DECISION SUPPORT (HEADS)
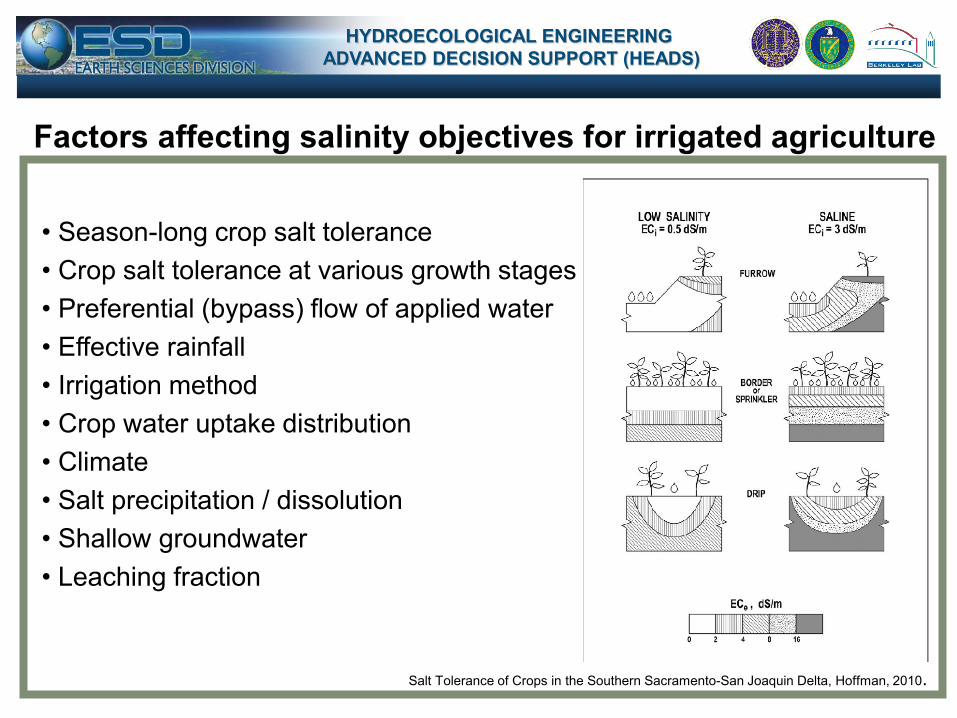
Factors affecting salinity objectives for irrigated agriculture
Salt Tolerance of Crops in the Southern Sacramento-San Joaquin Delta, Hoffman, 2010.
• Season-long crop salt tolerance• Crop salt tolerance at various growth stages• Preferential (bypass) flow of applied water• Effective rainfall• Irrigation method• Crop water uptake distribution• Climate• Salt precipitation / dissolution• Shallow groundwater• Leaching fraction
Comparison of crop salt tolerance 1990’s vs 2000’s
HYDROECOLOGICAL ENGINEERING ADVANCED DECISION SUPPORT (HEADS)
CWQRCB. LSJR Salt Tolerance Report, 2016.
HYDROECOLOGICAL ENGINEERING ADVANCED DECISION SUPPORT (HEADS)
Seasonal salt tolerance by crop type
Salt Tolerance of Crops in the Southern Sacramento-San Joaquin Delta, Hoffman, 2010
HYDROECOLOGICAL ENGINEERING ADVANCED DECISION SUPPORT (HEADS)
Steady-state models for soil salinity management
Salt Tolerance of Crops in the Southern Sacramento-San Joaquin Delta, Hoffman, 2010
• Bernstein (1964): Lr
= ECi/ EC
e50(consistently overestimates Lr)
• Bernstein and Francois (1973b)& van Schilfgaarde (1974): L
r = EC
i/ (2*EC
e0)
(consistently underestimates Lr)
• Rhoades (1974): Lr
= ECi/ (5*EC
et– Ec
i)
(reasonable at low Lr,
overestimates severely at high Lr)
• Rhoades and Merrill (1976): Lr
= ECi/ EC
e40-30-20-10
(large swings between over/underestimating Lr)
• Hoffman and van Genuchten (1983): (correlates best with measured L
rC/C
a= 1/L + (δ/Z x L) x ln [L + (1 – L) x exp( –Z/δ) ] – 1.73
- underestimates at high Lr)
C = salt conc. of soil saturated extract
HYDROECOLOGICAL ENGINEERING ADVANCED DECISION SUPPORT (HEADS)
Cereals
Forage grasses
Salt Tolerance of Crops in the Southern Sacramento-San Joaquin Delta, Hoffman, 2010
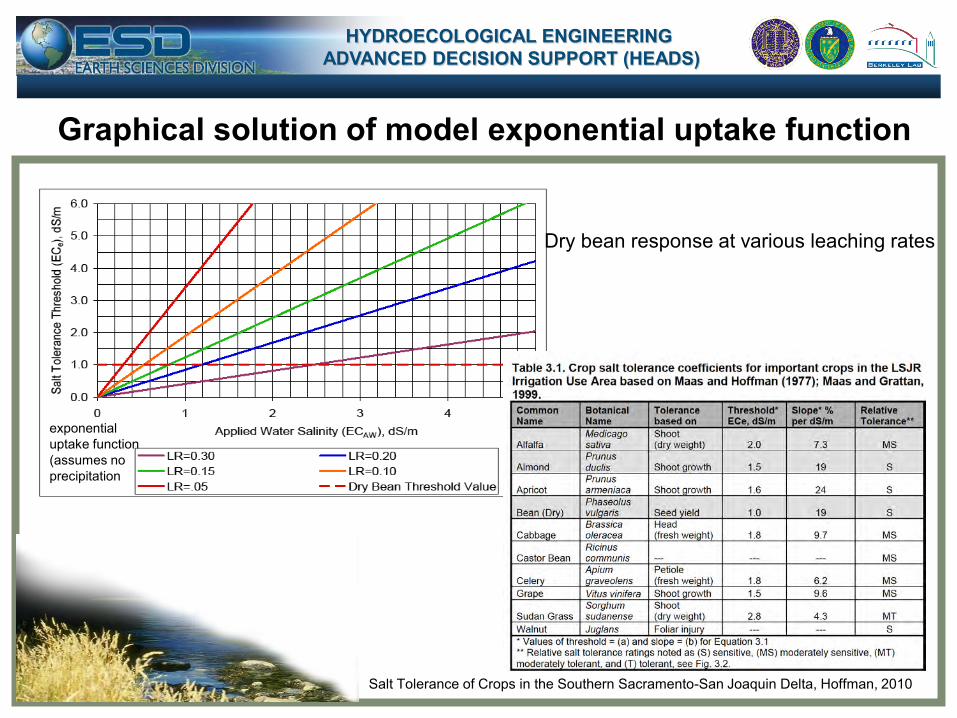
Graphical solution of model exponential uptake function
HYDROECOLOGICAL ENGINEERING ADVANCED DECISION SUPPORT (HEADS)
exponential uptake function (assumes no precipitation
Salt Tolerance of Crops in the Southern Sacramento-San Joaquin Delta, Hoffman, 2010
Dry bean response at various leaching rates
HYDROECOLOGICAL ENGINEERING ADVANCED DECISION SUPPORT (HEADS)
Factors affecting performance of existing transient models
• Appropriate water uptake function
• Feedback mechanism for soil-waterstatus, plant growth & transpiration
• Allows additional water uptake from non-stressed region of root zone.
• Accounts for salt precipitation/dissolution
• Can be compared to field experimental data
• Grattan – modified 40-30-20-10
• Corwin - TETrans
• Simunek - UNSATCHEM
• Letey – ENVIRO-GRO
Limitations of existing transient hydrosalinity models
HYDROECOLOGICAL ENGINEERING ADVANCED DECISION SUPPORT (HEADS)
• Poor or non-existent documentation• Developed and more appropriate for use by the research
community• Poorly designed or non-existent graphical user interfaces• Few are validated with field data• Very few being used for day-to-day salinity management• Difficult to make direct comparisons with more widely
accepted steady-state models (Hoffman model)
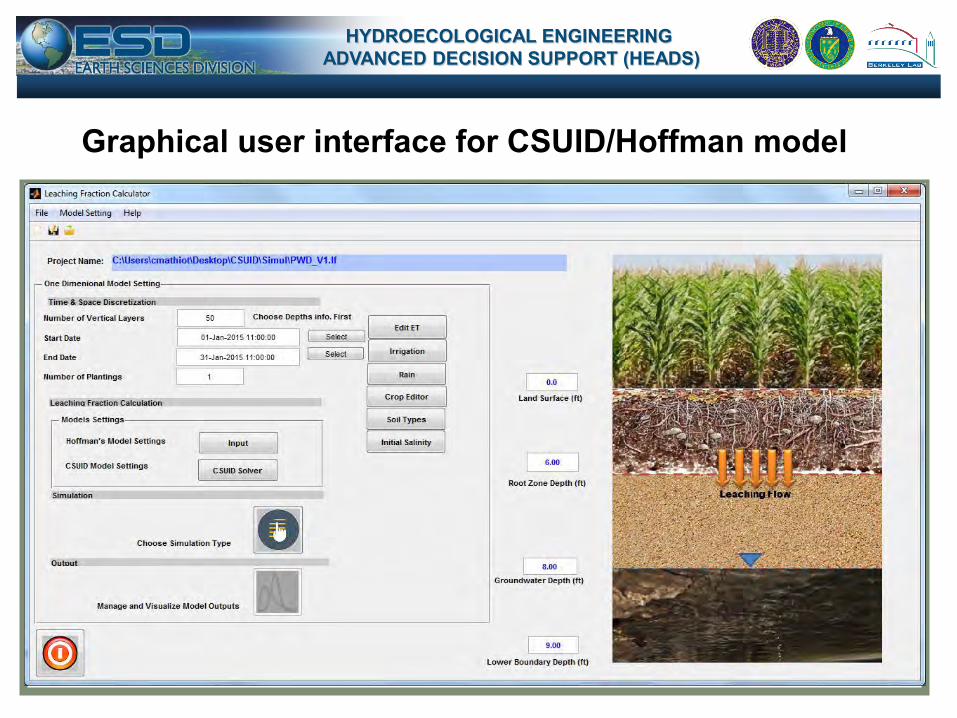
Graphical user interface for CSUID/Hoffman model
HYDROECOLOGICAL ENGINEERING ADVANCED DECISION SUPPORT (HEADS)
HYDROECOLOGICAL ENGINEERING ADVANCED DECISION SUPPORT (HEADS)
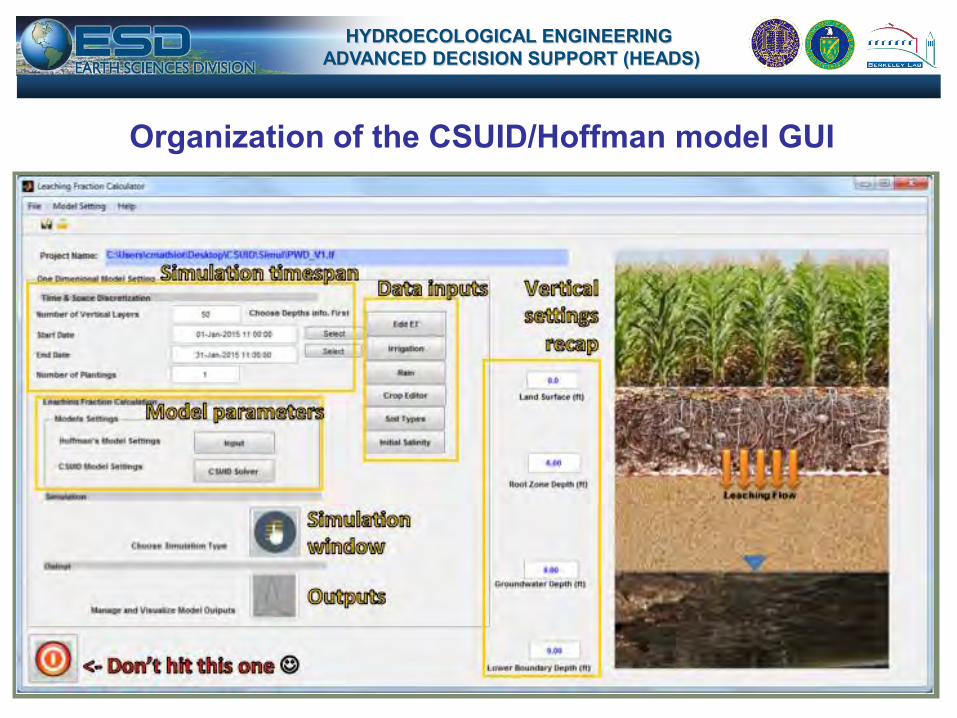
Organization of the CSUID/Hoffman model GUI
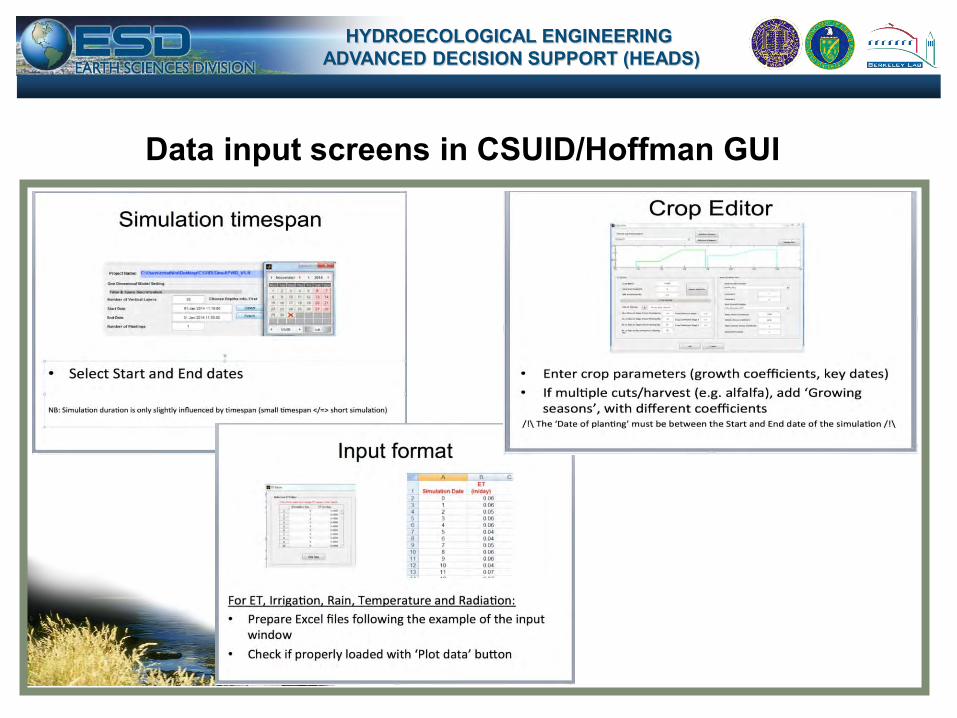
Data input screens in CSUID/Hoffman GUI
HYDROECOLOGICAL ENGINEERING ADVANCED DECISION SUPPORT (HEADS)
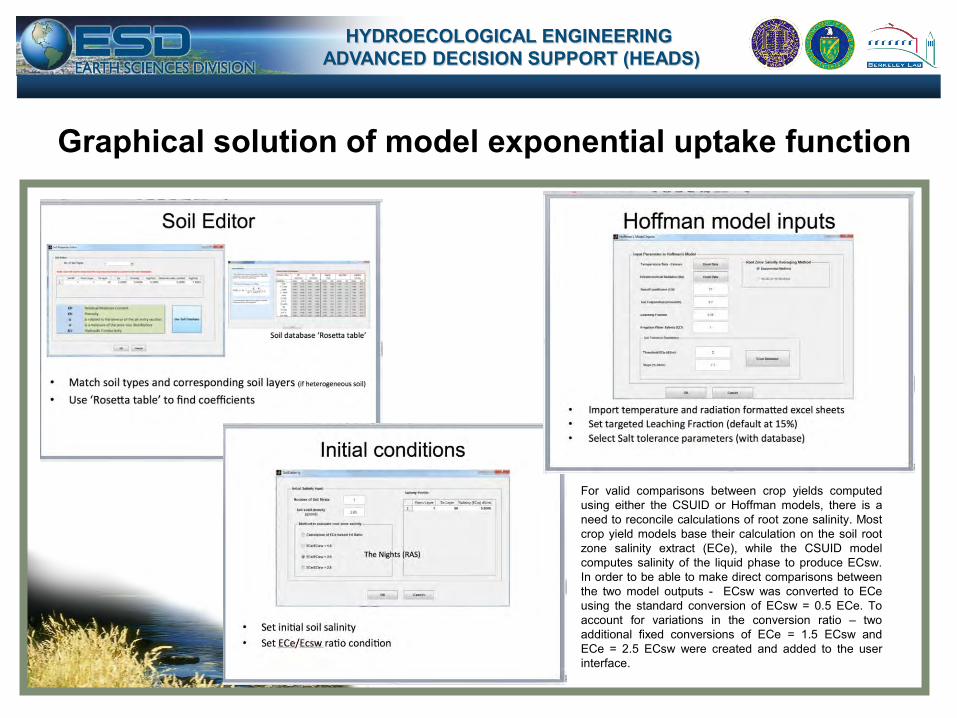
Graphical solution of model exponential uptake function
HYDROECOLOGICAL ENGINEERING ADVANCED DECISION SUPPORT (HEADS)
For valid comparisons between crop yields computedusing either the CSUID or Hoffman models, there is aneed to reconcile calculations of root zone salinity. Mostcrop yield models base their calculation on the soil rootzone salinity extract (ECe), while the CSUID modelcomputes salinity of the liquid phase to produce ECsw.In order to be able to make direct comparisons betweenthe two model outputs - ECsw was converted to ECeusing the standard conversion of ECsw = 0.5 ECe. Toaccount for variations in the conversion ratio – twoadditional fixed conversions of ECe = 1.5 ECsw andECe = 2.5 ECsw were created and added to the userinterface.
Graphical solution of model exponential uptake function
HYDROECOLOGICAL ENGINEERING ADVANCED DECISION SUPPORT (HEADS)
• CSUID model currently limited to 2 year simulation (730 days)
• Hoffman spreadsheet model requires trial and error solution –model develops response surface automatically
• Can select leaching fractions to input into the Hoffman model or use those calculated by CSUID.
• Can adjust ECe / EC(s)w ratio• Output graphics customized to
allow direct comparison of outputs from CSUID and Hoffman models
Output for Hoffman model from CSUID GUI interface
HYDROECOLOGICAL ENGINEERING ADVANCED DECISION SUPPORT (HEADS)
Effect of leaching rate and rainfall on yield response
HYDROECOLOGICAL ENGINEERING ADVANCED DECISION SUPPORT (HEADS)
CWQRCB. LSJR Salt Tolerance Report, 2016
Soil water salinity vs total annual rainfall by root zone uptake function
HYDROECOLOGICAL ENGINEERING ADVANCED DECISION SUPPORT (HEADS)
CWQRCB. LSJR Salt Tolerance Report, 2016
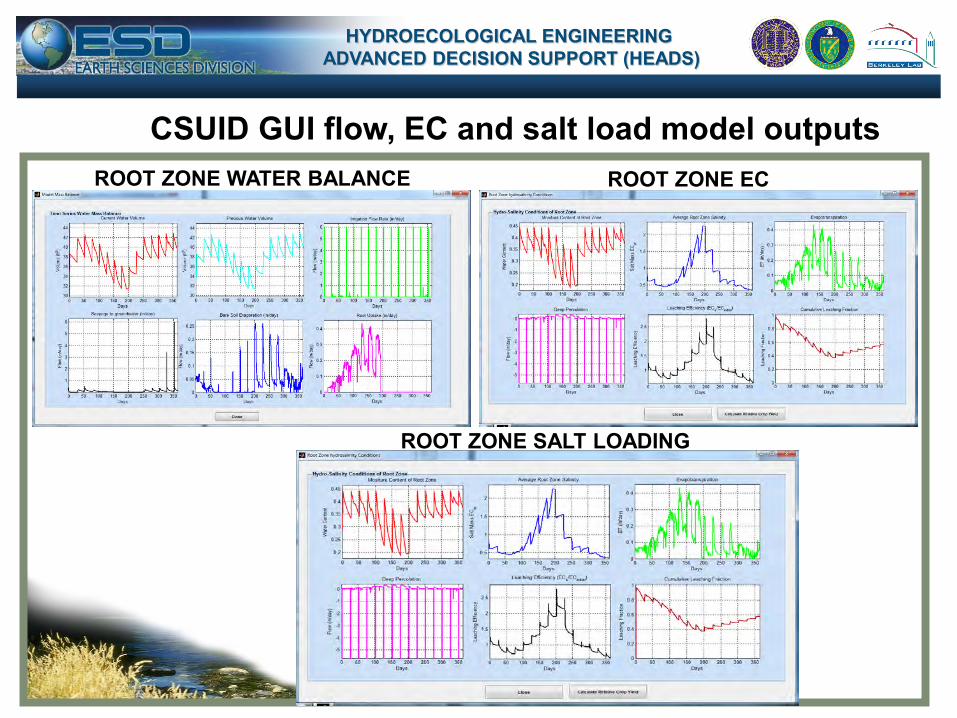
CSUID GUI flow, EC and salt load model outputs
HYDROECOLOGICAL ENGINEERING ADVANCED DECISION SUPPORT (HEADS)
ROOT ZONE WATER BALANCE ROOT ZONE EC
ROOT ZONE SALT LOADING
CSUID GUI flow, EC and salt load model outputs
HYDROECOLOGICAL ENGINEERING ADVANCED DECISION SUPPORT (HEADS)
CSUID GUI flow, EC and salt load model outputs
HYDROECOLOGICAL ENGINEERING ADVANCED DECISION SUPPORT (HEADS)
HYDROECOLOGICAL ENGINEERING ADVANCED DECISION SUPPORT (HEADS)
Summary and Conclusions
Real-time water quality (salinity) management will require better understanding of appropriate crop leaching rates for various irrigation application water salinities
Steady-state models have been used successfully for planning studies but have limitations as decision support systems at the watershed level
Existing transient salinity models have limited utility given their lack of documentation, graphical user interfaces and limited visualization
The CSUID-Hoffman model addresses these deficiencies –provides greater decision support capability.
Model currently being applied to investigate long-term yield declines in alfalfa and Jose tall wheat grass in Panoche Water District