Development a cartographic index of the vigour of forest stands from Ikonos imagery data F.N. Essono 1 , L. Coulibaly 2 , H.G. Adegbidi 3 , R. Fournier 4 1, 2, 3 Faculté de foresterie, Université de Moncton, Campus d'Edmundston 165, boulevard Hebert, Edmundston, N.-B., E3V 2S8 Canada Tél. 506-737-5246 Fax. 506-737-5373 e -mail : [email protected], [email protected], [email protected]4 Département de géomatique appliquée, Faculté des lettres et sciences humaines Université de Sherbrooke (Québec) J1K 2R1 Tél : 819-821-8000 poste 63209 Fax : 819-821-7944 e -mail : [email protected]Abstract : This study develops a cartographic index of forest stands vigour from Ikonos imagery data. The study area located at GOUNAMITZ (New-Brunswick, Canada) consists mainly of fir, tolerant and intolerant hardwoods at mature and overmature stages. Forest inventory plots were set up in the stands; dendrometric measures (height, DBH, annual increment, etc.) were collected and used to estimate reference values of stands vigour using Lebel’s equation. Reflectance values of the differents tree species inventoried were later extracted from the Ikonos image following the processes of fusion, segmentation and classification. Vegetation indices (NDVI, MSAVI, and TSAVI) were also extracted from the same image. The different data obtained from the image were then linked by multiple regression models to earlier estimated reference values ofstands vigour. Obtained results showed that the linear regression model yielded the best estimates of forest stands vigour. Determination coefficients (r ²) were 0.771, 0.783 and 0.776 respectively for fir, intolerant hardwoods and tolerant hardwoods species. Further, the regression model used was validated by comparing for 36 reference plots, the values of vigour computed from forest inventory data to values estimated by the model. The overall regression on the studied fir, tolerant and intolerant hardwood stands generated RMSE, of 0.17, 0.29 and 0.10, respectively. In a second step, the results of this study were generalized to map the vigour of forest stands throughout the whole area of the study. Keywords: vigour of forest stands; remote sensing, Ikonos Image. 1. Introduction The vigour of a forest is associated with its productivity. It is the production capacity of a forest stand, a given species on a given station, based on standard and constant forest conditions (Rondeux 1993). Traditionally, stand vigour is estimated from stem productivity data. However, the acquisition of such information is very costly in terms of money, time and energy for logging companies and other forest users. The latter aspire to have a speedier and automated method to reduce costs related to forest inventory and forest management over large areas. A potential means for automatic data extraction over large forest areas is remote sensing, especially with the advent of new sensors providing high spatial resolution images and increasingly powerful spatial analytical tools (Depontailler al. 2004). In this context of seeking a speedy and automatic method to estimate the forest’s vigour, this study aims to develop a cartographic vigour index of forest stands using remote sensing data. This study attempts to develop an approach that combines panchromatic and multispectral data from Ikonos-2 satellite with inventory data directlycollected from stands, in order to establish an equation that allows the prediction of stand vigour from remote sensing physical data. The project will test the potential of vegetation indices, reflectance and texture values of an image to generate accurate measures of
Transcript
Development a cartographic index of the vigour of forest stands from Ikonos imagery data
F.N. Essono 1, L. Coulibaly 2, H.G. Adegbidi 3, R. Fournier 4
1, 2, 3 Faculté de foresterie, Université de Moncton, Campus d'Edmundston 165, boulevard Hebert, Edmundston, N.-B., E3V 2S8 Canada
4 Département de géomatique appliquée, Faculté des lettres et sciences humaines
Université de Sherbrooke (Québec) J1K 2R1 Tél : 819-821-8000 poste 63209 Fax : 819-821-7944
e -mail : [email protected] Abstract : This study develops a cartographic index of forest stands vigour from Ikonos imagery data. The study area located at GOUNAMITZ (New-Brunswick, Canada) consists mainly of fir, tolerant and intolerant hardwoods at mature and overmature stages. Forest inventory plots were set up in the stands; dendrometric measures (height, DBH, annual increment, etc.) were collected and used to estimate reference values of stands vigour using Lebel’s equation. Reflectance values of the differents tree species inventoried were later extracted from the Ikonos image following the processes of fusion, segmentation and classification. Vegetation indices (NDVI, MSAVI, and TSAVI) were also extracted from the same image. The different data obtained from the image were then linked by multiple regression models to earlier estimated reference values ofstands vigour. Obtained results showed that the linear regression model yielded the best estimates of forest stands vigour. Determination coefficients (r ²) were 0.771, 0.783 and 0.776 respectively for fir, intolerant hardwoods and tolerant hardwoods species. Further, the regression model used was validated by comparing for 36 reference plots, the values of vigour computed from forest inventory data to values estimated by the model. The overall regression on the studied fir, tolerant and intolerant hardwood stands generated RMSE, of 0.17, 0.29 and 0.10, respectively. In a second step, the results of this study were generalized to map the vigour of forest stands throughout the whole area of the study.
Keywords: vigour of forest stands; remote sensing, Ikonos Image. 1. Introduction The vigour of a forest is associated with its productivity. It is the production capacity of a forest stand, a given species on a given station, based on standard and constant forest conditions (Rondeux 1993). Traditionally, stand vigour is estimated from stem productivity data. However, the acquisition of such information is very costly in terms of money, time and energy for logging companies and other forest users. The latter aspire to have a speedier and automated method to reduce costs related to forest inventory and forest management over large areas. A potential means for automatic data extraction over large forest areas is remote sensing, especially with the advent of new sensors providing high spatial resolution images and increasingly powerful spatial analytical tools (Depontailler al. 2004). In this context of seeking a speedy and automatic method to estimate the forest’s vigour, this study aims to develop a cartographic vigour index of forest stands using remote sensing data. This study attempts to develop an approach that combines panchromatic and multispectral data from Ikonos-2 satellite with inventory data directlycollected from stands, in order to establish an equation that allows the prediction of stand vigour from remote sensing physical data. The project will test the potential of vegetation indices, reflectance and texture values of an image to generate accurate measures of
stand vigour. If validated, such an approach will lead to a new method for estimating forest stand vigour at a larger scale, with high repeatability and extremely low costs. 2. Methodology 2.1. Area of study The selected area for this project is the Gounamitz’s site, located northeast of the province of New-Brunswick on the Restigouche river banks (Figure 1). Its geographical coordinates are 47 ° 60 '49 "W, -67 ° 40' 49" N and its size is 90 hectares. In the area, balsam fir (Abies balsamea) is the most common species and represents over 60% of forest cover. Tolerant hardwoods represent 23% of the cover with dominance of yellow birch (Betula papyrifera Marsh). There are also some intolerant hardwoods (17% forest coverage) dominated by the presence of red maple (Acer rubrum).
Figure 1. Area of study and its representation on the Ikonos image 2.2. Collection of field data. Three distinct groups of species were inventoried: balsam fir, tolerant hardwoods and intolerant hardwoods. Dendrometric measures of
forest inventory (height, DBH, annual increment) were collected in each of 32 rectangular plots (20m × 25m) of these stands and used to estimate the vigour of reference from the equation Lebel (1996), following the formula in equation 1.
AAMA
DHPIVA ×= (1)
Where IVA is the index of vigour of a tree, DBH is the diameter at breast height, A is the age (years), AAM is the average annual increment (m³ / ha / year). 2.3. Satellite images data and processing In addition to forest inventory data, two multispectral satellite images were used. The first one is an Ikonos image with very high spatial resolution (1 m in panchromatic and 4 m in multispectral). This image acquired in September 2007, is cloudless and corresponds to the period when deciduous trees still have leaves. The second image is a Landsat-7 ETM + and has an average spatial resolution (15 m in panchromatic and 30 m in multispectral). This other image was chosen to try to understand the effect of spatial resolution on estimating the vigour of forest stands. First, a fusion was performed by merging the panchromatic and multispectral bands of the Ikonos image, using a fusion algorithm "pan-sharpening" (Zhang, 2002) available in PCI Geomatics. This resulted in a multispectral image of one meter spatial resolution. With the Landsat-7 ETM + image, the fusion was done by the IHS method (intensity, hue and saturation) using the function of IMGFUSE (Chavez et al. 1991). The result yielded a image of 15-meter in resolution. Then the mid-infrared band of 30m spatial resolution was re-sampled at 15m, grouped with bands in the visible and near infrared of 15m resolution. The thermal band was not used. The correction of geometric distortions of the Ikonos image was done with the New Brunswick forest map at 1: 12500 as reference, using the polynomial approach of degree 1. A RMSE (Root Mean Square Error) of 0.17m was obtained after this correction. The Landsat-7 ETM + image, already georeferenced when acquired, was not corrected a second time. Atmospheric corrections for the two images were performed using the algorithm ATCOR2 (Atmospheric correction for flat terrain) of the Geomatica software v 10.1 (Lanzl & Richter, 1991). That correction uses the spectral bands of
the image, the atmospheric properties, the solar zenith angle, the image’s date of acquisition, the optical visibility. Once the two images corrected, the segmentation of multiresolution images was performed (Benz et al. 2004). The segments generated were then tested using the nearest neighbour’s classifications. After the classification, masks were prepared to preserve only the three classes of species (pine, tolerant and intolerant hardwoods) where vegetation indices and texture are extracted. Since the site is a heterogeneous region, there is quite a contrast between forest areas and other elements on the ground (bare soil, regeneration stands, and gaps). Thus, to take into account this effect, only the brightest pixels representing vegetation were extracted. Two approaches were compared: the approach using all the pixels of the image and the approach using only the brightest pixels. 2.4. Extraction of parameters from satellite images In this step, spectral indices NDVI (Normalized Difference Vegetation Index), MSAVI (Modified Soil Adjusted Vegetation Index), PVI (Perpendicular vegetation index), TSAVI (Transformed Soil Adjusted Vegetation Index) were calculated from the bands of Ikonos and Landsat-7 sensors. Also on the image Landsat-7 ETM +, with the presence of the mid-infrared band, another vegetation index, the NDWI (Normalized Difference Water Index), was calculated.. In a second step, two parameters of texture (homogeneity and contrast) were computed using the approach based on the cooccurrence matrix developed by Haralick et al. (1973). 3. Statistical Analysis The different spectral and textural data obtained from the image were then related to the reference values of vigour (computed from inventory data) by multiple regression methods. In these equations, the computed reference vigour was the dependent variable while spectral and textural indices were the independent variables. A stepwise regression method in SPSS v. 15.0 was used to determine the relevant and significant explanatory variables. 4. Cartographic validation
Regression equations with the highest coefficients of determination (r2) were selected and applied to the whole image. For this, the mask containing the pixels of each type of forest stand was set up in a matrix format. Values of the relevant spectral variables (vegetation, reflectance and texture indices) identified by the regression equation for each type of stand were then extracted. Then for each type of stand, the extracted values of the predictive variables were used in the pertaining regression equation and applied to its particular mask to generate a vigour image of that stand type. A final image of the whole study area was then produced by merging the different masks containing the values of vigour of each stand type. To assess the accuracy of the estimates of vigour derived from the regression equations, 36 validation plots were set up, in which inventory data were collected and reference vigour values were computed. In addition, spectral variables values were extracted from those same plots and used to predict their vigour values. Then reference values were compared to predicted values of vigour. 5. Results and discussions 5.1. Segmentation and classification The optimal parameters used for the identification of objects representative of forest stands are:
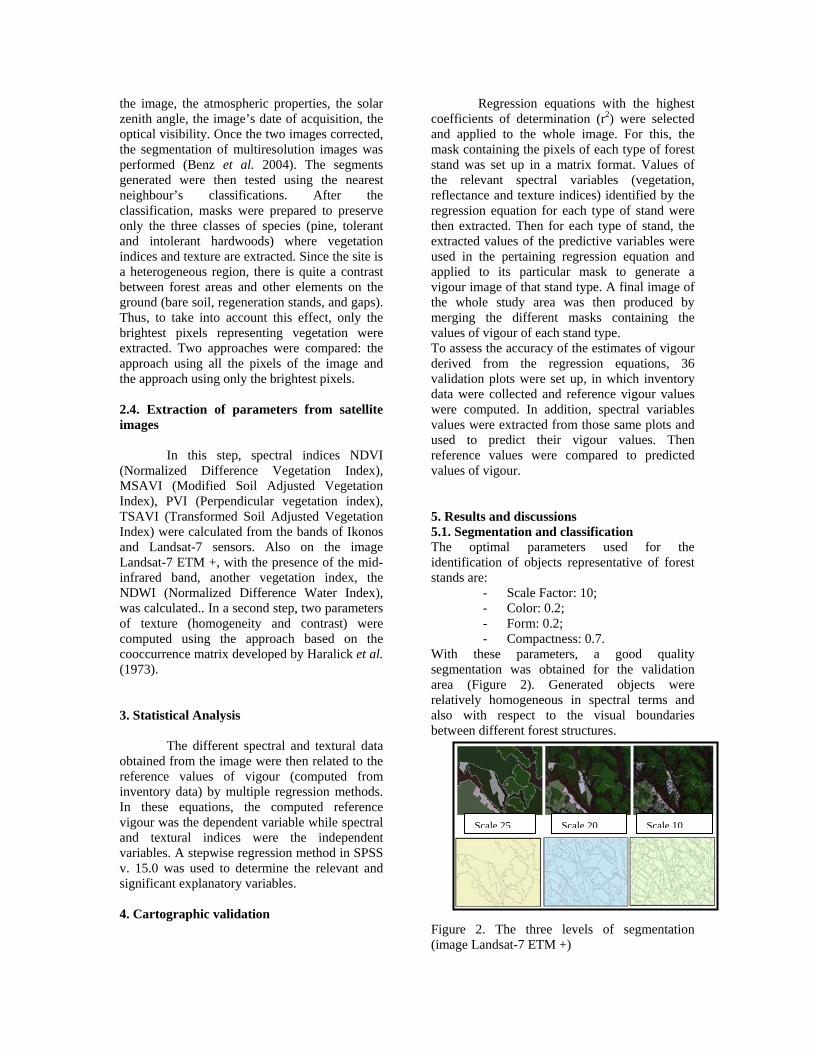
With these parameters, a good quality segmentation was obtained for the validation area (Figure 2). Generated objects were relatively homogeneous in spectral terms and also with respect to the visual boundaries between different forest structures. Figure 2. The three levels of segmentation (image Landsat-7 ETM +)
Scale 25 Scale 20 Scale 10
Figure 3. The three levels of segmentation (Ikonos image) On these figures (2 and 3), one can see that the number of segments decreases when the value of the scale increases. The classification loses its capacity in response to a segmentation of a large scale. Therefore, maps of land at segmentation 10 give more details for each of the two images. According to the results of the classification,with the segmentation level of scale 10, the total accuracy obtained was 91.03% for the Ikonos image and 86.74% for the image Landsat-7 ETM +. The Ikonos image provides a best result of classification Table 1. Results of the classification for both images
Percentages of accurately classified pixels
Classes
Image Ikonos
Image Landsat-7 ETM+
Tolerant hardwoods 85,74 73,21 Fir 89,18 86,49 Intolerant hardwoods 84,75 88,16 Bare soil 87,25 85,36 Regeneration stands 97,97 89,51
Mean accuracy : 91,74
Mean accuracy: 86,48
Total acccuracy : 91,03
Total accuracy : 86,74
kappa cœfficient: 0,88
kappa coefficient : 0,71
Figure 4. Maps of land use images Landsat-7 ETM + and Ikonos 5.2. Evaluating the performance of regression Table 2. Comparison of coefficients of determination of the two images
The evaluation results showed that spectral indices including, TSAVI and reflectance in the green can be used to accurately estimate forest stand vigour in the Gounamitz area. The logarithmic equation for fir classe established with those two spectral indices yielded the highest coefficient of determination (r2 = 0.78) and the lowest residual error of 0.15. In addition, for intolerant hardwoods, the TSAVI, PVI and reflectance in the blue also yielded satisfactory results (r2 = 0.783) with the linear equation. Comparing the values of the coefficients of determination of the two images (Table 2), it appears that the highest coefficients are obtained from the Ikonos image. This observation suggests that highest resolution images should be used. Thus, the Ikonos image was chosen for the continuation of the task of estimating and mapping of forest stands vigour. The different regression equations for those estimations are presented in Table 3. Obtained results showed that using only the brightest pixels of the image yielded good relationships between the spectral indices and the vigour of reference. This observation is illustrated by the values of coefficients of determination as high as 0.78, 0.77 and 0.78 for fir, tolerant hardwoods and intolerant hardwood, respectively. Residual errors are 0.17, 0.10 and 0.29 respectively for the same classes. Applying the different equations (Table 3), one sees a realistic allocation of the distribution of vigour for each of the tree classes. Indeed, the results of the final map obtained are consistent with the forest map. Figure 5. Map of the forest stands vigour
Table 4. Root mean square error and residual error for each of the equations used in relationship to forest species.
On the final map of the existing forest stands (Figure 5), shades of colors ranged from dark green for more vigourous stands to white for less vigourous stands, holes and bare soils. Therefore, the regressions between spectral indices and the vigour of reference led to qualitative results in terms of mapping the distribution of the vigour of existing forest stands. However, these regressions produce different results, depending on the proportion of image pixels used and the parameters used for the segmentation of the image. Overall, the results showed the great potential of the Ikonos image data for the estimation of the vigour of forest stands and its mapping. Another strong point of the study is the use of bright pixels: the extraction of bright pixels using thresholds positively impacted the established correlations between spectral variables and the vigour. Indeed, results are optimal for a threshold value of 55 and a segmentation value of 25. This led to the conclusion that only the brightest pixels are connected to the forest stands vigour. Conclusion The objective of this work was to develop a method for the estimation and mapping of the vigour of existing forest stands by remote sensing. The brightest pixels were extracted and this approach was assessed for 2 images of different resolutions to understand the effect of spatial resolution on derived estimates of this dendrometric parameter. Obtained results indicated that the extraction of bright pixels from an image of high spatial resolution is an important step in the determination of regressions equations linking spectral indices and vigour of forest stands. Indeed, the methods of extraction of bright pixels using the threshold generated coefficients of determination higher than those obtained from all pixels of the image. This has a significant influence on the results of the vigour estimation.
0.38 - 0.53
0
0.29 - 0.38
0.53 - 0.680.68 - 0.77
0.77 - 0.840.84- 0.91
1000 0 1000 2000 3000 m
Vigour
References Benz, U.C., Hofmann, P., Willhauck, G., Lingenfelder, L, Heynen, M. (2004). Multi-resolution,object-oriented fuzzyanalysis of remote sensing data for GIS-ready information. ISPRS Journal of Photogrammetry & Remote Sensing (58), 239-25 Chavez P.S., Sides S.C. et Anderson J.A. (1991). "Comparaison of Three Different Methods to Merge Multiresolution and Multispectral Data". Photogrammetric Engineering & Remote Sensing, Vol. LVII, N° 3, pp. 294-303. Dépontailler, L., Fonteyne, A., Kober, M., & Schaeffer, B. (2004). Cartographie de fragments forestiers à partir de scènes SPOT, application à la région d’Aurignac (Midi-Pyrénées). Ecological modelling (205), 423-436. F. Lanzl & R. Richter,(1991). A Fast Atmospheric Correction Algorithm. For Small Swath Angle Satellite Sensors. Ico topical meeting on atmospheric, volume and surface scattering and propagation, florence, italy (455-458). Lebel, R. (1996). The assessment of the tree vigour and the merchantable volume of wood in stands of mature and over mature spruce and balsam fir using remote sensing techniques. Projet 5.1 Applied R & D Canada /New Brunswick Cooperative Agreement on Forest Development. Rondeux, J. (1993). La mesure des arbres et des peuplements forestiers. Presses agronomiques de Gembloux, Belgique. Zhang, Y. (2002) A new automatic approach for effectively fusing Landsat-7 as well as Ikonos images, Proc. Of IGARSS/24th CRSS symposium, Toronto, 4 p.