59


© 2017 National Rural Support Programme Established in 1991, NRSP is the largest Rural Support Programme in the country in terms of outreach, staff and development activities. It is a not for profit organization registered under Section 42 of Companies Ordinance 1984. NRSP’s mandate is to alleviate poverty by harnessing people’s potential and undertaking development activities in Pakistan. It has a presence in 64 districts in four provinces and Azad Jammu and Kashmir through regional and field offices. NRSP is currently working with three million poor households organized into a network of more than 189,000 Community Organizations. With sustained incremental growth, it is emerging as Pakistan’s leading engine for poverty reduction and rural development. Parts of this report may be reproduced for professional purposes, provided that the source is acknowledged and the material is not sold. Prepared by: Zaiba Younas Supervised by: Muhammad Saad Iqbal

Impact Assessment Study: Livelihood Improvement through Agriculture and Livestock Innovations | i
Contents
Executive Summary ..............................................................................................................................................................1
Background .............................................................................................................................................................................5
Budget of the Project ............................................................................................................................................................6
Project Activities ....................................................................................................................................................................7
Objective of the study ......................................................................................................................................................7
Survey methodology ........................................................................................................................................................8
Beneficiaries profile and selection .................................................................................................................................8
Results and Findings .............................................................................................................................................................9
Training Sessions on Agriculture enhancement .........................................................................................................9
Land preparation and sowing .........................................................................................................................................9
Wheat Cropping .............................................................................................................................................................. 11
Land utilized for the cropping of wheat ................................................................................................................ 11
Varieties and sources of seeds used for wheat crop ......................................................................................... 11
Quantity of Seed applied in an acre ....................................................................................................................... 12
Seeds poisoned before sowing .............................................................................................................................. 12
Fertilizer application ................................................................................................................................................. 12
Pesticide spray usage .............................................................................................................................................. 13
Irrigation details ......................................................................................................................................................... 13
Cost of production (Before and After Training) ................................................................................................... 14
Wheat crop production/yield (Before and After Training) .................................................................................... 15
Income generated from production (Before and After Training) ........................................................................ 16
Rice Cropping ................................................................................................................................................................. 18
Land utilized for the cropping of Rice ................................................................................................................... 18
Varieties of Seeds used for Rice Crop ................................................................................................................... 18
Purpose of Sowing Rice ........................................................................................................................................... 19
Methods of growing Rice ......................................................................................................................................... 19
Mildew prevention for Rice nursery ....................................................................................................................... 20
Cultivating seedling/buds ........................................................................................................................................ 20
Land Preparation of Rice Seedlings ...................................................................................................................... 21
Preparation of Nursery ............................................................................................................................................. 21
Urea in Nursery .......................................................................................................................................................... 22
Shifting of Seedlings into the Main Field .............................................................................................................. 22

ii | Impact Assessment Study: Livelihood Improvement through Agriculture and Livestock Innovations
Irrigation after the transfer of seedlings ............................................................................................................... 24
Land preparation of the main Field ........................................................................................................................ 26
Weed Removal ........................................................................................................................................................... 26
Crop disease and prevention .................................................................................................................................. 26
Production and Income generation ....................................................................................................................... 27
Seed variety wise production .................................................................................................................................. 28
Cost Analysis (Before and after training) ............................................................................................................. 29
Income Analysis (Before and after training) ........................................................................................................ 30
Utilization of Production .......................................................................................................................................... 30
Training Impact ......................................................................................................................................................... 30
Livestock .......................................................................................................................................................................... 31
Training Sessions on livestock: .............................................................................................................................. 31
Livestock Vaccination and De-worming: .............................................................................................................. 31
Artificial Insemination: .............................................................................................................................................. 33
Case Studies ........................................................................................................................................................................ 35
Ehsan Qadir ..................................................................................................................................................................... 35
Imran Shehzad ............................................................................................................................................................... 36
Muhammad Nawaz ....................................................................................................................................................... 37
SWOT Analysis .................................................................................................................................................................... 38
Strengths ......................................................................................................................................................................... 38
Weakness ........................................................................................................................................................................ 38
Opportunities .................................................................................................................................................................. 38
Threats ............................................................................................................................................................................. 39
Recommendations ............................................................................................................................................................. 40
Conclusion............................................................................................................................................................................ 41
Annexures............................................................................................................................................................................. 42
Annex 1: Questionnaire ................................................................................................................................................. 42

Impact Assessment Study: Livelihood Improvement through Agriculture and Livestock Innovations | iii
Abbreviations
AI Artificial insemination
CMST Community Management Skill Training
CO Community Organization
CRP’s Community Resource person’s
DAP Diammonium Phosphate
DVM Doctor of Veterinary Medicine
ENRM Environment and Natural Resource Management
GDP Gross Domestic Product
HH’s Household’s
IEC Information, Education and Communication
LSO Local Support Organization
NRSP National Rural Support Program
RV Revenue Village
SM Social Mobilization
SWOT Strengths, Weakness’s, Opportunities and Threats
UC Union Council
VO Village Organization

iv | Impact Assessment Study: Livelihood Improvement through Agriculture and Livestock Innovations

Impact Assessment Study: Livelihood Improvement through Agriculture and Livestock Innovations | 1
Executive Summary
In September 2015, ENRM section of NRSP initiated a research and developmental project titled “Livelihood Improvement through Agriculture and Livestock Innovations”, focused on farmers ‘community by organizing
and provision of linkages to the quality agriculture and livestock services through awareness which significantly contributes to Social and Economic Rural Development”
This was initiated in District Sargodha with an objective to help/aware all farmers about improving Agriculture and Livestock practices and modify local farming system to subsistence commercial farming, also to reduce
the demand supply gaps through linkage development and to ensure the increase productivity enhancement
of Crop and livestock.
Total number of beneficiaries was 210 (23%) out of 971 and 100% of them were surveyed. Out of the total
beneficiaries, 61% of the respondents were literate while 39% were illiterate. They were selected by using random sampling method to conduct this assessment and the sample size included both members and non-
members of the community organization (CO). The project mainly focused farming community; through linkage development with line department, to trim down the demand and supply gaps of agriculture and
livestock services through spiraling extension-farmer-research linkage with government extension departments, research and training institutes, Agriculture department, seed companies, private companies
and local markets. Moreover, prompting them to adopt the recommended practices to increase the productivity enhancement of crops (i.e. Wheat up to 30%, Rice up to 30-40%) and livestock (milk and meat 40-
50%) and also 30% water saving by applying new technology and quality inputs were also the objectives of the project.
As a matter of fact, the social, economic and rural development drastically contributed through mindfulness
and demonstration. Hence, NRSP conducted an assessment study in December, 2016, to weigh the impact of the project on input cost, production and income of the farmers. This assessment is an effort to document
the progress and immediate results of this initiative and provide recommendations to further increase the benefits to the farmers through this initiative.
Mindfulness raising sessions were led for the farmers (master trainers, who were being chosen from each
village and were supposed to further aware all the remaining farmers of their related villages through
awareness sessions) to aware them about prescribed practices and share intercession for efficiency upgrade
and the fundamental information about soil testing, land preparation, balanced fertilizer application, seed selection/germination test of seed before sowing, seed multiplication, seed storage, cultivation methods, crop
yield, seed storage, irrigation system, quality Agro inputs selection (seed, fertilizer, weedicides etc.), integrated pest management, organic farming, analysis, value addition and marketing, application of advance and best
practices, irrigation time, innovation for profitability improvement and exposure field visits to farms and research institutes, have been secured in the sessions. These sessions were directed by the specialized staff
of NRSP and the Government officers.
Total land holding size of the respondents was 2077 acres (smallest is 0.5 acres and largest is 97 acres). 1073 acres of the land was being used to cultivate wheat and 179 acres of the land was utilized for the cultivation
of rice. Bhari-mera/mera (Clay and Sandy Loam) type land was largely used by majority 174 (86%) of the beneficiaries, while 27 (13%) Sandy (Retli) and 1 (1%) Kalrathi land was used by the beneficiaries for the

2 | Impact Assessment Study: Livelihood Improvement through Agriculture and Livestock Innovations
cultivation of the wheat and Rice seed in the district. 82% respondents cultivated Wheat and 41% respondents
cultivated Rice on Mera/Bhari Mera land followed by 17% who cultivated wheat and 6% Rice on Sandy land. 130 (65%) of the total beneficiaries have examined their agriculture land utilized for wheat and rice sowing
through a Laboratory Test (before sowing) as recommended by NRSP whose cost was put up with the NRSP, while 70 (35%) beneficiaries didn’t examine their land. Likewise, 20% (39) beneficiaries have examined water
(utilized for irrigation) before wheat and rice cultivate on their agriculture land while 80% (155) didn’t do that.
As far as the cropping pattern of wheat was concerned, different farmers followed different pattern of
cropping, 48% followed maize-wheat, while the remaining 52% followed other cropping patterns as rice-wheat, fodder-wheat, sugarcane-wheat, sesame-wheat so on and so forth.
The beneficiaries used different recommended varieties of wheat seeds on their land like Faisalabad-2008
Punjab-2011, Galaxy-2013, Ujala, Lasani-2008, Aari while some of the beneficiaries used various other than the recommended varieties including Aas-11, Inqalaab and Uqab and also seeds from the last year that they
had saved. Different sources of seeds were used, like majority farmers (71%) used the seeds which were available at home while 28% bought the seeds from the local market at an average of 46 rupees. Majority
(89%) of the beneficiaries applied the wheat seeds as per the recommendations of NRSP, which was 50-60 Kgs per acre, remaining 11% sowed the seed below the recommended quantity.
Furthermore, the study also revealed an average percentage of the farmers who had and had not poisoned
the seeds before sowing which was 89% and 11% respectively. Similarly, 93% of the beneficiaries had sprayed the pesticide spray while 7% hadn’t. Whereas, all the beneficiaries had used fertilizers in their field as per their
own choices which included, nitrogen, phosphorus, potassium, urea and DAP.
Before the trainings, 22% beneficiaries reported the input cost of wheat per acre to be within the range of Rs.1000-10,000, 67% of them reported the input cost to be Rs.11000-20000 per acre while the remaining 11%
beneficiaries reported it to be Rs.21000 and above. After the trainings, 22% of the beneficiaries reported the input cost per acre to be within the range of Rs.1000-10,000, 69% reported it to be Rs. 11,001-20,000 and the
remaining 9% stated it to be Rs. 21,000 and above. Likewise, before trainings 18% of the beneficiaries who cultivated Rice, reported the input cost of Rice per acre to be Rs.1000-15,000, 74% stated the input cost of
Rice per acre to be Rs. 15,000-30,000 while 8% of the beneficiaries reported the input cost to be above 30,000 rupees and after training, the input cost was reported to be almost the same.
Farmers though did cultivate rice in the projected union council on purpose. Some did to seek capital while others for seed multiplication. However, in traditional system, it is very important to raise rice nursery and
transplant it at an appropriate time to get optimum yield. It was recommended to raise rice nursery before the
end of May, for nursery seedlings raised before or after this period are more prone to bacterial blight, Bakanae disease and increased pest attack and increased yield could be gained only by transplanting healthy, vigorous,
weed and pest free seedlings. So to gain the optimal result, majority (99%) of the beneficiaries followed the recommendation. Very much like the aforementioned wheat cultivation, different cropping patterns were
being followed for cultivating rice, majority of the beneficiaries (81%) followed Wheat-Rice pattern, while the remaining 19% followed other cropping patterns as Wheat-Cotton, Wheat-maize, Wheat-vegetable and Wheat-
fodder.
Different type of rice seeds was being used by the beneficiaries which include PS2 (Kainat), PAK 386 (86, Kernal
Basmati) and Super Basmati and different sources of seeds were used, like majority farmers (37%) bought the

Impact Assessment Study: Livelihood Improvement through Agriculture and Livestock Innovations | 3
seeds from the local market, 32% bought the seeds from Punjab Seeds Corporation and the remaining 31%
used the seeds which were available at home. 89% of the beneficiaries applied 5-10 Kg rice seeds per acre in a nursery plot, 9% applied below the recommended quantity while the remaining 3% sowed the seed above
the recommended quantity. Furthermore, the study also revealed of the farmers who had and had not poisoned the seeds before sowing which was 45% and 55% respectively. Similarly, 76% of the beneficiaries
had sprayed the pesticide spray while 24% hadn’t. Whereas, all the beneficiaries had used fertilizers in their field as per their own choices which included, nitrogen, phosphorus, potassium, urea and DAP. Likewise, the
farmers were also trained about the land Preparation, cultivation of seedling buds, preparation of nursery and the field, crop diseases and their prevention, irrigation etc. and majority of the farmers had followed the
recommendations.
Before the trainings, 22% beneficiaries reported the input cost of wheat per acre to be within the range of
Rs.1000-10,000, 67% of them reported the input cost to be Rs.11000-20000 per acre while the remaining 11% beneficiaries reported it to be Rs.21000 and above. After the trainings, 22% of the beneficiaries reported the
input cost per acre to be within the range of Rs.1000-10,000, 69% reported it to be Rs. 11,001-20,000 and the remaining 9% stated it to be Rs. 21,000 and above. Likewise, before trainings 18% of the beneficiaries who
cultivated Rice, reported the input cost of Rice per acre to be Rs.1000-15,000, 74% stated the input cost of
Rice per acre to be Rs. 15,000-30,000 while 8% of the beneficiaries reported the input cost to be above 30,000 rupees and after training, the input cost was reported to be almost the same.
The impact of the information provided to the farmers regarding both the crop enhancement and livelihood management is going to be clearly visible as compared with contrasted Union Councils of the Region. As it is
already observed from the analysis that there is a big difference in the production per acre yield of the beneficiaries before and after training. Previously, cost of the production of the majority farmers was less as
compared to the cost of production after training and this fluctuation was recorded for following the recommended application for the productivity enhancement as the farmers were not applying all the
necessary applicants in their field before that’s why they were not getting the optimum results but after following the recommendations, a notable increase has been observed in the production of both the crops
(Wheat and Rice). Overall the farmers who were cultivating Wheat had good yield with an average yield of 41-50 maunds per acre. Prior to the training, no one was receiving above 60 maunds per acre yield but after the
training, 1% farmers reached to the range of the production yield which was an achievement of the project, as this was the goal of the project to train the farmers to produce more yield. Likewise, before training, the
majority farmers (43%) were getting production per acre of land between the range of 31 to 40 maunds, while
after the training there is an immense increase in the production range of 41-50 maunds per acre yield as the majority (44%) shifted to the range.
Similarly, a big difference before and after training in the production per acre yield of Rice is observed from the analysis as overall farmers had good yield with an average yield of 41-50 maunds per acre. In the previous
year there were just 7 (30%) farmers who had production of more than 40 maunds per acre and after the training, the number has increased to 48% that clearly mirrors the objective of the project.
It is marked from the analysis that the crop enhancement training has a positive impact on the overall
production of the crop which enhanced their wage enormously and in light of the expanded wage, their way of life has been improved, which was also one of the sub-objective of the venture. Moreover, it can be
concluded that with the trainings, the overall production and income trend prevailing in the area increased which improved the living style of the beneficiaries.

4 | Impact Assessment Study: Livelihood Improvement through Agriculture and Livestock Innovations
Likewise, the awareness sessions of agriculture, the same sessions were also carried out for the livestock, to
aware the farmers regarding best practice about animal productivity enhancement. Technical staff from government department were invited in the sessions to aware the farmers about the basic knowledge about
animal breeds for meat and milk, importance of vaccination, de-worming and Artificial insemination, seasonal vaccination schedule, livestock management, feed and fodder, animal diseases preventive measure, milk and
meat marketing, poultry management and basic management practices for productivity enhancement. Vaccination cards were also provided to the beneficiaries to avoid the over dosage and death of animal.
NRSP has also linked the farmers with government livestock extension departments, Govt. /Private veterinary hospitals, AL service providers, private companies, Govt. training institutes, link for animal feed/silage and also
fodder seeds.

Impact Assessment Study: Livelihood Improvement through Agriculture and Livestock Innovations | 5
Background
Agriculture constitutes the largest sector of our economy.
Majority of the population is directly or indirectly dependent on this sector. It contributes about 24 percent of Gross
Domestic Product (GDP) and accounts for half of employed labor force and is the largest source of foreign exchange
earnings. It feeds whole rural and urban population. Realizing its importance, planners and policy makers are
always keen to have reliable area and production statistics
of agricultural crops well in time.
Sargodha District of Punjab is an agricultural district with
wheat, rice, and sugarcane being its main crops. It is also famous for citrus fruit; kino is a newly developed variety.
In the year 2015, National Rural Support Program (NRSP) propelled an experimental venture in perspective of need of community (farmers, peasants, contractors, farm labors/workers) for Agriculture and Livestock
productivity enhancement all the way through providing the trainings and workshops.
NRSP had taken initiative under the name “Agriculture and Livestock Productivity enhancement” to provide technical support to the farmers of Union Council of district Sargodha by providing trainings about the crop
and Livestock management on information related to Irrigation methods, fertilizer usage, pesticides usage and awareness about the new agro practices. The sessions included information about handling and care of
the animals at time of emergency and also arranged medical services. Pamphlets and broachers were also developed and distributed among the farmers. The inventiveness was piloted in the chosen UC (Lalluwali) for
over a period of twelve months.
UC Laluwali (RV’s: Laluwali, Chak No.26/SB, Chak No.27/SB and Ghurki) of Sargodha District was Selected/identified as the area of venture which is sited at 35 km from Sargodha city, having an area of 5864
km with a sum of 2040 households and with the population index of 14,475 individuals of which 917 HHs were engaged in farming and 1082 were non farmers. The preferred crop of the farmers was identified to be wheat,
fodder, sugarcane and rice respectively. These 917 farmers were provided with various livestock and
agricultural trainings related to productivity enhancement for wheat, rice and livestock.
The farmer generally preferred to use their own wheat seed for cultivation and super basmati rice variety for
cultivating rice. Majority of the farmers followed Rice-wheat and Maize-wheat crop rotation pattern. The farmers used to sow wheat seed ranging from 30 to 60kgs per acre and for rice, 1 to 10kgs per acer.
At the end of the project, NRSP management decided to conduct survey at the household level for the
beneficiaries of Agriculture and livestock services in the aforementioned Union Council Lalluwali to analyze the impact of the beneficiaries following recommended practices in the area. The program was mainly
focused to assess the changes adopted by the beneficiaries in Agriculture farming and livestock management.

6 | Impact Assessment Study: Livelihood Improvement through Agriculture and Livestock Innovations
Budget of the Project
The project began with an aim to fill all the gaps within the agricultural sector. The venture projected to equip
the farmers with modern farming techniques. However, at the time of the initiation of the project, one-year budget was prepared which was geared up with a plan of action.
Detailed targets, Budget, actual expenses and progress as of November 2016 are given in the following table.
Table 1: Progress as of November 2016
The initial project duration was one year in which 917 farmers were to be trained in four villages i.e. Laluwali,
Ghurki, 26SB and 27SB of UC Laluwali but later on, No-Cost extension for 3 months was awarded to the project to meet the targets.
Year Sept2015-Aug 2016
Plan
Number of farmers 917 farmers (land holding of farmers :
390 farmers having 1-5 acres, 202 farmers 6-10 acres,
230 farmers above 11 acres) Villages 4 Union Councils 1
Budg
et
Budgeted Costs for project period
CRPs honorarium 336,000 SM cost 287,000 Extension Services & demonstration of field activities 1,508,650 Workshops/ trainings/ exposure visits / meetings 905,000 Monitoring 240,000
Expe
nses
Actual Expenses (Rs.)*
CRPs honorarium 329,000
Capital SM cost 319,957 Extension Services & demonstration of field activities 1,124,893 Workshops/ trainings/ exposure visits / meetings 449,572 Monitoring 375,256
Prog
ress
Progress No. of Beneficiaries 917 Farmers Areas (acres) 3519.375

Impact Assessment Study: Livelihood Improvement through Agriculture and Livestock Innovations | 7
Project Activities
Table 2: Project Activities
Activities No of Events
Days Number of
participants Total F M
Capacity building of COs (CMST) 8 3 days per events
158 0 158
Capacity building of VO/LSO (Residential) 5 2 days per events
94 0 94
Female livestock farmers workshop by DVM (20 farmers in each workshop)
48 1 day per events
960 0 960
Awareness sessions for the farmers about recommended agri practices by Deptt.
31 1 day per events
0 917 917
Awareness sessions for the farmers about recommended livestock practices
31 1 day per events
930 0 930
Master trainer sessions 92 1 day per events
0 917 917
Capacity building is the conceptual approach to social and personal development which helps determining and realizing development goals. In this regard eight such events had been taken place in the projected year
for the COs, every single event lasted three days in which 158 female members took part. Likewise, had been the case with VO/LSO, where five events were conducted and 94 female members took part into it.
Similarly, female livestock farmer workshops were arranged by DVM, in which a total of 48 events were
conducted with a fair distribution of one day for each event. Total 960 people took part including both beneficiaries (917) and non-beneficiaries (43), as those events were open to all (every one of the area was
allowed to participate in the training/workshops).
Likewise, the awareness sessions about the recommended agro practices were being conducted by the Department. Sessions encompassed a total of 31 events with again one day for each event and in this way a
total of 917 beneficiaries participated in all such events.
In addition to it, awareness sessions for farmers about livestock practices were being conducted, 31 events
were being covered in these sessions and 930 beneficiaries participated in them, out of them 917 were the
beneficiaries whilst 13 farmers were from the community, as those sessions were also open to all.
Lastly 92 master training sessions were organized with one day for each event and all the beneficiaries took
part in these sessions.
Objective of the study
This study attempted to assess the impact of the application of the new Agriculture and Livestock
practices/technologies on input, production and income of the farmers of UC Lalluwali

8 | Impact Assessment Study: Livelihood Improvement through Agriculture and Livestock Innovations
Survey methodology
The questionnaire for the survey was designed at NRSP Head Office in consultation with the relevant departments ENRM and district staff after a careful review of the related project documents (Questionnaire
format is given in Annexure).
A team of four members executed the survey in the field during 16th to 22nd of November 2016, in district Sargodha, UC Lalluwali. Whereas, the regional team supported the completion of survey. The total number of
210 beneficiaries was covered in the survey which was total of the sample size and was selected through random sampling from each of the four villages.
Village Name Total beneficiaries Sample Beneficiaries
Lalluwali 624 143
Ghurki 142 32
26 SB 87 20
27 SB 64 15
Total 917 210
Beneficiaries profile and selection
Larger part of the respondents were
farmers (97%) while just 7 (3%) out of the aggregate 210 were non-farmers. 39% of
the beneficiaries were illiterate and 61%
were literate, their education level varied i.e. out of the 61%, 10% of them were
primary pass, 18% were middle pass, 24% of them were matriculate while 7%
were intermediate while 2% were graduated and the remaining 1% were
master’s degree holders.
Community Organizations (COs) platform was used to identify the farmers for this project. The individuals
from COs were given trainings/workshops, in which they were educated about the practices for farming furthermore about the mediation insight and about the efficiency upgrade. They were likewise staying alert
about the advantages of the instructional meetings identified with cost and production.
10%
18%
24%
7%
2% 1%
39%
Primary Middle Matric Intermediate Graduation Masters NIL
Education Profile

Impact Assessment Study: Livelihood Improvement through Agriculture and Livestock Innovations | 9
Results and Findings
Training Sessions on Agriculture enhancement
Training/awareness sessions for farmers were being organized by NRSP to educate farmers about the recommended practices and also shared the intervention detail about productivity enhancement techniques.
Farmers sessions covered the basic knowledge about the Land preparation, soil and water tests, seed selection and germination test of seed before sowing, procurement of seed, cropping pattern, quality Agro
inputs selection (fertilizer, weedicides etc.), balance fertilizer application, irrigation time, crop yield, seed multiplication, seed storage and also arranged the exposure visits of farmers to farm and research institutes.
However, 58% of the total beneficiaries reported that they have been attending the trainings/workshops in
which they were being guided about the cropping techniques, production enhancement and yield, while 42% didn’t attend the trainings/workshops. 97% (203) of farmers and 3% (7) of non-farmer participants have
participated and were also provided with the printed material in local language.
Land preparation and sowing
65 percent of the respondents had their
soil tests. Further inquiries reviled that the tests were free of cost and all the
expenses were borne by NRSP. Moreover, all of the respondents who had
their soil test reported that they had implied the prescribed methods of taking
samples from the soil i.e. taken from the soil’s depth of 6 and 12 inches. 82% of the
farmers get their soil test reports while 18% did not get the report, out of 82%
who get their reports, approximately 42% came up with the positive results “All Clear” whereas the remaining 58% had Nitrogen, Phosphorus and Potassium lacking in their lands. Among the farmers who had their soil
test, 24% respondents did not take any remedial measures to fight these deficiencies and the remaining 76%
responded the threat by adding various fertilizers, out of which Potassium, Phosphorus, Nitrogen, and Urea
was applied by 3%, 1%, 70% and 1% farmers respectively in their lands. However, 96 % of the respondents
believed their results to be realistic/true and reported the improvement in their crop yield.
Majority of the farmers (86%) had Bhari Mera/Mera type of land followed by 13% farmers who had sandy land
while the remaining 1% have Kalrathi land. 82% respondents cultivated Wheat and 41% respondents cultivated Rice on Mera/Bhari Mera land followed by 17% who cultivated wheat and 6% Rice on Sandy land. Total land
was 2077 Acres. Majority of the farmers (84%) owned land ranging 1-15 Acres. 10% had owned land ranging from 16 to 30 Acres, 2% farmers owned 31-45 Acres whereas 4% had above 45 Acres of Land. 182 farmers
had a cumulative rented land of 635.5 Acres which was in addition to their own landholding, out of which 86%
35%
65%
No Yes
% of farmers who carried out Soil Test

10 | Impact Assessment Study: Livelihood Improvement through Agriculture and Livestock Innovations
farmers had rented land ranging from 0-5 acres, 8% had 6-10
Acres rented land while the remaining 5% had rented land of 11 acres and above.
Out of 2077 Acres, 1073 Acres of land was used to cultivate Wheat whereas 179 Acres of land was used to cultivate Rice.
33% farmers used up to 5 Acres of their own land to cultivate Wheat, 11-25 Acres of land was used by 30% of the farmers
whereas, the remaining 7% used above 25 acres of their land for the cultivation of wheat. Likewise, out of the total rented land,
64% of farmer used up to 5 Acres of the rented land to cultivate
wheat, 6-10 Acres of land was used by 8% of the farmers while
3% had used 11-25 Acres of their land and the remaining 3% farmers used above 25 Acres of the rented land to cultivate Rice.
Only 20% respondent had their water tested while the remaining 80% have not had their water tested. The
results showed that 97% respondents had been using suitable water for irrigation whereas 3% respondents did not have water suitable for irrigation.
86%
1%
13%
Land type
Bhari Mera/Mera Kalrathi Sandy
Impact Assessment Study: Livelihood Improvement through Agriculture and Livestock Innovations | 11
Wheat Cropping
Land utilized for the cropping of wheat
Total land owned by the respondents summed up to 2077 acres. The farmers had cultivated wheat on either
all of their lands or to some of the parts. As shown in the table 53% of small farmers having landholdings upto 5 acres had used 0.5-5 acres of their lands to cultivate wheat crops, 6% had used 6 to 10 acres of their land.
14% of the farmers having 6-10 Acres of landholding had used 0-5 acres for the cultivation of wheat crops, 9% had used 6-10 acres while 2% had used 11-20 acres and only 1% of the farmers having landholding between
6-10 acres had used 25-50 acres of their land for wheat cultivation. Likewise, 2% of the farmers having landholding of 11-25 acres utilized up to 5 acres of their land for wheat cultivation, 6% cultivated wheat on 6-
10 acres of land while the other 6% of the farmers cultivated wheat on 11-20 acres of land and 1% cultivated wheat crops on 25-50 acres. 1% farmers having landholding of 26 to 50 acres cultivated wheat on 11 to 20
acres of land. Farmers who had landholdings ranging of 25-50 acres, cultivated wheat on either 11 to 20 acres or 25 to 50 acres compounding up to 2%.
As far as the cropping pattern of wheat was concerned, different farmers followed different pattern of
cropping, 48% followed maize-wheat, while the remaining 52% followed other cropping patterns as rice-wheat, fodder-wheat, sugarcane-wheat, sesame-wheat so on and so forth.
Varieties and sources of seeds used for wheat crop
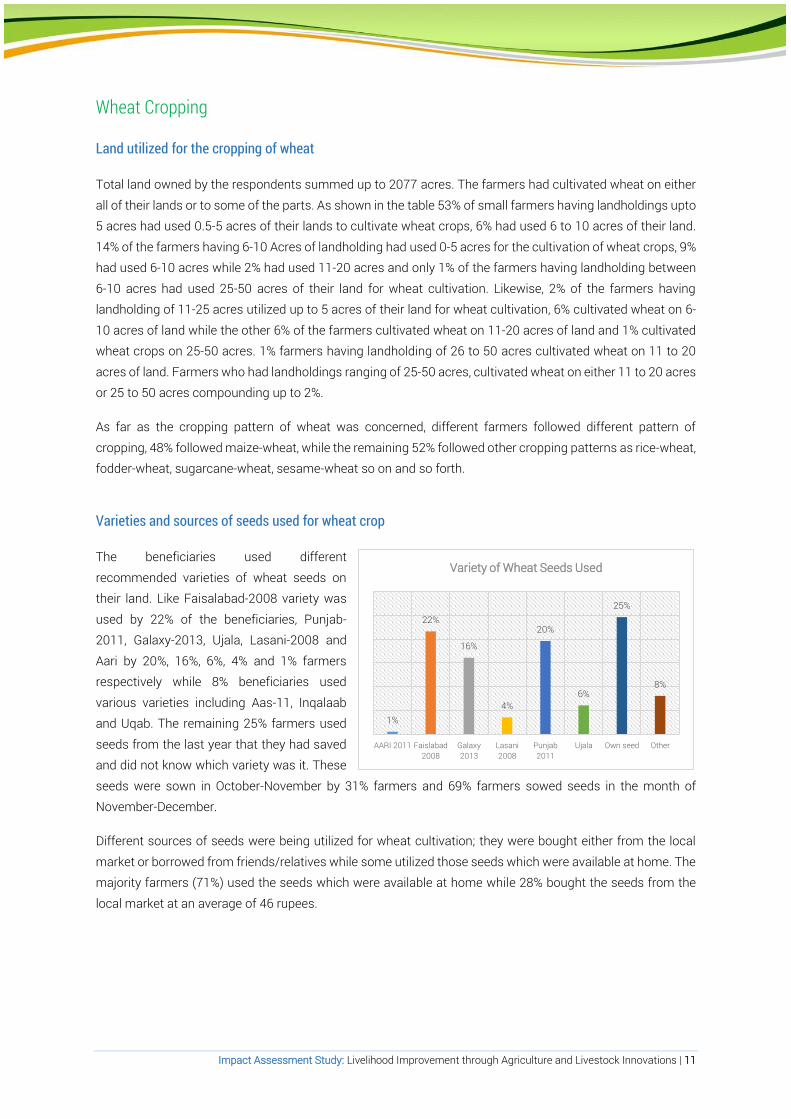
The beneficiaries used different
recommended varieties of wheat seeds on their land. Like Faisalabad-2008 variety was
used by 22% of the beneficiaries, Punjab-2011, Galaxy-2013, Ujala, Lasani-2008 and
Aari by 20%, 16%, 6%, 4% and 1% farmers respectively while 8% beneficiaries used
various varieties including Aas-11, Inqalaab and Uqab. The remaining 25% farmers used
seeds from the last year that they had saved
and did not know which variety was it. These
seeds were sown in October-November by 31% farmers and 69% farmers sowed seeds in the month of November-December.
Different sources of seeds were being utilized for wheat cultivation; they were bought either from the local
market or borrowed from friends/relatives while some utilized those seeds which were available at home. The majority farmers (71%) used the seeds which were available at home while 28% bought the seeds from the
local market at an average of 46 rupees.
1%
22%
16%
4%
20%
6%
25%
8%
AARI 2011 Faislabad2008
Galaxy2013
Lasani2008
Punjab2011
Ujala Own seed Other
Variety of Wheat Seeds Used

12 | Impact Assessment Study: Livelihood Improvement through Agriculture and Livestock Innovations
Quantity of Seed applied in an acre
Majority of the farmers (89%) followed the recommended
application of per acre seed for maximum yield which was 50-60 kg/acre seeds while mere 11% farmers sowed below 50 kg-
60/acre seeds. The reason of sowing below 50-60 kg/acre was that their land was very much fertile and was able to produce
more even with fewer amounts of seeds than the
recommended. The other reason was that some of the farmers were not economically strong and could not afford much
expenditure.
Seeds poisoned before sowing
Besides, farmers were additionally prescribed to poison the seeds before
sowing to protect them from different maladies. 89% farmers did not use
poison, whereas, 11% of the farmers poisoned their seeds before sowing and
all of them recall the name of the poison they utilized or the amount they utilized
per Kg. 73% of the farmers reported that they followed the process told by NRSP
for mixing poison while another 27% reported that they had followed/practiced their own process.
Fertilizer application
Different fertilizers with its quantity was being recommended to the farmers to use
in their land during the cropping of wheat i.e. the farmers were recommended to
use 52kg Nitrogen, 46kg Phosphorus and 25kg Potassium in non-fertile land for the
purpose of nourishment, whereas, half bag of Urea, 2 bags of DAP and 2 bags of
Potassium Sulphate were recommended to use during cultivation and half bags of
Urea at the time of first irrigation and a mere half bag at second irrigation. 42 kg Nitrogen, 34 kg Phosphorus and 25 kg Potash was recommended to
use in less fertile land for the same purpose as mentioned before: whereas, half bag of Urea, 1½ bags of DAP and 1 bag of Potassium Sulphate was recommended to use during cultivation. Similarly, half bag of Urea at
the time of first irrigation while half bag at second irrigation was recommended. Likewise, 32 kg Nitrogen, 23 kg Phosphorus and 25 kg Potassium was recommended for fertile land as the element of nourishment during
cultivation whereas, half bag of Urea was recommended to use at the time of first irrigation
89%
11%
Wheat Seed Application
50-60 kg/acre Below 50-60 kg/acre
89%
11%
No Yes
Seeds Poisoned before sowing
57%
95%
75%
7%
11%
43%
5%
25%
93%
89%
Nitrogen
Phosphorus
Potassium
Urea
DAP
Fertilizers Applied No Yes

Impact Assessment Study: Livelihood Improvement through Agriculture and Livestock Innovations | 13
Majority (99%) of the farmers had applied different fertilizers while only 1% farmers didn’t applied fertilizers in
their land at the time of wheat cultivation. As can be seen from the figure, few farmers followed the recommended fertilizer application. Majority of the farmers only used 1 or two fertilizers, cumulatively 88%
farmers did use Nitrogen while the remaining 12% didn’t used it in their land, 30% used phosphorus and 70% didn’t, 74% used potash while 26% didn’t used it, likewise majority of the farmers (99%) used Urea and DAP
respectively, at the time of cultivation.
Pesticide spray usage
93% of the farmers used the Pesticides Spray to eliminate the
extra plant, grass, insect and other harmful organisms to
cultivate crop. Other 7% farmers did not used any sort of pesticides at all. 96% of those farmers who applied pesticides
on their fields did that when the weather was suitable i.e. no rain, fog or fast wind.
Irrigation details
The farmers were recommended to irrigate the fields four times during the whole crop cycle and were also recommended to
add another irrigation between the second and the third irrigations if the weather is dry. As can be seen in the figure,
74% farmers irrigated the fields four times whereas 20% farmers irrigated the fields more than four times. Only 6%
irrigated their fields less than four times.
7%
93%
% of farmers used Pesticide Spray
No Yes
74%
6%
20%
Irrigation Details
4 times Less than 4 times More than 4 times

14 | Impact Assessment Study: Livelihood Improvement through Agriculture and Livestock Innovations
Cost of production (Before and After Training)
Figure reveals that the majority (75%) of the farmers having 10-20 maunds per acre yield were spending 5001-
10000 rupees during the whole crop cycle before training while 25% of them spent 10001-15000 rupees before training. However, after training 50% were spending 5001-10000 rupees during the crop cycle, 25%
were spending 10001-15000 and the remaining 25% farmers were spending 20001-25000, which was an ideal cost for the production of Rice crops.
38% of the farmers, having yield of 21-30 maunds per acre were spending 5001-10000 rupees during the whole crop cycle, 19% were spending 10001-15000, 24% were spending 15001-20000 whilst the remaining
19% of the farmers were spending 20001-25000 rupees during the whole crop cycle. After the trainings, 70% of the famers started spending 50001-10000 rupees during the whole crop cycle, 10% spent 10001-15000,
15001-20000 and 20001-25000 rupees respectively.
Before training, out of those farmers who were having 31-40 maunds per acre yield, 15% of them were those who were spending 50001-10000 rupees during the whole crop, 38% were those who were spending 10001-
15000 rupees, 35% were spending 15001-20000 rupees while the remaining 5% were spending 20001-25000 rupees during the whole crop cycle. While after training 19% farmers started spending 50001-10000 rupees
during the whole crop cycle, 37% of the farmers spent 10001-15000 rupees, 39% spent 15001-20000 rupees while only 1% spent 20001-25000 rupees during the whole crop cycle.
Likewise, there were farmers who were having 41-50 maunds per acre production, among them 23% were
spending 50001-10000 rupees during the whole crop cycle while 26% of the farmers were spending 10001-15000 rupees, 42% of the farmers were spending 15001-20000 rupees and the remaining 8% of them were
spending 20001-25000 rupees during the whole crop cycle of wheat. After training 19% of the farmers spent 5001-1000 rupees during the crop cycle, 30% of them spent 10001-15000 rupees, 38% spent 15001-20000
rupees during the whole crop cycle while 8% of them spent 20001-25000 rupees.
Whilst the farmers who were having 51-60 maunds per acre production, afore training 8% of them had spent 5001-10000 rupees during the whole crop cycle, 42% had spent 10001 to 15000 Rupees and 33% invested
15001 to 20000 rupees and 8% had spent 20,001 to 25,000 during the whole crop cycle. However, subsequent
75%
25%
50%
25%
25%
38%
19% 24
%
19%
70%
10%
10%
10%15
%
38%
35%
5%
19%
37%
39%
1%
23% 26
%
42%
8%
19%
30%
39%
10%
8%
42%
33%
8%
13%
38%
38%
6%
67%
5001 - 10000 10001 - 15000 15001 - 20000 20001 - 25000 5001 - 10000 10001 - 15000 15001 - 20000 20001 - 25000
Before training After training
Production Cost
10-20 mands/acre 21-30 mands/acre 31-40 mands/acre 41-50 mands/acre 51-60 mands/acre Above 60 mands/acre

Impact Assessment Study: Livelihood Improvement through Agriculture and Livestock Innovations | 15
to the training, 13% of the farmers spent 5001-10000 rupees, 38% spent 10001-15000 rupees, 38% spent
15001-20000 while the remaining 6% spent 20001-25000 rupees during the whole crop cycle.
Likewise, next to the training, the farmers who were having above 60 maunds per acre yield, 67% of them
spent 15001-2000 rupees during the whole crop cycle.
88% farmers harvested their crops during the month of April-May while 9% during the month of March-April and 3% during the month of May-June.
Wheat crop production/yield (Before and After Training)
Overall the farmers had good yield with an average yield of 41-50 maunds per acre. As can be seen in the figure, prior to the training, in the previous year, no one was receiving above 60 maunds per acre yield but after
the training, 2% farmers reached to the range of the production yield which was a great achievement of the project, as this was the goal of the project to train the farmers to produce more yield, likewise, 33% of the
recipients were getting production per acre of land between the scope of 41 to 50 maunds but after the training, the percentage of the farmers increased up to 47%. Followed by 6% farmers who had 51 to 60 maunds
per acre yield before the training, has raised to 8% while 31-40 maunds per acre range was decreased from
46% farmers to 34% reason being the production range of those farmers has shifted to the range of more yield
after the training, more likely, 11% farmers had 21- 30 maunds per acre yield and after the training only 5% remained at the same range of production while the other had shifted to the higher range of production and
2% of the farmers who were receiving 10 -20 maunds per acre yield remained in the same range of production.
It can be obviously observed from the figure that the trainings to the recipients had a positive/incredible effect
on the yield of generation which enhanced their wage colossally/immensely and in light of the expanded wage, their way of life has been improved, which was one of the sub-objective of the venture.
2%
11%
46%
33%
6%
0%3%2%
5%
34%
47%
8%
2% 2%
10-20 mands/acre 21-30 mands/acre 31-40 mands/acre 41-50 mands/ acre 51-60 mands/acre above 60 mands/acre Didn’t Mention
Production Comparision
Before Training After Training

16 | Impact Assessment Study: Livelihood Improvement through Agriculture and Livestock Innovations
Income generated from production (Before and After Training)
None of the farmers utilized all that hard earned yield for any one activity but utilized the production of wheat crop in the following manner: Data analysis showed that before attending trainings/workshops, 84% farmers
sold part of their production to earn money. Average sale price was calculated to be Rs.1218 per maunds.
However, in the previous year, farmers having production between different ranges like 10-20 mands/acre, 21-
30, 31-40, 41-50 and 51-60 mands/acres, sold the wheat for different prices ranging from 0-1000 and 1000 to 1500 per maunds. 50% of the farmers having production between 10-20 maunds per acre, sold their wheat
for 0-1000 rupees per maund while the remaining 50% of the farmers having the same production range had sold their wheat for 1001-1500 rupees per maund, after the training 100% of the farmers having production
of 10-20 maunds per acre, sold their production yield for 1001-1500 rupees per maund. As their income had increases, their living style has automatically been changed positively.
26% of the farmers who were having 21-30 maunds per acre production before the training were selling their
wheat for 0-1000 rupees per maund while after the training, 56% of the farmers were earning 0-1000 rupees per maund while 44% farmers were the once who were earning 1001-1500 rupees per maund. Likewise, 26%
farmers having 31-40 maunds per acre were selling their wheat yield for 0-1000 rupees per maund while 74% of them sold their wheat production for 1001-1500, after the training only 20% of them were receiving less
amount (0-1000 rupees per maund) while the majority sold their production for more (1001-1500rupees per maund).
25% of the farmers having 41-50 maunds per acre yield, sold the wheat for 0-1000 rupees per maund while
75% of them sold for rupees 1001-1500, after training, 20% farmers sold their production in the range of 0-1000 rupees and the majority (80%) sold it for 1001-1500 rupees similarly 18% of the farmers who were having
51-60 maunds per acre production, were selling wheat for 0-1000 rupees per maund, before training. While 75% were selling it for 1001-1500 rupees per maund. After the trainings, only 65 farmers were left in the range
of 0-1000 rupees per maund and the big majority started earning 1001-1500 rupees per maund.
50% 50%
0%
100%
37%
63%56%
44%
26%
74%
20%
80%
25%
75%
8%
92%
18%
82%
6%
94%
33%
67%
0 - 1000 1001 - 1500 0 - 1000 1001 - 1500
previous year Curren tYear
Comparision of income
10-20 mands/acre 21-30 mands/acre 31-40 mands/acre 41-50 mands/acre 51-60 mands/acre above 60 mands/acre

Impact Assessment Study: Livelihood Improvement through Agriculture and Livestock Innovations | 17
A notable change after the training was that, before training there was no farmer having above 60 maunds per
acre yield but after training 1% farmers were having above 60 maunds, out of them 33% sold the wheat for 0-1000 rupees per maund while the remaing 67% sold it for 1001-1500 rupees per maund.
Similarly, 52% farmers in average had saved 2 to 200 maunds to use at home, as food while 15% in average, had saved 1-150 maunds for the next season seed. 16% farmers gave 2 to 90 maunds to other farmers, friends
and family while only 17% farmers used 10 maunds for other purposes.
Data analysis showed that the average sale price after attending trainings/workshops was calculated to be Rs.1218 per maunds. 80% farmers having production between different ranges like 10-20 mands/acre, 21-30,
31-40, 41-50, 51-60 mands/acres and Above 60mands/acre, sold the wheat for a price ranging from 1000 to
1500 per maunds of while 4% sold wheat for a price ranging from Rs. 0 to 1000.

18 | Impact Assessment Study: Livelihood Improvement through Agriculture and Livestock Innovations
Rice Cropping
Land utilized for the cropping of Rice
Rice was cultivated on total 178.9 acres with an average land size of 2.23 acres by a total of 80 respondents.
Total land under cultivation by the respondents summed up to almost 1,060 acres with an average landholding size of 13.25 acres. The farmers cultivated rice on either all of their lands or on some parts of the land.
Land owned Ranges of land utilized for Rice crop
Ranges 0.5 - 5 Acres 5.5 - 10 Acres
1 - 15 Acres 97% 3%
16 - 30 Acres 100% 0%
31 - 45 Acres 75% 25%
Above 45 Acres 75% 25%
As shown in the table 97% small farmers having landholdings between 1 to 15 acres cultivate rice crops on
0.5-5 acres, while 3% of them cultivated rice on 5.5 to 10 acres. 100% of the farmers having landholding ranging from 16 to 30 acres also cultivated rice on 0.5 to 5 acres of their land while none of the farmers
cultivated rice on 5.5 to 10 acres of land who were having landholding ranging from 16 to 30 acres. 75% farmers having landholding of 31 to 45 acres, cultivated rice on 0.5 to 5 acres of land while 25% did cultivate
rice on 5.5-10 acres of land. Likewise, 75% of the farmers having landholding of 45 acres and above, cultivated rice on 0.5 to 5 acres while 25% cultivated rice on 5.5 to 10 acres.
Varieties of Seeds used for Rice Crop
The beneficiaries of rice used 3 different recommended varieties of rice seeds on their land. Super Basmati
variety was used by the majority (51%) of the beneficiaries. PS2 (Kainat) was used by 44% farmers while 5% farmers used PAK 386. Diverse sources of seeds were being utilized for rice cultivation; they were bought
either from the approved retail locations of Punjab Seed Corporation or the local neighborhood markets, which were suggested by the NRSP staff. However, the farmers who had acquired the seeds were fully satisfied by
the production and nature of the seeds. Summing up 26% of the farmers utilized quality seed from Punjab seed organization and the approved re-venders of Punjab seed enterprise, 30% utilized seeds from local
market, while 25% of the farmers utilized those seeds which were accessible at home from the last year's yield and 19% of the farmers utilized seeds from other different sources.
Variety name % farmer
PAK 386 5%
PS2 44%
Super Basmati 51%
Grand Total 100%
As far as the cropping pattern of Rice was concerned, more or less the same pattern of wheat had been
followed. 81% followed Wheat-Rice, 11% followed Wheat-Maize pattern while the remaining 8% followed other cropping patterns as Rice-Fodder, Wheat-Cotton and Wheat-Fodder.

Impact Assessment Study: Livelihood Improvement through Agriculture and Livestock Innovations | 19
Purpose of Sowing Rice
The overall trend for rice cultivation was observed to be quite low in the union council. The farmers also had
their self-explanatory reasons for not cultivating rice, of majority (45%) identified it to be low income generation. 24% farmers reported that they did not have sufficient resources to cultivate rice and the
remaining farmers reported some other reasons like, they had never cultivated Rice before, had sandy land or cultivated other crop instead of Rice. 31% of the farmers did sow rice for accomplishment of both of their
purposes i.e. seed multiplication and sale in market, 51% sowed rice only to sell in the market while 18% sowed
only for seed-multiplication purposes.
Purpose % responses
Both 31%
Sale in Market 51%
Seed multiplication 18%
Grand Total 100%
Methods of growing Rice
NRSP had organized training sessions in which the farmers
were briefed thoroughly about various productivity enhancing methods and techniques for acquiring better yield of the crop.
Awareness raising and training sessions stressed the use of
transplantation method for the cultivation of rice crops and which almost all the farmers had followed the same prescribed
method i.e. 99% farmers used the transplantation method and only 1% used the broadcasting method. The transplantation
method of cultivating rice is also very cost effective method for farmers having small land holdings.
As per the recommendations, 5 kilogram of seeds had to be used in developing a nursery on one acre of land.
Almost all the farmers used 5 kg seeds for developing a nursery with some exceptions who used about 8 to 10 kg seeds. According to them their land was not quite suitable for the growth of rice and that is why they
had to use more seeds in developing the nursery. 100% farmers used manual method for sowing both for seed multiplication and to sell in the market.
1%
99%
Methods of Transplanting
Broadcasting Method Transplantation Method

20 | Impact Assessment Study: Livelihood Improvement through Agriculture and Livestock Innovations
Mildew prevention for Rice nursery
Farmers were recommended to poison
the seed before sowing to protect the seed from various diseases. Out of the
farmers who cultivated rice crops, majority of them (55%) did not poison the
seeds while 45% poisoned the seeds.
Among the farmers who used poison, Topson-M was used by 78%, 14% used
other poisons while the remaining 8
percent could not recall the poison that
used on the seeds. 58% reported that 2 gram of poison was the quantity they used on per Kg of seed, which was recommended while 28% used more
than the recommended quantity and the remaining 14% applied less than the recommended quantity on per Kg seed.
Majority of the farmers (81%) reported that they used the wet method (Poured some water in a bowl and later on put seeds in it) to poison the seeds. However, 19%farmers claimed to use other methods of poisoning
seeds which was the Dry method (Mixed the poison and seeds in an envelope).
54% farmers stored the seeds for the next year of which 98% removed other varieties and infected plants from the field. These farmers (98%) used the seeds that were dropped the first time while harvesting. The farmers
stored the seeds using different practices i.e. 49% farmers dried the seeds under the sun and stored the seeds in a clean dry place. 40% farmers dried the seeds under the sun and packed in TOPSON sack and then stored
in clean, open and dry place. 12% farmers packed the seeds directly.
Cultivating seedling/buds
When inquired about the separation of the bad seeds, the farmers responded that they separated Bad seeds
by using different methods i.e. majority of the farmers (51%) separated the bad seeds by dipping the seeds in normal water, 33% of the farmers did nothing to separate the bad seeds while the remaining 16% farmers
followed the recommendation i.e. dipped the seeds in salted water to separate the bad ones.
Only 29% farmers used the recommended method i.e making small stacks of seeds and covering them with wet sack 1.5 to 2 days. 65% farmers made small stacks of seeds and covered them with wet sack for more
than 2 days while 6% farmers created small stacks of seeds and covered them with wet sack and covered them for less than 2 days.
76% farmers ploughed the fields before planting rice seedlings of which 70% ploughed the dried fields as recommended while 30% ploughed the wet fields. 36% farmers ploughed the fields one to two times as per
the recommendations while 64% farmers ploughed the fields 3 or more times.
55%
45%
No Yes
% of farmers used poison

Impact Assessment Study: Livelihood Improvement through Agriculture and Livestock Innovations | 21
Land Preparation of Rice Seedlings
Rice crop in Pakistan has been prone to
zinc deficiencies; hence in order to avoid this prevailing threat, NRSP briefed the
farmers to apply Zinc Sulphate in their nursery as well as in main field. However,
41% of the farmers applied Zinc Sulphate
during preparation of nursery 10% of such farmers included the ones who did
not have the soil tests conducted of their
fields while 59% did not use zinc
sulphate. Among the farmers who used zinc while preparing the nursey, 26% used 33% zinc and the remaining 15% used 22% zinc. Those who applied
zinc during the preparation of the nursery, applied different quantities of zinc to their field. 67% of them followed the recommendation and applied 1Kg/ 5 Marla, while the rest, 21% used 2Kg/ 5 Marla and the
remaining 12% used 3Kg/ 5 Marla.
After the preparation of rice seedlings, 76% of the farmers divided the land to small plots, out of the farmers
14% of the farmers followed the recommended size which was 10 Marla each plot, 38% of the farmers divided the plots into more than the recommended size, 16% of the farmers were those who divided their plots into
less than the recommended size while the remaining 8% divided the land into the small plots having random
sizes..
Likewise, it was recommended that fields should be irrigated that 3 days before transplanting rice seedlings.
70% of the farmers followed the recommendation and irrigated their field 3 days before transplanting rice seedlings whereas 30% of them irrigated their land more than 3 days, before the transplantation of the
seedlings. Similarly, it was also recommended to double plough the field in standing water which was followed by the majority of the farmers as 95% of the farmers reported that they did follow the recommendation.
Preparation of Nursery
During the preparation of the nursery, it was recommended that
broadcasting of the seed buds should be done in evening which
was followed by the majority (64%) of the farmers while the lesser (36%) didn’t follow the recommended time.
Directions about irrigation during broad casting were also given
to the farmers like they were directed to maintain the water level up to 1 to 1.5 inches, which was followed by 62% of the farmers
while 36% farmers reported that water level in their field during broad casting was more than 1 to 1.5 inches and the remaining
1% stated that less than 1 to 1.5 inches of water was there in the field during broad casting.
36%
64%
Broadcasting time of Seed buds
Day Evening
10%
21%
31%
38%
Yes No Yes No
No Soil test conducted of field Soil Test conducted of field
Application of Zinc Sulphate in the Nursery

22 | Impact Assessment Study: Livelihood Improvement through Agriculture and Livestock Innovations
It was also instructed that the water should be kept there in the field till next evening and irrigate the nursery
plot the next morning and then to repeat the exercise for 1 week, it was also recommended to increase the depth of water up to 3 inches, as the length of the seedlings grew.
46% of the farmers followed the recommended practice and they kept the water in the field till next evening, 38% kept the water till next morning, 13% kept it for more than 2 days while the remaining 4% kept the water
in the field for 2 days. Out of the total farmers, 93% irrigated the nursery plots the next morning. 97% of them repeated the exercise, out of them 47% followed the recommendation and repeated the exercise for 1 week,
39% repeated it for more than one week while 14% of them repeated the exercise for less than one week.
64% of the farmers reported that they have followed the recommendation as they increased the water
level/depth up to 3 inches as the length of the seedlings grew, 19% stated that they increase the water depth
up to 5 inches or more and the remaining 18% reported that they did not increased the level of water with the increasing length of the seedlings.
Urea in Nursery
During the training sessions, it had been recommended that 250 Grams of Urea
be applied in per Marla before 10 days of shifting the seedlings into the main field,
in case the seedlings were weak.
60% of the farmers used Urea in the
Nursery for weak seedlings, out of them
42% of the farmers did exactly what was taught to them (used 250 Grams Urea in
each Marla), 38% of the farmers applied more than the 250 Grams Urea in each
Marla reason being they had applied more than the recommended rate because of the reasons that their land was not much suitable for the rice cultivation and that the application of more Urea into the nursery gives
more productivity, while 21% used less than the recommended quantity. Most of the farmers (56%) who had used Urea in the nursery applied it 10 days prior to the transfer of seedlings into the main field, 33% farmers
had applied urea more than 10 days prior to the transfer of seedlings and 10% of the farmers applied Urea in the main field, less than 10 days prior to the transfer of seedlings.
Shifting of Seedlings into the Main Field
The training sessions that had been conducted by NRSP, put a great emphasis on proper and systematic
transfer of seedlings from nursery to main filed so that the productivity of rice could be enhanced.
54% of the farmers reported that it took 10 to 20 days to transfer the harvested seedlings in to the main field, 26% reported that it took 20 to 30 days for the transfer of the harvested seedlings into the main field while the
remaining 20% of the farmers reported that it took more than a month to do so. It was strictly recommended to complete the transfer of seedlings to the main field till the end of July which was followed by all the (100%)
farmers.
40%
60%
No Yes
Urea used for weak seedlings

Impact Assessment Study: Livelihood Improvement through Agriculture and Livestock Innovations | 23
Age has always been an important factor
for determining the yield of transplanted seeds. The effect of transplantation on
yield increases with the decreasing in the age. However, ideal seedling age is about
30 to 40 days at the time of cultivation. 74% farmers transferred 30-40 days old
seedling in to the main field. It was recommended to irrigate the nursery one
day before the transfer of seedlings, which was followed by the 85% farmers
while 15% of the farmers overlooked the recommendation. 68% of the farmers irrigated the nursery one to two days before the transferring of seedling, 21% reported that they irrigate the nursery three to four days before
the transfer of seedlings and 12% of the farmers irrigate the nursery five to seven day before the transfer of seedlings.
To achieve an optimum level of
productivity the farmers were advised to plant two seedlings with a distance of 9
inches. By this exercise an acre was to hold a maximum of 1, 80,000 holes and
1,60,000 plants. But only 25% of the farmers followed what they were taught,
while 68% of the farmers planted one plant per hole, planting a total of 90,000
rice plants per acre and 5% farmers planted three seedlings per hole which
made their count to 2,70,000 rice plants per acre and the remaining 3% farmers didn’t mention.
Out of the total farmers, 77% planted each plant at the distance of 9 inches from the other plant while 16%
placed them at the distance of less than 9 inches and the remaining 6% placed the plants randomly. 39% of the farmers continuously kept the water standing in the field after transplantation, 29% kept it for more than
a month while 23% kept it for a week and 11% kept the water till 2 weeks in the field after transplantation.
Extra seedlings were tied and placed at the corner of the field in water as reported by 49% farmers while 18% farmers reported that they had no extra seedlings. 34% reported that they gave the extra seedlings to other
farmers who were in need at the time and 3% stated that they feed their animals with the extra seedlings. Likewise, 100% of the farmers removed the weak and diseased seedlings as recommended.
68%
25%
5% 3%
1 seedling in each hole 2 seedlings in eachhole
3 seedlings in eachhole
Didn’t Mention
Seedlings planted/hole
74%
6% 9% 11%
30 to 40 days Didn’t Mention Less than 30 days More than 40 days
Age of seedling at the time of cultivation

24 | Impact Assessment Study: Livelihood Improvement through Agriculture and Livestock Innovations
Irrigation after the transfer of seedlings
After the transfer of seedlings, it was recommended to maintain the depth of water 1.5 inches till one week of
plantation, 58% of the farmers followed the recommendation and kept 1.5 inches’ water till one week of plantation while 41% reported that the depth of water in their filed till one week of plantation was more than
1.5 inches and the remaining 1% told that the depth of water was less than 1.5 inches’ water till one week of plantation. Similarly, it was advised to increase the depth of water after one week of plantation up to 3 inches,
majority of the farmers (64%) followed the recommendation and increase the depth of water up to 3 inches after one week of plantation, 30% increase the depth of water more than 3 inches and 6% increase it to less
than 3 inches.
After putting urea in the field, 100% of the farmers irrigated the fields, out of which, 60% of the farmers reported that 3 inches of water level was in the field at the time of fertilizer application while 29% of the farmers said
that the water level in the field at the time of fertilizer application was more than 3 inches and the remaining 11% farmers stated that at the time of fertilizer application less than 3 inches of water level was in the field.
49% of the farmers reported that before more than 15 days of ripening of crop, they stopped watering while 35% of the farmers stopped watering the field before 15 days and 16% of the farmers reported that less than
15 days of ripening of crop, they stopped watering the field.
Farmers were advised to harvest the seedling before 20th May to protect them
from various pest attacks, 96% of the farmers harvested the seedlings before
20th of May while the remaining 4% farmers didn’t.74% of the farmers applied
poison on the seedlings while 24% of the farmers didn’t poisoned the seedlings.
Out of those farmers who applied poison on the seedlings, 76% applied the poison
on the seedling only once while the recommendation was of applying the poison twice. Only 24% applied the poison twice on the seedlings. 63%
farmers used Topson-M poison on their fields while 37% farmers could the recall the name of the poison used in the field. 55% farmers applied the poison on their fields within 8 to 20 days of which 9% farmers applied
poison in 8 to 10 days while 45% farmers applied poison within 15 to 20 days. 45% farmers applied poison after 20 days.
76%
24%
Once Twice
Poison application
58%
1%
41%
Water depth during first week
1.5 inches less than 1.5 inch more than 1.5 inch
64%
6%
30%
Water depth after first week
3 inches Less than 3 inches More than 3 inches

Impact Assessment Study: Livelihood Improvement through Agriculture and Livestock Innovations | 25
For better rice productivity fertilizers were also to be used. As explained during the training sessions that the
optimum level of the crop could only be achieved by applying 2 bags of Urea, 1.5 bag of DAP and 1 bag of Potassium. Only 6.25% of the farmers applied the fertilizers as prescribed by the NRSP staff. However, a very
large percentage of farmers had applied only one bag of each fertilizer and it came to be 44% while 19% applied 1.5 bag Dap and 1 bag of Potassium. During fertilization it was recommended that fields should be muddy at
the time of fertilization, 24% of the farmers followed the recommendation while the majority (70%) fertilized the watery field and the remaining 6% fertilized the dry field.
Used Dap, Potash and Urea % of farmers
1 bag Dap, Potash and Urea each 44%
1.5 bag Dap, 1bag Potash and 2 bags Urea 6.25%
1.5 bag Dap and 1 bag Potash 19%
As already discussed that Rice crop in Pakistan has been facing the deficiency of Zinc and Boron; hence in order to avoid this prevailing threat, NRSP instructed the farmers to apply Zinc Sulphate and Boron in their
fields if the subsequent symptoms occurred i.e. leafs of the crops will start turning white or yellow, leafs start curling at their tips, growth of the crops will stop and easily be taken out and due to major deficiency of Zinc
Sulphate, the leafs will tore from the middle (either in length or width) while in case of major deficiency of Boron, leafs will start falling down and grains do not grow in the rice stock, so to fight against the deficiency
of Zinc Sulphate and Boron, the farmers were taught to take the remedial measures like, for the deficiency of Zinc Sulphate, 1Kg/5 Marla’s Zinc Sulphate (33%) to be used in the nursery before cultivating it or to mix 1Kg
Zinc-Oxide in 50 liters water and dip the seedlings of 1Acre in the mixture before the shifting of seedlings while for the major deficiency, 5Kg/acre Zinc Sulphate (33%) or 10Kg/acre Zinc Sulphate (22%) be broad casted 10
days before the shifting of seedlings and for the deficiency of Boron it was recommended to use 3Kg Boric Acid or 20% 4.5 Kg Borax/Acre during the preparation of field and before transferring the seedlings.
76% of the farmers applied zinc during preparation of the main field while 24% did not applied zinc during
preparation of the main field, out of the farmers who applied zinc in the main field, 62% used 33% of zinc and the remaining 38% used 22% of zinc. Those who applied zinc during the preparation of the main field, applied
different quantity of zinc to their field, 50% of them applied 5Kg/Acre, 48% used 10Kg/Acre, while 2% used 15Kg/Acre. Majority of the farmers who had not applied zinc into their field preparation were those who did
not get their fields tested or did not get the reports of soil test.
54% of the farmers reported that their
crops were Zinc deficient, 1% were facing Boron deficiency while 45% of the
farmers reported that their crops were
not Zinc nor Boron deficient, out of farmers who were having Zinc Sulphate
deficiency in their crops, 68% told that the leafs start turning yellow, 20% of them
stated that their leaf turned white while 11% reported the curling of the leafs from
the tips. 93% of the farmers who faced the deficiency had taken remedial measures to overcome the deficiency while 7% did not do anything. Out of
1%
45%
54%
Boron No deficiency Zinc
Zinc or Boron Deficient
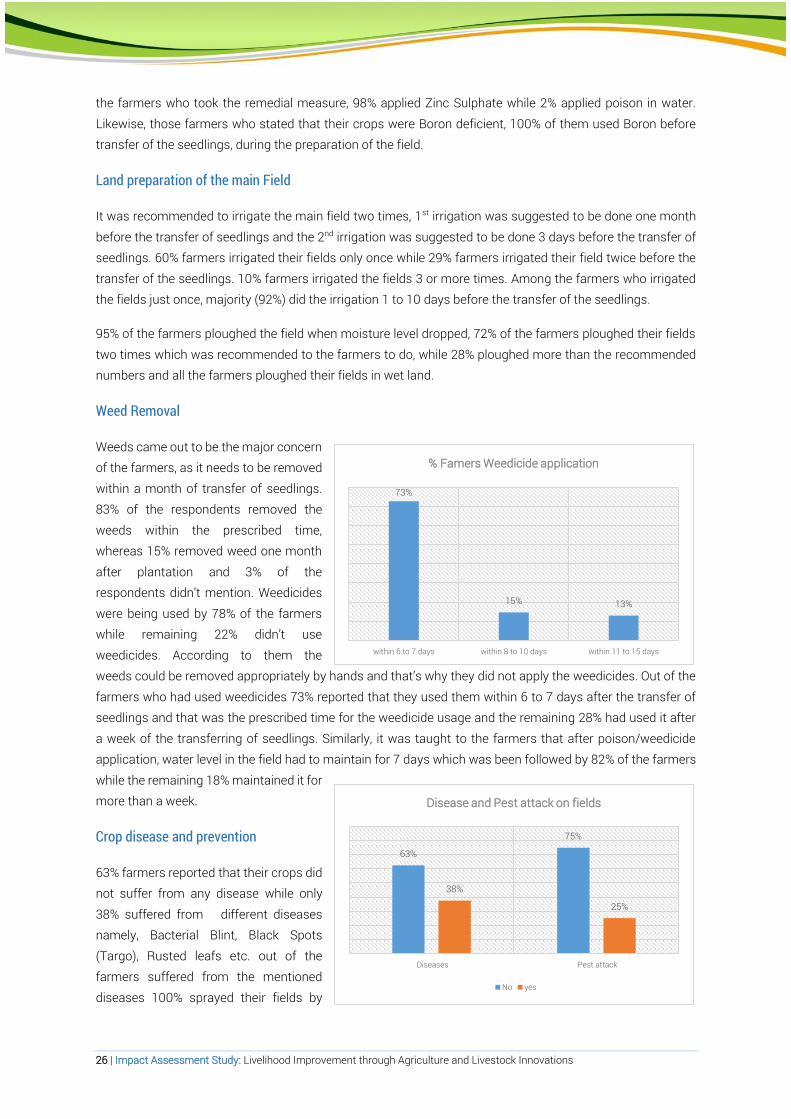
26 | Impact Assessment Study: Livelihood Improvement through Agriculture and Livestock Innovations
the farmers who took the remedial measure, 98% applied Zinc Sulphate while 2% applied poison in water.
Likewise, those farmers who stated that their crops were Boron deficient, 100% of them used Boron before transfer of the seedlings, during the preparation of the field.
Land preparation of the main Field
It was recommended to irrigate the main field two times, 1st irrigation was suggested to be done one month
before the transfer of seedlings and the 2nd irrigation was suggested to be done 3 days before the transfer of seedlings. 60% farmers irrigated their fields only once while 29% farmers irrigated their field twice before the
transfer of the seedlings. 10% farmers irrigated the fields 3 or more times. Among the farmers who irrigated the fields just once, majority (92%) did the irrigation 1 to 10 days before the transfer of the seedlings.
95% of the farmers ploughed the field when moisture level dropped, 72% of the farmers ploughed their fields
two times which was recommended to the farmers to do, while 28% ploughed more than the recommended numbers and all the farmers ploughed their fields in wet land.
Weed Removal
Weeds came out to be the major concern of the farmers, as it needs to be removed
within a month of transfer of seedlings. 83% of the respondents removed the
weeds within the prescribed time, whereas 15% removed weed one month
after plantation and 3% of the respondents didn’t mention. Weedicides
were being used by 78% of the farmers while remaining 22% didn’t use
weedicides. According to them the weeds could be removed appropriately by hands and that’s why they did not apply the weedicides. Out of the
farmers who had used weedicides 73% reported that they used them within 6 to 7 days after the transfer of seedlings and that was the prescribed time for the weedicide usage and the remaining 28% had used it after
a week of the transferring of seedlings. Similarly, it was taught to the farmers that after poison/weedicide
application, water level in the field had to maintain for 7 days which was been followed by 82% of the farmers
while the remaining 18% maintained it for more than a week.
Crop disease and prevention
63% farmers reported that their crops did not suffer from any disease while only
38% suffered from different diseases namely, Bacterial Blint, Black Spots
(Targo), Rusted leafs etc. out of the farmers suffered from the mentioned
diseases 100% sprayed their fields by
73%
15% 13%
within 6 to 7 days within 8 to 10 days within 11 to 15 days
% Famers Weedicide application
63%
75%
38%
25%
Diseases Pest attack
Disease and Pest attack on fields
No yes

Impact Assessment Study: Livelihood Improvement through Agriculture and Livestock Innovations | 27
using different poison named Lemda and Protein-C, Bromoxil, Karatae, and Cholodina to fight against the
disease attack to prevent their crops.
Similarly, 75% farmers reported that their crops did not suffer from any pest attack while 25% farmers dealt
with the pest problem by spraying Bromoxil, Lemda and Protin C. The pest that attacked the fields included Sundi, Tela and borers. The farmers were provided with all necessary information during the trainings and
hence all the farmers were able to rid their fields from disease and pest attacks.
Production and Income generation
Rice crop production/yield (Before and After Training)
It is evident from the figures that the crop enhancement training has a positive impact on the overall production of the crop which enhanced their wage enormously and in light of the expanded wage, their way
of life has been improved, which was also one of the sub-objective of the venture. In the previous year there were less number of people (30%) who had production of more than 40 maunds per acre and after the training,
the number has increased to 48% that clearly mirrors the objective of the project. Moreover, it can be concluded that with the trainings, the overall income trend prevailing in the area increased.
Overall the farmers had good yield with an average yield of 41-50 maunds per acre. As can be seen in the figure, prior to the training, in the previous year, 3% were receiving above 60 maunds per acre yield but after
the training, 4% farmers reached to the range of the production yield, likewise, 8% of the recipients were getting production per acre between the scope of 51 to 60 maunds but after the training, the percentage of the farmers
increased up to 16%. Followed by 19% farmers who had 41 to 50 maunds per acre yield before the training, has raised to 28% while 31-40 maunds per acre range was decreased from 52% farmers to 34% reason being
the production range of those farmers has shifted to the range of more yield after the training, more likely, 16% farmers had 21- 30 maunds per acre yield and after the training 13% remained at the same range of production
while the other had shifted to the higher range of production and 1% of the farmers who were receiving 10 -20 maunds per acre yields increased up to 5%.
1%5%
16%13%
52%
34%
19%
28%
8%
16%
3% 4%
Before training After training
Production Comparision
10-20 mands/acre 21-30 mands/acre 31-40 mands/acre 41-50 mands/acre 51-60 mands/acre above 60 mands/acre

28 | Impact Assessment Study: Livelihood Improvement through Agriculture and Livestock Innovations
Seed variety wise production
The respondents cultivated PAK 386, PS2, Super Basmati and Super India. Survey results showed that
majority of the farmers cultivated Super Basmati (53%) while 41% farmers cultivated PS2 and the remaining 6% cultivated PAK 386 and Super India. The results indicate a very positive impact on the production received
using the same varieties. The chart shows the varieties sowed and per acer production of the farmers received before and after the trainings. The respondents sowed the same varieties before and after trainings but as
can be clearly seen in the figure, the production of the same varieties significantly increased after trainings. Majority of the farmer (26%) cultivated Super basmati variety of seeds and produced 31 to 40 maunds yield,
followed by 11% who produced 21 to 30 maunds, only 5% produced 41 to 50 maunds per acer. Whereas after training 18% farmer produced 31 to 40 maunds, 8% produced 41 to 50 maunds, 10% farmers produced 51 to
60 maunds and 3% had more than 60 maunds per acer production of Super Basmati rice variety. Similarly, the famers who cultivated PS2 variety, 19% have produced 31 to 40 maunds per acer, 13% have produced 41 to
50 maunds per acer while 3% produced 51 to 60 maunds per acer yield. Whereas after training, 15% farmers received 31 to 40 maunds per acer, 19% farmers received 41 to 50 maunds per acer and 4% farmers received
51 to 60 maunds per acer production. Similarly, this increase in production was also observed in the case of other varieties of rice seeds used for the cultivation of rice.
1% 1%4%4%
11%
3%
10%
1%
19%
26%
1%
15% 18
%
1%
13%
5%
1%
19%
8%
3% 3% 3% 3%
4%
10%
1% 1%
3%
1%
PAK 386 PS2 super basmati Super India PAK 386 PS2 super basmati Super India
Before Training After Training
Variety wise production (Before & After Training)
10-20 mands/acre 21-30 mands/acre 31-40 mands/acre 41-50 mands/acre 51-60 mands/acre above 60 mands/acre

Impact Assessment Study: Livelihood Improvement through Agriculture and Livestock Innovations | 29
Cost Analysis (Before and after training)
The training mainly revolved around adopting best practiced for seed selection, crop rotation, irrigation schedule, Fertilizer application, Weedicide and Pesticide usage to gain maximum yield of production. This section of the report attempts to identify the changes in the production and costs incurred by farmers.
Data Analysis showed that per/Acer cost remained the same, however the production was increased. Results showed that before training, by incurring 1000-15000/ rupees per acer, 8% farmers had 10-20 maunds/acer
per acre yield, 54% had 31 to 40 maunds per acer yield, 8% had 41 to 50 maunds per acer yield, 23% had 51 to 60 maunds per acer and 8% had above 60 maunds per acer yield. However, the results show’s that, after
training by incurring 10000-15000/rupees cost/per acer, 7% farmers had 10 to 20 maunds per acer, 36% had 31 to 40 maunds per acer, 14% farmers had 41 to 50 maunds per acer, 29% farmers had 51 to 60 maunds per
acer and 14% farmers had above 60 maunds per acer production.
Similarly, before training, by incurring more than 31,000 Rupees/acer, 57% farmers had 31 to 40 maunds per
acer of production, 29% had 41 to 50 maunds per acer and 14% farmers had 51 to 60 maunds per acer yield
whereas after training by incurring more than 31,000 Rupees/acer, 17% farmers 21 to 30 maunds per acer yield, 67% farmers had 41 to 50 maunds per acer and 17% farmers had 51 to 60 maunds per acer yield.
This shows a positive change in the production by applying the techniques learned during the training
sessions. These results are of the 80 farmers out of the total sample of 210 who cultivated rice, as from the
past two year’s experience, the farmers were not able to get the expected return so the small farmers did not invested on the rice cropping. All the beneficiaries who had cultivated rice crop, were of the view that the
trainings were beneficial for them and that they will be following the prescribed process for their future production.
8% 7% 5%
23%
16%
17%
54%
51% 57
%
36%
37%
8%
21% 29
%
14%
28%
67%
23%
4%
14%
29%
12% 17
%
8%
2%
14%
2%
1000 - 15000 16000 - 30000 Above 31000 10000 - 15000 15001-30000 30001 and above
Before Training After Training
Production & Cost Comparison
10-20 mands/acre 21-30 mands/acre 31-40 mands/acre 41-50 mands/acre 51-60 mands/acre above 60 mands/acre

30 | Impact Assessment Study: Livelihood Improvement through Agriculture and Livestock Innovations
Income Analysis (Before and after training)
The results show a very positive change in
the per acer income generated by the farmers. Before training, 58% farmers
were generating up to 1000 rupees per maund followed by 42% of the farmers
were getting the income 1100-2000
rupees per maund. The results show a drastic change in the per maund income
earned by the farmers after trainings.
Majority of the farmer (91%) generated
1100 to 2000 rupees per maund and just 8% earned up to 1000 rupees. This shows that the training had a very positive effect on not only the quantity
but also the quality of the production and the farmers were able to sell the produce for good price. The farmers were made aware about the deficiency of various important minerals in soil and water through water and soil
tests and were further educated about the most suitable varieties to be used for cultivating rice. Furthermore, they were also educated about the new and improved Agricultural techniques related to crop rotation, sowing,
irrigation, weedicide and pesticide usage and the timing of each activity. All this resulted in better per acer yield with improved quality which the farmers were able to sell in the market for better price to generate higher
income returns.
Utilization of Production
The respondents had a total production of 6,708 maunds of rice with an average production of 84 maunds. The results show that the majority of the farmers used major portion of the yield to sell in market. A total of
5,042 maunds (75% of total production) of rice was sold in the market. Each farmer on average sold 68% of his total production. Average sale price was calculated to be 1224 rupees. Similarly, 1,292 maunds (19% of
total production) of rice were kept to be used at home. On average, each farmer saved 25% of his total yield
to be used at home. Results also showed that a total of 289 maunds (4% of the total yield) was saved by the farmers (on average 5% by each farmer) to be used in next season for sowing. 10 farmers reported that they
gave 71 maunds cumulatively (1% of the total production) to friends and family members while only 3 farmers
reported that they used a total of 14 maunds of rice production for other purposes including, giving away some
maunds to the labors who were engaged in harvesting process. None of the farmers used the yield for barter trade or for exchange of seeds.
Training Impact
63% farmers attended the trainings while 37% farmers did not attend the training. 96% of farmers who
attended the training reported that they have learned procedure of productivity enhancement, land preparation, cultivation methods, proper usage of pesticides and sprays, proper usage of fertilizers and about
irrigation system. Those techniques which were taught to the farmers through the training sessions were reported by 94% of the farmers to be proven as the helping hands to them while the remaining 4% did not
attend the trainings. The training participant were found to be completely satisfied with the contents of the trainings, 76% farmers reported that adopting new techniques improved their income while the remaining 24%
did not witness any increase in their production. It should also be noted here that these farmers did not
58%
8%
42%
91%
Before Training After Training
Income Generated per maund
1 - 1000 Rupees 1100 - 2000 Rupees

Impact Assessment Study: Livelihood Improvement through Agriculture and Livestock Innovations | 31
followed the recommendation to the latter regarding per acer seed application, irrigation schedule and fertilizer
usage.
Livestock
Training Sessions on livestock:
Awareness sessions on livestock were conducted by NRSP in
which the farmers were made aware of the best practices about
animal breeding and caring methods (milk and meat production), proper Insemination, Vaccination and Deworming, animal
nutrition (including feed, fodder, silage, drinking water requirement), basic livestock management practices for productive
enhancement, animal diseases and their preventive measures. 34% of the beneficiaries reported that they have attended
workshop/training sessions while the remaining didn’t attend the workshops/trainings.
Along with the resource persons some of the farmers were being selected from each four villages as master trainer in livestock extension services and they further trained the
remaining all livestock owning farmers of their respective villages.
Livestock Vaccination and De-worming:
The project had a livestock component under which the large
and small livestock were provided vaccines to improve their health and production. 1,810 was the total number of livestock
of the beneficiaries which included 1,288 cows/bullocks and buffaloes and 522 small animals i.e. goats and sheep’s. NRSP
provided free of cost vaccines to large and small animals at least once a year and also provided the beneficiaries with the
vaccination cards (28% of the beneficiaries are having the vaccination cards) to make sure that double vaccination at the
same time should be avoided, as Government was also providing vaccines in the same area.
97% farmers consider vaccination worth spending money and
3% beneficiaries didn’t consider it worth spending money, out of the 97% farmers who consider vaccination worth spending
money, 95% beneficiaries vaccinate their animals at least once in a year while the remaining 5% didn’t vaccinate their animals.
When the ratio of diseases prevailed the previous year was
compared to the current year in the area, the tendency has been decreased to the minimum.
5%
95%
Vaccination Once A Year
No Yes
66%
34%
Attended Workshop
No yes
28%
72%
Availibility of Vaccination Cards
Yes No

32 | Impact Assessment Study: Livelihood Improvement through Agriculture and Livestock Innovations
As can be seen in the table that “Fever”, “blood in urine”, Hemorrhagic septicemia” Stomach problem and “foot
to mouth” were some of the common diseases which were attacking almost every livestock in the area and causes deaths of the animals, now the tendency has been decreased to 4% as per the farmers, which became
possible just because of the adopted habit of regular vaccination.
As shown in the above table, total reported deaths of livestock the previous year were 69 out of 1810 in
number. The following analysis shows that the breakdown of each variety of livestock and the percentage of animals which have been vaccinated.
After initiation of regular vaccination 100% of the respondents who vaccinate their animals at least once a
year, have observed that their animal became active and healthy, diseases been controlled, feed intake been improved and milk and meat productivity been increased and death rate of the animals has been reduced.
Diseases Cow/Bullocks Buffalo Goat/Sheep
Previous Year Current year Previous Current Previous Current Blood in urine 1% 0% 4% 1% 1% 0% Fever 3% 3% 3% 1% 1% 2% Foot to mouth 10% 5% 13% 6% 3% 1% Hemorragic septicemia 3% 3% 3% 1% 1% 0% Stomach Problem 1% 1% 1% 1% 0% 0% Breathing problem 0% 0% 1% 0% 0% 0% Failure of pregnancy 0% 0% 0% 1% 0% 1% Mocus 0% 0% 0% 0% 0% 1% Paches 0% 0% 0% 0% 0% 1% polio 0% 0% 0% 0% 0% 1% No disease 83% 88% 77% 89% 94% 94%
Livestock Total number of
livestock Death of Animal (previous Year)
Number of vaccinated animals
% of Vaccinated animals
Cows/Bullocks 659 28 637 97%
Buffalo 629 21 597 97%
Goats/Sheep’s 522 20 478 91%
Total 1810 69 1712 Average: 95%

Impact Assessment Study: Livelihood Improvement through Agriculture and Livestock Innovations | 33
NRSP also provided de-worming facilities to large and small
animals at half of the market price to make the animals more active and healthier, to control the diseases, to increase the feed
intake level and also to increase the milk and meat productivity. Which are been observed in the area, 82% of the farmers have
reported that they vaccinate their animals on regular basis while the remaining 18% are not practicing. All the beneficiaries who
are practicing Deworming on regular basis, have reported that they have observed changes after regular de-worming like their
animals are been cured from the diseases so that they have started taking proper feed so their milk and meat productivity
has enhanced and became more active and healthier.
Artificial Insemination:
Artificial insemination (AI) is the process of collecting sperm cells from a male
animal and manually/artificially depositing them into the reproductive
tract of a female animal.
Whereas it is convenient to provide for regulation of livestock breeding services,
to improve genetic potential of breeds and protect indigenous breeds of
livestock in the Punjab, Artificial insemination is commonly used instead
of natural mating in many species of animals because of the many benefits it can reap. These benefits include increased safety of the animals and producer, increased production efficiency and it can drastically improve
the genetics of the livestock.
NRSP aware the livestock owners through workshops/awareness sessions/trainings about breeding and
caring methods (meat and milk production), proper insemination (the regulation of breeding services and also
regarding the standard and quality of breeding services), breeds were also recommended in the workshop. 34% beneficiaries
attended the workshops while the remaining 66% didn’t.
36%
64%
Artificial Insamination of Animals
No Yes
1%
23%
75%
Don’t know No yes
Importance of AI Services
18%
82%
Regular Deworming
No yes

34 | Impact Assessment Study: Livelihood Improvement through Agriculture and Livestock Innovations
75% beneficiaries were of the view that Artificial Insemination services are important, while 24% were of the
opposite vision and only 1% didn’t know either it is important or not. Out of the total beneficiaries who were of the view that AI is important, 77% reported that they are artificially inseminating their animals for breed
improvement while 23% are not practicing it. 42% of those who are artificially inseminating their animals reported that they use Friesian breed of semen for artificial insemination as suggested by NRSP, 28% use
Sahiwal breed for Artificial Insemination, 20% use Local/Velaiti breed while Australian, Jersey and Neeli Ravi breeds were used to artificially inseminate their animals by 1%, 3% and 6% beneficiaries respectively.
NRSP is one of the existing AI service provider in the area, 22% beneficiaries
reported that they are taking AI services
from NRSP, 16% are taking the services
from government department, while 42% are taking the services from private
doctors and 20% reported that they have no idea about the service providers.
20%16%
22%
42%
Don't know Government NRSP Privae Doctor
AI Service Providers In The Area

Impact Assessment Study: Livelihood Improvement through Agriculture and Livestock Innovations | 35
Case Studies
Ehsan Qadir
Mr Ehsan Qadir is a 38-year-old farmer and a father of six children and a farmer by profession. He lives in village
“LaluWali” of union council LaluWali. He is also looking after his parents in addition to his own family. He is an
active member of his community and has been engaged in agriculture for the past 15 years. He cultivates maize,
wheat and rice. In addition to that he also sells milk of his cattle’s. Till 2015 he had been using old farming
techniques to enhance his crop productivity.
After inception of the Livelihood improvement through Agriculture and Livestock Innovation project by NRSP his
wife became member of CO. He too started actively participating in the activities being organized under the
project.
As being active member of the society he used to gather as many farmers from adjecent areas of his place and
made sure that everybody from the society must get maximum benefit from the project. He attended all the
trainings organized by NRSP staff during the project implementation period and applied the learnt new techniques to his cropping procedures.
Before the start of the project his per acre yield of wheat was 51 – 60 Maunds and after employing the things
learnt from the trainings his per acre yield of the same crop was more than 60 Maunds. Same was the case with the rice crop. During the training session he was told about the methods to increase the rice productivity
and after employing the same techniques his rice crop yield per acre also increased.
During the training poisoning of seeds was emphasized by NRSP and he followed the procedure of poisoning
the seeds and when his crop yield increased he took some of the wheat for seeds, and now he sells the seeds to other farmers in addition to selling the wheat to the government.
He also has as fair amount of cattles that include cows, buffalos and goats. After he was introduced to the
livestock management practices he came to know about the importance of new techniques in the sector and started following the routine of regular vaccination and deworming of his animals. By doing so the feed intake
and milk productivity of the animals increased. He now sells milk to the milkmen in the area and to the NRSP operated chiller plants. He is very hopeful that NRSP’s interventions in the agricultural sector are going to bring
about a positive change in the locality.
Monthly he earns a fair income of around 70000 PKR and is living a successful life with the help of NRSP. He was of the view that more trainings may be organized by the organization and expanding the focus to other
crops as well so that overall productivity of the agriculture may be increased.

36 | Impact Assessment Study: Livelihood Improvement through Agriculture and Livestock Innovations
Imran Shehzad
Mr. Imran Shehzad is a 32-year-old farmer and a father of four children and a farmer by profession. He lives in village
“LaluWali” of union council LaluWali. His household consists of seven people. He has been doing agricultural
practices for the past ten years. He is a regular farmer and earns his livelihood from selling the crops and the milk of
the cattle’s he has kept. He mainly cultivates wheat, mustard and rice. He employed different techniques to
increase the productivity of his crops but every time failed because he was using old fashioned techniques.
As NRSP launched the Livelihood improvement through
Agriculture and Livestock Innovation project, he at first was not willing to join the community organization nor did
he allowed his family members to become part of the organization. Soon he realized that the goal of the project
was to enhance the productivity of the crops, so he started attending the meetings of the community and
started attending the orientation sessions given by the staff.
He after employing the learned techniques increased the per acre yield of his crops. He also started cultivating
rice crops on procedures described in the trainings. The per acre yield of his rice crop was increased but could not get more profit because of the low prevailing rate in the market.
He had his land tested by the organization after which he came to know that his land was pottasium deficient. He was very happy for after employing pottasium into the field, the deficiency had been minimized and his
per acre yield for every crop he cultivated had increased.
He also has as fair amount of cattles that include cows, buffalos and goats. After he was introduced to the livestock management practices he came to know about the importance of new techniques in the sector and
started following the routine of regular vaccination and deworming of his animals. By doing so the feed intake and milk productivity of the animals increased. He now sells milk to the NRSP operated chiller plants and is
very happy on the return he is getting for the sold milk.
Monthly he earns a fair income of arund 35000 PKR for which he is happy. When asked he told that he could not afford the schooling of his children at first but now all of his children are going to school. He suggested
that every farmer may be provided with the opportunity he was provided with and NRSP must expand the focus to other crops as well so that overall productivity of the agriculture may be increased.

Impact Assessment Study: Livelihood Improvement through Agriculture and Livestock Innovations | 37
Muhammad Nawaz
Muhammad Nawaz is a 40 year old resident of village “Lalu Wali” of union council Lalu awali. He is father of
four children and his household comprises of six people. At first he used to do casual labour but now he is a
patient of tuberclausis and does nothing becuause of his detriorating health. He now looks after the land of a
landlord. All he can do now is to sit and watch for any intruders coming in the land. In return the landlord has
provided them with shelter and gives them wheat seeds and some money. He was living a life of misery. He owns
some animals but did not have any means that cold increase the productivity of the animals. His wife Bushra
bibi started to share the economic load of the household by working in the homes of defferent people. In this way
they could manage to meet their both ends meet in a very difficult way.
When NRSP started the Livelihood improvement
through Agriculture and Livestock Innovation project his wife became the member of CO and he too started to
attend the training sessions given on livestock management. He was told by the staff about the
benefits of regular deworming and vaccination. His animals had not been vaccinated before nor deworing was done. He managed to vaccinate the animals throuh NRSP staff and deworming medicine was provided to him
on subsidised rates by NRSP.
After using the medicine several times the feed intake of his animals increased and eventually the milk productivity also increased. He approached the chiller plants managed by NRSP for the sale of excess milk
and now he sells the milk to NRSP operated chiller plants.
He wants his children to study as much as possible and he is sending all his children to school. He has three
sons and one daughter. He is thankful to the trainings he attended and because of the trainings his monthly
income has increased and he is able to send his children to school. His monthly income lies in the bracket of 10,000 to 12,000 PKR. He is now able to pull his family and thank the help provided to him by the organization.

38 | Impact Assessment Study: Livelihood Improvement through Agriculture and Livestock Innovations
SWOT Analysis
SWOT analysis was done to examine the project strengths, weaknesses, opportunities and threats. The
analysis is given below.
Strengths
NRSP has entrenched system of Community Organizations (189,097).
Large number of social organizers and Micro-credit staff members are also in close contact with these community organizations and their members
Well trained regional staff that carries out the trainings of the farmers and also establishes a healthy
relationship with them through meetings and practices.
Supporting the farmers in terms of seasonal crop seeds and fertilizers Provision of soil and water test before cultivating crop
Arrangements of farmer’s exposure visits to the large scale Agro-research centers Dissemination of the IEC (Information, Education and Communication) material to the active farmers
for the due seasonal crops. Well connected to the government departments of livestock
Weakness
Lack of staff for the proper execution of the project.
The project is run through community resource persons and hence the outreach is compromised with less social organizers supervising the CRPs.
Due lack of regular follow up, farmers are not fully aware of how to increase the productivity of their crops and they have been practicing traditional methods for a very long time.
The training sessions alone cannot deliver a holistic impact of the project. Lack of investment and also the physical infrastructure in the area
Lower rate of literacy rate in the areas practicing agriculture. Producers and the buyers are not interlinked directly
Opportunities
Farmers are willing to pay to NRSP for provision of innovative technologies to mechanize their
farming. Proper planning to use the available resources would help increase the yield of all crops.
With a proper planning a new direction to the project may be given. Small farmers may be persuaded towards cooperative farming. It can be directed this way with
NRSP’s network of community organizations which may bring about a great positive impact on the productivity.
Application of latest seeds (Hybrid) in some area of the land to get maximum production. The economic conditions of the farmers can be targeted and right information can be provided.
Livestock management practices have a capability of making an effect on economic/financial condition.

Impact Assessment Study: Livelihood Improvement through Agriculture and Livestock Innovations | 39
With legitimate arranging the venture can draw attention of or attract national and international
donors. The sealed seeds may be made available by the organization to the farmers on payment.
Threats
The project plans to build the profitability of the products. Yet, a large portion of the farmers are uneducated and are honing customary techniques for quite a while. However, to change the prevailing
mindset would be a challenge. Linking the farmers directly to the government would result in interference from the local traders
which might hinder the implementation of project.
The local markets may get to be distinctly precarious if the seeds are given to the farmers on
installment. Focusing on more than one crop as well as livestock caused damage to the crops for them being not
properly cared. Provision of seeds to the inappropriate land had also caused the crop productivity to suffer.
Application of prescribed fertilizers had not been followed by all farmers.

40 | Impact Assessment Study: Livelihood Improvement through Agriculture and Livestock Innovations
Recommendations
To give the holistic view of the project it is said to have marked a great deal of positive effects on the
production and got a positive feedback from the farmers. However, few of the recommendations are provided below:
1. Cooperative farming, at the very first place is recommended and highly appreciated for it is beneficial
for the farmers in many ways. As for it can enhance the economy of scale, access to capital, quality of life and continuity by which small farms can be raised to a level where they are comparable to the
big ones. 2. Secondly the availability of the staff within the community organizations should be ensured for
executing the project in the way which is desired. In this way the project would be competed in the due time and will not be seeking extensions.
3. Thirdly, The NRSP can also provide the farmers with the seeds at the subsidized rates through Punjab Corporation. In this way the varieties of high quality which are suitable for the area will be provided to
the farmers through which the production yield could be increased. 4. Fourthly, refresher farmer field schools are highly recommended. A part of reason for this is that in
this way the farmers would be provided with an opportunity to refurbish their skills which have been acquired by them during the training and awareness sessions.
5. At the fifth place, it is recommended to make livestock sector a center of attention reason being many of the beneficiaries were also running ranches and sell milk for earning a better livelihood. Hence,
once the sector is given required attention, the beneficiaries would get to know the benefits of timely vaccinating their cattle. In addition to it, doctors should be working for them within community
organizations, moreover awareness should be raised among the beneficiaries of the benefits of vaccines, de-worming and artificial insemination services.
6. Lastly, NRSP ought to arrange the visits of experts for the community members. Likewise, NRSP ought to guarantee the linkage between farmers and government departments. Moreover, it should
also engage farmers in healthier mechanisms to increase their productivity and the yield. NRSP also ought to arrange the visits of experts for the community members.

Impact Assessment Study: Livelihood Improvement through Agriculture and Livestock Innovations | 41
Conclusion
General venture is a win for both the parties. The organization has possessed the capacity to accomplish a
large portion of the objectives while the farmers are getting used to the new strategies as prompted by the association. Farmers however, were appreciative to the organization for giving them the chance to learn and
contend with the opportune changes. Social mobilization has been on the weaker side of the accomplishments in light of the absence of the anticipated staff accessible for smooth execution. A few
territories of the union council have been left over because of the previously mentioned reason. Moreover, it would really be an injustice not to mention the NRSP’s efforts in this regard; for the training sessions and
mindful raising campaigns had worked a great deal in revolutionizing the existing prevailing farming
techniques in the aforementioned union council. However, it can be predicted from the above report that in
the near future, the impact of the information provided to the farmers regarding both the crop enhancement and livelihood management is going to be clearly visible as compared with contrasted Union Councils of the
Region.
Farmers were deeply obliged by the efforts made by NRSP and were of the view that NRSP needs to broaden its horizon and should continue its efforts so that the whole agricultural sector could be revolutionized.

42 | Impact Assessment Study: Livelihood Improvement through Agriculture and Livestock Innovations
Annexures
Annex 1: Questionnaire
1. How much land does the HH hold? (Acres)
Owned Rented Total Land utilized for wheat Land utilized for Rice
2. What is the type of your agricultural land used for cultivation?
a) Bhari Mera / Mera (Clay + Sand Loam) b) Kalrathi (Saline) c) Sandy (Retli)
Soil and water Test:
Soil Test
1. Did you test your soil? a) Yes b) No
If yes, were the samples collected from 6 spots a) Yes b) No
If yes, did you pay for soil test? a) Yes b) No
Did you collect soil test report with recommendations? a) Yes b) No
If yes, was any mineral deficient? a) Yes b) No
If yes, which mineral was found deficient? a) Nitrogen b) Phosphorus c) Potassium d) Zinc e) Magnesium f) None
Did you apply recommended application of soil test? a) Yes b) No
If yes, what did you apply as per the recommendation? ___________________________________ _______________________________________________________________.
If not, Explain reason _______________________________________________________________
2. In your opinion, was the test beneficial? a) Yes b) No
3. Did the crop yield improved? a) Yes b) No
1 Respondent Name 7 Interviewer
2 Gender Male 8 UC Lallu Wali
3 Household ID 9 Revenue Village
4 Respondent Age 10 Settlement
5 Respondent’s relation with the Member
11 Member name
6 Education 12 LSO/VO/CO
13 District Sargodha 14 Practicing Farmer Yes No

Impact Assessment Study: Livelihood Improvement through Agriculture and Livestock Innovations | 43
Water Test
1. Did you examined the water utilized for irrigation? a) Yes b) No If yes, did you pay for water test?
c) Yes d) No
Did you collect water test report with recommendations? c) Yes d) No
What were the results of the laboratory tests? a) Water is Suitable b) Water is not suitable c) Don’t Know d) Didn’t Answer
If no, why not? a) Canal water is certified b) Water does not need to be tested c) Didn’t Know d) Didn’t Answer
Have you taken any action as per recommendations made in the results? a) Yes b) No
2. In your opinion, was the result beneficial? a) Yes b) No
3. Did the crop yield improved? a) Yes b) No
Training/Workshop on Productivity Enhancement Techniques
4. Did you attend the training on “Productivity Enhancement Techniques” for rice crop? a) Yes b) No
If yes, who conducted the training? a) NRSP staff b) Agriculture department staff c) Other
What have you learned from the training? a) Soil testing b) Quality Agri inputs selection (seed, fertilizer, weedicides etc.) c) Seed selection/germination test of seed before sowing d) Balance fertilizer application e) Irrigation time f) Crop yield g) Seed multiplication h) Seed storage i) Exposure visit of farms and Research institutes j) All the above
Wheat
1. Name the seed which you used for wheat cultivation? a) Galaxy 2013 b) Punjab 2011 c) Lasani 2008 d) Aari 2011 e) Faislabad 2008 f) Own seed g) Other
2. What was the sowing month for your wheat crop? a) October-November b) November -December c) December-January
3. How much per acre wheat seeds have you sowed? a) 50-60 kg/per acre b) Below 50-60 kg/per acre c) Above 50-60 kg/per are
4. What was the source of Seed? a. Home seed b. Market c. Borrowed from friends/relatives d. Other

44 | Impact Assessment Study: Livelihood Improvement through Agriculture and Livestock Innovations
5. If bought from market, at what price per kg? ________________ 6. Were the wheat seeds poisoned before sowing?
a) Yes b) No
7. If yes, what was the name of poison used? a) Topson-M b) David and Star c) Other ___________________________
If other, why different from above mentioned? ____________________________________________ 8. Was the process told by NRSP for mixing poison followed?
a) Yes b) No
If yes, what was the procedure? _______________________________________________________ If No, then why not? ________________________________________________________________ 9. What cropping pattern you followed?
___________________-Wheat
10. What was cultivated on the land before sowing of wheat seeds? ______________________________
11. Did you use any fertilizer in your crops? a) Yes b) No
If yes, which fertilizers were used? a) Nitrogen b) Phosphorus c) Potassium d) Urea e) DAP
12. For how many times you irrigated your wheat crops? a) 4 times b) More than 4 times c) Less than 4 times
If more than then 4 time, why? a) Sandy land needs more water b) because of hot weather the land gets dry soon c) For good wheat production d) Other
13. Have you used any pesticide spray? a) Yes b) No
If yes, did you spray the crops during rain or fog? a) Yes b) No
14. When did you harvest your wheat crops? a) March-April b) April-May c) May-June
15. What was the per acre wheat production the previous year? (Before training)
Seed variety used Per acer production Production Cost/Acre Income Generated Per maund a) Below 10 Mands/Acre b) 10-20 Mands/Acre c) 21-30 Mands/Acre d) 31-40 Mands/Acre e) 41-50 Mands/Acre f) 51-60 Mands/Acre g) Above 60 Mands/Acre
16. What was the per Acre wheat production this year? (After Training)
Seed Variety used Per acer production Production Cost/ Acer Income Generated per Mands a) Below 10 Mands/Acre b) 10-20 Mands/Acre c) 21-30 Mands/Acre d) 31-40 Mands/Acre e) 41-50 Mands/Acre f) 51-60 Mands/Acre g) Above 60 Mands/Acre

Impact Assessment Study: Livelihood Improvement through Agriculture and Livestock Innovations | 45
17. How did you utilize the production? (All should sum up)
Sold(Mands) Price/Mands Used to purchase other seeds
Which crop/ variety
Given to friend or family members
Saved for using at home
Saved for next season
Other: Total
Rice
Crop rotation patterns: 1. What cropping pattern you followed?
a) Wheat -Rice b) Wheat -Cotton c) Wheat -Maize d) wheat -Vegetable e) Wheat-Fodder
2. What was the purpose of sowing Rice? a) For seed multiplication b) To sale in market c) Both “a” and “b”
3. What method you used for sowing Rice? a) Broad-Casting Method b) Transplantation Method
Which methods did you use: For seed Multiplication
a) Manually b) Machine
For Sale in market a) Manually b) Machine
4. Which seed variety did you use? a) BAS 515 b) PS2 (Kainat) c) PAK 386 (86, Cornal Basmati) d) Basmati 2000,385,370 e) Super Basmati f) IRRI- 6 g) KS 282,434 h) Basmati 198 (Southern Punjab) i) KSK 282 (Southern Punjab) j) KS 133 (Southern Punjab)
5. What was the source of Seed? a) Punjab seed corporation b) Own seed c) Local market (Ghala Mandi) d) Other
6. What was the quantity of seeds used per acre? ____________________________
Mildew Prevention
1. Were the rice seeds poisoned before sowing? a) Yes b) No
If yes, what was the name of poison used? a) Topson-M b) Other__________________
How much quantity of poison was used/liter for one kg seeds? a) Less than 2 gram b) 2 gram c) More than 2 gram
What was the procedure of mixing poison in seeds? a) Dry method (Mixed the poison and seeds in an envelope) b) Wet method (Poured some water in a bowl and later on put seeds in it)
Seed Selection & preparation 1. Did you prepare the seed for next year?
a) Yes b) No
If Yes, did you remove other varieties and infected plants from the field where you stored the seeds? c) Yes d) No

46 | Impact Assessment Study: Livelihood Improvement through Agriculture and Livestock Innovations
Did you use the seeds that were dropped the first time while harvesting? a) Yes b) No
How did you store the seeds? a) Packed directly b) Dried under sun and packed in Topson sack and then stored in clean open dry place c) Dried under sun and stored in clean dry place
Cultivating Seedlings/buds
1. How did you separate bad seeds? a) Dipped the seeds in salted water b) Dipped in normal water c) Didn’t do anything
2. What method did you use so that the seeds produces buds?
a) Created small stacks of seeds and covered them with wet sacks for 1.5 to 2 days b) Created small stacks of seeds and covered them with wet sacks for 1.5 days c) Created small stacks of seeds and covered them with wet sacks for 2 to 3 days d) Created large stack of seeds and covered it with wet sacks for 3 to 4 days
3. Did you plough the fields before planting rice seedlings?
a) Yes b) No
If yes, did you plough in: a) Dry land b) wet land
How many times you plough? a) 1 b) 2 c) 3 d) More than 3
4. Did you use zinc during preparation of nursery? a) Yes b) No
If yes, what was the percentage of zinc used during preparation of nursery? a) 22% zinc b) 33% zinc
What was the quantity used per marla? a) 1 kg/5Marla b) 2 kg/5Marla c) 3 Kg/5Marla
5. Did you use zinc during preparation of the field? a) Yes b) No
If yes, what was the percentage of zinc used during preparation of the field? a) 22% zinc b) 33% zinc
What was the quantity used per Acre? a) 5 kg/Acre b) 10 kg/Acre c) 15 Kg/Acre
6. After the land preparation of Rice seedlings, did you divide the land to small plots? a) Yes b) No
If yes, what was the size of plots?
a) 5 Marla each plot b) 10 Marla each plot c) 15 Marla each plot d) It was random e) Other
7. How many days before transplanting rice seedling, you irrigated the field?
a) 1 day b) 2-3 days c) 3-4 days d) 4-5 days e) 5-6 days 8. Did you double plough the field in standing water?
a) Yes b) No
Preparation of nursery
9. At what time broad casting of seed buds was done? a) Day b) Evening c) Night

Impact Assessment Study: Livelihood Improvement through Agriculture and Livestock Innovations | 47
10. During Broad casting of seeds what was the water level in the field? a) 1-1.5 inch b) More than 1-1.5 inch c) Less than 1-1.5 inch
11. For how long did you keep the water before you let it out of the nursery plot?
a) Till next evening b) Till next morning
c) It was there for 2 days d) It was there for more than 2 days
12. Did you re-irrigate the nursery plot the next morning?
a) Yes b) No
Did you repeat this exercise? a) Yes b) No
If yes, for how long?
a) Less than 1 week b) 1 Week c) More than one week
13. How much water (depth) did you increase as the length of the seedling grew?
a) It remained the same b) Up to 3 inches c) Up to 5 inches d) More than 5 inches
14. Did you use Urea incase the seedlings were weak?
a) Yes b) No c) N/A
If yes, how many days before shifting the seedling into the main field? a) 3-6 days b) 7-10 days c) 11-15 d) 16-20 days
At what quantity?
a) 150 grams/ Marla b) 250 grams/Marla c) More than 250 Grams/Marla
15. How many days it took you to transfer the harvested seedling in to the main field? a) 10-20 days b) 20 to 30 days c) More than a month
16. Was the transfer completed till the end of July?
a) Yes b) No
17. What was the age of seedlings at the time of cultivation? a) 30-40 days b) Less than 30 days c) More than 40 days d) Other
18. Did you irrigate the seedling nursery before its transfer? a) Yes b) No
If yes, how many days before ______________
Main Field
19. What was the water level in the main field at the time of cultivation? a) 1.5 inch b) More than 1.5 inch c) Less than 1.5 inch d) Other
20. Crop density (2,2 plants; 9,9 Inches)
Number of seedling Distance (inches) How many days continuously water remained standing in the fields after transplanting?

48 | Impact Assessment Study: Livelihood Improvement through Agriculture and Livestock Innovations
21. Where did you put extra seedling?
a) At home b) Tied them and placed at the corner of the field in water
c) Had no extra d) Other 22. What did you do with the diseased/week seedlings?
a) Removed them b) Kept them safe for future use c) Other
Irrigation after the transfer of Seedlings
1. What was the depth of water till one week of plantation? a) 1.5 inch b) More than 1.5 inch c) Less than 1.5 inch d) Other
2. What was the depth of water after one week of plantation? a) 3 inches b) More than three inches c) Less than 3 inches d) Other
3. After putting UREA into the field did you water it? a) Yes b) No
4. What was the water level in the field at the time of fertilizer application?
a) 3 inches b) More than 3 inches c) Less than 3 inches d) Other
5. When did you stopped watering the field? a) 15 days before ripening of crop b) More than 15 days before ripening of crop c) Less than 15 days before ripening of crop d) Other
Prevention of seedling from insects
1. Did you harvest the seedling after 20th May? a) Yes b) No
2. How many times did you applied poison on the seedlings? a) Once b) Twice c) Did not apply poison
If twice
Age of seedling (days) Poison Used
Fertilizer Application
1. Which and how much fertilizers did you use?
Fertilizer Quantity
DAP
Potash
Urea
2. During fertilization, the fields were:
a) Dry b) Muddy c) Watery

Impact Assessment Study: Livelihood Improvement through Agriculture and Livestock Innovations | 49
Use of Zinc and Boron
1. Were your crops zinc or boron deficient? a) Zinc b) Boron c) No deficiency
If yes, what were the symptoms? a) Leafs of the crops turn white b) Leafs of the crops turn yellow c) Leafs get start curling at their tips d) Above all e) Other ________________________
Did you use anything to minimize the deficiency? a) Yes b) No
What did you use to minimize the deficiency? _____________________________________________
Land Preparation of the main field
1. Before the transfer of the seedlings,
How many times fields were irrigated
1st irrigation (days before the transfer of seedlings)
Did you plough the fields when moisture level dropped (Yes/No)
How many times did you plough the fields?
2nd irrigation (days before the transfer of seedlings)
2. Was the ploughing done in wet field?
a) Yes b) No
If yes, How many times: ___________________ Weed Removal 1. When did you remove the weeds from your field after plantation?
a) Within one month of plantation b) After one month of plantation c) Other
2. Did you used weedicides? a) Yes b) No
If yes, how many days after transfer of seedlings? a) Within 6 to 7 days b) Within 8 to 10 days c) Within 11 to 15 days d) Other
3. After poison/weedicide application, how long did you maintain water level in the field? a) 2 days b) 7 days c) 10 days d) 15 days
Crop diseases and prevention
1. Did your crop suffer from any disease? a) Yes b) No
If yes, Which disease? __________________________________________. Did you use any preventive measure to prevent your crop from the disease?
a) Yes b) No
If yes, what preventive measure did you take to prevent your crop from the disease? ______________________________________________________________________________________________________________________________________________.
What was the name of the poison which you used to prevent your crop from the disease? ____________________________________________________. 2. Did your crop suffer from any pest attack?
a) Yes b) No
If yes, Which pest? _____________________ 3. Did you use any preventive measure to prevent your crop from the pest?
a) Yes b) No

50 | Impact Assessment Study: Livelihood Improvement through Agriculture and Livestock Innovations
What preventive measure did you take to prevent your crop from the pest? ______________________________________________________________________________________________________________________________________________.
What was the name of the poison which you used to prevent your crop from the pest? ______________________________________________________________________________________________________________________________________________.
Production and income generation
1. Did adopting new techniques improved your income? a) Yes b) No
2. Are you satisfied with the training or workshop? a) Yes b) No
3. What new things did you learn from the training? a) Procedure of productivity enhancement, land preparation and cultivation methods b) Proper usage of pesticides and sprays c) Proper usage of fertilizers and irrigation d) Didn’t Answer e) Other___________________________________________________________________
4. What was the per acre rice production the previous year? (Before training)
Seed variety used Per acer production Production Cost/Acre Income Generated Per maund
Below 10 Mands/Acre
10-20 Mands/Acre
21-30 Mands/Acre
31-40 Mands/Acre
41-50 Mands/Acre
51-60 Mands/Acre
Above 60 Mands/Acre
5. What was the per Acre rice production this year? (After Training)
Seed Variety used Per acer production Production Cost/ Acer Income Generated per maund
Below 10 Mands/Acre
10-20 Mands/Acre
21-30 Mands/Acre
31-40 Mands/Acre
41-50 Mands/Acre
51-60 Mands/Acre
Above 60 Mands/Acre

Impact Assessment Study: Livelihood Improvement through Agriculture and Livestock Innovations | 51
6. How did you utilize the production? (All should sum up)
Sold (Kgs) Price/Kg Used to
purchase
other seeds
Which crop/
variety
Gave to friend or
family members
Saved for
using at
home
Saved for
next
season
Other: Total
Livestock
1. Existing breeds
Livestock Breed name Number
Cows/Bullocks
Buffalo
Camel
Goats/Sheep
Any other
2. How many livestock died of diseases last year?
Livestock Number Because of which disease
Cows/Bullocks
Buffalo
Camel
Goats/Sheep
Any other
Didn’t died
3. In your area, Animals suffer from which diseases? (Foot to mouth, Hemorrhagic septicemia, Fever, Blood in Urine, Failure of pregnancy etc.)
Livestock Last year Current year
Cows/Bullocks
Buffalo
Camel
Goats/Sheep
Any other
No Disease
4. Do you consider vaccination worth spending money?
a) Yes b) No c) Not Sure
5. Do you vaccinate your animals at least once in a year? a) Yes b) No

52 | Impact Assessment Study: Livelihood Improvement through Agriculture and Livestock Innovations
6. Do you have vaccination card? a) Yes b) No
7. How many animals were vaccinated last year?
Livestock Vaccinated
(Yes/No) Number If yes
Gov. Facility or Private Facility Amount Paid/Animal
Cows/Bullocks
Buffalo
Camel
Goats/Sheep
Any other
8. Have you observed any changes after initiation of regular vaccination? a) Yes b) No
If yes, what changes have you observed after initiation of regular vaccination? a) Became more active and healthy b) Diseases have been controlled c) Feed intake has increased d) Milk and meat productivity has increased e) Other
If no, how? a) Vaccines didn’t work b) Diseases have not been controlled c) Other
Deworming Details
9. Do you undertake livestock deworming regularly? a) Yes b) No
Livestock Deworming (Yes/No)
Number If yes Gov. Facility or Private Facility
Amount Paid/Animal
Cows/Bullocks
Buffalo
Camel
Goats/Sheep
Any other
10. Have you observed any changes after initiation of regular De-worming? a) Yes b) No
If yes, what changes have you observed after initiation of regular De-worming?
a) Became more active and healthy b) Diseases have been controlled c) Feed intake has increased d) Milk and meat productivity has increased e) Other
If no, how? a) De-worming didn’t work b) Diseases have not been controlled c) Other
Artificial Insemination
11. Do you think that Artificial Insemination services are important? a) Yes b) No

Impact Assessment Study: Livelihood Improvement through Agriculture and Livestock Innovations | 53
12. Who are the existing AI service providers in the area? a) Government b) NRSP c) Other
13. Did you attend any workshop on Artificial insemination services? a) Yes b) No
If yes, what you have learned? a) Animal Breeding and caring methods (meat and milk production) b) Proper insemination, vaccination and deworming c) Animal Nutrition include feed /fodder/ silage/ drinking water requirement d) Basic livestock management practices e) Animal diseases and preventive measures f) Value addition and enterprise development g) Use of electronic information technology to disseminate basic information h) Visit to animal farms i) Didn’t answer j) Don’t remember k) Other_______________________________________ l) Above all
What breeds were recommended in the workshop?
Livestock Breed Name Cows/Bullocks Buffalo Camel Goats/Sheep
14. Did you artificially inseminate your animal for breed improvement? a) Yes b) No If yes, which Breed of semen was used for Artificial Insemination?
a) Friesian Breed b) Other___________________________________________


