DEVELOPMENT AND APPLICATION OF A HYDROCLIMATOLOGICAL STREAM TEMPERATURE MODEL WITHIN SWAT Darren L. Ficklin 1 , Yuzhou Luo 2 , Iris T. Stewart 1 , Edwin P. Maurer 3 1 Environmental Studies Institute, Santa Clara University, CA 95053 2 Department of Land, Air and Water Resources, University of California, Davis, CA 95616 3 Civil Engineering Department, Santa Clara University, Santa Clara, CA 95053 Environmental Studies Institute at Santa Clara University 1 [email protected]
Transcript
DEVELOPMENT AND APPLICATION OF A
HYDROCLIMATOLOGICAL STREAM
TEMPERATURE MODEL WITHIN SWAT Darren L. Ficklin1, Yuzhou Luo2, Iris T. Stewart1, Edwin P. Maurer3
1Environmental Studies Institute, Santa Clara University, CA 95053
2Department of Land, Air and Water Resources, University of California, Davis, CA 95616
3Civil Engineering Department, Santa Clara University, Santa Clara, CA 95053
Environmental Studies Institute at Santa Clara University
Stream temperature has direct and indirect effects
on aquatic species health
Stream temperatures reflect the combined influence
of meteorological and hydrologic factors
Stream temperature strongly correlated to air temp.
Low streamflow, lower the capacity for heat storage
Snowmelt, surface runoff, and groundwater entering the
stream have different temperature signatures
2
Introduction and background
Many studies successfully model stream temp. based
solely on a relationship with air temp.
Others use a S-shaped function
3
Mohseni et al., 1998
Upper bounds
Lower bounds
Introduction and background
SWAT estimates stream temperature from relationship developed by Stefan and Prued’homme [1993]
Twater = 5.0 + 0.75 * Tair
Twater = average daily water temperature (oC)
Tair = average daily air temperature (oC)
**does not account for influence of streamflow, groundwater inflow, snowmelt
We develop a stream temp. model within SWAT that reflects the combined influence of meteorological (air temp.) and hydrological conditions (streamflow, snowmelt, groundwater, surface runoff, and lateral soil flow) on water temperature within a watershed.
4
New stream temperature model 5
Average
daily T
0.1 °C
Average
daily air T
User input T T of incoming flow
Average
daily air T
New stream temperature model
New model estimates in-stream temp. by three components:
[1] temperature and amount of local water within the subbasin
α, β, λ: calibration coefficients relating the relative contribution of the
hydrologic components to local water temp (dimensionless)
sub_snow: snowmelt contribution in subbasin (assume snowmelt temp. to be 0.1 oC)
sub_gw: groundwater contribution in subbasin (mm) with a temperature Tgw (
oC) sub_surq: surface runoff in subbasin (mm)
sub_latq: lateral soil flow in subbasin (mm)
sub_wyld: water yield in subbasin (mm)
Tair,lag: average daily air temperature with a lag (oC)
wyldsub
latqsubsurqsubTgwsubTsnowsubT
lagairgw
localw_
))__(()_()_1.0( ,
,
6
New stream temperature model
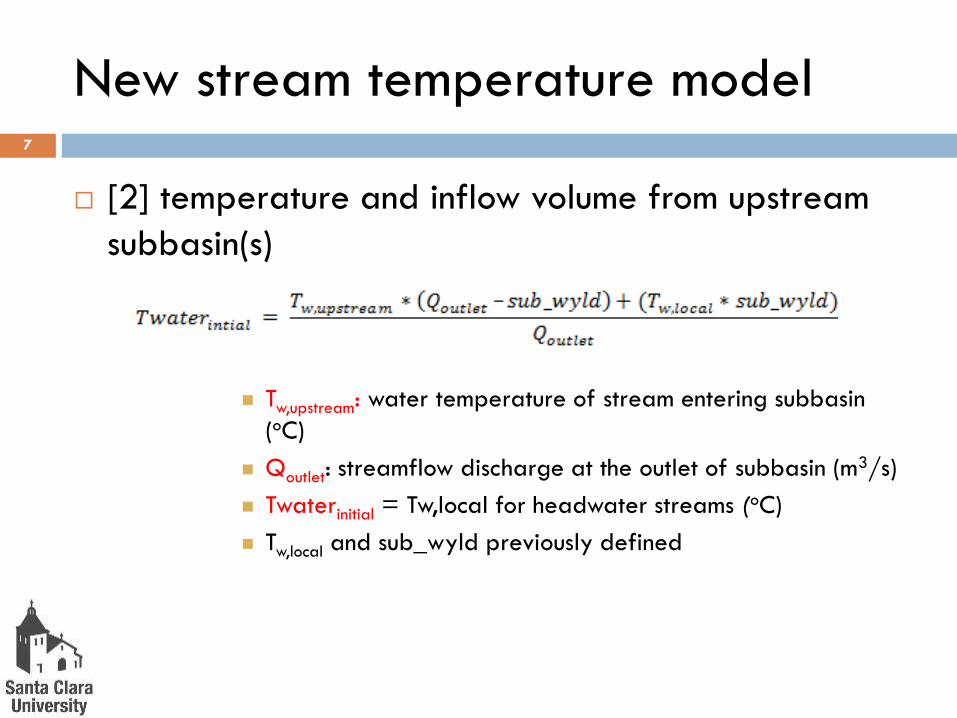
[2] temperature and inflow volume from upstream
subbasin(s)
Tw,upstream: water temperature of stream entering subbasin
(oC)
Qoutlet: streamflow discharge at the outlet of subbasin (m3/s)
Twaterinitial = Tw,local for headwater streams (oC)
Tw,local and sub_wyld previously defined
7
New stream temperature model
[3] air-water temperature transfer during the streamflow travel time in the subbasin


![Getting Started With Android Application Development [IndicThreads Mobile Application Development Conference]](https://static.documents.pub/doc/80x56/554a08edb4c9055b7a8b5843/getting-started-with-android-application-development-indicthreads-mobile-application.jpg)


