Watershed Management And Modeling Development and Application of Watershed Models for Simulation and Management of Nonpoint Source Pollutants Charles W. Downer Coastal and Hydraulic Laboratory Billy E. Johnson Environmental Laboratory Engineer Research and Development Center
Transcript
Watershed Management And Modeling
Development and Application of Watershed Models for Simulation and
Management of Nonpoint Source Pollutants
Charles W. DownerCoastal and Hydraulic Laboratory
Billy E. JohnsonEnvironmental Laboratory
Engineer Research and Development Center
Watershed Management And Modeling
Non-point Source Pollution
According to the US EPA, non-point source pollution (NPSP) Comes from many diffuse sources. Caused by rainfall or snowmelt moving over and through the ground. As the runoff moves, it picks up and carries away natural and human-
made pollutants, finally depositing them into lakes, rivers, wetlands, coastal waters, and even our underground sources of drinking water.
These pollutants include: Excess fertilizers, herbicides, and insecticides from agricultural lands and
residential areas. Oil, grease, and toxic chemicals from urban runoff and energy production; Sediment from improperly managed construction sites, crop and forest
lands, and eroding streambanks; Salt from irrigation practices and acid drainage from abandoned mines; Bacteria and nutrients from livestock, pet wastes, and faulty septic systems
Watershed Management and Modeling
Extent of Problem
In it’s 2004 Water Quality Inventory Report to Congress, the USEPA reported. A large portion of the nations water bodies do not meet water quality
standards 44% river miles 64% ponds, lakes, and reservoirs 30% of estuauries
Water quality impairment attributed to NPSP constitutes a large percentage of the impaired water bodies 65% of river miles 30% of ponds, lakes and reservoirs 40% of estuaries
Watershed Management And Modeling
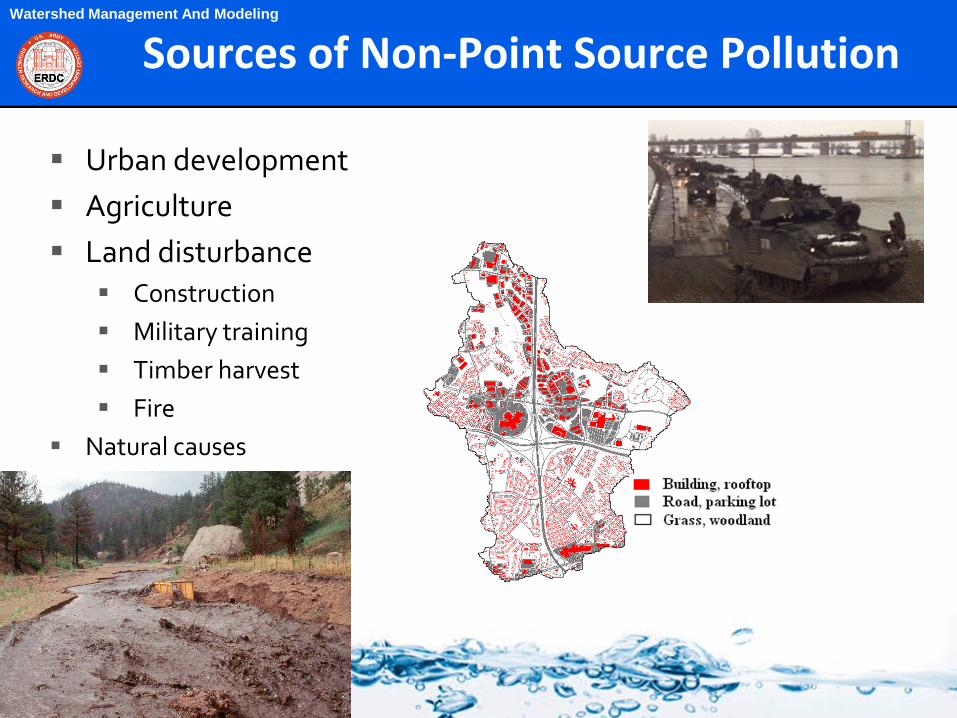
Sources of Non-Point Source Pollution
Urban development Agriculture Land disturbance
Construction Military training Timber harvest Fire
Natural causes
Watershed Management And Modeling
Programs Related to Control of NPSP
TMDL Process – Total Maximum Daily Loading Intended to allow states to meet water quality standards The total loading that will allow water quality standards to be met for a given body
of water is determined. The total loading is attributed to various sources and land owners. The reduction in total loading needed to meet the water quality standards is also
determined. This determines the amount of reduced loading from each source and/or land
owner. The EPA, state, land owners develop an implementation plan that will result in the
water quality standards being met.
Low Impact Development (LID) Development is conducted in a way to minimize the effects of urbanization on
hydrology and water quality. Water/sediments/pollutants are captured near their source with various
management practices – rain barrels, porous pavement, detention basins, etc.
Watershed Management And Modeling
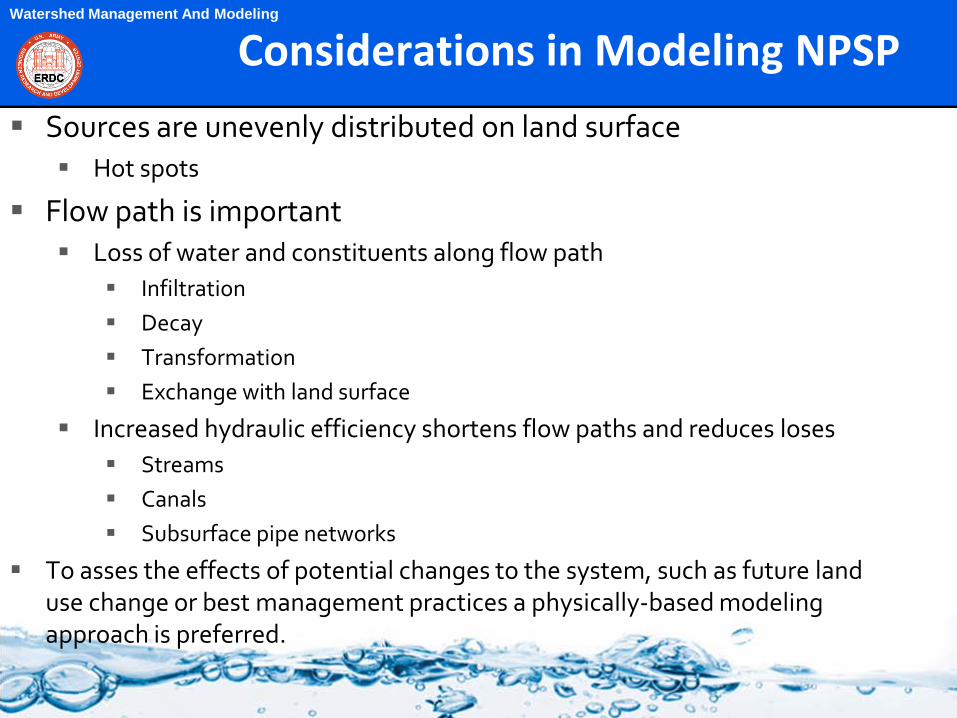
Considerations in Modeling NPSP
Sources are unevenly distributed on land surface Hot spots
Flow path is important Loss of water and constituents along flow path
Infiltration Decay Transformation Exchange with land surface
To asses the effects of potential changes to the system, such as future land use change or best management practices a physically-based modeling approach is preferred.
Watershed Management And Modeling
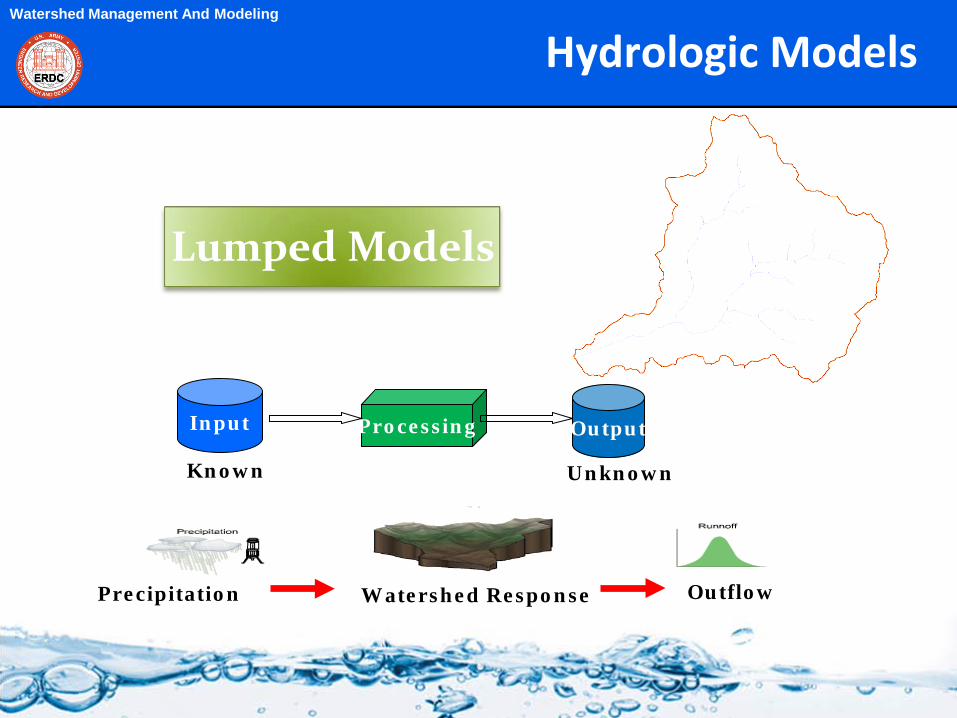
Hydrologic Models
Lumped Models
ProcessingInput Output
Known Unknown
OutflowwPrecipitation Watershed Response
Watershed Management And Modeling
Hydrologic Models
Distributed Models
Fine scale physical processes are simulated at element level Plant interception Infiltration Runoff Evapo-transpiration
Elemental responses are integrated to determine system response
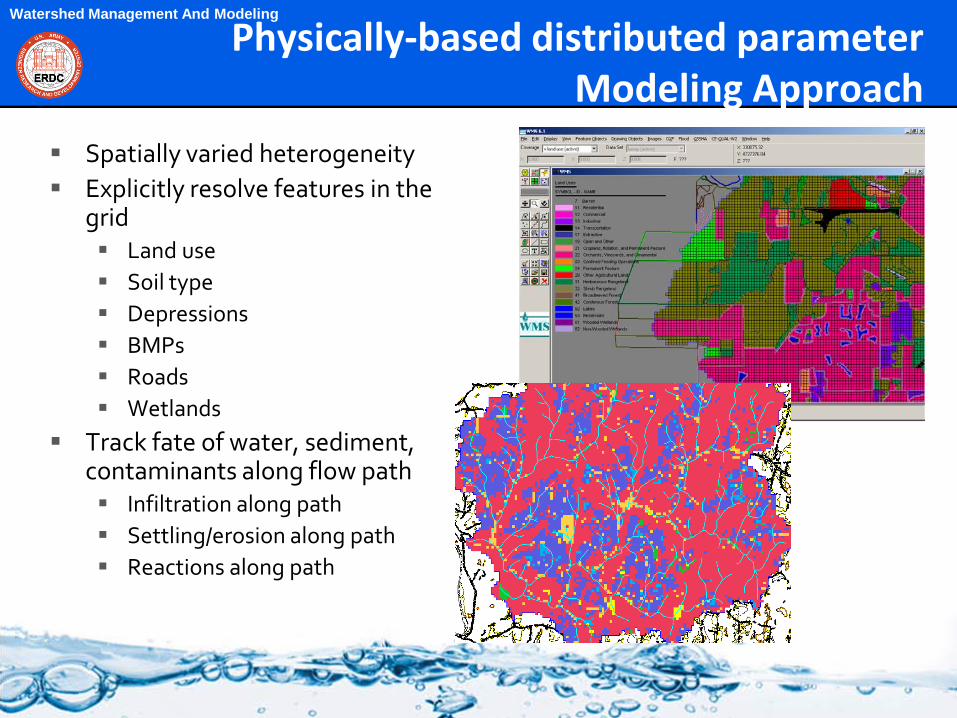
Spatially varied heterogeneity Explicitly resolve features in the
grid Land use Soil type Depressions BMPs Roads Wetlands
Track fate of water, sediment, contaminants along flow path Infiltration along path Settling/erosion along path Reactions along path
Watershed Management And Modeling
What is GSSHA?
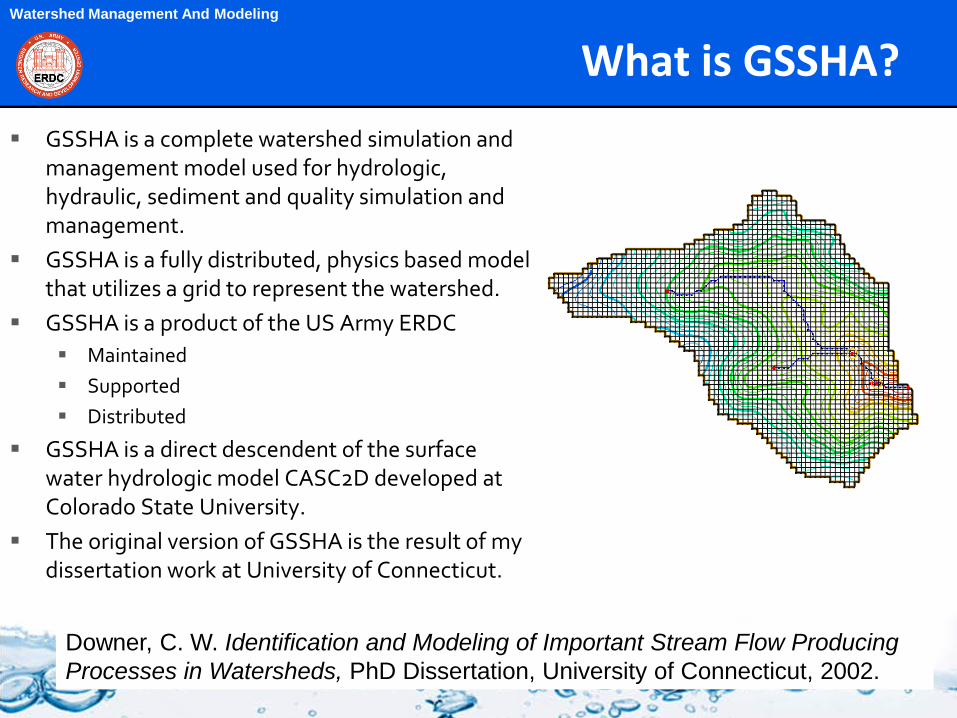
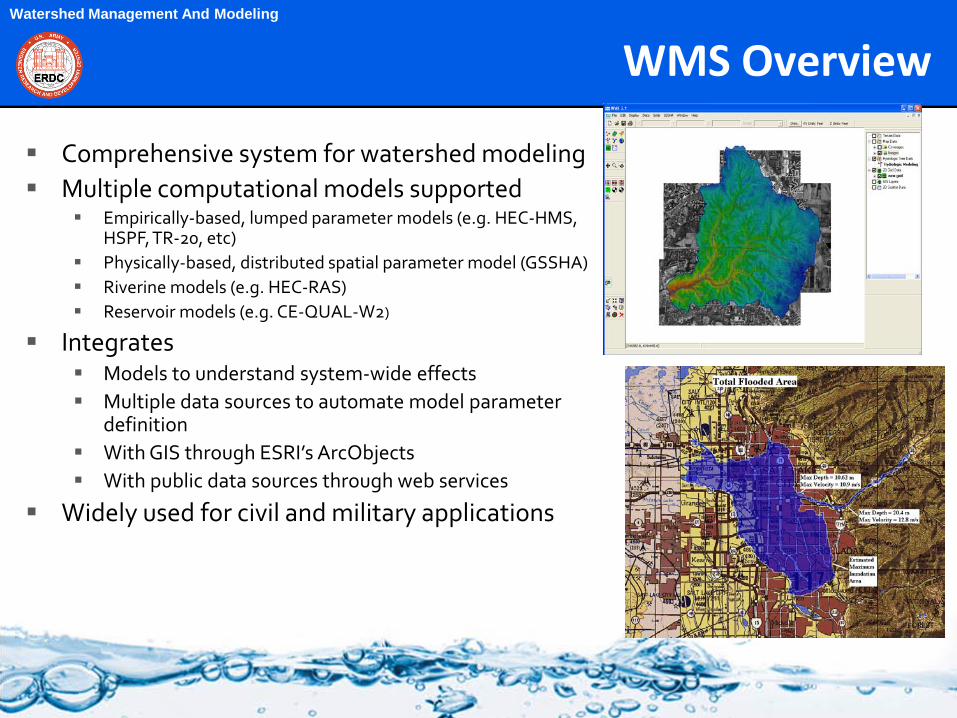
GSSHA is a complete watershed simulation and management model used for hydrologic, hydraulic, sediment and quality simulation and management.
GSSHA is a fully distributed, physics based model that utilizes a grid to represent the watershed.
GSSHA is a product of the US Army ERDC Maintained Supported Distributed
GSSHA is a direct descendent of the surface water hydrologic model CASC2D developed at Colorado State University.
The original version of GSSHA is the result of my dissertation work at University of Connecticut.
Downer, C. W. Identification and Modeling of Important Stream Flow Producing Processes in Watersheds, PhD Dissertation, University of Connecticut, 2002.
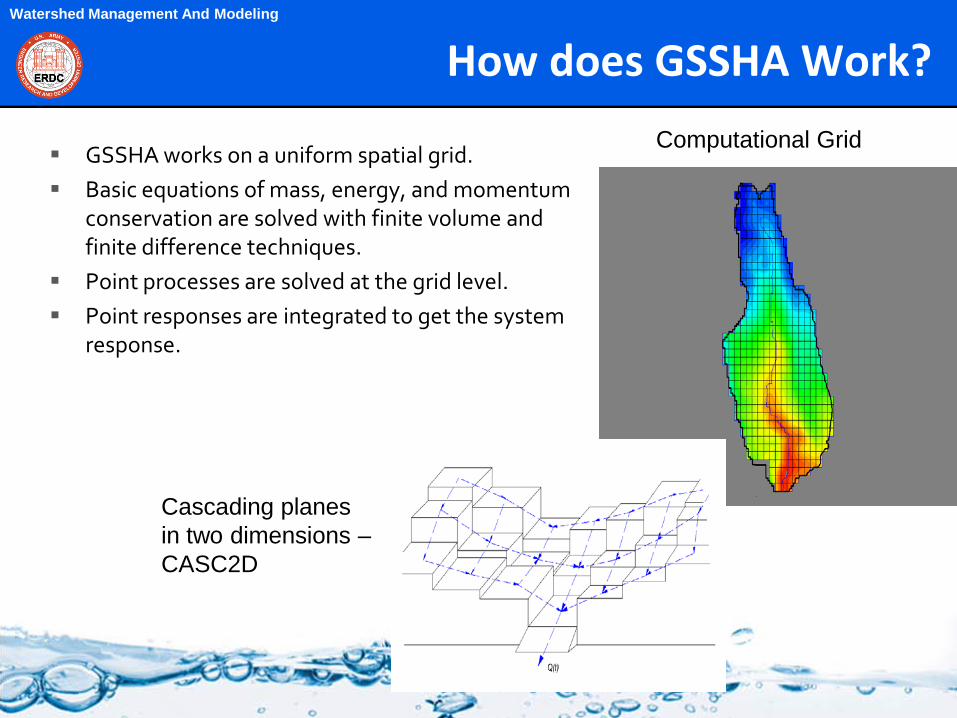
GSSHA works on a uniform spatial grid. Basic equations of mass, energy, and momentum
conservation are solved with finite volume and finite difference techniques.
Point processes are solved at the grid level. Point responses are integrated to get the system
response.
Cascading planes in two dimensions –CASC2D
Computational Grid
Watershed Management And Modeling
GSSHA
Includes special features to allow the model to explicitly resolve issues related to NPSP: Land use change BMPs Storm and tile drains Wetlands Sediment transport Constituent transport
Watershed Management And Modeling
Land Use ChangeChanging land uses lead to changing in the physical properties in the watershed and alter the stream response.
Converting natural areas to agricultural and urban areas results in more compacted soils and smoother surfaces.
Urbanization also leads to greater impervious area.
All these changes result in more runoff.
Drainage capacity is usually increased exasperating the problems of increase runoff.
All effects sediment and constituent runoff
Watershed Management And ModelingSpatial Hydrology: Dealing with
Runoff Processes Changes
Spatial effects of land use changes Where you put a commercial
zone, detention basin, or wetland changes the hydrology
Include engineered wetlands Include detention basins Planning and after-the-fact land
use changes
Watershed Management And Modeling
Storm and Tile Drains
Connected set of pipes, manholes, inlet grates
Tile drains are porous pipes that drain groundwater in agricultural areas.
Storm and tile drains increase runoff and short circuit natural treatment mechanisms.
Integrates Models to understand system-wide effects Multiple data sources to automate model parameter
definition With GIS through ESRI’s ArcObjects With public data sources through web services
Widely used for civil and military applications
Watershed Management And Modeling
Watershed Modeling
Watershed Management And Modeling
Naval Computer and Telecommunications Area Master Station Atlantic (NCTAMS) Install stormwater samplers and rain gages Build GSSHA model to calculate nitrogen
and sediment loadings Recommend BMPs, if necessary
Schofield Barracks / Makua EIS Install stream flow and stormwater
samplers Build GSSHA models to compute
sediment, nitrogen and phosphorous loadings to the near-shore environment
Recommend BMPs, if necessary
SERDP Applications Assess impacts of training, climate change
on sensitive hydrology and sediment transport situations (e.g. permafrost)
SW-2SW-1
SW-3
SW-4
Surface-water Monitoring Sites for Makua EIS and GSSHA Modeling
Military Watershed TMDL Applications
Watershed Management And Modeling
Hawaii Training Ranges EIS/TMDL Program Objectives
Maintain operation of Training Ranges in Hawaii to meet training needs:
Reduce erosion of training lands, and reduce nutrient and sediment content in streams leaving installation (all ranges).
Identify potential pathways and rates of munitions’ constituent transport from training areas. Determine whether Munitions Constituents are leaving the sites in surface water or groundwater (live fire ranges). Sampling program designed to evaluating impacts of munition constituents (explosive, metals) and nutrients (nitrogen, phosphorus) on surface water, and munition constituents on groundwater.
Validate that Depleted Uranium is not leaving live-fire training ranges (live fire ranges). Sampling for depleted uranium (DU) was added for Schofield Barracks surface water as recommended by Joint Munitions Command (JMC), AEC, as well as U.S. Army Garrison-Hawaii
Watershed Management And Modeling
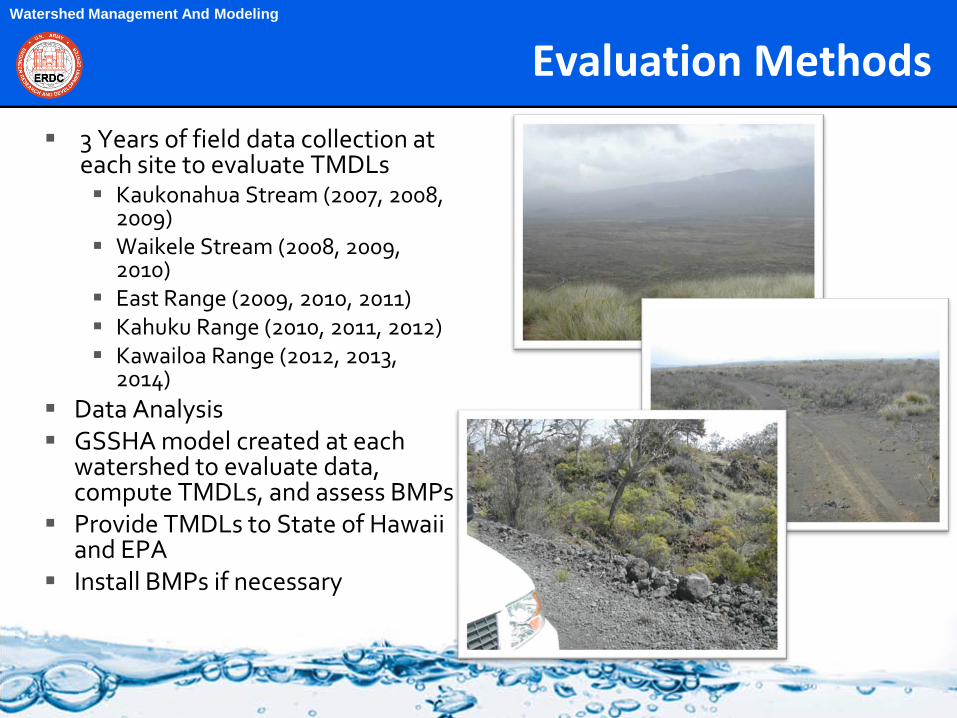
Evaluation Methods
3 Years of field data collection at each site to evaluate TMDLs Kaukonahua Stream (2007, 2008,
2009) Waikele Stream (2008, 2009,
2010) East Range (2009, 2010, 2011) Kahuku Range (2010, 2011, 2012) Kawailoa Range (2012, 2013,
2014) Data Analysis GSSHA model created at each
watershed to evaluate data, compute TMDLs, and assess BMPs
Provide TMDLs to State of Hawaii and EPA
Install BMPs if necessary
Watershed Management And Modeling
Transport of Sorbed Materials in Isolated Hotspots