Development and Characterization of Food-Grade Tracers forthe Global Grain Tracing and Recall System
KYUNG-MIN LEE,† PAUL R. ARMSTRONG,‡ J. ALEX THOMASSON,§ RUIXIU SUI,#
MARK CASADA,‡ AND TIMOTHY J. HERRMAN*,†
†Office of the Texas State Chemist, Texas Agricultural Experiment Station, College Station, Texas 77841,‡Center for Grain and Animal Health Research, Agricultural Research Service, U.S. Department ofAgriculture, Manhattan, Kansas 66502, §Biological and Agricultural Engineering Department, TexasA&M University, College Station, Texas 77843, and #Cotton Ginning Research Unit, Agricultural
Research Service, U.S. Department of Agriculture, Stoneville, Mississippi 38776
Tracing grain from the farm to its final processing destination as it moves through multiple grain-
handling systems, storage bins, and bulk carriers presents numerous challenges to existing record-
keeping systems. This study examines the suitability of coded caplets to trace grain, in particular, to
evaluate methodology to test tracers’ ability to withstand the rigors of a commercial grain handling
and storage systems as defined by physical properties using measurement technology commonly
applied to assess grain hardness and end-use properties. Three types of tracers to dispense into
bulk grains for tracing the grain back to its field of origin were developed using three food-grade
substances [processed sugar, pregelatinized starch, and silicified microcrystalline cellulose (SMCC)]
as a major component in formulations. Due to a different functionality of formulations, the
manufacturing process conditions varied for each tracer type, resulting in unique variations in
surface roughness, weight, dimensions, and physical and spectroscopic properties before and after
coating. The applied two types of coating [pregelatinized starch and hydroxypropylmethylcellulose
(HPMC)] using an aqueous coating system containing appropriate plasticizers showed uniform
coverage and clear coating. Coating appeared to act as a barrier against moisture penetration, to
protect against mechanical damage of the surface of the tracers, and to improve the mechanical
strength of tracers. The results of analysis of variance (ANOVA) tests showed the type of tracer,
coating material, conditioning time, and a theoretical weight gain significantly influenced the
morphological and physical properties of tracers. Optimization of these factors needs to be pursued
to produce desirable tracers with consistent quality and performance when they flow with bulk grains
Section 306 of theBioterrorAct of 2002 (1) administered by theU.S. Food and Drug Administration requires grain traceabilityone step forward and backward (2). For a commercial grainstorage facility serving as the first collection point, tracing grainback to the farm(s) origin and forward to a terminal grainelevator or processor is required. The EU General Food Trace-ability Regulation (EC/178/2002) (3) requires labeling and trace-ability for food and feed, including biotech grains and grainproducts, and identifying immediate suppliers or customers of theproduct. The International StandardsOrganization (ISO) offereda new food safety standard (4) on traceability in the feed and foodchain to provide general principles and requirements for thedesign and implantation of a feed and food traceability system. Atraceability system that enables rapid identification of the market
pathway will reduce business risk, improve product safety, andlower costs for recall and liability (5, 6).
Grain loaded onto a truck at the field is hauled to farmstorages, country elevators, or inland subterminals (7, 8). Grainshipped to commercial grain storage facilities is frequentlycommingled with grain from other farms. Export terminal andlarge processing facility elevators contain commingled grainsdelivered from many geographical regions in the United Statesfrom possibly thousands of farms, which greatly increases thechallenge of tracing grain to its point of origin. Competitive orcomplementary transportation modes and their paths in movinggrains between the original and final destinations are determinedby transportation accessibility, costs per mile, local requirement,and efficiency (7). Truck transportation remains the most flexiblein times and delivery routes and is the dominating transportationmode for a short haul of grains. Rail and barge transportation ispreferred over trucks for a longer haul distance, handling a largeamount of grains (7, 9).
10946 J. Agric. Food Chem., Vol. 58, No. 20, 2010 Lee et al.
Low cost and easy application to the current grain transporta-tion and processing system inmost countries would surely be oneadvantage of the proposed coded caplet traceability system overthe existing traceability systems. Even their traceability efficiencymay be improved by properlymerging the part of procedures andtechnologies obtained from the coded caplet traceability system.Using information recorded on a coded caplet and accompanyingdatabase, system participants and users can identify grain origin,movement, and quality traits even after grains are commingledand shipped to multiple distributors.
Pharmaceutical caplets are typically manufactured via a four-stage process: dispensing, granulation, compression, and pack-ing. The granulation process can be classified into five differentmethods: wet granulation, dry granulation, direct compression,fluid bed granulation, and spray-dried granulation (10). In adirect compression method, caplets are manufactured simply bycompressing the mixture of active ingredients and excipientswithout blending the powders prepared by the wet and drygranulation. Thismethod is simple, speedy, and themost advanced,and it requires less labor and processing time. Due to theseadvantages, the direct compression method was used in this studyfor tracer production. A caplet coating using poured or sprayedcoating materials (e.g., shellac, polymers, and sucrose-based syrup)in a coating pan helps keep the physical shape of a caplet frombodyfluids, protects the stomach lining, and helps control release of thecaplet ingredients (11). In this traceability system, a coating processis necessary to maintain the caplet shape and protect the markedcodes on the surface of a tracer. There are differentways ofmarkinga pharmaceutical caplet: printing with ink, embossing, debossing,and engraving (11, 12). The proposed coded traceability systemwas initially planned to apply the edible ink for imprinting tracersbefore or after coating.
The objectives of this study were to develop different types oftracers using nonadulterant food-grade materials for the grainand characterize the morphological, physical, and spectroscopicproperties of uncoated and coated tracers prior to printing IDmarkingwith a code or numerals to identify the origin of grains atany point in the grain supply chain, enabling trace back to theorigin of fields. Particularly, the spectroscopic property andspectral data processing technique were explored as tools tosubstitute time-consuming and destructive measurements fortracer quality and improve the system efficiency. The character-ization of tracers’ morphological, physical, and spectroscopicproperties before and after coating should provide scientificcriteria and guidelines to produce a tracer and coating solutionmost suitable for this proposed traceability system. On the basisof these criteria, research advances in developing tracer technol-ogy based on desirable physicochemical properties and moistureresistant tracers will improve final tracer quality and performancein bulk grain during handling and commercial storage conditions.
MATERIALS AND METHODS
Materials.Direct compressible formulations for three types of tracers,sucrose-, starch-, and cellulose-based tracers, were made of processedsugar (Di-Pac Direct Compacting & Tableting Sugar, Domino Foods,Inc., Baltimore, MD), pregelatinized starch (C*PharmaGel DC 93000,Cargill, Inc., The Netherlands), silicified microcrystalline cellulose(Prosolv 50, Penwest Pharmaceuticals Co., Patterson, NY), and magne-sium stearate (TABLETpress.NET, Athens, OH). All of the materials arefood-grade substances and free from food allergens caused by grainproteins. Tracers were coatedwith two coatingmaterials using an aqueouscoating system: pregelatinized starch (INSTANT PURE-COTE, GrainProcessing Corp., Muscatine, IA) and hydroxypropylmethylcellulose(HPMC) (Methocel K4M, Dow Chemical Co., Midland, MI). A tracerfilm coating helps improve tracer visual appearance andminimizemechan-ical damage and abrasions of the tracer and surface-printed ID code.
Tracer Preparation. The ingredients of sucrose-, starch-, and cellu-lose-based tracers were added to a V-type mixer according to the ratiospresented in Table 1 and thoroughly mixed for 60 min. The premixedformulation was then loaded into an auxiliary hopper in a tablet press(FSP-30 Single Punch Tablet Press, Minhua, Shanghai, China). Thepressure exerted on the tracer was adjusted for similar tracer hardnessamong three types of tracers using the guide-bar by considering thebinding force between particles in the formulation powder. The produc-tion rate (the number of tracers produced per minute) also needed to beoptimized to avoid variation in caplet quality and ranged between 45 and50 tracers/min. The tracer-forming die with dimensions of 11mm length�6 mm width � 4 mm height was designed for the tablet press. The tracerweight anddimensionwere frequently checked for consistent tracer qualityduring production. The manufactured tracers were placed in doubleairtight plastic bags at room temperature before coating.
Coating Processing. Two types of aqueous coating solutions wereprepared bymixing different polymers and plasticizers with distilled water(Table 2) at ambient temperature for 20 min. A 900 g batch of uncoatedtracers was loaded to a laboratory-scale pan coater (Hi-Coater, VectorCorp., Marion, IA) for coating. For application of coating solution,coating process parameters were effectively controlled while the amountsof applied coating solutions were varied to obtain theoretical coatingweight gains of 1, 2, and 3% (Table 3). Coating times and the appliedsolution amount varied to achieve desirable weight gains because thecoating solutions had different solid concentrations and the tracer volumeper batch was associated with a tracer density. Coated tracers were kept atroom temperature before morphological, physical, and spectroscopicproperties were evaluated.
TracerMorphological and Physical Properties. Individual weightsof 100 tracers for each type of uncoated and coated tracers were weighedand averaged using an analytical balance (Aldinger, Dallas, TX). Thethickness, length, and width of 25 randomly selected uncoated and coatedtracers weremeasured using a digital micrometer (Figure 1). The differenceof the averaged measurements on coated and their correspondinguncoated tracers was considered as the amount of coating material
Table 1. Direct Compressible Formulations for Three Different Types ofTracers
ingredient
sucrose-based
tracer
starch-based
tracer
cellulose-based
tracer
processed sugar 97.0 35.0
pregelatinized starch 100.0
SMCCa 64.5
magnesium stearate 3.0 0.5
a SMCC, silicified microcrystalline cellulose.
Table 2. Composition of Aqueous Coating Solutions
coating solution composition (% w/w)
pregelatinized starch pregelatinized starch (15), glycerol (2), water (83)
HPMCa HPMC (5), triethyl citrate (1), water (94)
aHPMC, hydroxypropylmethylcellulose.
Table 3. Coating Process Conditions Used for Tracer Coating with DifferentCoating Solutions to Yield 1, 2, and 3% Weight Gain Tracers
deposited on their surface (coating film thickness). For density measure-ment of tracers, the tracer pellet lot was first divided using a Boernerdivider (Seedburo Equipment Co., Chicago, IL). Four representativesamples were obtained from each lot with the divider. Each sample wasused to fill a multipycnometer cup leaving 1/16 to
1/8 in. of space on top.Particle density was then measured using a helium-gas multipycnometer(modelMVP-1, QuantachromeCorp., Syosset,NY).Moisture adsorptionrates of tracers were quantified by weighing approximately 10 g of tracers,
placing them into mesh bags, and allowing them to adsorb moisture in anenvironmental chamber maintained at 80%RH and 20.5 �C. Tracers wereexposed to these conditions for 0, 4, 24, and 48 h. Moisture content was
then determined using ASABE Standards (13) for wheat. Triplicatemeasurements were made, and average moisture was reported. Thismethod was also used to condition tracers for the subsequent physical
tests described below. Shear strength was determined by placing tracers ina shear box designed to shear tracers transverse to the long axis of the
tracer. Shearing was in the direction of the shorter cross-sectional dimen-sion designated as width in Figure 1. A stepper motor attached to a loadcell provided deformation and force measurements. A personal computer
(PC) was used to control the motor and sense load cell force measure-ments. The deformation rate was 2.5 mm/s. Five tracers were tested foreach moisture conditioning period and average results reported. Com-
pression strength of the tracers was performed using the same PC, steppermotor, and load cell apparatus. Tracers were placed on a horizontalplatform with the width of the tracer oriented vertically. Loading was
essentially between parallel plates. The tracer was loaded until failure andthe peak force recorded. Five tracers were tested for each moisture con-
ditioning period and average results reported. Tracer abrasion resistancewas tested using a tangential abrasive dehulling device (TADD) (VenablesMachine Works Ltd., Saskatoon, SK, Canada). Approximately 10 g of
tracers was weighed and then ground in the TADD for 10 s, removed,weighed, and reground for an additional 10 s. Weights prior to grindingand after 10 and 20 s of grinding were recorded as measures of abrasive
resistance. Two replicates were done for each conditioning period andaverage results reported.Weightswere normalized to the originalweight ofthe sample for easier comparison. Normalized weight is thus the decimal
percentage of material remaining after each grind.Raman Spectroscopy. Raman spectra for ingredient powders and
manufactured tracers were recorded on RamanStation 400F (Perkin-Elmer, Beaconsfield, Buckinghamshire, U.K.) interfaced with Spectrum(v. 6.3) software in the Raman shift range from 200 to 3500 cm-1 using anear-infrared laser light source of 785 nm at 350 mW and a 256 � 1024pixel CCD detector. The powder and tracer samples were placed on thewell plate, and theirRaman spectrawere collected at a resolutionof 8 cm-1
from the large sample spot consisting of six locations around the centeredlocation with exposure times of 1 sec and 10 scans at the sample location.The spectra from seven locations were co-added to give a single spectralfile. Ten samples selected from different types of ingredient powders andtracers were analyzed for this study.During the spectra measurements, thepowder and tracer samples were stored in screw-capped glass bottles atroom temperature. Prior to the spectral analysis, the collected spectra werebaseline corrected andnormalized to reduce variation inRaman signal dueto subtle changes in experimental conditions. Multivariate statistical tech-niques such as principal component analysis (PCA) and cluster analysiswere performed for spectral data reduction and tracer classification.
Statistical Analysis. A four-factor factorial design was employedin this study. The effect of four factors, including the type of tracer,coating material, a theoretical weight gain, and conditioning period, was
investigated on themorphological and physical properties (weight, dimen-sion, moisture content, peak compression force, peak shear force, andTADDabrasion) of uncoated and coated tracers (Table 4). General linearmodel analysis using the SAS ProcGLMprocedure was used to determinethe effect of the four factors. Themeans of themorphological and physicalproperties of tracers were compared using least significant difference(LSD) and least-squares means (LSMeans) using the PDIFF option. Allstatistical analysis was conducted by SAS software (14).
RESULTS AND DISCUSSION
Properties of RawMaterials.Three food-grade substanceswereused for manufacturing tracers with a single punch tablet pressbecause they have suitable binding property, flowability, andcompressibility in direct compression formulations. Sucrose usedfor a sucrose-based tracer is a processed sugar powder withdextrin, the flowability and compressibility of which are desirablefor a direct compression method involving a tablet press. Thissucrose powder contains many hydroxyl groups of chains thatmost likely react with water molecules under certain atmosphericconditions. Starch used for starch-based tracers is partiallypregelatinized maize starch without allergens requiring labelingby the European Food Labeling Directive 2000/13/EC (15) andthe U.S. Food Allergen Labeling and Consumer Protection Act(FALCPA) of 2004 (16). This pregelatinized starch possesses ahigh binding capacity, low friability, and good compressibilityand flowability without a lubricant, resulting in acceptable tracerhardness. The degree of starch gelatinization affects the crystal-linity of the starch molecule so that it may modify the physical,structural, and hygroscopic properties of powder, tracer, andcoating formation on a starch-based tracer (17,18).Microcrystal-line cellulose (MCC) has been used as a filler and binder inpharmaceutical tabletting, but it has a problem in the compres-sion property, that is, much lower tensile strength after wetgranulation (19). Contrarily, despite its similar structure to thatof MCC (20), silicified microcrystalline cellulose (SMCC) usedfor a cellulose-based tracer has an ability to retain compactionproperties after wet and dry granulation. In addition, SMCC hasother beneficiary characteristics with respect to mechanicalproperties over conventional MCC (19).
TracerManufacturing.Adirect compressionmethod involvinga tablet press appeared to be ideal for producing a tracer becausethe production of tracer was simple, fast, and economical while
Figure 1. Bar-coded tracer and tracer dimension.
Table 4. Four Factors in the Factorial Design
factor type and level
type of tracer (3) sucrose-based tracer
starch-based tracer
cellulose-based tracer
coating material (2) pregelatinized starch
HPMCa
theoretical weight gain (3) 1, 2, and 3%
conditioning period (4) 0, 4, 24, and 48 h
aHPMC, hydroxypropylmethylcellulose.
10948 J. Agric. Food Chem., Vol. 58, No. 20, 2010 Lee et al.
easily managing tracer quality consistency in terms of its appear-ance, weight, dimension, and physical properties. The appliedpress pressure to compact a formulation varied with the type oftracer due to difference in the flowability and compressibility ofthe formation. In addition to a compacting force, the tracerproduction rate was also optimized for each type of tracer.Inappropriate use of a production rate caused overload andjamming in the tablet press and larger variation in tracer quality.A starch-based tracer was manufactured using 100% pregelati-nized starch without other additives due to its good flowabilityand compressibility resulting from starch structural changescaused by gelatinization. With starch polymers, if amorphousregions are dominant, the chains are less ordered and moreflexible, resulting in molecular rearrangements during the com-pression process (17). On the contrary, direct compression ofSMCC was not sufficient to produce a tracer with appropriatehardness, requiring magnesium stearate for lubrication and aprocessed sugar for improved binding strength (Table 1). When atracer formulation is compressed, themolecules of a substance arerearranged and become closely packed. This molecular packedstructure can increase the crushing strength of tracers (21).When higher compacting forces are applied to tracers, increasedshearing and compression forces are expected due to a tightlycompact structure. Water penetration is more difficult in such astronger packing structure at swelling (17).
Tracer Coating. The surface of the film coating applied to thetracers was found to be smooth with no defects, although therewas a characteristic difference among the tracer types and coatingsolutions. With uniformity of coating mass deposition over thetracer surface, surface roughness can be considered to be anindicator of tracer quality. Improved coating quality can beachieved by strictly optimizing crucial coating process conditionssuch as coating and drying temperature, tracer surface properties,solubility and viscosity of coating solution, and adequateatomization (22-24). Tracer-to-tracer variation in coating is animportant factor to be measured to characterize the coatingprocess. Thus, coating variation can serve as a diagnostic toolto identify a defective coating process and assess new processes.
An aqueous film coating system was formulated to prepare apregelatinized starch coating solution and an HPMC coatingsolution inwhich 15%pregelatinized starchwith 2%glycerol and5% HPMC with 1% triethyl citrate were dissolved, respectively(Table 2). Starch properties and coating process parameterssuch as starch source, starch glass transition temperature, starch
dissolution in water, drying temperature, and the moisturecontent of the samples are known to affect the crystallinity ofstarch coating films associated with the rheological and mecha-nical properties of the coated tracers (25-27). HPMC coatingsolution applied under similar coating process conditions forpregelatinized starch produced a coating film without significantdefects in the physical appearance of the coated tracer. HPMC isknown to be less sensitive than starch to the inlet air temperatureon the physical appearance and mechanical properties (28).Typically, plasticizers such as glycerol and triethyl citrate areadded to the coating formulation to help improve the smooth-ness, ductility, and flexibility of the coating. The plasticizers usedin this study are considered tomodify starch andHPMCcoatingsby weakening the intermolecular attraction between the polymerchains, improving the flexibility and extensibility of the coatingfilm (29-30). An increase in plasticizer concentration is expectedto decrease the mechanical strength of the coated tracers (24).
Overall Characteristics and Properties of Tracers. Each type oftracer required different tablet press settings and a compactingforce for the appropriate tracer production. Accordingly, themanufactured tracers were distinctive in weight, dimension,physical, and spectroscopy properties among the types of tracersbefore and after coating. The results of analysis of variance(ANOVA) (Table 5) and mean comparison tests showed thatthe type of tracer was the most influential factor on moisturecontent and peak shear force, whereas a conditioning period hadthe most significant effect on peak compression force in bothcoated and uncoated tracers.
Uncoated tracers were conditioned at 80%RHand 20.5 �C for0, 4, 24, and 48 h, which is equivalent to equilibrium relativehumidity (ERH) condition for corn at approximately 20% MCwb. Under this condition, sucrose-based tracers absorbed moremoisture than the other two types of tracers and disintegratedafter a few hours of conditioning. Therefore, they could not betested for subsequent physical propertieswithout coating. Coatedstarch-based tracers had a rougher surface than the other twotypes of tracers and apparent pores and flaws on the exterior oftracers. The surface porosity and the pore structure networks ofuncoated and coated tracers are known to be associated withwater absorption and penetration and the amount of imbibedmarking ink into a unit mass of sample (31). The homogeneousmatrix of coating likely indicates its good structural integrity (27),which improves the mechanical properties of the coated tracers.The pores and cracks of uncoated tracers seemed to influence the
Table 5. Analysis of Variance (ANOVA) for Moisture Content and Physical Properties of Coated Tracersa
MC compression shear TADD20
sourceb F value P value F value P value F value P value F value P value
CON � tracer � WG 11.7 <0.0001 0.8 0.6542 0.7 0.7966 0.6 0.8568
aMC, moisture content (% wb); compression, peak compression force (N); shear, peak shear force (N); TADD20, weight loss after 20 s of grinding in the TADD (tangentialabrasive dehulling device). bCoat, coating material; CON, conditioning time (h); tracer, type of tracer; WG, theoretical weight gain (%). cResults in bold indicate significance levelat the 0.01.
structural integrity and roughness of film coating on the surfacebecause sucrose-based tracers with a smoother and glossier sur-face showed greater moisture and abrasion resistance of filmcoatings than starch-based tracers when the same coatingmaterial was used. In addition to these factors, tracer manufac-turing parameters including compacting force, coating materialadditives, and coating process conditions also appeared toinfluence the morphological and mechanical properties of tracersdue to the physicochemical and structural changes in tracerpolymers induced by the parameter changes. Therefore, tracerswith appropriate durability and sustainability during grainshipping and handling would be obtained by controlling andoptimizing the manufacturing parameters.
Tracer Weight and Dimension. The tracer weight proportion-ally increased with a theoretical weight gain (%) after coating(Table 6). The increased amount of coating weight was slightlylarger in HPMC-coated starch- and cellulose-based tracers thanthe same tracers with pregelatinized starch coating. However,there was no increase in tracer weight between uncoated starch-based tracer and the pregelatinized starch-coated tracer with 1%weight gain, which may be attributed to poor coating processcontrol and a large variation in uncoated tracer weight. Thestatistical analysis showed significant interaction between the
type of tracer and the coating material on the tracer weight(P<0.01). Apparently, the tracer weight increase by coatingvaried with the type of tracer and coating material. The tracerweight variation was relatively small. The CV (%) of tracerweight was under or slightly over 1.0% in all uncoated andcoated tracers (Table 6). As expected from the above observa-tions, starch-based tracer and pregelatinized starch coatingshowed a larger weight CV (%) than sucrose- and cellulose-basedtracers and HPMC coating, respectively. It is speculated that thebetter flowability and compressibility of the tracer formulationresulted in the smaller weight variation in sucrose- and cellulose-based tracers (32, 33).
The uncoated tracer thickness is different between tracers; inorder of thickness, sucrose-, starch-, and cellulose-based tracersshowed decreasing thickness (Table 7). The length and width ofsucrose-based tracers, however, were the thinnest, although thesame die configuration was used to compress the tracer formula-tions. This difference in dimension of uncoated tracers can beattributed to the difference in the flowability, compressibility, andcompactibility among the formulations. In fact, sucrose-basedtracers were compressed at the lower pressure tomanufacture thetracer with a hardness similar to that of the other two typesof tracers.
Table 6. Mean Weight of Sucrose-, Starch-, and Cellulose-Based Tracers before and after Coatinga
a Total number of measurements for each type of tracers (n) = 100. b Theoretical weight gain (%) of uncoated tracers after coating. cCV, coefficient of variation (%). dHPMC,hydroxypropylmethylcellulose. eWithin each type of tracer, data followed by the same letter are not significantly different at P < 0.01.
Table 7. Mean and Its Difference in Dimension between Uncoated and Coated Tracers a
thickness (mm) length (mm) width (mm)
tracer and coating type weight gainb (%) mean diffc mean diff mean diff
a Total number of measurements for each type of tracers (n) = 25. b Theoretical weight gain (%) of uncoated tracers after coating. cMean difference was calculated bysubtracting themean of uncoated tracer from that of the coated tracer. dHPMC, hydroxypropylmethylcellulose. eWithin each type of tracer for each dimension, data followed by thesame letter are not significantly different at P < 0.01.
10950 J. Agric. Food Chem., Vol. 58, No. 20, 2010 Lee et al.
After coating, all dimensions of thickness, length, and widthincreased with a theoretical weight gain. However, the increase ofcoating film thickness was not the same on each dimension.Apparently, all dimensions of the tracer were not equally exposedto the spray coating. The shape of the cellulose-based tracerappeared to be less feasible for the equal exposure of all dimen-sions to coating material. In pregelatinized starch coating, therewas no difference in length between uncoated cellulose-basedtracer and 1% weight gain cellulose-based tracer and a smallerdifference between 2% and 3% weight gain coated tracerscompared to other types of tracers. This can be attributed to lessexposure of the side of the tracer length to coatingmaterial duringcoating process. This nonuniform coating thickness on the tracersurface may be resolved by using a higher coating pan speed (34).Increasing pan speed tumbles tracers to create more frequency ofexposure to the coating material and improve the coatinguniformity. The coating film thickness is also known to beaffected by air atomization pressure (35).
Similar to tracer weight, variations in the tracer dimensionswere small. The CV (%) of the tracer dimensions were <1% forthickness, length, and width in all coated and uncoated tracers(data not shown). The thickness and width CVs of coated tracerswere not significantly different from those of uncoated tracers,indicating that the variations of coated tracers originated morefrom the uncoated tracers than coating process. HPMC-coatedcellulose-based tracers showed the lowest CV (%), which isalmost equal to that of uncoated cellulose-based tracer. Thevariation in coating film thickness is crucial because it caninfluence mechanical properties and other tracer qualities (25).
Statistical analysis showed that type of tracer, coatingmaterial,weight gain, and their interactions had a significant effect on thefinal tracer dimension. The tracer dimension significantly differedwith the type of coating material (P<0.01). The HPMC coatingsolutionproduceda tracerwith a thicker film coating.An increaseof coating thickness caused by coating application depended onthe type of tracer (P < 0.01). The three types of tracers with thesame theoretical weight gain exhibited a different coating thick-ness in the application of the same coatingmaterial. Thismight bedue to the difference in the exterior and interior structuralproperty between uncoated tracers (36). These results seem todemonstrate that the combination of the type of tracer andcoating material needs to be optimized to produce tracers ofbetter quality and performance.
Moisture Absorption of Tracers.After conditioning at 80%RHand 20.5 �C for 0, 4, 24, and 48 h, the moisture content (MC) oftracers increased andwas almost double the initial content at 48 h(Figure 2). Uncoated starch-based tracers appeared to absorbmore moisture than cellulose-based tracers. Starch-based tracersrevealedmoisture absorption behavior similar to that of wheat ormaize, whereas cellulose-based tracers did not absorbmuchwaterafter 24 h of conditioning. Starch-based tracers are hygroscopicand contain abundant hydroxyl groups of amylose and amylo-pectin chains for fast hydration. The absorbedwater is thought toserve as a plasticizer in starch-based tracers, changing therheological and mechanical properties of tracers (22, 37). Dis-solution of uncoated sucrose-based tracers is attributed to thehydration of hydroxyl group of sucrose molecules. Conversely,the cellulosemolecule has a low tendency to absorbmoisture. Thetrue and bulk density of the matrix is an important factor that isinversely correlatedwith porosity andwater penetration (38-41).In this study, cellulose-based tracers exhibited a higher density(1.545 g/cm3) than the starch-based tracers (1.487 g/cm3). With alower hygroscopic property, the higher density andmore compactstructure of cellulose-based tracers might result in less moistureuptake. The higher equilibrium water content of starch-based
tracers is also considered to be associated with a more porousstructure of the tracer surface (mainly fine pores) and internaltexture (larger pores) (34, 42).
The ANOVA test results showed that the moisture content ofcoated tracers was significantly influenced by the type of tracer,coatingmaterial, conditioning period, and theoretical weight gain(P<0.01) (Table 5). The increase ofmoisture content inHPMC-coated tracers was a little lower than that of uncoated tracersconditioned for 4 h in starch-based and cellulose-based tracers.The moisture content increased in proportion to a theoreticalweight gain in coated sucrose- and cellulose-based tracers during
Figure 2. Moisture content (% wb) of tracers with different weight gainsunder conditioning at 80% RH and 20.5 �C for 0, 4, 24, and 48 h. UN, PS,and HC represent uncoated tracer, pregelatinized starch coating, andHPMC coating, respectively. Numbers following PS and HC indicate thepercent of weight gain by coating application. Uncoated sucrose-basedtracers were not tested due to the dissolution during conditioning. Withineach type of tracer, data followed by the same letter are not significantlydifferent at P < 0.05.
conditioning. However, starch-based tracers did not show asignificant moisture increase accompanied by a weight gain,presumably due to being close to the maximum water absorptioncapacity in the early conditioning period. The use of pregelati-nized starch in the tracer formulation and coating material maybe considered as a factor to contribute to the higher moistureuptake in starch-based tracers and pregelatinized starch-coatedtracers because starch gelatinization can lead a molecularreorganization to increase water absorption capacity (27).
As for coating material, sucrose- and cellulose-based tracerscoated byHPMC showed lower moisture contents than the sametypes of tracers coated with pregelatinized starch. However,starch-based tracers showed an opposite tendency, that is, slightlyhigher moisture content for HPMC-coated tracers. This demon-strates that the final moisture content of coated starch-basedtracers was mainly determined by higher hygroscopic pregelati-nized starch ingredient in a tracer rather than HPMC filmcoating. In all three types of coated tracers, the increase ofmoisture content from 24 to 48 h of conditioning was higher inpregelatinized starch coating than HPMC coating. It is knownthat the pregelatinized starch film is relatively more sensitive tohumidity and becomes unstable in a high-moisture environment(27). In addition to pregelatinized starch in a coating formulation,the hygroscopic character of the plasticizer added to the formula-tion may increase that of pregelatinized coating films. Theplasticizer is related to the structural modification of the polymernetwork to make the coating film favor water adsorption andprevent fracture of the filmduring handling and storage (27). As aresult, the concentration of plasticizer can affect the mechanicaland rheological properties of the coating film (22, 37).
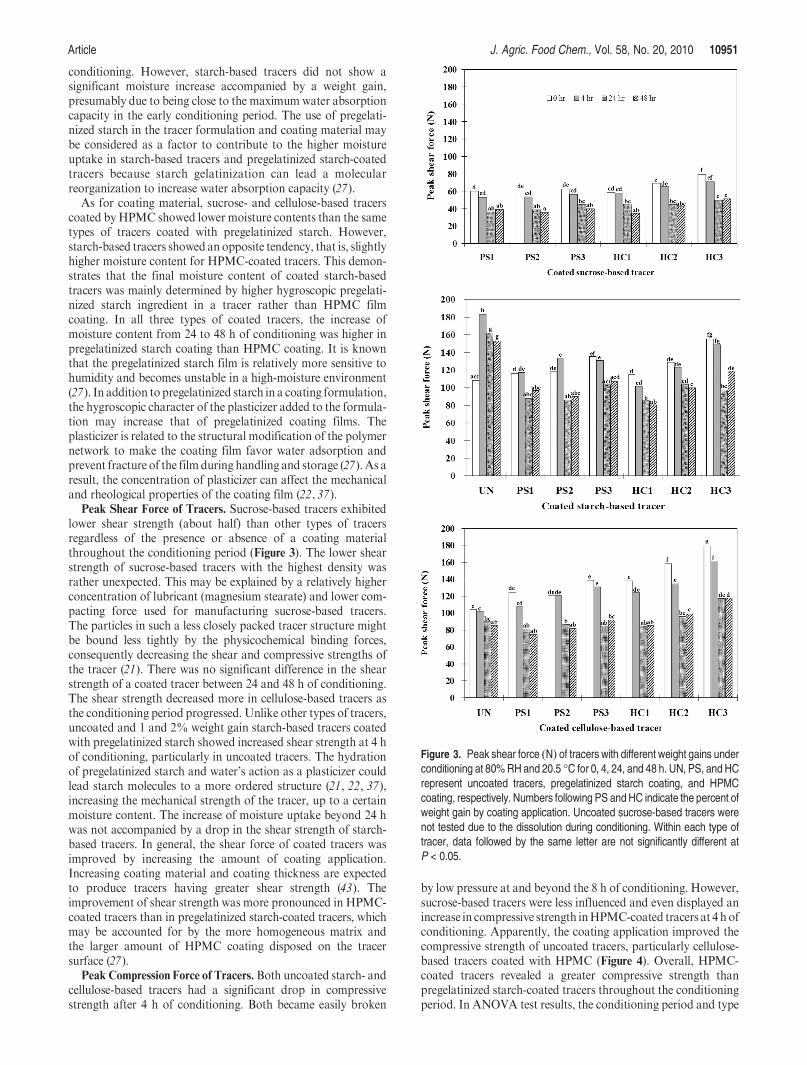
Peak Shear Force of Tracers. Sucrose-based tracers exhibitedlower shear strength (about half) than other types of tracersregardless of the presence or absence of a coating materialthroughout the conditioning period (Figure 3). The lower shearstrength of sucrose-based tracers with the highest density wasrather unexpected. This may be explained by a relatively higherconcentration of lubricant (magnesium stearate) and lower com-pacting force used for manufacturing sucrose-based tracers.The particles in such a less closely packed tracer structure mightbe bound less tightly by the physicochemical binding forces,consequently decreasing the shear and compressive strengths ofthe tracer (21). There was no significant difference in the shearstrength of a coated tracer between 24 and 48 h of conditioning.The shear strength decreased more in cellulose-based tracers asthe conditioning period progressed. Unlike other types of tracers,uncoated and 1 and 2% weight gain starch-based tracers coatedwith pregelatinized starch showed increased shear strength at 4 hof conditioning, particularly in uncoated tracers. The hydrationof pregelatinized starch and water’s action as a plasticizer couldlead starch molecules to a more ordered structure (21, 22, 37),increasing the mechanical strength of the tracer, up to a certainmoisture content. The increase of moisture uptake beyond 24 hwas not accompanied by a drop in the shear strength of starch-based tracers. In general, the shear force of coated tracers wasimproved by increasing the amount of coating application.Increasing coating material and coating thickness are expectedto produce tracers having greater shear strength (43). Theimprovement of shear strength was more pronounced in HPMC-coated tracers than in pregelatinized starch-coated tracers, whichmay be accounted for by the more homogeneous matrix andthe larger amount of HPMC coating disposed on the tracersurface (27).
Peak Compression Force of Tracers. Both uncoated starch- andcellulose-based tracers had a significant drop in compressivestrength after 4 h of conditioning. Both became easily broken
by low pressure at and beyond the 8 h of conditioning. However,sucrose-based tracers were less influenced and even displayed anincrease in compressive strength inHPMC-coated tracers at 4 h ofconditioning. Apparently, the coating application improved thecompressive strength of uncoated tracers, particularly cellulose-based tracers coated with HPMC (Figure 4). Overall, HPMC-coated tracers revealed a greater compressive strength thanpregelatinized starch-coated tracers throughout the conditioningperiod. In ANOVA test results, the conditioning period and type
Figure 3. Peak shear force (N) of tracers with different weight gains underconditioning at 80%RHand 20.5 �C for 0, 4, 24, and 48 h. UN, PS, and HCrepresent uncoated tracers, pregelatinized starch coating, and HPMCcoating, respectively. Numbers following PS andHC indicate the percent ofweight gain by coating application. Uncoated sucrose-based tracers werenot tested due to the dissolution during conditioning. Within each type oftracer, data followed by the same letter are not significantly different atP < 0.05.
10952 J. Agric. Food Chem., Vol. 58, No. 20, 2010 Lee et al.
of tracer were more significant factors on the peak compressionforce of coated tracers, whereas the compressive strength did notincrease proportionally as weight gain and coating film thicknessincreased (Table 5). Prior to conditioning, the compressionstrength of HPMC-coated tracers was positively correlated withweight gain. However, starch- and cellulose-based tracers coatedwith pregelatinized starch did not exhibit the greatest compres-sion force at 3% weight gain. This nonproportional increase ofcompression strength with weight gain and film thickness inpregelatinized starch coating might be attributed to an increasein flaw or weakness of film coating with a weight gain (25).Fundamentally, the compressive strength of tracers should with-stand pressures during grain storage and handling. The tracers
tested in this study appeared to be strong enough using Janssen’sequation (44) to estimate pressures at the bottom of storage binsof various dimensions.
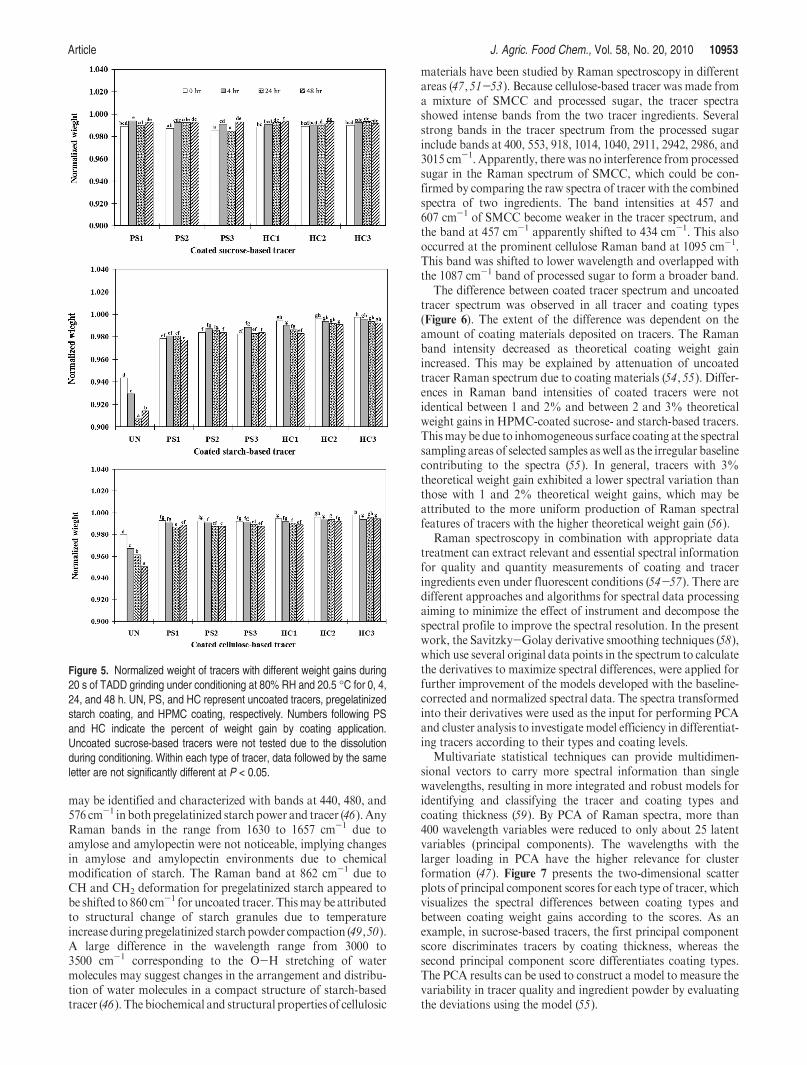
Tangential Abrasive Dehulling Device (TADD) Test of Tracers.Unlike any other physical property, the ANOVA results showedthat coating material was the most influential factor followedby the type of tracer on weight loss during grinding (P < 0.01)(Table 5). In general, HPMC-coated tracers had less weight lossthan pregelatinized starch-coated tracers, depending on the typeof tracer and the conditioning period. The nonplasticized HPMCcoating film has rheological and mechanical properties similar tothose of the nonplasticized starch coating film, whereas theplasticized HPMC coating film is more flexible and less brittle,whichmay help protect the tracer againstmechanical damage andweight loss during grinding (22). Weight loss of tracers bygrinding increased with grinding time within the range of0-20 s regardless of coating application (Figure 5). Starch-basedtracers were more susceptible to weight loss than other types oftracers by grinding. Sucrose-based tracers had a similar weightloss in both coating materials, which was more pronounced after20 s of grinding, implying that the lesser weight loss of sucrose-based tracers wasmore associatedwith the tracer itself rather thanthe type of coating material. The conditioning period, the majorinfluential factor on the other physical properties of tracers,significantly affected weight loss at 20 s of grinding (P =0.0135). Zero hour conditioning produced the least amount ofweight loss in uncoated tracers, but not in coated tracers. Aweight loss of HPMC-coated tracers generally increased withconditioning period. Contrarily, an inconsistent weight loss withconditioning period was observed in pregelatinized starch-coatedtracers. This might be explained by the fact that starch coatingmaterials are sensitive to humidity and become unstable (27,45).An increase of coating weight gain led to less weight loss ofHPMC-coated tracers,whereas a coatingweight gain appeared tobe uncorrelated to weight loss in pregelatinized starch-coatedtracers.
Data Analysis and Multivariate Statistical Analysis of Raman
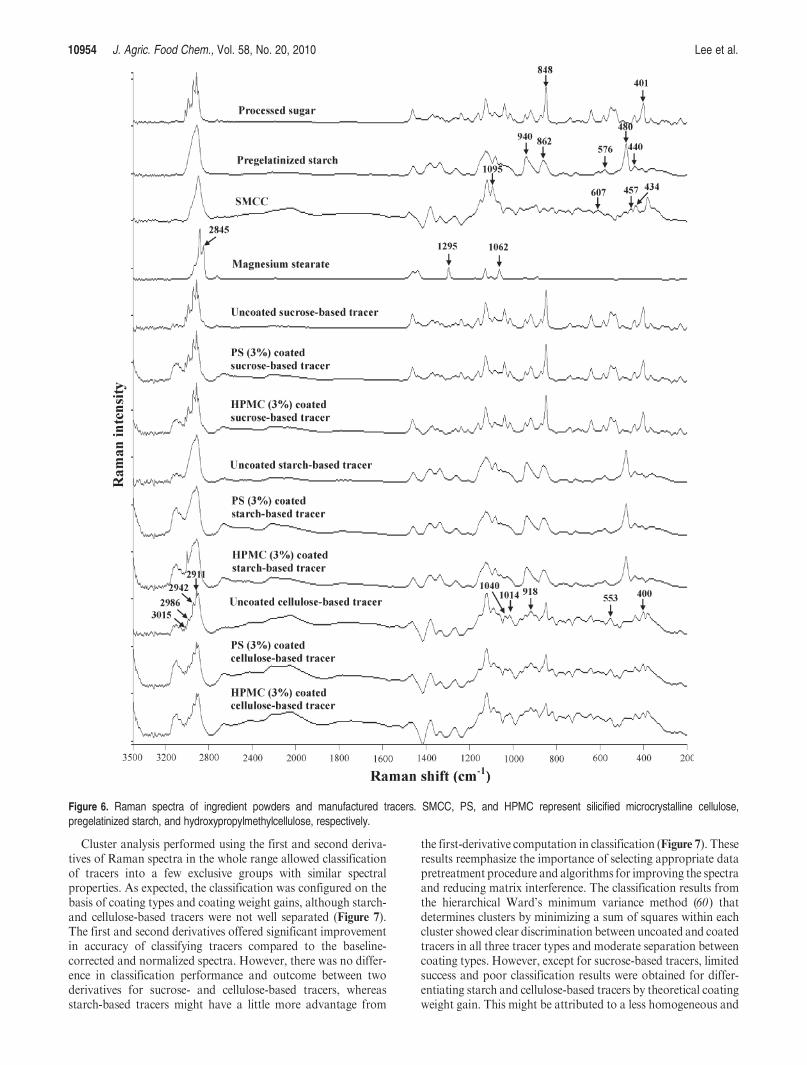
Spectra. The baseline-corrected and normalized Raman spectraof ingredient powders and manufactured tracers are presented inFigure 6. The spectral difference between the powders and tracerswas noticeable. The major difference in all three types of tracerswas in the wavelength range from 2800 to 3150 cm-1 correlatedwith C-H stretching mode (46). In Figure 6, the Raman signalof uncoated sucrose-based tracer appeared similar to that ofprocessed sugar powder consisting of 97% of the tracer. Newbands were observed in the tracer spectrum at 1062, 1295, and2845 cm-1 associated with magnesium stearate. The processedsugar and sucrose-based tracer showed the higher Raman bandintensity at 401 and 848 cm-1 corresponding to C-O or C-Cvibrations of sucrose (47). The subtraction of bands associatedwith magnesium stearate from uncoated sucrose-based tracerspectrum gave a spectrum close to that of processed sugar. Theslight difference between the subtracted and the spectrum of theprocessed sugar may be partially explained by the temperatureincrease on tracer compaction, which may induce structuralchanges in the ingredient depending on its glass transitiontemperature and storage time, consequently influencing mechan-ical properties and Raman band intensity (48, 49). The mainspectral regions for interpretation and characterization inRamanspectrum of pregelatinized starch powder and uncoated starch-based tracer were located below 1500 cm-1 and above 2800 cm-1
(Figure 6). Both powder and tracer showed strong Raman bandintensities at 480 cm-1 due to a C-O vibration and at 940 cm-1
corresponding to vibrations originating from the R-1,4 glycosidiclinkages in starch (46). The pyranose ring of glucose unit in starch
Figure 4. Peak compression force (N) of tracers with different weightgains under conditioning at 80%RH and 20.5 �C for 0, 4, 24, and 48 h. UN,PS, and HC represent uncoated tracers, pregelatinized starch coating, andHPMC coating, respectively. Numbers following PS and HC indicate thepercent of weight gain by coating application. Uncoated sucrose-basedtracers were not tested due to the dissolution during conditioning. Withineach type of tracer, data followed by the same letter are not significantlydifferent at P < 0.05.
may be identified and characterized with bands at 440, 480, and576 cm-1 in both pregelatinized starchpower and tracer (46).AnyRaman bands in the range from 1630 to 1657 cm-1 due toamylose and amylopectin were not noticeable, implying changesin amylose and amylopectin environments due to chemicalmodification of starch. The Raman band at 862 cm-1 due toCH and CH2 deformation for pregelatinized starch appeared tobe shifted to 860 cm-1 for uncoated tracer. Thismay be attributedto structural change of starch granules due to temperatureincrease during pregelatinized starchpowder compaction (49,50).A large difference in the wavelength range from 3000 to3500 cm-1 corresponding to the O-H stretching of watermolecules may suggest changes in the arrangement and distribu-tion of water molecules in a compact structure of starch-basedtracer (46). The biochemical and structural properties of cellulosic
materials have been studied by Raman spectroscopy in differentareas (47,51-53). Because cellulose-based tracer was made froma mixture of SMCC and processed sugar, the tracer spectrashowed intense bands from the two tracer ingredients. Severalstrong bands in the tracer spectrum from the processed sugarinclude bands at 400, 553, 918, 1014, 1040, 2911, 2942, 2986, and3015 cm-1. Apparently, there was no interference from processedsugar in the Raman spectrum of SMCC, which could be con-firmed by comparing the raw spectra of tracer with the combinedspectra of two ingredients. The band intensities at 457 and607 cm-1 of SMCC become weaker in the tracer spectrum, andthe band at 457 cm-1 apparently shifted to 434 cm-1. This alsooccurred at the prominent cellulose Raman band at 1095 cm-1.This band was shifted to lower wavelength and overlapped withthe 1087 cm-1 band of processed sugar to form a broader band.
The difference between coated tracer spectrum and uncoatedtracer spectrum was observed in all tracer and coating types(Figure 6). The extent of the difference was dependent on theamount of coating materials deposited on tracers. The Ramanband intensity decreased as theoretical coating weight gainincreased. This may be explained by attenuation of uncoatedtracer Raman spectrum due to coating materials (54,55). Differ-ences in Raman band intensities of coated tracers were notidentical between 1 and 2% and between 2 and 3% theoreticalweight gains in HPMC-coated sucrose- and starch-based tracers.Thismay be due to inhomogeneous surface coating at the spectralsampling areas of selected samples aswell as the irregular baselinecontributing to the spectra (55). In general, tracers with 3%theoretical weight gain exhibited a lower spectral variation thanthose with 1 and 2% theoretical weight gains, which may beattributed to the more uniform production of Raman spectralfeatures of tracers with the higher theoretical weight gain (56).
Raman spectroscopy in combination with appropriate datatreatment can extract relevant and essential spectral informationfor quality and quantity measurements of coating and traceringredients even under fluorescent conditions (54-57). There aredifferent approaches and algorithms for spectral data processingaiming to minimize the effect of instrument and decompose thespectral profile to improve the spectral resolution. In the presentwork, the Savitzky-Golay derivative smoothing techniques (58),which use several original data points in the spectrum to calculatethe derivatives to maximize spectral differences, were applied forfurther improvement of the models developed with the baseline-corrected and normalized spectral data. The spectra transformedinto their derivatives were used as the input for performing PCAand cluster analysis to investigate model efficiency in differentiat-ing tracers according to their types and coating levels.
Multivariate statistical techniques can provide multidimen-sional vectors to carry more spectral information than singlewavelengths, resulting in more integrated and robust models foridentifying and classifying the tracer and coating types andcoating thickness (59). By PCA of Raman spectra, more than400 wavelength variables were reduced to only about 25 latentvariables (principal components). The wavelengths with thelarger loading in PCA have the higher relevance for clusterformation (47). Figure 7 presents the two-dimensional scatterplots of principal component scores for each type of tracer, whichvisualizes the spectral differences between coating types andbetween coating weight gains according to the scores. As anexample, in sucrose-based tracers, the first principal componentscore discriminates tracers by coating thickness, whereas thesecond principal component score differentiates coating types.The PCA results can be used to construct a model to measure thevariability in tracer quality and ingredient powder by evaluatingthe deviations using the model (55).
Figure 5. Normalized weight of tracers with different weight gains during20 s of TADD grinding under conditioning at 80% RH and 20.5 �C for 0, 4,24, and 48 h. UN, PS, and HC represent uncoated tracers, pregelatinizedstarch coating, and HPMC coating, respectively. Numbers following PSand HC indicate the percent of weight gain by coating application.Uncoated sucrose-based tracers were not tested due to the dissolutionduring conditioning. Within each type of tracer, data followed by the sameletter are not significantly different at P < 0.05.
10954 J. Agric. Food Chem., Vol. 58, No. 20, 2010 Lee et al.
Cluster analysis performed using the first and second deriva-tives of Raman spectra in the whole range allowed classificationof tracers into a few exclusive groups with similar spectralproperties. As expected, the classification was configured on thebasis of coating types and coating weight gains, although starch-and cellulose-based tracers were not well separated (Figure 7).The first and second derivatives offered significant improvementin accuracy of classifying tracers compared to the baseline-corrected and normalized spectra. However, there was no differ-ence in classification performance and outcome between twoderivatives for sucrose- and cellulose-based tracers, whereasstarch-based tracers might have a little more advantage from
the first-derivative computation in classification (Figure 7). Theseresults reemphasize the importance of selecting appropriate datapretreatment procedure and algorithms for improving the spectraand reducing matrix interference. The classification results fromthe hierarchical Ward’s minimum variance method (60) thatdetermines clusters by minimizing a sum of squares within eachcluster showed clear discrimination between uncoated and coatedtracers in all three tracer types and moderate separation betweencoating types. However, except for sucrose-based tracers, limitedsuccess and poor classification results were obtained for differ-entiating starch and cellulose-based tracers by theoretical coatingweight gain. This might be attributed to a less homogeneous and
Figure 6. Raman spectra of ingredient powders and manufactured tracers. SMCC, PS, and HPMC represent silicified microcrystalline cellulose,pregelatinized starch, and hydroxypropylmethylcellulose, respectively.
rougher coating surface and nonrepresentative sampling in thetwo types of tracers (55 ,61). Apparently, pregelatinized starch-coated tracers were less distinctively separated by a theoreticalcoating weight gain than HPMC-coated tracers. This may bepartially explained by thicker HPMC coating. The thicker coat-ing typically gives more homogeneous and consistent Ramanspectra (56).
As demonstrated in the present work, Raman spectroscopy,requiring less analysis time and little sample preparation, is anattractive and promising technique for the proposed grain trace-ability system because it can provide rapid quality and processcontrol of tracer and coating. In addition, this technique canserve as a fast and reliable tool for distinguishing genuine tracersfrom counterfeit tracers dispensed into bulk grains by terrorist ororganized criminal groups.
In conclusion, three types of tracers, sucrose-, starch-, andcellulose-based tracers made of and coated with food-gradesubstances, had acceptable durability and strength characteristicssuitable for handling and storing with grain presumably withoutany significant changes in their quality and performance. Theresults from this study draw attention to a need to carefully
formulate a tracer mixture and coating solution and design thetracer manufacturing processes to yield tracers with desirableproperties and characteristics.
To maintain consistent quality and superior performance of atracer resistant to damage from moisture and mold growth, thetracer formulation would be required to have a low hygroscopicproperty and excellent flowability, compressibility, bindingstrength, and compactability.With respect to coating, the coatingmaterial also needs to be less hygroscopic, flowable, and ductile toprovide a smooth and homogeneousmatrix of coating filmon thesurface to enhance tracer strength and protecting a printed IDcode from mechanical damage. It is equally important to selecttracers with fewer surface defects and optimize coating processconditions to achieve the uniformity and consistency of tracercoating. In addition, variation in tracer manufacture and coatingprocesses should be minimized because it appeared to influencethe mechanical, structural, and spectroscopic properties of acoated tracer, making it difficult to explain the quality factorsof a tracer governing its performance.
The U.S. Food and Drug Administration expressed noobjection to insertion of a food-grade tracer in grain without
Figure 7. Scatter plots of the first two principal component (PC) scores through the principal component analysis of the Savitsky-Golay first (1) and second(2) derivate spectral data. S, ST, and C stand for sucrose-, starch-, and cellulose-based tracers, respectively. UN, PS, and HC represent uncoated tracers,pregelatinized starch coating, and HPMC coating, respectively. Numbers following PS and HC indicate the percent of weight gain by coating application.
10956 J. Agric. Food Chem., Vol. 58, No. 20, 2010 Lee et al.
adulterating the grain. Future research to develop new tracerswould investigate alternative sizes and shapes of tracers for newcrops, modify current tracer and coating formulations with novelsubstances possessing the aforementioned physicochemical prop-erties, and establish new manufacturing process conditions. Thecharacteristics of newly designed tracers should be as follows: (1)more durable and better for flowing with grains during handlingand storage; (2) more resistant to moisture and mechanicaldamages; (3) economically cheaper to manufacture; (4) easier tomanage and keep clean, and (5) more flawless and ink-absorbentsurface for printing ID codes.
ABBREVIATIONS USED
ANOVA, analysis of variance; CV, coefficient of variation;HPMC, hydroxypropylmethylcellulose; PCA, principal compo-nent analysis; MC, moisture content; MCC, microcrystallinecellulose; SMCC, silicified microcrystalline cellulose; TADD,tangential abrasive dehulling device.
LITERATURE CITED
(1) U.S. Congress. Public Health Security and Bioterrorism Prepared-ness and Response Act of 2002, Title III, subtitles A, 2002; availableat http://www.fda.gov/Food/FoodDefense/Bioterrorism/ucm111086.htm#attach-a (accessed Dec 1, 2009).
(2) Establishment andMaintenance of RecordsUnder the Public HealthSecurity and Bioterrorism Preparedness and Response Act of 2002;Final Rule. Fed. Regist. 2004, 69 (236, Dec 9), 71561-71655.
(3) European Parliament. Regulation (EC) No. 178/2002 of theEuropean Parliament and of the Council. Off. J. Eur. Communities2002, L31, 1-24.
(4) ISO 22005. Traceability in the feed and food chain - generalprinciples and guidance for system design and development. ISOStandard, 2007.
(5) Golan, E.; Krissoff, B.; Kuchler, F.; Calvin, L.; Nelson, K.; Price, G.Traceability in the U.S. food supply: economic theory and industrystudies; Agricultural Economic Report 830; USDA/Economic ResearchService: Washington, DC, 2004.
(6) Herrman, T. J. White paper on traceability in the U.S. grain andplant protein feed ingredient industries, 2002; available at http://www.grains.ksu.edu/Extension/DesktopModules/ViewDocument.aspx?DocumentID=4982 (accessed Dec 1, 2009).
(7) Meyer, S. Grain Transportation and Marketing Channels, 2004;available at http://www.fapri.missouri.edu/outreach/publications/2004/FAPRI_UMC_Briefing_Paper_04_04.pdf (accessed Dec 1, 2009).
(8) Herrman, T. J.; Boland, M. A.; Agrawal, K.; Baker, S. R. Use of asimulation model to evaluate wheat segregation strategies forcountry elevators. Appl. Eng. Agric. 2002b, 18, 105-112.
(9) Frittelli, J. F. Grain transport: modal trends and infrastructureimplication, 2005; available at http://www.nationalaglawcenter.org/assets/crs/RL32720.pdf (accessed Jan 26, 2010).
(10) Sarantopoulos, P. D.; Altiok, T.; Elsayed, E. A. Manufacturing inthe pharmaceutical Industry. J. Manuf. Syst. 1995, 14, 452-467.
(11) Loyd, V. A., Jr.; Popovich, N. G.; Ansel, H. C. Tablets. In Ansel’sPharmaceutical Dosage Forms and Drug Delivery Systems; Loyd,V. A., Jr., Popovich, N. G., Ansel, H. C., Eds.; Lippincott Williams &Wilkins: Baltimore, MD, 2005; Chapter 8, pp228-259.
(12) Natoli, D. Tooling for pharmaceutical processing. InPharmaceuticalDosage Forms. Tablets; Augsburger, L. L., Hoag, S. W., Eds.; InformaHealthcare: New York, 2008; Chapter 1, pp 1-48.
(13) S352.2(R2008):Moisture measurement- unground grain and seeds.ASAE Standards; ASABE: St. Joseph, MI, 2008.
(14) SAS User’s guide: Statistics, Version 9.13 ed.; SAS Institute: Cary,NC, 2004.
(15) European Commission. Directive 2000/13/EC of the EuropeanParliament and of the Council of 20 March 2000 on the approxima-tion of the laws of the member states relating to the labelling,presentation and advertising of foodstuffs. Off. J. Eur. Communities2000, L 109, 29-42.
(16) U.S. Food and Drug Administration. Food Allergen Labeling andConsumer Protection Act (FALCPA) of 2004 (Title II of public law108-282), 2004; available at http://www.fda.gov/Food/Labeling-Nutrition/FoodAllergensLabeling/GuidanceComplianceRegulator-yInformation/ucm106187.htm (accessed Dec 4, 2009).
(17) Ispas-Szabo, P.; Ravenelle, F.; Hassan, I.; Preda, M.; Mateescu,M. A. Structure-properties relationship in cross-linked high-amylose starch for use in controlled drug release. Carbohydr. Res.2000, 323, 163-175.
(18) Dumoulin, Y.; Alex, S.; Szabo, P.; Cartilier, L.; Mateescu, M. A.Cross-linked amylose as matrix for drug controlled release. X-rayand FT-IR structural analysis. Carbohydr. Polym. 1998, 37,361-370.
(19) Buckton, G.; Yonemochi, E.; Yoon, W. L.; Moffat, A. C. Watersorption and near IR spectroscopy to study the differencesbetween microcrystalline cellulose and silicified microcrystallinecellulose before and after wet granulation. Int. J. Pharm. 1999,181, 41-47.
(20) Tobyn, M. J.; McCarthy, G. P.; Staniforth, J. N.; Edge, S. Physico-chemical comparison between microcrystalline cellulose and silici-fied microcrystalline cellulose. Int. J. Pharm. 1998, 169, 183-194.
(21) Atichokudomchai, N.; Shobsngobb, S.; Chinachotic, P.; Varavinita,S. A study of some physicochemical properties of high-crystallinetapioca starch. Starch/Staerke 2001, 53, 577-581.
(22) Palviainen, P.; Heinamaki, J.; Myllarinen, P.; Lahtinen, R.; Yliruusi,J.; Forssell, P. Corn starches as film formers in aqueous-based filmcoating. Pharm. Dev. Technol. 2001, 6, 351-359.
(23) Silva, G.D.; Publio,M. C. P.; Oliveira,W. P. Evaluation of the tabletcoating by the conventional spouted-bed process. Drug Dev. Ind.Pharm. 2001, 27, 213-219.
(24) Krogars, K.; Antikainen, O.; Heinamaki, J.; Laitinen, N.; Yliruusi,J. Tablet film-coating with amylose-richmaize starch.Eur. J. Pharm.Sci. 2002, 17, 23-30.
(25) Jansson, A.; Thuvander, F. Influence of thickness on the mechanicalproperties for starch films. Carbohydr. Polym. 2004, 56, 499-503.
(26) Koskinen, M.; Suortti, T.; Autio, K.; Myllarinen, P.; Poutanen, K..Effect of pretreatment on the film forming properties of potato andbarley starch dispersions. Ind. Crops Prod. 1996, 5, 23-34.
(27) Mali, S.; Grossmann, M. V.; Garcia, M. A.; Martino, M. N.;Zaritzky, N. E.Microstructural characterization of yam starch films.Carbohydr. Polym. 2002, 50, 379-386.
(28) Heinamaki, J.; Ruotsalainen, M.; Lehtola, V.-M.; Antikainen, O.;Yliruusi, J. Optimization of aqueous-based film coating of tabletsperformed by a side-vented pan-coating system. Pharm. Dev. Tech-nol. 1997, 2, 357-364.
(29) Donhowe, I. G.; Fennema, O. R. The effects of plasticizers oncrystallinity, permeability, and mechanical properties of methyl-cellulose films. J. Food Process. Preserv. 1993, 17, 247-257.
(30) Hulleman, S.; Janssen, F.; Feil, H. The role of water duringplastication of native starches. Polymer 1998, 39, 2043-2048.
(31) Ridgway, C. J.; Gane, P. A. C.; Schoelkopf, J. Modified calciumcarbonate coatings with rapid absorption and extensive liquiduptake capacity. Colloids Surf., A 2004, 236, 91-102.
(32) Lahdenpaa, E.; Niskanen, M.; Yliruusi, J. Crushing strength, dis-intergration time and weight variation of tablets compressed fromthree AvicelÒ PH grades and their mixtures. Eur. J. Pharm.Biopharm. 1997, 43, 315-322.
(33) Doelker, E. Comparative compaction properties of various micro-crystalline cellulose types and generic products. Drug Dev. Ind.Pharm. 1993, 19, 2399-2471.
(34) Wilson, K. E.; Crossman, E. The influence of tablet shape and panspeed on intra-tablet film coating uniformity.Drug Dev. Ind. Pharm.1997, 23, 1239-1243.
(35) Aulton, M. E.; Twitchell, A. M.; Hogan, J. E. Physical properties ofHPMC solutions and their role in the film coating process and thequality of coated product. In Aqueous Polymeric Coatings forPharmaceutical Dosage Forms; McGinity, J. W., Ed.; Dekker:New York, 1997; Chapter 6, pp 227-266.
(36) Ravenelle, F.; Marchessault, R. H.; Legare, A.; Buschmann, M. D.Mechanical properties and structure of swollen corsslinked highamylose starch tablets. Carbohydr. polym. 2002, 47, 259-266.
(37) Rindlav-Westling, A.; Stading, M.; Hermansson, A.-M.; Gatenholm,P. Structure, mechanical and barrier properties of amylose andamylopectin films. Carbohydr. Polym. 1998, 36, 217-224.
(38) Karababa, E. Physical properties of popcorn kernels. J. Food Eng.2006, 72, 100-107.
(39) Mihranyan, A.; Llagostera, A. P.; Karmhag, R.; Strømme, M.; Ek,R. Moisture sorption by cellulose powders of varying crystallinity.Int. J. Pharm. 2004, 269, 434-442.
(40) Alebiowu, G.; Itiola, O. A. Effects of starches on the mechanicalproperties of paracetamol tablet formulations. II. Sorghum andplantain starches as disintegrants. Acta Pharm. 2003, 53, 1-8.
(41) Hall, G. E.; Hill, L. D. Test weight adjustment based on moisturecontent and mechanical damage of corn kernels. Trans. ASAE 1974,17, 578-579.
(42) Santos, H.; Veiga, F.; Pina, M.; Podczeck, F.; Sousa, J. Physicalproperties of chitosan pellets produced by extrusion-spheronisa-tion: influence of formulation variables. Int. J. Pharm. 2002, 246,153-169.
(43) Gilleo, K. B. Rheology and surface chemistry. In Coating Technol-ogy Handbook; Tracton, A. A., Ed.; CRC Press: Boca Raton, FL, 2006;Chapter 1, pp 1-12.
(44) Vanel, L.; Claudin, Ph.; Bouchaud, J.-Ph.; Cates,M. E.; Clement, E.;Wittmer, J. P. Stresses in silos: comparison between theoreticalmodels and new experiments. Phys. Rev. Lett. 2000, 84, 1439-1442.
(45) Bader, H. G.; Goritz, D. Investigations on high amylose corn starchfilms. Part 2: Water vapor sorption. Starch/Staerke 1994, 46, 249-252.
(46) Kizil, R.; Irudayaraj, J.; Seetharaman, K. Characterization ofirradiated starches by using FT-Raman and FTIR spectroscopy.J. Agric. Food Chem. 2002, 50, 3912-3918.
(47) Sohn, M.; Himmelsbach, D. S.; Kays, S. E.; Archibald, D. D.;Barton, F. E., II. NIR-FT/Raman spectroscopy for nutritionalclassification of cereal foods. Cereal Chem. 2005, 82, 660-665.
(48) Schmidt, A. G.; Wartewig, S.; Picker, K. M. Polyethylene oxides:protection potential against polymorphic transitions of drugs?J. Raman Spectrosc. 2004, 35, 360-367.
(49) Picker-Freyer, K. M.; Schmidt, A. G. Does temperature increaseinduced by tableting contribute to tablet quality? J. Therm. Anal.Calorim. 2004, 77, 531-539.
(50) Odeku, O. A.; Schmid,W.; Picker-Freyer, K. M.Material and tabletproperties of pregelatinized (thermally modified)Dioscorea starches.Eur. J. Pharm. Biopharm. 2008, 70, 357-371.
(51) Schulz, H.; Baranska, M. Identification and quantification of valu-able plant substances by IR and Raman spectroscopy. Vib. Spec-trosc. 2007, 43, 13-25.
(52) Eichhorn, S. J.; Young, R. J. The Young’s modulus of a micro-crystalline cellulose. Cellulose 2001, 8, 197-207.
(53) Vueba, M. L.; Batista de Carvalho, L. A. E.; Veiga, F.; Sousa, J. J.;Pina, M. E. Influence of cellulose ether mixtures on ibuprofenrelease: MC25, HPC and HPMC K100M. Pharm. Dev. Technol.2006, 11, 213-228.
(54) Kauffman, J. F.; Dellibovi, M.; Cunningham, C. R. Raman spec-troscopy of coated pharmaceutical tablets and physical models formultivariate calibration to tablet coating thickness. J. Pharm.Biomed. Anal. 2007, 43, 39-48.
(55) Romero-Torres, S.; Perez-Ramos, J. D.; Morris, K. R.; Grant, E. R.Raman spectroscopic measurement of tablet-to-tablet coating varia-bility. J. Pharm. Biomed. Anal. 2005, 38, 270-274.
(56) Romero-Torres, S.; Perez-Ramos, J. D.; Morris, K. R.; Grant, E. R.Raman spectroscopy for tablet coating thickness quantification andcoating characterization in the presence of strong fluorescent inter-ference. J. Pharm. Biomed. Anal. 2006, 41, 811-819.
(57) Byler, D. M.; Susi, H. Application of computerized infrared andRaman spectroscopy to conformation studies of casein and otherfood proteins. J. Ind. Microbiol. 1988, 3, 73-88.
(58) Savitzky, A.; Golay, M. J. E. Smoothing and differentiation of data bysimplified least squares procedures. Anal. Chem. 1964, 36, 1627-1638.
(59) Johnson, D. E. Applied multivariate methods. In Applied Multi-variate Methods for Data Analysts; Johnson, D. E., Ed.; Duxbury:Pacific Grove, CA, 1998; Chapter 1, pp 1-33.
(60) Ward, J. H., Jr. Hierarchical grouping to optimize an objectivefunction. J. Am. Stat. Assoc. 1963, 58, 236-244.
(61) Johansson, J.; Pettersson, S.; Folestad, S. Characterization ofdifferent laser irradiation methods for quantitative Raman tabletassessment. J. Pharm. Biomed. Anal. 2005, 39, 510-516.
Received for review April 13, 2010. Revised manuscript received
September 13, 2010. Accepted September 13, 2010. Mention of
trademark or proprietary product does not constitute a guarantee or
warranty of the product by the U.S. Department of Agriculture and does
not imply its approval to the exclusion of other products that may also be