• FEATURE 28 JOURNAL AWWA Bellevue Smart: Development and Integration of a Smart City Chelo Picardal, Brian Pugliese, Sokwoo Rhee, Cuong Nguyen, Raja Kadiyala, and Ken Thompson Chelo Picardal, Brian Pugliese, Sokwoo Rhee, Cuong Nguyen, Raja Kadiyala, and Ken Thompson Chelo Picardal, Brian Pugliese, Sokwoo Rhee, Cuong Nguyen, Raja Kadiyala, and Ken Thompson
Transcript
• FEATURE
28 JOURNAL AWWA
Bellevue Smart: Development and Integration of a Smart CityChelo Picardal, Brian Pugliese, Sokwoo Rhee, Cuong Nguyen, Raja Kadiyala, and Ken ThompsonChelo Picardal, Brian Pugliese, Sokwoo Rhee, Cuong Nguyen, Raja Kadiyala, and Ken ThompsonChelo Picardal, Brian Pugliese, Sokwoo Rhee, Cuong Nguyen, Raja Kadiyala, and Ken Thompson
• FEATURE
FEBRUARY 2020 • VOL.112 • NO.2 29
Key Takeaways
In Washington, the City of Bellevue wanted to break away from the inefficiency of siloed operations and create a unified, data-based, smart-city strategy across all city departments.
The Bellevue Smart Team tested a water module in its new City Portal, starting with a dashboard that would organize and optimize data for a better customer, utility, and city experience.
The platform used to set up the City Portal allows for flexibility in adding modules and adopting new technologies.
Layout imagery by metamorworks/Shutterstock.com
• FEATURE Development o f a Smar t C i t y
30 JOURNAL AWWA
With a population of approximately 141,000 residents, the city of Bellevue is located in the Eastside region of King County in Washington, across Lake Washington
from Seattle. The name Bellevue is derived from the French words for “beautiful view”; in addition to keeping its scenery gorgeous, Bellevue is committed to being an industry leader in smart city design and implementation.
Bellevue SmartCities traditionally address their operational challenges in silos, such as traffic management, public safety, city lighting, pollution and environment, waste management, or parking optimization. However, this fragmented approach can be inefficient, ineffective, and uneconomi-cal. With its Bellevue Smart program, the city intends to break down the traditional silos of municipal govern-ment and unite them to improve the decision-making process and the speed with which responses are made. So far, Bellevue’s systematic approach has included these elements:
• Creating a cross-departmental smart city team • Performing background research on smart cities to develop a vision and supporting goals
• Conducting a maturity assessment of smart-city tech-nology adoption across city functions
• Developing a comprehensive smart city strategic plan • Creating an architecture to develop a City Portal to meet city and community needs
Throughout this process, the Bellevue Smart Team—the City of Bellevue, the National Institute of Standards and Technology (NIST), Jacobs, and Quantela Inc.— maintained strong engagement with the Bellevue City Council, city staff, and technology partners.
The City PortalTo begin development of the City Portal, the team pilot-tested technologies that could make better use of the city’s existing water system data, gather new data, and effec-tively share real-time data across departments. In the end, the city wanted a visual, geographic information system- based dashboard (i.e., the City Portal) to display data to promote greater effectiveness and efficiencies in operating individual departments, enhance customer service, and communicate more easily across departments.
In developing the City Portal, the team decided to start with a water module for Bellevue’s 40,000-customer utili-ties department. The water module will provide the foun-dation for continued smart city development as the city integrates additional modules for other city departments and future technology advancements. The water mod-ule will draw real-time data from the city’s water utility
operations, including online water quality monitoring (OWQM) data, compliance testing results, and other re-lated key parameters.
The team is developing data analytics and improving the interconnectivity of department systems citywide, including police, fire, civic services, transportation, utilities, and information technology (IT). The ultimate goal of the Bellevue Smart program is to enable all city staff, citizens, and visitors to leverage appropriate levels of real-time data from throughout the city for use in their daily activities.
As a project partially funded by NIST, broader goals include ensuring that Bellevue’s solution is replicable and scalable for any city, is based on a well-documented open architecture, employs industry standards, and is designed for modularity. These goals are well aligned with NIST’s Global City Teams Challenge, which is out-lined in a 2016 report by Rhee and colleagues (https://doi.org/10.6028/NIST.SP.1900-01). This smart-city and Internet of Things (IoT) program led to the city’s Replicable Smart City Technology grant.
The following sections describe the process the City of Bellevue used to identify useful data streams, create a nor-malized database in its virtual machine (VM), integrate the data, create new algorithms and visualization tools, and measure the usefulness of the information gained through a set of key performance indicators (KPIs).
Project GoalsDuring the 2016 Chief Information Officer (CIO) Forum, hosted by the National Association of Counties, CIOs of the 50 largest water and wastewater agencies in the United States were informally polled about the level of data pro-cessing that occurs at their agencies. The consolidated response was that about 10% of data collected was thor-oughly processed and evaluated. The remaining data, often termed dark data, remained untouched, primarily because resources and tools were lacking. Assuming other cities and their various departments process data as effi-ciently (or inefficiently) as the water industry does, there is
The ultimate goal of the Bellevue Smart program is to enable all city staff, citizens, and visitors to leverage appropriate levels of real-time data from throughout the city for use in their daily activities.
significant potential to gain value-added information for improving utility and city operations.
One of the goals for the common City Portal at the heart of the Bellevue Smart program was to include tools that city departments can use to process data from existing sources into actionable information to share cross-departmentally, and in many cases with the community, to improve decision-making, efficiencies, responses, and communication. Examples of existing city data sources include 911, utility supervisory control and data acquisition (SCADA), intelligent transportation, and electrical systems. The development of the water module through the NIST project was the first step in this process.
Project ApproachWater Module Use CasesThe vision for the water module project was developed through two separate informational workshops held with members of the Smart Team. At the first workshop, the team decided to explore a mature portal developed by Quantela, who would later join the team, and to evaluate working concurrently with Microsoft on its trusted- data platform. One of the models the team followed was that of the US Environmental Protection Agency Water Security Division; it has conducted extensive research as part of its Surveillance and Response Program, which uses real-time monitoring of multiple data streams, an-alytics, and response protocols to detect and respond to water quality anomalies. In Bellevue’s case, the goal was to select a set of use cases in which data could be collect-ed in near-real time, analyzed, and spatially displayed on a web-based dashboard.
After reviewing its approach during the second workshop, the team determined that information in the following five areas would be integrated, processed, and visualized in Bellevue’s water module and City Portal:
• Online water quality monitoring. Extract data from the city’s water SCADA system every two minutes to process data on pH, chlorine, and temperature from OWQM stations, and visualize it using trending graphs. Sensors are already in place at OWQM sta-tions in the city’s distribution system.
• Compliance data. Extract and process data from the Seattle Public Utilities Laboratory Information Management System (LIMS) weekly, then visualize all compliance monitoring sites using trend graphs. Additionally, allow the city to see systemwide profiles using the most recent sampling results from each compliance site.
• Pipeline breaks. Extract information from the computerized maintenance management system for
pipeline breaks daily; spatially visualize the last three days on the dashboard.
• Customer complaints. Extract information from the database every 15 minutes for customer complaint calls. Evaluate the different categories of calls for clustering or threshold exceedances and visualize calls on the dashboard over a 24-hour running period.
• Cross-connection control. Extract information week-ly for the annual cross-connection testing program and track late report data on the dashboard.
KPIs Project-specific KPIs were developed on the basis of indi-cators for water and sanitation outlined in the International Organization for Standardization’s ISO 37120:2018, Sustainable Cities and Communities—Indicators for City Services and Quality of Life. In particu-lar, two KPIs were used to assess how the City Portal improved data sharing and response: (1) the total number of water quality complaints each month and (2) the aver-age time to respond to water quality complaints. Once the dashboard is integrated, both of these KPIs are expected to decrease over the long term.
Platform SelectionThree potential City Portal platforms were evaluated for this project. Table 1 provides a summary of the strengths and weaknesses of each system.
Software Module DevelopmentInitially, the project was going to compare the function-ality of two platforms. However, because of the alignment with the project schedule, the water module was devel-oped first because it had been used in smart city cases that included street lighting, parking, and air pollution monitoring. The platform provider used industry- accepted open architecture standards, with an approach replicable by other city departments, including the fol-lowing features:
• Extract-transform-load (ETL) scripts. ETL scripts allow data to be extracted from the legacy systems the City of Bellevue currently uses.
• Long-term storage. Long-term storage for the differ-ent systems will continue to be located in the city’s host systems.
• Short-term storage. An operational data store was set up on a virtual server to store and feed data in near-real time to the platform. The selected platform provides short-term data storage for running applica-tions and analytics.
• Application programming interfaces (APIs) and web interfaces. APIs and web interfaces allow for
• FEATURE Development o f a Smar t C i t y
32 JOURNAL AWWA
extraction of data from the operational data store in a web-friendly manner. An interface (using a representational-state-transfer, or REST, style) with JavaScript object notation is the provided data output payload.
Software Development and Testing Cycle (Standards)Software development included an API to allow data transfer from the VM located in the Bellevue IT data cen-ter to the cloud and server. After development of the soft-ware applications to process and visualize the data streams for the five use cases, the following additional assessments were made during the pilot evaluation period:
• SCADA data extraction. The data extraction scripts were created in a configurable manner to allow for future expansion. Requested data from the data his-torian were defined in dictionaries that can be easily modified and extended as additional SCADA data are needed or become available.
• VM. By using a virtual environment, system resourc-es are more easily managed (extended or reduced). Redundancy and scalability can also be addressed by incorporating additional VMs to provide horizontal scaling of the operational data store.
• Cloud applications. Transferring data from the City of Bellevue VM to the selected platform re-quired Amazon’s cloud services, which were used after thoroughly reviewing the cyber-protections in place.
Cybersecurity and Data PrivacyData security and privacy are important for critical infrastructure systems. NIST has worked with other industries to develop a cybersecurity framework that provides guidance for best practices and integrates cybersecurity activities into an organization’s risk man-agement plan (see NIST’s 2014 Framework for Improving Critical Infrastructure Cybersecurity). In 2017, NIST pub-lished An Introduction to Privacy Engineering and Risk Management in Federal Information Systems by Sean W. Brooks and colleagues. These two resources are good guides to creating and implementing cybersecurity and data privacy policies. In developing Bellevue Smart, the team focused on data security as well as protecting the sources of critical data.
Data SourcesThe team first identified what information was best to include in the water module, how it would be used, and how to access the data, including long-term data storage. The City of Bellevue Utilities Department considered incorporating the following information systems (data sources) into the water module:
• SCADA system (Wonderware)—water system oper-ational data, including pressure, water level, flow, water quality, and energy use
• Customer information system (Infinity)—customer information, billing history, and account status
• Asset management system (Maximo)—asset manage-ment data for water system infrastructure, including
Pros and Cons of Potential City Portal Platforms
Table 1
Platform Pros Cons Selection
System A Numerous smart city applicationsAdvanced cloud securityDevelopment of in-kind servicesApplication development fits project schedule
No water moduleDevelopment team overseas
First choice for mature system
System B Advanced cloud securityDevelopment of in-kind services Development team local
No smart city applicationsNo water modulePlatform in basic developmentApplication development doesn’t fit project schedule
First choice for emerging systemCould not meet schedule
System C Basic water moduleDevelopment team in nearby state
No smart city applicationsSecurity not advanced
Not considered because of lack of smart city applications
• FEATURE Development o f a Smar t C i t y
FEBRUARY 2020 • VOL.112 • NO.2 33
maintenance activities, inspection records, customer complaints, and failure history
• Geographic information system (ArcGIS)—water system maps and infrastructure data
• Seattle Public Utilities LIMS—water quality data from this regional water provider
• Cross-connection control (XC2)—active database on annual compliance testing for customer-owned
backflow devices required to protect the water system from unintentional contamination
• Advanced metering infrastructure (AMI)—meter data management system (vendor specific)
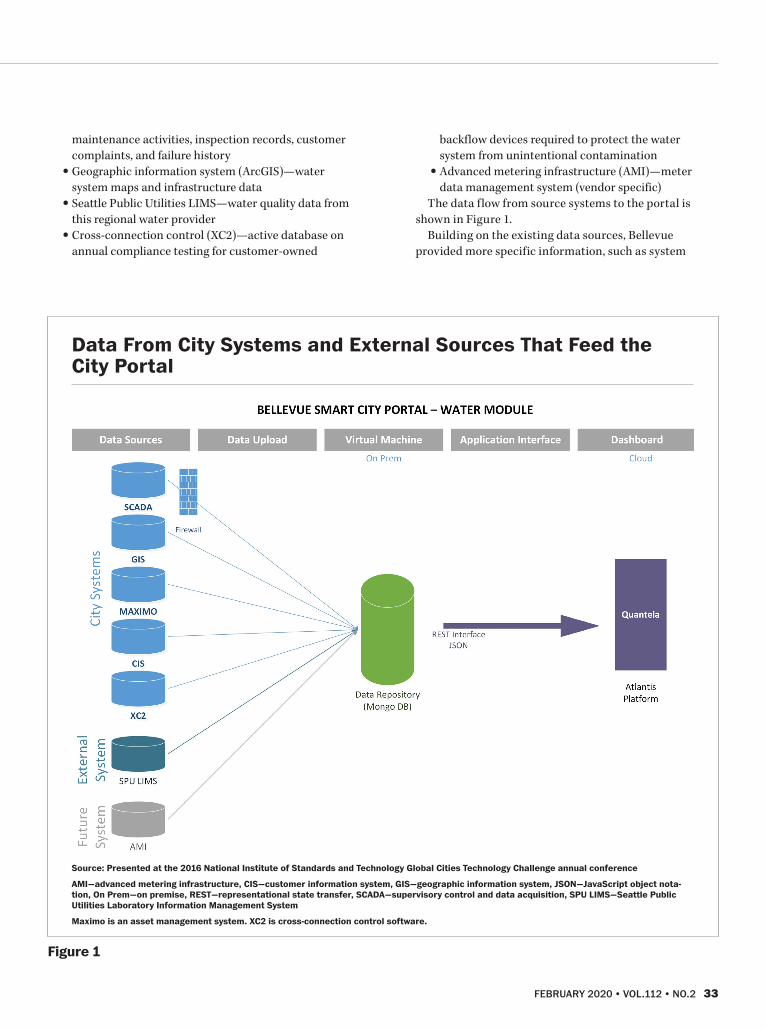
The data flow from source systems to the portal is shown in Figure 1.
Building on the existing data sources, Bellevue provided more specific information, such as system
Data From City Systems and External Sources That Feed the City Portal
Figure 1
Source: Presented at the 2016 National Institute of Standards and Technology Global Cities Technology Challenge annual conference
AMI—advanced metering infrastructure, CIS—customer information system, GIS—geographic information system, JSON—JavaScript object nota-tion, On Prem—on premise, REST—representational state transfer, SCADA—supervisory control and data acquisition, SPU LIMS—Seattle Public Utilities Laboratory Information Management System
Maximo is an asset management system. XC2 is cross-connection control software.
• FEATURE Development o f a Smar t C i t y
34 JOURNAL AWWA
application details, update frequencies, and data vol-umes and sensitivities. In 2018, the city began imple-menting an AMI system for all customers. The AMI system will provide data on daily customer usage, back-flow incidents, customer-side leaks, and meter tamper-ing. Integration of the AMI system into the water mod-ule will allow the city to use the information to reduce nonrevenue water losses through early detection and response to pipeline breaks, theft, and premature meter failures. The AMI system will also improve resiliency and enhance security by leveraging backflow and meter tampering alerts.
Data AccessA variety of data access techniques were necessary to ultimately bring all of the data sets onto the selected platform, and the initial challenge in developing the water module was extracting and migrating data from existing systems into the open architecture database. The solution was a VM that brings different data sources into a single database and formats it for trans-fer to the platform.
Once the data sets are in the operational data store, they are made available to the platform. The city would like the portal to be a fully integrated system that in-cludes all operations and that is accessible to all city employees. Because of the sensitive nature of some
information, the city will take processed and validated information from the platform and transfer it to a sepa-rate citizen portal.
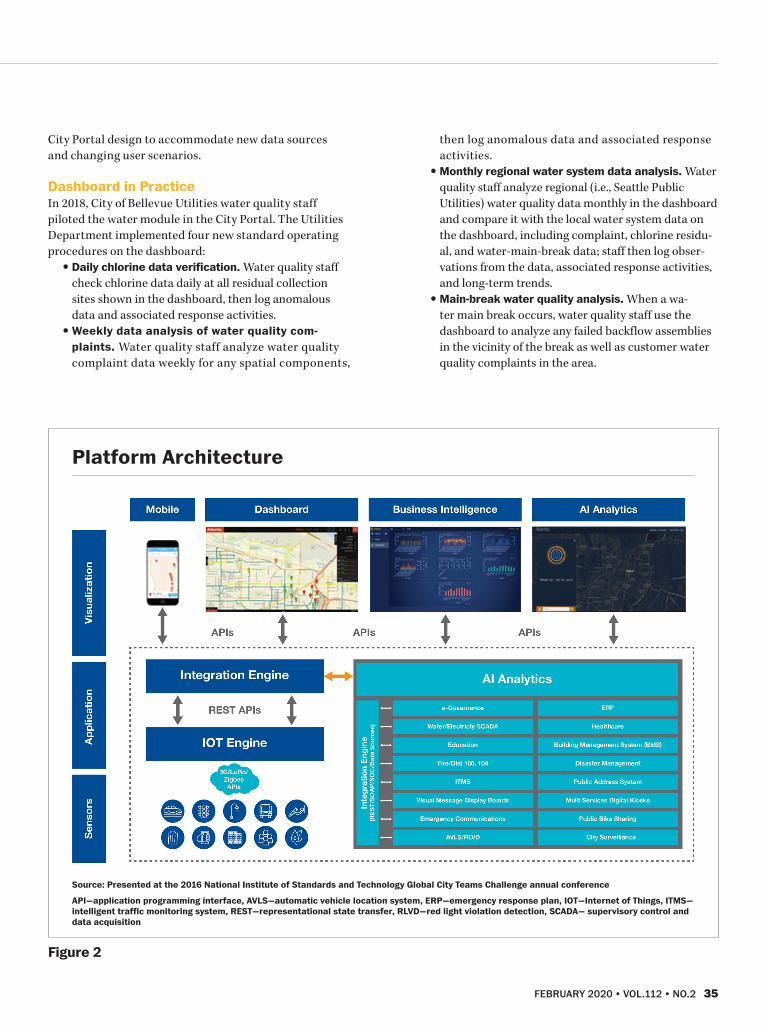
As Figure 2 illustrates, the City Portal was devel-oped around the selected platform, which connects city infrastructure over a common network and data layer. The platform engine helps build a converged network that draws from smart devices, other devices, and software applications across various IoT proto-cols to monitoring and control sensors, devices, and software applications across domains. Its data manage-ment framework enables data collection, organization, and sharing. The platform also provides predictive,
prescriptive analytics for efficient city operations, safe-ty, and infrastructure use.
The City Portal aggregates contextual information and normalizes it into a common language under-stood by third-party APIs. Any vendor can be integrat-ed into the City Portal irrespective of the communi-cation protocol, and open APIs are available through application keys from the city for application develop-ers. This results in a city app store—an opportunity for revenue for the city.
Business Intelligence and Artificial Intelligence (AI) AnalyticsBellevue’s platform, which has been deployed in several smart city programs, uses AI-based analytics that improve data-sharing and decision-making through advanced machine-learning capabilities. The platform includes a modular and scalable architecture, allowing cross-vertical analytics that quickly blend data from varied sources into helpful tables and trends. The hard-ware and software modules can be customized for each city department and can integrate any software archi-tecture or sensor technology. This approach allows the city to start integrating existing data streams, expand to smart city applications immediately, and add more applications as needed. Applications that employees interact with directly sit “on top” of the City Portal, con-suming normalized data from third-party sensors and city systems, displaying the data, and responding in real time to city changes.
Bellevue’s smart city plan, Bellevue Smart: Planning for a Smarter City, lays out a comprehen-sive approach that integrates many city elements, including connectivity, transportation, public safety, water, and energy, among others. The plan’s phased approach allows the city to invest in smart systems and adapt as technology and expectations continue to change. The smart city dashboard as envisioned in Figure 3 provides a one-stop portal and ref lects this phased approach. The portal will be modified over time as the Smart Team learns how to integrate data from multiple sources, gains experience with data visualization and user experience, and expands insights on various technology platforms.
With only one module, the data can be managed with an on-premise data repository before feeding the cloud platform for the dashboard. As more modules are add-ed, data growth will strain the interim data repository, so either additional server capacity or a shift to a cloud solution will be needed in the long term. Operational impacts will be monitored as adjustments are made to the architecture and updates are implemented to the
With only one module, the data can be managed with an on-premise data repository before feeding the cloud platform for the dashboard.
• FEATURE Development o f a Smar t C i t y
FEBRUARY 2020 • VOL.112 • NO.2 35
City Portal design to accommodate new data sources and changing user scenarios.
Dashboard in PracticeIn 2018, City of Bellevue Utilities water quality staff piloted the water module in the City Portal. The Utilities Department implemented four new standard operating procedures on the dashboard:
• Daily chlorine data verification. Water quality staff check chlorine data daily at all residual collection sites shown in the dashboard, then log anomalous data and associated response activities.
• Weekly data analysis of water quality com-plaints. Water quality staff analyze water quality complaint data weekly for any spatial components,
then log anomalous data and associated response activities.
• Monthly regional water system data analysis. Water quality staff analyze regional (i.e., Seattle Public Utilities) water quality data monthly in the dashboard and compare it with the local water system data on the dashboard, including complaint, chlorine residu-al, and water-main-break data; staff then log obser-vations from the data, associated response activities, and long-term trends.
• Main-break water quality analysis. When a wa-ter main break occurs, water quality staff use the dashboard to analyze any failed backflow assemblies in the vicinity of the break as well as customer water quality complaints in the area.
Platform Architecture
Figure 2
Source: Presented at the 2016 National Institute of Standards and Technology Global City Teams Challenge annual conference
API—application programming interface, AVLS—automatic vehicle location system, ERP—emergency response plan, IOT—Internet of Things, ITMS—intelligent traffic monitoring system, REST—representational state transfer, RLVD—red light violation detection, SCADA— supervisory control and data acquisition
• FEATURE Development o f a Smar t C i t y
36 JOURNAL AWWA
Utilities staff collected data on the monthly water quality complaints and the average time to respond to complaints, as described previously, to validate the effectiveness of the dashboard. They observed that regular reviews of the data in the City Portal should help staff understand potential trends and develop predictive analytics regarding causes of water qual-ity issues, allowing the development of software to
preemptively identify and resolve water quality issues before they became customer complaints. This would result in an overall decrease in the total number of water quality complaints per month. In addition, staff reported that consolidation of the various data sources in the water quality module would enable them to troubleshoot and respond to complaints more expeditiously, decreasing the average time to
respond to these complaints.Baseline data (i.e., pre-dash-
board implementation) were collected from Jan. 1, 2017, through Feb. 28, 2018. Post-dashboard implementation data collection began on Mar. 1, 2018. The average total number of water quality com-plaints was reduced from 10.6 (pre-dashboard implementa-tion) to 4.8 (post-dashboard implementation). The average time to respond to water qual-ity complaints was reduced by over 25%, from 4.0 to 2.9 hours. These results indicate that the dashboard has helped staff reduce complaints and respond more quickly when there is a problem. Normal f luctuations in the measures continue, but the overall trends are promising.
Aside from tracking these KPIs, staff reported that the dashboard was useful in identi-fying and responding to issues. Some examples from their log-books are as follows:
• On the evening of Mar. 12, 2018, staff received a water quality complaint about brown water at a local medical facility. The staff investigated potential causes at the facility, tested the chlorine residual, and then flushed the system. To determine whether this was a wider concern, staff looked at water quality complaints over the past several days on the dashboard to look for similar or possibly related concerns in the area. Staff also looked at
The Smart City Dashboard Vision
Figure 3
Source: Presented at the 2016 National Institute of Standards and Technology Global Cities Technology Challenge annual conference
• FEATURE Development o f a Smar t C i t y
FEBRUARY 2020 • VOL.112 • NO.2 37
chlorine residuals at nearby water quality sensors. The system showed good chlorine residual, and there were no trending complaints. This event was most likely an isolated incident at the facility rather than a larger system issue. Staff have followed up with the facility, but the dashboard helped inform the conver-sation and the response.
• On Mar. 6, 2018, staff received a customer complaint about a chemical taste in the drinking water. Staff looked at other customer complaint data on the dashboard and did not discover any similar calls in the vicinity. Staff were able to isolate the complaint as a local issue.
• On Mar. 22, 2018, staff received a complaint regarding discolored drinking water. Staff checked the dashboard and identified that there had not been a water main break near the call but found that crews had per-formed water main flushing on the customer’s street.
ConclusionThe City of Bellevue now has a fully operating water mod-ule as the basis for its City Portal. The City Portal has been designed to flexibly integrate future technology advancements and additional requirements from the city departments. This flexibility, both now and in the future, will enable Bellevue and other cities to make better use of their data streams to reduce costs, improve efficiencies, and enhance services within communities.
Similar to implementation of any IT project, the dash-board’s success depended on the extent to which it ad-dressed user requirements, and a business process flow was set up to maximize its usefulness. Simply accessing existing data sources proved to be a sufficient challenge, but once they were integrated, users immediately realized the ben-efits of viewing multiple time-series data sets geospatially on the same portal. After the dashboard was implemented, users quickly identified the potential benefits of machine learning in creating data signatures for combinations of data sets that have adaptive alarms to notify staff of anom-alies. In the end, a smart city must provide tangible benefits to justify the cost of planning, development, and implemen-tation. Success means more than having an operational system; the solution should also improve decision-making, help operations become more efficient, and make all depart-ments more responsive. The City of Bellevue Utilities will continue to consider improvements to its dashboard and will incorporate machine-learning capabilities as it intro-duces additional data sets to increase future functionality.
AcknowledgmentPortions of this publication and research efforts are made possible through the support of NIST via
federal cooperative agreement #70NANB16H275. Along with the authors, key project team members include Andrew Lee, Todd Dahlberg, Michael Pan, and Uma Singh, with the City of Bellevue; Sharon Frazier, with Jacobs; and Aaron Simkin and Shyam Vasiraju, with Quantela.
DisclaimerOfficial contribution of NIST and not subject to copyright in the United States. Certain commercial products are identified to adequately specify the procedure; this does not imply endorsement or recommendation by NIST, nor does it imply that such products are necessarily the best available for the purpose presented here.
About the Authors
Chelo Picardal is the City of Bellevue’s chief technology officer, Bellevue, Wash.; [email protected].
Brian Pugliese is Smart Water Technology program manager with the City of Bellevue.
Sokwoo Rhee is associate director of cyber-physical sys-tems innovation at NIST in Gaithersburg, Md.
Cuong Nguyen is in NIST’s Smart Grid and Cyber-Physical Systems Program office.
Raja Kadiyala is a global director of digital solutions at Jacobs in Oakland, Calif.
Ken Thompson is a global technology leader at Jacobs in Englewood, Colo.
https://doi.org/10.1002/awwa.1446
AWWA Resources • Water Utilities Look to Smart Technologies in 2018. Fillinger, J., 2018. Opflow, 44:1:8. https://doi.org/10.5991/OPF.2018.44.0005.
• Fixing the Future of Wastewater Systems With Smart Water Network Modeling. Boulos, P.F. & Walker, A.T., 2015. Journal AWWA, 107:4:72. https://doi.org/10.5942/jawwa.2015.107.0057.
• How Smart Is Your City? Quraishi, A. & Siegert, D., 2011. Journal AWWA, 103:7:42. https://doi.org/10.1002/j.1551-8833.2011.tb11483.x.
These resources have been supplied by Journal AWWA staff. For information on these and other AWWA resources, visit www.awwa.org.