Development and Sustainability of Emerging Health Insurance Markets: Evidence from Microinsurance in Pakistan Yi (Kitty) Yao Department of Actuarial Science, Risk Management and Insurance, School of Business, University of Wisconsin at Madison, Madison, WI, U.S. E-mail: [email protected]Despite widespread interest in expanding insurance at the bottom of the economic pyramid, the viability of emerging microinsurance programmes is questioned because of their high loss ratios and doubts about their sustainability. The purpose of this research is to derive implications for the viable provision of products for emerging microinsurers by investigating the degree of sustainability of a micro health insurance programme in its early years of development. Using data from a micro health insurance programme in Pakistan, this paper analyses how claim rates evolve as households renew their policies and finds that households that have larger claims during the policy period are more likely to renew their policies for the next period. Although on the surface that pattern is consistent with adverse selection and decreasing sustainability, it was found instead that when compared with households buying the insurance for the first time, renewed households have significantly lower claim frequency and total claim amounts. Taken together, these results may suggest that there are forces affecting insurance demand for renewed households that may lead to an improved risk portfolio. The Geneva Papers (2013) 38, 160–180. doi:10.1057/gpp.2012.19 Keywords: sustainability; micro health insurance; selection; Pakistan Introduction Although low-income individuals rank insurance covering health risk as one of the most needed, the provision of health insurance to low-income individuals in developing countries is still very limited because of the complexity of delivering healthcare in less developed areas. Both acute and chronic diseases are serious problems for the poor in developing countries, where poor sanitation, poor nutrition and inadequate preventive care are widespread. As a result, the life expectancy for those living in low- and middle-income countries is 20 per cent lower than for those living in high-income countries. In an extreme comparison, the life expectancy for people living in sub-Saharan African is only 46 years, compared with 75.5 years in high-income countries. 1 For the poor, the consequences of illness include not only reduced current living standards but also the potential to lead them to reduce investment in their future human capital. Against that backdrop, it is perhaps 1 Table 2.3. Selected mortality characteristics by sex and World Bank region in 2001, Global burden of disease and risk factors, Oxford University Press and The World Bank, 2006. The Geneva Papers, 2013, 38, (160–180) r 2013 The International Association for the Study of Insurance Economics 1018-5895/13 www.genevaassociation.org
Transcript
Development and Sustainability of Emerging
Health Insurance Markets: Evidence from
Microinsurance in Pakistan
Yi (Kitty) YaoDepartment of Actuarial Science, Risk Management and Insurance, School of Business, University of
Despite widespread interest in expanding insurance at the bottom of the economicpyramid, the viability of emerging microinsurance programmes is questioned because oftheir high loss ratios and doubts about their sustainability. The purpose of this research isto derive implications for the viable provision of products for emerging microinsurers byinvestigating the degree of sustainability of a micro health insurance programme in its earlyyears of development. Using data from a micro health insurance programme in Pakistan,this paper analyses how claim rates evolve as households renew their policies and finds thathouseholds that have larger claims during the policy period are more likely to renew theirpolicies for the next period. Although on the surface that pattern is consistent with adverseselection and decreasing sustainability, it was found instead that when compared withhouseholds buying the insurance for the first time, renewed households have significantlylower claim frequency and total claim amounts. Taken together, these results may suggestthat there are forces affecting insurance demand for renewed households that may lead toan improved risk portfolio.The Geneva Papers (2013) 38, 160–180. doi:10.1057/gpp.2012.19
Keywords: sustainability; micro health insurance; selection; Pakistan
Introduction
Although low-income individuals rank insurance covering health risk as one of themost needed, the provision of health insurance to low-income individuals indeveloping countries is still very limited because of the complexity of deliveringhealthcare in less developed areas. Both acute and chronic diseases are seriousproblems for the poor in developing countries, where poor sanitation, poor nutritionand inadequate preventive care are widespread. As a result, the life expectancy forthose living in low- and middle-income countries is 20 per cent lower than for thoseliving in high-income countries. In an extreme comparison, the life expectancy forpeople living in sub-Saharan African is only 46 years, compared with 75.5 years inhigh-income countries.1 For the poor, the consequences of illness include not onlyreduced current living standards but also the potential to lead them to reduceinvestment in their future human capital. Against that backdrop, it is perhaps
1 Table 2.3. Selected mortality characteristics by sex and World Bank region in 2001, Global burden of
disease and risk factors, Oxford University Press and The World Bank, 2006.
The Geneva Papers, 2013, 38, (160–180)r 2013 The International Association for the Study of Insurance Economics 1018-5895/13www.genevaassociation.org
unsurprising that people with low incomes also have an interest in health insuranceprogrammes. Despite their interest, however, only 20 per cent of low-income personsare believed to have access to adequate health insurance.2
In recent years there has been an explosion of interest in the creation of newinsurance products in developing countries. Interest in these new “microinsurance”products has been closely related to the growth of interest in “microfinance” and alsooften reflects the efforts of non-profit organisations to find a way to provide insurancein the developing world. To achieve their goals, however, these organisations must finda sustainable business model. Many programmes experienced high loss ratios and highlapse rates in their beginning years. In turn, these difficulties have raised concernsamong the donors and governments that subsidise these programmes about theirsustainability. This paper focuses specifically on the viability of micro healthinsurance.
Although the long-term financial success of micro health insurance programmesrequires sound data analysis, little empirical knowledge currently exists about thisinfant market. The scant literature available paints somewhat conflicting views aboutthe potential for sustainable micro health insurance. Pauly et al.3 used data from theWorld Health Survey of 14 developing countries to compare the risk premium thatlocal people would be willing to pay and developed likely values for administrativeexpenses. Without taking information asymmetry into account, they concluded that avoluntary health insurance market might be feasible. In contrast, Biener and Eling4
examined the problems and solutions for microinsurance markets. Based on a surveyof studies, they concluded that problems of information asymmetry were “epidemic”in micro health insurance and cited as evidence examples in the literature thatranged from adverse selection to moral hazard to fraud, which raise concerns forsustainability.
This paper addresses this debate by studying the development of a microinsurer’srisk portfolio in its early years of operation. In particular, it examines households’renewal decisions. The results reveal the claim trends in renewal business. A betterunderstanding of these trends and of the forces driving them will help improve thesustainability of micro health insurance programmes.
This study uses data from the Aga Khan Agency for Microfinance (AKAM), whichoperated a simple micro health insurance programme in Pakistan from 2007 to 2011.5
One important issue with sustainability is selection; however, testing for the nature ofselection in microinsurance markets presents unique challenges. Most studies ofselection issues in insurance must overcome the inability to observe outcomes forpeople who do not purchase insurance. In developed markets, researchers typicallyapproach these issues by using tests for adverse selection that analyse differences inclaim experience across insureds who purchase different amounts of insurance.6 Incontrast, however, in developing markets, as with the AKAM product studied here,
2 Bockstal (2008).3 Pauly et al. (2008).4 Biener and Eling (2012).5 In April 2011, the programme was moved from AKAM to New Jubilee Life Insurance Company.6 See Chiappori and Salanie (2000).
Yi (Kitty) YaoDevelopment and Sustainability of Emerging Health Insurance Markets
161
customers are given only one coverage option. This is done as a way to hold downadministrative costs and keep the products simple for a population inexperienced ininsurance purchasing. Consequently, the standard “positive correlation” test betweencoverage level and risk is not feasible.
Faced with the inability to use this standard test, I examined the viability of microhealth insurance instead by looking into households’ renewal decisions. Specifically, Ianalysed the trend of sustainability by measuring the development of claim experiencesin renewal policies. A two-part model was used to compare the microinsurer’s newbook of business to its renewed book of business and to test whether the risk pool haddeteriorated over time. The status of the risk pool sheds light on the sustainability ofthe microinsurer’s business.
From a theoretical standpoint, the development of renewal policies could resultin either increasing or decreasing sustainability. On the one hand there are forcesleading to decreased sustainability via the renewal business in the sense that peoplewith higher risks might be more likely to stay with an insurer. One classic version ofthe adverse selection story here would be if policyholders have private informationabout their risk type and suffer unrelated income shocks that affect whether theycan afford insurance. In that case, it would be expected that those who know theyare at especially high risk would be less likely to cancel insurance because of anincome shock; retention of such policyholders would result in a deteriorating bookof business in terms of renewed policies. Another possibility motivating people athigher risk to stay with a programme is that people might learn about their risktype over time—for instance, learning about a pregnancy. If people act on that newinformation, one would expect adverse selection as those aware of their higher riskchoose to renew while low risks do not.
On the other hand, other forces that affect the renewal decision may be unrelated torisk type and could even result in increasing sustainability. First, more financiallysavvy people might be more likely to renew; if they are healthier, then their renewalsimprove the risk portfolio in terms of sustainability. Second, more risk averse peopleare more likely to renew; however, these policyholders tend to be healthier andtherefore could also improve sustainability. Last but not least, in new markets likePakistan people are starting to learn the value of insurance and how it protects theirfinancial stability and flexibility. People who experience a major treatment that mightbe unlikely to happen again (as in appendectomies and cholecystectomies) still maywant to renew because they better understand and appreciate the value of insurance.These people could well be healthier because of the treatment received; therefore itcould improve the risk portfolio. Ultimately, the direction to pursue to achievesustainability in this type of micro insurance market is an open empirical question.
I analysed how claim rates evolve as households renew their policies and found thathouseholds that have larger claims during the policy period are slightly more likely torenew their policy for the next period. Although that pattern is superficially consistentwith adverse selection and decreasing sustainability, it was found instead that whencompared with households buying insurance for the first time, renewed householdshave significantly lower claim frequency and total claim amounts. Taken togetherthese results may suggest that there are forces affecting demand for insurance byrenewed households that may lead to an improved risk portfolio.
The Geneva Papers on Risk and Insurance—Issues and Practice
162
The remainder of this paper proceeds as follows. The “Information asymmetry inemerging health insurance markets and related literature” section presents an overviewhighlighting work on information asymmetry in general and explores the small bodyof literature on micro health insurance. The “AKAM micro health insuranceprogramme and data” section introduces the programme and the data used inempirical analysis. The “Empirical models and results” section discusses the modelsand results, and the last section presents the conclusions.
Information asymmetry in emerging health insurance markets and relatedliterature
Introduction to information asymmetry: review of theory and existing approaches
The theory of asymmetric information was first established in the 1970s through theseminal work of Akerlof, Pauly, and Rothschild and Stiglitz,7 and it was furtherdeveloped by later generations of scholars.8 In the classic Rothschild-Stiglitz model,insureds were assumed to be of different risk types, and it resulted in a separatingequilibrium in which low-risk individuals bought partial insurance with reducedwelfare and high-risk individuals bought full insurance. These theories motivatedusing risk classification as a solution to overcome adverse selection because if aninsurance company could differentiate the low-risk purchasers from those of high risk,it could offer different contracts to both groups and improve the welfare of society. Inaddition, these theories established the rationale of testing for adverse selection in agiven market by using the “positive correlation test” between risk type and insurancecoverage purchased. For example, Puelz and Snow9 used data from the auto insurancemarket of the United States and found those with higher accident risk choose lowerdeductibles (more insurance coverage), a finding that agreed with the predictedoutcome of the “positive correlation test”.
Scholars tested for adverse selection in various markets using different proxies forrisk type and insurance coverage.10 The most common proxies for insurance coverageare policies with different levels of deductibles and copayments, decisions to opt in andout of insurance, and the option to purchase supplemental insurance. Proxies for risktype ranged from subjective measurement (self-evaluated health condition) toobjective ones (indicators such as age and medical history) and predicted risk type.11
Others12 have found a negative, rather than positive, relationship between risk typeand insurance coverage, which indicates that low-risk individuals purchased moreinsurance coverage. This negative relationship observed in empirical tests was referredto as advantageous selection in contrast to the traditional term of adverse selection.Besides risk preference, various other sources of advantageous selection have been
7 Akerlof (1970); Pauly (1974); Rothschild and Stiglitz (1976).8 See Miyazaki (1977); Wilson (1977); Finkelstein and McGarry (2006).9 Puelz and Snow (1994).
10 See Cohen and Siegelman (2010) for a review.11 See Browne (1992, 2006); Gao et al. (2009).12 See Bolhaar et al. (2008); Fang et al. (2008); Gao et al. (2009); Einav and Finkelstein (2011).
Yi (Kitty) YaoDevelopment and Sustainability of Emerging Health Insurance Markets
163
proposed, including heterogeneity in income, education, health preferences, financialplanning horizons and cognitive ability.
Information asymmetry in micro health insurance programmes
Although the basic predictions of insurance theory should largely function similarlyfor microinsurance, the nature of the product imposes a number of challenges in adeveloping market.13 Microinsurance as an emerging product for low-income peoplein developing countries could suffer from adverse selection in a vital way, especiallybecause of a limited capability to assess and classify risks. Because of the need toreduce administrative costs while keeping the product simple, microinsurance productsare often designed to be universal without deductible or coinsurance options. Thisdesign for universality is mainly for two reasons. First, it fits the financial literacy oflow-income individuals. Usually a microinsurance policy is the first insurance policythat a low-income individual purchases; deductibles and coinsurance require moresophisticated knowledge about insurance than these individuals usually possess.Without proper education of purchasers and easily understood handling of theirclaims, misunderstandings could occur that would ruin the reputation of the insurerand of insurance overall before the market could fully develop. Second, insurers arereluctant to implement more sophisticated policy features because they want to holddown administrative costs. Effectively administering policies with deductibles andcoinsurance requires electronic recordkeeping, and it may be necessary to implement asystem to track and verify claims onsite at every clinic. Most microinsurers have notyet invested in these technologies and infrastructure.
Because microinsurance markets remain relatively immature and data is ofteninaccessible and imperfect, only a few empirical studies have focused on testingadverse selection in this market. However, those that have explored the subject, usingvarious methodologies, all found evidence to support the existence of adverse selectionin micro health insurance markets of different countries in different time periods.
A series of studies on adverse selection have been conducted using data from a ruralmutual health-care insurance project in China. Wang et al.14 followed a voluntarymutual health-care insurance programme from 2002 to 2006 and performed a paneldata analysis. Using individual level data, they found strong evidence of adverseselection despite a high enrolment rate and a requirement that an entire householdenroll as a unit. In particular, they found the pre-enrolled medical expenditures forenrolled individuals were 9.6 per cent higher than the average expenditure for allresidents. In addition, the enrolled members of a partially enrolled family spent 1.7times more than the non-enrolled members of a partially enrolled family. Zhang andWang15 also observed that people with histories of chronic conditions and those in fairor poor health overall were more likely to enroll in the programme, showing the
13 Brau et al. (2009).14 Wang et al. (2006).15 Zhang and Wang (2008).
The Geneva Papers on Risk and Insurance—Issues and Practice
164
existence of adverse selection. The extent of adverse selection, however, seemed to bestable over the study period.
Similarly, Ito and Kono16 found evidence of adverse selection in a micro healthinsurance programme in India because households with a higher ratio of sick memberswere more likely to purchase insurance.
Using historical survey data of American short-term disability microinsurance in theearly 20th century, Murray17 found prima facie evidence of asymmetric information,with evidence for the presence of adverse selection outweighing the presence of moralhazard. In addition, it was shown that the countermeasures taken by themicroinsurers, including the enforcement of a trial period and waiting period,effectively reduced claims.
In this study, testing for adverse selection using the traditional “positive correlationtest” is not feasible using the Pakistan programme studied here because the producthad a simple design providing the same coverage for all. Instead I examined thedevelopment of risk portfolios as households renewed their policies. This approachhelps to reveal the trends in risk portfolios in the renewal business as well as to shedlight on the trend of sustainability.
AKAM micro health insurance programme and data
AKAM programme background
The AKAM Microinsurance Initiative began in 2006, with support from the Bill andMelinda Gates Foundation. AKAM is owned by the Aga Khan DevelopmentNetwork (AKDN), and it started its pilot enrolment period for an annual micro healthinsurance policy in the Northern Area (NA)18 of Pakistan in November 2007. NA,located in the mountainous part of Pakistan, is the country’s northernmost politicalentity and has an estimated l.35 million people scattered across six districts. Makinghealth insurance available to the region’s poor for the first time is a milestone in theprovision of social services to the area. In the three years since the programme waslaunched, over 100,000 members have been enrolled, or about 7.5 per cent of the localpopulation.
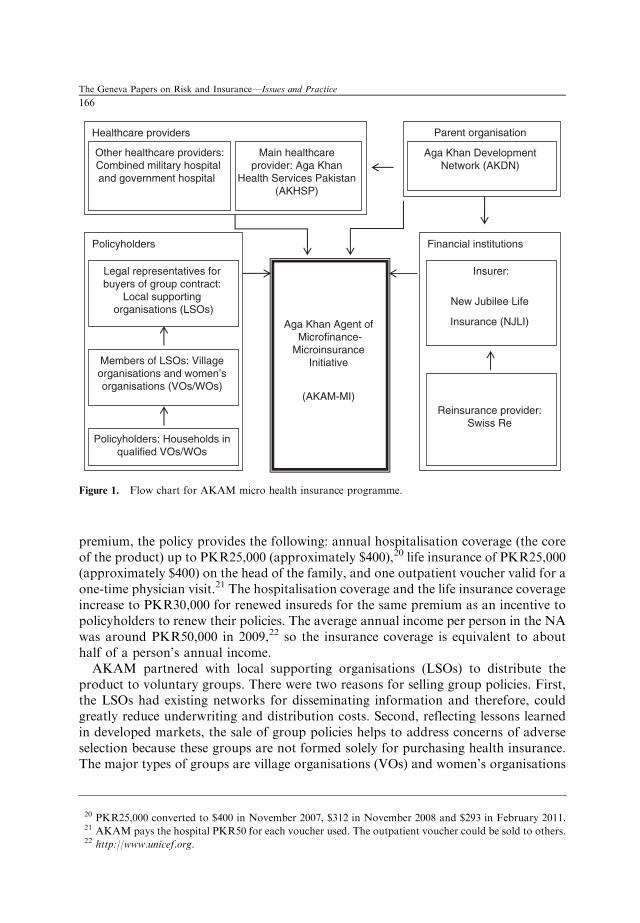
Figure 1 shows the flow chart for the operation and organisations associated withthe micro health insurance programme.
The coverage and premiums are the same for every member, and the individualannual premium of 400 Pakistan rupees (PKR) (approximately $5.60) is paid upfront.19 There is no individual risk classification in underwriting. In exchange for this
16 Ito and Kono (2010).17 Murray (2011).18 The Northern Area (NA) is now known as Gilgit-Baltistan (GB).19 The premium was PKR350 in November 2007. It increased to PKR400 in November 2008 and stayed the
same in July 2009 and November 2009. It increased again to PKR450 for new insureds in two LSOs
(ZADO and Danyore) in July 2010, but stayed the same for all the other insureds. In the data analysis,
those households affected by the price increase were excluded from the sample, resulting in a loss of 199
observations.
Yi (Kitty) YaoDevelopment and Sustainability of Emerging Health Insurance Markets
165
premium, the policy provides the following: annual hospitalisation coverage (the coreof the product) up to PKR25,000 (approximately $400),20 life insurance of PKR25,000(approximately $400) on the head of the family, and one outpatient voucher valid for aone-time physician visit.21 The hospitalisation coverage and the life insurance coverageincrease to PKR30,000 for renewed insureds for the same premium as an incentive topolicyholders to renew their policies. The average annual income per person in the NAwas around PKR50,000 in 2009,22 so the insurance coverage is equivalent to abouthalf of a person’s annual income.
AKAM partnered with local supporting organisations (LSOs) to distribute theproduct to voluntary groups. There were two reasons for selling group policies. First,the LSOs had existing networks for disseminating information and therefore, couldgreatly reduce underwriting and distribution costs. Second, reflecting lessons learnedin developed markets, the sale of group policies helps to address concerns of adverseselection because these groups are not formed solely for purchasing health insurance.The major types of groups are village organisations (VOs) and women’s organisations
Parent organisation
Policyholders
Healthcare providers
Aga Khan Agent of Microfinance-
Microinsurance Initiative
(AKAM-MI)
Financial institutions
Reinsurance provider: Swiss Re
Insurer:
New Jubilee Life
Insurance (NJLI)
Legal representatives for buyers of group contract:
Local supporting organisations (LSOs)
Members of LSOs: Village organisations and women’s organisations (VOs/WOs)
Policyholders: Households in qualified VOs/WOs
Other healthcare providers:Combined military hospital and government hospital
Main healthcare provider: Aga Khan
Health Services Pakistan (AKHSP)
Aga Khan Development Network (AKDN)
Figure 1. Flow chart for AKAM micro health insurance programme.
20 PKR25,000 converted to $400 in November 2007, $312 in November 2008 and $293 in February 2011.21 AKAM pays the hospital PKR50 for each voucher used. The outpatient voucher could be sold to others.22 http://www.unicef.org.
The Geneva Papers on Risk and Insurance—Issues and Practice
166
(WOs), and their members could purchase health insurance through the VOs/WOs ifat least 50 per cent of the households in the organisation agreed, in the test survey, topurchase the product if it were available. In addition, the entire household is requiredto enroll in the programme in order to alleviate adverse selection.
AKAM relies on an existing network of VOs and WOs for product distribution. Bythe end of 2005, the NA had over 4,000 VOs and WOs that represented over 78 percent of the total households.23 VOs/WOs are grass-root community organisations thatwere first developed to improve the capability of households to undertake villagedevelopment initiatives. For example, projects have included obtaining funding andorganising the villagers to work on infrastructure projects such as minor irrigationworks, flood protection, erosion control and linking of roads. In addition, VOs/WOswere also involved in organising informal community-based micro loans among theirmembers before AKAM started its formal microfinance service in the area. Morerecently, these organisations have become key players in providing supportivenetworks to enlarge communities’ assets and harness individuals’ skills to generatesustainable forms of income.
LSOs are large organisations working for the member organisations in the area andmay consist of 50 or more villages. They are nonprofit organisations set up in a jointeffort with the Aga Khan Rural Support Program (AKRSP) and the local population andserve as registered legal entities under Pakistani law. LSOs are the vehicles for VOs andWOs, which are not registered organisations, to enter into legal agreements as a group orsubgroup. Gradually, LSOs have obtained project funding and broadened their services.
AKAM initiated policies for New Jubilee Life Insurance Company (NJLI), which isa commercial insurer based in Karachi, Pakistan, and also owned by AKDN.24 TheLSO enters into an agreement with AKAM, which has been appointed by NJLI torepresent it in all matters pertaining to the health microinsurance programme. TheLSOs contract with NJLI on behalf of household members living in their VOS/WO.
AKAM chose the NA as the first area in which to provide health insurance becauseof the high profile AKDN has there. The main health service provider, Aga KhanHealth Services Pakistan (AKHSP), which is a part of AKDN, has operated in the NAfor over 30 years. It has three hospitals and 25 primary care facilities in the NA, andover 90 per cent of the claims from the AKAM micro health insurance programme arehandled within AKHSP systems. In addition, the Combined Military Hospital (CMH)and a government hospital are located in the NA; these two facilities handle less than10 per cent of the claims, with most of these associated with emergency services.
Data
The empirical application uses a data set composed of household level information,including some basic demographics on the age and gender of the head of the house-hold, members’ ages and gender, and household size. The VO and LSO to which the
23 The Aga Khan Rural Support Program, an assessment of the institutional development of village and
women’s organisations, the AKRSP’s Institutional Development Survey 2006.24 In regard to the reinsurance arrangements, AKAM arranged a stop loss contract with Swiss Re.
Yi (Kitty) YaoDevelopment and Sustainability of Emerging Health Insurance Markets
167
household belongs are also recorded. The data set also has some policy-levelinformation such as policy limit, renewal status and enrolment date. Moreover, itcontains detailed information on claims made during the policy periods.
There have been six enrolment periods since the programme was launched in November2007. Each policy lasts for one year, and the enrolment window was opened for only onemonth in November at the beginning to help alleviate adverse selection by not allowingpeople to buy insurance policies right after they know surgeries were needed. In addition,it helped reduce the administrative and distribution costs. In addition to the fourNovember waves of enrolment from 2007 to 2010, a July enrolment window was openedin 2009 because of the increasing demand for health insurance and improved recognitionof the income cycle for local households.25 The policy was made available to householdsin the VOs/WOs that met the minimum enrolment requirement. The programme alsoexpanded into a few new VOs/WOs in the same area during the July enrolment periods.
The first enrolment period in November 2007 was a pilot programme; therefore,detailed information was not collected at the time. Because of this lack of data, thefirst period was omitted from the data analysis. For the fifth enrolment period thatbegan July 2010, claim data is available only through November 2010. Because thisresults in only part-year claim data for that enrolment window, any analysis based onthat period uses the available claim data scaled up to an annual basis. The sixthenrolment period, which started in November 2010, is excluded from the analysisbecause of lack of access to the data.
To sum up, the data analysis is based on data from four available enrolmentperiods: November 2008, July 2009, November 2009 and July 2010. The data fromthese four totals 16,225 household-year observations and 64,172 member-yearobservations.
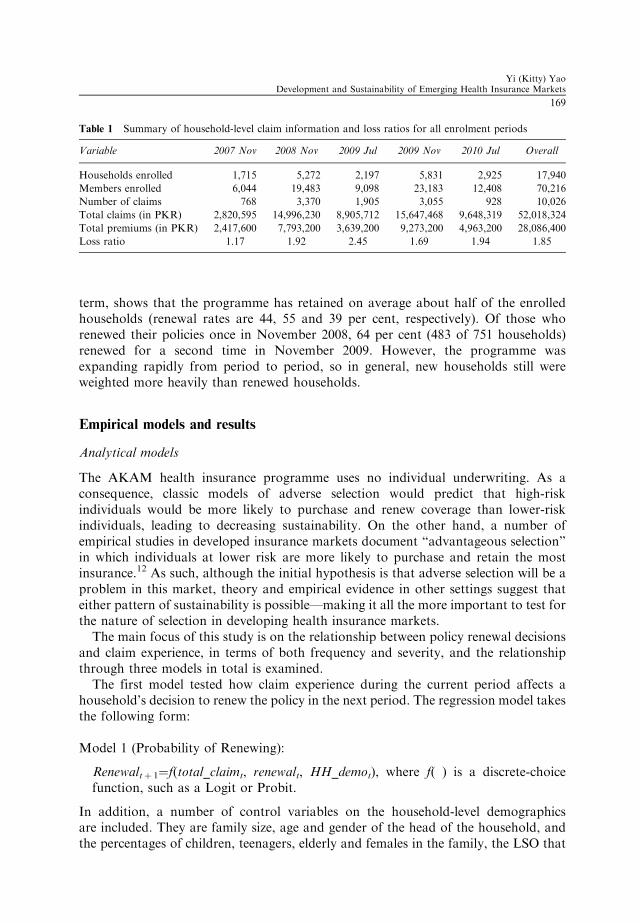
Because the two key variables to examine are claim experience (in terms offrequency, severity and total amount) and renewal status, detailed information onthose variables across different enrolment periods is summarised in Table 1.
Table 1 shows that the claim experience and loss ratio fluctuated across differentenrolment periods. The overall loss ratio for five periods was 1.85. For the threeNovember waves of enrolment, the claim experience and its corresponding loss ratioincreased in 2009 and then decreased in 2010. For the two July waves of enrolment, theclaim experience was very high at first and then decreased.
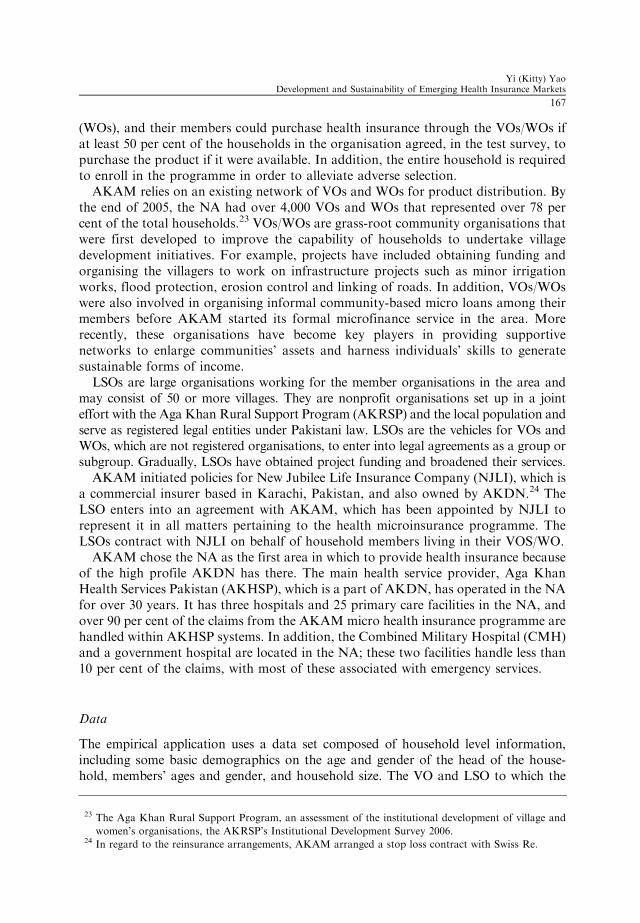
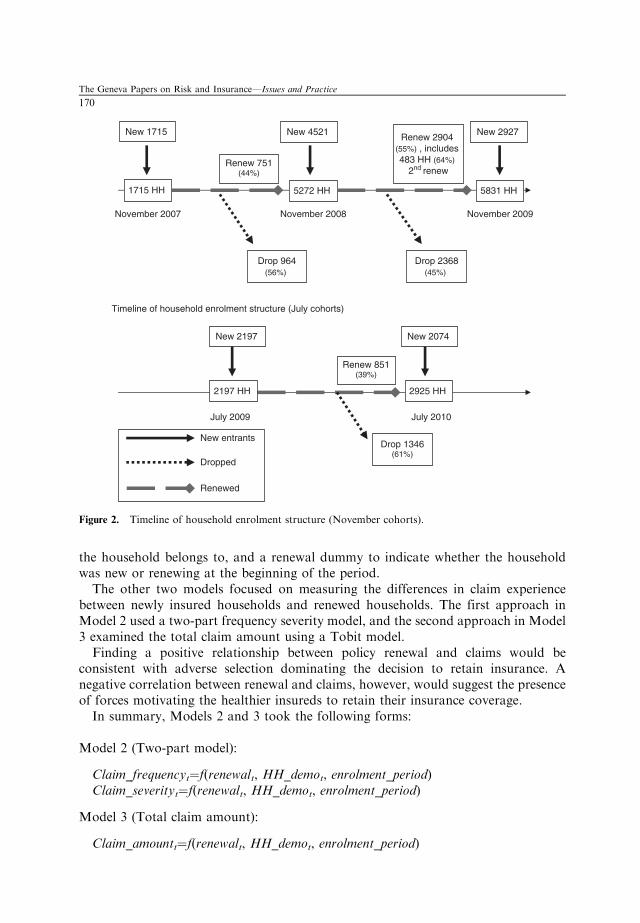
Households’ decisions to opt in/out and renew policies is one of the key variables ofinterest, so Figure 2 describes the timeline of the household enrolment structure forboth the November and July cohorts.
In the first enrolment waves in both July and November, all households were new,but enrolment in the other three periods was a combination of new households andhouseholds that were renewing from the previous periods. The renewal rate, defined asthe percentage of households that chose to renew their policies at the end of the policy
25 Originally November was chosen as the month to open the enrolment window because after the autumn
harvest most of the farmers had cash to pay the premium. Then it was discovered that there was another
group of local residents whose main income flow came in the summer from tourism, so a July enrolment
month was added to accommodate these residents.
The Geneva Papers on Risk and Insurance—Issues and Practice
168
term, shows that the programme has retained on average about half of the enrolledhouseholds (renewal rates are 44, 55 and 39 per cent, respectively). Of those whorenewed their policies once in November 2008, 64 per cent (483 of 751 households)renewed for a second time in November 2009. However, the programme wasexpanding rapidly from period to period, so in general, new households still wereweighted more heavily than renewed households.
Empirical models and results
Analytical models
The AKAM health insurance programme uses no individual underwriting. As aconsequence, classic models of adverse selection would predict that high-riskindividuals would be more likely to purchase and renew coverage than lower-riskindividuals, leading to decreasing sustainability. On the other hand, a number ofempirical studies in developed insurance markets document “advantageous selection”in which individuals at lower risk are more likely to purchase and retain the mostinsurance.12 As such, although the initial hypothesis is that adverse selection will be aproblem in this market, theory and empirical evidence in other settings suggest thateither pattern of sustainability is possible—making it all the more important to test forthe nature of selection in developing health insurance markets.
The main focus of this study is on the relationship between policy renewal decisionsand claim experience, in terms of both frequency and severity, and the relationshipthrough three models in total is examined.
The first model tested how claim experience during the current period affects ahousehold’s decision to renew the policy in the next period. The regression model takesthe following form:
Model 1 (Probability of Renewing):
Renewaltþ 1¼f(total_claimt, renewalt, HH_demot), where f( ) is a discrete-choicefunction, such as a Logit or Probit.
In addition, a number of control variables on the household-level demographicsare included. They are family size, age and gender of the head of the household, andthe percentages of children, teenagers, elderly and females in the family, the LSO that
Table 1 Summary of household-level claim information and loss ratios for all enrolment periods
Variable 2007 Nov 2008 Nov 2009 Jul 2009 Nov 2010 Jul Overall
Members enrolled 6,044 19,483 9,098 23,183 12,408 70,216
Number of claims 768 3,370 1,905 3,055 928 10,026
Total claims (in PKR) 2,820,595 14,996,230 8,905,712 15,647,468 9,648,319 52,018,324
Total premiums (in PKR) 2,417,600 7,793,200 3,639,200 9,273,200 4,963,200 28,086,400
Loss ratio 1.17 1.92 2.45 1.69 1.94 1.85
Yi (Kitty) YaoDevelopment and Sustainability of Emerging Health Insurance Markets
169
the household belongs to, and a renewal dummy to indicate whether the householdwas new or renewing at the beginning of the period.
The other two models focused on measuring the differences in claim experiencebetween newly insured households and renewed households. The first approach inModel 2 used a two-part frequency severity model, and the second approach in Model3 examined the total claim amount using a Tobit model.
Finding a positive relationship between policy renewal and claims would beconsistent with adverse selection dominating the decision to retain insurance. Anegative correlation between renewal and claims, however, would suggest the presenceof forces motivating the healthier insureds to retain their insurance coverage.
In summary, Models 2 and 3 took the following forms:
Timeline of household enrolment structure (July cohorts)
July 2010 July 2009
1715 HH 5272 HH 5831 HH
New 1715 New 4521 New 2927
Drop 964(56%)
Drop 2368(45%)
Renew 751(44%)
Renew 2904 (55%) , includes 483 HH (64%)
2nd renew
2197 HH 2925 HH
Renew 851(39%)
Drop 1346(61%)
New entrants
Dropped
Renewed
New 2197 New 2074
Figure 2. Timeline of household enrolment structure (November cohorts).
The Geneva Papers on Risk and Insurance—Issues and Practice
170
The primary measures of claim experience are claim frequency, claim severity andtotal claim amount; the latter equals the product of claim frequency and severity. Inthe two-part model, claim frequency is used, defined as a dummy variable indicatingthat the household filed at least one claim in the policy year, as the dependent variable.It is modelled with Logit regression in the first part. Then, conditioned on thehousehold having at least one claim, claim severity is used, defined as total claimamount for the household in a policy year, as the dependent variable. Then OLS isused to model the natural log transform of claim severity. As an alternative to the two-part model, Model 3 is also included using annual claim amounts as the dependentvariable as a sensitive test. For this specification a Tobit model is used left censored atzero to take into account the presence of a large number of zeros in the dependentvariable.
In both Models 2 and 3, I began by using only renewal status as the independentvariable in specification [1], and then additional control variables were also included tomeasure other policyholder characteristics that might affect claim experiencethroughout models 2 and 3 in specification [2]. The additional control variables werelog of family size, age of the head of household, gender of the head of the household,family structure (percentages of members that are children, teenagers, elderly andfemale) and geography (the LSO that the insured household belongs to).
Results
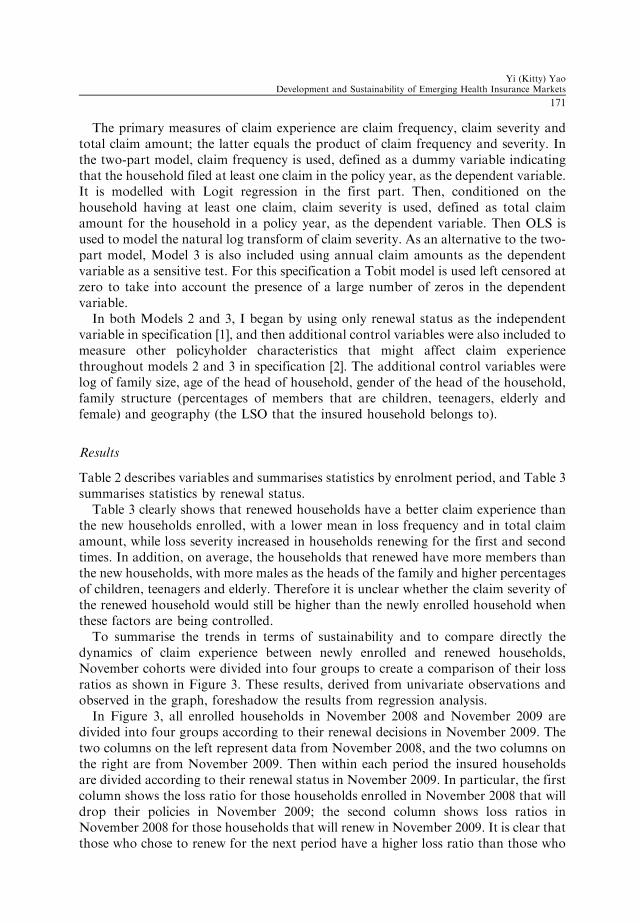
Table 2 describes variables and summarises statistics by enrolment period, and Table 3summarises statistics by renewal status.
Table 3 clearly shows that renewed households have a better claim experience thanthe new households enrolled, with a lower mean in loss frequency and in total claimamount, while loss severity increased in households renewing for the first and secondtimes. In addition, on average, the households that renewed have more members thanthe new households, with more males as the heads of the family and higher percentagesof children, teenagers and elderly. Therefore it is unclear whether the claim severity ofthe renewed household would still be higher than the newly enrolled household whenthese factors are being controlled.
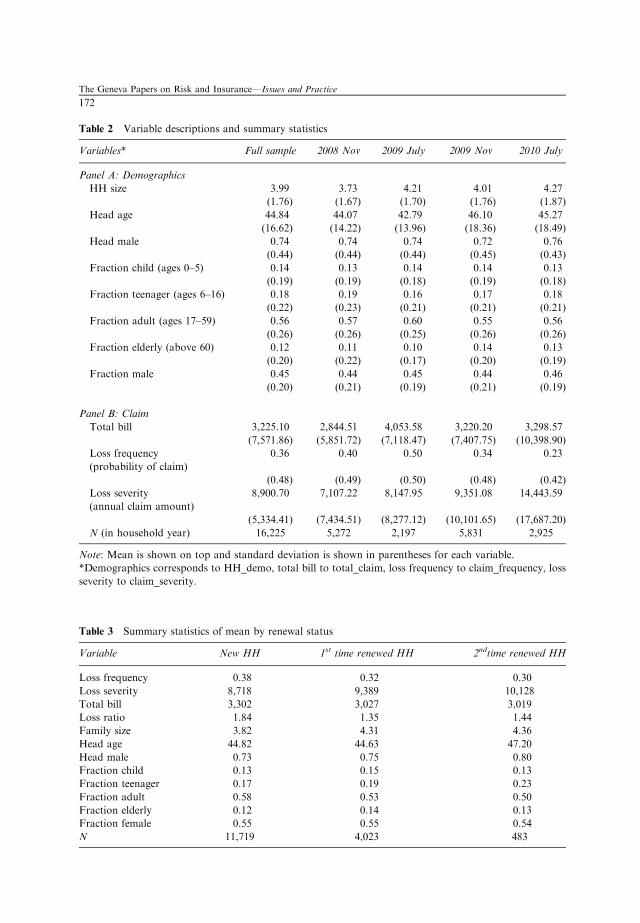
To summarise the trends in terms of sustainability and to compare directly thedynamics of claim experience between newly enrolled and renewed households,November cohorts were divided into four groups to create a comparison of their lossratios as shown in Figure 3. These results, derived from univariate observations andobserved in the graph, foreshadow the results from regression analysis.
In Figure 3, all enrolled households in November 2008 and November 2009 aredivided into four groups according to their renewal decisions in November 2009. Thetwo columns on the left represent data from November 2008, and the two columns onthe right are from November 2009. Then within each period the insured householdsare divided according to their renewal status in November 2009. In particular, the firstcolumn shows the loss ratio for those households enrolled in November 2008 that willdrop their policies in November 2009; the second column shows loss ratios inNovember 2008 for those households that will renew in November 2009. It is clear thatthose who chose to renew for the next period have a higher loss ratio than those who
Yi (Kitty) YaoDevelopment and Sustainability of Emerging Health Insurance Markets
171
Table 2 Variable descriptions and summary statistics
Variables* Full sample 2008 Nov 2009 July 2009 Nov 2010 July
N (in household year) 16,225 5,272 2,197 5,831 2,925
Note: Mean is shown on top and standard deviation is shown in parentheses for each variable.
*Demographics corresponds to HH_demo, total bill to total_claim, loss frequency to claim_frequency, loss
severity to claim_severity.
Table 3 Summary statistics of mean by renewal status
Variable New HH 1st time renewed HH 2ndtime renewed HH
Loss frequency 0.38 0.32 0.30
Loss severity 8,718 9,389 10,128
Total bill 3,302 3,027 3,019
Loss ratio 1.84 1.35 1.44
Family size 3.82 4.31 4.36
Head age 44.82 44.63 47.20
Head male 0.73 0.75 0.80
Fraction child 0.13 0.15 0.13
Fraction teenager 0.17 0.19 0.23
Fraction adult 0.58 0.53 0.50
Fraction elderly 0.12 0.14 0.13
Fraction female 0.55 0.55 0.54
N 11,719 4,023 483
The Geneva Papers on Risk and Insurance—Issues and Practice
172
chose not to renew (2.22 compared with 1.49). This comparison suggests a likely“adverse selection” scenario.
The third column represents the loss ratio in November 2009 for those householdthat renewed from November 2008. This means these households are the same as thosein column 2, just with an updated loss ratio in November 2009. It is obvious that theloss ratio of the same group of households improved dramatically in a year (a decreasefrom 2.22 to 1.46), making their loss ratio even slightly lower than the first group.Moreover, their loss ratio is much lower than the loss ratio of newly enrolledhouseholds (1.46 compared with 1.91 in column 4).
Very similar patterns are observed in comparisons using total claim amount or claimfrequency. In November 2008, the group that will renew has a higher claim frequency,a higher total bill and a very high loss ratio in comparison with the group that will notrenew. However, a year later in November 2009, the same group of people actuallyhad a much lower claim frequency, a lower total bill and much improved loss ratiothan they experienced in the previous period. These November 2009 figures forrenewals are actually comparable to, if not lower than, the same figures for the newlyenrolled households. These patterns illustrate some of the key findings of regressionmodels in the next part.
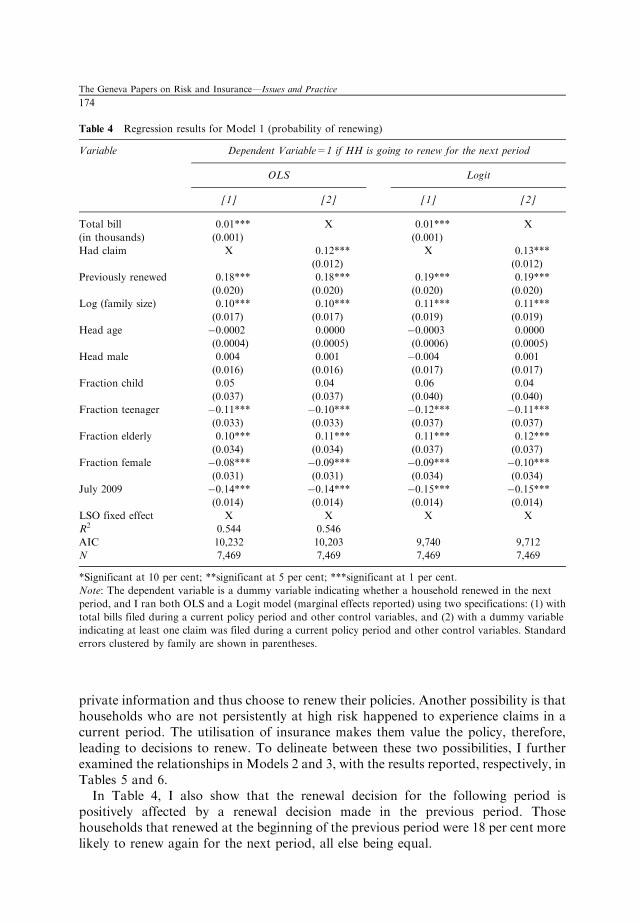
The regression results for the three models are shown in Tables 4–6, respectively.In Table 4, using the enrolment data from November 2008 and July 2009 together,I found that both the total bill during the policy year and an indicator that thehousehold had at least one claim were positively related to the renewal decision for thenext period. Every PKR1,000 increase in the current period claim increased theprobability of renewing by 1 percentage point holding other factors constant. Inaddition, those households that had at least one claim during their policy period wouldincrease their propensity to renew by 12 percentage points holding other factorsconstant.
Households with larger claim amounts in one period are more likely to renew theirpolicy in the next. This could happen for a number of reasons. First, traditional“adverse selection” scenarios may be at work in which high-risk households have
Figure 3. Loss ratio comparison for November cohorts.
Yi (Kitty) YaoDevelopment and Sustainability of Emerging Health Insurance Markets
173
private information and thus choose to renew their policies. Another possibility is thathouseholds who are not persistently at high risk happened to experience claims in acurrent period. The utilisation of insurance makes them value the policy, therefore,leading to decisions to renew. To delineate between these two possibilities, I furtherexamined the relationships in Models 2 and 3, with the results reported, respectively, inTables 5 and 6.
In Table 4, I also show that the renewal decision for the following period ispositively affected by a renewal decision made in the previous period. Thosehouseholds that renewed at the beginning of the previous period were 18 per cent morelikely to renew again for the next period, all else being equal.
Table 4 Regression results for Model 1 (probability of renewing)
Variable Dependent Variable=1 if HH is going to renew for the next period
*Significant at 10 per cent; **significant at 5 per cent; ***significant at 1 per cent.
Note: The dependent variable is a dummy variable indicating whether a household renewed in the next
period, and I ran both OLS and a Logit model (marginal effects reported) using two specifications: (1) with
total bills filed during a current policy period and other control variables, and (2) with a dummy variable
indicating at least one claim was filed during a current policy period and other control variables. Standard
errors clustered by family are shown in parentheses.
The Geneva Papers on Risk and Insurance—Issues and Practice
174
Family size is another important factor in the decision to renew a policy. I used thelog of the total member count in a household as a measurement of family size toaccount for the nonlinearity between the member count and decision-making. It wasfound that every 10 per cent increase in family size resulted, on average, in a 1 per centincrease in the probability a policy would be renewed, holding other factors constant.
As for the impact of age composition, the percentage of elderly in the family had aconsistently positive impact on the renewal decision. Every 10 per cent increase in thepercentage of elderly in a household, when other factors were held constant, increased
Table 5 Regression results for Model 2 (two-part model)
Variable Frequency model Severity model
Dependent variable=1 if filed any claim Ln (claim amount+1)
Logit OLS
[1] [2] [1] [2]
1st renewal �0.06*** �0.04*** 0.11*** �0.07*
(0.008) (0.010) (0.0320) (0.036)
2nd renewal �0.08*** �0.07*** 0.23*** �0.01
(0.021) (0.023) (0.084) (0.088)
Log(family size) 0.16*** 0.05
(0.012) (0.039)
Head age �0.003*** 0.003***
(0.0003) (0.001)
Head male �0.02* �0.04
(0.011) (0.037)
Fraction child 0.10*** �0.52***
(0.024) (0.080)
Fraction teenager �0.33*** �0.19***
(0.024) (0.086)
Fraction elderly 0.03 0.17**
(0.024) (0.082)
Fraction female 0.07*** �0.18***
(0.022) (0.077)
July 2009 0.03*** 0.040
(0.013) (0.040)
November 2009 �0.04** 0.25***
(0.010) (0.035)
July 2010 �0.21*** 0.55***
(0.010) (0.053)
LSO fixed effect X X
R2 0.0027 0.9862
AIC 20,979 19,649 17,220 16,736
N 16,026 15,961 5,846 5,842
*Significant at 10 per cent; **significant at 5 per cent; ***significant at 1 per cent.
Note: For the frequency model, the dependent variable is a dummy variable indicating at least one claim was
filed during the policy period, and a Logit model (marginal effects reported) was run using two
specifications: (1) with only renewal status as an independent variable, and (2) with other control variables.
In conditions that claim frequency is greater than zero, the severity model with ln (claim amount+1) was run
as dependent variable with OLS. Standard errors clustered by family are shown in parentheses.
Yi (Kitty) YaoDevelopment and Sustainability of Emerging Health Insurance Markets
175
the probability of policy renewal by 1 per cent. The impact of the percentage ofteenagers in households was negative. Each 10 per cent increase in the percentage ofteenagers in a household decreased the probability of renewal by 1.1 per cent, but thepercentage of children had no significant impact on renewal decisions. As withteenagers, the percentage of females in a household had a consistently negative impacton renewal probability. Each 10 per cent increase in the percentage of females in ahousehold when other factors were held constant decreased the probability of renewalby 0.8 per cent.
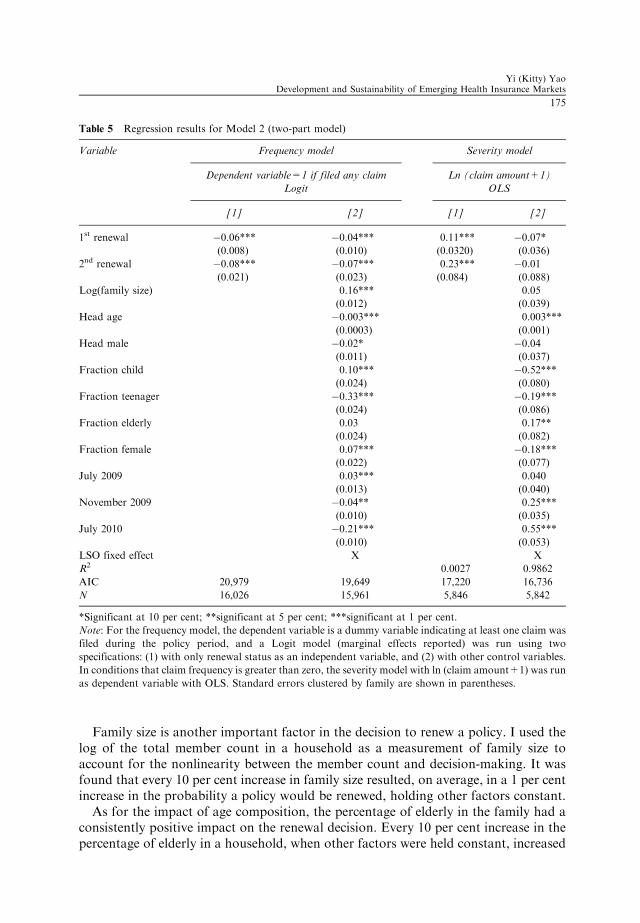
Table 5 demonstrates the regression results for the two-part model. The analysis ofclaim frequency shows that renewed households are less likely to file claims than new
Table 6 Regression results for Model 3 (Total loss amount)
*Significant at 10 per cent; **significant at 5 per cent; ***significant at 1 per cent.
Note: The dependent variable is the natural log of the total claim amount that a household incurred during
the policy year plus one. Both OLS and a Tobit model were run with the same two specifications as in
Table 5. Robust standard errors are shown in parentheses.
The Geneva Papers on Risk and Insurance—Issues and Practice
176
customers. That pattern is confirmed in both specifications in Table 5. According to aLogit model, a first-time household renewal, all else being equal, decreases theprobability of filing any claims by 4 percentage points, and a second-time renewaldecreases the probability of filing any claims by 7 percentage points.
It was also found that larger families are more likely to file claims, which is intuitive.Each 10 per cent increase in family size all else being equal leads to a 1.6 percentagepoint increase in the probability of filing claims. Households headed by females are 2percentage points more likely to file claims than households headed by males. Onepossible explanation for this difference is that households with male heads might bebetter off financially than those with female heads, leading to better nutrition andfewer claims. In addition, families with higher percentages of children and femaleshave more claims, with each 10 per cent increase, on average, affecting the probabilityof filing claims by 1 percentage point in the case of children and 0.7 percentage point inthe case of females, all else being equal.
Conditioned on each household filing at least one claim, I ran the severity model.The dependent variable is the natural log of the total claim amount during the policyyear plus one. Using the OLS model, it was found that households renewed for thefirst time have a slightly lower claim severity than newly enrolled households, and thisdifference of 7 per cent was statistically significant when all control variables wereincluded.
Overall, the significance level in the severity model is lower than in the frequencymodel. The results of the two-part model are consistent with the health literature onselection. The existence of selection is expected in frequency analysis becausehouseholds make their own decisions to seek medical services; however, selection isnot necessarily expected in severity analysis because severity is also driven by thedecisions of physicians, a situation exogenous to households’ decisions.
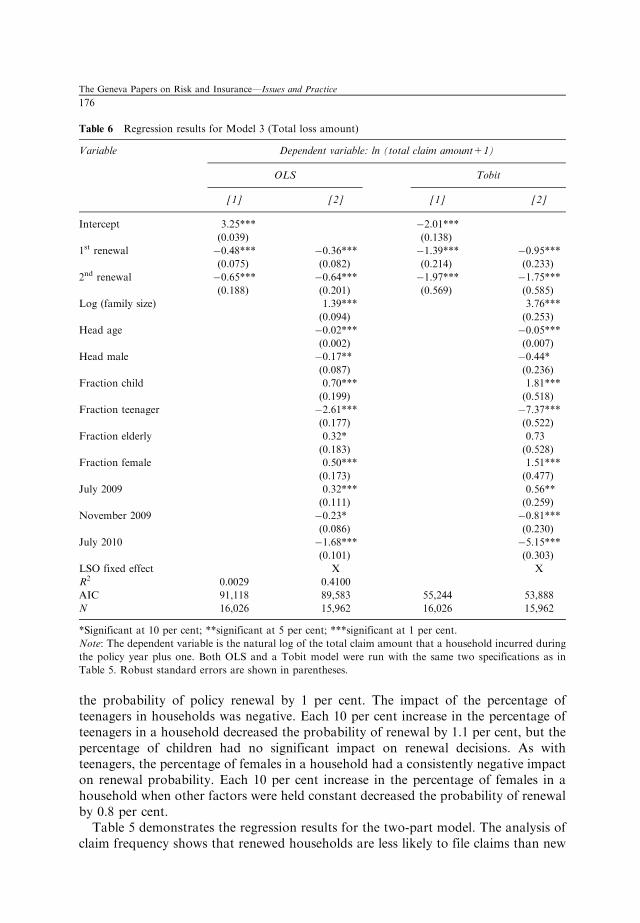
As a sensitivity test to Model 2, ran another model for the total claim amountwas also run. The results for both the OLS and the Tobit model are presented inTable 6.
The results are consistent with the two-part model by and large, showing that bothfirst-time and second-time renewals have significantly lower total claim amounts thanthose of newly enrolled households. According to the OLS model, a first-timehousehold renewal, all else being equal, decreases the size if total claim by 30percentage points, and a second-time renewal decreases the size of total claim by 47percentage points.
The coefficient estimates for the other control variables are also consistent withthe results in the previous model. Family size has a significant positive impact ontotal claims. The age of the head of household and the head of household being male,both negatively affect the total claim amount. As for age composition, having ahigher percentage of teenage family members decreases the total claim amount, andhaving more children and elderly in the household increases the total claim amountsignificantly. A higher percentage of female family members also increases the totalclaim amount.
In conclusion, the combination of the regression results and the observations inFigure 3 would seem to show even at first glance that the households that chose torenew were really bad risks, but this would not necessarily be true. Over time these
Yi (Kitty) YaoDevelopment and Sustainability of Emerging Health Insurance Markets
177
renewed households were shown to be no worse than newly enrolled households. Infact, they filed fewer claims and had a lower total claim amount than newly enrolledhouseholds. This longer-term outcome is more consistent with the explanation thatpeople who had claims valued insurance more and that this value judgement wastheir motivation to renew instead of its reflecting decisions motivated by a higherpropensity to incur a claim. This is also consistent with the fact that people indeveloping countries have pent-up health-care needs that emerge when healthinsurance is first provided. Because of this pent-up demand, the loss ratio for newlyenrolled households is high, but as time goes by, the risk portfolio may improve asthese households renew their policies. Therefore, if this trend persists, it would supportincreased sustainability for health-care insurance rather than decreasing its long-termsustainability.
Conclusion
In response to the need for affordable and quality health insurance for the poor, microhealth insurance programmes have been established with financial aid from donors inthe hope that these programmes will become sustainable in the long run. Littleempirical evidence is available about the sustainability of these infant microinsurancehealth insurance programmes in developing countries despite the critical need for dataanalysis that would advance our understanding of what is needed for the success ofthese undertakings. In an effort to meet this need, data from a micro health insuranceprogramme in Pakistan was used to examine the relationship between claim historiesand decisions to renew policies as a way to observe the development of renewalpolicies. I found that although households that filed higher amounts of claims weremore likely to renew their policies, these same households subsequently had fewerclaims and lower total claim amounts than those of newly enrolled households. Therenewed households have a much improved claim experience as time goes by, and theyhave comparable, if not better, claim frequency, total claims and loss ratios than thenewly enrolled households. Thus, the entire risk portfolio actually improves over timeinstead of deteriorating as predicted by a classic adverse selection process.
This evidence suggests that part of the problem of high loss ratios stems from aninitial surge of claims during the first year of coverage. This surge points to aconclusion that microinsurers need to realise that offering insurance for the first timeamong populations that may never have had affordable healthcare unleashes pent-updemand for health services to address a range of pre-existing conditions. Thesefindings shed light on the possibility, despite a lack of underwriting, of long-termdevelopment of sustainable micro insurance programmes in developing countries.
Acknowledgements
The author acknowledges data support from the Aga Khan Agency of Microfinance. The author also thanks
Joan Schmit, Justin Sydnor, Peter Wrede, Rui Wang, Mark Browne, Jed Frees, John Mullahy,
Margie Rosenberg, James Guszcza, Marc Ragin, Marc-Andre Desrosiers and other participants at the
2011 American Risk and Insurance Association conference in San Diego for their helpful comments and
suggestions.
The Geneva Papers on Risk and Insurance—Issues and Practice
178
References
Akerlof, G. (1970) ‘The market for “lemons”: Quality uncertainty and the market mechanism’, The
Quarterly Journal of Economics 84(3): 488–500.
Biener, C. and Eling, M. (2012) ‘Insurability in microinsurance markets: An analysis of problems
and potential solutions’, The Geneva Papers on Risk and Insurance—Issues and Practice 37(1):
77–107.
Bockstal, C. (2008) HMIS in National Social Protection Strategies: Experiences from Francophone African
Countries, presentation in the 4th International Microinsurance Conference.
Bolhaar, J., Lindeboom, M. and van der Klaauw, B. (2008) A dynamic analysis of the demand for health
insurance and health care, Tinbergen institute discussion paper, TI 2008-084/3.
Brau, J., Merrill, C. and Staking, K. (2011) ‘Insurance theory and challenges facing the development of
microinsurance markets’, Journal of Developmental Entrepreneurship 16(4): 411–440.
Browne, M. (1992) ‘Evidence of adverse selection in the individual health insurance market’, Journal of Risk
and Insurance 59(1): 13–33.
Browne, M. (2006) ‘Adverse selection in the long-term care insurance market’, in P.-A. Chiappori and
C. Gollier (eds.) Competitive Failures in Insurance Markets: Theory and Evidence, CESifo Seminar Series,
Cambridge, MA: MIT Press, pp. 97–112.
Chiappori, P. and Salanie, B. (2000) ‘Testing for asymmetric information in insurance markets’, Journal of
Political Economy 108(1): 56–78.
Cohen, A. and Siegelman, P. (2010) ‘Testing for adverse selection in insurance markets’, The Journal of Risk
and Insurance 77(1): 39–84.
Einav, L. and Finkelstein, A. (2011) ‘Selection in insurance markets: Theory and empirics in pictures’,
Journal of Economic Perspectives 25(1): 115–138.
Fang, H., Keane, M. and Silverman, D. (2008) ‘Sources of advantageous selection: Evidence from the
Medigap insurance market’, Journal of political Economy 116(2): 303–350.
Finkelstein, A. and McGarry, K. (2006) ‘Multiple dimensions of private information: Evidence from the
long-term care insurance market’, American Economics Review 96(4): 938–958.
Gao, F., Powers, M. andWang, J. (2009) ‘Adverse selection or advantageous selection? Risk and underwriting in
China’s health-insurance market’, Insurance: Mathematics and Economics 44(3): 505–510.
Ito, S. and Kono, H. (2010) ‘Why is the take-up of microinsurance so low? Evidence from a health insurance
scheme in India’, The Developing Economies 48(1): 74–101.
Miyazaki, H. (1977) ‘The rat race and internal labor markets’, The Bell Journal of Economics 8(2):
394–418.
Murray, J. (2011) ‘Asymmetric information and countermeasures in early twentieth-century American short-
term disability microinsurance’, The Journal of Risk and Insurance 78(1): 117–138.
Pauly, M., Blavin, F.E. and Meghan, S. (2008) Is there a market for voluntary health insurance in developing
countries? NBER working paper, 14095.
Pauly, M.V. (1974) ‘Overinsurance and public provision of insurance: The role of moral hazard and adverse
selection’, Quarterly Journal of Economics 88(1): 44–62.
Puelz, R. and Snow, A. (1994) ‘Evidence on adverse selection: Equilibrium signaling and cross-subsidization
in the insurance market’, Journal of Political Economy 102(2): 236–257.
Rothschild, M. and Stiglitz, J. (1976) ‘Equilibrium in competitive insurance markets: An essay on the
economics of imperfect information’, Quarterly Journal of Economics 90(4): 629–649.
Wang, H., Zhang, L., Yip, W. and Hsiao, W. (2006) ‘Adverse selection in a voluntary rural mutual health
care health insurance scheme in China’, Social Science & Medicine 63(5): 1236–1245.
Wilson, C. (1977) ‘A model of insurance markets with incomplete information’, Journal of Economic Theory
16: 167–207.
Zhang, L. and Wang, H. (2008) ‘Dynamic process of adverse selection: Evidence from a
subsidized community-based health insurance in rural China’, Social Science & Medicine 67(7):
1173–1182.
Yi (Kitty) YaoDevelopment and Sustainability of Emerging Health Insurance Markets
179
About the Author
Yi (Kitty) Yao is a PhD candidate in the Department of Actuarial Science, RiskManagement and Insurance, University of Wisconsin at Madison. The author will bean Assistant Professor in the School of Economics at Peking University as fromautumn 2012.
The Geneva Papers on Risk and Insurance—Issues and Practice