Development and Validation of a Generic
Instrument for Assessing
The Quality of Decision-Making
A thesis submitted in accordance with the conditions
governing candidates for the degree of
DOCTOR OF PHILOSOPHY
in
CARDIFF UNIVERSITY
Presented by
Ronan Donelan
December 2013
ii
ACKNOWLEDGMENTS
I am indebted to my supervisors, Prof Sam Salek and Prof Stuart Walker for their
advice, guidance and encouragement throughout the preparation of this thesis. Both have
provided several years of guidance and support to help in the delivery of this research.
Both are pioneering in their professional research and the overall healthcare area. They
have both been generous in sharing their expertise, experience and wisdom.
I would like to say a special “Thank you” to all the interviewees who kindly gave up
time during their busy workloads. All were very accommodating, supportive and
encouraging, for which I am truly grateful.
I would also like to thank the staff at the Welsh School of Pharmacy and Pharmaceutical
Services, in particular Ms Helen Harron and Ms Justine Jenkins for their support and
encouragement.
To Ross and Ava, thank you for your love and patience and I apologise for the lost
holidays and weekends. We will make up for them.
Finally, I dedicate this thesis to my beautiful and ever-supportive wife, Gemma. She has
been my rock in all aspects and has provided unfailing support on this professional,
educational and challenging life-journey.
iii
CONTENTS
ACKNOWLEDGMENTS .................................................................................................. II
CONTENTS ....................................................................................................................... III
ABSTRACT ....................................................................................................................... VI
LIST OF ABBREVIATIONS ....................................................................................... VIII
GLOSSARY OF TERMS ................................................................................................. XI
LIST OF FIGURES ......................................................................................................... XX
LIST OF TABLES ........................................................................................................ XXII
CHAPTER 1: GENERAL INTRODUCTION .................................................................. 1
BACKGROUND ....................................................................................................... 2
PHARMACEUTICAL DEVELOPMENT DECISION-MAKING
CHALLENGES ......................................................................................................... 3
AIM AND OBJECTIVES OF THE STUDY............................................................ 27
CHAPTER 2: STUDY RATIONALE AND METHODOLOGICAL FRAMEWORK28
PART 1: STUDY RATIONALE ............................................................................... 29
PART 2: METHODOLOGICAL FRAMEWORK .................................................. 29
DATA SOURCES AND COLLECTION ................................................................ 34
SUMMARY ............................................................................................................. 50
CHAPTER 3: DEVELOPMENT OF A GENERIC DECISION-MAKING TOOL:
QUALITATIVE STUDY ................................................................................................... 51
INTRODUCTION ................................................................................................... 52
METHODS .............................................................................................................. 54
RESULTS ................................................................................................................ 58
DISCUSSION .......................................................................................................... 76
SUMMARY ............................................................................................................. 80
iv
CHAPTER 4: DEVELOPMENT OF A GENERIC DECISION-MAKING TOOL:
CONTENT VALIDATION ............................................................................................... 81
INTRODUCTION ................................................................................................... 82
METHODS .............................................................................................................. 83
RESULTS ................................................................................................................ 85
DISCUSSION .......................................................................................................... 93
SUMMARY ............................................................................................................. 94
CHAPTER 5: DEVELOPMENT OF THE QODOS: FACTOR ANALYSIS .............. 95
INTRODUCTION ................................................................................................... 96
METHODS .............................................................................................................. 96
RESULTS .............................................................................................................. 100
DISCUSSION ........................................................................................................ 126
SUMMARY ........................................................................................................... 130
CHAPTER 6: RELIABILITY AND CONSTRUCT VALIDATION OF QODOS
AND HALLMARKS OF GOOD DECISION-MAKING PRACTICE ....................... 132
INTRODUCTION ................................................................................................. 133
METHODS ............................................................................................................ 133
RESULTS .............................................................................................................. 134
DISCUSSION ........................................................................................................ 160
SUMMARY ........................................................................................................... 163
CHAPTER 7: GENERAL DISCUSSION ...................................................................... 165
LIMITATIONS OF THE STUDY ......................................................................... 173
RECOMMENDATIONS ....................................................................................... 174
FUTURE WORK ................................................................................................... 175
REFERENCES ................................................................................................................. 177
APPENDICIES ................................................................................................................. 191
I: Quality of Decision-Making: Research Outline ................................................. 191
II: content validation of a tool to assess the quality of decision-making ............... 193
v
III: A copy of the 94-item checklist ....................................................................... 195
IV: QoDOS developmental instrument (version 2) ............................................... 200
QODOS DEVELOPMENTAL INSTRUMENT (VERSION 2) ............................ 200
V: The 47-item QoDOS instrument (version 3) ..................................................... 210
vi
ABSTRACT
Decision-making per se can be regarded as part art and part science in the development
of new medicines. In the area of pharmaceutical development, decision-making plays a
pivotal role in the continuation or the termination of further development or withdrawal
of medicinal products. The decisions made at each stage have a direct impact on all
stakeholders namely, pharmaceutical companies, regulators, payers and patients. What is
lacking at present is a qualified understanding of the subjective decision-making
approach, influences, behaviours and other factors which impact the decision-making of
individuals and organisations involved in the delivery of new medicines. The aim of this
study was, therefore, to develop and validate a generic instrument for appraising the
quality of decision-making.
Semi-structured interviews were carried out with 29 key decision-makers from the
pharmaceutical industry, regulatory authorities and contract research organisations
(CROs). They were invited to discuss all aspects, including their perception of decision-
making and its role in drug development and regulatory review; decision making within
their organisation; awareness and use of decision-making techniques; and impact and
monitoring of decisions. Thematic analysis was carried out using NViVO 8 © software.
A preliminary 94-item instrument was developed from the themes and the sub-themes
that emerged from the interviews. Content validity was assessed using qualitative and
quantitative data from an expert panel involving six key decision makers. A separate
international cohort of 120 individuals working in the pharmaceutical industry,
regulatory authority or CROs was recruited for factor analysis to reduce items. A further
78 individuals completed the final version of the QoDOS for construct validity and
reliability.
Most individuals interviewed were male (55% - n=16) and their level of experience
ranged from 7 to 35 years. 32 themes and 90 sub-themes of aspects of decision-making
were identified from the interviews. The median numbers of themes reported by experts
was 6 (range = 1-10). The key themes included: quality and validity of the data;
vii
political, financial, competitor and reward influences; analytical and logical approach;
overconfidence in own judgement; plunging in or procrastinating with decision-making;
impact analysis of decisions; education and awareness of evolving decision-making
techniques; and SWOT and alternate outcome planning. Relationships between the
themes were identified.
A 94-item generic instrument for assessing the quality of life decision-making, Quality
of Decision-Making Orientation Scheme (QoDOS) ©, with a 5-point Likert response
scale was developed. The content validity panel’s rating of each item on a 4-point scale
for the 4 attributes showed “strongly agreed” or “agreed” (88%) with an ICC value of
.89 (CI = 0.56 – 0.99) suggesting a high agreement between the panel members’
responses. This led to the reduction of 20 items and addition of two items as a result of
cross-referencing with the qualitative data. Thus, the 76 items (version 2) emerged from
content validation. Factor analysis produced a 47-item measure with four factors. The
QoDOS showed high internal consistency (n = 120, Cronbach’s alpha = 0.89), high
reproducibility (n = 20, ICC = 0.77) and a mean completion time of 10 minutes. 10
hallmarks of “Good Decision-Making Practice” (GDMP) were identified.
The QoDOS is a valuable addition to the decision-making tool box of drug developers
and regulators and has the potential to fill the missing gap of the entire process which is
building quality into the lifecycle of medicine. The identification of ten hallmarks and
generation of a framework for GDMP are also important contributions of this study to
the field.
viii
LIST OF ABBREVIATIONS
ANOVA: Analysis of variance
BEMA: Benchmarking of European Medicines Agencies
BIA: Biotechnology Industry Association
BRAT: Benefit Risk Action Team
BRR: Benefit Risk Ratio
CAQDAS: Computer assisted qualitative data analysis software
CDER: Centre for Drug Evaluation and Research
CIRS: Centre for Innovation in Regulatory Science
CMC: Chemistry, Manufacturing and Controls
EFPIA: European Federation of Pharmaceutical Industry Association
EMA: European Medicines Agency
EPAR: European Public Assessment Report
EU: European Union
EuNetHTA: European Network for Health Technology Assessment
FDA: Food and Drug Administration
FDA BRF: FDA Benefit Risk Framework
GRP: Good Review Practice
HTA: Health Technology Assessment
ICC: Inter-correlation coefficient
ICH: International Conference on Harmonisation
IDMC: Individual decision-making competence
IDMS: Individual decision-making style
ix
IMI: Innovative Medicines Initiative
IQR: Interquartile range
KOL: Key Opinion Leader
KMO: Kaiser Meyer-Olkin
KPI: Key Performance Indicator
MAA: Marketing Authorisation Application
MCDA: Multi-criteria Decision Analysis
MHRA: Medicines and Healthcare products Regulatory Agency
MTMM: Multi-Trait Multi Methods
NBE: New Biological Entity
NCE: New Chemical Entities
NDA: New Drug Application
ODMA: Organisational decision-making approach
ODMC: Organisational decision-making culture
PhRMA: Pharmaceutical Researcher Manufacturers Association of America
PRAC: Pharmacovigilance regulatory advisory committee
PrOACT-URL: Problem, Objectives, Alternatives, Consequences, Trade-offs,
Uncertainty, Risk and Linked decisions framework
PROTECT: Pharmacoepidemiological Research on Outcomes of Therapeutics by a
European ConsorTium
QALY: Quality Adjusted Life Years
QoDOS: Quality of decision-making orientation scheme
R&D: Research and development
ROI: Return on investment
SME: Small and Medium Enterprise
x
SOP: Standard Operating Procedure
SPC: Summary of Product Characteristics
SPSS: Software Package for Statistical AnalySis
SWOT: Strengths, Weaknesses, Opportunities, Threats
UMBRA: Unified Methodologies for Benefit Risk Assessment
UK: United Kingdom
xi
GLOSSARY OF TERMS
ANOVA: Analysis of Variance, which tests for significant mean differences in the
variables among multiple groups.
Advisory committee: An expert committee that advises the regulatory authority on the
safety, quality and efficacy of medicinal products for human use.
Approval: The approval of a product by a regulatory authority, signified by the granting
of a product licence.
Assessment report: This report describes the assessment of the medicinal product and
states the reasons for the conclusions. It explains why a marketing authorisation
and each of the proposed indications have been approved or rejected and details
the benefit-risk considerations for the product. This document also serves as an
audit trail and should be sufficiently detailed to allow for secondary assessment by
other Member States experts.
Assessment template: A standard document or a form used to record data required by
the quality system of the review process.
Bartlett’s test of sphericity: Statistical test used in the analysis of variance.
Benefit: The positive results of a given treatment for an individual or a population. (i.e.
efficacy, convenience, or even quality of life)
Benefit-risk assessment: A formal way to analyse benefit and risk consequences and
their balances from a set of actions and to make choice among actions when risk
aversion and preferences are specified.
Bias: Any error that creeps into the data. Biases can be introduced by the researcher, the
respondent, the measuring instrument, the sample, and so on.
Category scale: Analyses done to detect cause-and-effect relationships between two or
among more variables.
Centralised procedure: The Centralised Procedure is used when a marketing
authorisation covering the entire EU region is applied for. A marketing
authorisation application is submitted to the European Medicines Agency. A single
evaluation is carried out through the Committee for Medicinal Products for Human
Use (CHMP). If the Committee concludes that quality, safety and efficacy of the
xii
medicinal product is sufficiently proven, it adopts a positive opinion. This is sent
to the European Commission to be transformed into a single market authorisation
valid for the whole of the European Union.
Checklist: An informational aid to guide evaluators in determining when qualitative
methods are appropriate for an evaluation inquiry.
Clinical section of the dossier: This section consists of the clinical study reports
including documentation on the clinical trials performed on the product. This
information is provided in Module 5 of the Common Technical Document.
Coding: The analytic process through which the qualitative data that you have gathered
are reduced, rearranged, and integrated to form theory.
Concurrent validity: Relates to criterion-related validity, which is established at the
same time the test is administered.
Conjoint Analysis: A multivariate statistical technique used to determine the relative
importance respondents attach to attributes and the utilities they attach to specific
levels of attributes.
Construct validity: Testifies to how well the results obtained from the use of the
measure fit the theories around which the test was designed.
Content analyses: An observational research method that is used to systematically
evaluate the symbolic contents of all forms of recorded communication.
Content validity: Establishes the representative sampling of a whole set of items that
measures a concept, and reflects how well the dimensions and elements thereof are
delineated.
Continual improvement: Ongoing activities to evaluate and positively change
activities, processes and the quality system to increase effectiveness. This term is
frequently used interchangeably with continuous improvement.
Convergent validity: that which is established when the scores obtained by two
different instruments measuring the same concept, or by measuring the concept by
twp different methods, are highly correlated.
Correlational analysis: Analysis done to trace the mutual influence of variables on one
another.
Cronbach’s alpha: is a coefficient of internal consistency.
xiii
Deductive reasoning: the application of a general theory to specific case.
Descriptive statistics: statistics such as frequencies, the mean, and the standard
deviation, which provide descriptive information about a set of data.
Development stage: The phase of the research and development encompassing all
activities between drug candidate selection and approval.
Discriminant analysis: a statistical technique that helps to identify the independent
variables that discriminate a normally scaled dependent variable of interest.
Discriminant validity: that which is established when two variables are theorised to be
uncorrelated, and the scores obtained by measuring them are indeed empirically
found to be so.
Effectiveness: Is the extent to which an intervention does more good than harm when
provided under the usual circumstances of health care practice.
Efficacy: Is the extent to which an intervention does more good than harm under ideal
circumstances.
European public assessment report (EPAR): The European Public Assessment Report
is prepared at the end of every centralised evaluation process to provide a
summary of the grounds for the opinion in favour of a marketing authorisation as
taken by the Committee for Human Medicinal Products (CHMP). The EPAR is
derived from the assessment of the documentation submitted by the applicant and
the scientific discussions undertaken by the CHMP during the evaluation process.
The European Medicines Agency makes the EPARs available to the public after
deletion of commercially confidential information. Furthermore, the EPARs are
updated throughout the life cycle of the product to reflect changes to the original
terms and conditions of the marketing authorisation.
External validity: the extent of generalisability of the results of a casual study to other
field settings.
Factor analysis: is a statistical method used to describe variability among observed,
correlated variables in terms of a potentially lower number of unobserved
variables called factors.
Face-to-face interview: information gathering when both the interviewer and
interviewee meet in person.
xiv
Face validity: an aspect of validity examining whether the item on the scale, on the face
of it, reads as if it indeed measures what it is suppose to measure.
Framework: structured stepwise approach to perform a task.
Good review practice (GRP): GRP is a documented best practice that discusses any
aspect related to the process, format, content, and/or management of a product
review. GRPs are developed to provide consistency to the overall review process
of new products, as well as to improve the quality, efficiency, clarity, and
transparency of reviews and review management.
Health Technology Assessment: This is the term used for the assessments made by
government and insurance reimbursement agencies, hospital formulary committees
and other bodies representing the payers for healthcare and medicines.
Inductive reasoning: a process where we observe specific phenomena and on this basis
arrive at general conclusions.
Integrated quality management: is the understanding and effective direction of an
organisation, resulting in the best possible management decisions, so that the
needs and expectations of all stakeholders and partners are satisfied by the
optimum use of all resources.
Interitem consistency reliability: a test of the consistency of responses to all the items
in a measure to establish that they hang together as a set.
Internal consistency: homogeneity of the items in the measure that tap a construct.
Interrater reliability: the consistency of the judgement of several raters on how they
see a phenomenon or interpret the activities in a situation.
Interviewing: a data collection method in which the researcher asks for information
verbally from the respondents.
Key performance indicators (KPIs): KPIs are quantifiable measures that indicate
relative performance in relationship to a target goal.
Kaiser-Meyer Olkin: a test to assess the appropriateness of using factor analysis on
data.
Likert Scale: an interval scale that specifically uses the five anchors of strongly
disagree, disagree, neither disagree nor agree, agree, and strongly agree.
xv
List of questions: A consolidated list of questions provided by the regulatory authority
identifying major objections and / or other concerns identified during a review.
Literature review: the documentation of a comprehensive review of the published work
from secondary sources of data in the areas of specific interest to the researcher.
Marketing Authorisation: Legal approval granted to a company by a national authority
to market a medicinal product in that particular market.
Marketing Authorisation Application: An application submitted by a company to
support the regulatory approval for a medicinal product in a country/region. In the
US this could also mean a New Drug Application (NDA).
Measurement: A process of establishing the correspondence between a property and a
number system.
Methodology: The system of methods and principles used in a particular discipline.
Multiple regression analysis: a statistical technique to predict the variance in the
dependent variable by regressing the independent variables against it.
Multitrait-multimethod matrix is an approach to examining Construct Validity.
New Active Substance: A chemical, biological or radio pharmaceutical substance that
has not been previously available for therapeutic use in humans.
NVivo: a qualitative data analysis computer software package designed for qualitative
researchers working with very rich text-based and/or multimedia information,
where deep levels of analysis on small or large volumes of data are required.
Non-clinical section of dossier: This section consists of the non-clinical study reports
and tests covering the pharmacology, pharmacokinetics and toxicology of the
drug. This information is included in Module 4 of the Common Technical
Document.
Objectivity: interpretation of the results on the basis of data analysis, as opposed to
subjective or emotional interpretations.
Parsimony: efficient explanation of the variance in the dependent variable of interest
through the use of smaller, rather than a larger number of independent variables.
Peer review: Peer review means an additional evaluation of an original assessment
carried out by an independent person or committee. Peer review can occur either
xvi
during assessment of a dossier or at sign-off. Peer review can be internal or
external.
Population: the entire group of people, events, or things that the researcher desires to
investigate.
Preference values: A quantitative measure of the extent to which an outcome achieves
an objective, as judged by an individual or group.
Principal component analysis: a statistical method of analysis which involves finding
the linear combination of a set of variables.
Problem definition: a precise, succinct statement of the question or issue that is to be
investigated.
QoDOS: Quality of decision-making orientation scheme.
Qualitative study: research involving analysis of data/information that are descriptive
in nature and not readily quantifiable.
Quality assurance: Planned and systematic activities implemented in a quality system
that provide confidence that quality requirements are fulfilled.
Quality audit: It involves the assessment of any designated process or activity to obtain
objective evidence that the existing requirements have been met (for example,
effective and efficient implementation of processes and resources). Quality audits
can be internal or external.
Quality control: Quality control is operational techniques and activities that are used to
fulfil requirements for quality. It involves techniques that monitor a process and
eliminate causes of unsatisfactory performance at all stages of the quality cycle.
Quality section of dossier: This section of the dossier consists of chemical-
pharmaceutical and biological information for chemical active substances and
biological medicinal products. This information is provided in Module 3 of the
Common Technical Document.
Quality policy: Overall intentions and direction of an organisation related to quality as
formally expressed by top management.
Quality system: The organisational structure, responsibilities, procedures, processes and
resources for implementing quality management.
Quantitative: involving considerations of amount or size; capable of being measured.
xvii
Questionnaire: a pre-formulated written set of questions to which the respondent
records the answers, usually within rather closely delineated alternatives.
Registration: This term is also known as marketing authorisation.
Regression analysis: used in a situation where one or more metric independent
variable(s) is (are) hypothesised to affect a metric dependent variable.
Relative efficacy: the extent to which an intervention does more good than harm under
ideal circumstances compared to one or more alternative interventions.
Reliability: attests to the consistency and stability of the measuring instrument.
Research: an organised, systematic, critical, scientific inquiry or investigation into a
specific problem, undertaken with the objective of finding answers or solutions
thereto.
Review: This term is also known as assessment in which the assessors review the
dossier in terms of the quality, safety and efficacy of the submitted data.
Review outcome: The result of the regulatory review in terms of whether or not a
licence was granted by the authority for marketing the product.
Rigour: the theoretical and methodological precision adhered to in conducting research.
Risk: The negative results (adverse outcomes) of a given treatment for an individual or
population in terms of probability of occurrence having considered the magnitude
of severity.
Risk-benefit balance: An evaluation of the positive therapeutic effects of a medicinal
product in relation to any risk relating to the quality, safety or efficacy of the
medicinal product as regards patients’ health or public health. A marketing
authorisation will be refused if the risk-benefit balance is not considered to be
favourable.
Risk management plan: It is a set of pharmacovigilance activities and interventions
designed to identify, characterise and manage risks relating to a medicinal product.
It consists of an overview of the safety profile of the product, a pharmacovigilance
plan and a risk minimisation plan.
Sample: a subset or subgroup of the population.
Sample size: the actual number of subjects chosen as a sample to represent the
population characteristics.
xviii
Scale: a tool or mechanism by which individuals, events, or objects are distinguished on
the variables of interest in some meaningful way.
Scientific advice: Advice provided to companies on the conduct of various tests and
trials necessary to demonstrate the quality, safety and efficacy of the medicinal
product. The advice covers scientific issues related to the proposed future
development of the product.
Scientific assessment: Review of the dossier in terms of safety, quality and efficacy of
the data submitted.
Scree (Catrell’s) plot: A visual plot in descending order of magnitude of the
eignevalues of a correlation matrix which presents the relative importance of the
factors.
Self-assessment: This is a carefully considered evaluation resulting in an opinion or
judgement of the effectiveness and efficiency of the organisation and the maturity
of the quality management system. Self-assessment is usually performed by the
organisation’s own management.
Spearman’s test: is a nonparametric measure of statistical dependence between two
variables.
Standard operating procedures (SOPs): SOPs are written documents that describe in
detail the routine procedures to be followed for a specific operation, analysis or
action.
Submission: The submission of a regulatory dossier to apply for a licence to market the
product.
Summary of Product Characteristics (SPC): The SPC is a document that forms an
intrinsic and integral part of the marketing authorisation application. The SPC is a
summary of the dossier and sets out the agreed position of the medicinal product
as distilled during the course of the assessment process. The SPC is the basis of
information for health professionals on how to use the medicinal product safely
and effectively.
SWOT: A business approach to identify Strength, Weakness, Opportunities, Threats of
a situation
xix
Validation process: The process whereby a regulatory authority verifies that all parts of
the submitted dossier are present and complete and suitable to be assessed as part
of the assessment and registration process.
Validity: evidence that the instrument, technique, or process used to measure a concept
does indeed measure the intended concept.
Variable: anything that can take on differing or varying values.
Variance: Indicates the dispersion of a variable in the data set, and is obtained by
subtracting the mean from each of the observations, squaring the results, summing
them, and dividing the total by the number of observations.
Utility: A subjective measurement that describes a person’s or group’s preference
(satisfaction, risk attitude, etc.).
Value function: A function which convert the input data (parameters) in all criteria into
preference value or utility for the options under evaluation.
Value judgement: A subjective assessment for appropriateness of values or utility in a
decision-making problem.
Weight: Scaling constants assigned to criteria such that the units of scaled preference
values across all criteria are equal.
xx
LIST OF FIGURES
Figure 1.1: The L.E.A.D decision-making framework ................................................................ 13
Figure 1.2: Genesis strategic decision-making process ............................................................... 13
Figure 1.3: The Evidence-Based Decision-Making framework................................................... 14
Figure 1.4: US FDA Benefit-Risk Framework ............................................................................ 19
Figure 1.5: UMBRA benefit-risk framework .............................................................................. 20
Figure 1.6: IMI-PROTECT Evaluation components for evaluation techniques / frameworks ........................................................................................................ 23
Figure 2.1: Development of The Generic Decision-Making Instrument .................................... 40
Figure 2.2: Guide to interpreting a Box-and-Whisker plot .......................................................... 49
Figure 3.1: Qualitative development of a generic decision-making tool ..................................... 59
Figure 3.2: Example NVivo8 data output for an individual interviewee ..................................... 65
Figure 3.3: Thematic map of decision-making themes from the qualitative research ................. 75
Figure 5.1: Survey Monkey Likert format used in the research .................................................. 97
Figure: 5.2: My organisation uses a structured approach in its decision-making ...................... 101
Figure 5.3: My organisation re-examines its decision-making as new information becomes available ........................................................................................................... 101
Figure 5.4: My organisation quantifies the probability of success in its decision-making ........ 102
Figure 5.5: My organisation evaluates the impact of its decisions ............................................ 102
Figure 5.6: I feel that I could make better quality decisions ...................................................... 103
Figure 5.7: I use intuition or “gut-feeling” in my decision-making ........................................... 103
Figure 5.8: I receive training in the science of decision-making ............................................... 104
Figure 5.9: Box and Whisker plot for the distribution of the results from the three organisations .................................................................................................... 106
Figure 5.10: Scree plot for the 76-item composite instrument ................................................... 107
Figure 5.11: Scree plot of the 35 organisational level items ...................................................... 109
Figure 5.12: Scree plot for the 23 organisational influence items ............................................. 113
Figure 5.13: Scree plot for the 21 item organisation level influences........................................ 113
Figure 5.14: The Scree plot for the 41 individual related items ................................................. 115
Figure 5.15: Scree plot for the individual items solution (2nd factor analysis) ......................... 118
Figure 5.16: Scree plot for the individual items (7th factor analysis) ......................................... 119
Figure 5.17: Scree plot for the individual items (11th factor analysis) ..................................... 120
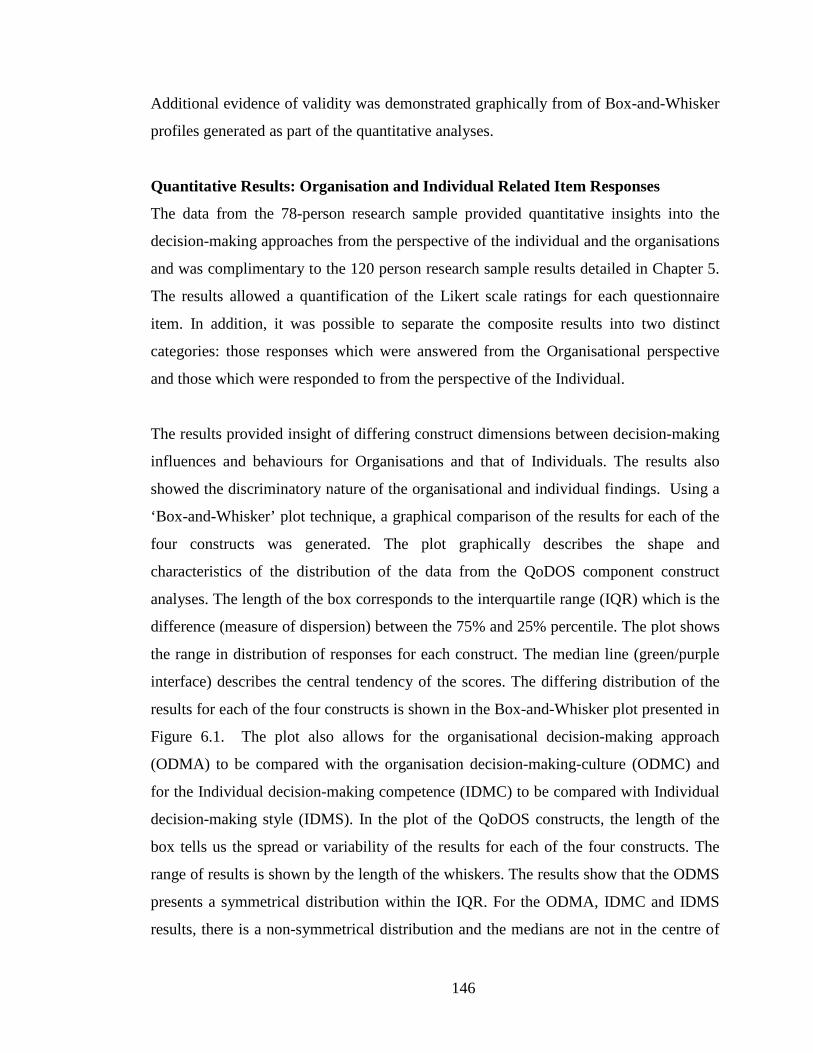
Figure 6.1: Box-and-Whisker plot of QoDOS construct result loadings’ distribution .............. 147
Figure: 6.2: My organisation uses a structured approach in its decision-making ...................... 148
xxi
Figure 6.3: My organisation quantifies the probability of success in its decision-making ........ 148
Figure 6.4: My organisation re-examines its decision-making as new information becomes available ........................................................................................................... 149
Figure 6.5: My organisation’s culture has resulted in its inability to make a decision .............. 150
Figure 6.6: I feel that I could make better quality decisions ...................................................... 150
Figure 6.7: I use intuition or “gut-feeling” in my decision-making ........................................... 151
Figure 6.8: I receive training in the science of decision-making ............................................... 151
Figure 6.9: I generate a SWOT analysis in my decision-making .............................................. 152
Figure 6.10: Use of a structured approach is used in decision-making ...................................... 152
Figure 6:11: Quantification of the probability of success in decision-making by the organisation and the individual ........................................................................ 153
Figure 6.12: Training in the science of decision-making ........................................................... 153
Figure 6.13: Transparency in decision-making approach .......................................................... 154
Figure 6.14: Employ scientific rigour and understand the decision context (Top rating).......... 158
Figure 6.15: Apply knowledge and experience (2nd highest rating)........................................... 158
Figure 6.16: Decision-making profile of an individual .............................................................. 160
Figure 7.1: Quality of decision-making framework reflecting good decision-making practice ............................................................................................................. 171
xxii
LIST OF TABLES
Table 1.1 Comparisons of existing benefit-risk assessment frameworks .................................... 22
Table 2.1: Overview of the data collection techniques used in the generic decision-making instrument research ............................................................................................ 35
Table 3.1: Socio-Demographics of study participants ................................................................. 58
Table 3.2: Emergent themes and sub-themes from the NVivo8 analysis ................................... 61
Table 4.1: Summary of percentage rating results given by each expert rater .............................. 86
Table 4.2: The judges’ ratings (n=6) of the 94 items across four criteria .................................... 87
Table 4.3: Item wording changes recommended by the expert panel ......................................... 92
Table 5.1: Response metrics for individuals from the three organisations ................................ 104
Table 5.2: Correlation coefficients for the three organisations .................................................. 105
Table 5.3: KMO and Bartlett’s Test results for 76 items ........................................................... 107
Table 5.4: Mapping and separation of the 76 QoDOS items to their organisational level (35) and individual level (41) items ................................................................. 108
Table 5.5: KMO and Bartlett’s test results for 35 organisational item ...................................... 110
Table 5.6: Results of factor analysis 1: Total variance explained ............................................. 111
Table 5.7: Total variance explained for the 21-item solution .................................................... 114
Table 5.8: The organisational item resultant rotated factor loadings (pattern matrix) ............... 116
Table 5.9: KMO and Bartlett’s Test results for the 41 individual items .................................... 117
Table 5.10: Total variance explained for the 22 item solution .................................................. 121
Table 5.11: The 22 individual related decision-making factors: following item reduction and SPSS extraction ......................................................................................... 122
Table 6.1: Organisational level influences ................................................................................. 135
Table 6.2: Summary results for the statistical testing performed on the 12 organisational approach items ................................................................................................. 136
Table 6.3: Spearman’s correlation inter-item correlation matrix for 12 organisational approach items ................................................................................................. 137
Table 6.4: Summary results for the statistical testing performed on the 11 “culture” items...... 138
Table 6.5: Spearman’s correlation inter-item correlation matrix for 11 organisational culture items ..................................................................................................... 139
Table 6.6: Individual level influences ........................................................................................ 140
Table 6.7: Summary results for the statistical testing performed on the 14 “competence” items ................................................................................................................. 141
Table 6.8: Spearman’s correlation inter-item correlation matrix for 14 individual competence items ............................................................................................. 142
xxiii
Table 6.9: Summary results for the statistical testing performed on the 10 items ..................... 143
Table 6.10: Spearman’s correlation inter-item correlation matrix for the individual style items ................................................................................................................. 144
Table 6.11: Multi-Trait Multi-Method for QoDOS construct validity ...................................... 145
Table 6.12: Mapping of the QoDOS items to the hallmarks of good decision-making practice. ............................................................................................................ 156
2
BACKGROUND “From vision to decision, Pharma 2020”........was the title of the PWC pharmaceutical
strategy report issued in late 2012. The opening paragraph of the report states “Pharma’s
future has never looked more promising – or more ominous. Major scientific,
technological and socioeconomic changes will review the industry’s fortunes in another
decade, but capitalising on these trends will entail making crucial decisions” (PWC,
2012). There is constant discussion, debate and published material on the current and
future productivity projections of pharmaceutical industry research and development
(R&D). At present, there are several formidable internal and external factors that are
facing the industry including items such as increasing stakeholder pressures. These
include the current patent expiration, the market dynamics, the in-licensing/out-licensing
of assets, the outsourcing of complete R&D activities to service providers and the
emergence of non-ICH countries as being key players in the delivery and the demand for
pharmaceutical products. So, in regard to the changing pharmaceutical arena, it begs the
question, will pharma improve the quality of its decision-making in the future and
therefore aim to make its future more promising rather than more ominous?
The development of a new drug from molecule to market is a complex stepwise process
that is dependent on multiple and expert input, knowledge and decision-making by a
wide range of specialists in various fields. Within the pharmaceutical industry, these
come from differing functional areas and comprise individuals with specialised training
and expertise in areas such as: synthetic chemistry, manufacturing, non-clinical
pharmacology and toxicology, biostatistics, clinical operations, data management,
project management, medical affairs, regulatory affairs, benefit/risk pharmacovigilance,
management teams, health economics, commercial and legal affairs. Within the
regulatory agencies, the expertise of the individuals will have a particular focus on areas
such as: chemistry/pharmaceutical and manufacturing controls, non-clinical pharmaco-
toxicology, clinical expertise in differing therapeutic areas, biostatistics,
pharmacovigilance, regulatory affairs and legal affairs. More recently we are also seeing
a growing involvement of agency personnel with expertise in areas such as cost-
3
effectiveness, pharmacoeconomics and their interaction with Health Technology
Assessment (HTA) agencies and patient platform groups.
Rapid advances in drug development such as the use of modelling and simulation,
adaptive clinical trials, specific target therapy properties of drug candidates and a greater
appreciation of benefit/risk assessment are now common within the drug development
programme of New Chemical Entities (NCEs) and New Biological Entities (NBEs). The
traditional ‘Go/No-go’ stage gates are still dominant within the delivery and maturation
of new medicines. The science and dynamic evolution of development approaches are
new challenges to pharmaceutical companies and regulatory authorities, but both are
adapting to the changes (Eichler et al., 2008; Eichler et al., 2012). The drug development
arena has inherent high risks and uncertainties associated through each stage of
development (Pritchard et al., 2003). The decisions made will dictate the continuation
or the termination of a candidate drug and thus limit patients’ access to new medicines
(Pritchard et al., 2003; Eichler et al., 2008; Chung-Stein, 2011; Colwrick et al., 2011;
Eichler et al., 2012). In the regulatory review and the HTA component of the evaluation
of new medicines, ever increasing efforts are seen to improve the decision-making
process as it is recognised to be in the interest of all stakeholders. The latest MHRA/
Biotechnology Industry Association expert committee report has again highlighted the
need for improvement in the regulatory decision-making process (MHRA, 2013).
PHARMACEUTICAL DEVELOPMENT DECISION-MAKING CHALLENGES Industry
Several decision-making frameworks are available to aid quality decision-making and in
particular in the benefit-risk assessment of medicines in the post-approval setting.
Quality of decision-making remains a fundamental issue which has a direct impact on all
stakeholders (Walker et al., 2007; Mattes et al., 2010) and it is appreciated that “quality”
is a difficult concept to define and a difficult parameter to establish and monitor
(Lumpkin, 2000).
4
Pharmaceutical organisations operate in a business environment in which different
dynamics and forces are present such as: competitors, governmental regulations,
investors, payers and patients. Each plays a significant role in the company’s
performance by presenting opportunities and imposing threats on Research and
Development, manufacturing, clinical and commercial activities. Ironically, although
innovative drugs with novel mechanisms of action are attractive to all stakeholders, they
also bring the penalty of being unpredictable with unknown risk (Pritchard, 2008). It is
therefore in the interest of all stakeholders, that there is an effort to improve decision-
making by “dropping the loser” and “supporting the winner” and thus achieve minimum
time-to-market. The 2009 European Commission report on the European pharmaceutical
sector confirmed the decline of new chemical entities reaching the market and identified
some of the company practices possibly contributing to this decline. The report also
highlighted the need to address the fragmented decision-making within regional/local
Member State regulatory agencies and emphasised that this should be addressed at a
local level (ECORYS, 2009).
Within pharmaceutical R & D, the ‘Go or No-Go’ decisions are based on judgements
made by a group of individual health experts with varying background knowledge and
experience (Pritchard et al., 2003; Sarac et al., 2012). Decisions are often made based on
insufficient or incomplete data, a high degree of uncertainty, time pressure, financials
and often in a competitive environment. As drug candidates mature through the R&D
processes, the stakeholder groups will tend to include more external regulatory
influences and market forces in their decision-making. High quality or optimised
decision-making should be considered a cornerstone for effective drug development and
life cycle maintenance. The industry has developed many decision-making analysis
techniques including qualitative, quantitative and semi-quantitative approaches to try to
aid the decision-making process. These techniques include frameworks, value-trees,
modelling, simulations and other platforms which aim to provide a systematic and
transparent approach to decision-making.
5
Regulatory
The remit of regulatory agencies is to protect public health. However, the regulatory
authorities are increasingly being challenged to find the appropriate balance between the
need for rapid access to new medicinal products and at the same time to ensure
comprehensive data on their benefits and risks (Breckenridge and Walley, 2008; Eichler
et al., 2008; Breckenridge et al., 2010; Eichler et al., 2012). The regulators’ dilemma is
that of balancing access to market against the requirement for as complete as possible
data package prior to licensing as outlined in the European Medicines Agency’s (EMA)
draft roadmap to 2015 (EMA, 2011b). This dilemma is also compounded by the
increasing novelty, complexity and speciality of some clinical development programmes
and subsequent regulatory review is becoming an increasing challenge (Eichler et al.,
2012). The challenges and the importance of the decision-making process for the
regulatory authorities is illustrated by the risk of failure or error in any of the numerous
decisions taken by the authority (Jefferys, 2000).
Regulatory agencies are actively working on improving the benefit-risk balance model
by focussing on three major aspects for improvement: ensuring a consistent decision-
making approach, providing a better rationale for the outcome of the benefit-risk
decision-making review and improving communication with the various stakeholders
(EMA, 2010; EMA, 2011a; IMI-EFPIA, 2013a). The EMA is actively supporting other
areas within the licensing review which could be improved, such as facilitating more
continuous dialogue during the assessment of a marketing authorisation, providing
additional transparency of the decision-making undertaken and the outcome of the
scientific review as summarised in the EU EPARs. It is also aiming to achieve the right
balance of protection of commercial confidentiality of proprietary information (EMA,
2010a). Continuous benefit-risk assessments throughout a medicine’s lifecycle and other
strategies such as staggered-licensing of new medicines in certain situations are
discussed in the EMA roadmap (EMA, 2011b). Other initiatives including the option to
seek joint scientific advice from CHMP and HTA Agencies from EuNetHTA, has been
well received by industry and Authorities (EMA, 2013b). These joint meetings may help
to identify and develop the best clinical development programme and registration
6
strategy that should satisfy the safety, quality and efficacy requirements of the MAA
submission and in addition the pharmacoeconomic demands of potential payers. An
example of another initiative which is facilitating transparency on safety/benefit
expectations of medicines is the establishment of the PRAC advisory meetings (since
2012) which is helping better define expectations of new MAAs (EMA, 2013b).
Other initiatives such as the EU benchmarking system, are helping to achieve a
strengthening of the quality assurance systems in place at the level of all EU regulatory
authorities (EMA, 2011b). The EU Benchmarking of European Medicines Agencies
(BEMA) programme has the following broad aim to ‘contribute to the development of a
world-class medicines regulatory system based on a network of agencies operating to
best practice standard’. BEMA is based on the assessment of the systems and processes
in individual agencies against a set of indicators which have been agreed in the
following areas: management systems, assessment of marketing authorisation
applications, pharmacovigilance (drug safety) activities and inspection services (HMA,
2013). Regulatory Agencies have also recognised and established the importance of a
strong Integrated Quality Management (IQM) system (FDA, 2006; FDA, 2009; MHRA,
2009). Integrated management is the understanding and effective direction of an
organisation, resulting in the best possible management decisions, so that the needs and
expectations of all stakeholders and partners are satisfied by the optimum use of all
resources (MHRA, 2009). Linked to the integrated management approach and
benchmarking initiatives, the regulatory agencies issue regular performance metrics.
These metrics provide a valuable insight into outputs from the regulatory agencies and
include information on new approvals, review timelines, clinical trial activities,
inspection reports and orphan product designations.
Good review practice (GRP) systems are now present within many regulatory agencies
and are helping to add transparency and a systematic approach to the regulatory review
(FDA, 2005; FDA, 2006; Dash and Jones, 2010; Molzon et al., 2011; TGA, 2013). The
US FDA and EMA have invested considerably over recent years in a quality system
which is aimed to be integrated, agency-wide and risk-based in order to control, assure
and improve the effectiveness of the regulatory processes (FDA, 2009; EMA, 2011b).
7
Pharmaceutical organisations also need to ensure that they establish good regulatory
practices and that these are being applied. Methods for monitoring and assessing quality
procedures should be sought with a view to continuous improvement (Korteweg, 2002;
Walker, et al., 2007). It is appreciated by all stakeholders that improved transparency in
the decision-making on new medicines and their life cycle will be of benefit to all
(Korvivk, 2008).
Decision-Making Issues for The Individual
Decision-making within medicines development and the regulatory review is made at an
organisational as well as an individual level. Decision-making is a subjective value
assessment and judgement and can be regarded as being part science and part art
(Milkman et al., 2008; Kahneman, 2012; Wethey, 2013). This subjective decision-
making style represents the combination of how an individual interprets and understands
stimuli and the general way in which he chooses to respond to them. It is linked to an
individual’s education, knowledge, ability, culture and motivation, their value
orientation and tolerance for not having valid and reliable information before making a
decision. Decision-making is usually considered to be the result of cognitive processes
leading to the selection of a course of action between several alternatives (Dhami, 2003;
Westaby et al., 2010; Kahneman et al., 2011). It represents a rational or irrational
reasoning or emotional process based on prior knowledge as well as individual
assumptions based on normative perspectives, which is held by that individual and no
other person is privy to that decision-making process. It is this notion that underpins the
importance of decision-conferencing where individuals share their normative standards
to reach a shared decision.
The act of decision-making is a multi-stage multi-criteria process which should be
utilised in ‘Go/No-Go’ processes. The elements of risk and reward depend on the
information available and the individual’s outlook in regard to acceptable risk and
reward levels. It is also important to appreciate that decision-making is not a linear and
predictive process, but rather a non-linear and evolving one. A person’s behaviour is an
important factor in an individual’s decision-making and it is influenced by their
8
environment (Kahneman, 2012). Successful decision-making can be expected to require
a thorough understanding and appreciation of the environment in which that decision
will be carried out. Without such an understanding, it is impossible to assess the
probable consequences that may result (Messicks and Bazerman, 1996). Thus, the
decision environment as defined by the collection of information, alternatives, values,
and preferences available at the time of the decision (Harris, 2012), will be of
importance for the actual decision process. Therefore, an ideal decision environment
would include all possible information, which is accurate and clear and addresses every
possible alternative (Ivanona and Gibcus, 2003; Milkman et al., 2008; Harris, 2012;
Wethey, 2013). However, in real world medicines development this ideal position is
rarely the case in which safety and efficacy evidence is dynamic and development
timelines are compressed.
Individual Decision-Making Styles:
On a fundamental level, there are four basic decision-making styles: subjective,
objective, analytical and non-analytical (Rowe and Bougarides, 1983; Quernk, 2009).
Many factors that can influence an individual’s approach to decision-making such as:
• Personal biases which are based on a grounded personal belief or faith and
include elements such as a person’s political leanings or religious choices
• Cognitive bias may be present in the form of a selective search for evidence
or a tendency to think in a certain way. Cognitive biases can lead to
deviations from a standard of rationality or good judgment
• Selective perception e.g. where a person discounts certain information too
quickly and interprets it in the way they want to, rather than looking at the
bigger picture. This behaviour results in a person tending to "see things"
based on their particular frame of reference and results in a person
perceiving what they want in information while ignoring opposing
viewpoints (Hammond, 2002; Verma, 2009).
• Information or data overload can result in “paralysis by analysis” from a
state of over-analysing or over-thinking a situation so that a decision or
action is never taken, in effect paralysing the outcome. A decision can be
9
treated as over-complicated, with too many detailed options, so that a
choice is never made, instead of trying something and changing if a major
problem arises. A person might be seeking the optimal or "perfect" solution
upfront, and is concerned about making any decision which could lead to a
bad outcome, which can result in no decision being made, which in itself
could be considered a bad outcome (Ansoff, 1979)
• Anchoring is where a disproportionate weighting is given to the first
information received. This high value assignment or anchoring to initial
information rather than being receptive to update information and
performing a re-evaluation which would deliver a more balanced approach
• Overconfidence, wishful thinking or optimism bias e.g. being over-
confident in one’s own decision-making. Overly confident about the
accuracy of their prediction and considering too narrow a range of
possibilities. A major cause of overconfidence is anchoring (Lovallo and
Kahneman, 2003; Hammond et al., 2011; Kahneman, 2012)
• Choice supported bias is the tendency of a person to retroactively assign
positive attributes to an option or decision that the person made in the past.
The person ignores or downplays the negative aspect of the decision made.
This bias can arise due a person’s previous experience or memories
(Hammond, 2002)
• Recent events or semantic priming: remembering and being overly
influenced by recent dramatic events
• Groupthink can occur where a group of people may arrive at a consensus
decision albeit a bad one. This phenomenon can be caused by the dynamics
and strong personalities within a group. This can result in even a group of
intelligent people making a poor decision (Von Bergen and Kirk, 1978;
McCauley, 1998; Macleod, 2011)
• Authoritative style: where a single person (leader) makes the decision. This
decision-making style is useful when the leader possesses all the necessary
information and has the required expertise to make the best decision. This
10
style can be particularly valuable when a fast decision is required. It can
also easily result in bad decisions
• Overweighting or underweighting of probability is observed where a person
is more concerned about possible “losses than gains” or conversely where
the person has not performed a qualified or quantified risk assessment of
possible outcomes (Kahneman and Tversky, 1982; Kahneman, 2012)
• Inertia or status quo bias results in a person leaving a decision challenge as
is and perpetuating the current situation by putting the decision-making off
to later. This later time can be a distant horizon (Samuelson and
Zeckhauser, 1988; Hammond et al., 2011)
• Under-estimating inherent uncertainty and over-estimating is the illusion of
control and is caused by an under-estimation or lack of appreciation of the
potential items or influences which could impact the decision. This can
result in a false sense of security and perception that all is in order, whereas
in fact the task or decision could be “spinning out of control” (Hammond et
al., 2011)
• Confirming evidence is where a person tends to seek out information that
supports their instinct or point of view while avoiding information that may
contradict it. The confirming – evidence trap affects where or how we go to
collect evidence and how we interpret it. Too much weight can be given to
supportive information and too little to conflicting information
• Use of intuition of gut-feeling can be regarded as being a sophisticated form
of reasoning based on a distillation of wisdom and instinct that one gains
from life-experience, exposure to situations in personal and professional-
life. It is a subconscious, complex, and quick acting phenomenon. It does
appear directly connected to experience, expertise and deep knowledge
developed over years (Mintzberg and Westley, 2001).
For individuals involved in drug development, some people who make individual
decisions will be risk-prone while others will be risk-adverse on a particular issue
(Mussen et al., 2009). Since actual decisions concerning the balance between benefits
11
and risks are heavily influenced by the values of the decision makers and are difficult to
quantify, better methods are needed for quantifying the benefit-risk profile and
expressing the values involved in decision-making. The decisions made during drug
development and the regulatory review are based on evolving scientific capabilities and
clinical judgement. These decisions need to be monitored throughout the life cycle of a
medicine. It is also important to appreciate that benefit-risk analysis undertaken by
regulators is not based on a precise mathematical equation and is invariably
judgemental. Some people might well reach different decisions on another occasion,
even when presented with the same data (Hammond, 2002; Milkman K et al., 2008;
Verma, 2009; Rawlins, 2011).
Decision-making considerations for the organisation:
The pharmaceutical industry and regulators also appreciate the need for better decision-
making practices and for systematic and transparent approaches to be more evident in
the delivery of new medicines and industry/agencies and industry/agencies/academia
initiatives are being progressed (Guo et al., 2010a, IMI-EFPIA, 2013b). The main area
of collaboration between these stakeholders is in the area of benefit-risk assessment and
decision-making frameworks. The pharmaceutical industry and the regulatory agencies
appreciate the need to incorporate the perspectives of stakeholders in the development of
frameworks intended to aid lifecycle evolution of medicines including the regulatory
review. Frameworks provide a structured and systematic outline of how to approach a
task. In decision-making, they provide the structure and systematic elements and
provide transparency at each stage of the decision process and by inference an auditable
trail of the basis of the final decision. Frameworks can facilitate consistency; promote
reproducibility, reliability, confidence and overall quality in the decision-making
process. They can delivery a platform for effective communication amongst all drug
development stakeholders (pharmaceutical companies, regulatory agencies, payers,
physicians and patients). This effective communication between the industry and
regulatory agencies should be iterative in its nature.
12
Frameworks for Decision-Making
The cornerstones of quality decision-making are: a structured approach, transparency,
quality of information and effective communication and use of frameworks capture each
of these components in a systematic manner. In general, frameworks are over-arching
processes which systematically document important elements of decision-making. They
promote the use of a structured and an effective decision-making approach. An effective
decision-making process should aim to fulfil the following criteria:
• It focuses on the decision context
• It is logical and consistent
• It acknowledges both subjective and objective factors and blends analytical
with intuitive thinking
• It requires only as much information and analysis as is necessary to address
the decision context
• It encourages and guides the gathering of relevant information and informed
opinion
• It is straightforward, reliable, easy to use, and flexible.
The concept and the recognised benefit of decision-making frameworks is evident across
many business disciplines. The fundamental tenets of good framework are as outlined
above. Some examples of frameworks used outside of drug development are introduced
for reference in Figures 1.1 – 1.3.
The L.E.A.D. (Locate, Evaluate, Assemble, Decisions) framework process can be used
to assemble evidence in a way that is useful to decision makers. The framework
recommends a standard systematic template approach that can be used to report results
to decision makers, which prompts for 1) a statement of the question, 2) a transparent
description of the strategy used to locate the evidence, 3) a table reporting the evidence,
and 4) a summary of the evidence organised as answers to the derived questions (Figure
1.1) (Kumanyika et al., 2012).
13
Figure 1.1: The L.E.A.D decision-making framework
Another framework is the Genesis strategic decision-making process (Genesis, 2013)
showing its component elements as outlined in Figure 1.2.
Figure 1.2: Genesis strategic decision-making process
The evidence-based decision-making framework is presented as a circular process aimed
at thinking about how decisions can be strengthened at every step in an improvement
cycle. Each circle (stage in the cycle) can be considered separately, with revisions and
improvements within that circle taking place continually. Although the circles show a
progression in decision-making reflecting the typical phases in planning, implementing,
14
and evaluating a decision, they can also provide a means for reflecting on which areas
need more attention after improvement initiatives are underway (Figure 1.3).
Figure 1.3: The Evidence-Based Decision-Making framework
There are other general tools and techniques such as Strengths, Weakness,
Opportunities, Threats (SWOTs), the 7-S framework (structure, systems, style, staff,
skills, strategy and shared values), Pareto (root cause) analysis, questionnaires,
checklists, risk analysis and risk management and decision trees used to support
decision-making processes (Van Assen et al., 2009). In regard to the delivery of new
15
medicines, the EMA and FDA have been supportive of initiates to develop the decision-
making frameworks. John Jenkins’ (US FDA) conclusion on the regulators perspective
on benefit-risk assessment was that “Regulatory risk-benefit decision-making is a
qualitative science grounded in quantitative data. Judgment is required in making
regulatory risk-benefit decisions and those judgments are influenced by many factors,
both extrinsic and intrinsic. Clearly outlining the available data and how decisions
(judgments) were made can improve transparency of the decision-making process”
(FDA, 2010). He also outlined the desirable properties and attributes of a decision-
making framework as being:
• Simple and user-friendly
• Address critical issues
• Capture expert views faithfully
• Represent transparently
• Compatible with quantitative analysis of clinical benefit and
safety information • Facilitate communications (internal and external) • Broadly applicable
Jenkins described the desired attributes of the framework as being: simple (not
simplistic), supports sound expert judgement (not a replacement for it) identifies areas of
disagreement and that it captures the decision context.
Decision-making frameworks can be broadly classified into three types: qualitative,
semi-quantitative and quantitative (Levitan and Mussen, 2012) Qualitative frameworks
are generally templates, grids or visual displays that present the key benefits and risk
attributes. They use a process based on internal experts making subjective judgements
e.g. on the benefit-risk profile of each product and provide a conclusion. A semi-
quantitative framework usually has a qualitative foundation but includes tabular or
graphical tools to display and summarise the metrics associated with the key benefits
and risks data. The semi-quantitative metrics-collection component requires the use of a
16
structured or standard working procedure. The decisions made are based on the review
of the data results followed by expert judgement. Quantitative frameworks used in
benefit-risk assessments for medicines allow for the calculation of a benefit-risk score
using weightings, uncertainty calculations and statistical analysis and allows for a
benefit-risk balance to be generated. The mathematical component in quantitative
frameworks can be expected to require considerable specialised resource and effort. In
the end, decisions are again made based on the review of the data results followed by
expert judgement. The qualitative frameworks and the insights they deliver are the
foundation for additional decision-making that may be performed using semi-
quantitative or quantitative methods during and throughout the life cycle of a medicinal
product.
The EMA medicines’ benefit-risk methodology project is aimed at developing and
assessing tools which could be used to aid informed, science-based regulatory decisions.
The project has to date consisted of five consecutive work packages. The work packages
have and continue to assess the applicability of the following qualitative frameworks:
PrOACT-URL, PhRMA BRAT, the 7-step CIRS, the US FDA benefit-risk framework,
use of decision tree models and Multi-Criteria Decision Analysis (MCDA) along with
other alternative quantitative approaches for assessing the benefit-risk balance (EMA,
2010; EMA, 2010; EMA, 2011a; IMI-EFPIA, 2013b). MCDA can be considered to be
the principal foundation in regulatory decision-making for a few existing frameworks
namely, the PRoACT-URL, PhRAM’s BRAT framework and the 7-step CIRS
framework. A short review of the frameworks is presented with special attention being
given to the PrOACT-URL technique as it has established proven value in both
decision-making at an individual level (personal) and at a professional or business
(organisational) level.
PrOACT-URL is a generic decision-making guide and its acronym PrOACT-URL
represents the steps of the framework: (1) determine the decision context and frame the
Problems; (2) establish Objectives and identify criteria; (3) identify options and
Alternatives; (4) evaluate the expected Consequences of the options for each criterion;
17
(5) assess the Trade-offs between benefits and risks; (6) report the Uncertainty in
benefits and risks, and assess the impact of uncertainty on the benefit-risk balance; (7)
judge the relative importance and the Risk attitude of the decision maker and assess how
this affects the benefit-risk balance; and (8) consider the decision’s consistency with
other Linked decisions, both in the past and its impact on future decisions (Hammond,
2002; Hammond et al., 2011).
The PrOACT-URL approach provides a clear outline for a quality decision-making
approach. It raises awareness and identification of the known’s and unknowns and the
intangible aspects relating to the decision situation. The framework helps to transpose
the facts, judgement values and an individual’s beliefs and feelings into the best possible
choice option. The framework is flexible and adaptable and can be used both for
professional or business decisions as well as personal decisions. It imbues a systematic
sequential approach to the decision challenge. It presents a “divide and conquer”
approach by breaking complex or hard decisions into the eight elements outlined. The
first five (problem, objectives, alternatives, consequences and tradeoffs) represent the
fundamental tenet of the recommended approach. The three remaining elements –
uncertainty, risk tolerance and linked decisions, help to clarify decisions in a real-world
changing environment (Hammond et al., 2011). The PrOACT-URL approach also
provided flexibility and adaptability in that not all of its elements need to be used in a
given decision-making situation but it does present a “pick and choose” option to the
decision-maker.
Decision tree (and value tree) models incorporate, in diagrammatic displays, decisions
(options), subsequent uncertain events, consequences and multiple criteria describing the
consequences of a decision. They show these as branching structures, like trees tipped
on their sides, with roots (decisions) at the left, and branches to the right showing
possible outcomes of the uncertain events, followed by more decisions and a repeated
process until a point representing some time in the future when consequences will be
apparent. They can be applied to any decision-making scenario. Decision-trees require
that preference logic is used in each expansion of the decision-options and implies that
18
just two quantities are needed for decisions: numbers that express the relative values of
possible consequences and numbers showing how likely these consequences are to
occur. Multiplying utilities by their associated probabilities and summing those products
over all consequences for a given alternative provides an expected utility figure that is a
guide to action. The decision-tree approach requires the decomposition of a complex
statement into its elements and then assessing probabilities and utilities about the
relevant elements and finally reassembling the pieces using the expected utility
calculation. That result allows decision-makers to examine their decision preferences
and present a logically sound approach to decision-making. One problem with decision
trees is that they can expand exponentially as more and more nodes are included, thereby
becoming very complex. On the other hand, it is appreciated that if the problem is very
complex, unaided human judgement can also be questioned as an acceptable alternative.
The PhRMA BRAT framework standardises and supports the decision-making and
communication of a benefit-risk assessment between pharmaceutical companies and
regulators through a 6-step process:
Step 1: Define decision context
Step 2: Identify outcomes
Step 3: Identify data sources
Step 4: Customise framework
Step 5: Assess outcome importance
Step 6: Display and interpret key benefit-risk metrics (Coplan et al., 2011).
The US FDA BRF (Benefit-Risk Framework) provides the “big picture” to “tell the
story” by summarising evidence and addressing their implications for decision in a table
for five decision factors: analysis of condition, unmet medical need, benefit, risk, and
risk management and is presented in Figure 1.4 (Frey, 2012).
19
Figure 1.4: US FDA Benefit-Risk Framework
The UMBRA initiative established by CIRS in 2012 aims to provide a platform for the
coordinated development of benefit-risk assessment methodologies that can be used
internationally during the drug development and regulatory review and post-approval
periods. The goals of the programme are to increase the transparency, predictability and
consistency with which benefit-risk assessments are conducted. The UMBRA (Unified
Methodologies for Benefit-Risk Assessment) framework is aimed at establishing a
unified benefit-risk framework with an 8-step common element process addressed in 4-
stages shown in Figure 1.5. (CIRS, 2012). The four stages involve:
1. Framing the decision – decision context
2. Identifying benefits and risks – building and refining the value tree
3. Assessing benefits and risks – relative importance of benefits and risks
evaluating the options
4. Interpretation and recommendations – evaluating uncertainty, concise
presentation of results, and expert judgement and communication.
An attractive element of the UMBRA descriptive framework appears to be its ability to
accommodate the perspectives of the pharmaceutical companies, healthcare providers
and regulatory agencies.
20
Figure 1.5: UMBRA benefit-risk framework
Building the benefit-risk toolbox – CIRS workshop report - 2012
The MCDA (Multi-Criteria Decision Analysis) framework is a qualitative and stepwise
decision-making process that allows quantification of the overall performance of two or
more alternatives. It employs some quantification techniques during the process but the
overall framework is qualitative in its nature. It provides an approach and a set of steps,
with the goal of providing an overall ordering of options, from the most preferred to the
least preferred option. MCDA is a way of looking at complex problems and breaking the
problem context into more manageable pieces to allow data and judgements to be
brought into the decision task. The elements of the complex problems can be
reassembled presenting a coherent overall picture to decision makers. The purpose is to
serve as an aid to thinking and decision-making, but not to take the decision. As a set of
techniques, MCDA provides different ways of disaggregating a complex problem, of
measuring the extent to which options achieve objectives, of weighting the objectives,
and of reassembling the pieces (Dodgson, 2009). In benefit-risk assessments, statistical
software is regularly used to provide simulation and modelling support to tackle the
21
complex decision context. As applied to the benefit-risk balance of a drug and its
comparators, performance of the alternatives on the favourable and unfavourable effects
are judged for their clinical relevance, and all effects are weighted to create a common
unit of preference value or utility. Applying an MCDA approach to sum the common
units of benefit and risks provides an overall benefit-risk preference value or utility for
each alternative, enabling aspects such as the calculation of the difference of the drug
against the comparators (Mussen et al., 2009; Tony et al., 2011). The MCDA
framework involves:
• Establishing the decision context
• Identifying the options to be appraised
• Identifying objectives and criteria
• ‘Scoring’ by assessing the expected performance of each option against
the criteria. Then assessing the values associated with the consequences
of each option for each criterion
• ‘Weighting’ by assigning weights for each of the criterion to reflect
their relative importance to the decision
• Combination of the weights and scores for each option to derive an
overall value
• Examining the results
• Performing a sensitivity analysis.
The MCDA approach offers a logical approach which helps to define the problem
context, helps decision-makers explore their heuristic values, choices and judgements
through structuring and presenting information in a manner that allows them to consider
and challenge their considerations. It also identifies a preferred course of action and
allows for final decision-making to be based on expert judgement. It is not intended to
replace this expert judgement but acts to compliment it. It also gives structure and a
step-wise audit trail and transparency to the decision-process. A summary of the
comparative characteristics of the PrOACT-URL, PhRMA BRAT, US FDA and
UMBRA benefit-risk assessment frameworks is presented in Table 1.1.
22
Table 1.1 Comparisons of existing benefit-risk assessment frameworks
Frameworks reviewed
Core elements
Framing the
decision Identifying benefits and risks Assessing benefits and risks Interpretation and outcome
US FDA Analysis of conditions
and unmet medical needs
Clinical benefits, risks Evidence and uncertainties Conclusions and
reasons, risk
management plans
EMA PrOACT-URL
Nature and framing of
the problem
Objectives, favourable and unfavourable effects Alternatives
regarding
options to be
evaluated and
the
consequences
Trade-offs
and benefit-
risk balance
Evaluating
uncertainty
Effects table and
risk tolerance
Consistency of
decisions (linked
decisions)
PhRMA BRAT
framework
Define decision context Identify
outcomes, extract
source data: build
value tree
Customise framework:
refine value tree
Assess relative importance of
different outcomes: weighting or
ranking, other stakeholders
Evaluating
uncertainty
Display and
interpret key
benefit-risk metrics
and validate results
Decision and
communication of
benefit-risk
assessment
UMBRA Universal benefit-risk framework
Step 1 Step 2 Step 3 Step 4 Step 5 Step 6 Step 7 Step 8
Decision context Building the value
tree
Customising the value tree Weighting of
benefits and
risks
Scoring
the options
Evaluating
uncertainties
Concise
presentation of
results
(visualisation)
Expert judgment
23
The pharmaceutical industry and regulatory agencies agree that frameworks facilitate
the provision of quality decisions and transparency. The IMI-PROTECT project (IMI-
EFPIA, 2013b) has recommended that frameworks should contain the following four
components as shown in Figure 1.6.
Figure 1.6: IMI-PROTECT Evaluation components for evaluation techniques / frameworks
ESFPI/PSI Benefit-Risk Special Interest Group meeting, 2012
In the development and lifecycle of medicines there is still no single framework for
decision-making that fulfils the requirements and perspectives of the regulatory and
pharmaceutical stakeholders in making and communicating benefit-risk decisions.
1. FUNDAMENTAL PRINCIPLES - Logically sound
- Increased transparency - Statistical uncertainty estimate
-Includes other sources of uncertainty - Principles easily understood - Handling of multiple options
2. FEATURES - Balance of benefits and risks
- Several benefit and risk criteria - May include multiple sources of
evidence - Allows sensitivity analyses
- Time dimension - Methods can be formally updated
- Any unique feature
3. VISUAL REPRESENTATION MODEL - Potential visualisation techniques
4. ASSESSIBILITY AND ACCESSIBILITY - Parameters and results easily
interpretable - How practical is the method when
used in real-life decision-making - Perspective for which the methods
are useful - Can make the method lead to better
decision-making
24
Any new decision-making framework should aim to capture a number of key elements
and the following builds on the IMI protect initiative (IMI-EFPIA, 2013b):
1. Include the perspectives of the stakeholders by involving them integrally in the
qualitative and quantitative development and validation stages of the new
framework (or instrument)
2. Have logical soundness and presents coherent dimensions to aid rational
thinking
3. Provide a structured and systematic approach
4. Be comprehensive to allow utility in all forms of medicinal products and
across all lifecycle stages (e.g. discovery, clinical, registration submission,
regulatory review and post-authorisation)
5. Present confidence and acceptability by having undergone due validation
resulting in a structured approach that would allow validity checks and an
audit trail on stepwise decisions
6. Possess specificity and sensitivity supported by an underpinning statistical
perspective
7. Increase transparency in the decision-making
8. Have easily understood principles such as an aim to assess the quality of
decision-making
9. Incorporate the value judgements of stakeholders (e.g. individual or
organisational)
10. Be derived from and include multiple sources of evidence
11. Allows sensitivity analyses (e.g. use in different populations)
12. Have a time dimension
13. Possess flexibility to be adapted
14. Have the ability for stand-alone use or for combination use with other accepted
techniques and/or methodologies e.g. semi-quantitative or quantitative
frameworks
15. Present easily interpretable results and facilitate an effective communication of
the basis of the decision
16. Add better predictability into the decision-making
25
17. Be practical in real-life decision-making and easy to use
18. Present a method leading to better decision-making
19. Have a visualisation technique such as a graphical profiling of an individual’s
decision-making style to promote understanding and communication
20. Have a unique feature such as universality, international attraction and good
branding (e.g. memorable brand name).
Benefit-risk assessments and decisions in the development and approval of medicines
rely on scientific capabilities and subjective clinical judgements. These decisions need
to be monitored during the life cycle of a medicine from drug development to post-
marketing and there should be an effective and iterative exchange of information
between the different stakeholders. The EMA have provided their opinion and
recommend that any quantitative benefit-risk assessment method or approach should
have a qualitative framework component. Combinations of such qualitative and
quantitative approaches could prove useful (Guo et al., 2010a) and an overarching
benefit-risk assessment framework with the capacity to incorporate various quantitative
methods would be ideal. A universal overarching framework can be interpreted as a set
of principles, guidelines and tools to guide decision-making in organising,
understanding, summarising, quantifying and communicating the basis of the decision.
Methodologies are tools which assist in conducting the scientific assessment and aid
the articulation, communication and visualisation of decisions (Walker, 2011).
Results of a study by Leong et al. published in 2013, investigating the need for a
universal benefit-risk assessment framework for medicines captured the perspectives of
the pharmaceutical industry and the regulatory agencies and showed valuable insights
into the current usage of qualitative and quantitative systems. It showed that qualitative
systems are employed by both industry and agencies and implied that value and
weighting had generally not been applied in benefit-risk assessment. Assigning weights
to the different benefits and risks allows transparency, clarification and communication
of their relative importance and of the overall basis of the final decision. The absence
of fully quantitative systems, values, weights and visualisation tools is recognised as
26
presenting a challenge to effective communication of decisions to all stakeholders.
Having a universal overarching systematic framework for decision-making and
benefit-risk assessment in particular, should provide a formal structure for
documenting the component processes leading to the final decision and this added
transparency will allow all stakeholders to make informed quality decisions (Leong et
al., 2013).
Stakeholder Interest in Improved Quality Decision-Making
It is evident from current and joint pharmaceutical industry/regulatory agency activities
over the recent years that there is a definite desire by all stakeholders to improve
currently used decision-making approaches. Considerable investment of resource and
effort is evident on the qualitative, semi-quantitative and quantitative frameworks
intended to help in the benefit-risk assessment of medicines. Within all of the
frameworks and underpinning techniques, there remains a subjective element of
decision-making required at one of the multiple stages of the decision-process. What is
not fully transparent is how the subjective decisions in drug development and the
regulatory review are made and whether there are influences, behaviours and other
latent factors that contribute to the decision-making. These insights into the subjective
decision-making element may help to promote better quality decision-making.
To date there is limited information on the quality of decision-making and this
prompted the current research. Therefore, the current unknowns are: do these
organisations and individuals make good quality decisions? What are the influences
and approaches they use in their decision-making? Is there a place for a new
framework to further aid decision-making for use throughout the drug development
and complete life cycle? What appears to be currently missing from the drug
development and review armamentarium is a generic instrument to assess and enable
quality decision-making. Such an instrument could also facilitate the development of a
decision-making framework to be used beyond just the benefit-risk assessment and it
could incorporate the perspectives of the industry and regulatory agencies.
27
AIM AND OBJECTIVES OF THE STUDY
Aim
The aim of this study is to develop and validate a generic instrument for appraising the
quality of decision-making.
Objectives
• Design a framework for the development of a decision-making instrument
within drug development and the regulatory review
• Identify decision-making themes from the perspective of the individual and the
organisation using qualitative techniques
• Develop a prototype instrument to appraise the quality of decision-making
using the outcome of the qualitative techniques
• Determine content validity of the developmental version of the quality of
decision-making instrument
• Refine the generic quality of decision-making instrument in the target
population using factor analysis
• Development of the final version of the instrument, Quality of Decision-
Making Orientation Scheme (QoDOS).
29
Part 1: STUDY RATIONALE Chapter one highlighted the paucity of previous research studies investigating the
quality of decision-making undertaken by the regulatory agencies and the
pharmaceutical industry. Given the importance of global drug development and the
societal need for new medicine, it is proposed that information is collected on the
decision-making approaches and influences of regulatory agencies and
pharmaceutical industry. This will enable:
• Provision of insights into the decision-making approaches and influences of
pharmaceutical companies and regulatory agencies
• Generation of an instrument to measure and enable quality decision-making
within the drug development life cycle
• Develop an instrument which would allow a visualisation of an individuals and
their organisation’s decision-making approach which would present an
articulation, understanding and clarity on areas for development
• Provide a framework for promoting consistency, transparency and
communication of the decision-making approach
• Identification of the hallmarks of good decision-making practice.
The literature review highlighted several past and ongoing initiatives within the
pharmaceutical industry and the regulatory agencies (and more recently including
academia) aimed at developing decision-making methodologies. Most of these
initiatives and aimed at promoting better decision-making and in particular in regard
to benefit-risk assessment. Several decision-making frameworks and tools developed
to facilitate decision-making were reviewed. It was established that there is no
validated and reliable instrument to assess and enable quality decision-making in the
drug development and regulatory review, currently available in the public arena. This
helped to frame the research question and the research message.
PART 2: METHODOLOGICAL FRAMEWORK The choice of research approaches depends on the nature of the research question
and research objectives (Strauss and Corbin, 1998; Patton 2002). The research
method to be used in this investigation into influences, approaches, behaviours and
30
overall quality of decision-making, will be a mixed-methods approach involving both
qualitative and quantitative techniques. In the qualitative research, face-to-face
interviews will be conducted with a variety of key opinion leaders (KOLs) from the
European Medicines Agency (EMA) and national European regulatory agencies,
international pharmaceutical companies and contract research organisations.
Quantitative research methods will be for the psychometric evaluation of the
instrument and appropriate statistical analyses will be employed for reporting and
interpretation of the results. A triangulation of research methodologies will underpin
validation of the final generic instrument.
Study Design
The selection of a research design is one of the most important decisions that must be
taken into account in order to answer the research questions. A ‘research design’ is a
plan of the procedures for an investigation to be conducted, based on the nature of
the research problem or issues being addressed and the researchers personal
experience (Creswell, 2003; Meyrick, 2006). The research methodology tells readers
how the researcher chooses the available methodology and conducts the various
stages of research. It should reflect the overall process, in which the research
philosophy, approach, strategy, data collection methods and data analysis are
consistent (Saunders, 2009). Such an approach is presented for this research and a
description of the planning, evidence gathering, data preparation, analyses,
exploration and communication of the research findings and overall conclusion. A
mixed-methods approach involving an initial qualitative phase followed by a
quantitative will be used in this research study.
Qualitative and Quantitative Research Methodologies
According to Cresswell (2003), qualitative research is an inquiry process of
understanding based on distinct and methodological traditions of inquiry that explore
a social or a human problem. The researcher builds a complex, holistic picture,
analyses words, reports detailed views of informants and conducts the study in a
natural setting (Creswell, 2003). It allows us to gain an understanding and to access
any latent factors by focusing on the context of people’s everyday life (Barbour et
al., 2008). Qualitative data consist of items such as: in depth descriptions of
circumstances, people, interactions, observed behaviours, events, attitudes, thoughts
31
and beliefs and include direct quotes from people who have experienced or are
experiencing the phenomenon (Strauss and Corbin, 1998; Patton, 2002; Denzin and
Lincoln, 2005; Dicicco-Bloom, 2006). These data are gathered using techniques
such as focus groups or interviews (Ritchie, 1994; Doyle, 2012).
Qualitative data help researchers understand processes and latent issues, especially
those that emerge over time, provide detailed information about setting or context,
and emphasise the voices of participants through quotes (Doyle, 2012). Qualitative
methods facilitate the collection of data when measures do not exist and provide a
depth of understanding of concepts (Strauss and Corbin 1998; Graneheim and
Lundman, 2004; Ryan, 2007). To understand the processes or the how and why of a
given phenomenon qualitative research provides the necessary in-depth and
exploratory tools to achieve a clear picture of the process (Collis, 2009). The overall
approach is flexible and evolving and caters for the addition of new information and
perspectives. Also, according to Silverman, qualitative research findings from
interviews and questionnaires which ask respondents to provide facts, attitudes or
experiences, have an important part to play in healthcare (Silverman, 2000).
Quantitative data is any data presented in numerical form such as statistics,
percentages, whole numbers, metrics or other such data outputs. It aims to answer
typical questions relating to where, what, who, how many and when (Silverman,
2000). The objective of quantitative research is to develop and employ mathematical
models, theories and/or hypotheses pertaining to phenomena (Crabtree and Miller,
1999; Silverman 2000).The process of measurement is central to quantitative
research because it provides the fundamental connection between the empirical
observation and a mathematical expression of quantitative relationships (Silverman,
2000). The approach involves collection and analysis of numerical data answer to
answer a research question (Crabtree and Miller, 1999; Moule and Goodman, 2009).
Quantitative research and its mathematical output aims to present results in a factual
and unbiased manner. The results obtained also allow for an extrapolation from a
small population (sample size) to a larger and more generalisable population
(Silverman, 2000).
In mixed-methods studies researchers choose to combine different types of research
methods. They combine quantitative (e.g. a survey) and qualitative (e.g. an in-depth
32
interview) research methods, resulting in a combination of statistical and experiential
data and findings (Hanson et al., 2005). The mixed-methods pragmatic approach to
be used will have an initial qualitative component followed by a quantitative phase.
According to DiCicco-Bloom and Crabtree, mixed-methods in which both qualitative
and quantitative approaches are integrated in a way that contributes to provide a rich
and comprehensive study. Mixed-methods provide rigorous and methodologically
sound study designs, with qualitative techniques such as interviews being an integral
component of an evolving study process that is responsive to emerging insights,
supported by quantitative analyses (Creswell, 2003; Doyle, 2012).
Research purposes are normally categorised as being exploratory, explanatory and
descriptive (Creswell, 2003). Exploratory research is undertaken when an issue or
phenomenon is poorly understood and little research has been done on it (Creswell,
2003). Normally, an inductive approach is suitable for exploratory purposes to look
for patterns and ideas (Collis, 2009), and it is employed in exploratory research to
arrive at a set of assumptions on which to base the research design. This approach
applies to the current research on the development and subsequent validation of a
generic decision-making instrument being undertaken.
Descriptive research is conducted to describe the features of the variables of interest
in a situation (Sekaran and Bougie, 2010). A deductive approach is suitable for
descriptive research (Sekaran and Bougie, 2010). An explanatory study is used to
establish relationships between variables, and both deductive and inductive
approaches can be applied to it (Saunders, 2009). As the differences between
deductive and inductive research are narrowed down, an approach that combines
these two is becoming more widely used (Doyle, 2012). A combined approach can
provide a better understanding of a specific research topic rather than two separate
ones.
Interpretivism entails that research and reality are inseparable and reality is internal
and socially constructed (Remenyi et al., 1998; Denzin and Lincoln 2005). The
interpretative paradigm is viewed as qualitative, inductive and subjectivist, while the
positivist paradigm is described as quantitative, deductive and objectivist.
Interpretivists attempt to understand not only what is happening, but also why it is
33
happening (Creswell 2003; Denzin and Lincoln 2005). Pragmatists hold the view that
it is perfectly possible to work with both philosophies (Saunders, 2009). This
approach claims that mixed-methods are possible and highly appropriate within
research and provide more comprehensive evidence than one method alone can
deliver (Casey et al., 2011; Doyle, 2012). In this research, in order to satisfy the
research objectives both qualitative data (which deal with more in-depth and
insightful exploration with limited number of interviewees) and quantitative data
(which can be collected from wider samples for generalisation) were collected. The
philosophical underpinning of pragmatism allows and guides mixed methods
researchers to use a variety of approaches to answer research questions that cannot be
addressed using a singular method. Mixed methods research is viewed as the third
methodological movement and as an approach it has much to offer health and social
science research. Its emergence has been in response to the limitations of the sole use
of quantitative or qualitative methods and is now considered by many a legitimate
alternative to these two traditions. Overall, it can be seen that a mixed-methods
pragmatic approach was appropriate and was the approach adopted in this research.
PSYCHOMETRIC PROPERTIES OF A MEASUREMENT TOOL
Psychometrics is the field of study concerned with the theory and technique of
psychological measurement, which includes the measurement of knowledge,
abilities, attitudes, behaviours and traits. The field is primarily concerned with the
construction and validation of measurement instruments such as questionnaires, tests,
and personality assessments. It involves two major research tasks, namely: (i) the
construction of instruments and procedures for measurement; and (ii) the
development and refinement of theoretical approaches to measurement.
Psychometric evaluation will be performed on the developmental generic instrument.
In this research, the development of the generic decision-making instrument will
have exploratory, descriptive, explanatory and confirmatory purposes. Firstly, this
research will be exploratory as there are no currently validated instruments available
for assessing the quality of decision-making. This research will employ an inductive
approach in the qualitative stage involving the proposed conduct of interviews and
subsequent thematic analysis. Secondly, this research will be descriptive, as it will
aim to describe any emergent decision-making themes. A deductive approach will
34
be used in the mixed-method qualitative and quantitative data analyses techniques to
test results emergent from the research stages. Thirdly, this research will be
explanatory, as it is aimed at establishing the relationships between different
decision-making factors and themes which may emerge from the analysis of the
results obtained from the different stakeholders. Fourthly, it is hoped to be
confirmatory in that it will investigate construct validity and reliability of the generic
developmental instrument.
DATA SOURCES AND COLLECTION MEDLINE, PUBMED and other internet-based search engines were used to perform
a systematic literature review to identify methodologies for measuring the quality of
decision-making within the drug development arena and the regulatory review. An
extensive and systematic literature search was performed to identify such
methodologies. These platforms were used to find scientific publications, books,
academic conference proceedings. Country specific drug regulatory internet sites
were also searched. Key search words included: decision-making (and decision-
making), drug development, tool, instrument, validated, risk-benefit, regulatory,
pharmaceutical, quality, framework, best-practice and influences. Search inclusion
criteria used were 1) only English language publications, 2) with focus on drug
development and the regulatory review of drugs and 3) decision-making analysis and
techniques. Exclusion criteria included; veterinary-medicine publications, cosmetics,
homeopathy, and animal studies. The perspective of the decision-making literature
interrogation was not limited to that of any one stakeholder. It is believed that this
literature review corroborated the research into the development of a tool to facilitate
improved decision-making in the pharmaceutical and regulator target audience.
The literature interrogation helped generate the appropriate framing of the research
problem context. This allowed for the rationale of the proposed research approach,
the evolution of the research investigation, the proposed methodology, the target
study population and the potential target audience that could benefit from the
availability of a validated new generic decision-making tool to be identified. In
addition to the literature interrogation, direct contact was also made with
organisations such as the Cochrane Collaboration, Stanford University, professional
35
networks specialising in “Decision-Making” and also through the researchers own
professional networks to determine if there was a suitable decision-making
instrument available in the public domain.
Data Collection Techniques
Qualitative research techniques involving semi-structured interviews, use of expert
panels and thematic framing will be used in a complimentary manner to the
quantitative techniques which will comprise primarily of several different types of
statistical analyses. A tabular summary of the data collection techniques to be
employed in the research is presented in Table 2.1
Table 2.1: Overview of the data collection techniques used in the generic decision-making instrument research
Data collection and Analysis Mode Research Objectives Thesis Chapter
Semi-structured interviews with
Key Opinion Leaders
Qualitative research
To identify emergent themes relating to the
decision-making research
Generate a developmental version of an
instrument for measuring the quality of
decision-making
Generation of a thematic map
3
Qualitative research involving an
expert panel /qualitative research
Content validation of the developmental
decision-making instrument
4
Qualitative and quantitative research Factor analysis
Item reduction
5
Qualitative and quantitative research Reliability and construct validity testing of the
developmental instrument
Identification of the hallmarks of good
decision-making practice
6
Decision-Making Instrument: Data Collection Technique
Qualitative and quantitative data collection techniques will be used in this research
including interviews with Key Opinion Leader’s (KOLs) from the regulatory
agencies and pharmaceutical arena. Digital recordings, the NVivo computer
relationship database (Bazeley, 2007; Casey et al., 2011) and web-based
questionnaires (Richards, 2005). Thematic mapping (Attridge- Stirling, 2001; Braun
and Clarke, 2006; Casey et al., 2011), construct validation and triangulation of the
36
qualitative and quantitative research finding will be used to compound the
interpretation of the overall research outcome.
Qualitative Techniques: Semi- Structured Interviews & Questionnaires There are three recognised different types of interviews: structured, unstructured and
semi-structured. Semi-structured interviews strike a balance between a structured
interview and unstructured interview. In the semi-structured interviews the questions
are open ended and do not limit the respondents/interviewees choice of answers. The
purpose is to provide a setting/atmosphere where the interviewer and interviewee can
discuss the topic in detail.
The advantages of face-to-face interviews include the flexibility afforded in
presenting a series of questions ranging from “closed” to “open”, verbal interactions
and enhanced assurance on understanding of question asked, It has been shown that
individuals are more likely to be interviewed rather than complete a questionnaire,
especially when the topic is seen to be interesting and relevant to their own current
work (Holstein, 2001; Dicicco-Bloom, 2006). Interviews are also a good method of
building rapport and are non-judgemental and can be improved by showing a
genuine interest in the responses and appreciation of the time-investment of the
interviewee. Semi-structured interviews are generally organised around a set of
predetermined open-ended questions or checklist, with other questions emerging
from the dialogue between the interviewer and interviewees. Semi-structured in-
depth interviews are the most widely used interviewing format for qualitative
research and take between 30 minutes to several hours to complete (Dicicco-Bloom,
2006). Semi-structured interviews will be used in this research.
The individual interview technique is also a qualified research data collection method
used in new instrument development purposes (Patton, 2002; Patrick et al., 2011a).
The main advantages of individual interviews are that they allow face-to-face
communication and help to obtain more in-depth and detailed information about an
individual’s experience. It is also recognised that potential “downsides” to the
individual interview approach are: time-sacrifice involved, it may take longer to
collect the data, limited to one participant’s view at a time; no peer comparison, cost
37
(e.g. travel, transcription fees) (Patrick et al., 2011b). Individual interviews are ideal
for concepts that are sensitive or target populations/people are unlikely to volunteer
or share information in a group setting (Patrick et al., 2011b). This is a pertinent
consideration for this research in which confidential, sensitive and subjective
discussion items will be raised.
Semi-Structured Interview Procedure
In this research, individual face-to-face interviews using a semi-structured interview
checklist will be used in the majority of the interviews with the senior decision-
makers. Where this is not possible, the interviews will be held by teleconference. The
face-to-face interviews should allow for a respect, understanding and rapport to
develop between the interviewee and the researcher performing the interviews. It is
hoped that the use of this checklist and interviews will provide a free-flowing
dialogue and discussion forum between the interviewee and interviewer.
Before the scheduling of any interview, each interviewee will be sent by e-mail a
copy of the research outline. This research outline will provide detail on the: research
background, research objective, research methodology, informed consent and
confidentiality assurance, estimated time needed for the conduct of the interviews,
the time window during which interviews are planned, data collection, next steps
details in the overall research and inform interviewees that the results of the overall
research investigation would be made available in due course. This approach is in
line with good research practice (Mathers, 2002; Meyrick, 2006). At the start of all
interviews, confidentiality will be assured and a request made to record the
interviews.
An Olympus WS-6505 digital high quality voice recorder will be used to record all
the interviews with the senior decision-makers. The interview transcripts will form
the basis of the qualitative research component (Wellard and McKenna, 2001;
Mathers, 2002; Halcomb and Davidson, 2006). The use of audio recording in concept
elicitation interviews is well established and helps to fully capture the context and
content of each session as well as to produce transcripts that form the data for
analysis. Audio recordings facilitate participant anonymity and are generally
comfortable for participants, particularly when sensitive topics are being discussed.
38
Participants are assured of confidentiality and limited use of the recorded materials
from their interviews. Recording also frees the interviewer from note taking so that
he or she may engage fully with participants (Wellard and McKenna, 2001; Patrick
et al., 2011b).
Web-based survey questionnaire platforms will be used during the developmental
and validation stages of the generic instrument research. This web-based method
involves posting a questionnaire onto a website allowing the respondents to complete
remotely (Diem, 2002a). The advantages of this method include: quick responses are
possible; it can be inexpensive if the correct software and tools are available; postage
is reduced or eliminated; and it is easy for respondents to reply. The Survey-Monkey
web-based survey platform will be used in this investigation (Survey Monkey, 2013).
The commonly reported techniques aimed at improving questionnaire response rates
will be used if needed for each of the questionnaire surveys conducted (Schleyer and
Titus K.L., 2000; Diem, 2002b; Boynton, 2004). Data will be collected through the
web-based questionnaires and the survey-monkey functionality. All questionnaire
returns should be completed directly into the Survey-Monkey database and
anonymity and confidentiality will again be respected and assured throughout the
data collection, analyses and reporting stages.
Information Sources
The generic developmental instrument will involve gathering information from at
least 10 regulatory agencies and more than 60 international pharmaceutical
companies.
Study Instruments
As detailed in Chapter 1, there is currently no existing validated instrument available
to measure the quality of decision-making within the drug development and
regulatory arena. There are many instruments in the medical decision-arena
especially relating to quality of life. Many were reviewed for their applicability and
value in the current research question and some example instrument articles are
referenced (Guyatt, 1993; Pijls-Johannesma et al., 2005; Langham et al., 2008; Ruiz
et al., 2008; Rothman et al., 2009; Kriston et al., 2010; Bhatti et al., 2013a; Bhatti et
al., 2013b). A tool developed to monitor the Centralised Procedure for submission of
39
marketing authorisation application (EMA, 2000) was also reviewed but again, the
tool was not considered fit-for-purpose to address the research aim relating to the
quality of decision-making.
A thorough search of the internet will be performed to investigate many of the web-
sites given over to decision-making, decision-analysis and decision-techniques.
Some of these sites could be helpful in providing extra dimension considerations to
the research question although the sites are not aimed at the drug development or
general healthcare arena. It is recognised that the audience for most of these websites
appears to quite broad ranging from the “general public” to persons with specific or
academic expertise in an area of the decisions sciences or strategic management/
business leadership area (Web, 2012; MindTools, 2013; Government, 2013; Stanford
University, 2013; UCI, 2013; Stellenbosch University 2013b).
Generic Instrument Development Techniques
Conceptual Model and Hypothesis
The origin of the conceptual framework was an appreciation of the lack of research
performed to date investigating the actual quality of decision-making by stakeholders
involved in the research, development and delivery of new medicines. An initial six
themes were generated for the interview checklist based on value judgments which
formed the basis of the qualitative interviews and in turn the construction of the
developmental decision-making instrument. The objectives of the conceptual
framework were to explore the ways in which individuals (decision-makers) and
different companies/organisations manage decision-making and to identify the
hallmarks of good decision-making practice. The steps involved in the development
of the generic decision-making instrument are presented in Figure 2.1.
40
Figure 2.1: Development of The Generic Decision-Making Instrument
Expert review Conceptualisation
Literature Review Item Generation
Screening Criteria: Importance Universality Wording /
Ambiguity General
Acceptability
Item Reduction
Assessment of validity: Clarity Completeness Linguistic Clarity Relevance Structure
Initial versions of the instrument
QoDOS Instrument
Item reduction &
construct domains
Literature review
Factor analyses
Item revision and generation KOL Interviews
Expert review
Expert review
Expert review
Expert review
Expert review
Validation Construct Reliability
Developmental instrument Expert review
41
Psychometric Evaluation of The Study Instrument
As the generic instrument is a new instrument it will be examined to ensure it has
adequate measurement properties relevant to decision-making from the perspective
of the individual and the organisation. The applicability, practicality, acceptability, as
well as four validity aspects of the instrument will be evaluated at several stages
through its development (Nunnally and Bernstein, 1994; Simon et al., 2006; NIH,
2012). Qualitative and quantitative research components will be employed in the
stepwise development and validation of the instrument.
Validity can be established in several ways and addresses the issue of whether what
we are trying to measure is actually measured. Published measures for various
concepts usually report the kind of validity that has been established for an
instrument, so that the user or reader can judge the “goodness” of the measure
(Streiner and Norman, 2008; Bougie, 2010).
Face validity
Face validity simply indicates whether, on the face of it, the instrument appears to be
assessing the desired qualities. The criterion represents a subjective judgement based
on a review of the measure itself by one or more experts, and rarely are any
empirical approaches used (Streiner and Norman, 2008). Face validity will be
performed at each stage of the instrument development. Face validity measurement
can be considered as a basic and a very minimum index of content validity. In
questionnaire and instrument development, each component item is reviewed by a
person or team familiar with the target research area and asked to validate whether in
their judgement that the questionnaire/instrument content, layout, language and
format are appropriate. A positive review and acceptance provides an implicit
assessment of face validity.
Content validity
Content validation is an important process whereby a new measuring instrument is
examined for its focus and emphasis relating to the target population (Streiner and
Norman, 2008; Bougie, 2010). In questionnaire or instrument development, it is
used to ensure that the questionnaire includes a representative and adequate set of
items to uncover the concepts in the research questions. The more the scale items
42
represent a related field or domain of the concept being measured, the greater the
validity. The use of expert judges to solicit opinions on the suitability of the measure
is used to establish content validity. It is a fundamental requirement of instrument
validation and also inherently supports construct validity and generalisability of a
new instrument. The content validation exercise to be performed will involve a panel
of not less than four experts reviewing and providing their feedback on the language
clarity, completeness, relevance, and scaling of the developmental instrument items.
Quantitative assessment techniques can be used to complement the subjective
reviews of the expert panel. The techniques that will be used are: calculation of the
Content Validity Index (CVI) and Scale Content Validity Index (S-CVI). In addition,
intraclass correlation coefficients (ICC) and reliability (Cronbach’s alpha) testing
will be determined using SPSS statistical software. Content validation will be
described in more detail in Chapter 4.
Criterion-related validity
Criterion-related validity is established when the measure differentiates individuals
on a criterion it is expected to predict. There are two types of criterion-related
validity; predictive and concurrent validity (Streiner and Norman, 2008) Predictive
validity indicates that a future criterion can be replaced by a current measurement on
a scale. Concurrent validity refers to a relationship between a predictor variable and
a current variable, both of which are assessed at the same time (McDaniel and Gates,
2002. In other words, when testing different individual variables that are known to
be different, they should score differently on the results (Sekaran and Bougie, 2010).
Construct validity
Construct validity is concerned with how well the results obtained from the use of a
measure fit the theoretical foundations from which it is designed (Meehl, 1955;
Trochim, 2006). It associates the practical components of an instrument test score
obtained from with some underlying theory of behaviour (Salkind, 2006; Trochim,
2006). Constructs are underlying latent variables which cannot be directly observed
but encompass the foundation dimensions of a psychometric instrument. Construct
validation contains two validity sub-categories (convergent and discriminant).
Convergent validity is the degree to which the concepts that should be related
theoretically are interrelated in reality. Discriminant validity is the degree to which
43
concepts should not be related theoretically and are in fact not interrelated in reality
and is established when two variables which are predicted to be uncorrelated or to
have low correlation (Westen and Rosenthal, 2003; Trochim, 2006; MacKenzie et
al., 2011). Evidence of construct validity can be presented using a multi-trait-multi-
method matrix (MTMM). The MTMM is an approach which examines convergence
(evidence that different measurement methods of a construct give similar results) and
discriminability (ability to differentiate the construct from other related constructs)
(Campbell and Fiske, 1959; Trochim, 1989).
Sensitivity
The sensitivity of the instrument is the ability to measure any degree of change
(Streiner and Norman, 2008). Sensitivity assessments will be performed during the
development of the generic instrument.
Responsiveness
Responsiveness assesses the ability to measure important change. According to
Liang (2000), it is the ability of an instrument to measure a meaningful or clinically
important change in a clinical state (Liang, 2000). Patrick and Chiang, view
sensitivity and responsiveness as a form of construct validation, assessing the
hypothesis that the instrument is capable of detecting meaningful change (Patrick,
2000).
Practicality
The practicality of the study instrument should also be addressed when evaluating
the suitability of a measure and this includes considerations such as respondent
burden, the cost in administering, mode of administration of the instrument (e.g.
interviews or self-administered), the ease with which the measure can be scored and
whether it is readily understood (Holstein, 2001; Dicicco-Bloom, 2006).
Reliability
Reliability of a measure indicates the extent to which it is without bias and therefore
ensures that consistent measurements across time and various items in an instrument
i.e. it helps to assess the “goodness” of a measure (Sekaran and Bougie, 2010). It
refers to the extent to which the instrument is measuring consistently and producing
44
the same result on repeated trials (Higginson, 2001) and assesses that a test is
measuring something in a reproducible fashion; it says nothing about what is being
measured.
Measures of internal consistency are the most widely used indices of reliability. The
reliability coefficient expresses the proportion of the total variance in the
measurement which is due to ‘true’ differences between subjects (Streiner and
Norman, 2008).
Thus the formal definition of reliability is
Reliability = 𝑆𝑢𝑏𝑗𝑒𝑐𝑡 𝑉𝑎𝑟𝑖𝑎𝑏𝑖𝑙𝑖𝑡𝑦𝑆𝑢𝑏𝑗𝑒𝑐𝑡 𝑉𝑎𝑟𝑖𝑎𝑏𝑖𝑙𝑖𝑡𝑦 +𝑀𝑒𝑎𝑠𝑢𝑟𝑒𝑚𝑒𝑛𝑡 𝐸𝑟𝑟𝑜𝑟
Reliability is expressed as a number between 0 and 1, with 0 indicating no reliability,
and 1 indicating perfect reliability (Streiner and Norman, 2008; Eisinga et al., 2013).
Cronbach’s alpha coefficient testing is the most popular test of inter-item consistency
reliability (Salek et al., 1996; Streiner and Norman, 2008). It measures how united
the items are in a test or assessment and is determined by Cronbach’s alpha
coefficient (Salkind, 2006). Cronbach’s alpha testing will be used in the validation
testing of the new generic instrument. Internal consistency is also a relative measure
of reliability and reflects the scale’s ability to differentiate among people. Split-half,
parallel (Davidshofer and Murphy, 2005) and Guttman (Davidshofer and Murphy,
2005) reliability testing are also widely used in qualitative psychometric research and
will be used in the battery of reliability tests to be performed on the developmental
instrument. The internal consistency of measures is indicative of the homogeneity of
the items in the measure that tap the construct. In other words, the items should
“hang together as a set” and be capable of independently measuring the same concept
so that the respondents attach the same overall meaning to each of the items, thus
supporting construct validation. This can be seen by examining whether the items
and the subsets of items in the measuring instrument are correlated. The internal
consistency reliability is a test of the consistency of respondents’ answers to all the
items in a measure. It presents an estimate of degree of inter-correlation between
independent measures of the same concept. The consistency over repeated measures
of the same test can be assessed with the Spearman’s correlation coefficient and the
equivalence of different versions of the same measure can be indexed by a statistical
45
correlation. The internal consistency, which addresses the relatedness/homogeneity
of a single test form, may be assessed by correlating performance on ‘two halves of a
test’, which is termed split-half reliability. The value of this Pearson product-moment
correlation coefficient for two half-tests is adjusted with the Spearman–Brown
prediction formula to correspond to the correlation between two tests (John and
Benet-Martinez, 2000b).
Intra-class correlations (ICC) is the ratio of variance of measurements of a given
target to the variance of all targets and is a complimentary method for assessing
reliability. ICC describes how strongly the items in the same grouping correlate or
resemble each other. It is used to assess the consistency, or conformity, of
measurements made by multiple observers measuring the same quantity. ICC will be
measured as one of the battery of tests performed to evaluate reliability.
Manual Review and Coding of The Transcripts
The transcripts from each of the interviews with the KOL’s will form the basis of the
qualitative research component of this study. Each resultant interview transcript will
be carefully read, reviewed and manually coded for emergent decision-making
themes and sub-themes. This will involve a line by line review of the transcripts and
particular noteworthy quotations will be noted. The time to manually code the
transcripts is expected to take on average three hours per interview script. A
standard manual systematic coding approach will be followed comprising of five
steps (Ritchie, 1994): familiarisation, identification of a thematic framework,
indexing, grouping, mapping and interpretation:
Stage 1: Familiarisation: the process by which the reviewer becomes familiar and
then wholly immersed in the transcripts of the data collected. Throughout this
process there is a growing awareness of the key ideas and recurrent emergent themes
(Basit, 2003).
Stage 2: Identification of a thematic framework: this occurs after familiarisation
with the data set and when the emerging themes are recognisable. The themes and
sub-themes emerge as those that have been expressed by the participants and form
the basis of a thematic framework. Following the identification of the thematic
46
framework, the themes and subthemes can be refined. Refining a thematic
framework is not an automatic or mechanical process, but involves both logical and
intuitive thinking. It involves making judgments about meaning, about the relevance
and importance of themes and about implicit connections between ideas (Ritchie,
1994).
Stage 3: Indexing: is the process of assigning portions, phrases or sections of the
data to a particular theme or sub-theme heading. This data management step assists
with the more formal allocation of themes and sub-themes into defined theme
groupings.
Stage 4: Grouping is the arrangement of the indexed themes and sub-themes under a
specific heading. The naming of the theme heading is an important process and
naming is best done using the language of the interviewees as closely as possible,
because the names of the concepts represent the perspectives of interviewees and not
that of the developers. This naming approach will be followed for emergent decision-
making themes.
Stage 5: Mapping and interpretation: Mapping involves the linkage of the emergent
theme outputs to allow an interpretation and analysis of key emergent characteristics.
This analysis should be able to provide a schematic diagram of the
event/phenomenon emergent themes thus guiding interpretation of the overall data
set (Ritchie, 1994). It is at this mapping and interpretation stage that the objectives of
the qualitative analysis are identified in terms of defining concepts, theme
associations, thematic mapping, providing explanations as well as helping to
developing future strategies.
Data management, processing and analysis
Data Management
Interviews will be transcribed into Word format. The transcription of the individual
interviews from the audio-recording to Word format is expected to take on average
eight hours per interview script. The transcripts will be transferred into the
qualitative software package NVivo 8 for data management and processing.
47
The computer software package NVivo 8, will be used to analyse all the interview
data and support thematic evolution and coding (Richards, 2005; Bazeley, 2007).
NVivo is a specialist package developed solely as a computer aided qualitative data
analysis system (CAQDAS) and is recognised globally as a reputable tool for
managing and supporting this type of analytical work (Richards, 2005). It will be
used to organise, transcribe data, facilitate coding, to perform analyses and assess
inter-coder reliability. The NVivo functionality does not assign codes to the data and
manual subjective coding will be required in this research (Richards, 2005; Bazeley,
2007).
NVivo has two principal benefits: efficiency (time burden of manual approach) and
transparency (NVivo facilitates the maintenance of a clear audit trial). NVivo is a
type of database known as a ‘relational database’ which facilitates the linking of all
relevant imported data (audio and transcripts). It allows a researcher to map out a
project, set up frameworks, organise ideas and establish a range of queries and
themes. The functionality allows for non-numerical and/or unstructured data to be
organised and analysed. In turn, the software allows for the classification, sorting
and arrangement of information; examination of relationships in the data; and
combination of analysis with linkage to themes and concepts using a “Node and
Node Tree approach” coding approach. The Node approach identifies trends, themes
and allows cross-examination of information in various ways. This type of database
facilitates linking all relevant data generated during the data gathering and
importation process. The NVivo system enables the researcher to also add notes to
transcript imports.
Data Processing
The NVivo 8 software will also be used for data processing. NVivo 8 provides a
“tree branch”, that is, a hierarchal nodal-coding system for emerging themes and
links to their main category (conceptual core domain). A colour coding system in this
software allow for large amount of text data to be organised in a consistent standard
manner. This data text being meticulously analysed word-by-word and line-by-line
from the large body of the verbatim transcription text. Subsequently, all the
interview transcripts data will be combined in order to build a broader picture of
different emerging aspects of decision-making themes. Various decision-making
48
themes that emerge will be coded and grouped into core decision-making categories.
A thematic map of the emergent themes will be generated which should allow a
holistic visualisation of the research subject themes and sub-themes.
Coding Framework and Content Analysis
The interview transcript information obtained will be qualitatively coded into nodes,
major categories and domains. Thereafter, it will be analysed, summarised and
quantified in the form of numbers and percentages to provide statistical meaning to
the data.
Quantitative techniques: Data processing and analyses Used on The New
Generic Instrument
Data processing and statistical analysis will be carried out using Microsoft Excel and
SPSS for the QoDOS development instrument research. Various descriptive statistics
techniques will be used in the analyses, interpretation and reporting of quantitative
data. Descriptive tables and bar charts, spider plots and “Box and Whisker plots” will
also be used to illustrate key features in the distribution of data. The Box-and-
Whisker plot graphically describes the shape and characteristics of the distribution of
comparative data. It is a valuable tool for presenting the distribution of related
datasets. A general guide to interpreting a Box-and-Whisker plot is presented in
Figure 2.2 (Salek et al., 1996; Zuckerman, 2006).
A spider graph (also known as a radar chart) is a graphical method of displaying
multivariate data in the form of a two-dimensional chart of quantitative variables
represented on axes starting from the same point. The relative position and angle of
the axes is typically uninformative. They are used in profiling quality improvement
programmes and performance metrics (Basu, 2004; Zuckerman, 2006).
49
Figure 2.2: Guide to interpreting a Box-and-Whisker plot
Statistical programming and descriptive statistics will be employed in the exploratory
and confirmatory factor analyses and construct validation. Descriptive statistics
apply transformations of the obtained data into a form which can provide the
characteristics of large sets of data. The descriptive statistics to be used in the
research include Cronbach’s alpha (reliability), Kaiser Meyer-Olkin (KMO),
Barlett’s test of Sphericity, Scree plots, Spearman Rank Correlation Coefficient,
intraclass correlation coefficient (ICC) techniques, ANOVA, discriminatory,
convergent and regression analysis.
Cronbach’s alpha determinations will be used to measure the internal consistency
reliability of the evolving developmental instrument and this testing will also provide
supportive evidence for the retention and deletion of the items during a planned
factor analysis (Pallant, 2005; Petter, 2007; Streiner and Norman, 2008). Scree plots
provide a useful and easily interpretable impression of the number of factors within
each extraction result. Factor rotation will be performed using the Varimax
technique and Kaiser-Meyer-Olkin (KMO) and Bartlett’s test of sphericity
measurements will be taken to demonstrate that adequate sampling is being
performed for each extraction stage (Field, 2009). Reliability testing using intraclass
correlation coefficient (ICC) techniques will be used to evaluate inter-rater scores.
50
Hallmarks of Good Decision-Making Practice
It is hoped that the insights gained during the development and validation of the
generic instrument could also facilitate the identification of the hallmarks of quality
decision-making. It is anticipated that the decision-making themes that emerge from
the qualitative interviews and corroborated by quantitative research may allow for
best practice recommendations and approaches to be generated. If these hallmarks of
good decision-making practice do emerge from the research then an attempt will be
made to transpose them into a new decision-making framework. The framework
would present a systematic and structured approach to decision-making.
SUMMARY
• A detailed outline of the systematic development approach of the generic
decision-making instrument is provided including the conceptual phase,
interview stage, item generation phase, content validation, web-based
questionnaires conducted, factor-analyses, item reduction, construct
validation, and reliability testing of the new instrument
• The various qualitative methodologies and techniques that will be used in the
research have been described
• Methodological choices relating to interviews, transcriptions, database
management, data processing, data reporting, data analyses and data
interpretation have been evaluated and detailed
• The different types of psychometric properties that will be tested with the
new instrument were discussed
• The various quantitative methodologies and statistical techniques proposed to
be used in the generation, processing and interpretation of output results from
the various research components have been evaluated and detailed
• The secondary study outcome, relating to potential identification hallmarks of
good decision-making and creation of a new framework for quality decision-
making has been detailed.
52
INTRODUCTION Decision-making among the regulators of medicines and members of the
pharmaceutical industry is driven by various factors. Regulators must adhere to a
remit to positively impact public health whilst remaining mindful of precedents and
adhering to laws, regulations and policies (Eichler et al., 2008; Breckenridge et al,
2011). Pharmaceutical industry members, on the other hand, are motivated by the
need to predictably and transparently develop medicines that will fulfil patients’
needs and regulatory requirements whilst delivering profit to shareholders
(Breckenridge and Woods, 2005; PWC, 2012).
The challenges to medicines development for both regulators and industry have been
well documented and include increasing dossier complexity, the need for expedited
approval timing, escalating costs in the face of constraints on capital, patent expiries,
dwindling pipelines and stakeholder scrutiny with resulting demands for access,
proven value, productivity and return on investment (PWC, 2012). Any support for
quality decision-making in the face of these sometimes conflicting drivers and
challenges would benefit all stakeholders (Walker et al., 2007).
Decision-making per se, can be regarded as being part science and part art, with art
in this case being the subjective human component within the decision-making
process. This subjective decision-making style reflects the combination of how an
individual perceives and comprehends stimuli and the general manner in which he or
she chooses to respond to it. It is linked to an individual’s knowledge, ability,
motivation, their value orientation and tolerance for ambiguity (Kahneman, 2012).
Decision-making is usually considered to be the result of cognitive processes leading
to the selection of a course of action among several alternatives (McDermott, 2008).
It also represents a rational or irrational reasoning or emotional process based on
prior knowledge as well as a person’s individual assumptions. In a normative
perspective, decision-making deals with the logics and rationality of the outcome
related to the individual or collective choice made.
In another sense, decision-making may be regarded as the result of problem-solving
processes, which ends in an assumed rational choice (Kahneman, 2003; Kahneman,
53
2012). In most specialist or science-based professions, decisions are commonly
made, continuously or at points or gates in the development of a specific product or
service. In the pharmaceutical industry, decision-making involves making judgments
on specific scientific data sets on the development of a novel molecule or
pharmaceutical in order to take appropriate actions in respect to company objectives
(Pritchard et al., 2003).
By its very nature, drug development has many inherent risks and effective decision-
making is required to successfully deliver new medicines. In the drug development
arena, decisions commonly have to be made based on insufficient data, a high degree
of uncertainty, time pressure, significant economical stakes, and often in a
competitive environment where several stakeholders are competing to be first on the
market with their specific drug candidate (Pritchard et al., 2003; Chung-Stein, 2011).
(Pritchard et al., 2003, Chung-Stein, 2011). Other potential factors such as the nature
of the sponsor organisation and target patient characteristics of the treatment
indication add increasing variability to the outcome such that different decision-
makers could make different decisions faced with the same set of criteria
(Kostopoulou and Wildman, 2004).
Investigation into the decision-making approaches of individuals and organisations
involved in medicines research and delivery may provide useful insights into how
both the person and the company make decisions. This enhanced understanding may
facilitate a clearer understanding of decision-making approaches and this in-turn may
help to identify or enable better decision-making practices for both the individual and
the organisation. A structured systematic research study may help reveal
determinants of the decision-making process as well as providing research
participants with a structured reflection on their own decision-making style and
approach. This enhanced understanding may also help them to improve their future
decisions.
At a fundamental level, there are four basic decision-making styles: subjective,
objective, analytical and non-analytical, with numerous academic sub-styles such as
directive, analytical, conceptual and behavioural (John and Benet-Martinez, 2000a;
Kahneman, 2012). Linked to these styles, numerous qualitative, semi-quantitative
54
and quantitative decision approaches have evolved such as the PROACT-URL and
Multi-Criteria Decision Analysis (Guo et al., 2010b; EMA, 2013a; Leong et al.,
2013). Frameworks are recognised as being helpful in decision-making and several
are being developed on an ongoing basis.
The overall aims of this study were to develop a generic questionnaire instrument to
assess and enable higher quality decision-making. The research question being,
“could the development and availability of a decision-making instrument, enrich the
quality of decision-making by individuals and organisation stakeholders from the
medicines development arena”. The aim of this initial qualitative component of the
research was to investigate fundamental considerations as to how individuals and
organisations working in the drug delivery arena manage decision-making.
METHODS Research Design and Methodological Framework
The overall research was exploratory and descriptive in nature. Since there are no
well-established theoretical frameworks for determining the “quality of decision-
making” and as limited research has been conducted on the component factors, an
inductive approach exploring the research question was followed. The initial
qualitative stage involved the conduct of semi-structured interviews. Thematic
analyses of the output from the interviews delivered in-depth insight into decision-
making themes and considerations. The research consisted of the quantification and
analysis of decision-making outputs. The content analysis performed, provided a
systematic way of identifying and organising relevant data into meaningful
information on decision-making.
Conceptual Model and Hypothesis
A conceptual framework is used in research to outline possible courses of action or
to present a preferred approach to an idea or thought. Conceptual frameworks
(theoretical frameworks) are a type of intermediate theory that attempt to connect to
all aspects of enquiry (e.g. problem definition, purpose, literature review,
55
methodology, data collection and analysis). Conceptual frameworks can act like
maps that give coherence to empirical enquiry. It is hoped that such a thematic map
could be generated for decision-making domains as part of this qualitative research.
Thematic maps can also ease the tension between human judgement and statistical
analysis in qualitative research (Trochim, 1989; Attridge-Stirling, 2001).
The conceptual framework presented in this research is that the quality of decision-
making could be enriched by the use of a generic decision-making instrument. This
would initially involve an exploration of the decision-making approaches of senior
decision-makers and the regulatory agencies or organisations in which they are
employed. This exploration may lead to a better understanding of how these
individuals and their organisations manage decision-making. In turn, this
understanding could facilitate the development of an appropriate generic
questionnaire for use in decision-making considerations of individuals and
organisations.
The origin of the conceptual framework was an appreciation of the lack of research
performed to date investigating the quality of decision-making of stakeholders
involved in the research, development and delivery of new medicines. An expert
panel met and identified six decision-making items based on value judgments, to be
researched in the study. The six items formed the basis of the initial interviews and
in-turn the construction of the generic instrument. These six items were:
• General understanding or perception of decision-making
• Decision-making within the drug development arena
• Decision-making within the regulatory review
• Decision-making within their organisation
• Awareness and use of decision-making techniques
• Impact and monitoring of decisions.
The underpinning principles of the conceptual framework were as follows:
• Identification of the decision-making themes relevant to the research
question
56
• Improvement in the quality of regulatory submissions and reviews by
improving the decision-making approach and techniques employed within the
drug development process and regulatory review
• A final research output being the delivery of an instrument to people working
within the pharmaceutical arena and regulatory agencies. The instrument could
be used by them as a convenient tool with inherent generalisable properties to
monitor and improve quality decision-making in routine and challenging
decision-making situations.
Choice of Sample and Design of Interview Checklist
The initial operational phase of the qualitative research involved the conduct of semi-
structured interviews with experienced decision-makers employed within the
pharmaceutical arena and regulatory agencies. The participants were appropriate as it
reflected a sub-set of the intended target population (pharmaceutical industry and
regulators) to be further investigated in a follow-on research study. The criteria
adopted for recruitment of the study were:
• Individuals employed in a senior position of authority within a regulatory
agency or pharmaceutical industry organisation
• Having more than five years experience in a managerial role
• Located in either the EU or USA
• English language speaker
• Willingness and availability to participate in a 45 – 90 minute interview.
A six-item checklist detailed previously was designed for semi-structured interviews.
Content validation was performed on the developmental instrument by an expert
panel (Denzin and Lincoln, 2005; Hayes et al., 1995). The content validation
exercise ensured that the construction and format of the questionnaire allowed
information relevant to the purposes of the study and the target population to be
obtained with appropriate reliability and validity. The language, redundancy,
formulated questions, terminology, format and layout of the questionnaire were
reviewed and agreed by the expert panel. It adhered to appropriate best approach
recommendations (Patrick et al., 2011a; Patrick et al., 2011b).
57
In advance of all interviews, a copy of the research study outline was sent by e-mail
to each of the prospective interviewees. This research outline provided details on the
background, objectives, methodology, voluntary consent, anonymity and
confidentiality assurance, estimated time needed for the conduct of the interviews,
the time-window during which interviews were planned, data collection and the next
steps in the overall research. Mention was included that the results of the overall
research investigation would be made available to the interviewees in due course. A
copy of the research outline given to participants is provided in Appendix I.
Data Collection
Each interview was audio-recorded and in-turn transcribed verbatim into Word
format within 1-week of the conduct of the face-to-face interview whenever possible.
The transcription of the individual interviews from the audio-recording to Word
format took eight hours on average per interview script. Thematic coding on each
transcript was performed using the NVivo8 relational database (Bazeley, 2007) and
by manual review and coding.
Computer Assisted Coding of The Interview Transcripts
The proprietary relational database NVivo8 was used in the computerised coding
exercise (Bazeley, 2007). NVivo8 software and functionality allowed for the
interview transcripts to be analysed and for the identification and quantification of
emergent decision-making themes and sub-themes. The functionality of NVivo8
automatically facilitated the following: coding of similar themes (thematic coding),
identification of a thematic framework, indexing of the emergent themes and
subthemes and grouping of the themes under category headings, comparison and
quantification (frequencies) of emergent data to be generated. This automated coding
approach was complimentary to the manual coding also performed on the transcripts.
Manual Review and Coding of The Transcripts
Each interview transcript was carefully read, reviewed and manually coded for
emergent decision-making themes and sub-themes. This involved a line by line
review of the transcripts and identification of the decision-making themes. Particular
quotations from the interviewees were noted. The time to manually code the
transcripts took on average three hours per interview script. A standard manual
58
coding approach was followed comprising of five steps (Ritchie, 1994);
familiarisation, identifying a thematic framework, indexing, grouping, mapping and
interpretation.
Overall, all the information obtained by the interview techniques described was
qualitatively coded into themes and sub-themes and quantified in the form of
numbers and percentages for ease of interpretation.
RESULTS The interviewees who participated were all at a managerial or senior executive level
within their respective organisations. The interview checklist captured socio-
demographic details of the interviewees such as; their name, their job role, the
organisation in which they are employed and the number of years of experience they
have within pharmaceutical development or within regulatory agencies. The
interviewees were from European Medicines Agency (EMA), Medicines Human
Regulatory Agency (MHRA), Irish Medicines Board (IMB), EU and US
Pharmaceutical companies and US Contract Research Organisations. A summary of
the demographics of the study participants is presented in Table 3.1.
Table 3.1: Socio-Demographics of study participants Organisation, number of participants and gender
Job Title Range Years of Experience
Regulatory Agency
(n = 9, 6M/3F)
Group Head – Head of Agency 9 – >35 years
Pharmaceutical Company
(n=10, 5M/5F)
Manager – Global Function
Head
8 - >35 years
CRO (n=10, 5M/5F)
Manager – Global Function
Head
7 - >30 years
59
The objectives of the conceptual framework are to explore the ways in which
individuals (decision-makers) and different organisations manage decision-making.
The conceptual framework and methodology used in this qualitative research are
outlined in Figure 3.1.
Figure 3.1: Qualitative development of a generic decision-making tool
60
Conduct of Semi-Structured Interviews
A total of 29 semi-structured interviews were conducted investigating the decision-
making approaches and considerations of the study participants and their
organisations. The semi-structured interviews were conducted between September
2011 and January 2012. The interviews on average lasted around 50 minutes.
In the qualitative interviews, the emergent theme saturation level was achieved after
completion of 29 interviews. No additional decision-making themes were seen to
emerge from the 27th, 28th or 29th interview performed and the 29th was the final
interview conducted. Analyses of the decision-making themes and sub-themes evident
in the interview transcripts were performed using NVivo8 and its automated thematic
coding functionality. Manual review and subjective evaluation of apparent themes and
associated coding of these emergent items were also performed. The NVivo8
automated coding and the manual evaluations of the transcripts from the interviews
with the senior regulatory and industry key opinion leaders provided quantified
outputs and valuable insights into the decision-making approaches of the study
participants and that of their organisation.
NVivo8 Relational Database Thematic Coding
NVivo8 thematic output provided details of emergent decision-making themes and
sub-themes from the transcripts data set. Information on the prevalence of what was
cited (number of times referenced in the data-set themes and sub-themes) and also by
how many of the 29 person participants was recorded (Table 3.2). Here, the number of
citations made by an individual included those relating to one or more of the sub-
themes. This results in the total number of citations not being the same as the sum-
total of all sub-theme citations due to the possibility of overlapping of citations in a
case where a person made more than one reference to that theme/sub-theme.
61
Table 3.2: Emergent themes and sub-themes from the NVivo8 analysis Theme Sub-Theme Citations* Individuals**
1.Analytical Analytical Tools SOP’s Templates - Stepwise Procedures
31(Total) 20 23
19 (Total) 13 14
2. Benefit Risk Critical Understanding of issue or decision Mitigation approach Qualitative approach Quantitative approach Structured approach
52 (Total) 10 2 11 20 19
13 (Total) 6 2 7 9 7
3. Champions Champion as Project leader
19 (Total) 19
17 (Total) 17
4. Consensus Consensus is the normal goal targeted Cultural considerations with consensus approach. Weaknesses related with trying to reach consensus
41(Total) 29 3
12
24(Total) 22 3
7
5. Critical nature of the decision
Clear understanding of the impact of the decision Effective communication and comprehension
10 (Total) 9
1
7 (Total) 7
1
6. Culture Autocratic Disciplined governance Global Culture Hierarchical Innovative & ability to challenge & recommendations Portfolio therapeutic specialisation Traditional conservative
54 (Total) 8 13 10 23 1
1 8
25 (Total) 5 9 7
12 1
1 6
7. Decision-making Analytical in approach Defined relationships Objective approach Structured approach to decision-making Subjective approach
43 (Total) 7 5 9
23 14
10 (Total) 7 3 7
10 6
8. Drug development portfolio & differentiation
Understanding of drug development Understanding of portfolio management
26 (Total) 25
19
21 (Total) 21 12
*The number of items listed in the dataset **Number of interviewees who mentioned a specific theme or sub-theme
62
Table 3.2: Emergent themes and sub-themes from the NVivo8 analysis cont’
Theme Sub-Theme Citations Individuals
9. Engagement Engagement linked to understand of task Stakeholders
24 (Total) 10 14
19 (Total) 7
13
10. Experience A person’s inexperience & associated risk Talent, track record & professional experience
23 (Total) 3
22
14 (Total) 2
14 11. Enhancements
Decision Criteria Extrinsic factors e.g. patient choice Impact analysis Qualification of the decision makers Qualitative approach Quantitative approach Structured approach Successful communication & clarity of language Training & awareness Understanding of critical nature of issue
49 (Total) 1 8 5 2 2 7 7 6
1 8
13 (Total) 1 7 5 2 2 4 5 4
1 5
12. Facilitators Facilitators are not used in the organisation
26 (Total) 12
25 (Total) 12
13. Facilitators are used on rare or exceptional occasions
External facilitators are used Internal facilitators are used
5 (Total) 1 4
5 (Total) 1 4
14. Facilitators are used routinely in the organisation
External facilitators are used Internal facilitators are used
3 (Total) 0 0
3 (Total) 0 0
15. Framework
Framework templates
Structures approach to decision-making
15 (Total)
9
11
7 (Total)
5
5 16. Human factors and considerations
Experience and maturity of decision-making
Gut feeling intuition
43 (Total)
5
39
29 (Total)
5
28 17. Individual
Human or personal factors
Preferred approach
25 (Total)
16
13
10 (Total)
5
5
18. Mechanisms and procedures
Standard mechanisms or procedures
30 (Total)
30
8 (Total)
8
*The number of items listed in the dataset **Number of interviewees who mentioned a specific theme or sub-theme
63
Table 3.2: Emergent themes and sub-themes from the NVivo8 analysis cont’
Theme Sub-Theme Citations Individuals
19. Metrics and
benchmarks
Benchmarking is not used
Benchmarking is used
33 (Total)
2
33
25 (Total)
2
23
20. Milestones
Milestones employed in the decision-
making
Milestones not used
12 (Total)
12
1
7 (Total)
7
1
21. Poor quality
decisions
Bad decisions experienced
Escalation of commitment
25 (Total)
1
25
22 (Total)
1
22
22. Quality
Lack of quality
Quality enhancements
Quality factors
24 (Total)
0
9
16
7 (Total)
0
5
5
23. Review or impact
analysis
Retrospective impact analysis and lessons
Review steps or time-outs employed
Review steps during a decision-making
task
15 (Total)
10
6
6
9 (Total)
7
3
3
24. Situation
Differing situations require different
approaches
29 (Total)
28
14 (Total)
14
25. Strategy
Appreciation of preferred outcome
Organisation strategy
22 (Total)
1
22
14 (Total)
1
14
26. Subjective
Approach to the decision-making
Human factors & considerations
43 (Total)
37
17
17 (Total)
14
8
27. Team or group
Advantages of team based decision-
making
Decision made on team basis
Disadvantages of team based decisions
116 (Total)
29
70
17
27 (Total)
20
26
15
*The number of items listed in the dataset **Number of interviewees who mentioned a specific theme or sub-theme
64
Table 3.2: Emergent themes and sub-themes from the NVivo8 analysis cont’
Theme Sub-Theme Citations Individuals
28. Process
Standard approach or process not
employed
Standard processes
45 (Total)
0
45
23 (Total)
0
23
29. Tools
Awareness
Unawareness
Usage of tools
Usage of tools in decision-making
53 (Total)
5
35
5
4
20 (Total)
5
11
4
4
30. Training
No training received
Perceived benefit of training
Training received
47 (Total)
53
11
2
24 (Total)
24
9
1
31. Understanding
Background & task
Science or issue in question
Understanding of expectations
28 (Total)
10
7
12
13 (Total)
8
6
7
32. Influences
Competitors
Human nature
Incentives rewards penalties
Money /costs /politics
Origin of project
Patients expediting delivery of medicines
People & talent
Precedents
Regulatory & legal
Stakeholder motivation
Strategic fit
Timelines
69 (Total)
1
1
14
18
15
4
4
14
11
20
8
2
20 (Total)
1
1
6
11
6
4
3
7
6
17
6
2 .
*The number of items listed in the dataset **Number of interviewees who mentioned a specific theme or sub-theme
The NVivo8 decision-making thematic analyses provided data for both the individual
interviewees and for 29 person study participants. An illustrative example of the
NVivo8 output for an individual from the study is provided in Figure 3.2.
65
Figure 3.2: Example NVivo8 data output for an individual interviewee
2
8 8
7
5 5
4
3 3 3 3
2 2 2 2 2 2 2 2 2 2
0
1
2
3
4
5
6
7
8
9
Sub
ject
ive
Ben
efit
Ris
k
Enh
ance
men
ts
Tool
s
Team
or
Gro
up
Dec
isio
n m
akin
g
Pro
cess
Rev
iew
or
Impa
ct A
naly
sis
Trai
ning
Eng
agem
ent
Influ
ence
s
Info
rmat
ion
Cul
ture
Cha
mpi
ons
Indi
vidu
al
Und
erst
andi
ng
Crt
itica
l nat
ure
of
Qua
lific
atio
n to
mak
e
Situ
atio
n
Met
rics
and
Ben
chm
arki
ng
Num
ber
of C
odin
g re
fere
nces
Node/Theme
Transcript – Coding by Node/Theme
Automated NVivo8 and Manual Review and Evaluation of The Interview
Transcripts
The automated thematic coding resulted in the identification of 32 emergent
decision-making themes and more than 90 sub-themes from the interview transcripts.
A manual content analysis and subject evaluation of the interview transcripts was
also performed and this produced a complimentary list of decision-making themes
from the study participants transcripts.
Validation of The NVivo Output
The validation of the NVivo output i.e. consolidation of the 32 themes and sub-
themes and manual content analysis of the interview transcripts, resulted in the
identification and emergence of 19 overarching decision-making themes. The manual
review and coding approach was performed as detailed (in Chapter 2) i.e.
familiarisation, thematic framework identification, indexing and grouping of the
decision-making themes. Following the familiarisation and complete immersion into
66
the transcribed narrative outputs from the interviews, 32 themes were identified and
further consolidated into the following 19 overarching themes given below:
1. Quality and validity of data
2. Time considerations
3. Organisational, hierarchical and cultural influences
4. Analytical and logical approach
5. Qualification and experience in previous decision-making
6. Subjective and personal considerations
7. Political, financial, competitor and reward influences
8. Precedents for similar previous decisions
9. Perpetuating previous decision-making mistakes
10. Plunging in or procrastination with decision-making
11. Clear understanding or lack of understanding of the decision in question
12. Overconfidence in own judgement
13. Group successes and group failures
14. SWOT and alternate outcome planning in decision-making
15. Impact analyses of decisions
16. Decision-making audit trail
17. Education and awareness of evolving decision-making techniques
18. Individual versus Corporate decision-making
19. Quantitative frameworks.
An illustration of the relationship between these 19 decision-making themes and the
themes and sub-themes identified in Table 3.2 is as follows: ‘Clear understanding or
lack of understanding of the decision in question (Number 11 from list above) with
Table 3.2 “Critical nature of the decision” (item 5) and “Critical understanding of
issue or decision” (Subtheme of item 2), “Understanding of critical nature of issue”
(Sub-theme of item 11).
The approach adopted by which the sub-themes were grouped into themes for each
of the resultant 19 decision-making domains is expanded below accompanied by
relevant supportive example verbatim quotes from the study participants.
67
Quality and Validity of Data
The expectation and need for good quality, reliable data on which a person can make
a decision was raised in the majority of interviews. This theme encompassed items
such as reliability and validity of the source data and trustworthiness of the
information provided on which to base a decision. The need for valid and ideally
high quality data of suitable integrity was evident. The theme of what constitutes a
“quality” decision and the challenge with defining quality in this context was also
apparent.
“Valid data is a fundamental requirement for good decision-making”....Regulatory
Agency
“You need to be able to trust the data you are being asked to review and upon which
you are being asked to make a decision”.......Pharmaceutical Company
Time Considerations
The reality of having to make timely or real-time decisions was raised in several
interviews as was the need to adhere to “review timelines”. The Regulatory Agency
personnel also specifically advised that there is an obligation for them to work to
defined review timeframes. In addition, Regulatory Agency personnel also advised
that on occasion, they need to make fast decisions. Items which have a spontaneous
safety concern, need quick action and timely/quick decision-making. The sub-theme
of workload and time sacrifice/time allocation for making decisions was raised. The
challenge of needing to be able to “multi-task” on several projects was raised. This
multi-tasking impacts the time allowance or tolerance that can be allocated to
individual decision-making exercises.
“We have a public health remit and there are times when we need to make a decision
in a rapid manner. Sometimes we do not have all the background information
available but still we need to make that decision”.........Regulatory Agency
Organisational, Hierarchical and Cultural Influences
Several themes emerged relating to the philosophy and organisational approach to
decision-making. Items such as cultural influences, in particular in the larger
68
organisations were raised. The use of scientific committees was mentioned by all the
regulatory agency interviewees. From an industry perspective, the formal
requirement for decision-making to be escalated upwards to the appropriate
management executive empowered with the actual decision-making was apparent.
“In larger companies, you have more stakeholders in place and therefore it is
important to know the decision-making approach because there is likely to be more
of a commonality of opinions. Political astuteness is also vital in a large Pharma
organisation”...........Pharmaceutical Company
Analytical and Logical approach
The use of frameworks to assist with the decision-making process and the use of
analytical and step-wise decision-making approaches were apparent. The potential
that such approaches may add transparency to the decision-making process was
raised.
“A quantitative assessment and analytical procedures will improve transparency in
decision-making”…..Regulatory Agency
“A general best-practice framework for decision-making within the drug
development arena or in the regulatory review would comprise an awareness of the
implications of decision-making and the need to approach decision-making in a
logical manner”....Pharmaceutical Company
Qualification and Experience in Previous Decision-Making
Bias based on a person’s previous experience in decision-making was apparent. It
was clearly evident that past experience in the decision-making arena and exposure
to similar challenges in the past are important factors for both individuals and
organisations. In addition, the theme of qualification of the decision-maker to make
those decisions (scientific, strategic, benefit/risk...etc.) was raised. The academic
qualifications complimented by practical “on the job” experience were cited as being
important. The theme of “intuition” and “gut-feeling” also overlapped with the theme
of Qualification. It was apparent that this intuition/gut-feeling appears to also
develop with a senior decision-makers’ increasing experience. This intuition/gut-
69
feeling theme was captured under the “overconfidence” theme discussed later on in
this section.
”What makes one person out to be a good decision-maker? What qualifies that
person to make decisions? Is it scientific or professional training? How much does a
person require, in order for that person to make better decisions? It is a subjective
matter and worth investigating”.....Pharmaceutical Company
Subjective and Personal Considerations
Personal preferences relating to the subjective interpretation of the decision-making
task in question and the personality of the decision-maker were apparent. The
individual human element of a person’s beliefs, the values important to that person
and their preferred approach to decisions were evident.
“I like to review all the available background information before starting on the
decision-making exercise”..........Pharmaceutical Company
Political, Financial, Competitor and Reward Influences
Internal and external factors that impact on decision-making were evident. Items
were apparent which were considered somewhat outside of the control of the
decision-maker but which did impact the decision-making. Considerations such as
go/no–go decisions based on financial sales predictions, return on investment (RoI)
and continuation of a project because of some internal or external political
considerations were raised. The concept of “reward” for achieving milestones and
the impact this has on decision-making emerged from the industry but not from the
agency representatives.
“A lot of go/no-go decisions are based on political reasons. We do not always like to
say this is the case but in reality it is”..........Pharmaceutical Company
“Everyone monitors the competition in drug development”........Pharmaceutical
Company
70
Precedents for Similar Previous Decisions
Previous precedent emerged as a decision-making theme. Precedents in terms of
traditional drug development or drug-class considerations were apparent from the
perspective of both the agency and industry personnel. In addition, the need and
desire for consistency was evident in regard to drug approvals.
“Previous approvals in that therapy area are always reviewed during our
assessment”........Regulatory Agency
“We have a standard proven approach to internal decision-making. This is what we
follow”......Pharmaceutical Agency
Perpetuating Previous Decision-Making Mistakes
Repeated mistakes or lack of learning from previous experience, or not applying
“lessons learned” were apparent. The challenge of following a previous unsuccessful
course of action which has a high probability of a negative outcome was evident.
“We are all guilty of this but at least we recognise our errors” ..........Pharmaceutical
Company
Plunging-in or Procrastination with Decision-Making
The impact of procrastination and the inability of a person to make a decision at a
suitable time were apparent. The potential for information or data “overload” relating
to a decision which could result in a decision not being made, or being postponed or
leading to a request for even more information was evident. The polar theme, where
a person may make a snap-decision without having suitable salient facts was raised.
The “plunging-in” was also linked with the potential theme of self over-confidence
relating to the perspective of both the individual and the organisation.
“The good assessor will make a regulatory decision and make a good
recommendation, the poor assessor will sit on the fence and write a report and say it
is up to the advisory committee”.....Regulatory Agency
“Paralysis by analysis is resulting in the death of creativity”.........Pharmaceutical
Company
71
Clear Understanding or Lack of Understanding of the Decision in Question
The need to clearly understand the context of the decision that one is being asked to
make was apparent. The use of appropriate language and instruction in
communicating what a decision-maker is being asked to do was evident.
“People need to understand what they are being asked to do and also the factors
involved in the decision that they are being asked to make”.....Pharmaceutical
Company
Over-Confidence in Own Judgement
Several themes relating to both over-confidence and use of “intuition / gut-feeling”
emerged. Over-confidence and use of intuition were not seen in a negative context
but merely one that needs to be appreciated, managed and balanced.
“Intuition and gut-feeling have a place but it is often an educated gut-feeling and
educated intuition in decision-making. It is not something that you are born with. It
comes about with the experience of the job environment over 10, 20, 30 years”...
...Pharmaceutical Company
“We might say that decision-making is all science and that it is all quantitative and it
is all black and white, it is not. The very sophisticated blend of intuition or gut-
feeling comes into good decision-making practice as well”......Regulatory Agency
Group Successes and Group Failures
The use of teams or groups for several aspects of decision-making was apparent. The
use of scientific advice committees by regulatory agencies, internal steering
committees and executive committees emerged. In addition, the pros and cons of
aiming for consensus approach on important decisions were raised. The theme of
using tools such as “facilitators” and decision-conferencing to facilitate decision-
making emerged. The dynamics of a group decision-making approach and the
challenge to terminate such a decision-making exercise being conducted by a group
was also apparent.
72
“Project teams can be very possessive and defensive of their baby (project) which
can make it a very challenging situation when tough decisions need to be made on
the continued viability of the project”....... Pharmaceutical Company
“Sometimes you are better just to go with a more extreme decision rather than a
compromise one, and this will mean that some people may be unhappy. I am not
sure that aiming to reach consensus always is a good thing or always results in the
best decision.......Regulatory Agency
SWOT Analyses and Alternate Outcome Planning in Decision-Making
The use of identifying the strengths, weaknesses, opportunities and threats, within
the decision-making framework emerged from the study. The need to identify the
pros, cons and the options relating to a decision and to have contingency
considerations in place for a decision outcome were apparent.
“We routinely use SWOTs, they are what we used during our restructuring
exercise”.........Regulatory Agency
“You always need a back-up plan, SWOTs and contingency planning should always
be part of decision-making”.........Pharmaceutical Company
Impact Analyses of Decisions
The value in identifying good decision practices adopted as well as bad decision
practices was apparent. The need and value of reviewing and examining the impact
of decision-making outcomes is also important. With hindsight, could or should a
different approach have been adopted for a particular task?
“It is important that organisations look back at the decisions they made 10 years ago
and review whether in hindsight, these were good or bad decisions”...Pharmaceutical
Company
“We should all take time to perform impact analyses and try to learn from the good
and the bad”........Regulatory Agency
73
Decision-Making Audit Trail
The value of maintaining an audit trail for important decisions was apparent. The
step-wise path of the decision exercise undertaken relating not only to major Go/No-
Go decisions but also those decisions which may need to be reviewed or examined at
a later date emerged. Transparency in the process and the potential for better
predictability in future judgments were linked to having a record / audit trail of
previous successes.
“Transparency, the justification for decisions, and understanding why a decision has
been made need to be documented, it is good practice”.......Regulatory Agency
Education and Awareness of Evolving Decision-Making Techniques
The value and benefit of receiving training in the science of decision-making and
also on the tools and techniques that are currently available to facilitate decision-
making were identified.
“It is important that we are trained in decision-making. We also need understanding
and practical application of the tools which can assist our decision-making. So, I
think it should be part of people’s ongoing professional training”.....Pharmaceutical
Company
“Modelling and simulation is becoming ever more the norm in drug development.
One of the challenges we have, is in keeping pace with advancements in drug
development and the models employed in decision-analysis”.........Regulatory
Agency
Individual Versus Corporate Decision-Making
The different decision-making approaches of the individual compared with that of
the organisation were apparent. The challenge with understanding how the individual
and the organisation reach their decisions was evident.
“There is a difference between the corporate decision-making process and that of the
individual. For example, we have a good understanding of how a committee makes a
74
decision but we do not necessarily understand how individuals on that committee
have made their own position or decision”........Regulatory Agency
“We need to have a better understanding on how an individual reaches their own
conclusion this is particularly important in regard to benefit-risk decision-
making”......Regulatory Agency
Quantitative Frameworks
The value of assigning weightings (relative importance) to the decision-making
exercise in situations such as benefit-risk assessments and the transparency that such
a quantitative weighting process could bring to a decision was evident.
“The concept of weighting is a nice framework for benefit-risk decision-
making”.....Regulatory Agency
“I am a firm believer in quantitative assessment to improve transparency in
decision-making…....Regulatory Agency
Thematic Map
A secondary objective of the qualitative investigation was to generate a thematic map
of the decision-making themes that emerged from the study. Thematic networks are
web-like illustrations that summarise the main themes constituting a piece of
research. The thematic mapping network technique is a robust and sensitive tool for
the systematisation and presentation of qualitative analyses (Trochim, 1989,
Attridge-Stirling, 2001, Braun and Clarke, 2006). In instrument development, maps
can help with structural conceptualisation to articulate the expected relationships
between constructs that are being measured and are a tool for defining the conceptual
domains (Marquart, 1989; Davis, 1989). The thematic map generated from the study
is presented in Figure 3.3.
75
Figure 3.3: Thematic map of decision-making themes from the qualitative research
Decision-Making Results from the Perspective of The Individual and The
Organisation
In addition to the composite results obtained for the 29 participants, unique results for
each individual participant were also generated in the NVivo8 system. However, it
should be noted that assurance was provided to the interviewees that confidentiality
would be respected and that results which could identify an individual or their
organisation would not be presented. Therefore, limited presentation of source
76
individual interviewee results are provided in this thesis. The individual commentary
in the form of the verbatim quotes from individuals’ interview transcripts is intended
to provide valuable insights into the perspective of the individuals who volunteered to
participate in this research.
The consolidated output of the qualitative research comprised the identification of
almost 100 themes and sub-themes relating to decision-making approaches. This
combination of the automated and manual subjective thematic coding results was used
to form the basis for the decision-making instrument which would be subjected to
further development and validation. A total of 94 items were agreed for inclusion in
the first version of the instrument. The further development and validation of the
instrument is reported in Chapters 4 – 6. A copy of the 94-item checklist including the
rating scale used on each items is presented in Appendix III.
DISCUSSION The goal of this qualitative research study was to investigate and gain insight into the
decision-making approaches used by the Pharmaceutical Industry and Regulatory
Agency decision-makers, in their professional work. This goal was successfully
achieved. In addition, the identification and application of the decision-making themes
which emerged from the research should enable the generation of a generic
developmental decision-making instrument.
The qualitative research approach involved the conduct of semi-structured interviews
with a variety of key opinion leaders from the EMA, national European regulatory
agencies and international pharmaceutical industry. These interviews generated
valuable insights into the decision-making approaches both from the perspective of the
individual and their organisation. The interviewees were engaged and supportive of
the study and were accommodating with their time-sacrifice and flexibility to
participate in the interviews. The beneficial and advantageous approach of face-to-face
interviews is well documented and this was the case also in this study (Holstein,
2001). It is also noteworthy, that the interviews allowed for respect, understanding,
rapport and relationship-building to develop between the interviewee and the
researcher performing the interviews.
77
The complimentary combination of the NVivo8 and the manual thematic coding
helped to detail a wide-spectrum of decision-making components and emergent
themes from the study. It was evident that this coding process did not deliver the same
amount of subjectivity as generated by the manual review of the interview transcripts.
However, the combination of both the automated computerised NVivo8 system and
the subjective manual evaluation of the interview transcripts did ensure that all
decision-making themes contained within the interviews were explored. Almost 100
decision-making themes and sub-themes were apparent from the data analyses. This
allowed for the generation of a 94-item developmental version of the instrument which
will form the basis for a larger sample-size and more powerful research investigation
into the decision-making approaches of individuals and their organisations.
Of particular note, some of the decision-making themes that emerged from the
interviews may be somewhat surprising bearing in mind that most of the study
participants worked in a highly regulated working environment where regulations,
directives, SOPs and other guidance documents are the norm. Some particularly
important themes and decision-making aspirations received from the study participants
are detailed below:
The desire for enhanced transparency, consistency and predictability within the
decision-making approaches used by individuals, committees and organisations
overall.
The use of intuition or “gut-feeling” in the decision-making process of individuals
even though they are working in an evidenced based and systematic drug development
environment. This intuition was seen as a positive attribute which matures and appears
to become more beneficial and accurate, the longer the individual has been working in
his or her profession. Linked with intuition was the assertion that for many
individuals, the more experience gained in their professions, the higher the quality of
their decision-making and the easier the decision-making process is for them. The
experienced professional is less likely to procrastinate over a decision and appears to
have a greater appreciation of the consequences of the decision-making process that
they are being asked to make. An area of contention linked with experience was that
78
of, “what qualifies an individual to be a good decision-maker in a given situation?”
Academic, clinical or professional qualifications linked with the subjective personality
and astuteness of the individual emerged as important facets for being a “good
decision-maker”.
The recognition of the value of training in the science of decision-making and a
greater understanding and appreciation of the tools available to support decision-
making was echoed by many of the study participants. Simple tools such as SWOTs
and decision-trees were routinely used by some people, while some other participants
advised they never employ such techniques. There appears to be a lack of training
offered within the profession (Agency and Industry) but it was the belief of many that
they and their organisation would benefit from such training.
Ensuring an understanding of the decision-context, determining the internal and
external influences which might be relevant to the decision being asked, awareness of
one’s own personal decision-making preferences, appreciation of previous similar and
most importantly, the validity and integrity of the information that one is being asked
on which to base the decision were key items that emerged from the interviews.
Other items such as re-evaluating as new information becomes available, reviewing
the impact of decisions made and applying “lessons learned” to new projects and
decisions were thought to be beneficial. The pros and cons of group decision-making
and seeking a consensus approach were raised along with the potential value of
assigning quantitative weightings within a step-wise decision-making approach while
at the same time, ensuring that there is a audit record trail maintained of each decision-
step.
The simple thematic map generated captured the decision-making themes that
emerged from the qualitative research. It is appreciated that thematic mapping can
help to ease tension between quantitative and qualitative measurements by combining
statistical analysis and human judgements. The main strength that mapping offers in
the validity exercise of an instrument is that it allows relationships to emerge and these
emergent categories are more data driven than they are in a traditional content
analysis. The thematic map can help in formalising a choice in a syntax/context
79
relationship (Jackson and Trochim, 2002). The generated thematic map can also
contribute to the construct validation of the developmental instrument. Construct
validity refers to how operationalisations in research reflect the theoretical constructs
they are supposed to reflect. In determining if there is construct validity, researchers
should have an idea of the interrelationships among constructs (Jackson and Trochim,
2002).
The decision-making themes discussed in this chapter were not the conclusive list of
considerations which were volunteered by individuals during the qualitative research.
However, the items raised by the study participants did provide supportive justification
and validation of the research being performed. This study has demonstrated that the
area of decision-making in the medicinal product development and life cycle is under-
researched. The potential benefits of improved decision-making within both the drug
development arena including the regulatory review would benefit all concerned
stakeholders. Improved and better quality decision-making could be expected to
expedite the delivery of new medicines. These improvements could be initiated by
individuals and organisations, having a better fundamental understanding of the
principles and themes of decision-making.
Overall, this study has achieved its aim of exploring decision-making from the
perspective of the individual and the organisation working in the drug development
arena. The detailed content analysis in the research produced vital information for the
development of a novel concept for a decision-making instrument. Decision-making
themes and considerations have emerged which can be incorporated into a generic 94-
item decision-making checklist which will undergo further content validation, field
testing and refinement. The supportive engagement of the participants involved in this
study is also positive endorsement of the value of this research.
80
SUMMARY • This chapter provided information about how data was collected for the
conceptualisation and development of a decision-making tool
• Twenty-nine interviews were conducted with senior decision-makers from
regulatory agencies and the pharmaceutical industry to investigate how they
manage decision-making at an individual and/or organisational level
• NVivo8 qualitative software was used for managing the large quantity of data
and for content analysis
• Thematic coding of the interview transcripts was performed using NVivo8
and manual content analysis which resulted in an enhanced understanding and
appreciation of the decision-making considerations and identified thirty-two
themes from the perspective of the of individual and their organisation
• The emergent decision-making themes and commentaries volunteered by the
study participants provided evidence of the need for a more systematic
approach to decision-making within the regulatory and pharmaceutical
environment
• Positive endorsement of the study was received from the study participants
which provided further impetus and validity to the continuation of the
development of a generic decision-making instrument
• A 94-item decision-making theme checklist was generated
82
INTRODUCTION Content validation helps to examine whether the measurement tool possesses the
right emphasis and focus for the concept being measured and the target population.
This evaluates whether a scale has enough items and covers each of the domains
being measured. The items of a new instrument should be relevant and representative
of the target population and/or construct (Streiner and Norman, 2008). Content
validation is a primary validation step which helps to compliment, endorse and
increase the probability of obtaining high construct validation in the development of
an instrument (Denzin and Lincoln, 2005).
The process of establishing content validity of an instrument by using a panel of
experts to determine the suitability of an instrument or questionnaire items is a well
established procedure in instrument development. The opinion and judgement of
experts to modify or remove items from a developmental instrument helps to ensure
the appropriateness of such a tool. The opinion of the experts is also sought to verify
that the scale is appropriate for the intended purposes. (Strauss and Corbin, 1998;
Streiner and Norman, 2008). Haynes et al (1995), defined content validity as: “the
degree to which elements of an assessment instrument are relevant to and
representative of the targeted construct for a particular assessment purpose” (Hayes
et al., 1995). Instrument content validation is a process which may encompass both
“quantitative” and “qualitative” approaches and is a vital part of the overall
instrument validation process. Items should be reviewed and judged by a panel of
experts using an assessment scale covering item relevance, representativeness,
specificity and clarity. The use of these content validation expert panels may help to
eliminate early items which if left in the questionnaire might be “outliers” at a later
stage of analysis and which could contribute to spurious or incorrect study findings
(Hayes et al., 1995).
In this validation exercise, the content validity was evaluated by a complimentary
triangulation of methods to ensure appropriate reliability and validity of the 94-item
developmental version of the decision-making instrument.
83
METHODS The 94-item developmental version of the decision-making instrument was carefully
reviewed for the four attributes of: language clarity, completeness, relevance, and
scaling. These item attributes are well established in the content validation
investigation of new instrument development (Norusis, 1993; Graneheim and
Lundman 2004; Pallant, 2005; Simon et al., 2006; IBM, 2011; Patrick et al., 2011a;
Bhatti et al., 2013b).
The content validity of the 94-item developmental version of the instrument was
carried out in two separate stages, i.e. an initial qualitative stage followed by a
quantitative stage. In the qualitative assessment, the expert panel members were
asked to review and make comment on the developmental version of the instrument.
In the quantitative part, the panel members were asked to complete a formalised
scale to assess each item and the instrument as a whole. The results from the
qualitative and quantitative parts were used to make changes to the 94-item
developmental version to ensure that items were relevant and appropriate to the
decision-making construct.
The 94-item developmental version of the instrument was initially examined for
content validation by a team of six experts. Their task was to review the instrument
and to use their subjective judgement to rate each of the 94-items using a 4-point
Likert scale (strongly agree, agree, disagree and strongly disagree) for its language
clarity, completeness, relevance and scaling (Denzin and Lincoln, 2005; Bougie,
2010; Bhatti et al., 2013b). The experts were encouraged to suggest appropriate
changes as necessary in order to develop an instrument which could accurately
measure what was intended to be measured. The identification, communication and
selection of the independent expert panel were performed in an appropriate manner.
The six member panel “quorum” was in line with best practice reported in the
literature (Lynn, 1986; Polit, 2006).
Part I: Qualitative Assessment
A six member expert panel of experienced and senior decision-makers from the
regulatory agencies and pharmaceutical and CRO industry carried out the content
84
validation. The pharmaceutical (two) and Clinical Research Organisation (two)
panel members were all experienced professionals at advanced managerial level and
all with more than seven years experience (7 – 30 years). The regulatory agency
experts (two) were experienced “Assessors” with more than seven years Regulatory
Agency experience. All of the experts considered themselves experienced and
experts in ‘decision-making’.
Procedure
All of the expert panel members were initially contacted either by a face-to-face
meeting or by telephone to determine their willingness and availability to participate
in the validation exercise. Following their agreement, they were all sent by email,
additional background on the research, a copy of the developmental questionnaire
and instructions on how to complete it (a copy of each is provided in Appendices II
and III).
Each expert member participated in two ways: firstly, by individually completing the
94-item development questionnaire and the rating of each item using a 4-point scale.
Secondly, by participating in an all panel round-table discussion meeting once all six
feedback forms had been analysed.
The rating guidance given for assessing each of the 94-item development
questionnaire using a 4-point scale for its language clarity, completeness, relevance
and scaling is as follows:
Language Clarity: The sentence and wording should be clear, understandable,
straightforward and simple. Completing the questionnaire should not require reading
skills beyond that of a 12-year-old to avoid missing values and unreliable answers.
Completeness: The sentence structure should be complete not broken and should
end properly.
Relevance: Each item should be relevant to the subject area and target population.
85
Scaling: Panel members should rate the scaling system as to whether or not the
response options fit the statements/item on the 4-option scale.
Part II: Quantitative Assessment
In the quantitative stage, the completed questionnaires from each of the six panel
members were transposed from Word format questionnaires into Excel. Excel results
were generated for each individual panel member as well as the composite panel.
The results from these scores were used to generate the relevance scale which was
computed using Content Validity Index (CVI), Scale Content Validity Index (S-
CVI), using Excel. Intraclass correlation coefficients (ICC) and reliability
(Cronbach’s alpha) measurement were determined using SPSS statistical software. It
is appreciated that there are very different opinions in the literature about whether
Kappa measurement versus the ICC technique is better for inter-rater reliability. For
non-quantitative data (categorical/nominal), the kappa coefficient is the techniques
of choice. The ICC is more appropriate and better than the kappa technique for
analysing data obtained from ratings using any scale (e.g.1 to 10) (Bhatti et al.,
2013a; Bhatti et al., 2013b) and it was used for the qualitative phase to measure the
level of agreement (inter-rater reliability) among the panel of judges.
RESULTS The results of the content validity are presented in two parts; quantitative and
qualitative. The quantitative results are those obtained directly on the questionnaire
feedback rating forms. The qualitative results comprise the comments made by
individual panel members and also the outcomes of discussions at the expert panel
meeting. The changes made to the 94-item developmental version of the
questionnaire are discussed taking into account both the quantitative and the
qualitative components.
The completed questionnaire feedback forms with the comments from each expert
panel member were returned in advance of a pre-scheduled expert panel meeting. At
this meeting, a summary of the background and framework of the research project
was outlined for the expert panels in line with good practice (Terwee et al., 2007).
The panel meeting reviewed the composite feedback received from all panel
86
members and following panel discussion, resulted in the reduction/removal of
several items from the 94-item instrument. In addition, some changes were made to
the language of some items. The panel also provided their opinion on the time
sacrifice needed for “time-to-complete” the questionnaire.
Part I: Quantitative Assessment
The results for the quantitative assessment were based on the returned questionnaire
feedback forms (n=6). The results for each of the four rating criteria: language,
clarity, completeness, relevance and scaling were analysed. Each of the six judges
rated the 94 items. The feedback results of each of the six individuals are
summarised in Table 4.1.
Table 4.1: Summary of percentage rating results given by each expert rater Expert
1
Expert
2
Expert
3
Expert
4
Expert
5
Expert
6
Strongly Agree 86% 22.% 57% 50% 32% 74%
Agree 6% 61% 36% 37% 50% 20%
Disagree 6% 14% 7% 13% 17% 5%
Strongly Disagree 2% 3% 0% 0% 1% 1%
Combined
Strongly Agree/Agree
92% 83% 93% 87% 82% 94%
Strongly disagree/disagree 8% 17% 7% 13% 18% 6%
Language Clarity
When the judges were asked whether the items showed good language clarity, there
were 385 ratings (68.3%) for strongly agree, 93 (16.5%) for agree, 68 (12.1%) for
disagree and 14 (2.5%) for strongly disagree. Three (0.5%) were missing (not
completed) and were not included in the analysis. A sum of 85% was obtained for
the “strongly agree/agree” scores suggesting that the expert panel agreed with the
clarity of the language.
Completeness
The rating of the items for completeness revealed that there were 213 ratings (37.8%)
for strongly agree, 259 (45.9%) for agree, 80 (14.2%) for disagree and 8 (1.4%) for
strongly disagree. Four (0.7%) were missing and not included in the analysis. A sum
87
of 84% was obtained for the ”strongly agree/agree” scores suggesting the experts
agreed on the completeness of the scale.
Relevance
When the judges were asked whether the items were relevant, there were 183 ratings
(32.4%) for strongly agree, 292 (51.8%) for agree, 77 (13.6%) for disagree and 7
(1.2%) for strongly disagree. Five (0.9%) were missing and not included in the
analysis. A sum of 84% was obtained for the “strongly agree/agree” scores
suggesting the experts agreed on the relevance of the scale.
Scaling
With regard to scaling, there were 399 ratings (70.7%) for strongly agree, 158 (28%)
for agree, 2 (0.4%) for disagree and 0 (0%) for strongly disagree. Five (0.9 %) were
missing and not included in the analysis. A sum of 99% was obtained for the
”strongly agree/agree” scores suggesting the experts agreed on the scaling of the
scale.
A tabular summary of the judges’ ratings of the 94 items across the four content
validation criteria is presented in Table 4.2
Table 4.2: The judges’ ratings (n=6) of the 94 items across four criteria Judges’ response
option
Language
Clarity
Completeness Relevance Scaling
Strongly agree 385 (68.3%) 213 (37.8%) 183 (32.4%) 399 (70.7%)
Agree 93 (16.5%) 259 (45.9%) 292 (51.8%) 158 (28%)
Disagree 68 (12.1 %) 80 (14.2%) 77 (13. 6%) 2 (0.4%)
Strongly Disagree 14 (2.5%) 8 (1.4%) 7 (1.2%) 0 (0%)
Missing 3 (0.5%) 4 (0.7%) 5 (0. 9%) 5 (0.9%)
Strongly Agree /
Agree
476 (84.8%) 472 (83.7%) 475 (84.2%) 557 (99%)
Strongly
Disagree/Disagree
82 (14.6%) 88 (15.6%) 84 (14.9%) 0 (0.0%)
88
Of the 94-items, the items which had the most number of “Disagree and Strongly
Disagree” ratings emerged from the results and were discussed during the expert
panel meeting. Twenty such items emerged and will be discussed in the next section.
Content Validity Index
In addition to the subjective testing performed on the developmental instrument, the
additional content validation tests of: content validation index (CVI) and the content
validity of the whole scale (S-CVI) were applied to the qualitative data (Polit, 2006).
CVI= Number of items on which expert raters Agreed
Total number of expert raters
The CVI and S-CVI have been used in healthcare research for the determination of
content validity in the development of multi-item scales rated by multiple expert
raters (Polit, 2006). There is a general agreement about the calculation of the CVI. A
panel of content validation experts is asked to rate each scale item in terms of its
relevance to the underlying construct. These items are typically on a four point scale
to avoid having a neutral and ambivalent midpoint although a five or three point
scale may be used (Lynn, 1986). A requirement of CVI is that a minimum of three
expert raters are involved in the rating exercise and twice this amount was used in the
validation exercise. The CVI can be calculated on an item level (I-CVI) and scale
level (S-CVI). The item content validity index (I-CVI) is calculated as a level of
agreement between a panel of judges for each individual item i.e. the proportion of
experts who rate it as content valid. It is calculated by the number of experts giving a
positive rating (“strongly agree” or “agree” in the case of the developmental
instrument) divided by the number of experts (n=6), therefore calculating the
proportion of judges in agreement about relevance” (Polit, 2006).
Individual Items
The range of the CVI is from -1.00 to +1.00, with +1 indicating perfect item-
objective relevancies. The minimum acceptable I-CVI value for items varies
depending on the number of judges involved but a minimum value of 0.70-0.8 is
recommended (Lynn, 1986). For the validation exercise, a minimum value of 0.8 was
used. Items with an index of less than 0.8 were discarded from the measure to
89
improve its validity. Of the 94-items, a total of 20 items had an I-CVI of less than
0.8. These items were:
• My decision-making is in line with that of the organisation
• I am "engaged" in my decision-making
• My organisation is engaged in its decision-making
• Training in the science of decision-making would benefit me
• My organisation would benefit from training in the science of decision-making
• I quantify the cost implications of my decision-making
• My organisation quantifies the cost implications of its decision-making
• I consult with colleagues before making a decision
• In my organisation, consultation with colleagues is encouraged in decision-making
• My decision-making is quantifiable
• My organisation's decision-making approach is quantifiable
• My organisation questions the integrity of its decision-making
• My decision-making is balanced
• My organisation’s decision-making is balanced
• I qualify the cost implications of my decision-making
• My organisation qualifies the cost implications of its decision-making
• My over-optimism results in me underestimating the outcome of a decision
• My organisation's over-optimism results in underestimating the outcome of a
decision
• I systematically analyse how I make decisions
• Decision-making within my organisation is systematically analysed.
The twenty items with an I-CVI value of less than 0.8 were complimentary evidence
of those items observed by the subjective review of the 94-items with the highest
number of “strongly disagree /disagree” ratings.
Overall Instrument (94-items)
The scale content validity index (S-CVI) is defined as “the proportion of total items
judged content valid” (Lynn, 1986). For the developmental instrument this would be
the number of “strongly agrees” and “agrees” and is calculated by the average of the
90
I-CVIs (Polit, 2006). The S-CVI for the 94-item developmental instrument was
calculated as 0.85, which is an acceptable value to suggest the scale is content valid.
Statistical Testing of Agreement
The 94 items of the developmental version of the instrument were rated on a 4-point
ordinal scale for four different content validation criteria by six judges. It is
important to establish the inter-rater reliability between the ratings given by the
expert panel. This will indicate the level of consistency between the panel of judges
and whether the data produced by the judges’ ratings can be relied upon.
The most commonly used measures of agreement for quantitative data (the rating
results) are the Intraclass Correlation Coefficient (ICC). This was appropriate due to
the type of rating method/scale used (ordinal scale) in the questionnaire assessment.
SPSS 20 statistical software was used to calculate the ICC and the reliability of the
results from the six ratings by determination of Cronbach’s alpha. The ICC analysis
between all six raters showed an ICC of 0.894 (p<0.0001. CI=0.561 to 0.993),
indicating a high level of agreement between the six raters for the four criteria
(language, scaling, relevance and completeness) and supporting the content validity
of the items chosen for the developmental version of the instrument.
The Cronbach’s alpha reliability measurement of the six-rater sample results was
0.91, indicating a high level of reliability and further endorsement of content validity
for the developmental instrument.
Part II: Qualitative Assessment
The results from the questionnaire feedback forms (“written feedback”) were
collated and discussed at the expert panel meeting. The members of the panel
participated in free and open discussion which resulted in consensus
recommendation on retaining 74 items and the removal of 20 items from the 94-item
developmental instrument. Editorial language changes were recommended to some
of the 74 remaining items. In addition, two further items were added giving a total of
76-items.
91
The items chosen by the panel for removal were all those that had been identified in
as having a CVI of less than 0.8 and discussed previously. In addition, to the CVI
and S-CVI testing performed, the subjective test of “Face validity” was also
performed by the expert panel. Face validity is an intuitive type of validity in which
the experts provided their feedback on whether the developmental instrument
actually appears to reflect the concept that it is intended to measure. It indicates that
the items that are intended to measure a concept, do, on the face of it, look as though
they measure the concept (Patton, 2002; Denzin and Lincoln, 2005; Bougie, 2010). It
is considered a basic and minimum index of content validity (Streiner and Norman,
2008). All six raters provided their positive opinion that the developmental
instrument does appear to measure the “decision-making” concept and this face
validity further helped to provide useful support for the instrument development
process.
Revisions to The Original Developmental Instrument
The expert panel meeting was interactive and constructive. All of the panel members
actively participated and aired their opinions while at the same time allowing and
agreeing on consensus recommendations on revisions to the instrument. Twenty
items were removed from the original 94-item developmental version of the
instrument (Version 1) and the majority of these were done so by clear consensus
and did not warrant much panel discussion. However, three of the 20 items which
were removed did require notable discussion time as there was originally no clear
consensus on whether to retain or to remove them. These items were:
• Training in the science of decision-making would benefit me
• My organisation would benefit from training in the science of decision-
making
• I systematically analyse how I make decisions.
As part of a lengthy panel review and discussion, the final consensus was to remove
these three items. In addition, the panel recommended the re-wording of six of the 74
retained items as presented in Table 4.3.
92
Table 4.3: Item wording changes recommended by the expert panel Original item wording Revised item wording
I use tools which facilitate my decision-
making
I use tools e.g. modelling or decision trees
which facilitate my decision-making
I understand the instructions before making
a decision
I understand the context of the decision I am
being asked to make
My organisation re-evaluates its decision-
making as new information becomes
available
My organisation re-examines its decision-
making as new information becomes
available
In my decision-making, I perpetuate the
same mistakes as made in the past
In my decision-making, I make the same
mistakes as made in the past
In my organisations decision-making, it
perpetuates the same mistakes as in the past
In my organisations decision-making, it
makes the same mistakes as made in the past
I communicate effectively the decisions I
make
I effectively communicate the decisions I
make
The expert panel also recommended the addition of two new items to the
developmental instrument. These were:
• My decision-making approach in practice tends to focus on discussions rather than actual decisions
• Decision-making in my organisation tends to be final and not open to reinterpretation or discussion
Following the expert panel meeting, the output and recommendations of the expert
panel to the developmental instrument were reviewed and it was agreed to
incorporate the changes to the developmental instrument. This resulted in the 76-item
developmental instrument that would then undergo further psychometric testing.
During the expert panel meeting, the panel advised that 30 – 40 minutes would be a
time estimate needed to complete the revised 76-item questionnaire, based on their
experience of completing the original 94-item questionnaire.
Branding of The Decision-Making Instrument
The expert panel were introduced to the proposed brand name of “QoDOS” (Quality
of Decision-Making Orientation Scheme) assigned to the instrument and advised that
the proposed name was “strong and appropriate” for the decision-making instrument.
93
A copy of the post-content validation 76-item QoDOS developmental instrument
(Version 2) is presented in Appendix IV.
DISCUSSION The content validation of the developmental version of the decision-making
instrument was an essential process for it to be fit-for-purpose. The design of the
process was in line with best practice recommendations reported in the literature for
content validation of a new instrument i.e. qualitative and quantitative components,
use of a multi-expert panel, structural element assessment of the scale by evaluating
language clarity, completeness, relevance and scaling in addition to overall face-
validity assessment.
The inclusion of panel experts from the three different disciplines (regulatory
agency, pharmaceutical industry and CRO) was reflective of the proposed final target
audience for the decision-making instrument. The heterogeneity of the panel
members provided extra robustness to the content validation exercise being
evaluated. The panel experts were all experienced professionals with many years of
experience in decision-making. All of the panel members were supportive and
participated actively in the two stage review process (questionnaire completion and
expert panel meeting).
The use of I-CVI, S-CVI, ICC and reliability measurements provided complimentary
and quantitative statistical support for the overall robustness of the content
validation. The statistical evaluation and the triangulated qualitative assessment of
the expert panel resulted in changes being made to the original developmental
instrument and resulted in a shortened version.
Overall, the expert consensus was that the content of the developmental version of
the instrument was straight forward and appropriate in relation to the specific
decision-making concepts and was relevant to the target population. This agreement
among the expert panel members was reassuring and encouraging. It also provided
confidence that the outcome of this stage was satisfactory in terms of establishing
content validation and proof-of-concept of the shortened developmental version and
94
supported further psychometric testing of the instrument through item reduction
using factor analyses. The resulting 76-item instrument was given the name,
“Quality of Decision-making Orientation Scheme” with the abbreviation “QoDOS”.
The expert panel opinion was that this was an appropriate and strong acronym for the
decision-making instrument.
SUMMARY • The 94 items resulting from the quantitative study (Chapter 3) were reviewed
for language clarity, completeness, relevance and scaling. Content validation
was performed on the original 94-item developmental version of the instrument
using a panel of six experts
• Qualitative and quantitative methods were used in the content validation study
• The scale content validity index of 0.85 suggested that the content validity of
the scale was high
• The test of agreement between raters (ICC) was 0.89 (p<0.0001. CI=0.561 to
0.993), indicating a high level of agreement between the raters
• The expert panel review resulted in the reduction of the original 94 items to 76
items (QoDOS Version 2)
• Content validity and the sub-component of face-validity was successfully
evaluated and the developmental instrument deemed fit-for-purpose and
suitable for further item reduction investigation
• The brand name ‘QoDOS’ (Quality of Decision-making Orientation Scheme)
was assigned to the instrument.
96
INTRODUCTION Factor analysis is a statistical technique used to analyse, investigate and identify the
relationships between a set of variables (items) measured or observed, in particular
for those with similar concepts (Cattell, 1978; Floyd, 1995; Bhatti et al., 2013b). It
is used to help confirm the grouping of the instrument items that have been based on
subjective opinion through use of mathematical modelling. A factor is a group of
items that may be said to belong together (Hazard, 2011). Factor analysis is widely
used to reduce a large number of correlated variables to a more manageable number,
and is regularly used to reduce the number of items in questionnaires. The use of
factor analysis is not designed for testing hypotheses or for judging whether one
group is significantly different to another (Pallant, 2005). It is a statistical technique
used to identify a relatively small number of factors that can be used to represent
relationships among a set of many interrelated variables. In other words it allows for
a large number of individual scale items and questions to be refined and reduced to a
smaller number of derived items (Pallant, 2005; Field, 2009; Bhatti et al., 2013b).
For the purposes of this current research, factor analysis was used to reduce the
number of items in the current 76-item developmental QoDOS instrument and also
to identify underlying factors within the reduced set of items.
Factor analysis is an established approach used in the development of new
instruments in various research areas and in particular for those with a psychometric
or a Quality of Life component (Fayers and Hand, 1997; Nedert et al., 2001;
Fredheim et al., 2007; ESPRINT Group., 2007; Coyne Karin S., 2012). Factor
analysis was employed to refine the QoDOS (Version 2) prior to its full scale
psychometric evaluation. This psychometric evaluation included construct validity,
responsiveness, reliability and interpretability testing.
METHODS There were two distinct research component phases involved in the factor analysis
and item reduction of the 76-item QoDOS instrument (Version 2) as detailed in
Chapter 4. These phases were as follows:
97
Component phase 1: Conduct of a research study survey using the QoDOS
instrument in a large sample population to investigate the decision-making approach
of individuals and their respective organisations. Each prospective participant was
contacted in advance and provided with background information on the research
project and given assurance on anonymity and confidentially on all research related
materials. The same confidentiality commitment as detailed previously in Chapter 3
was provided to all would-be participants.
Survey Monkey was used for the issuance of the QoDOS (Version 2) questionnaire
to all participants and in-turn for the automatic compilation of completed
questionnaire returns. A 100% response rate was achieved and this can be expected
to be due to the functionality within Survey Money which requires that a
questionnaire must be fully completed before it can be sent into its central database.
It will not accept data from partially completed questionnaires. The Survey Monkey
question structure used a Likert response format as exemplified in Figure 5.1.
Figure 5.1: Survey Monkey Likert format used in the research
The time-window for the issuance and completion of the QoDOS developmental
survey was July 2012 to October 2012.
Survey Monkey and Excel were used in the quantitative analysis of this component
of the research. An Excel database was used to compile the completed questionnaires
received from each of the research participants. The functionality of the Excel
database facilitated the data management and interpretation of the study results. The
98
combined Survey Monkey survey and Excel functionality allowed for the generation
of results in various formats including spider graphs, bar charts and ‘Box and
Whisker’ plots for the research sample data.
Component phase 2: The quantitative data generated in Component 1 research was
transposed into statistical format ready for factor analysis and item reduction.
Data Capture, Processing and Analyses (Component Phase 2)
Data processing and statistical analyses were performed using the well established
methodology involving SPSS 20 statistical software for Windows (Norusis, 1993;
Pallant, 2005; IBM, 2011).
Exploratory factor analysis (EFA) using the “principle component analysis” was
performed using SPSS20 statistical software. EFA is used to investigate whether
there is any correlation among a set of items and to identify the dimensions or factor
structure of the new measure and to can be used to reduce items (Fayers and Hand,
1997; Pallant, 2005). It can also be used to support construct validation of new
instruments (Bhatti et al., 2013b). For the QoDOS (Version 2), EFA was used to
explore the underlying structure, to reduce the number of items (inappropriate ones
that may not contribute to the underlying factors) and to support its appropriateness
(construct validity).
Using the SPSS 20 software, a correlation and component matrix was created for the
dataset. Descriptive statistical techniques were used to measure the Kaiser-Meyer-
Olkin (KMO) measure (which comparatively measures the magnitudes of the
observed correlation coefficients to the magnitudes of the partial correlation
coefficients) and Bartlett’s test of sphericity for adequate sampling. A multi-step
factor analysis was performed and Scree plots were generated at each extraction
stage. The Scree plots provided a useful, easily interpretable impression of the
number of factors within each sequential extraction result. Factor rotation was
performed using the Varimax technique and Kaiser-Meyer-Olkin (KMO) and
Bartlett’s test of sphericity measurements were measured at each extraction stage.
Reliability testing was performed by measuring Cronbach’s alpha to measure the
internal consistency and intraclass correlation coefficient (ICC) to evaluate inter-rater
99
reliability. The Cronbach’s alpha testing also provided supportive evidence for the
retention and deletion of the items during the factor analysis (Pallant, 2005; Petter,
2007; Streiner and Norman, 2008).
The following steps and rules were applied during the factor analysis:
1. Reliability test (Cronbach’s alpha) of items was carried out before at each factor
analysis step.
2. Factor analysis was performed on the remaining items.
3. Analysis criterion: Only factor loadings of ≥ 0.4 were progressed. Items which
failed to load on any component were removed. Items with “corrected items-total
correlation” (factor loadings) values <0.4 were deemed not to be discriminating well
/ poorly fitting and were removed. As a rule of thumb, the eigenvalue of 0.32 is
considered to be a minimum loading for an item (Costello and Osborne, 2005) but in
this study, due to the large number of variables, a value of 0.4 was assigned and
considered appropriate to represent strong correlation.
4. Items which loaded on multiple components with not much difference between
values (weak complex variables) were removed. However, items with significantly
higher loading were retained.
5. Further factor analysis was carried out to see whether or not the remaining items
with a similar concept fitted together under the appropriate corresponding
components.
6. Successive factor analyses were carried out to examine the difference (similarities,
number of items removed and the types of items removed).
7. Items were retained of removed based on their loading score. A table was
generated showing the ranking of items based on loading scores. This was used to
decide which items should be deleted and which should be retained for additional
analysis. This assessment on whether to retain or remove an item was performed
100
simply by “eyeballing” the ranked included in the table. Items were deleted, retained,
merged or rephrased on statistical, conceptual and philosophical grounds.
8. After the final analysis, any item that did not conceptually fit in the final extracted
components was manually moved to ones that were more appropriate and
meaningful to that component. This allowed for a logical ordering of concepts to be
generated.
RESULTS Study Participants
Six hundred individuals were contacted and invited to participate in the study. A total
of 130 responded, of which 120 were evaluable. This included 76 from the EU and
US pharmaceutical industry, 19 from the regulatory agencies (European Medicines
Agency, Danish Agency, Irish Medicines Board, UK MHRA, Singapore Ministry of
Health and the UAE Ministry of Health), 23 from CROs (EU and US) and two from
academia. The research results obtained from the 120 evaluable participants provided
insights into decision-making from the perspective of the individual and also that of
the organisation in which they were/are employed. The results also allowed for
comparisons to be made across the three main organisations that participated in the
study i.e. the Regulatory Agencies, Pharmaceutical Companies and CROs.
Organisation and Individual Related Item Responses
Composite results for the 120 person research sample were generated for each of the
76-items in the developmental questionnaire. The results provided a quantitative
response rate to the Likert scale ratings used in the questionnaires for each item. It
was possible to separate the composite results into two distinct categories: those
responses which were answered from the perspective of the Organisation and those
which were responded to from the perspective of the Individual.
A selection of four organisational related item responses and four individual related
item responses are presented in Figures 5.2 – 5.8 respectively for reference and
example purpose.
101
A structured approach to decision-making (Figure 5.2) appeared to be routine
practice in approximately 50% of cases (always/often), 33% on a “sometimes” basis
and rarely or never up to 15% of occasions.
Figure: 5.2: My organisation uses a structured approach in its decision-making
Re-evaluation of decision-making with the availability of new information (Figure
5.3) appears to be standard practice in 15% of cases and an often/sometimes basis for
an additional 70%. It appears not to be the standard approach in about 15% of
decision-making exercises.
Figure 5.3: My organisation re-examines its decision-making as new information becomes available
0
5
10
15
20
25
30
35
Never Rarely Sometimes Often Always Not Applicable
%
Response Options
0
5
10
15
20
25
30
35
40
Never Rarely Sometimes Often Always Not Applicable
%
Response Options
Figure: 5.6: Selection of some O
rganisational item related responses
102
It would appear that organisations only consistently review the probability of success
in their decisions in just over 10% of cases. It appears to be rarely/never performed
in around 12% of occasions. This could infer that organisations are either not
familiar with the advantages of re-examination as it appears not to be used on a
standard basis (Figure 5.4).
Figure 5.4: My organisation quantifies the probability of success in its decision-making
Organisations appear to perform a relatively routine assessment of the impact of the
decision-making. It appears not to be performed in 10% of cases (Figure 5.5).
Figure 5.5: My organisation evaluates the impact of its decisions
0
5
10
15
20
25
30
35
40
Never Rarely Sometimes Often Always Not Applicable
%
Response Options
0
5
10
15
20
25
30
35
40
45
Never Rarely Sometimes Often Always Not Applicable
%
Response Options
103
From the perspective of the individual it appears that the majority of individuals
(around 85%) felt as though they could make better decisions ranging from a
sometimes to an always basis (Figure 5.6).
Figure 5.6: I feel that I could make better quality decisions
The use of intuition as a standard practice appears to be the case in around 25% of
people. Less than 15% appear to use it only on a ‘rarely/never’ basis and 75% on a
‘sometimes/often’ basis. It is recognised that different situation will call upon
different decision-making approaches but still this is an interesting finding
considering the background of the individuals and the evidence based medicines
arena.
Figure 5.7: I use intuition or “gut-feeling” in my decision-making
0
10
20
30
40
50
60
Never Rarely Sometimes Often Always Not Applicable
%
Response Options
0
10
20
30
40
50
60
70
Never Rarely Sometimes Often Always Not Applicable
%
Response Options
104
More than 35% of persons who participated in the research advised that they had not
received any training in the science of decision-making. Less than 10% of persons
advised that they received training on often/always basis (Figure 5.8). This is an
interesting and somewhat disappointing finding when one considers the evolving and
innovated nature of drug development and the regulatory review and the increasing
convergence of industry and regulators in effective delivery of new drugs.
Figure 5.8: I receive training in the science of decision-making
The collection of all the item response data in Excel format allowed for the
quantification of the response metrics per response option for each of the
organisations. A tabular summary of the response metrics for the organisations is
given in Table 5.1.
Table 5.1: Response metrics for individuals from the three organisations* Regulatory Agencies
(n=19) Pharmaceutical
Companies (n=76) CROs (n=23)
Never 99 (6.9%) 203 (3.5%) 63 (3.6%)
Rarely 242 (16.8%) 934 (16.2%) 278 (15.9%)
Sometimes 378 (26.2%) 2030 (35.1%) 608 (34.8%)
Often 367 (25.4%) 1768 (30.6%) 537 (30.7%)
Always 225 (15.6%) 714 (12.4%) 221 (12.7%)
Not Applicable 133 (9.2%) 127 (2.2%) 40 (2.3%)
* The results of the Academics (n=2) were excluded in the metric and statistical analyses due to such low participant numbers.
0
5
10
15
20
25
30
35
40
45
Never Rarely Sometimes Often Always Not Applicable
%
Response Options
105
The percentage of “Affirmative” responses received from the individuals from the
three organisations was 67% (Regulatory Agencies), 78% (Pharmaceutical
companies) and 78% (CROs).
Comparative statistical analyses were performed on the organisation data to generate
items such as correlation information and comparative “box and whisker” plots on
the distribution of the data. The correlation coefficients for the associations between
the results of the organisations were high as shown in Table 5.2.
Table 5.2: Correlation coefficients for the three organisations Regulatory Agencies
(r, p<0.001)
Pharmaceutical
Companies (r, p<0.001)
CROs
(r, p<0.001)
Regulatory Agencies - 0.98 -
Pharmaceutical
Companies
0.98 - 0.99
CROs 0.98 0.99 -
Comparative ‘box and whisker’ plots of the three different organisation results were
generated. The plots were generated using Minimum, 25%, Median, 75% and the
Maximum of the datasets (Figure 5.9). A ‘Box and Whisker’ plot presents summary
information about the distribution of the data or results. It plots the minimum, the
25th percentile, the median, the 75th percentile and the maximum results and scores
that are far removed from the rest (outliers). Fifty per cent of the results are within
the coloured boxed areas. The length of the box corresponds to the inter-quartile
range (IQR) which is the difference between the 75% and 25% percentiles. The IQR
is an established technique used for enabling comparisons to be made among several
groups of data. In addition to distribution or spread of results, they also give
information on the central tendency of the data set (Sekaran and Bougie, 2010). The
Box-and-Whisker plots present a visualisation of the distribution in responses
between the organisations and the close comparison between the CRO and the
Agency distribution is noteworthy.
106
Figure 5.9: Box and Whisker plot for the distribution of the results from the three organisations
Statistical Factor-Analysis
The 76-item QoDOS (Version 2) contained questions relating directly to the
decision-making approach adopted by “organisations” (Regulatory Agencies and
Pharmaceutical Industry) and that used by “Individuals” (from within the Regulatory
Agencies and Pharmaceutical Industry). Eight different SPSS analyses approaches
were attempted on the 76-item instrument using SPSS 20. The approaches
investigated the use of PCA, item reduction, Scree plots, KMO, Bartlett’s Sphericity
testing, statistics descriptive techniques, ICC and several different rotation
techniques. The factor analyses did not result in satisfactory item convergence of
item reduction. In the draft instrument, the questions were presented in a composite
manner and not separated on the basis of whether the question item related to the
“Individual” or the “Organisation”.
Factor Analysis of The Composite 76-item Instrument
The factor-analysis attempted on the 76-item instrument, commenced with
generation of a Scree plot. A rule-of-thumb in interpreting Scree plot outputs is that
the “bend in the elbow” or “point of inflexion” is indicative of the number of latent
factors within the item set. The Scree plot for the 76 items inferred the presence of
nine or ten latent factors (Figure 5.10).
0
500
1000
1500
2000
2500
Pharma CRO Agency
Dis
tribu
tion
of R
espo
nses
Organisation type
107
Figure 5.10: Scree plot for the 76-item composite instrument
The Cronbach’s alpha for the 76-items instrument was 0.861 which inferred good
reliability (Pallant, 2005). As indicated in Table 5.3, the KMO which measured the
adequacy of the proposed factor analysis for the 76 items was 0.553. This KMO
result was above the 0.5 threshold of acceptability, although it did infer that the
sample size was “mediocre” in nature (Pallant, 2005; Field, 2005). Bartlett’s test of
sphericity tests whether the correlation matrix is an identity matrix, which would
indicate that the factor model is inappropriate.
Table 5.3: KMO and Bartlett’s Test results for 76 items Kaiser-Meyer-Olkin Measure of Sampling Adequacy 0.553
Approx. Chi-Square 6007.891
Significance (‘p’) 0.0001
Organisation Versus Individual Factor Analysis Methods
Following the unsuccessful factor analysis attempts and item reduction of the 76-
item QoDOS developmental instrument, the items were separated into two groups
depending on whether the item related to organisational or individual level decision-
making. This split the 76 items into two separate blocks, one containing 35
organisational items and the other 41 individual related items. The two blocks were
given the coding nomenclature d1 – d76 in the SPSS procedural analysis approach
with d1 – d36 comprising the Organisational level items and d37 – d76 the
individual level items (Table 5.4). This in essence, produced two new distinct
domains of the QoDOS instrument. One for Organisational related items (d1 – d36
(excluding d15, which was an organisational item)) and another one for Individual
related items (d37 –d76).
108
Table 5.4: Mapping and separation of the 76 QoDOS items to their organisational level (35) and individual level (41) items
Organisation level items Individual level items
Q2 d1
Q1 d37 Q4 d2
Q3 d38
Q6 d3
Q5 d39 Q7 d4
Q13 d40
Q8 d5
Q15 d41 Q9 d6
Q16 d42
Q10 d7
Q18 d43 Q11 d8
Q19 d44
Q12 d9
Q21 d45 Q14 d10
Q22 d46
Q17 d11
Q24 d47 Q20 d12
Q25 d48
Q23 d13
Q26 d49 Q28 d14
Q27 d50
Q31 d16
Q29* d15 Q33 d17
Q30 d51
Q35 d18
Q32 d52 Q37 d19
Q34 d53
Q39 d20
Q36 d54 Q41 d21
Q38 d55
Q48 d22
Q40 d56 Q49 d23
Q42 d57
Q51 d24
Q43 d58 Q53 d25
Q44 d59
Q54 d26
Q45 d60 Q56 d27
Q46 d61
Q58 d28
Q47 d62 Q60 d29
Q50 d63
Q63 d30
Q52 d64 Q65 d31
Q55 d65
Q68 d32
Q57 d66 Q70 d33
Q59 d67
Q72 d34
Q61 d68 Q74 d35
Q62 d69
Q76 d36
Q64 d70
Q66 d71
Q67 d72
Q69 d73
Q71 d74
Q73 d75
Q75 d76
*Q29 (my procrastination has resulted in a negative outcome) was assigned inadvertently as out of sequence “d” reference number but this did not impact the analyses.
109
Factor Analysis of The Organisational Related Items
A 12-step factor analysis was performed on the 35 organisational related items using
SPSS 20. This helped to explore the underlying structure of the 35 items, to confirm
appropriateness (construct validity) and to further develop the instrument by
reducing inappropriate items that did not contribute to underlying domain factors of
the instrument. Reliability testing using Cronbach’s alpha and ICC were measured
along with KMO and Barlett’s testing. Scree plots were generated at each factor
analysis stage. The Scree Plot for the 35 Organisational related items is presented in
Figure 5.11 and inferred the presence of six or seven latent factors for the 35 items.
Figure 5.11: Scree plot of the 35 organisational level items
The reliability statistics performed resulted in a Cronbach’s alpha of 0.776 for the 35
Organisational items which was a satisfactory robust result. As indicated in Table
5.5, the KMO for the 35 Organisation item solution was 0.743 and was satisfactory.
The Bartlett’s test result obtained rejected the hypothesis (at p≥0.0001) that the
110
correlation matrix is an identity matrix. This supported the appropriateness of the
factor model.
Table 5.5: KMO and Bartlett’s test results for 35 organisational item Kaiser-Meyer-Olkin Measure of Sampling Adequacy 0.743
Bartlett’s Test of Sphericity 595
Significance (‘p’) 0.0001
The ICC Reliability coefficient describes how strongly items in the same group
resemble each other. The ICC Reliability coefficient ICC = % of variance in the
scores results from “true” variance among subjects. ICC ranges from 0 (no
agreement) to 1 (perfect agreement). The "single" measure gives the reliability of the
scale that is scored by just one of several raters or at one of several occasions and the
"average" " measures provided the reliability of a scale that is made up as the
average of the different raters. The average ICC value for the organisational items
was above 0.77 which is considered acceptable.
Factor Analysis 1:
This included all 35 organisation-related items. The initial factor analysis performed
based on the Kaiser’s rule, yielded 9- factors with eigenvalue of at least 1 (Table
5.6). The resultant nine factors were also supported by the subjective interpretation
of the Scree plot (factors to “bend in elbow”). Item d23 (Q49) was removed as a
result of Analysis 1.
Further automatic step-wise extractions were performed on the 35 items and resulted
in five component factors and 21 items. As part of the analysis, some Cronbach’s
alpha measurements were calculated in addition to KMO to add extra robustness to
the statistical analysis. A summary of the additional nine extraction steps and results
obtained is presented after Table 5.6.
111
Table 5.6: Results of factor analysis 1: Total variance explained Component Initial Eigenvalues Extraction Sums of squared
loadings
Total % of Variance Cumulative % Total % of Variance
1 7.881 22.516 22.516 7.881 22.516
2 4.569 13.054 35.571 4.569 13.054
3 2.440 6.972 42.542 2.440 6.972
4 1.790 5.113 47.656 1.790 5.113
5 1.582 4.520 52.176 1.582 4.520
6 1.386 3.959 53.135 1.386 3.959
7 1.220 3.487 59.622 1.220 3.487
8 1.098 3.138 62.759 1.098 3.138
9 1.052 3.007 65.766 1.052 3.007
10 0.984 2.813 68.579
11 0.944 2.698 71.277
12 0.838 2.395 73.671
13 0.829 2.367 76.039
14 0.772 2.206 78.245
15 0.702 2.006 80.250
16 0.668 1.909 82.159
17 0.580 1.656 83.815
18 0.551 1.575 85.390
19 0.547 1.562 86.952
20 0.510 1.458 88.409
21 0.460 1.314 89.724
22 0.438 1.250 90.974
23 0.411 1.174 92.148
24 0.365 1.042 93.190
25 0.349 0.998 94.187
26 0.319 0.911 95.099
27 0.296 0.847 95.946
28 0.265 0.756 96.702
29 0.250 0.713 97.415
30 0.195 0.557 97.972
31 0.173 0.493 98.465
32 0.165 0.470 98.935
33 0.152 0.433 99.369
34 0.134 0.384 99.752
35 0.087 0.248 100.00
112
Factor Analysis 2: This resulted in item reduction with the removal of two items;
d12 (Q20) and d33 (Q70). The KMO for the resultant 9-factor solution was 0.736.
Factor Analysis 3: This produced a KMO of 0.722 for a 9-factor solution.
Factor Analysis 4: This used a 2-factor analysis and resulted in the removal of two
further items; d28 (Q58), d26 (Q54). The resultant KMO was 0.722 for the resultant
9-factor solution.
Factor Analysis 5: This used a 2 factor-analysis and resulted in the removal of three
items; d4 (Q7), d34 (Q72), d35 (Q76). The KMO for the resultant 8-factor solution
was 0.731.
Factor Analysis 6: This resulted in the removal of one further item namely; d10
(Q14). The KMO was 0.749 for the resultant 8-factor solution. The Cronbach’s alpha
was 0.768.
Factor Analysis 7: This resulted in the removal of three items: d33 (Q17);
d31(Q65); and d32 (Q68). With KMO of 0.750 for the resultant 6-factor solution and
23 items. The Scree plot for the 23 item solution is presented in Figure 5.12 and it
inferred the presence of six factors.
Factor Analysis 8: This resulted in the removal of one further item namely; d29
(Q60). The KMO was 0.789 for the resultant 6-factor, 22 item solution.
Factor Analysis 9: This resulted in the removal of one further item namely; d7
(Q10). The KMO was 0.802 and the Cronbach’s alpha was 0.762 for the resultant 5-
factor, 21 item solution.
113
Figure 5.12: Scree plot for the 23 organisational influence items
Factor Analysis 10: This resulted in a KMO of 0.804 for the resultant 21 item
solution. The Scree plot for the 21 item solution is presented in Figure 5.13 and
inferred the presence of four factors.
Figure 5.13: Scree plot for the 21 item organisation level influences
The factor analysis performed, reduced the 35 Organisational items to 21 items.
Eigenvalues were generated for each of the 21 items (factors). The Scree plot was
relatively improved compared to the previous extraction. The eigenvalue loading
results showed that most loading was accounted for on five factors, with the majority
loading onto two factors as shown in Table 5.7.
114
Table 5.7: Total variance explained for the 21-item solution Component Initial Eigenvalues Extraction Sums of squared
loadings
(d) Total % of
Variance
Cumulative % Total % of Variance
1 5.993 28.538 28.538 5.992 28.538
2 3.862 18.393 46.930 3.862 18.393
3 1.350 6.427 53.357
4 1.247 5.936 59.264
5 1.062 5.056 64.349
6 0.962 4.582 68.931
7 0.810 3.859 72.790
8 0.709 3.374 76.165
9 0.694 3.306 79.471
10 0.618 2.941 82.411
11 0.576 2.741 85.152
12 0.491 2.338 87.490
13 0.459 2.184 89.675
14 0.401 1.911 91.585
15 0.341 1.624 93.210
16 0.309 1.470 94.680
17 0.301 1.432 96.112
18 0.248 1.180 97.292
19 0.208 0.992 98.284
20 0.194 0.923 99.207
21 0.166 0.793 100.00
The first five component factors explained relatively large amounts of variance
(especially factors one and two) whereas the subsequent factors explained small and
reducing amounts of variance. Only the initial two factors had loadings above an
eigenvalue of 2.
Rotation Factor Matrix
The component matrix for the 21 extracted variables was rotated using Varimax
functionality. This Varimax rotation helped to confirm the initial structure of the
scale and delivered a matrix of the factor loadings for each vairable onto each of the
two factors. The loading solution showed the variables listed in order of the size of
115
their factor loadings onto each of the two component factors. Loading values with a
unique value of less than 0.4 were supressed. The rotated matrix 2-factor solution for
the 21 organisational variables showing the loading of each variable is presented in
Table 5.8.
The Varimax rotation maximised the variance of each of the 21 items, so the total
amount of variance accounted for was redistributed over the two extracted factors.
Overall, the factor analysis on the Organisational items allowed a reduction from 35
to 21 items. The analysis was also discriminatory in nature in that different loadings
resulted for the differing constructs which was also supportive of overall construct
validity.
Factor Analysis of Individual Related Items
The grouping of the original composite 76-item QoDOS (Version 2) into two blocks,
resulted in 41 individual related items in the “individual” block. Factor analysis on
the 41 items was performed using SPSS 20. A total of 11 consecutive factor analysis
item reduction steps were performed on the 41 individual related items. Reliability
testing using Cronbach’s alpha and ICC were measured along with KMO and
Barlett’s testing. Scree plots were generated at each factor analysis stage. The Scree
Plot for the 41individual related items is presented in Figure 5.14 and inferred the
presence of nine or ten latent factors for the 41 items.
Figure 5.14: The Scree plot for the 41 individual related items
116
Table 5.8: The organisational item resultant rotated factor loadings (pattern matrix)
Variable Factor1 Factor2
My organisation’s decision-making is influenced by company
politics Q11 d8 .796
My organisation has suffered a negative outcome due to slow
decision-making Q31 d16 .719
In my organisation’s decision-making, it makes the same
mistakes as made in the past Q53 d25 .684
My organisation’s decision-making is influenced by vested
interest of individuals Q9 d6 .668
My organisation’s culture has resulted in its inability to make
a decision Q33 d17 .666 -.373
My organisation continues with projects which should be
terminated at an earlier stage Q28 d14 .631
My organisation’s decision-making is influenced by
competitors Q8 d5 .585 .406
My organisation’s decision-making is influenced by
incentives or penalty payments Q12 d9 .575
My organisation underestimates problems which adversely
impacts its own decision-making Q56 d27 .569
My organisation quantifies the probability of success in its
decision-making Q37 d19 .382 .710
My organisation qualifies the probability of success in its
decision-making Q35 d18
.664
My organisation encourages innovative decision-making Q63 d30
.637
My company uses a structured approach in its decision-
making Q2 d1
.634
My organisation effectively communicates the decisions it
makes Q74 d35 -.481 .612
My organisation provides clear and unambiguous instructions
for decision-making Q39 d20
.612
My organisation evaluates the impact of the decisions it
makes Q4 d2
.600
My organisation’s decision-making approach is transparent Q41 d21 -.375 .587
My organisation’s decision-making is consistent Q48 d22 -.384 541
My organisation is open to using better alternatives in its
decision-making Q51 d24
.539
My organisation re-examines its decision-making as new
information becomes available Q49 d23 -.488 .537
My organisation’s decision-making is influenced by external
stakeholder’s demands Q6 d3
.520
117
The reliability statistics performed resulted in a Cronbach’s alpha of 0.809 for the 41
Individual item instrument which was a satisfactory robust result. As indicated in
Table 5.9, the KMO for the 41 Individual item solution was 0.645 and was “fair”.
The Bartlett’s test result obtained rejected the hypothesis (at p≥0.0001) that the
correlation matrix is an identity matrix. This supported the appropriateness of the
factor model.
Table 5.9: KMO and Bartlett’s Test results for the 41 individual items Kaiser-Meyer-Olkin Measure of Sampling Adequacy 0.645
Bartlett’s Test of Sphericity 820
Significance (p) 0.0001
The Intraclass Correlation Coefficient for the 41 individual items were also generated
and had an average ICC value of 0.8, which was acceptable. As part of the step-wise
factor analyses, some Cronbach’s alpha measurements were calculated in addition to
KMO to add extra robustness to the statistical analysis. A summary of the additional
11 extraction steps is presented below:
Factor Analysis 1: 41 Individual related items
The initial factor analysis performed based on the Kaiser’s rule, yielded 12 factors
with an Eigen-value of at least 1. The 12-factor solution was also supported by the
subjective interpretation of the Scree plot (factors to “bend in elbow”). Four Items;
d74 (Q71), d42 (Q16), d43 (Q18), d61 (Q6) were removed as a result of the first
factor analysis. Further automatic step-wise extractions involving 11 reiterations
were performed on the remaining items which resulted in 6 component factors and
22 items.
Factor Analysis 2:
This resulted in the reduction of three items: d41 (Q15); d76 (Q75); and d70 (Q64)
with KMO value of 0.683 for the resultant 11-factors and 34-item solution. The
Scree plot for the 34 item solution is presented in Figure 5.15 and inferred the
presence of 12 latent factors.
118
Figure 5.15: Scree plot for the individual items solution (2nd factor analysis)
Factor Analysis 3:
This resulted in item reduction leading to the removal of one item namely: d72
(Q67). The KMO obtained post-factor analysis three was 0.695.
Factor Analysis 4:
This resulted in the removal of one item namely: d66 (Q57). The KMO obtained
post-factor analysis was 0.700 (good) and the Cronbach’s alpha of 0.809 (very good).
Factor Analysis 5:
This resulted in the removal of a further one item: d75 (Q73). The KMO obtained
post-factor analysis was 0.710 (good).
Factor Analysis 6:
This resulted in item reduction of one item namely: d69 (Q62). The KMO obtained
post-factor analysis was 0.713 (good).
Factor Analysis 7:
The KMO obtained post-factor analysis seven, was 0.713 (good) and the Cronbach’s
alpha was 0.803 (good). The Scree plot obtained and presented in Figure 5.16
inferred the presence of four factors.
119
Figure 5.16: Scree plot for the individual items (7th factor analysis)
Factor Analysis 8:
This resulted in the removal of five items: d40 (Q13): d48 (Q25); d47 (Q24); d63
(Q50); and d38 (Q3). The KMO obtained was 0.713 (good).
Factor Analysis 9:
Factor analysis nine resulted in the removal of two items namely: d45 (Q21) and d61
(Q46). The KMO was 0.755 (good) with a Cronbach’s alpha of 0.821(good).
Factor Analysis 10:
Factor analysis ten resulted in the removal of a further single item: d44 (Q19). The
KMO obtained was 0.765 (good).
Factor Analysis 11: Factor analysis eleven, resulted in no further reduction of items.
The KMO obtained was 0.762 (good) and the Cronbach’s alpha of 0.796 (good).
The Scree plot inferred the presence of at least 6 latent factors, two of which were
most dominant. No clear “point of inference / elbow break” was evident in the Scree
plot, as presented in Figure 5.17.
120
Figure 5.17: Scree plot for the individual items (11th factor analysis)
The ICC reliability coefficient results describe how strongly items in the individual
item group resemble each other. The average ICC value was 0.796 which is
acceptable. The factor analysis performed on the individual items reduced the
number of items from 41 to 22. The eigenvalue loading resultant from the final
extraction are presented in Table 5.10 showed that a six component factor solution
explained relatively large amounts of variance (especially factors one and two)
whereas the subsequent factors explained small and reducing amounts of variance.
Only the top two dominant factors had loadings above an eigenvalue of 2 (same
criteria as applied to the Organisational items).
Rotation Factor Matrix
The component correlation matrix for the 22 extracted variables was rotated using
Varimax functionality. The Varimax rotation helped to confirm the initial structure
of the scale and delivered a matrix of the factor loadings for each variable onto each
of the two dominant factors. The loading solution showed the variables listed in
order of the size of their factor loadings onto each of the two component factors.
Loading values with a unique value of less than 0.4 were suppressed. The rotated
matrix 2-factor solution for the 22 individual variables showing the loading of each
variable is presented in Table 5.11.
121
The Varimax rotation maximised the variance of each of the 22 factors, so the total
amount of variance accounted for was redistributed over the two extracted factors.
The reduction of the original 41 organisational items to 22 and followed by their
loading onto two factors will allow for an individual behaviour title to be allocated to
the two factors. The analysis was also discriminatory in nature in that different
loadings resulted for the differing constructs which was also supportive of overall
construct validity.
Table 5.10: Total variance explained for the 22 item solution Component Initial Eigenvalues Extraction Sums of squared
loadings
d Total % of Variance Cumulative % Total % of Variance
1 4.485 20.385 20.385 4.485 20.385
2 3.786 17.208 37.592 3.786 17.208
3 1.675 7.612 45.205
4 1.303 5.922 51.127
5 1.225 5.566 56.693
6 1.037 4.713 61.406
7 0.972 4.417 65.824
8 0.867 3.943 69.766
9 0.817 3.712 73.479
10 0.727 3.307 76.785
11 0.716 3.256 80.041
12 0.620 2.819 82.860
13 0.542 2.466 85.326
14 0.502 2.284 87.610
15 0.473 2.152 89.761
16 0.441 2.006 91.768
17 0.380 1.276 93.493
18 0.376 1.710 95.203
19 0.349 1.589 96.792
20 0.284 1.292 98.084
21 0.224 1.017 99.101
22 0.198 0.899 100.00
122
Table 5.11: The 22 individual related decision-making factors: following item reduction and SPSS extraction
Variable
Component (Factor)1
Component (Factor)2
My procrastination has resulted in a negative outcome
Q29 d15 .734
I have experienced “paralysis by analysis” caused by my slow decision-making
Q30 d51 .720
Emotion is part of my decision-making Q66 d71 .706 I have experienced a negative outcome by a
decision not being made Q32 d52 .680
In my decision-making, I make the same mistakes as made in the past
Q52 d64 .600
Recent or dramatic events greatly impact my decision-making
Q59 d67 .559
My decision-making could be improved by assigning weights
Q42 d57 .532
I continue with projects which should be terminated at an earlier stage
Q27 d50 .522
I feel that I could make better quality decisions
Q22 d46 .502
I underestimate problems which adversely impact my decision-making
Q55 d21 .493
I quantify the probability of success in my decision-making
Q36 d54 .445 .326
I qualify the probability of success in my decision-making
Q34 d53 .441 .312
I understand the context of the decision I am being asked to make
Q38 d55 .741
I consider uncertainty and unknowns in my decision-making approach
Q45 d60 .644
I present contingencies or achievable options as part of my decision-making
Q43 d58 .642
My decision-making is consistent Q47 d62 .635 My decision-making approach is transparent Q40 d56 .608 I use a structured approach in my decision-making
Q1 d37 .591
My decision-making is knowledge based Q69 d73 .529 I understand the importance of the decisions I make
Q5 d39 .509
My professional experience is important when having to make challenging decisions
Q26 d49 .484
I generate a SWOT (strengths, weaknesses, opportunities, threats ) analysis in my decision-making
Q44 d59 .482
123
Factor Analysis Final Output
The factor analysis and item reduction performed on the initial 76-item draft
instrument resulted in the emergence of the following list of reduced items for the
Organisation and Individual decision-making categories.
Organisational Related Items (21-items):
• My organisation’s decision-making is influenced by company politics
• My organisation has suffered a negative outcome due to slow decision- making
• In my organisation’s decision-making, it makes the same mistakes as made in the
past
• My organisation’s decision-making is influenced by vested interest of individuals
• My organisation’s culture has resulted in its inability to make a decision
• My organisation continues with projects which should be terminated at an earlier
stage
• My organisation’s decision-making is influenced by competitors
• My organisation’s decision-making is influenced by incentives or penalty
payments
• My organisation underestimates problems which adversely impacts its own
decision-making
• My organisation quantifies the probability of success in its decision- making
• My organisation qualifies the probability of success in its decision-making
• My organisation encourages innovative decision-making
• My company uses a structured approach in its decision-making
• My organisation effectively communicates the decisions it makes
• My organisation provides clear and unambiguous instructions for decision-
making
• My organisation evaluates the impact of the decisions it makes
• My organisation’s decision-making approach is transparent
• My organisation’s decision-making is consistent
• My organisation is open to using better alternatives in its decision-making
• My organisation re-examines its decision-making as new information becomes
available
124
• My organisation’s decision-making is influenced by external stakeholder’s
demands
Individual Related Items (22-items):
• My procrastination has resulted in a negative outcome
• I have experienced “paralysis by analysis” caused by my slow decision-
making
• Emotion is part of my decision-making
• I have experienced a negative outcome by a decision not being made
• In my decision-making, I make the same mistakes as made in the past
• Recent or dramatic events greatly impact my decision-making
• My decision-making could be improved by assigning weights
• I underestimate problems which adversely impact my decision-making
• I continue with projects which should be terminated at an earlier stage
• I feel that I could make better quality decisions
• I quantify the probability of success in my decision-making
• I qualify the probability of success in my decision-making
• I understand the context of the decision I am being asked to make
• I consider uncertainty and unknowns in my decision-making approach
• I present contingencies or achievable options as part of my decision-making
• My decision-making is consistent
• My decision-making approach is transparent
• I use a structured approach in my decision-making
• My decision-making is knowledge based
• I understand the importance of the decisions I make
• My professional experience is important when having to make challenging
decisions
• I generate a SWOT (strengths, weaknesses, opportunities, threats ) analysis in
my decision-making.
Expert Team Review of The Themes that Emerged from The Qualitative Study
It is appreciated that factor analysis is a complex procedure, which is exacerbated by
the lack of inferential statistics and the imperfections of “real world” data and can be
125
prone to subjective biases such as during the “eyeballing” stage. To address this a
panel of expert can be used to review and make judgement concerning the deletion
and retention of specific items (Denzin and Lincoln, 2005). The research team
reviewed the initial emergent source themes on Organisational (21) and Individual
(22) related decision-making behaviour. It was decided to retain some of the
removed items which were very highly prevalent in the qualitative study. The
additions below were proposed by the team based on their own personal and expert
professional perspective and also with cognisance of the output from the key-opinion
leaders interviews discussed in Chapter 3. These additions were:
Organisational related item additions:
My organisation considers uncertainties in relation to decision-making
My organisation provides training in the science of decision-making
Individual related item additions:
I receive training in the science of decision-making
I use intuition or “gut-feeling” in my decision-making
The outcome of the final factor analysis and the thorough review performed by the
research team was the delivery of the 47-item QoDOS (Version 3) instrument. The
instrument comprised of two domains; one for organisational level decision-making
consisting of 23 items and individual level approaches consisting of 24 items.
Subsequently each component was grouped into two separate domains representing
the approach, culture, competence and decision-making style.
Overall, the factor analysis performed allowed for the organisation and individual
influence items contained within the final instrument to be allocated to one of four
categories, two relating to the organisation and two relating to the individual:
• Organisational level influences - decision-making approach
• Organisational level influences - decision-making culture
• Individual level influences - decision-making competence
• Individual level influences - decision-making style
126
The complete set of organisational related items and individual related items have
been incorporated into the QoDOS instrument (Version 3) presented in Appendix V.
This was tested for final validation which will be reported in Chapter 6.
DISCUSSION There were two distinct but linked component stages in the factor analysis performed
on the 76-item QoDOS (Version 2). The first stage involved the instrument being
sent using Survey Monkey to over 600 potential research participants. A total of 120
evaluable individuals participated in this stage of the research and completed the
developmental QoDOS questionnaire as requested. The research participants
comprised of individuals from international regulatory agencies, international
pharmaceutical companies and CROs (and two from Academia).
The timeframe for completion of the questionnaire was a defined four months over
the summer period and this may have had an influence on the low response rate of
20%. Several measures reported in the literature (and introduced in Chapter 2) to
boost response rates were employed including follow-up requests to complete, phone
contacts and some personal one-to-one interactions (Diem, 2002b; Boynton, 2004;
Survey Monkey, 2013). Factors other than the summer test period that might have
influenced the low response rate could have included: the length of the questionnaire
(76 items and perceived time-sacrifice burden), corporate position not allowing for
surveys to be completed (as reported by several persons), potential participant apathy
to the survey and to the research area and other contributory factors which are not
easy to qualify or to quantify. However, the resultant data from the 120 person
research sample provided a rich and valuable platform for developing insights into
the decision-making practices of the individuals and the organisations who
participated in the research. A wealth of resultant information was generated and this
allowed several comparative reviews of perspective from that of the individual and
the organisation.
The Survey Monkey and the SPSS statistical functionality allowed for a large
amount of quantitative findings to be generated. Quantitative feedback results were
generated for each of the three main organisations (Regulatory Agencies,
127
Pharmaceutical Companies and CROs) active in the research. The data provided
insight into the variance in distribution of results to the 76-item question obtained
from the three organisations. The results provided preliminary insight of differing
construct dimensions of the decision-making perspective of the organisations
compared with that of the individual. For Organisations, the Modus Operandi, the
working environment and the shared beliefs and values of that organisation appeared
to be important influences. For the Individual, the subjective elements of:
professional experience, ability, empowerment or autonomy and preference appeared
to be latent decision-making dimensions.
From the perspectives of the individual it was evident that people felt that they could
make better decisions and that an investment in training and education in decision-
making would benefit them and their decision-making. There was a lack or routine
usage of decision-making tools such as SWOTs and limited experience of modelling
and simulation. Other perspectives that emerged were that the individual felt that
they were more accountable for their decisions than the organisation was at the
organisational level. People firmly believed that professional experience was a key
component that influenced decision-making. The results also showed the importance
of clearly understanding the context of the decision. In total, the individual’s
perspective was obtained in response to 41 specific questions on their decision-
making style, approach and factors that impact them.
Similarly, insights were gained from the 120 person sample on the decision-making
perspective of the organisation. Thirty-five specific questions on organisational
decision-making were responded to and yielded insights into the factors including:
the culture of the organisation, the lack of training in decision-making being
provided within organisations, the internal and external competitor influences,
performing an impact analysis of decisions made, re-evaluating a decision on the
basis of new data becoming available and transparency within the decision-making
process. A variance in the distribution of the response profiles to the individual and
organisational focused questions was evident across the three organisations involved
in the research. The ‘Box and Whisker’ plot results give an interpretable visualisation
of this variance and also indicated that the pharmaceutical cohort had a wider range
of “outliers”. This may be linked to the decision-making competence or style
128
approach of some individuals employed in this cohort on items such as use of “gut
feeling /intuition” and the more competitive environment in which many decisions
need to be made. These decision-making drivers will be further explored through the
development of the developmental instrument. The research was enriching in several
ways in that it not only successfully investigated the research aim, but it also allowed
for an enabling, enriching and synergistic networking within the medicinal product
development community.
The second distinct component stage of this chapter was that relating to the factor
analysis performed on the original 76-item developmental instrument. Factor
analysis was attempted on the 76-item QoDOS (Version 2) containing the combined
organisational and individual item variables. Although the Cronbach’s alpha result
obtained (0.861) inferred good reliability (Pallant, 2005), the KMO measure of the
adequacy value of 0.553 obtained inferred that the sample size was “mediocre” in
nature. The “mediocre” KMO did not improve much as part of further reiterations
attempts. This mediocre KMO results were reflective of the challenge of the sample
size versus the number of items in the developmental instrument. The issue with the
low KMO results and with failure to achieve successful extractions and item
reductions, factor analysis and robust statistical analysis on the QoDOS (Version 2)
appeared to be related to the research sample size data available for the analysis
(n=120) versus the number of items (76) in the instrument. The 120 sample size was
apparently too small for the 76 target items and a sample size in the magnitude of
n=760 (in line with the 10:1 ratio detailed earlier) or potentially n=380 (on a 5:1
ratio) might have been sufficient to allow successful item extraction (Tabachnick and
Fidell, 2001). However, the implications of aiming for an n=760 sample size would
have required, in theory, making contact with 1,500 - 3,800 individuals on the
premise of a 20% participation rate. This ideal sample size requirement was
recognised as being prohibitive and the approach to split the 76-item into two
separate blocks of 35 (Organisational related items) and 41 (Individual related items)
seemed a plausible solution. The two blocks were given the coding nomenclature
related to Organisational level issues Individual level issues. This resulted in the two
blocks of Organisational and Individual related issues being mapped, analysed and
presented. This approach of splitting the 76 items into the two component blocks was
deemed pragmatic and valid.
129
The outcome of the factor-analysis and review was the extraction and reduction of
items in both groups. Organisational items were reduced from 35 to 23 and the
reduction of individual items from 41 to 24. The organisational and the Individual
related domains (n=24) were categorised into two sub-category dimensions. For the
Organisational items:“Decision-making approach” and “Decision-making culture”
and “Decision-making competence” and “Decision-making style” for the individual
items. These subcategory headings appeared to be the influences and behaviours that
emerged from the questionnaire results and endorsed by the qualitative interviews
conducted with the Key Opinion Leaders and reported previously. These four
construct dimensions are deemed acceptable in terms of generalisability and
applicability to a wider population outside the sample pool directly involved in this
research.
The resultant outcome of the factor-analysis was the delivery of the final version of
the QoDOS instrument (Version 3) capturing organisational and individual decision-
making items grouped into two separate construct variable domains representing the
approach, culture, competence and decision-making style. The factor-analysis was
discriminatory in that different factor loadings were observed for the latent variables
which also provided supportive evidence of construct validity. The reassurance on
the validity of the four construct domains identified was also supported from the
complimentary results of the KOL interviews conducted. In essence, the goal of
conducting the KOL interviews was to identify the key aspects (or attributes) of the
construct domain (MacKenzie et al., 2011). Greater discussion on the construct
validation investigation will be presented in the discussion section of Chapter 6.
The 47-item QoDOS instrument has been developed using a step-wise and
systematic scientific approach. Statistical validity and integrity were paramount in
the instrument development. The research approach comprised qualitative and
quantitative components which have been described in detail and which resulted in
the duly validated instrument that is now available for final stage psychometric
evaluation.
130
SUMMARY • The post content validation evaluation QoDOS (Version 2) containing 76
decision-making items was used in this stage of the research. The QoDOS
(Version 2) contained questions relating to the decision-making approach
employed by “Organisations” (Regulatory Agencies and Pharmaceutical
Industry) and that used by the “Individual” in the organisations
• One hundred and twenty experienced decision-makers from regulatory
agencies, pharmaceutical companies, CROs and Academia (n=2) completed
the QoDOS (Version 2) decision-making electronic questionnaire
• The Survey Monkey package was used in the issuance of the surveys,
collection and management of the results which provided comparative
insights into decision-making at an Individual and an Organisational level
• The statistical analyses results inferred the presence of differing construct
dimensions between the decision-making approaches used by Organisations
versus that used by Individuals
• Comparative insights were obtained on the decision-making approaches and
influenced of organisations.
• Comparative insights were obtained on the variance of decision-making
within the Regulatory Agency, Pharmaceutical Companies and CROs
• Insights were gained into the decision-making approaches and influences of
individuals
• Potential gaps in the education and training and development needs of
individuals and organisations were identified
• A detailed quantitative response analysis was generated for each of the 76-
item questions contained within the developmental questionnaire
• Factor analysis investigation was performed on the 76-item QoDOS (Version
2) developmental instrument
• Successful factor analysis and item reduction was performed on the 35
organisational items leading to a reduced set of 23 variables
• Successful factor analysis and item reduction was performed on the 41
individual items leading to a reduced data set of 24 variables
• Four additional items (two organisational and two individual) from the
original 76-items were re-instated to post-factor analysis items listings
131
• Two behavioural domain constructs were identified for the Organisational
items and these related to decision-making approach and culture
• Two behavioural domain constructs were identified for the Individual items
and these related to decision-making style and competence
• The 47-item QoDOS instrument was established.
132
CHAPTER 6
Reliability and Construct Validation of QoDOS
and
Hallmarks of Good Decision-Making Practice
133
INTRODUCTION The factor analysis performed on the QoDOS developmental instrument was
predicated on the belief that a battery of decision-making item tests could be
described in terms of a smaller number of underlying factors. The underlying
decision-making constructs caused a number of observable manifestations, which are
captured within the QoDOS items. The construct domain dimensions revealed by the
factor analysis were not directly observable from the data but rather were inferred
from the patterns within the results that emerged. As a result, the 47-item QoDOS
instrument yielded 4 construct domains, two relating to the organisation (Approach
and Culture) and two to the individual (Competence and Style).
The next stage, after factor analysis was the testing, assessment and establishment of
the reliability and construct validation of the 47-item QoDOS instrument using
statistical analyses. The reliability and construct validity testing was done using 78
individuals from regulatory agencies and the pharmaceutical healthcare arena.
Statistical analyses formed the basis of the construct validation and assessed the
correlations between the QoDOS construct domains (latent variables). The data
provided extra quantitative insights into the decision-making approaches from the
perspective of the individual and the organisations in the cohort and was
complimentary to the additional research sample results detailed in Chapter 5.
Following the conduct of the assessment of construct validity and reliability, research
was conducted into the identification and qualification of the Hallmarks of good
decision-making practice.
METHODS The final 47-item version of the QoDOS instrument contained 23 organisational and
24 individual items and was tested for reliability and construct validity. The QoDOS
instrument was sent to the study participants using the Survey Monkey online
questionnaire survey tool as described previously in Chapter 2. Each prospective
participant was provided with background information on the research project and
given assurance on the confidentiality on all research related matters.
134
The 78 respondents provided their answers to each of the 47-item questions using a
Likert 5-response option scale. Both the Survey Monkey functionality and Excel
were used in the quantitative analysis of this component of the research. An Excel
database was employed to capture the data returns from each of the research
participants. The functionality of the Excel database facilitated the data management
and interpretation of the results. The combined Survey Monkey and Excel
functionality also allowed the generation of information in various result formats.
The data were also analysed using the SPSS version 20 to examine the reliability and
construct validity of the QoDOS. The reliability and construct validity were tested
using standard statistical techniques including the Principal Component Analysis
(PCA), Cronbach’s alpha, Split-Half, Parallel and Gutmann testing for reliability
accompanied by ICC coefficient and Spearman’s 2-tailed correlation statistics. KMO
and Bartlett’s Sphericity testing and correlation statistics were also performed. A
Multi-Trait Multi-Method (MTMM) table was generated capturing comparative
statistical methodologies and results obtained in this reliability and validity
examination stage. Excel was used to compute some of the quantitative output and
generation of graphical outputs.
An extra research arm exercise was conducted to identify the “Hallmarks of good
decision-making practice”. This involved ranking a set of ten decision-making items
in order of perceived preference. The hallmarks questionnaire was presented as an
addendum to the QoDOS instrument questionnaire and was completed by a research
sample of 78 senior decision-makers from regulatory agencies and the
pharmaceutical and healthcare area.
RESULTS The results obtained from the research sample provided comparative quantitative
information on the decision-making approaches and influences from the perspective
of the organisation and the individual. The results presented evidence to support the
successful construct validation of the instrument and the underlying dimensions. The
construct validation results are presented for the composite 23-item organisational
and the 24-item individual decision-making scales followed by the results for each of
the two latent sub-components contained within each scale. The results are presented
135
in two sections that relate to the Construct validation (n=78 representing a 100%
response rate) and to the hallmarks of good decision-making practices (n=78
representing a 100% response rate).
Organisational Level Influences: The 23 organisational items, which comprised the
two organisational level decision-making influence dimensions namely Approach
and Culture were tested for construct validity (Table 6.1). The statistical results for
the Cronbach’s alpha, KMO and Bartlett’s test for the 23-item organisational level
influences in the two constructs were determined. The Cronbach’s alpha level,
indicative of reliability calculated for the 23 item instrument constructs was 0.746
which was acceptable/good. The KMO value of 0.794 was also acceptable. The
Bartlett’s test of Sphericity was 231 and the ICC was 0.746 (good). These results
demonstrated adequate sample size for the analysis and good reliability from the
Cronbach’s alpha and ICC results obtained.
Table 6.1: Organisational level influences Organisational Decision-Making Approach Dimension (12 items)
Organisational Decision-Making Culture Dimension (11 items)
1. My organisation evaluates the impact of the decisions it makes
2. My organisation’s decision-making approach is transparent
3. My organisation’s decision-making is consistent
4. My company uses a structured approach in its decision-making
5. My organisation’s decision-making is influenced by external stakeholder’s demands
6. My organisation qualifies the probability of success in its decision-making
7. My organisation quantifies the probability of success in its decision-making
8. My organisation is open to using better alternatives in its decision-making
9. My organisation encourages innovative decision-making
10. My organisation considers uncertainties in relation to its decision-making
11. My organisation provides training in the science of decision-making
12. My organisation re-examines its decision-making as new information becomes available
1 My organisation’s decision-making is influenced by company politics
2 My organisation has suffered a negative outcome due to slow decision-making
3 My organisation’s culture has resulted in its inability to make a decision.
4 In my organisation’s decision-making, it makes the same mistakes as made in the past
5 My organisation’s decision-making is influenced by the vested interest of individuals
6 My organisation underestimates problems which adversely impacts its own decision-making
7 My organisation continues with projects which should be terminated at an earlier stage
8 My organisation’s decision-making is influenced by competitors
9 My organisation’s decision-making is influenced by incentives or penalty payments
10 My organisation effectively communicates the decisions it makes
11 My organisation provides clear and unambiguous instructions for decision- making
136
Organisational Level Influence Items: Decision-Making Approach Construct
Descriptive statistics, reliability testing and correlation testing on the 12 items in the
organisational decision-making construct were performed. A tabular summary of the
reliability and correlation testing on the 12 items is presented in Table 6.2.
The Cronbach’s alpha level indicative of reliability, calculated for the 12 item
construct was 0.731 (0.749 based on standardised items) which was “good”. The
KMO value of 0.726 was also acceptable / “strong” result. The Bartlett’s test result
was 55. The average ICC was 0.790. These results demonstrated adequate sample
size for the analysis and good reliability from Cronbach’s alpha, the other reliability
tests and ICC results obtained.
Table 6.2: Summary results for the statistical testing performed on the 12 organisational approach items
Reliability
Assessment (r)
Intraclass Correlation
Coefficient (ICC)
KMO
(Sampling
Adequacy)
Spearman’s 2-tailed
correlation
Cronbach’s α: 0.821 (0.786 std)
0.790 (avg. measure 95% CI p=.0001)
0.754 YES
Split-half: 0.734 / 0.51
0.790 (avg. measure 95% CI p=.0001)
Parallel: 0.790 (0.794 unbiased)
0.790 (avg. measure 95% CI p=.0001)
Guttman Split-Half Coefficient 0.773
0.790
The nonparametric Spearman’s correlation matrix generated for the 12 organisational
approach variables is presented in Table 6.3. The data demonstrated the inter-
correlation relationship of each of the items (positive and negative as testing was
performed using a 2-tailed test). The results showed the statistical associations
between any two of the variables. The V1-V12 items are as numbered in Table 6.1.
137
Table 6.3: Spearman’s correlation inter-item correlation matrix for 12 organisational approach items V1 V2 V3 V4 V5 V6 V7 V8 V9 V10 V11 V12
V1 My organisation evaluates the impact of the decisions it
makes
1.00
V2.My organisation’s decision-making approach is transparent 0.209* 1.00
V3 My organisation’s decision-making is consistent 0.125 0.13 1.00
V4 My company uses a structured approach in its decision-
making
0.057 0.11 -.117 1.00
V5 My organisation’s decision-making is influenced by external
stakeholder’s demands
0.188 .137 .042 0.45 1.00
V6 My organisation qualifies the probability of success in its
decision- making
0.134 0.155 0.131 0.162 0.185 1.00
V7 My organisation quantifies the probability of success in its
decision-making
0.175 0.134 0.177 .058 0.153 0.644 1.00
V8 My organisation is open to using better alternatives in its
decision-making
0.254** 0.450** 0.006 .02** .252** 0.106 .139 1.00
V9 My organisation encourages innovative decision-making 0.211** 0.351** -.052 -.026 .120** -.163 0.046* 0.336 1.00
V10 My organisation considers uncertainties in relation to its
decision-making
0.219* 0.290** -.044 -.002 .194** 0.335 0.281* 0.216** 0.311 1.00
V11 My organisation provides training in the science of
decision-making
0.211* 0.061* 0.54 -.092 0.205 0.275 0.331* 0.184 0.062 0.392 1.00
V12 My organisation re-examines its decision-making as new
information becomes available
0.223* 0.255** -.157 .098 .157** 0.181 0.061* 0.322** 0.322** 0.310 0.157 1.00
* Correlation is significant at the 0.01 level ** Correlation is significant at the 0.05 level
138
Organisational Level Influence Item: Decision-Making Culture Construct Results
Descriptive statistics, reliability testing and correlation testing were performed on the 11
items in the organisational decision-making approach construct. A tabular summary of
the reliability and correlation testing and results on the 11 items are presented in Table
6.4.
The Cronbach’s alpha level indicative of reliability was calculated for the 11
organisational culture construct was 0.741 (and 0.719 based on standardised items)
which was “good”. The KMO value of 0.846 was also acceptable / “very strong” result.
The Bartlett’s test result was 55 and the average ICC 0.743. These results demonstrated
adequate sample size for the analysis and good reliability from Cronbach’s alpha, the
other reliability tests and ICC results obtained.
Table 6.4: Summary results for the statistical testing performed on the 11 “culture” items Reliability
Assessment (r)
Intraclass Correlation
Coefficient (ICC)
KMO (Sampling
Adequacy)
Spearman’s 2-
tailed correlation
Cronbach’s α: 0.743 (0.719 std)
0.743 (avg. measure 95% CI p=.0001)
0.846 YES
Split-half: 0.802 / 0.06
0.743 (avg. measure 95% CI p=.0001)
Parallel: 0.743 (0.748 unbiased)
0.731 (avg. measure 95% CI p=.0001)
Guttman Split Half Coefficient 0.469
The nonparametric Spearman’s correlation matrix generated for the 11 organisational
construct variables is presented in Table 6.5. The data demonstrated the inter-correlation
relationship of each of the items (positive and negative as testing was performed using a
2 tailed test). The results showed the statistical associations between any two of the
variables. The V1-V11 items are as numbered in Table 6.1.
139
Table 6.5: Spearman’s correlation inter-item correlation matrix for 11 organisational culture items V1 V2 V3 V4 V5 V6 V7 V8 V9 V10 V11
V1 : My organisation’s decision-making is influenced
by company politics
1
V2: My organisation has suffered a negative outcome
due to slow decision-making
.537 1
V3: My organisation’s culture has resulted in its
inability to make a decision.
.296** .446 1
V4: In my organisation’s decision-making, it makes
the same mistakes as made in the past
.266* .279** .271 1
V5 My organisation’s decision-making is influenced
by vested interest of individuals
.291** .197** .293** .653** 1
V6 My organisation underestimates problems which
adversely impacts its own decision-making
.395** .320* .287 .321 .202* 1
V7 My organisation continues with projects which
should be terminated at an earlier stage
.307 .281** .202 .379 .286** .566** 1
V8 My organisation’s decision-making is influenced
by competitors
.324** .422** .207 .324** .277** .413* .507** 1
V9 My organisation’s decision-making is influenced
by incentives or penalty payments
.309** .330** .202 .312** .196** .520* .449** .513** 1
V10 My organisation effectively communicates the
decisions it makes
-.24** -.41** -.211 .288** .005** -.197* .073** .161** -.118 1
V11:My organisation provides clear and unambiguous
instructions for decision-making
.378 .154 .202 .392 .482 .353* .284 .309 .301 .232 1
* Correlation is significant at the 0.01 level ** Correlation is significant at the 0.05 level
140
Individual Level Influences Results
The two individual level decision-making influence dimensions which were reported
post factor-analysis were tested for construct validity (Table 6.6).
The statistical results for Cronbach’s alpha, KMO and Bartlett’s test for the 24 item
individual level influences in the two constructs were determined: the Cronbach’s
alpha calculated for the 24 item instrument constructs was 0.785 which was “good”.
The KMO value of 0.751 was also acceptable. The Bartlett’s test was 276. The
average measure ICC was 0.785. These results demonstrated adequate sample size
for the analysis and good reliability from the Cronbach’s alpha and ICC results
obtained.
Table 6.6: Individual level influences Individual Decision-Making
Competence Dimension (14 items)
Individual Decision-Making
Style Dimension (10 items)
1. I quantify the probability of success in my decision-making
2. I qualify the probability of success in my decision-making
3. I understand the context of the decision I am being asked to make
4. I consider uncertainty and unknowns in my decision-making approach
5. I present contingencies or achievable options as part of my decision-making
6. My decision-making is consistent 7. My decision-making approach is
transparent 8. I use a structured approach in my decision-
making 9. My decision-making is knowledge based 10. I understand the importance of the
decisions I make 11. My professional experience is important
when having to make challenging decisions.
12. I generate a SWOT (strengths, weaknesses, opportunities, threats ) analysis in my decision-making
13. I receive training in the science of decision-making
14. I use intuition or “gut-feeling” in my decision-making
1. My procrastination has resulted in a negative outcome
2. I have experienced “paralysis by analysis” caused by my slow decision-making
3. Emotion is part of my decision-making 4. I have experienced a negative outcome
by a decision not being made 5. In my decision-making, I make the same
mistakes as made in the past 6. Recent or dramatic events greatly
impact my decision-making 7. My decision-making could be improved
by assigning weights 8. I underestimate problems which
adversely impact my decision-making 9. I continue with projects which should be
terminated at an earlier stage 10. I feel that I could make better quality
decisions
141
Individual Level Influence Item: Decision-Making Competence Construct
Descriptive statistics, reliability testing and correlation testing on the 14 items in the
individual decision-making competence construct were performed. A tabular
summary of the reliability and correlation testing performed on the 14 items is
presented in Table 6.7.
The Cronbach’s alpha level, for the 14 item construct was 0.731 (and 0.749 based on
standardised items) which was “good”. The KMO value of 0.726 was also an
acceptable/good result. The Bartlett’s test result was 55. The average ICC was 0.743
(good). These results demonstrated adequate sample size for the analysis and good
reliability from Cronbach’s alpha, the other reliability tests and ICC results obtained.
Table 6.7: Summary results for the statistical testing performed on the 14 “competence” items
Reliability
Assessment (r)
Intraclass Correlation
Coefficient (ICC)
KMO (Sampling
Adequacy)
Spearman’s 2-tailed
correlation
Cronbach’s α:
0.731 (0.749
std)
0.731 (avg. measure 95% CI
p=.0001)
0.726 YES
Split-half: 0.517
/ 0.739
0.731 (avg. measure 95% CI
p=.0001)
Parallel: 0.731
(unbiased .736)
0.731 (avg. measure 95% CI
p=.0001)
The nonparametric Spearman’s correlation matrix generated for the 14 individual
decision-making influence variables is presented in Table 6.8. The data demonstrated
the inter-correlation relationship for each of the items (positive and negative as
testing was performed using a 2-tailed test). The results showed the statistical
associations between any two of the variables. The V1-V14 items are as numbered
in Table 6.8.
142
Table 6.8: Spearman’s correlation inter-item correlation matrix for 14 individual competence items V1 V2 V3 V4 V5 V6 V7 V8 V9 V10 V11 V12 V13 V14
V1: I quantify the probability of success in my decision-making 1
V2: I qualify the probability of success in my decision-making .209* 1
V3 I understand the context of the decision I am being asked to
make
-.125 .13 1
V4 I consider uncertainty and unknowns in my decision-making
approach
.057 .11 .117 1
V5: I present contingencies or achievable options as part of my
decision-making
.188* .137 ,042 .045* 1
V6 My decision-making is consistent .134 .155 .131 .162 .185 1
V7: My decision-making approach is transparent .175 .134 .177 .058 .153 .644 1
V8: I use a structured approach in my decision-making .254** -.450** .006 ,020** .252** .106 .139** 1
V9: My decision-making is knowledge based .211* -.351** -0.52 -.026* .120** -.163 .046* .336** 1
V10 I understand the importance of the decisions I make .219* .290** -.044 -.020* .194** -.335 .281* .216** .311 1
V11 My professional experience is important when having to
make challenging decisions.
.211* .061 .054 .092* .205 .275 .331* .184 .062 .392* 1
V12 I generate a SWOT (strengths, weaknesses, opportunities,
threats ) analysis in my decision-making
.223* .255** -.157 .098* .157** .181 .061* .322** -.323 .310* .157 1
V13 I receive training in the science of decision-making .154 .280* .262* -.222 .118* .114 .81 .371* .350 .382 .103* .225 1
V14: I use intuition or “gut-feeling” in my decision-making .323* .258 -.085 .005* .144 .158 .107* .334 .196 .303* .187 .384 .257* 1
* Correlation is significant at the 0.01 level ** Correlation is significant at the 0.05 level
143
Individual Level Influence Item: Decision-Making Style Construct Results
The Cronbach’s alpha calculated for the ten item construct was 0.731 (and 0.749
based on standardised items) which was “good”. The KMO value of 0.726 was also
an acceptable/good result. The Bartlett’s test result was 55. The average ICC was
0.743 (good). These results demonstrated adequate sample size for the analysis and
good reliability and from Cronbach’s alpha, the other reliability tests and ICC results
obtained.
Table 6.9: Summary results for the statistical testing performed on the 10 items Reliability
Assessment (r)
Intraclass Correlation
Coefficient (ICC)
KMO (Sampling
Adequacy)
Spearman’s 2-
tailed correlation
Cronbach’s α: 0.822 (0.825 std)
0.822 (avg. measure 95% CI p=.0001)
0.832 YES
Split-half: 0.758 / 0.693
0.822 (avg. measure 95% CI p=.0001)
Parallel: 0.822 (unbiased .825)
0.822 (avg. measure 95% CI p=.0001)
The nonparametric Spearman’s correlation matrix generated for the 10 individual
style variables is presented in Table 6.9. The data demonstrated the inter-correlation
relationship for each of the items (positive and negative as testing was performed
using a 2-tailed test). The results showed the statistical associations between any two
of the variables. The V1-V10 items are as numbered in Table 6.10.
144
Table 6.10: Spearman’s correlation inter-item correlation matrix for the individual style items V1 V2 V3 V4 V5 V6 V7 V8 V9 V10
V1: My procrastination has resulted in a negative outcome 1 V2 I have experienced “paralysis by analysis” caused by my
slow decision-making
.177 1
V3 Emotion is part of my decision-making .351** .363** 1 V4 I have experienced a negative outcome by a decision not
being made
.350** .357** .680** 1
V5 In my decision-making, I make the same mistakes as made
in the past
.226* .366** .477** .517* 1
V6 Recent or dramatic events greatly impact my decision-
making
.178 .155 .311** .291* .235 1
V7 My decision-making could be improved by assigning
weights
.126 .334** .382** ,364* .296** .335** 1
V8: I underestimate problems which adversely impact my
decision-making
.254** .128 .380** .437** .290 .233** .346** 1
V9: I continue with projects which should be terminated at an
earlier stage .274** .141 .275** .212** .309 .471** .226** .227 1
V10: I feel that I could make better quality decisions .332** .311** .383** .424** .410** .312** .305** .314** .416** 1
* Correlation is significant at the 0.01 level ** Correlation is significant at the 0.05 level
145
The MTMM matrix is an established technique for looking at convergent and
discriminant validation simultaneously (Streiner and Norman, 2008; Trochim, 2006).
The matrix facilitates the interpretation of construct results and presents the pattern of
observation results across the constructs tested using the different statistical
methodologies employed. The MTMM matrix generated from the different statistical
test methods used in the QoDOS construct validation is presented in Table 6.11. The
matrix pattern demonstrates the convergent nature of construct results obtained with
high values for Cronbach’s alpha and ICC reliability of the individual measures across
all four constructs using the “homotrait–hetromethod” correlations. The matrix
graphically demonstrates that the internal consistency measured by Cronbach’s α was >
0.73 for all the four construct scales. The ICC was also >0.73 for all four constructs. In
addition, the discriminatory nature of the testing is evident from the low correlation
results across the inter-item correlations throughout the four different constructs.
Table 6.11: Multi-Trait Multi-Method for QoDOS construct validity ODMA ODMC IDMC IDMS
Cronbach’s α 0.786
ICC 0.790 0.743
Parallel reliability 0.793 0.743 0.731
Inter-item Covariances
(mean)
0.284 0.743 0.731 0.822
Inter-item correlations (mean) 0.250 0.253 0.731 0.832
Spearman-Brown Coefficient
(Split-half)
0.65 (equal)
0.79 (unequal)
0.189 0.132 0.822
0.62 (equal)
0.62 (unequal)
0.176 0.279
0.58 (equal)
0.58(equal)
0.320
0.76 (equal)
0.76 (unequal)
ODMA = Organisational decision-making approach, ODMC = Organisational decision- making culture
IDMC = Individual decision-making competence IDMS = Individual decision-making style
146
Additional evidence of validity was demonstrated graphically from of Box-and-Whisker
profiles generated as part of the quantitative analyses.
Quantitative Results: Organisation and Individual Related Item Responses
The data from the 78-person research sample provided quantitative insights into the
decision-making approaches from the perspective of the individual and the organisations
and was complimentary to the 120 person research sample results detailed in Chapter 5.
The results allowed a quantification of the Likert scale ratings for each questionnaire
item. In addition, it was possible to separate the composite results into two distinct
categories: those responses which were answered from the Organisational perspective
and those which were responded to from the perspective of the Individual.
The results provided insight of differing construct dimensions between decision-making
influences and behaviours for Organisations and that of Individuals. The results also
showed the discriminatory nature of the organisational and individual findings. Using a
‘Box-and-Whisker’ plot technique, a graphical comparison of the results for each of the
four constructs was generated. The plot graphically describes the shape and
characteristics of the distribution of the data from the QoDOS component construct
analyses. The length of the box corresponds to the interquartile range (IQR) which is the
difference (measure of dispersion) between the 75% and 25% percentile. The plot shows
the range in distribution of responses for each construct. The median line (green/purple
interface) describes the central tendency of the scores. The differing distribution of the
results for each of the four constructs is shown in the Box-and-Whisker plot presented in
Figure 6.1. The plot also allows for the organisational decision-making approach
(ODMA) to be compared with the organisation decision-making-culture (ODMC) and
for the Individual decision-making competence (IDMC) to be compared with Individual
decision-making style (IDMS). In the plot of the QoDOS constructs, the length of the
box tells us the spread or variability of the results for each of the four constructs. The
range of results is shown by the length of the whiskers. The results show that the ODMS
presents a symmetrical distribution within the IQR. For the ODMA, IDMC and IDMS
results, there is a non-symmetrical distribution and the medians are not in the centre of
147
the IQR boxes. These indicate the ‘skewness’ of the results. The IDMS results with a
median that is closer to the bottom of the box than the top, demonstrates ‘positively
skewed’ data. For The ODMA and the IDMC, the median is closer to the top and shows
“negatively skewed” data.
Figure 6.1: Box-and-Whisker plot of QoDOS construct result loadings’ distribution
The Box-and-Whisker comparisons of the four plots indicate the range and spread and
discriminatory patterns of results for each of the constructs.
The construct investigation results of the 78-person research sample provided further
insight into the decision-making approach, behaviours and influences from the
perspective of the individual and their organisation. In addition, to the analyses
performed on the composite sample, each component item of the questionnaire for 23
organisational items and the 24 individual items was analysed. A selection of four of the
organisational item response results and four individual related item response results are
presented in Figures 6.2 - 6.9 respectively.
0
100
200
300
400
500
600
700
ODMA ODMS IDMC IDMS
Res
pons
es
Constructs
148
The results obtained infer that a structured approach to decision-making is not used
routinely in 37 % (not at all /sometimes) of decision-making exercises (Figure 6.2). This
37% level and especially the 12% ‘not at all’ is surprising and infers that there is the
potential for improvement in the organisational decision-making and promotion of a
systematic or framework approach for quality decision-making.
Figure: 6.2: My organisation uses a structured approach in its decision-making
Figure 6.3: My organisation quantifies the probability of success in its decision-making
The strategy of trying to quantify the probability of success (Figure 6.3) appears to be
the routine approach in only about 5% of situations and is performed in around 45% of
other situations on a “ frequently/often” basis and ‘not at all’ in 11% of cases. This
result is something of an enigma as it infers that decision-makers are not trying to
0%
5%
10%
15%
20%
25%
30%
Response Options
Not at all Sometimes Frequently Often Always
0% 5%
10% 15% 20% 25% 30% 35% 40% 45%
Response Options
Not at all Sometimes Frequently Often Always
Figure: 5.6: Selection of some O
rganisational item related responses
149
quantify either the probability of success or by inference the probability of failure and
associated risk factors. The results could be interpreted as indicating a naivety of both
good business and decision-making. If the 12% cohort is not taking success probability
into account then it is unlikely that they are considering additional factors both internal
and external that could influence or impact the decision. The use of a systematic
approach in this 11% cohort is questionable.
It would appear that re-examination of decision-making as new information is received
(Figure 6.4) only on occurs a “sometimes” basis around 38% and may not occur in some
rare exceptions (<5%). The results could infer that re-evaluation is occurring on a
routine basis (often/always) in at least 35% of cases but also means there is room for an
improved approach.
Figure 6.4: My organisation re-examines its decision-making as new information becomes available
The culture of the organisation was seen to be an influencing factor in decision-making
with only 27% of responses indicating that the culture did not impact at all in its ability
to make a decision (Figure 6.5). These results imply that the culture of the organisation
is a key decision-driver.
0%
5%
10%
15%
20%
25%
30%
35%
40%
Response Options
Not at all
Sometimes
Frequently
Often
Always
150
Figure 6.5: My organisation’s culture has resulted in its inability to make a decision
In regard to the potential to make better quality decision, almost 95% of the response
indicated that individuals felt that their decision-making could be improved (Figure 6.6).
Figure 6.6: I feel that I could make better quality decisions
The results on the use of intuition or “gut-feeling” showed that its usage is quite
common and that less than 10% of individuals would appear not to use it in their
decision-making approach (Figure 6.7). This is an interesting result when one considers
again the evidence-driven environment of medicines development, although it could be
argued that intuition is taking evidence based outcomes into account implicitly.
0%
5%
10%
15%
20%
25%
30%
35%
40%
Response Options
Not at all Sometimes Frequently Often Always
0%
5%
10%
15%
20%
25%
30%
35%
40%
45%
50%
Response Options
Not at all
Sometimes
Frequently
Often
Always
151
Figure 6.7: I use intuition or “gut-feeling” in my decision-making
More than 35% of study participants indicated that they had not received any training
in the science of decision-making (Figure 6.8). Only 15% of persons advise that they
received training on an “often” (regular) basis (Figure 6.8). This is an interesting and
disappointing finding when one considers the increased industry and agency support
for a more structured approach to decision-making and the availability and usage of
qualitative and quantitative decision-making tools.
Figure 6.8: I receive training in the science of decision-making
The well established technique of using a SWOT analysis in decision-making appears
to be never considered by 12% of individuals. Another 35% only use the SWOT on a
“sometimes” basis. This could infer that the individuals surveyed are not familiar with
the SWOT tool and this might link to the results relating to the training offered and
received (Figure 6.9).
0% 5%
10% 15% 20% 25% 30% 35% 40% 45%
Response Options
Not at all Sometimes Frequently Often Always
0% 5%
10% 15% 20% 25% 30% 35% 40% 45%
Response Options
Not at all Sometimes Frequently Often Always
152
Figure 6.9: I generate a SWOT analysis in my decision-making
Organisation Versus Individual Analysis
A comparative analysis of the decision-making approach of the Organisation versus that
of the Individual was performed. The results were paired on the basis of
positive/affirmative and negative responses received for each of the QoDOS questions.
The results provided insights into the differing importance and approach of both groups.
A sample of four comparisons is presented in Figures 6.10 – 6.13.
The results indicate that a structured approach is employed more at an individual level
(60%) than at the organisational level (35%) (Figure 6.10).
Figure 6.10: Use of a structured approach is used in decision-making
0%
5%
10%
15%
20%
25%
30%
35%
40%
Response Options
Not at all Sometimes Frequently Often Always
Affirmative
Affirmative
Negative
Negative
0
10
20
30
40
50
60
70
Organisation Individual
% R
espo
nses
153
In regard to quantifying the probability of success in decision-making, the results
inferred that less quantification was performed by organisations as compared to the
approach by persons at an individual level (Figure 6.11). This could relate to factors
such as a person being more accountable at a micro-level for the decisions they make as
compared to the organisation on a macro-level, or indeed, their perception of the
situation.
Figure 6:11: Quantification of the probability of success in decision-making by the organisation and the individual
The research into training in the science of decision-making showed that only 15% of
individuals within the research sample had received training in ‘decision-making’ which
was similar to the percentage of organisations that had provided training in decision-
making (Figure 6.12).
Figure 6.12: Training in the science of decision-making
Affirmative
Affirmative
Negative
Negative
0
10
20
30
40
50
60
70
Organisation Individual
% R
espo
nses
Affirmative Affirmative
Negative Negative
0
10
20
30
40
50
Organisation Individual
% R
espo
nses
154
Transparency in decision-making showed that there was more transparency in the
approach of the organisation compared with that of the individual (Figure 6.13). This
could be as a result of the widespread usage of defined work practices and quality
management systems, Standard Operating Procedures (SOPs), templates, decision-
analysis tools within many organisations. The results also infer that a high level of
subjective non-structured approaches may be in use at the level of the individual.
Figure 6.13: Transparency in decision-making approach
The comparative analyses revealed that QoDOS was able to differentiate the decision-
making behaviours of organisations from that of the individual. It also provided
additional insights into the weighting or relative importance of decision-making factors
from the perspective of both groups.
Affirmative
Affirmative
Negative
Negative
0
10
20
30
40
50
60
70
Organisation Individual
% R
espo
nses
155
Hallmarks of Good Decision-Making Practice
The qualitative research into decision-making approaches of the individual and the
organisation resulted in the identification of 19 main decision-making themes:
1. Quality and validity of data
2. Time considerations
3. Organisational, hierarchical and cultural influences
4. Analytical and logical approach
5. Qualification and experience in previous decision-making
6. Subjective and personal considerations
7. Political, financial, competitor and reward influences
8. Precedents for similar previous decisions
9. Perpetuating previous decision-making mistakes
10. Plunging in or procrastination with decision-making
11. Clear understanding or lack of understanding of the decision in question
12. Overconfidence in own judgement
13. Group successes and group failures
14. SWOT and alternate outcome planning in decision-making
15. Impact analyses of decisions
16. Decision-making audit trail
17. Education and awareness of evolving decision-making techniques
18. Individual versus Corporate decision-making
19. Quantitative frameworks.
It was hypothesised that the 19 emergent decision-making themes could also provide
insight into the ‘Hallmarks of good decision-making’, so these 19 themes were reviewed
and distilled into 10 good decision-making criteria. These were then mapped against the
47-items in the final version of the QoDOS (Table 6.12).
156
Table 6.12: Mapping of the QoDOS items to the hallmarks of good decision-making practice.
Good decision-making practice hallmark QoDOS item number
mapped to each hallmark
1. Employ scientific rigour and understand the
decision context
30,31
2. Apply knowledge and experience 6,9,11,24,27,33,35,37,47
3. Examine the integrity of information for
validation and confidence in the decision
18
4. Use an objective approach and maintain
awareness of your biases and preferences
36,38,39,43,45,46
5. Consider uncertainty and examine alternative
solutions
8,10,26,28
6. Assign values and relative importance to
decision criteria
7,34,44
7. Re-evaluate as new information becomes
available
12
8. Evaluate both internal and external influences 5,13,14,15, 17, 19, 20, 21,40,42
9. Apply a structured approach to aid
transparency and record trail
2,3,4,16, 25,29,32,41
10. Perform impact analysis and effectively
communicate the basis of the decision
1,22,23
Validation of The Hallmarks
In order to provide further validity to the list of ten hallmarks, the research sample of 78
international senior industry and regulatory agency decision-makers were asked to rank
the “relative importance” of the hallmarks. They ranked the ten hallmarks in order of
what they perceived were the most important hallmarks to the least important hallmarks
on a scale of 1 to 10 (1 being the most important and 10 being the least important). They
were provided with appropriate notice and background on the research aim of ranking
the hallmarks and with assurance of confidentiality.
157
Ranking of The 10 Hallmarks of Good Decision-Making Practice
The composite ranking order of the ten hallmarks was:
1st Employ scientific rigour and understand the decision context
2nd Apply knowledge and experience
3rd Examine the integrity of information for validation and confidence in
the decision
4th Apply a structured approach to aid transparency and record trail
5th Use an objective approach and maintain awareness of your biases and
preferences
6th Re-evaluate as new information becomes available
7th Evaluate both internal and external influences
8th Assign values and relative importance to decision criteria
9th Perform impact analysis and effectively communicate the basis of the
decision
10th Consider uncertainty and examine alternative solutions.
The quantified results of the research were analysed and graphical presentations of the
10 hallmarks rating placements generated. The two top-rated items represented the
opinion of the majority of the research sample with regard to the need to employ
scientific rigour and to understand the decision context (24%) with the need to apply
one’s knowledge and experience (22%) in decision-making approach (Figures 6.14-
6.15). The results of the ranking exercise did not demonstrate any one wholly
outstanding decision-making hallmark.
158
Figure 6.14: Employ scientific rigour and understand the decision context (Top rating)
Figure 6.15: Apply knowledge and experience (2nd highest rating)
Application of QoDOS: An immediate application of QoDOS and the emergent
hallmarks of good decision-making is the ability to generate a profile of an individual’s
decision-making approach. The 47 items in QoDOS have been mapped against the 10
0
5
10
15
20
25
1 2 2 4 5 6 7 8 9 10
No
of r
espo
nses
Hallmarks
0
5
10
15
20
25
1 2 2 4 5 6 7 8 9 10
No
of r
espo
nses
Hallmarks
159
hallmarks as presented in Table 6.12. An algorithm has been generated to apply
weightings to each hallmark of good decision-making practice. Each hallmark
component sub-theme has an associated weighting score range of 1-4 (1= sometimes,
2=frequently, 3=often and 4=always). For each hallmark, a theoretical value for best
practice approach on the basis that a good hallmark’s approach should be pursued all of
the time.
For any individual, their responses to the 47 items in the QoDOS instrument can be
mapped to the hallmarks to present a profile of that person’s decision-making approach
using the algorithm above. This approach allows for a person’s profile (for the day on
which it was completed) to be generated from their actual response scores on a
comparative scale. Their response score can be presented on an assessment scale
showing theoretical optimum (maximum) and poor (minimum) profile results. This
profiling allows for an individual to identify their normal approach to decision-making,
their areas of strength in good decision-making practice and importantly, their areas
warranting further attention and development. This profiling which is performed as a
point in time assessment should allow an individual to monitor the changes in their
decision-making approaches over time. An example of an actual profile for one of the
participants in the research is presented in the spider plot in Figure 6.16.
The algorithmic approach to profiling an individual’s decision-making technique using
the QoDOS instrument is an easy to apply technique and should be generalisable outside
of the research sample in which it has been developed. A simple spider-plot charting
technique can be used to generate a profile of the decision-making responses,
developmental areas and to provide a time-course record of the decision-making
approach for a given individual. This graphical representation provides a focus for
identification of gaps and issues to address in a person’s decision-making approach
(Figure 6.16).
The visualisation of an individual’s decision-making profile may also enable better
communication of the profile and of its interpretation. Such visualisation techniques of
160
decision-making outcomes are actively being progressed and their importance is
increasingly being recognised (IMI-EFPIA, 2013a; Walker, 2011).
Figure 6.16: Decision-making profile of an individual
DISCUSSION The QoDOS instrument underwent factor-analysis which yielded four main construct
domains, two relating to organisation level influences i.e. organisational decision-
making approach (ODMA), organisational decision-making culture (ODMC); and two
to individual level influences i.e. individual decision-making competence (IDMC) and
individual level decision-making style (IDMS). The 47-instrument items were grouped
0 5
10 15 20 25 30 35 40
Scientific Rigour
Knowledge & Experience
Integrity of data
Objective and awareness of biases
Alternatives
Assign weightings
Re-evaluate new information
Internal & External influences
Structured approach
Impact analysis
Maximum score Actual QoDoS scores Minimum score
161
into one of the four domains and assessed for appropriate reliability and construct
validity.
Reliability and construct validity testing was performed on the QoDOS instrument and
the four component constructs using statistical methodologies complimented by
additional semi-quantitative techniques. For each of the four construct dimensions,
reliability was tested and demonstrated using several reliability methods including
Cronbach’s alpha and ICC testing. In all four construct investigations, reliability was
shown to be above a Cronbach’s alpha of 0.73 and ICC of > 0.73 in a battery of tests.
The consistency and reproducibility of the reliability finding across time as well as the
different items and measurement methodologies used supported the assertion that
appropriate reliability was observed. The reliability, the internal consistency and the
ICC of the measures observed were also indicative of the homogeneity of the
component items that tapped into each of the four constructs.
Construct validity testing is concerned with how well the results obtained from the use
of a measure fit the theoretical foundations from which it is designed. Construct
validation contains two validity sub-categories (convergent and discriminant validity).
Convergent validity is the degree to which the concepts that should be related
theoretically are interrelated in reality. Discriminant validity is the degree to which
concepts should not be related theoretically and are in fact not interrelated in reality. It is
recognised that the area of construct validation is in itself somewhat theoretical by its
very nature as it involves a latent theoretical aspect of a measure. There are several
challenges associated with construct validation of a new instrument. These include items
such as: the somewhat ethereal definition of what “construct validation” relates to and
how it is suitably demonstrated (Nunnally and Bernstein, 1994; MacKenzie et al., 2011).
There is also the challenge that constructs may have more than one conceptually
distinguishable aspect or sub-dimension which can in itself be confounding. If a
construct is multidimensional, which was the case with the four QoDOS constructs,
then it is important to ensure that the sub-component characteristics are distinctive from
each other (apart from their common theme). There are three major aspects of construct
162
validation: (1) specifying the correct domain of observables related to the construct; (2)
determining the extent to which observables tend to measure the same thing from
empirical research and statistical analyses; (3) performing subsequent individual
difference studies and / or experiments to determine the extent to which supposed
measures of the construct are consistent "best guesses" about the construct (Nunnally
and Bernstein, 1994; Holstein, 2001). Overall, the multi-dimensional approach adopted
in the construct validity evaluation and the triangulation of the complimentary and
supportive validation techniques provided robust evidence of good construct validity of
the QoDOS instrument.
The development of QoDOS also facilitated the investigation into the hallmarks of good
decision-making practice. It enabled the identification and rating of the hallmarks to be
performed which in itself provided additional insights into the establishment of quality
decision-making practice. The resultant top-three messages on best practice were: to use
scientific rigour and ensure one understands the decision context; to apply one’s
knowledge and experience; and to check the integrity of the information provided on
which to make a decision. However, it is also interesting that some items were
considered to be markedly less important in the ranking order. The hallmarks which
received the lowest rank ordering related to: performing an impact analysis; clear and
effective communication of the decision; considerations of uncertainty, unknowns and
examination of alternative solutions or options.
The hallmarks investigation included 78 senior decision-makers from regulatory
agencies and pharmaceutical companies and provided additional insight into their
approach and considerations in decision-making. These insights could be deemed to
warrant further research in this area and to involve a much larger sample to provide
additional validity and generalisability to the hallmark rating results. The ten hallmarks
and their rank-order provide a useful reference to good decision-making practice and
could also be beneficial to a wider audience outside that of the regulatory agencies and
pharmaceutical industry.
163
Overall, the main outcome was that of evaluating the reliability and construct validity of
the QoDOS instrument. Robust and appropriate assessments were performed
demonstrating the successful reliability and construct validity of the QoDOS decision-
making instrument. Additional and complimentary insights were gained on the decision-
making approaches and influences of individuals in the regulatory agencies and
pharmaceutical healthcare arena along with recommendations on good decision-making
practice. The potential of QoDOS to enable better decision-making has been established.
For organisations, the working environment and the shared beliefs and values of the
organisation appeared again to be important dimensions in decision-making. For the
individual, the subjective elements of: professional experience, competence, personal
style and autonomy appeared to influence decision-making.
SUMMARY • The QoDOS instrument that had undergone factor analysis and yielded four
constructs domains was evaluated for reliability and construct validity
• Seventy eight experienced decision-makers from regulatory agencies and
pharmaceutical healthcare companies were involved in this analysis
• SPSS statistical methodologies and Excel were used in the analyses of the
research sample findings. The reliability of each construct domain was above
0.73 and the ICC of each construct domain was above 0.73
• Convergent and discriminatory validity testing was performed and
demonstrated. Quantitative analyses also supported the construct validity
testing performed using the SPSS methodologies
• The quantitative results provided additional insights into the decision-making
influences and approaches of individuals and organisations
• Comparative results were obtained for each of the four constructs. This
enabled a comparative review of both the Organisational Versus the
Individual influences, the intra-organisational influences (Approach and
Culture) and the intra-individual influences (Competence and Style)
164
• Ten hallmarks of good decision-making practice from the investigation into
decision-making approaches of individuals and organisations were identified
and mapped against QoDOS
• The ten hallmarks were ranked in order of perceived importance by a group of
78 senior decision-makers. The top-three ranking items were: (1) Employ
scientific rigour and understand the decision context, (2) Apply knowledge
and experience and (3) Examine the integrity of information for validation and
confidence in the decision
• Profiling and visualisation of an individual’s decision-making approach has
been enabled by the QoDOS instrument.
166
The complexity of today’s pharmaceutical development and regulatory decisions has
created a drive for optimisation of the processes involved. To this end, decision-making
and its quality have become the central focus for the major stakeholders and policy
makers. It is this notion that has fuelled the initiative behind this research.
The qualitative research involved the conduct of interviews with a variety of key opinion
leaders from the European Medicines Agency, national European regulatory agencies,
the international pharmaceutical industry and clinical research organisations. These
interviews generated valuable insights into the decision-making approaches both from
the perspective of the individual and their organisations. The interviews were conducted
until saturation level was achieved at which point no new decision-making themes
emerged. The semi-structured interviews were conducted in an informal environment
and the key opinion leaders were both engaged and supportive. The confidential and
open conversation resulted in valuable insights into their decision-making. In addition,
they identified factors that influenced their decisions and their organisations in which
they were employed. It was appreciated that the panel of interviewees were all
experienced key opinion leaders from the regulatory agencies and industry. For the first
time a number of overarching decision-making factors were identified which have a
prominent impact on the quality of decision-making from the perspective of the
individual and the organisation.
For example, the quality and the validity of the data is a fundamental prerequisite to
making a quality decision. This would ensure that the information that is being used to
make a decision is valid, is as complete as possible and of optimum quality. Decisions
in drug development are made on the basis of information, its analysis and interpretation
and one should question, where did this evidence come from? How do you know the
evidence is reliable? Is it factually correct? Has it been analysed and interpreted
objectively and is it biased?
Another key factor is that of experience and expertise which is directly related to the
competence and confidence in decision-making. Hindsight into previous decision-
167
making and the success and failure of such decisions and their subsequent impact also
have a significant influence. These experiences provide a baseline for potential
outcomes from such decisions and also an appreciation of possible alternative solutions
that may be incorporated into future decision-making tasks. Furthermore, such
experiences give the decision maker confidence in their own ability to make such
decisions. Professional experience and exposure to different challenges are seen as a
valuable asset and part of the development of a quality decision-maker.
The culture of an organisation and its hierarchy is also a driving factor in regard to
decision-making within the organisation. In large pharmaceutical organisations, there
appears to be a defined chain-of-command in how decisions are made. This approach
impacts on the level of autonomy of the decision-makers and results in a formal
escalation of requirements and added bureaucracy in reaching a decision. It could also
be interpreted as stifling an individual’s creativity, diluting accountability in the
decision-making stages leading to the final decision. This means that more time could be
required for a decision to be made and by inference suppresses the possibility for quick
decisions and limits the level of empowerment of people within the organisation. The
difference between regulatory agencies and the pharmaceutical industry is that agencies’
use of committees may result in the decision being made whereas in the industry they
are used to facilitate rather than make the final decision.
Intuition or “gut feeling” is seen as a positive attribute within drug development and the
regulatory review. The use of intuition by an experienced professional appears to
expedite the decision-making process and avoids procrastination. It appears to be a non-
quantifiable skill which is a useful and valuable tool in decision-making. However, it is
not a systematic or structured approach and therefore is not infallible. It may be prone to
prejudices and biases, but if these are taken into account it can be a valuable asset. Drug
development and the regulatory review normally operates in a structured and
standardised manner and therefore it is interesting to appreciate the prominence that has
been given to intuition in decision-making.
168
Finally, while training in the science of decision-making was considered important, there
is a limited amount of training investment by both the regulatory agencies and the
industry. All of the interviewees advised that both they and their organisation would
benefit from training in decision-making. Such training was recommended to be almost
mandatory for decision-makers at a managerial or executive level and ideally should be
incorporated into personal and organisational development plans. Training in best
practice decision-making techniques, awareness of the tools to assist with routine best
practices and frameworks would help in different functions of the organisation. In
addition, training was perceived as developing the competence, capability and
confidence in decision-making.
At the level of the individual, the main confirmatory finding of the qualitative
investigation was the presence of a strong subjective element or style in decision-
making. The other factors included competence based on professional experience,
education and training, the ability to focus on the decision to be made and awareness of
personal biases. The presence of additional extrinsic organisational factors such as the
size of the organisation, the level of empowerment, autonomy and accountability given
to the person also are factors to be considered.
In terms of factors influencing organisational decision-making one should consider the
size, the time/cost, the culture, decision-making hierarchy, internal and external political
aspects, vested interests of individuals, competitor status and territorial tendencies.
Additional factors include, the organisation’s approach to marketing, whether current
projects requiring a decision originated from within or outside the organisation and its
willingness to embrace new technologies.
It was observed that in smaller organisations and within the regulatory agencies, there
was some evidence that decisions are made more rapidly than in larger ones. This
appears to be related to the increased responsibility and demand on individuals to make
decisions sooner rather than later. There appears to be less time/cost tolerance for
smaller pharmaceutical organisations and within regulatory agencies compared to larger
169
organisations. Another insight was that different decision-making approaches occur
within the functional groups of the same organisation.
The qualitative investigation resulted in the identification and consolidation of decision-
making themes into a developmental generic instrument to be used for assessing the
quality of decision-making. The prototype instrument was subjected to a structured and
systematic development followed by content validity evaluation by an expert panel. The
consensus of the panel was that the generic development tool was fit-for-purpose and
appropriate to progress to further psychometric testing.
The quantitative study recruited participants from several EU countries, the United
States and China. Ninety-four decision-making themes emerged from the qualitative
phase of the research and these formed the basis for the development of the QoDOS
instrument. The combination of the qualitative components supported and complimented
by the quantitative methodologies, provided confidence in the robustness and fit-for-
purpose evolution of the developmental instrument. The instrument items went through
several stages of refinement resulting in a final 47-item version of the instrument. The
instrument demonstrated good reliability and validity and these favourable psychometric
properties were further underpinned by the previous robust and rigorous qualitative
phase. This provided extra confidence in the intended utility of the tool. However, what
is missing at present from these frameworks and from other decision-making approaches
within drug development is a mechanism to enable and measure the subjective decision-
making of the individual and that of their organisation. The QoDOS instrument aims to
bridge this gap.
The main review of a marketing authorisation application or Health Technology
Assessment are inherently linked to the quality of the dossier submission and the quality
of the review (Salek et al., 2012). What is again missing at present is a tool to bridge the
unknown subjective decision-making that is a component of the quality submission and
the quality review and the QoDOS instrument provides this bridge. Furthermore, the
QoDOS was applied to a cohort of decision-makers from the industry and the regulatory
170
agencies and it did demonstrate the difference in the comparative approach and
behaviours of the individual versus that of the organisation. There were a number of
differences between the organisation and the individual which included:
• Use of structured approaches to decision-making - the results showed that
individuals within the organisation reported using a structured approach more
frequently in their personal decision-making than did their organisation
• Quantification of probability of success – these results showed that individuals
are more disciplined in quantifying such probability than their organisations
• Transparency in decision-making approach - individuals reported that their
own decision-making approach was not as transparent as that of their
organisation. This could be related to the quality management systems in
place which aim to standardise certain decision-making tasks and this in turn
facilitates transparency
• Training in decision-making - the comparative results showed that the amount
of training in the science of decision-making that had been received by an
individual and the level of support offered by their organisation was very
limited.
What QoDOS is now offering is an addition to the decision-making armamentarium. It
aims to address that void in the understanding of the quality of the decision-making
being applied both within the benefit-risk assessment frameworks, drug development
and beyond. One of the unique, attractive and beneficial features of QoDOS is that it
allows the individual or their organisation to visualise their decision-making approach.
This visualisation in turn presents and facilitates profiling and communication of
decision-making. In addition it provides a time-curve record of changes or
improvements in a person’s (or an organisation’s) decision-making approach. It
presents a platform to add consistency, transparency and communication to the
171
subjective decision-making element. This will in turn allow greater predictability and
auditability of the individual and their organisation.
QoDOS has also enabled the identification of the hallmarks of good decision-making
practice and a recommended decision-making framework (Figure 7.1). The structure of
this framework includes 10 items as outlined:
Figure 7.1: Quality of decision-making framework reflecting good decision-making practice
QoDOS Framework
Step 1: Employ scientific rigour and
understand the decision context
Step 2: Apply knowledge and
experience
Step 3: Collect and check validity and
integrity of information
Step 4: Use objective approach
and be aware of biases
Step 5: Consider uncertainties and
develop alternative solutions
Step 6: Assign values and relative
importance to decision criteria
Step 7: Re-evaluate any new
information
Step 8: Evaluate both internal and
external influences
Step 9: Apply a structured approach to aid transparency
and audit trail
Step 10: Make the decision, perform
impact analysis and effectively
communicate the basis of the decision
172
The rationale for each of the ten steps in the framework:
Step 1 – Employ Scientific Rigour and Understand The Decision Context
For any decision in drug development or the regulatory review it is important that firstly
the decision-context is clearly understood as if this is not achieved then the decision
process may be compromised.
Step 2 - Apply Knowledge and Experience
It has been demonstrated that decision-making knowledge and experience is critical.
Step 3 - Collect and Check Validity and Integrity of Information
The quality of any decision is directly related to the validity and integrity of the
information underpinning the ultimate decision. One should ensure that the information
collected is of the required quality in order to give the necessary confidence to the
decision maker.
Step 4 - Use of Objective Approach and Awareness of Biases
This adds another dimension to the subjective individual judgement and yet again
improved the robustness of the ultimate decision. Use an objective approach and be
aware of your personal biases.
Step 5 - Consider Uncertainties and Develop Alternate Solutions
Uncertainties are a reality of any decision-making. However, not identifying such
uncertainties could contribute to the risk of failure of the decision. Equally consideration
of the alternate solutions will lead to a more balanced decision.
Step 6 - Assign Values and Importance to Decision Criteria
There is a general agreement that not all criteria used either by the individual or the
organisation is of equal value and importance. It is therefore imperative to involve
careful examination of the relative importance of such criteria for decision-making.
173
Step 7 - Re-evaluate any New Information
The dynamic nature of scientific information and the speed with which that travels
globally in today’s environment makes it absolutely imperative on an individual and
organisation to revisit criteria used for any previous decision.
Step 8 - Evaluate any Internal or External Influences
Any organisation or individual must be constantly aware of any internal and external
influences on their decision-making for example previous experience with medicines in
a similar therapeutic class, an untoward spontaneous event or considerations such as
company politics and competitors.
Step 9 - Use a Structured Approach To Aid Transparency and Audit Trail
This underlines the fact that using a structured approach will aid transparency as well as
providing an audit trail to those wishing to understand the basis of the decision.
Step 10 - Perform Impact Analysis and Effectively Communicate The Decision
It is important in any decision-making to examine the impact the decision has on
stakeholders. Having a structured systematic framework would enable decisions that are
made to be effectively communicated, for example from pharmaceutical company to
regulatory agency, regulatory agency to physician and physician to patient.
LIMITATIONS OF THE STUDY As with any research there are a number of limitations including the following:
• The participants in the qualitative phase of the study were all senior decision-
makers or Key Opinion Leaders. Whilst this cohort provided rich insights into
their decision-making approaches and style, these were not truly
representative of personnel involved in medicines research and review.
However, if less experienced people had participated then some decision-
making themes may have not have emerged
174
• Whereas the sample size achieved in the qualitative phase was satisfactory,
this was not the case in the quantitative phase. It was disappointing that only a
20% response rate was achieved in the quantitative phase and this was despite
using recognised techniques of follow-up including repeat emails and phone
calls. The number of participants in the final sample should ideally have been
between 350–760. This would have involved recruiting up to 3,500 people
and this target was not achievable
• Whilst the QoDOS research was international in nature and did include
participants from several EU countries, United States and China, it did not
include South America, Japan, Southeast Asia and the Middle East and
decision-making in these regions may differ because of experience and culture
• The lack of a validated “gold-standard” instrument could be perceived as a
limiting factor as it precluded the opportunity for a head-to-head comparison,
which in turn would have reduced the sample size requirement and would
have provided a different construct validation approach.
RECOMMENDATIONS As a result of this research there are a number of recommendations that can be made:
• QoDOS should be applied as a strategic planning tool at the different stage-
gates in drug development within the pharmaceutical industry. This would
include decision points during the nonclinical and clinical development phases
and would hopefully improve the robustness of decision-making and improve
attrition rates and delayed/premature terminations in drug development
• QoDOS can provide the opportunity to bridge the gap between the submission
of a quality dossier and a quality review leading to a seamless and
comprehensive platform for more predictable outcomes and increased public
confidence
175
• QoDOS should be used as a training tool for decision-making which would
promote a better understanding of the science of decision-making and improve
the overall quality
• The routine application of QoDOS has the potential to change the
organisational culture and their approach to decision-making with an
increased awareness of its quality.
FUTURE WORK • It would be of value to initiate a study to assess the quality of decision-making
within the various functions of the pharmaceutical industry which would
include: discovery pre-clinical, clinical, regulatory and pharmacovigilance.
This would allow a comparison of the quality of decision-making between the
various departments and identify differences between individuals and their
departments.
• It would be advantageous to compare the decision-making of big Pharma with
Small and Medium Enterprises (SMEs) and small biotech companies. It is
hoped that this would identify whether culture and organisational hierarchy
impact on the quality of decision-making and whether in small companies
there is a greater demand for accountability of the decisions made.
• Clearly there are differences between the larger mature established regulatory
authorities and those in the emerging markets. Therefore, it would be of
interest to design a study to examine whether there is a difference in the
quality of the decision-making between these two groups. Of specific
importance, would be to examine the differences between the seven Gulf
States in the Middle East as they differ in expertise and resources.
176
• QoDOS has identified the importance of examining not only the impact of the
decision made but also the importance of re-examining the decision when new
information becomes available. Therefore, it would be important to examine
the quality of decision-making in the pre-licensing and post-licensing
divisions within a number of regulatory authorities.
• The regulatory authorities in the emerging markets often have a different
approach to the evaluation of new medicines depending on where they have
been approved for marketing. This includes a full review, abridged review and
a verification review. It would be of value to determine whether the quality of
decision-making differs according to the type of review.
• Patients are challenged in that the approval of a new medicine for marketing
does not necessarily mean that the product will be available for
reimbursement. Therefore a study to examine the quality of decision-making
within different Health Technology Assessment Agencies may explain why
some of these differences occur and this will greatly influence patients’ access
to new medicines.
• It would be of importance to initiate a survey as an urgent piece of future
work to determine acceptability of the quality of decision-making framework
by the pharmaceutical industry, regulatory authorities and health technology
assessment agencies in both the mature and the emerging markets.
The QoDOS has been developed as an instrument for assessing the quality of decision-
making within regulatory agencies and pharmaceutical companies and has identified a
framework for quality decision-making. This has the potential to not only revolutionise
the way in which the whole regulatory submission and review is viewed but also to fill
the missing piece of the entire process which is building quality into the lifecycle of
medicines.
177
REFERENCES
Ansoff, H.I. 1979. Strategic Management, London. Macmillan
Attridge-Stirling 2001. Thematic networks: an analytic tool for qualitative research.
Qualitative research, 1, pp. 385-405.
Barbour, V., Chinnock, P., Peiperl, L., Veitch, E. & Yamey, G. 2008. From theory to
practice: translating research into health outcomes. PLoS Med, 5, e15.
Basit, T. N. 2003. Manual or Electronic? The role of Coding in Qualitative Data Analysis.
Educational Researcher, 45, pp. 143-154.
Basu, R. 2004. Implementing quality: A practical guide to tools and techniques., Thomson
Learning.
Bazeley, P. 2007. Qualitative data analysis with NVivo, London, Sage Publications.
Bhatti, Z. U., Salek, S. & Finlay, A. Y. 2013a. Concept of major life-changing decisions in
life course research. Curr Probl Dermatol, 44, pp. 52-66.
Bhatti, Z. U., Salek, S. S., Bolton, C. E., George, L., Halcox, J. P., Jones, S. M., Ketchell, I.
R., Moore, R. H., Sabit, R., Piguet, V. & Finlay, A. Y. 2013b. The development
and validation of the major life changing decision profile (MLCDP). Health
Qual Life Outcomes, 11, 78.
Bougie, S. A. 2010. Research methods for business: a skill building approach
Boynton, P. M. 2004. Administering, analysing, and reporting your questionnaire. BMJ,
328, pp. 1372-5.
Braun, V. & Clarke, V. 2006. Using thematic analysis in psychology. Qualitative Research
in Psychology, 3 (2), pp. 77-101.
Breckenridge, A., Feldschreiber, P., Gregor, S., Raine, J. & Mulchay, L. A. 2011.
Evolution of regulatory frameworks. Nat Rev Drug Discov, 10, pp. 3-4.
Breckenridge, A. & Walley, T. 2008. Early access to new medicines. Clin Pharmacol Ther,
84, pp. 23-5.
Breckenridge, A. & Woods, K. 2005. Medicines regulation and the pharmaceutical
industry. BMJ, 331, pp. 834-6.
178
Breckenridge, A., Woods, K. & Wallely, T. 2010. Medicines regulation and health
technology assessment. Clin Pharmacol Ther, 87, pp. 152-4.
Campbell, D. T. & Fiske, D. W. 1959. Convergent and discriminant validation by the
multitrait-multimethod matrix. Psychol Bull, 56, pp. 81-105.
Casey, M., McNamera, M., Fealy, G. & Geragherty, R. 2011. Nurses' and midwives'
clinical leadership development needs: a mixed methods study. J Adv Nurs, 67,
pp. 1502-13.
Cattell, R. B. 1978. The Scientific Use of Factor Analysis, New York, Plenum Press.
UIC (Chicago). 2013. Department of Infomation and Decision Sciences, Chicago, http://business.uic.edu/home-uic-business/faculty-departments-research/department-of-ids.
Chung-Stein, K. E. A. 2011. A Quantitative Approach for Making Go/No-Go Decisions in
Drug Development. DIA Information Journal, 14, pp. 187-202.
CIRS, 2012. Buiding the benefit-risk toolbox: Are there enough common elements across
the different methodologies to enable a concensus on a scientifically acceptable
framework for making benefit-risk decisions? Workshop synopsis, June 20-21.
Collis, J. H., R 2009. Businees research: A practical guide for undergraduate and
postgraduate students. Palgrave MacMillan
Colwrick, I., Hedner, T., Wolf, R., Olausson, M. & Klofsten, M. 2011. Decision-making in
the pharmaceutical industry: analysis of entrepreneurial risk and attitude using
uncertain information. R&D Management, 41, pp. 331-336.
Coplan, P. M., Noel, R. A., Levitan, B. S., Ferguson, J. & Mussen, F. 2011. Development
of a framework for enhancing the transparency, reproducibility and
communication of the benefit-risk balance of medicines. Clin Pharmacol Ther,
89, pp. 312-5.
Coyne Karin S., M. M. K., Murphy Jeanne., Spies James. 2012. Validation of the UFS-
QOL-Hysterectomy Questionnaire: Modifying an existing measure for the
comparative effectiveness research Value in Health 15, pp. 674-679.
Crabtree & Miller, A. 1999. Doing quantitative research, Sage Publications
Creswell, J. W. 2003. Research design: qualitative; quantative and mixed methods Sage
Publications.
179
Dash, M. & Jones, D. 2010. Good Review Practices at the MHRA. Regulatory Rapporteur,
7. TOPRA
Davidshofer, K. & Murphy, C. 2005. Psychological testing: principles and applications,
Upper Saddle River, NJ, Pearson/Prentice Hall.
Davis, J. 1989. Measurement, construct validity and pattern matching: Construct validity in
measurement: A pattern matching approach, Evaluation and Program Planning,
Vol 12, pp. 31-36, USA. Pergamon Press
Denzin, N. & Lincoln, Y. 2005. The handbook of qualitative research, Thousand Oaks,
CA, USA, Sage Publications.
Dhamu, M. K. 2003. Psychological models of professional decision-making. Psychol Sci,
14, pp. 175-80.
Dicicco--Bloom, B., & CRABTREE, B.F 2006. The qualitative research interview Med.
Educ 40, pp. 314-21.
Diem, K. G. 2002b. A Step-by-step guide to developing effective questionnaires and survey
procedures for program evaluation and research New Jersey. Rutgers
Dodgson, J. S. 2009. Multi-criteria analysis: a manual. Communities and Local
Government Publications: London
Doyle, L., Brady, A-M., & Byrne, G. 2012 An overview of mixed methods research.
American Journal of evaluation 33, pp. 221-239.
ECORYS, 2009. Competitveness of the EU Market and Industry for Pharmaceuticals.
Report for the European Commission, Directorate General Enterprise & Industry.
Rotterdam.
Eichler, H. G., Oye, K., Baird, L. G., Abadie, E., Brown, J., Drum, C. L., Ferguson, J.,
Garner, S., Honig, P., Hukkelhoven, M., Lim, J. C., Lim, R., Lumpkin, M. M.,
Neil, G., O'Rourke, B., Pezalla, E., Shoda, D., Seyfert-Margolis, V., Sigal, E. V.,
Sobotka, J., Tan, D., Undger, T. F. & Hirsch, G. 2012. Adaptive licensing: taking
the next step in the evolution of drug approval. Clin Pharmacol Ther, 91, pp.
426-37.
Eichler, H. G., Pignatti, F., Flamion, B., Leufkens, H. & Breckenridge, A. 2008. Balancing
early market access to new drugs with the need for benefit/risk data: a mounting
dilemma. Nat Rev Drug Discov, 7, pp. 818-26.
180
Eisinga, R., Grotenhuis, M. T. & Pelzer, B. 2013. The reliability of a two-item scale:
Pearson, Cronbach, or Spearman-Brown? Int J Public Health, 58, pp. 637-42.
European Medicines Agency (EMA) 2010. Description of the benefit-risk assessment
models already being used in the European Union's regulatory network: Work
Package 1 Report. London. EMA
www.ema.europa.eu/docs/en_GB/document.../WC500109478.pdf
European Medicines Agency (EMA) 2011. Benefit-risk methodology project: Work
package 3 report: Field tests. London. EMA
www.ema.europa.eu/docs/en_GB/.../Report/.../WC500112088.pdf
European Medicines Agency (EMA) 2011b. Road Map to 2015: The Agency’s contribution
to science, medicines, health. London. EMA.
http://www.ema.europa.eu/docs/en_GB/document_library/Report/2011/01/WC5001
01373.pdf
European Medicines Agency (EMA). 2013b. EUnetHTA, London, EMA [Online].
Available: http://www.eunethta.eu/ema.
European Medicines Agency (EMA). 2013c. PRAC: Pharmacovigilance Risk Advisory
Committee [Online]. London, EMA. Available:
http://www.ema.europa.eu/ema/index.jsp?curl=pages/about_us/general/general_c
ontent_000537.jsp&mid=WC0b01ac058058cb18.
European Medicines Agency (EMA). 2010. European Medicines Agency Benefit–Risk
Methodology Project, London, EMA.
ESPRINT Group, E. S., Investigators, Valero, A., Alonso, J., Antepara, I., Baro, E., Colas,
C., Del Cuvillo, A., Ferrer, M., Herdman, M., Marti-Guadano, E., Monclus, L.,
Mullol, J., Navarro-Pulido, A. M., Navas, C., Sastre, J., Baltasar, M., Bartra, J.,
Serrano, C., Cardona, V., Castillo, J. A., Cerda, M. T., Cistero, A., Conejero, A.,
Davila, I., Escudero, C., Hernandez, E., Vereda, A., Fernandez, B., Mencia, J.,
Fernandez, J., Florido, J., Quiralte, J., Guardia, P., Malek, T., Montoro, J., Orta,
J. C., Oehling, A., Pascual, M. J., De La Parte, B., Raga, E., Rubira, N., Ranea,
S., Rivas, P., Serra, J. & Tabar, A. 2007. Development and validation of a new
Spanish instrument to measure health-related quality of life in patients with
allergic rhinitis: the ESPRINT questionnaire. Value Health, 10 (6), pp. 466-77.
181
Fayers, P. M. & Hand, D. J. 1997. Factor analysis, causal indicators and quality of life.
Qual of Life Research, 6 (2), pp. 139-50.
Field 2005. Discovering statistics using SPSS. 2nd edition, London, Sage Publications.
Field 2009. Discovering statistics with SPSS. 3rd edition, London, Sage Publications.
Floyd, F. J., & Widaman, K.F 1995. factor analysis in the development and refinement of
clinical assessment instruments Psychological Assessment, 286-299.
Food and Drug Administration (FDA) 2005. Guidance for review staff and industry, good
review management principles and practices for PDUFA products. FDA, USA.
Food and Drug Administration (FDA) 2006. Good review practices. Manual of policies and
procedures, FDA, USA.[Accessed: 14th October 2012].
Food and Drug Administration (FDA) 2009. Manual of Policies and Procedures (CDER).
FDA, USA [Accessed: 14th October 2012].
Food and Drug Administration (FDA) 2010. A United States regulators perspective on
benefit-risk considerations. FDA, USA. [Accessed: 14th October 2012].
http://www.fda.gov/downloads/AboutFDA/CentersOffices/CDER/UCM210155.pdf
Fredheim, O. M., Borchgrevink, P. C., Saltnes, T. & Kaasa, S. 2007. Validation and
comparison of the health-related quality-of-life instruments EORTC QLQ-C30
and SF-36 in assessment of patients with chronic nonmalignant pain. J Pain
Symptom Manage, 34, pp. 657-65.
Frey, P. 2012. Benefit-risk considerations in CDER: Development of a Qualitative
Framework. (DIA meeting). Silver Spring, MD: Food and Drug Administration,
Centre for Drug Evaluation and Research.
http://www.fda.gov/downloads/AboutFDA/CentresOffices/OfficerofMedicalPro
ductsand Tobacco/CDER/UCM317788.pdf.
Genesis. 2013. Genesis strategic decision process [Online]. Available:
http://www.genesismc.co.uk/blog/effective-decision-making/.
Government ( US Small Business Administration). 2013. Decision-making [Online].
Available: US Government, US http://www.sba.gov/content/making-decisions.
Graneheim, U. H. & Lundman, B. 2004. Qualitative content analysis in nursing research:
concepts, procedures and measures to achieve trustworthiness. Nurse Educ
Today, 24, pp. 105-12.
182
Guo, J. J., Pandey, S., Doyle, J., Bian, B., Lis, Y. & Raksch, D. W. 2010b. A Review of
Quantitative Risk–Benefit Methodologies for Assessing Drug Safety and
Efficacy—Report of the ISPOR Risk–Benefit Management Working Group.
Value in Health, 13, pp. 657-666.
Guyatt, G. F., D 1993. Measuring health related quality of life Annals of Internal Medicine,
118 (8), pp. 622-629.
Halcomb, E. J. & Davidson, P. M. 2006. Is verbatim transcription of interview data always
necessary? Appl Nurs Res, 19, 38-42.
Hammond, K., Raiffa 2002. Smart choices: A Practical Guide to Making Better Decisions,
Crown Business
Hammond, S., Keeney, R. & Raiffa, H. 2011. Making Smart Decisions, Boston, Harvard
Business Review.
Hanson, W., Creswell.J.W, Plano Clark, V., Petska, K. & Creswell, J. D. 2005. Mixed
Methods Research Designs in Counseling Psychology. Journal of Counseling
Psychology, 52, pp. 224-235.
Harris, R. 2012. Introduction to decision-making [Online]. Available:
http://www.virtualsalt.com/crebook5.htm.
Haynes, S., Richard, D. & Kubany, E. 1995. Content validity in psychological assessment:
A functional approach to concepts and methods Psychological Assessment. 7(3),
pp. 238-247.
Hazard, M. B. 2011. Statistical methods for health care research Lippincott Williams and
Wilkins.
Higginson, I., J., & Carr, A. J. 2001. Measuring quality of life using a qualit of life
measures in the clinical setting. British Medical Journal, pp. 297-1300.
Heads of Medicines Agency (HMA), 2013. Benchmarking of European Medicines
Agencies (BEMA). London, EMA. http://www.hma.eu/300.html
Holstein, G. 2001. Handbook of interview research: concepts, procedures and measures to
achieve trustworthiness Sage Publications.
IBM. 2011. SPSS Statistics 20 Brief Guide [Online]. Available:
http://www-01.ibm.com/support/docview.wss?uid=swg21509012.
183
IMI-EFPIA 2013a. IMI-PROTECT Benefit-Risk Group Recommendations Report
Recommendations for the methodology and visualisation techniques to be used
in the assessment of benefit and risk of medicines. In: IMI-EFPIA (ed.).
IMI-EFPIA. 2013b. IMI Protect Project [Online]. Available: http://www.imi-protect.eu/.
Ivanova, E. & Gibcus, P. 2003. The decision-making entrepreneur. Literature review. Literature Review, SCALES-paper N200219, EIM Business & Policy Research, Holland.
Jackson, K. & Trochim, W. M. 2002. Concept Mapping as an Alternative Approach for the Analysis of Open-Ended Survey Responses,Organizational Research Methods, 5, pp. 307-336.
Jefferys, D. 2000. The development of quality assurance within the Medicines Control
Agency. International Journal of Pharmaceutical Medicine 14, pp. 29-32.
John, O. & Benet-Martinez, V. 2000a. Handbook or research methods in social and
personality psychology, Cambridge University Press.
Kahneman, D. 2003. A perspective on judgment and choice: mapping bounded rationality.
Am Psychol, 58, pp. 697-720.
Kahenman, D. 2012. Thinking Fast and Slow, London, Penguin Books.
Kahneman, D., Lovallo, D. & Sibony, O. 2011. Before you make that big decision. Harv
Bus Rev, 89, 50-60, pp. 137.
Kahneman, D. & Tversky, A. 1982. Variants of uncertainty. Cognition, 11, pp. 143-57.
Korteweg, M. 2002. Benchmarking of good regulatory practices – Quality management
systems in the framework of PERF. Regulatory Affairs Journal Pharma.
February 2002, pp. 109-113.
Korvivk, J. 2008. Current and future approaches to benefit-risk assessment for Regulatory
agencies. In: Cone, M. and Lisinski, T. (Eds.) Measuring benefit and balancing
risk: strategies for the benefit-risk assessment of new medicines in a risk-averse
environment. CMR International Institute for Regulatory Science workshop
report. Surrey: CMR International.
Kostopoulou, O. & Wildman, M. 2004. Sources of variability in uncertain medical
decisions in the ICU: a process tracing study. Qual Saf Health Care, 13, 272-80.
184
Kriston, L., Scholl, I., Holzel, L., Simon, D., Loh, A. & Harter, M. 2010. The 9-item
Shared Decision-making Questionnaire (SDM-Q-9). Development and
psychometric properties in a primary care sample. Patient Educ Couns, 80, pp.
94-9.
Kumanyika, S., Brownson, R. C. & Cheadle, A. 2012. The L.E.A.D. framework: using
tools from evidence-based public health to address evidence needs for obesity
prevention. Prev Chronic Dis, 9, E125.
Langham, S., Maggi, M., Schulman, C., Quinton, R. & UHL-Hochgraeber, K. 2008.
Health-related quality of life instruments in studies of adult men with
testosterone deficiency syndrome: a critical assessment. J Sex Med, 5, pp. 2842-
52.
Leong, J., McAuslane, N., Walker, S. & Salek, S. 2013. Is there a need for a universal
benefit-risk assessment framework for medicines? Regulatory and industry
perspectives. Pharmacoepidemiol Drug Saf, 22, pp. 1004-12.
Levitan, B. & Mussein, F. 2012. Evaluating benefit-risk during and beyond drug
development: an industry view. Regulatory Rapporteur, 9. TOPRA
Liang, M. H. 2000. Longitudinal construct validity: establishment of clinical meaning in
patient evaluate instruments. Med Care, pp. 1184-90.
Lovallo, D. & Kahneman, D. 2003. Delusions of success. How optimism undermines
executives' decisions. Harv Bus Rev, 81, 56-63, p. 117.
Lumkin, M. 2000. Assessing quality of the regulatory review function DIA Annual Meeting
2000.
Lynn, M. R. 1986. determination and quantification of content validity.Nursing research,
35 (6), pp. 382-385
MacKenzie, S., Podsakoff, P. & Podsakoff, N. 2011. Construct Measurement and
Validation Procedures in MIS and Behavioural Research: Integrating New and
Existing Techniques. MIS Quarterly, 35, pp. 293-334.
MacLeod, L. 2011. Avoiding "groupthink": a manager's challenge. Nursing Management,
42 (10), pp. 44-8.
185
Marquart, J. 1989. A pattern matching approach to assess the construct validity of an
evaluation instrument. Concept mapping for evaluation and planning. USA:
Pergamon Press.
Mathers, N., Fox, N. & Hunn, A., 2002. Using interviews in a research project Institute of
General Practice, Sheffield, UK
Mattes, W. B., Walker, E. G., Abadie, E., Sistare, F. D., Vonderscher, J., Woodcock, J. &
Woosley, R. L. 2010. Research at the interface of industry, academia and
regulatory science. Nat Biotechnol, 28, pp. 432-3.
Mc Cauley, C. 1998. Group Dynamics in Janis's Theory of Groupthink: Backward and
Forward. Organ Behav Hum Decis Process, 73, pp. 142-62.
McDaniel, C. & Gates, R. 2002. Contemporary marketing research: the impact of the
Internet. 5th ed. Cincinnati (OH): South-Western College Publishing;
McDermott, R. 2008. Medical decision-making: Lessons from psychology. Urologic
Oncology: Seminars and Original Investigations, 26, pp. 665-668.
Medicines and Healthcare products Regulatory Agency (MHRA) 2009. The European
Medicines Agency’s Integrated Quality Management System. London.
Medicines and Healthcare products Regulatory Agency (MHRA) 2013. Report of the
Expert Group on innovation in the regulation of healthcare [Online]. London.
http://www.mhra.gov.uk/home/groups/pl-a/documents/websiteresources/con336728.pdf.
Meehhl, C. A. 1955. Construct Validity in Psychological Tests. Psychological Bulletin, 52.
Messicks, D. & Bazerman, M. 1996. Ethical leadership and the psychology of decision-
making. Sloan Management Review, pp. 9-22.
Meyrick, J. 2006. What is good qualitative research? A first step towards a comprehensive
approach to judging rigour/quality. J Health Psychol, 11, pp. 799-808.
Milkman, K., Chugh, D. & Bazerman, M. 2008. How can decision-making be improved?
USA, Harvard Business Review.
Mindtools. 2013. Decision-making [Online]. Available:
http://www.mindtools.com/pages/main/newMN_TED.htm.
Mintzberg, H. & Westley, F. 2001. Decision-making: It's not what you think. Sloan
Management Review, 42, pp. 89-93.
186
Molzon ,J., Giaquinto, A., Lindstrom, L., Tominaga, T., Ward, M., Doerr, P., Hunt, L.,
Rago, L, 2011. The Value and Benefits of the International Conference on
Harmonisation to Drug Regulatory Authorities: Advancing Harmonization for
Better Public Health. Clinical Pharmacology & Therapeutics 89, pp. 503-512.
Moule, P. & Goodman, R. 2009. Nursing Research: An introduction, London, Sage
Publications.
Mussen, F., Salek, S. & Walker, S. R. 2009. Benefit-risk appraisal of medicines. A
systematic approach to decision-making. Wiley
Neudert, C., Wasner, M. & Borasio, G. D. 2001. Patients' assessment of quality of life
instruments: a randomised study of SIP, SF-36 and SEIQoL-DW in patients with
amyotrophic lateral sclerosis. J Neurol Sci, 191, pp. 103-9.
NIH 2012. PROMIS® Instrument Development and Psychometric Evaluation Scientific
Standards. USA, National Institute of Health.
Norusis, M. J. 1993. SPSS for windows: base systems user's guide, Chicago, SPSS Inc.
Nunnally, J. C. & Berstein, L. 1994. Psychometric theory, McGraw Hill.
Pallant, J. 2005. SPSS Survival Manual: A step by step guide to data analysis using SPSS,
for Windows (Version 12). 2nd ed. Maidenhead: Open University Press.
Patrick, D. L., Burke, L. B., Gwaltney, C. J., Leidy, N. K., Martin, M. L., Molsen, E. &
Ring, L. 2011a. Content Validity—Establishing and Reporting the Evidence in
Newly Developed Patient-Reported Outcomes (PRO) Instruments for Medical
Product Evaluation: ISPOR PRO Good Research Practices Task Force Report:
Part 1—Eliciting Concepts for a New PRO Instrument. Value in Health, 14, pp.
967-977
Patrick, D. L., Burke, L. B., Gwaltney, C. J., Leidy, N. K., Martin, M. L., Molsen, E. &
Ring, L. 2011b. Content Validity—Establishing and Reporting the Evidence in
Newly Developed Patient-Reported Outcomes (PRO) Instruments for Medical
Product Evaluation: ISPOR PRO Good Research Practices Task Force Report:
Part 2—Assessing Respondent Understanding. Value in Health, 14, pp. 978-988.
Patrick, D. L. C., Y.P. 2000. Measurement of health outcomes in treatment effectiveness
evaluations: conceptual and methodogical challenges Med Care, pp. 1114-25.
Patton, M. Q. 2002. Qualitative research & evaluations methods, Sage Publications.
187
Petter, E. A. 2007. Specifying formative constructs in IS research. MIS Quarterly, 31, pp.
623-656.
Pijls-Johannesma, M. C., Pijpe, A., Kempen, G. I., Lambin, P. & Dagnelie, P. C. 2005.
Health related quality of life assessment instruments: a prospective study on
preference and acceptability among cancer patients referred for radiotherapy. Eur
J Cancer, 41, pp. 2250-6.
Polit, D. and Beck, C.T., 2006. The content validity index: Are you sure you know what's
being reported? critque and recommendations. Research in Nursing & Health 29
(5) pp. 489-497.
Pritchard, J. F., Jurima-Romet, M., Reimer, M. L., Mortimer, E., Rolfe, B. & Cayen, M. N.
2003. Making better drugs: Decision gates in non-clinical drug development. Nat
Rev Drug Discov, 2, pp. 542-53.
PWC 2012. From vision to decision. In: (ED), P. (ed.).
Quernk, N. L. 2009. Essentials of Myers-Briggs Type Indicator Assessment (Essentials of
Psychological Assessment), John Wiley & Sons.
Rawlins, M. 2011. Therapeutics, evidence and decision-making, RSM Books, CRC Press.
Remenyi, D.,Williams, A., Swartz & Ethne 1998. Doing Research in Business and
Management. An Introduction to Process and Method, London.
Richards, L. 2005. Handling qualitative data: A practical guide. Sage Publications.
Ritchie, J. Spencer, L. 1994. Qualitative data analysis for applied policy research. In
Analyzing Qualitative Data. Edited by Bryman A, Burgess RG. London:
Routledge
Rothman, M., Burke, L., Erickson, P., Leidy, N. K., Patrick, D. L. & Petrie, C. D. 2009.
Use of existing patient-reported outcome (PRO) instruments and their
modification: the ISPOR Good Research Practices for Evaluating and
Documenting Content Validity for the Use of Existing Instruments and Their
Modification PRO Task Force Report. Value in Health, 12, pp. 1075-83.
Rowe, A. J. & Bougarides, J. D. 1983. Decision styles - A perspective, . Leadership and
organizational development journal, 4, pp. 3-9.
188
Ruiz, M. A., Pardo, A., Rejas, J., Soto, J., Villasante, F. & Aranguren, J. L. 2008.
Development and validation of the "Treatment Satisfaction with Medicines
Questionnaire" (SATMED-Q). Value Health, 11, pp. 913-26.
Ryan, C. A. C. 2007. Step-by-step guide to critiquing research. Part 2: quaiitative research.
Bristish Journal of Nursing, 16.
Salek, M., Khan, G. & Finlay, A. 1996. Questionnaire techniques in assessing acne
handicap: reliability and validity study. Quality of life research, 5, pp. 131-138.
Salek, S., Mallia-Milanes, A., McAuslane, N. & Walker, S. 2012. Development and
Application of Scorecards to Assess the Quality of a Reulatory Submission and
Its Review. DIA Information Journal, 46.
Salkind, N. 2006. Exploring research, New Jersey, Pearson education.
Samuelson, W. & Zeckhauser, R. 1988. Status quo bias in decision making. Journal of risk
and uncertainty, 1, pp. 7-59.
Sarac, S. B., Rasmussen, C. H., Rasmussen, M. A., Hallgreen, C. E., Soeborg, T., Colding-
Jorgensen, M., Christensen, P. K., Thirstrup, S. & Mosekilde, E. 2012. A
comprehensive approach to benefit-risk assessment in drug development. Basic
Clin Pharmacol Toxicol, 111, pp. 65-72.
Saunders, L., Thornhill 2009. Research methods for business students. England, Pearson
Education Limited.
Schleyer & Titus, .K.L 2000. Methods for the design and administration of web-based
surveys Journal of American Medical Informatics Association 7.
Sekaran, U. & Bougie, R. 2010. Research Methods for Business, Wiley.
Silverman 2000. Handbook of quantitative research. Thousand Oaks, CA: Sage
Publications
Simon, D., Schorr, G., Wirtz, M., Vodermaier, A., Caspari, C., Neuner, B., Spies, C.,
Krontes, T., Keller, H., Edwards, A., Loh, A. & Harter, M. 2006. Development
and first validation of the shared decision-making questionnaire (SDM-Q).
Patient Educ Couns, 63, pp. 319-27.
Stanford University, 2013a. Decision-making [Online]. Stanford, USA. Available:
http://search.gsb.stanford.edu/search?q=decision-making&site
189
Stellenbosch University, S. 2013b. Information Science: Centre for knowledge dynamics
and decision-making [Online]. Available: http://www.informatics.sun.ac.za/.
Strauss, A. & Corbin, J. 1998. Basics of qualitative research, Thousand Oaks, Sage
Publications.
Streiner, D. & Norman, G. 2008. Health Measurement Scales: a practical guide to their
development and use, Oxford.Oxford University Press.
SurveyMonkey. 2013. SurveyMonkey Official website [Online]. Available:
http://www.surveymonkey.com.
Tabachnick, B. & Fidell 2001. Using multivariate statistics, New York, Harper Collins.
Terwee, C. B., Bot, S. D., De Boer, M. R., Van Der Windt, D. A., Knol, D. L., Dekker, J.,
Bouter, L. M. & De Vet, H. C. 2007. Quality criteria were proposed for
measurement properties of health status questionnaires. Journal of Clinical
Epidemiology, 60 (1), pp. 34-42.
TGA (Therapeutics Goods Agency), Canada, H. 2013. Therapeutic Products Directorate
Good Review Practices Project. 21 June 2013.
Tony, M., Wagner, M., Khoury, H., Rindress, D., Papastavros, T., Oh, P. & Goetghebeur,
M. M. 2011. Bridging health technology assessment (HTA) with multicriteria
decision analyses (MCDA): field testing of the EVIDEM framework for
coverage decisions by a public payer in Canada. BMC Health Serv Res, 11, p.
329.
Trochim, W. 2006. Construct validity, research methods knowledge base.
http://www.socialresearchmethods.net/kb/constval.php
Trochim, W. M. 1989. An introduction to concept mapping for evaluation and planning,
Evaluation and Program Planning, 12, pp. 1-16. Pergamon Press.
Van Assen, M., Van Den Berg, G. & Piestersma, P. 2009. Key management models, Great
Britain, Prentice Hall.
Verma, D. 2009. Decision-making style: Social and creative dimensions, New Delhi, India,
Global India Publications Pvt Ltd.
Von Bergen, C. W., JR. & Kirk, R. J. 1978. Groupthink: when too many heads spoil the
decision. Manage Rev, 67, pp. 44-9.
190
Walker, S., Cone, M. & McAuslane, N. 2007. Quality decision-making: procedures and
pracitices in drug development and the regulatory review. CMR International
Institute Workshop. Surrey: CMR International.
Walker, S. L., Liberti, L., Connelly, P. 2011. Visualising benefit-risk of assessment of
medicines: The key to develop a framework that informs stakeholder perspective
and clarity of decision making. CIRS Workshop. Surrey. CIRS.
Web, H. B. R. 2012. Decision-making [Online]. Available: http://hbr.org/web/management-
tip/tips-on-decision-making.
Wellard, S. & McKenna, L. 2001. Turning tapes into text: issues surrounding the
transcription of interviews. Contemp Nurse, 11, pp. 180-6.
Westaby, J. D., Probst, T. M. & Lee, B. C. 2010. Leadership decision-making: A
behavioral reasoning theory analysis. The Leadership Quarterly, 21, 481-495.
Westen, D. & Rosenthal, R. 2003. Quantifying construct validity: Two simple measures.
Journal of Personality and Social Psychology, 84, pp. 608-618.
Wethey, D. 2013. Decide, London, Kogan Page.
Zuckerman, D. 2006. Pharmaceutical Metrics: Measuring and improving R & D
performance, Gower Publishing Company. P.112.
191
APPENDIX I
Quality of Decision-Making: Research Outline
Background: The Centre for Innovation in Regulatory Science (CIRS), formerly known as
“CMR International Institute for Regulatory Science”, in collaboration with the Welsh
School of Pharmacy, Cardiff University is currently performing research into the “quality
of decision-making” within the pharmaceutical development arena and the associated
regulatory review.
Research Objective: to explore the ways in which different companies/organisations
manage decision-making. In turn, to help facilitate and promote quality within the
decision-making processes within the pharmaceutical arena and regulatory authorities
Research Methodology: This research involves a two-stage investigation and involves
participants from the pharmaceutical arena and the regulatory authorities.
Stage 1: Is an initial validation stage and consists of the conduct of semi-structured
interviews on the subject of “Quality of decision-making”, with interviewees from the
pharmaceutical arena and regulatory authorities. The interviews comprise of six main
questions covering an interviewee’s views on:
o General understanding or perception of decision-making
o Decision-making within the drug development arena
o Decision-making within the regulatory review
o Decision-making within their organisation
o Awareness and use of decision-making techniques
o Impact and monitoring of decisions
The interviews are all treated with due confidentiality and this is detailed before the start of
any interview. The interviews require around 30-45 minutes of an interviewee’s time and
will be conducted in October and November 2011.
192
The results of the Stage 1 interviews performed should facilitate and validate the generation
of a quality instrument tool to support and promote quality within the decision-making
process.
Stage 2, will comprise of an e-mail questionnaire survey (of the quality instrument tool) to
a larger sample size of targeted persons working within the pharmaceutical arena and
regulatory agencies. The questionnaire will comprise of a Likert type response format with
the option for free text. It will comprise of questions enquiring on how respondents and
their company/organisation manage the decision-making process. Again, the stage 2
research will be managed with due confidentiality and the findings of the investigation will
be made available to all of the research participants.
193
APPENDIX II
Content Validation of a Tool to Assess the Quality of Decision-Making
Introduction Many people find it hard to believe that there can be a “science of decision-making”. However, there is such a science and it is based on a very coherent theory about how to make better decisions. “Contrary to expectations a quality decision and decision-making process should not be tested by looking at the outcomes and consequences. In an uncertain world, it is perfectly possible to take a good decision that has poor consequences and, equally, to make a bad decision and come up with a good outcome. On balance, however, the long-running use of good systems for making decisions will generally give better outcomes.” Companies and regulatory agencies are working to develop frameworks for making decisions that are systematic, transparent and accountable. The question is how good are the approaches within companies and agencies for making decisions and what are the challenges and enablers to ensure good quality decisions? One way of testing this, is to look at how individuals and organisations make decisions based on custom and practices and map this to against best practice decision-making. Background
The Centre for Innovation in Regulatory Science in collaboration with the Welsh School of Pharmacy, Cardiff University, has developed a tool consisting of a number of statements to evaluate the quality of decision-making for individuals and their organisations. This was as a result of conducing twenty nine semi-structured interviews with individuals from regulatory authorities (nine), pharmaceutical companies (ten) and CROs (ten) when the follow themes were explored: Best practice perceptions of decision-making; Decision-making within drug development; Decision-making within the regulatory review; Decision-making within their individual organisation; Awareness and use of decision-making techniques; The impact and monitoring of decisions
194
As an outcome of these interviews, a tool for measuring the quality of decision-making has been developed consisting of 94 items (statements) which cover many aspects of decision-making within an organisation. Objectives This measurement tool now needs to be validated for its content and you are asked to rate each of the following statements for: A. Language clarity: the sentence and wording should be clear, understandable, straight forward and simple. Phrases and wording should be unambiguous and jargon free B. Completeness: The sentence should be complete, not broken and should end appropriately. C. Relevance: Each item should be relevant to the subject area and target population. D. Scaling: The scoring system uses a four point Likert scale. You should rate the Likert scaling system as to whether the response options fit the question or no Outcome It is envisaged that this tool will be sent to a number of regulatory authorities and pharmaceutical organisations inviting them to complete and assess each statement so that an organisation can compare its decision-making approach with the principles of good quality decision-making. As part of the standardised approach for the development of tools of this nature, it is ideal for a panel discussion following completion of the ratings by all panel members.
Ronan Donelan, Sam Salek and Stuart Walker 16 May 2012
195
APPENDIX III
A COPY OF THE 94-ITEM CHECKLIST
(The first nine items in the checklist are included for reference example)
196
A copy of the 94-item Checklist
Validation of Questionnaire Feedback Form
Quality of Decision-making Orientation Scheme (QoDOS)
Name . . . . . . . . . . . . . . . . . . . . . . . . . . . . . Specialty . . . . . . . . . . . . . . . . . . .
Thank you for agreeing to take part in the questionnaire feedback as part of the content
validity.
Each item on the questionnaire needs to be assessed for language clarity, completeness,
relevance and scaling. The following definitions are provided to ensure standardisation and
so that each person has the same understanding of these criteria.
Please rate each of the following questionnaire items on the following:
A. Language clarity: the sentence and wording should be clear, understandable, straightforward and simple. Phrases and wording should be unambiguous and jargon free
B. Completeness: the sentences should be complete, not broken and should end appropriately.
C. Relevance: each item should be relevant to the subject area and target population.
D. Scaling: the scoring system uses a 4 point Likert scale. You should rate the Likert scaling system as to whether the response options fit the question, or not.
A copy of the 94-item Checklist
Item 1: I use a structured approach in my decision-making
197
Strongly Agree Disagree Strongly agree disagree Language Clarity Completeness Relevance Scaling
Any Comments:
Item 2: My company uses a structured approach in its decision-making Strongly Agree Disagree Strongly agree disagree Language Clarity Completeness Relevance Scaling
Any Comments:
Item 3: I evaluate the impact of the decisions I make Strongly Agree Disagree Strongly agree disagree Language Clarity Completeness Relevance Scaling
Any Comments:
A copy of the 94-item Checklist (con’t)
Item 4: My organisation evaluates the impact of the decisions it makes
198
Strongly Agree Disagree Strongly agree disagree Language Clarity Completeness Relevance Scaling
Any Comments:
Item 5: I understand the importance of the decisions I make Strongly Agree Disagree Strongly agree disagree Language Clarity Completeness Relevance Scaling
Any Comments:
Item 6: My organisation’s decision-making is influenced by its strategy Strongly Agree Disagree Strongly agree disagree Language Clarity Completeness Relevance Scaling
Any Comments:
A copy of the 94-item Checklist (con’t)
Item 7: My organisation’s decision-making is influenced by external stakeholder
199
demands Strongly Agree Disagree Strongly agree disagree Language Clarity Completeness Relevance Scaling
Any Comments:
Item 8: My organisation’s decision-making is influenced by competitors Strongly Agree Disagree Strongly agree disagree Language Clarity Completeness Relevance Scaling
Any Comments:
Item 9: My organisation’s decision-making is influenced by the vested interest of individuals Strongly Agree Disagree Strongly agree disagree Language Clarity Completeness Relevance Scaling
Any Comments:
201
Quality of Decision-Making Orientation Scheme (QoDOS) The statements in the questionnaire relate to your views on your personal and organisations decision-making processes. Please mark clearly one box for each statement. Please remember, this questionnaire is about your/company’s views and not the views of others.
Quality of Decision-Making Orientation Scheme (QoDOS)
Never Rarely Sometimes Often Always Not
Applicable
1. I use a structured approach in my decision-making
2. My company uses a
structured approach in its decision-making
3. I evaluate the impact
of the decisions I make
4. My organisation
evaluates the impact of the decisions it makes
5. I understand the
importance of the decisions I make
6. My organisation’s
decision-making is influenced by its strategy
7. My organisation’s
decision-making is influenced by external stakeholder demands
8. My organisation’s
decision-making is influenced by competitors
202
Never Rarely Sometimes Often Always Not
Applicable
9. My organisation’s decision-making is influenced by the vested interest of individuals
10. My organisation’s decision-making is influenced by deadlines
11. My organisation’s
decision-making is influenced by Company politics
12. My organisation’s
decision-making is influenced by incentives or penalty payments
13. My decision-making is
influenced by my previous experience
14. My organisation’s decision-making is influenced by its previous experience
15. My decision-making is
influenced by the experience of others
16. I use intuition or “gut-
feeling” in my decision-making
17. In my organisation,
people are held accountable for their decisions
18. I am accountable for my
decisions
19. I have acquiesced to my
line management on project decisions
203
Never Rarely Sometimes Often Always Not
Applicable
20. My organisation has acquiesced to external experts on project decisions
21. I feel better qualified to
make a decision compared to others who are empowered to make decisions
22. I feel that I could make
better quality decisions
23. My organisation could
make better quality decisions
24. I receive training in the
science of decision-making
25. I use tools e.g. modelling
or decision trees which facilitate my decision-making
26. My professional
experience is important when having to make challenging decisions
27. I continue with projects
which should be terminated at an earlier stage
28. My organisation
continues with projects which should be terminated at an earlier stage
29. I have experienced
“paralysis by analysis” caused by my slow decision-making
30. My procrastination has
resulted in a negative outcome
204
Never Rarely Sometimes Often Always Not
Applicable
31. My organisation has suffered a negative outcome due to slow decision-making
32. I have experienced a negative outcome by a decision not being made
33. My organisation’s culture has resulted in its inability to make a decision
34. I qualify the probability of success in my decision-making
35. My organisation qualifies the probability of success in its decision-making
36. I quantify the probability of success in my decision-making
37. My organisation quantifies the probability of success in its decision-making
38. I understand the context of the decision I am being asked to make
39. My organisation provides clear and unambiguous instructions for decision-making
40. My decision-making approach is transparent
205
Never Rarely Sometimes Often Always Not
Applicable
41. My organisation’s decision-making approach is transparent
42. My decision-making could be improved by assigning weights
43. I present contingencies or achievable options as part of my decision-making
44. I generate a SWOT (strengths, weaknesses, opportunities, threats ) analysis in my decision-making
45. I consider uncertainty and unknowns in my decision-making approach
46. I use negotiation in my decision-making
47. My decision-making is consistent
48. My organisations decision-making is consistent
49. My organisation re-examines its decision-making as new information becomes available
50. I am open to using better alternatives in my current decision-making
Never Rarely Sometimes Often Always Not
206
Applicable
51. My organisation is open to using better alternatives in its decision-making
52. In my decision-making, I make the same mistakes as made in the past
53. In my organisations decision-making, it makes the same mistakes as made in the past
54. My organisation welcomes information supporting their existing biases and discounts opposing information
55. I underestimate problems which adversely impact my decision-making
56. My organisation underestimates problems which adversely impacts its decision-making
57. I am overcautious when estimating uncertainties related to my decisions
58. My organisation is overcautious when estimating uncertainties related to its decisions
59. Recent or dramatic events greatly impact my decision-making
Never Rarely Sometimes Often Always Not
207
Applicable
60. Recent or dramatic events greatly impact my organisations decision-making
61. I weigh up the opinions of others in my decision-making
62. My decision-making is innovative
63. My organisation encourages innovative decision-making
64. I maintain an auditable record of my decisions
65. My organisation maintains an auditable record of its decisions
66. Emotion is part of my decision-making
67. My approach to decision-making is predictable
68. My organisation’s approach to decision-making is predictable
69. My decision-making is
knowledge based
70. My organisations decision-
making is knowledge based
71. I use benchmarking in my decision-making
Never Rarely Sometimes Often Always Not
208
Applicable
72. My organisation uses benchmarking in its decision-making
73. I effectively communicate the decisions I make
74. My organisation effectively communicates the decisions it makes
75. My organisation effectively communicates the decisions it makes
76. Decision-making in my organisation tends to be final and not open to reinterpretation or discussion
Please check that you have answered all 76 questions.
Thank you for your cooperation with this exercise Please feel free to add comments, recommendations, suggestions or the like on the
free text page overleaf.
209
Free Text Commentary
...................................................................................................................................................
...................................................................................................................................................
...................................................................................................................................................
...................................................................................................................................................
...................................................................................................................................................
...................................................................................................................................................
...................................................................................................................................................
...................................................................................................................................................
...................................................................................................................................................
Please answer the following questions:
Job Title:
How many years of professional experience have you to date?
Type of Organisation:
Regulatory Agency Pharmaceutical Industry Academia CRO Other
Thank you for your participation.
211
Quality of Decision-Making Orientation Scheme (QoDOS)©
The statements in the questionnaire relate to your views on your personal and organisations decision-making processes. Please mark clearly one box for each statement. Please remember, this questionnaire is about your/company’s views and not of others. Please answer the following questions: Job title: ________________________________________________________________ How many years of professional experience have you to date? _____________________ Type of Organisation: Regulatory Agency Pharmaceutical Industry Academia CRO Other Part I: Organisational level influences
A. Decision-making approach Not at
all Sometimes Frequently Often Always
1. My organisation evaluates the impact of the decisions it makes
2. My organisation’s decision-making is transparent 3. My organisation’s decision-making is consistent
4. My organisation uses a structured approach in its
decision-making
5. My organisation’s decision-making is influenced by
external stakeholder’s demands
6. My organisation qualifies the probability of success in
its decision-making
7. My organisation quantifies the probability of success
in its decision-making
8. My organisation is open to using better alternatives in
its decision-making
9. My organisation encourages innovative decision-
making
10. My organisation considers uncertainties in relation to
its decision-making
11. My organisation provides training in the science of
decision-making
12. My organisation re-examines its decision-making as
new information becomes available
©MS Salek, R Donelan, SR Walker
212
B. Decision-making culture
Not at all
Sometimes Frequently Often Always
13. My organisation has suffered a negative outcome due to slow decision-making
14. My organisation’s culture has resulted in its
inability to make a decision
15. My organisation’s decision-making is influenced
by company politics
16. My organisation’s decision-making, it makes the
same mistakes as in the past.
17. My organisation’s decision-making its
influenced by the vested interest of individuals
18. My organisation underestimates problems which
adversely impacts its own decisions
19. My organisation continues with projects which
should be terminated at an earlier stage
20. My organisation decision-making its influenced
by competitors
21. My organisation’s decision-making is influenced
by incentives or penalty payments
22. My organisation effectively communicates the
decisions it makes
23. My organisation provides clear and unambiguous
instructions for decision-making
©MS Salek, R Donelan, SR Walker
213
PART II: Individual level influences A. Decision-making competence
Not at all Sometimes Frequently Often Always 24. My decision-making is knowledge based
25. My decision-making is consistent
26. I consider uncertainty and unknowns in my decision-making approach
27. I generate a SWOT analysis in my
decision-making
28. I present contingencies or achievable
options as part of my decision-making
29. My decision-making is transparent
30. I understand the context of the decision I
am being asked to make
31. I understand the importance of the
decisions I make
32. I use a structured approach in my decision-
making
33. I qualify the probability of success in my
decision-making
34. I quantify the probability of success in my
decision-making
35. I receive training in the science of
decision-making
36. I use intuition or “gut-feeling” in my
decision-making
37. My professional experience is important
when having to make challenging decisions
©MS Salek, R Donelan, SR Walker
214
B: Decision-making style Not
at all
Sometimes Frequently Often Always
38. Emotion is part of my decision-making
39. I have experienced “paralysis by analysis” caused by my slow decision-making
40. I have experienced a negative outcome by a
decision not being made
41. In my decision-making, I make the same mistakes
as in the past
42. Recent or dramatic events greatly impact my
decision-making
43. My procrastination has resulted in a negative
outcome
44. My decision-making could be improved by
assigning weights
45. I underestimate problems which adversely impact
my decision-making
46. I continue with projects which should be terminated
at an early stage
47. I feel that I could make better quality decisions
Please check that you have answered all 47 questions. Thank you for your cooperation with this exercise
Please feel free to add comments, recommendations, suggestions or the like on the free text page overleaf.
Please feel free to add comments, recommendations or suggestions below: Comments Confidentiality All information collected from individual agencies and companies will be kept strictly confidential. No data that will identify an individual agency or company will be reported, or detail made to a third party. External reports or presentation of the data will include only anonymous figures and any appropriate analytical interpretation. Agency or company data will only be provided to the relevant organisation concerned. COPYRIGHT This questionnaire should not be reproduced without the permission of M. Salek
Centre for Socioeconomic Research, Cardiff University, Cardiff, United Kingdom [email protected]