Development and Validation of the Portuguese Wind Atlas (1) Paulo Costa (2) Pedro Miranda (1) Ana Estanqueiro [email protected][email protected][email protected](1) INETI - Instituto Nacional de Engenharia, Tecnologia e Inovação, I.P., PORTUGAL, (2) CGUL – Centro de Geofísica da Universidade de Lisboa, PORTUGAL Abstract: A methodology to construct a wind potential atlas for mainland Portugal is presented. A long term simulation with the popular MM5 [1] mesoscale weather model was made with a whole year of reanalysis data (1999 year) in order to compute a mean wind annual cycle. Results were corrected by an intra annual variability factor and compared with four reference wind masts monitored by INETY for 12 years for validation purposes. The results obtained in this work are expected to present the wind energy developers a first estimate of the wind potential in mainland Portugal. Other useful applications can also be considered such as Tourism, territory planning and management among others. Keywords: Atlas, wind resource, mesoscale models. 1 Introduction In the last years there has been an increasing effort in characterizing the wind potential in Portugal due to the growing interest in this renewable form of energy. A few institutions are involved in the wind resource characterization and have, along the years, presented several wind resource studies covering areas that are suited for the use of wind power, but as these studies focus on limited areas, the need for a systematic way of mapping the wind resource as a whole was still present. The goal of this work is to provide a tool to help decision makers by enabling the identification of new sites to carry on experimental campaigns, as well as to contribute to the official planning of this power plants location and identify the need to reinforce the utilities transmission and distribution grid. This study presents a methodology to develop a wind power atlas for mainland Portugal, using the well known state-of-the-art mesoscale weather prediction model - MM5. The data used in this work for validation purposes was the observed wind speed and direction collected in four stations located in the west coast of Portugal, during 1999. The intra annual variability was assessed with help of these reference masts operated by INETI, so that outputs from model can be representative of the long term wind resource. 2 Methodology An Atlas, to be representative of the wind potential of a country or region, demands the characterization of the spatial variability of the wind in the terrain surface, and has to include the state of the art techniques to address its time dependency. A possible methodology consists on the application of numerical resolution processes to the mesoscale atmospheric models. They permit not only the introduction of the orographic characteristics of each region and the description its conditioning phenomena – such as the stratification and atmospheric turbulence effects – but also the calculation of the temporal variability of the atmospheric variables under study together with their mean yearly contribution for the wind energy assessment. Therefore it is possible to obtain maps of the wind energy resource and estimates being the results of the simulations compared with in situ measurements from four selected INETI’s anemometric stations. The simulations were performed for the year 1999, and the results were corrected with a mean deviation factor in order to consider the intra annual variability of the wind. 2.1 Anemometric Stations from INETI Table 1 shows the name of each station and also the position and sensor’s height. HEIGHT OF SENSORS STATION STATION ALTITUDE (A.G.L) Velocity Direction IN_01 S. J Lampas 152m 10m 10m IN_04 Vila do Bispo 104m 10m 10m IN_32 Gardunha 1210m 10m 20m IN_33 Arruda 398m 10m 20m Table 1: INETI’s wind stations selected for the scope of this work. Figure 1 shows the location for each mast in mainland Portugal.
Transcript
Development and Validation of the Portuguese Wind Atlas
(1) INETI - Instituto Nacional de Engenharia, Tecnologia e Inovação, I.P., PORTUGAL, (2) CGUL – Centro de Geofísica da Universidade de Lisboa, PORTUGAL
Abstract: A methodology to construct a wind potential atlas for mainland Portugal is presented. A long term simulation with the popular MM5 [1] mesoscale weather model was made with a whole year of reanalysis data (1999 year) in order to compute a mean wind annual cycle. Results were corrected by an intra annual variability factor and compared with four reference wind masts monitored by INETY for 12 years for validation purposes. The results obtained in this work are expected to present the wind energy developers a first estimate of the wind potential in mainland Portugal. Other useful applications can also be considered such as Tourism, territory planning and management among others. Keywords: Atlas, wind resource, mesoscale models.
1 Introduction
In the last years there has been an increasing effort in characterizing the wind potential in Portugal due to the growing interest in this renewable form of energy. A few institutions are involved in the wind resource characterization and have, along the years, presented several wind resource studies covering areas that are suited for the use of wind power, but as these studies focus on limited areas, the need for a systematic way of mapping the wind resource as a whole was still present. The goal of this work is to provide a tool to help decision makers by enabling the identification of new sites to carry on experimental campaigns, as well as to contribute to the official planning of this power plants location and identify the need to reinforce the utilities transmission and distribution grid. This study presents a methodology to develop a wind power atlas for mainland Portugal, using the well known state-of-the-art mesoscale weather prediction model - MM5. The data used in this work for validation purposes was the observed wind speed and direction collected in four stations located in the west coast of Portugal, during 1999. The intra annual variability was assessed with help of these reference masts operated by INETI, so that outputs from model can be representative of the long term wind resource.
2 Methodology
An Atlas, to be representative of the wind potential of a country or region, demands the characterization of the spatial variability of the wind in the terrain surface, and has to include the state of the art techniques to address its time dependency. A possible methodology consists on the application of numerical resolution processes to the mesoscale atmospheric models. They permit not only the introduction of the orographic characteristics of each region and the description its conditioning phenomena – such as the stratification and atmospheric turbulence effects – but also the calculation of the temporal variability of the atmospheric variables under study together with their mean yearly contribution for the wind energy assessment. Therefore it is possible to obtain maps of the wind energy resource and estimates being the results of the simulations compared with in situ measurements from four selected INETI’s anemometric stations. The simulations were performed for the year 1999, and the results were corrected with a mean deviation factor in order to consider the intra annual variability of the wind.
2.1 Anemometric Stations from INETI
Table 1 shows the name of each station and also the position and sensor’s height.
HEIGHT OF SENSORS STATION
STATION ALTITUDE
(A.G.L) Velocity Direction
IN_01 S. J Lampas 152m 10m 10m
IN_04 Vila do Bispo 104m 10m 10m
IN_32 Gardunha 1210m 10m 20m
IN_33 Arruda 398m 10m 20m
Table 1: INETI’s wind stations selected for the scope of this work. Figure 1 shows the location for each mast in mainland Portugal.
Figure 1: Location of INETI’s stations for wind comparing results and assessing the intra annual variability. 2.2 The mesoscale model (MM5)
In order to develop this Atlas, INETI has selected the MM5 “Fifth generation Mesoscale Model” – developed by the PSU /NCAR – “Pennsylvania State University / National Center for Atmospheric Research, EUA”, running the version 3.7.0. This model is fairly updated in what concerns the physics formulation, and presents the advantage of being freeware. Also, it’s continually being improved by it’s users in universities and research institutes all over the world. Basically, this is a regional model capable to simulate local thermal or shearing phenomena (e.g. sea-breeze circulations among others) in a sigma [2] coordinate grid which follows and describes the terrain. A set of independent modules are included in the main program. As an example the TERRAIN and REDGRID modules interpolate the surface meteorological data and the analysis to the simulation domains. These programs define the domain and projection of the topography and soil occupation maps. It is also possible to define nested domains in order to increase the resolution and the precision of the simulations. The terrain module processes the orography and accepts data from different sources, as an example, the high resolution geographic database GTOPO30 [3]. The REGRID module uses the analysis data as a model “first guess” and executes, at a later phase, interpolations of the meteorological parameters to all the points of the grid defined for the main domain and sub-domains. The INTERPF module performs the vertical interpolation of the pressure levels for the sigma coordinate system and generates boundary conditions for the model. The NESTDOWN
module generates boundary conditions in order to initiate the MM5 model with a higher spatial resolution using the prognostic fields produced by the model. 2.3 Boundary and initial conditions In order to perform the simulations, a set of four one-way nested domains were created and presented in figure 2
Figure 2: Domain simulations in MM5 for the developing of the wind Potential Atlas for Mainland Portugal. Table 2 shows the grid point dimensions, spatial resolution and model step time.
Domain Grid dimensionsnx×ny×nσ
Spatial resolution
Model Step (s)
D1 52×63×32 81 km 240 D2 54×72×32 27 km 81 D3 111×96×32 9 km 27 D4 171×276×32 3 km 9
Table 2: Domain dimensions and model step of the simulations.
The numerical simulations were performed by using the NCAR -“National Center for Atmospheric Research” - (Reanalysis project) [4] analysis, containing the 3D fields of the meteorological variables in 17 different vertical levels and 5 soil levels. All the simulations were carried out using the analysis of the 00h, 06h, 12h e 18h daily TUC, being used as boundary conditions for domain 1 (81km of spatial resolution). In order to save computational effort time, each of the four domains was modelled separately. The results of the simulation were saved every two hours. Once the simulation with domain 1 (boundary conditions ingested every 6h) was finished then that data was introduced in the NESTDOWN module in order to generate the boundary conditions
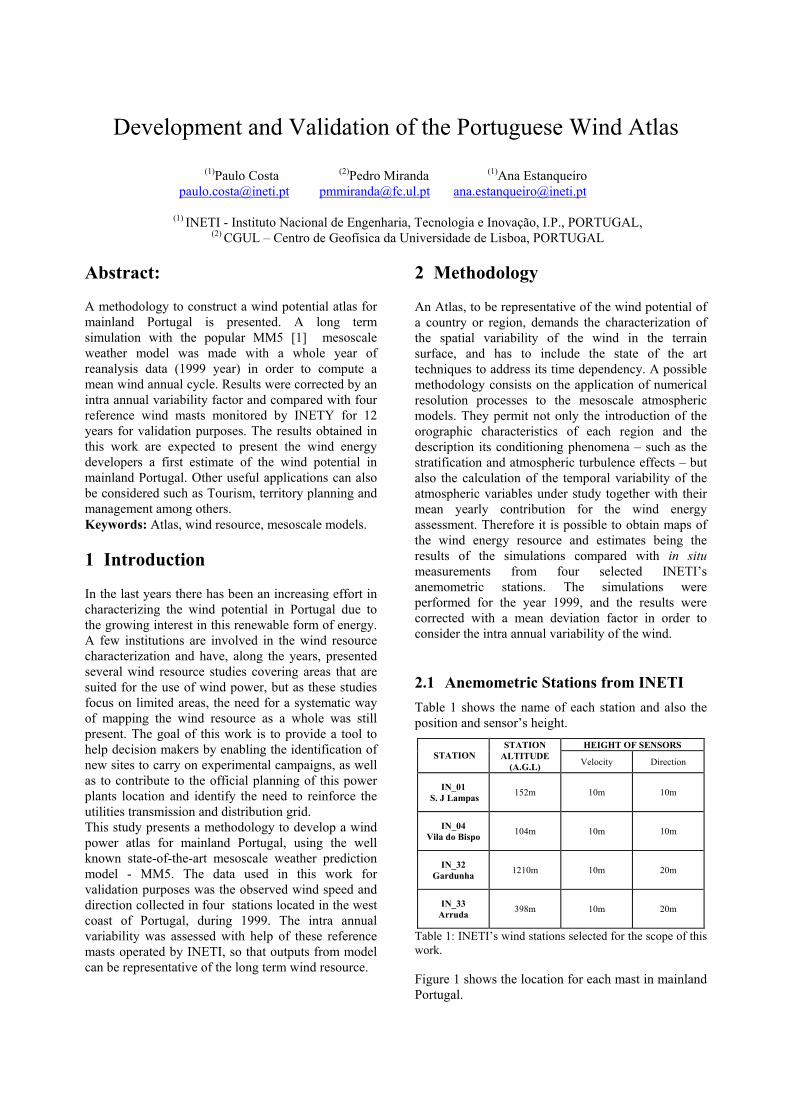
for domain 2. The new results obtained for this simulation (domain 2) were again saved every two hours. From this point on, the process becomes cyclic until the most refined grid – 3 x 3 km (domain 4) – was obtained. The wind potential maps presented in this work are the corrected outputs simulated with this domain. 2.4 Roughness and terrain characterization The topography of mainland Portugal, was represented in the numerical simulations, by using the digital terrain model from geographic database of the GTOPO30 - “Global 30 arc-second TOPOgraphic data” Project, developed by the USGS – “United States Geological Survey” [4]. In this project, the spatial resolution of altimetry is approximately 1km, being interpolated to 3km by module TERRAIN in MM5. The roughness used in the simulations was obtained at the same database, being the soil occupation classified in 24 different classes (e.g. forest, water, etc). Terrain and mean roughness parameter (z0), are presented in figure 3.
(a) (b)
Figure 3: (a) altimetry; (b) mean roughness parameter. Spatial resolution of 3X3km 3 Methodology results
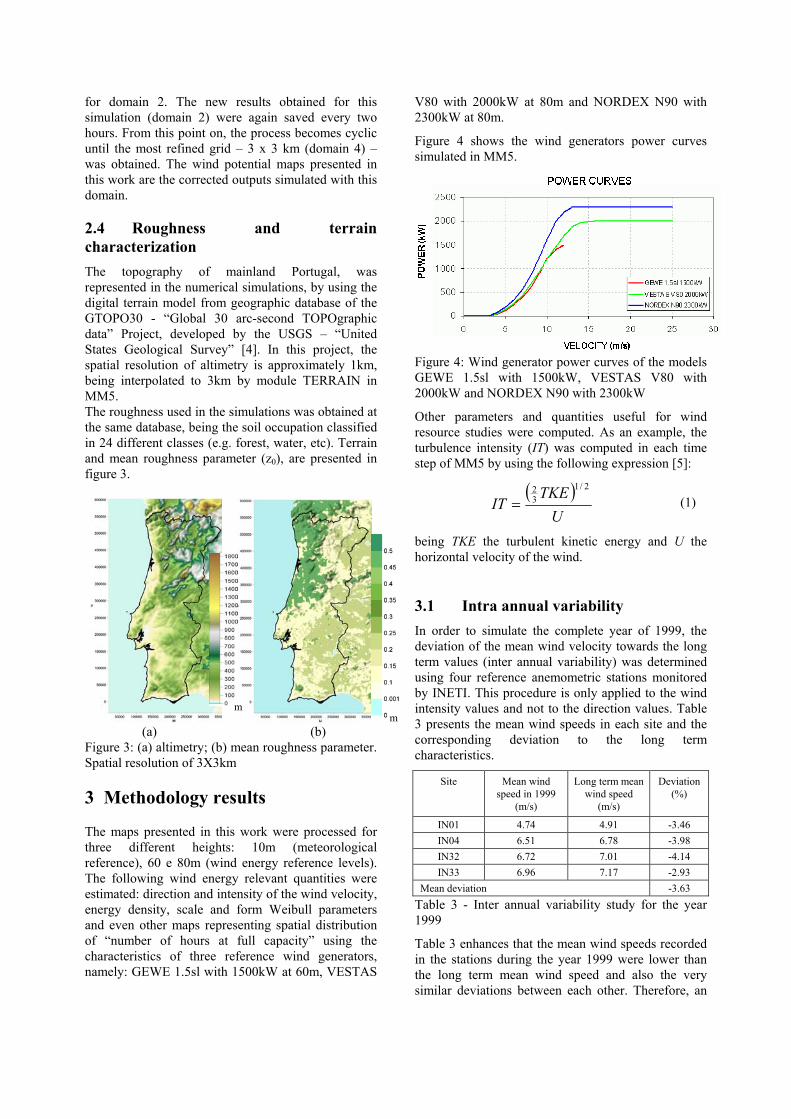
The maps presented in this work were processed for three different heights: 10m (meteorological reference), 60 e 80m (wind energy reference levels). The following wind energy relevant quantities were estimated: direction and intensity of the wind velocity, energy density, scale and form Weibull parameters and even other maps representing spatial distribution of “number of hours at full capacity” using the characteristics of three reference wind generators, namely: GEWE 1.5sl with 1500kW at 60m, VESTAS
V80 with 2000kW at 80m and NORDEX N90 with 2300kW at 80m.
Figure 4 shows the wind generators power curves simulated in MM5.
Figure 4: Wind generator power curves of the models GEWE 1.5sl with 1500kW, VESTAS V80 with 2000kW and NORDEX N90 with 2300kW
Other parameters and quantities useful for wind resource studies were computed. As an example, the turbulence intensity (IT) was computed in each time step of MM5 by using the following expression [5]:
( )U
TKEIT
2/132
= (1)
being TKE the turbulent kinetic energy and U the horizontal velocity of the wind.
3.1 Intra annual variability In order to simulate the complete year of 1999, the deviation of the mean wind velocity towards the long term values (inter annual variability) was determined using four reference anemometric stations monitored by INETI. This procedure is only applied to the wind intensity values and not to the direction values. Table 3 presents the mean wind speeds in each site and the corresponding deviation to the long term characteristics.
Mean deviation -3.63 Table 3 - Inter annual variability study for the year 1999
Table 3 enhances that the mean wind speeds recorded in the stations during the year 1999 were lower than the long term mean wind speed and also the very similar deviations between each other. Therefore, an
m m
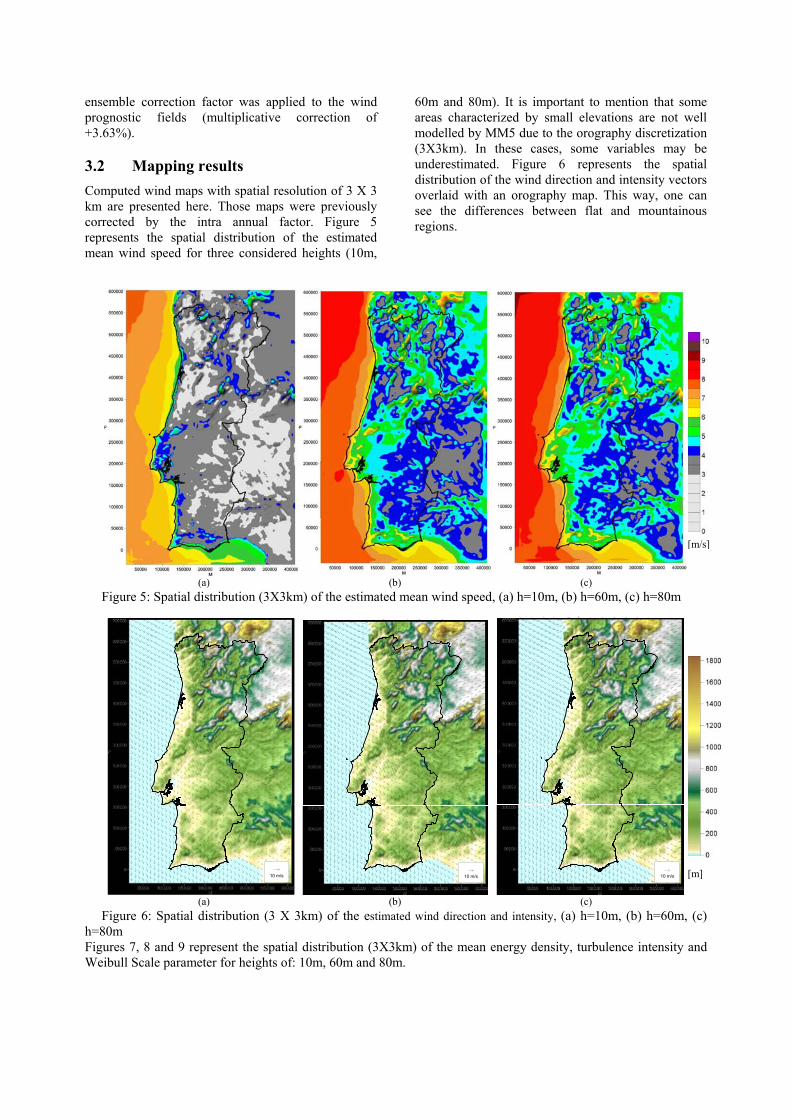
ensemble correction factor was applied to the wind prognostic fields (multiplicative correction of +3.63%). 3.2 Mapping results Computed wind maps with spatial resolution of 3 X 3 km are presented here. Those maps were previously corrected by the intra annual factor. Figure 5 represents the spatial distribution of the estimated mean wind speed for three considered heights (10m,
60m and 80m). It is important to mention that some areas characterized by small elevations are not well modelled by MM5 due to the orography discretization (3X3km). In these cases, some variables may be underestimated. Figure 6 represents the spatial distribution of the wind direction and intensity vectors overlaid with an orography map. This way, one can see the differences between flat and mountainous regions.
(a) (b) (c) Figure 5: Spatial distribution (3X3km) of the estimated mean wind speed, (a) h=10m, (b) h=60m, (c) h=80m
10 m/s
10 m/s
10 m/s
(a) (b) (c) Figure 6: Spatial distribution (3 X 3km) of the estimated wind direction and intensity, (a) h=10m, (b) h=60m, (c) h=80m Figures 7, 8 and 9 represent the spatial distribution (3X3km) of the mean energy density, turbulence intensity and Weibull Scale parameter for heights of: 10m, 60m and 80m.
[m/s]
[m]
(a) (b) (c)
Figure 7: Spatial distribution (3X3km) of the estimated mean energy density, (a) h=10m, (b) h=60m, (c) h=80m
(a) (b) (c)
Figure 8: Spatial distribution (3X3km) of the estimated turbulence intensity [%], (a) h=10m, (b) h=60m, (c) h=80m
(a) (b) (c)
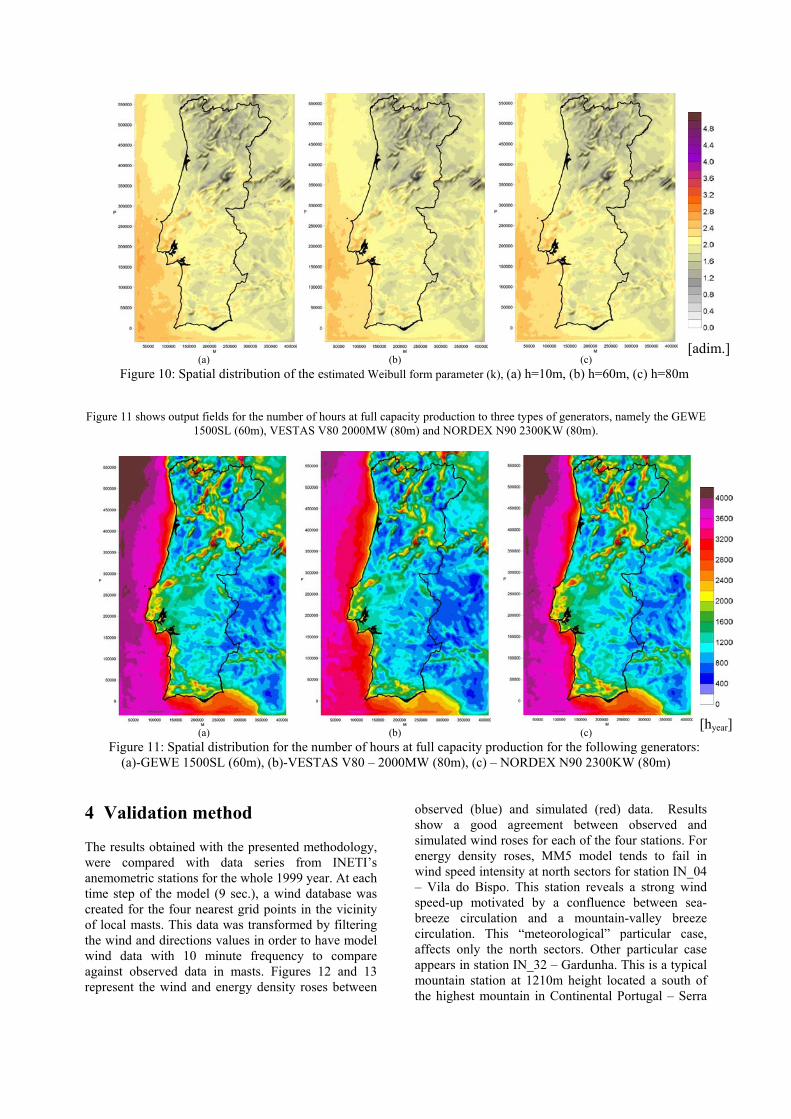
Figure 9: Spatial distribution (3X3km) for Weibull Scale parameter, (a) h=10m, (b) h=60m, (c) h=80m Figure 10 represent the Weibull form parameter (spatial resolution of 3X3km) for heights 10m, 60m and 80m.
[%]
[W/m2]
[m/s]
(a) (b) (c)
Figure 10: Spatial distribution of the estimated Weibull form parameter (k), (a) h=10m, (b) h=60m, (c) h=80m
Figure 11 shows output fields for the number of hours at full capacity production to three types of generators, namely the GEWE 1500SL (60m), VESTAS V80 2000MW (80m) and NORDEX N90 2300KW (80m).
(a) (b) (c)
Figure 11: Spatial distribution for the number of hours at full capacity production for the following generators: (a)-GEWE 1500SL (60m), (b)-VESTAS V80 – 2000MW (80m), (c) – NORDEX N90 2300KW (80m)
4 Validation method
The results obtained with the presented methodology, were compared with data series from INETI’s anemometric stations for the whole 1999 year. At each time step of the model (9 sec.), a wind database was created for the four nearest grid points in the vicinity of local masts. This data was transformed by filtering the wind and directions values in order to have model wind data with 10 minute frequency to compare against observed data in masts. Figures 12 and 13 represent the wind and energy density roses between
observed (blue) and simulated (red) data. Results show a good agreement between observed and simulated wind roses for each of the four stations. For energy density roses, MM5 model tends to fail in wind speed intensity at north sectors for station IN_04 – Vila do Bispo. This station reveals a strong wind speed-up motivated by a confluence between sea-breeze circulation and a mountain-valley breeze circulation. This “meteorological” particular case, affects only the north sectors. Other particular case appears in station IN_32 – Gardunha. This is a typical mountain station at 1210m height located a south of the highest mountain in Continental Portugal – Serra
[adim.]
[hyear]
da Estrela with approximately 2000m height. This sharply scarped mountain is not well described by GTOPO30s topography database. This discrepancy
explains why energy density rose from model results enhances the north sectors (due to lack of orography) face to the observed energy density rose.
Figure 12: Wind roses for comparison between the observed data and the Atlas data for the year 1999.
Figure 13: Wind power roses for comparison between the observed data and the Atlas data for the year 1999.
Exhaustive verifications were performed [8,9] but they are out of this paper scope. As an example of data comparison between observed and simulated data: Weibull distributions, dispersion flow charts, correlations, wind velocity and direction series, tables with deviations and root mean-squared errors for wind
direction and velocity for each month and year and tables with Weibull parameters and power flow by each of the 16 direction sectors. After the development and validation of this Atlas other interesting results were produced: for specific
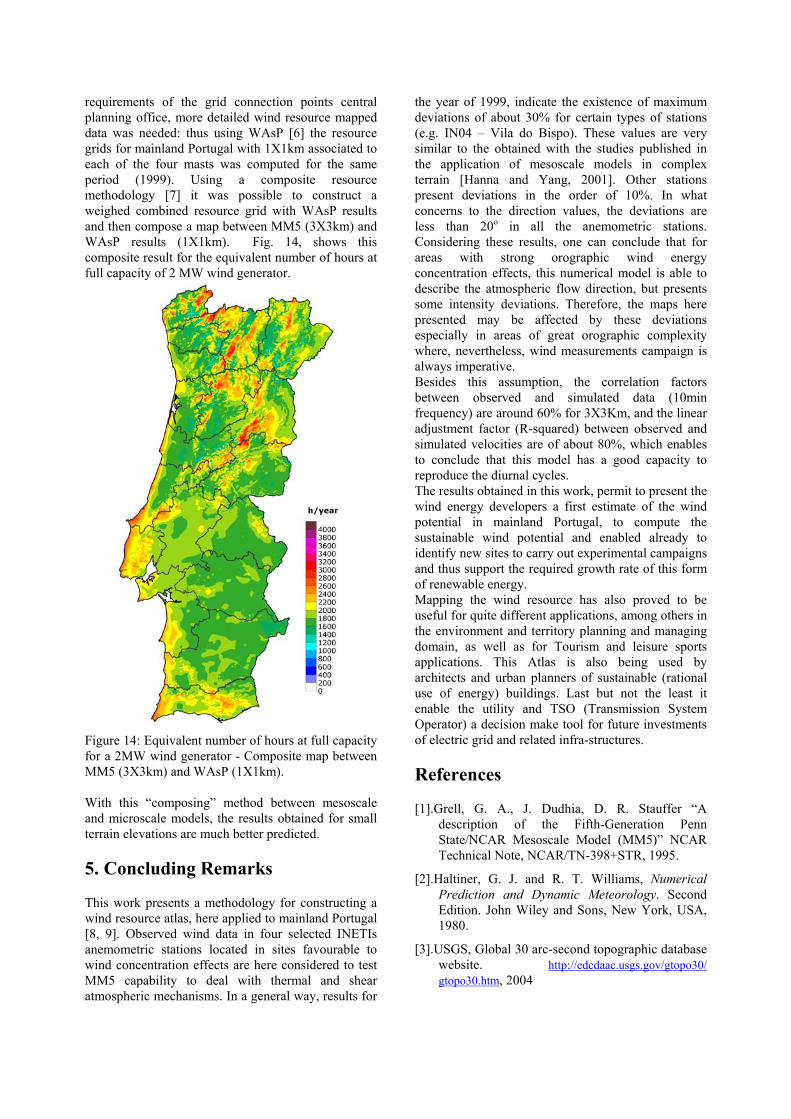
requirements of the grid connection points central planning office, more detailed wind resource mapped data was needed: thus using WAsP [6] the resource grids for mainland Portugal with 1X1km associated to each of the four masts was computed for the same period (1999). Using a composite resource methodology [7] it was possible to construct a weighed combined resource grid with WAsP results and then compose a map between MM5 (3X3km) and WAsP results (1X1km). Fig. 14, shows this composite result for the equivalent number of hours at full capacity of 2 MW wind generator.
Figure 14: Equivalent number of hours at full capacity for a 2MW wind generator - Composite map between MM5 (3X3km) and WAsP (1X1km). With this “composing” method between mesoscale and microscale models, the results obtained for small terrain elevations are much better predicted. 5. Concluding Remarks
This work presents a methodology for constructing a wind resource atlas, here applied to mainland Portugal [8, 9]. Observed wind data in four selected INETIs anemometric stations located in sites favourable to wind concentration effects are here considered to test MM5 capability to deal with thermal and shear atmospheric mechanisms. In a general way, results for
the year of 1999, indicate the existence of maximum deviations of about 30% for certain types of stations (e.g. IN04 – Vila do Bispo). These values are very similar to the obtained with the studies published in the application of mesoscale models in complex terrain [Hanna and Yang, 2001]. Other stations present deviations in the order of 10%. In what concerns to the direction values, the deviations are less than 20o in all the anemometric stations. Considering these results, one can conclude that for areas with strong orographic wind energy concentration effects, this numerical model is able to describe the atmospheric flow direction, but presents some intensity deviations. Therefore, the maps here presented may be affected by these deviations especially in areas of great orographic complexity where, nevertheless, wind measurements campaign is always imperative. Besides this assumption, the correlation factors between observed and simulated data (10min frequency) are around 60% for 3X3Km, and the linear adjustment factor (R-squared) between observed and simulated velocities are of about 80%, which enables to conclude that this model has a good capacity to reproduce the diurnal cycles. The results obtained in this work, permit to present the wind energy developers a first estimate of the wind potential in mainland Portugal, to compute the sustainable wind potential and enabled already to identify new sites to carry out experimental campaigns and thus support the required growth rate of this form of renewable energy. Mapping the wind resource has also proved to be useful for quite different applications, among others in the environment and territory planning and managing domain, as well as for Tourism and leisure sports applications. This Atlas is also being used by architects and urban planners of sustainable (rational use of energy) buildings. Last but not the least it enable the utility and TSO (Transmission System Operator) a decision make tool for future investments of electric grid and related infra-structures. References
[1].Grell, G. A., J. Dudhia, D. R. Stauffer “A description of the Fifth-Generation Penn State/NCAR Mesoscale Model (MM5)” NCAR Technical Note, NCAR/TN-398+STR, 1995.
[2].Haltiner, G. J. and R. T. Williams, Numerical Prediction and Dynamic Meteorology. Second Edition. John Wiley and Sons, New York, USA, 1980.
[3].USGS, Global 30 arc-second topographic database website. http://edcdaac.usgs.gov/gtopo30/ gtopo30.htm, 2004
[4].Kalnay, E. et al. “The NCEP/NCAR 40-Year Reanalysis Project”. Bull. Amer. Meteor. Soc. 77, pp. 437-471.
[5].Undheim, O. “Comparison of turbulence models for wind evaluation in complex terrain”. Proceedings of the European Wind Energy Conference, EWEC 2003, Madrid, Spain.
[6].Mortensen, N. G., L. Landeberg, I. Troen, E. L. Petersen, Wind Atlas Analysis and Application Program – WAsP. Risø National Laboratory, 1993.
[7].Costa, P., A. Estanqueiro, “A Methodology to Compute Wind Resource Grids in Complex Terrain Based on Multiple Anemometric Stations”. European Wind Energy Conference, EWEC 2003, Madrid, Spain.
[8].Costa, P. Atlas do Potencial Eólico para Portugal Continental. Master’s Thesis, Faculty of Sciences – University of Lisbon, 2004.
[9].Costa, P. et. al., Atlas do Potencial Eólico para Portugal Continental. CD-ROM Publication, INETI, 2004.


![Sondagem de Belverde (Bacia do Baixo Tejo, …repositorio.lneg.pt/bitstream/10400.9/947/1/28627CD_A 99.pdf · Electrical [SPR (Single-point Resistance) and SP (Spontaneous Potential)],](https://static.documents.pub/doc/80x56/5b9b1d1509d3f291158c9e19/sondagem-de-belverde-bacia-do-baixo-tejo-99pdf-electrical-spr-single-point.jpg)


