Paper for session 49 at the XIV International Economic History Congress, 21 to 25 August 2006, Helsinki, Finland Development Blocks and the Second Industrial Revolution, - Sweden 1900-1974 Kerstin Enflo, Astrid Kander and Lennart Schön Abstract The paper explores development blocks around electrification at a 14 sector level in the Swedish economy 1900-1974. We suggest that long-run cointegration relations in combination with mutually Granger-causing short-run effects form a development block. One block centred on electricity that comprises five more sectors is found. In addition we demonstrate that increasing its electricity share makes a sector grow faster, and by testing the electricity share versus the growth rates we find another development block around electricity, party overlapping the first one. Key words: development block, electricity, GPT, second industrial revolution Kerstin Enflo and Lennart Schön Astrid Kander Department of Economic History CIRCLE Lund University Lund University Box 7083 Box 117 220 07 Lund 221 00 Lund 1
Transcript
Paper for session 49 at the XIV International Economic History
Congress, 21 to 25 August 2006, Helsinki, Finland
Development Blocks and the Second Industrial Revolution,
- Sweden 1900-1974
Kerstin Enflo, Astrid Kander and Lennart Schön
Abstract
The paper explores development blocks around electrification at a 14 sector
level in the Swedish economy 1900-1974. We suggest that long-run
cointegration relations in combination with mutually Granger-causing short-run
effects form a development block. One block centred on electricity that
comprises five more sectors is found. In addition we demonstrate that increasing
its electricity share makes a sector grow faster, and by testing the electricity
share versus the growth rates we find another development block around
electricity, party overlapping the first one.
Key words: development block, electricity, GPT, second industrial revolution
Kerstin Enflo and Lennart Schön Astrid Kander Department of Economic History CIRCLE Lund University Lund University Box 7083 Box 117 220 07 Lund 221 00 Lund
1
Sweden Sweden
2
1. Introduction The aim of this paper is to explore the development block around electricity and its impact
upon growth during the second industrial revolution. There have been two major empirical
studies of Swedish industry using the development block approach. One is Erik Dahmén’s
(1950) formative study of Swedish entrepreneurial activity in the interwar period performed
primarily on a micro and branch level. The other is Lennart Schön’s (1990) study of
electricity and industrial development that inter alia connects the use of electricity to
innovative structural change and to the growth of relatively knowledge intensive industries.
The links within development blocks are complex, however. Our ambition is to bring this
kind of analyses one step further by investigating growth patterns and electrification in
Sweden to assess the options of identifying such development blocks and their importance for
growth quantitatively.
Development blocks should in principle be possible to identify with the means of
cointegration analyses. A first reasonable expectation is that sectors that form a development
block would be cointegrated, i. e. their long-run growth would be driven by a common
stochastic trend. This stochastic trend could be seen as consisting of the specific technology
of that block in a wide sense, but it might be influenced by business fluctuations driven by
demand and export as well. Still, if electricity is an important component of that new
technology, the electricity-producing sector should be cointegrated with every other sector of
the block. Second, the direction of causation in the short-term of the production of the sectors
should be marked by many mutually reinforcing connections within the development block,
rather than one sector Granger causing another, since a basic idea of the development block is
that activities are complementary.
Third, if electrification is a central kernel in a development block that drives growth it should
be possible to detect a correlation between the electricity use of an industry and its growth
rate. However, energy play very different roles in the production of sectors, some being heavy
energy users and others light users. Thus it is not the electricity intensity (electricity divided
by value added) but rather the electricity share of total energy use that would affect the
growth rate of the sector.
Recently Moser and Nicholas (2004) have used historical patent citations in order to evaluate
whether electricity was a general purpose technology. The method used here is also
quantitative, but rather than tracing patent links it traces the links between the value added of
3
sectors, and is thus a different method, but with the aim of answering a related question to that
of general purpose technologies: are there any development blocks around electricity?
The outline of the paper is as follows:
Section 2 is a theoretical and historical section around development blocks and the second
industrial revolution, with growth implications. Section 3 describes the data that we use to test
the idea of development blocks centred on electrification. Section 4 explains the method of
cointegration analyses. Section 5 shows the results of our testing of development blocks.
Section 6 sums up the discussion.
2. Theory
2.1 Development blocks and growth
The concept of development blocks was first formulated by Dahmén (1950, 1988) and was
influenced by the Schumpeterian idea of creative destruction (Carlsson and Henriksson 1991).
It is part of an evolutionary approach to economic growth, according to which growth is not
an even process over time, but takes place due to transformations and leads to structural
change of the GDP composition. Early on the basis for development blocks was said to be
new technologies, especially in the fields of communication and transportation that widened
into broad societal impact (Schön: 1990, 1991, 1994, 2000a, 2000b).
Electrification of industry provides a good starting point for an analysis of industrial growth
in the long-term perspective. Electricity has been central to Swedish industrial development
and electrification constitutes a development block with strong potentials and
complementarities. In addition, the electrification of industry required large simultaneous
efforts in the generation and distribution of electrical power and in the development of the
electro-technical industry and of industries consuming electricity and stimulated and was
stimulated by urbanization with the concentration of goods, labor and knowledge. Thus, the
concept of development block provides the framework for the analysis of this pattern of
electrification, focusing on the inter-relations of power generation, the electro-technical
4
industry and the industrial development, leading to shifts in supply and demand functions for
electricity.
With the advent of the IT-revolution, many economists noticed the occurrence of radical
innovations and technological shifts and in the mid-1990s the concept of General Purpose
Technologies, GPTs, was launched (Helpman, 1998, Bresnahan, T. F., E. Brynjolfson, and L.
M. Hitt 1999). Radical innovations tend to develop into GPTs. That is however a drawn-out
process that may stretch over generations. The concept development block, that combines the
characteristics of the innovation with economic relations, captures the main dynamics of this
process. The basic innovation enters into different development blocks over time on its path to
becoming a GPT. The innovation creates new complementarities – i.e. dependencies between
specific functions or properties within the production process or between production and
infrastructure or institutions that take time to bring forth and when accomplished the
complementary factors mutually increase their marginal returns. Fulfilling a development
block with radically new complementarities is a time consuming investment process.
Breakthrough periods of new important development blocks – periods of industrial
revolutions really qualify in this respect – are characterised by severe imbalances in growth,
bottlenecks that may direct investments and strong tendencies towards divergence between
branches and regions in growth performance.
Furthermore, in the breakthrough period, or period of structural transformation, the
positive contribution on productivity from technical change tends to be hampered by the
imbalances or bottlenecks in the economy. Complementarities are insufficiently provided for
(Schön 1991, 1998). A productivity paradox, i.e. rapid technical change coinciding with slow
productivity growth, appeared not only with the computer in the 1980s but also with the
breakthrough of electricity in industry (David 1990, Schön 1990).
The GPT as drastic innovations characterized by pervasiveness in use and
innovational complementarity has recently been integrated in endogenous growth models, for
instance by Petsas (2003) and Carlaw and Lipsey (2006).
The evolutionary growth perspective, with some branches taking the lead and
interacting with others in a complementary way, has been examined for Sweden for the period
1968 and onwards (Lundquist, Olander and Svensson Henning: 2005, 2006). Strong
empirical support for the idea of complementarities in growth processes in time and space has
5
been found simply by characterizing the growth rates of value added in a broad number of
branches in different periods.
This paper takes on the challenge of investigating Swedish economic growth
according to the development block ideas in an earlier period (1900-1970) and uses advanced
time series analyses, called cointegation analyses, to trace such linkages in the economic
growth process with specific emphasis on the role of electrification. The period under
investigation here is the period of the second industrial revolution.
2.2 The second industrial revolution
Sometimes it is stressed that there are three main clusters of technologies that
characterize the economic development, profound enough in socio-economic impact to be
referred to as the first, second and third industrial revolution. All three industrial revolutions
centered on innovations in the field of energy systems.
The first industrial revolution centred on an innovation in the field of inanimate power:
the steam engine. Steam engines replaced traditional energy sources but also provided power
for new fields of usage. They had several advantages, compared to traditional prime movers
that affected substitution patterns. The main advantage compared to animate power was that
the steam engine was more powerful. Compared to waterwheels its main advantage was that it
was site-independent. Steam engines not only replaced other prime movers; they also opened
up new application possibilities for prime movers. For instance steam powered railways
revolutionized land transportation. The third industrial revolution can be dated to the Mid 1970s, when the growth phase
for microelectronics took off with the miniaturisation of hardware for information treatment,
manifested in the microprocessor.1 It was a revolution in information treatment and exchange
relying on low-tension electricity just like the previous profound breakthroughs in
communication: the telegraph and the telephone.
The Second Industrial Revolution (or the Big Wave, Gordon 1999) was to structure
economic growth from the 1890s up until the late twentieth century. Thus, the concept of the
Second Industrial revolution can, as every industrial revolution, be understood in two ways
that do not exclude each other. In one perception it was a discontinuous event that within a
short time-span (a few decades) created new conditions technically, structurally and
6
institutionally for economic growth. In another conception it represented a set of forces that
unfolded itself during almost a century. In recent decades, much research has focussed on this
chain of events, allegedly giving birth to the modern industrial society.
At the heart of the Second Industrial Revolution there was a series of innovations
that went through a marked acceleration in their diffusion during the 1890s with far-reaching
repercussions on growth and society. And in the midst of this bunch of innovations were new
power-machines – the electric motor and the combustion engine. As is usually the case, the
basic innovations were born some decades earlier but complementary innovations (such as
three-phase alternate current and new transmission technique in the technology of electricity)
and economic expansion after the Baring crisis made diffusion more discontinuous and
compressed in time.
The breakthrough of the electrical motor and the combustion engine liberated
economic growth from a set of constraints that in the course of the nineteenth century had
become more inhibiting with industrial expansion. These constraints concerned the supply
and price of energy, the localisation of industry and the organisation of the industrial work
process (Schön 1990). From the 1870s the relative price of coal and firewood rose
significantly. There was a fear that industrial growth would be stifled by a shortage of energy.
The breakthroughs of the electrical dynamo and the combustion engine as forceful power
technologies widened energy supply and fear turned into new optimism. Running water had
for centuries been utilised as power source, transmitted mechanically to the working machines
at site. By the late nineteenth century, however, almost all reasonably available hydropower
was taken into use. There were large unutilised resources but in more remote areas such as
mountainous regions disfavoured by high transport costs. With a new transmission
technology, enabled by the three-phase alternating current, the supply of hydropower became
much more elastically available. Thus resources increased. Furthermore, with long-distance
transmission of electricity – irrespective of primary energy source - the location of industries
could be selected from a new basis of rationality, where markets were close at hand and where
labour-power or skills were plentiful. This gave rise to broader industrial environments, where
crucial knowledge, competence and skills could be utilised more efficiently and flexibly. The
innovating capacity was enhanced. For different reasons, also the combustion engine gave a
greater flexibility in choice of location. As a liquid fuel, petroleum was comparatively easy to
transport and handle. In regions or countries of plentiful petroleum resources, the combustion
7
engine became a prime mover. In every corner of the modern or modernising world, however,
it became prominent in transportation.
Also within the plants a new flexibility was created through the electrical motor or
the combustion engine. Mechanised factories driven by steam engines or direct waterpower
was constructed around the power machine from which the motive power was transmitted
mechanically via belts, cables and rotating shafts. Apart from all environmental damages – the
working site was noisy, dirty and dangerous – the mechanical transmission meant certain
constraints and indivisibilities in industrial organisation. The returns to increased
mechanisation or to division of labour between specialised machinery units were diminished
by these constraints. With small powerful motors and more sophisticated specialised
machinery a new organisation based on unit drive, i.e. one motor on each working machine,
developed during the first decades of the twentieth century
The power machines did not stand alone, though. The appearance of a radically new
steel technology in the last decades of the 19th century created other prerequisites for new
industrial growth. For one thing, the use of steel of higher qualities and in larger quantities
made machine technology more competitive and pervasive, particularly in conjunction with
new power machines. Steel also became the new material in constructions, in infrastructures,
in vehicles and vessels – i.e. there were wide potentials in power machines and steel as
kernels in new development blocks. Alongside with the new steel technology a new organic
chemistry, mainly based on coal, arose. Scientific knowledge in chemistry became input in
the production of steel and paper as well as of fertilisers, dyes, pharmaceutical drugs etc. And
in information technology, the advent of the telephone and the wireless radio made
communications much more flexible than before. In all, this swarm of innovations
strengthened modern economic growth and industrialisation became a more encompassing
social adventure and a more attractive path to follow.
To assess the full economic impact of these new technologies in quantitative terms is
impossible, because they are so complex. The direct growth effects that stem from the growth
of industries and branches involved with production of the new engines and related systems of
energy and communication may not justify the term industrial revolutions, but the indirect
effects on growth are substantial.
8
The indirect growth effects of the technologies of the second industrial revolutions were at
least fourfold. First, the new engines in sea, land and air transportation implied increasing
market integration with concomitant specialisation and economies of scale, which increased
overall economic efficiency and growth. Second, the new engines established a growing
production apparatus that augmented the motive power at the workers’ disposal. The stock of
machinery grew incrementally and brought about a long-term growth of industrial production.
Third, the new engines enabled more efficient organisations of production. This was
particularly so with electric engines when applied to group-drive or unit-drive. Fourth, the
new technologies went hand in hand with human capital development, since there was a skill-
technology complementarity especially in the electricity production and manufacturing of
electro-technical equipment (Goldin and Katz: 1986).
Diverging effects can be discerned from the Second Industrial Revolution in the midst of the
Gold Standard period. Growth pattern changed from 1890 (Schön: 2006, forthcoming).
Convergence became weaker and there was rather divergence in growth with different
responses to the revolutionary transformation of industry. In the period 1870-1890
convergence was much more pervasive and growth rates much more even among countries.
Growth was especially strong in the 1890s in a belt down from Scandinavia through
Germany, Austria, and Switzerland to northern Italy. Germany had an industrial structural
change similar to Sweden (or vice versa). Engineering industries and new chemical industries
expanded. Engineering industries or new knowledge intensive industries – with electro
technology as one outstanding part – were important also in the rest of the countries in this
group.
This paper focuses on one of the two radical innovations of the second industrial revolution:
electricity and we thus leave the combustion engine and oil aside for a later occasion. Our aim
is to analyse how specific development blocks form at the sectoral level, and we expect that
sectors that were early adopters and producers of electricity should take a lead of the
evolution and be mutually connected within certain development blocks. If electricity was an
important factor in driving growth in Sweden, Germany and Italy after 1890 we should be
able to find evidence of strong development blocks around electricity and fast growth of
electrifying sectors.
9
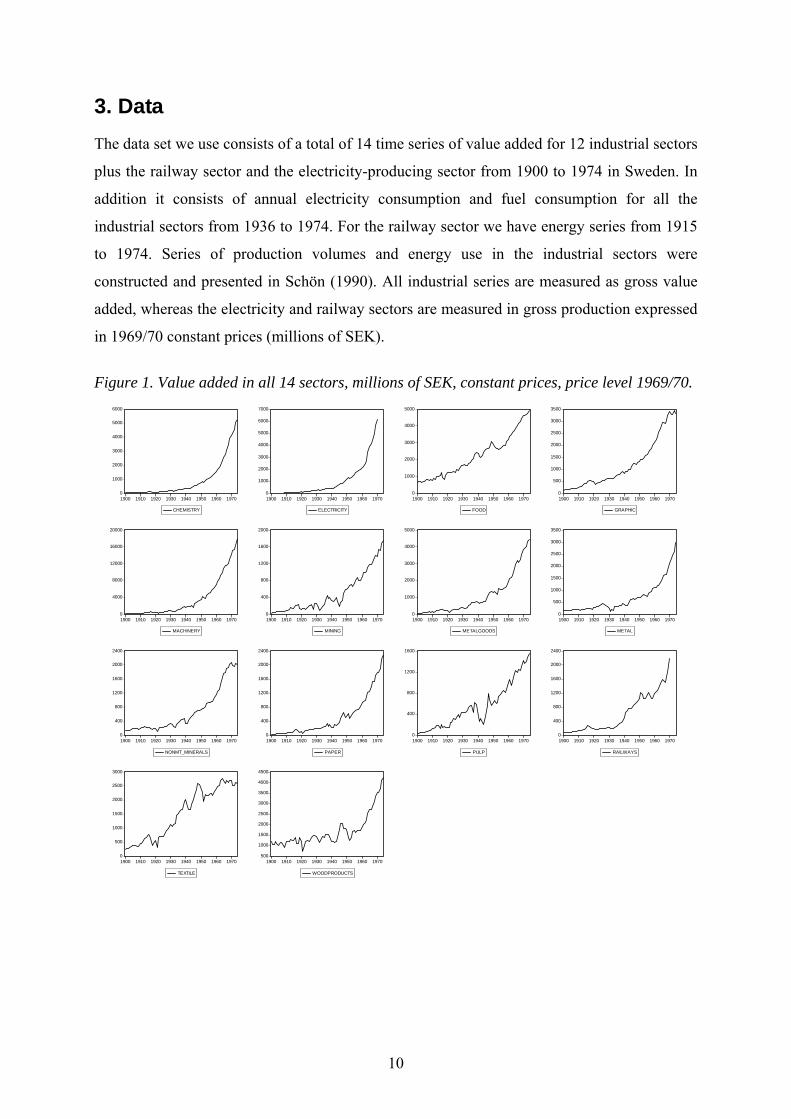
3. Data The data set we use consists of a total of 14 time series of value added for 12 industrial sectors
plus the railway sector and the electricity-producing sector from 1900 to 1974 in Sweden. In
addition it consists of annual electricity consumption and fuel consumption for all the
industrial sectors from 1936 to 1974. For the railway sector we have energy series from 1915
to 1974. Series of production volumes and energy use in the industrial sectors were
constructed and presented in Schön (1990). All industrial series are measured as gross value
added, whereas the electricity and railway sectors are measured in gross production expressed
in 1969/70 constant prices (millions of SEK).
Figure 1. Value added in all 14 sectors, millions of SEK, constant prices, price level 1969/70.
0
1000
2000
3000
4000
5000
6000
1900 1910 1920 1930 1940 1950 1960 1970
CHEMISTRY
0
1000
2000
3000
4000
5000
6000
7000
1900 1910 1920 1930 1940 1950 1960 1970
ELECTRICITY
0
1000
2000
3000
4000
5000
1900 1910 1920 1930 1940 1950 1960 1970
FOOD
0
500
1000
1500
2000
2500
3000
3500
1900 1910 1920 1930 1940 1950 1960 1970
GRAPHIC
0
4000
8000
12000
16000
20000
1900 1910 1920 1930 1940 1950 1960 1970
MACHINERY
0
400
800
1200
1600
2000
1900 1910 1920 1930 1940 1950 1960 1970
MINING
0
1000
2000
3000
4000
5000
1900 1910 1920 1930 1940 1950 1960 1970
METALGOODS
0
500
1000
1500
2000
2500
3000
3500
1900 1910 1920 1930 1940 1950 1960 1970
METAL
0
400
800
1200
1600
2000
2400
1900 1910 1920 1930 1940 1950 1960 1970
NONMT_MINERALS
0
400
800
1200
1600
2000
2400
1900 1910 1920 1930 1940 1950 1960 1970
PAPER
0
400
800
1200
1600
1900 1910 1920 1930 1940 1950 1960 1970
PULP
0
400
800
1200
1600
2000
2400
1900 1910 1920 1930 1940 1950 1960 1970
RAILWAYS
0
500
1000
1500
2000
2500
3000
1900 1910 1920 1930 1940 1950 1960 1970
TEXTILE
500
1000
1500
2000
2500
3000
3500
4000
4500
1900 1910 1920 1930 1940 1950 1960 1970
WOODPRODUCTS
10
4. Methods We use cointegration analyses to trace long-run relations between sectors and variables and
Granger causality to trace the short-run relations. We define a development block as
consisting of a number of sectors that share a common long-run trend (i.e. are cointegrated)
and are linked to each other by mutually reinforcing Granger causality. The expectation of
mutually reinforcing linkages in the short term is due to one of the main ideas in the theory of
development blocks: that of complementarity. This econometric approach to studying
sectoral linkages is different from the conventional input-output method that assumes an
instantaneous relationship between the sectors of the economy (Leontief: 1957). Instead we
use time series data to capture the dynamic relations between various industrial sectors, both
in the long and in the short-run. This econometric approach has been utilized in earlier studies
to assess the linkages from particular sectors, such as the financial sector (Odedokun: 1996) or
the construction sector (Chan: 2001) to the rest of the economy. To the best of our knowledge,
this approach has not yet been used as a mean to identify development blocks among several
sectors.
4.1 Cointegration The concept of cointegration can be defined as a systematic co-movement between two or
more non-stationary variables over the long run. A variable is said to be non-stationary when
its mean, variance and covariance are time dependent, meaning that any shock to the variable
will have a permanent effect, as the variable does not revert back to its mean. If two non-
stationary variables are regressed upon each other, the result is likely to be spurious (Granger
and Newbold: 1974), and therefore the econometricians used to opt for taking differences and
logs in order to transform non-stationary variables into stationery ones that can enter into
traditional regressions. A variable that becomes stationary after taking its first differences is
said to be integrated by order one, I(1). The problem with this approach is that the
differencing procedure removes all long-run properties from the series. However, Engle and
Granger (1987) showed that there can be a linear combination between two non-stationary
variables that produce a series which is stationary. If we are able to detect such a linear
combination, the two non-stationary time series are cointegrated, which means that they may
drift from their original means, but that that they follow the same stochastic trend so that they
11
never drift too far apart from each other in the long-run. Thus, if X t and Y t are non-stationary
but cointegrated, there exists some value, β, such that Y t – βX t is stationary.
In order to find out whether our variables are cointegrated we use the Vector Auto Regression
(VAR)-based trace test for cointegration developed by Johansen (1988, 1991). Since this test
is sensitive to the choice of length of the time lag in the original VAR, we use a combination
of information criterias and lag exclusion tests to determine the appropriate lag length, before
testing for cointegration.2 Since the asymptotic distribution of the test statistic for
cointegration depends on the assumptions made with respect to deterministic trends in the
data series and in the cointegration relations, an assumption regarding the underlying trends in
our data needs to be made. All specifications includes intercept in the cointegration relation,
but we only include trends if the variables appear to be trend stationary and if the trend turns
out to be significant. 3
4.2 Vector Error Correction (VEC) The Granger representation theorem (Granger: 1983, Engle and Granger 1987) states that if a
set of variables are cointegrated, there exists a valid error correction representation of the
data. If X t and Yt are cointegrated we can therefore write the following Vector Error
Where Δ is the first-difference operator, Φ and θ are the coefficients of the first-differenced
terms (the short-run parameters) and the α:s measure the speed of adjustment of each variable
to the cointegration relationship. The cointegration relationship is represented by the
expression within brackets, in which the β:s are the cointegration coefficients. The ε:s are
serially uncorrelated error terms.
2 Additional information about VAR-specification is provided in the appendix. 3 We also check the robustness of our findings for different specifications, and it turns out that our tests are robust to alternative specifications.
12
In order to discern short-run linkages between industrial sectors we use the Granger causality
test. The test was proposed by Granger (1969) and is a general approach to detect whether
past values of a series X can be used to determine current values of Y. The test is usually
carried out in a VAR-framework, but in the presence of a cointegration relationship between
X and Y, Granger causality can be determined within the framework of the VEC as specified
in the above equations. With respect to this system, there is one-way Granger-causality
running from X to Y if the Φ2’s are jointly significantly different from zero in the first
equation, but the θ2’s not jointly significantly different from zero in the second. In parallel,
there is one-way Granger causality from Y to X if the θ2’s are jointly significant from zero in
the second equation, but the Φ2’s in the first equation are not. Mutually short-run links are
defined as the two-way Granger causality that occurs when the Φ2’s in the first and the θ2’s in
the second equation both are jointly significant from zero. The two-way Granger causality
describes a scenario in which past values of X determine current values of Y and past values
of Y simultaneously determine current values of X, which means that the two series are
mutually reinforcing each other. The tests are carried out using the Wald-test for the joint null
hypothesis of the above-specified parameters being equal to zero in each equation.
In the absence of a long-run relationship between X and Y, there may still exists short-run
linkages. In that case we have employed the Granger causality test in a VAR with variables in
their differenced form to investigate these linkages.
5. Results
5. 1 Long-run relations
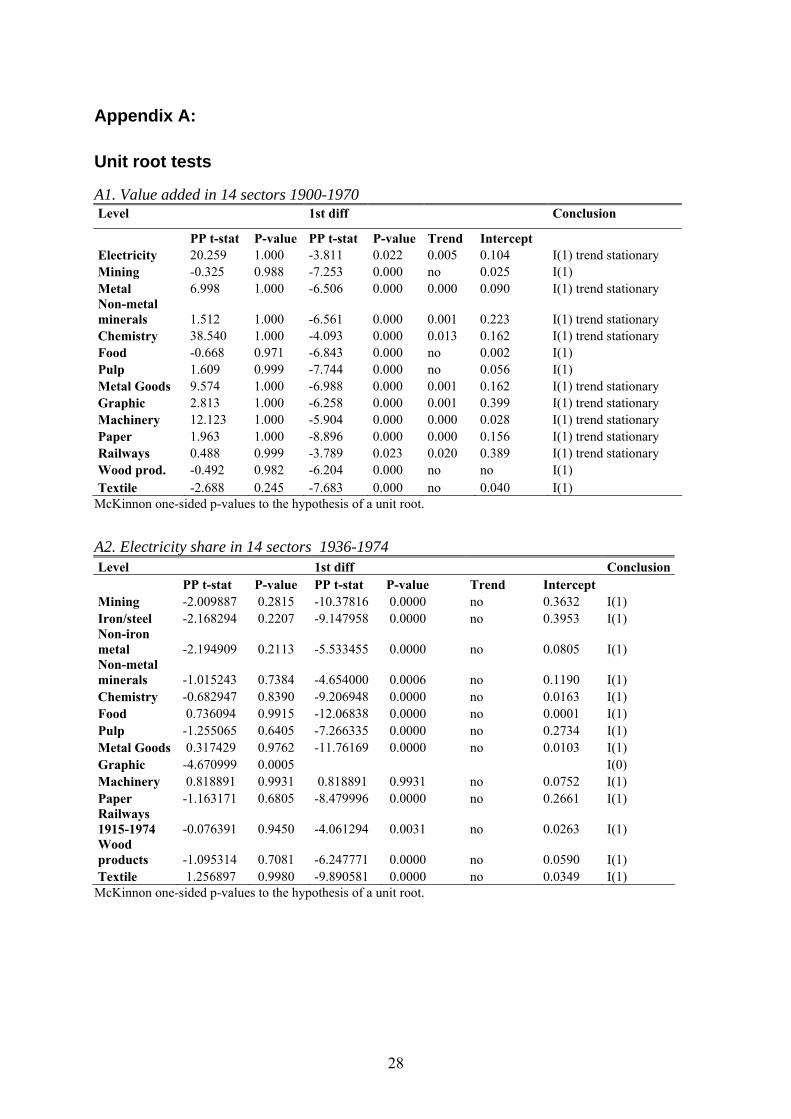
The Phillips-Perron test show that the value added-series in all 14 sectors are non-stationary
and I(1).4 Therefore we proceed by investigating whether we can find any long-run
relationships between pairs of sectors during the second industrial revolution. Since there are
14 sectors, each one can maximally share long-run relationships with all of the other 13
sectors. The results are presented in table 1. In general, there are quite many long-run
relationships between the sectors, which perhaps is not very surprising given that they are part
of the same macroeconomic system. The highest number of cointegration relationships is
found between the graphic industry and 12 other industries and most industries show 9 to 12 4 All unit root tests are reported in the appendix
13
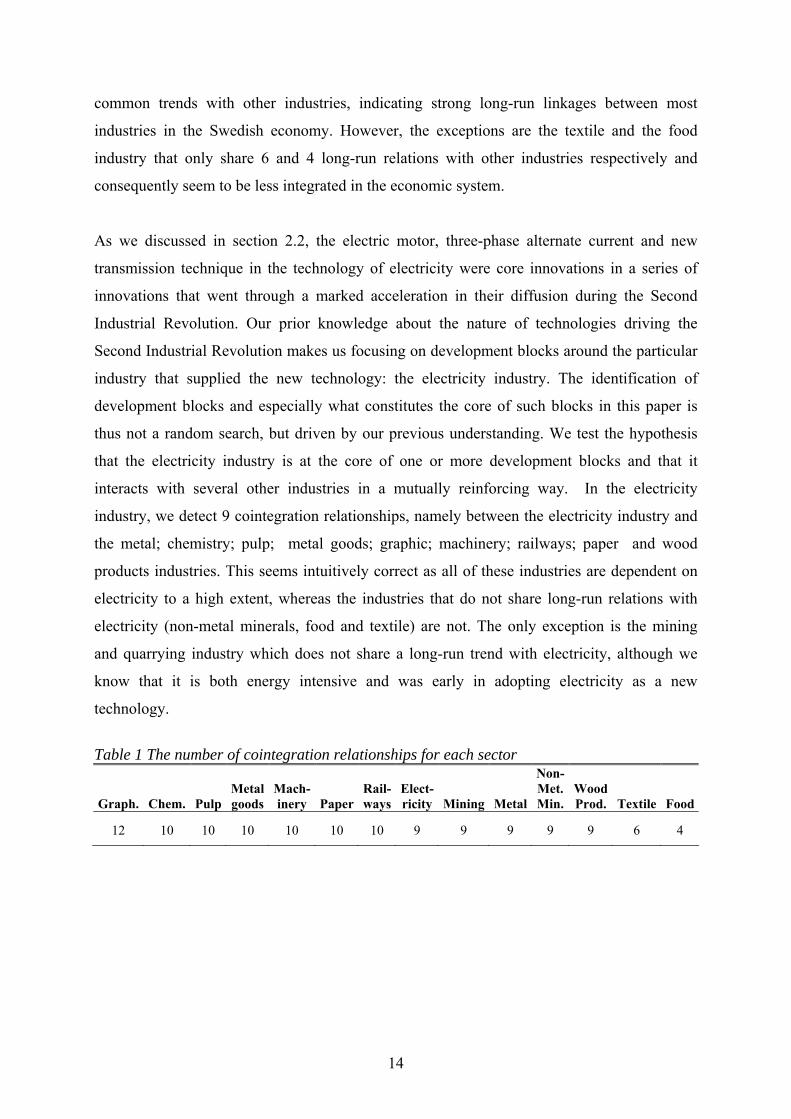
common trends with other industries, indicating strong long-run linkages between most
industries in the Swedish economy. However, the exceptions are the textile and the food
industry that only share 6 and 4 long-run relations with other industries respectively and
consequently seem to be less integrated in the economic system.
As we discussed in section 2.2, the electric motor, three-phase alternate current and new
transmission technique in the technology of electricity were core innovations in a series of
innovations that went through a marked acceleration in their diffusion during the Second
Industrial Revolution. Our prior knowledge about the nature of technologies driving the
Second Industrial Revolution makes us focusing on development blocks around the particular
industry that supplied the new technology: the electricity industry. The identification of
development blocks and especially what constitutes the core of such blocks in this paper is
thus not a random search, but driven by our previous understanding. We test the hypothesis
that the electricity industry is at the core of one or more development blocks and that it
interacts with several other industries in a mutually reinforcing way. In the electricity
industry, we detect 9 cointegration relationships, namely between the electricity industry and
the metal; chemistry; pulp; metal goods; graphic; machinery; railways; paper and wood
products industries. This seems intuitively correct as all of these industries are dependent on
electricity to a high extent, whereas the industries that do not share long-run relations with
electricity (non-metal minerals, food and textile) are not. The only exception is the mining
and quarrying industry which does not share a long-run trend with electricity, although we
know that it is both energy intensive and was early in adopting electricity as a new
technology.
Table 1 The number of cointegration relationships for each sector
Graph. Chem. Pulp Metal goods
Mach- inery Paper
Rail-ways
Elect-ricity Mining Metal
Non- Met. Min.
Wood Prod. Textile Food
12 10 10 10 10 10 10 9 9 9 9 9 6 4
14
It seems that electricity is an integrated part of the Swedish economic system during the
second industrial revolution, but the number of long-run relationships per se cannot help us in
identifying specific development blocks between sectors. To be able to identify such inter-
linkages we must investigate the short-run relationships and possible complementarities
between the industries.
5.2 Short-run linkages
Short-run Granger causality is tested either by running the bivariate VAR in differenced form
or, in the presence of cointegration, by running VEC-regressions between all possible pairs of
variables. Since there are 14 variables in the system, we start by running 91 regressions to test
if lagged values of any variable in the system can significantly explain the current dependent
variable. If a sector’s past values can be used to explain another sectors current value, we
define this relationship as a forward linkage. In parallel, we define a backward linkage as a
sector whose current value added is significantly adjusting to the past values of another sector.
If both variables past values can be used to mutually explain each other we consider this an
indicator of short-run complementarity between the two industries. The fact that we are
running a large number of tests obviously risks leading us into mass significance, since testing
on the 5 % level theoretically means that every 20th test can be significant even under a
correct null hypothesis, so some caution should be adopted when interpreting the results.
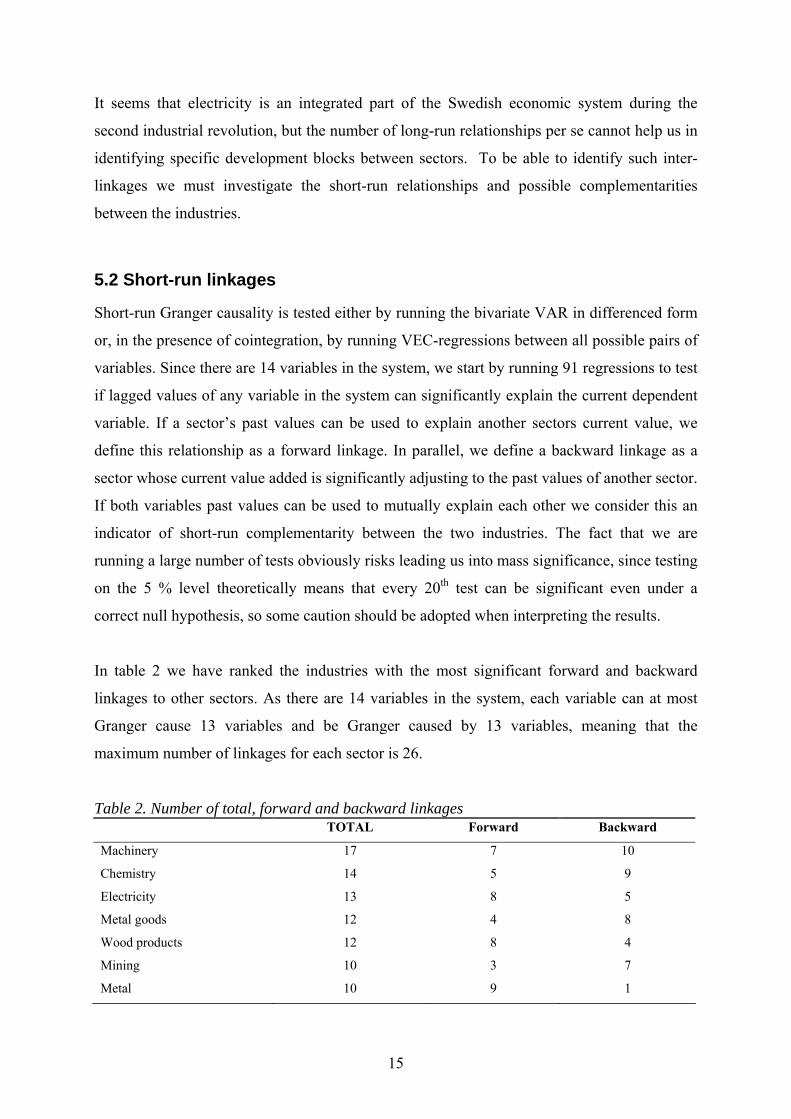
In table 2 we have ranked the industries with the most significant forward and backward
linkages to other sectors. As there are 14 variables in the system, each variable can at most
Granger cause 13 variables and be Granger caused by 13 variables, meaning that the
maximum number of linkages for each sector is 26.
Table 2. Number of total, forward and backward linkages TOTAL Forward Backward
Machinery 17 7 10
Chemistry 14 5 9
Electricity 13 8 5
Metal goods 12 4 8
Wood products 12 8 4
Mining 10 3 7
Metal 10 9 1
15
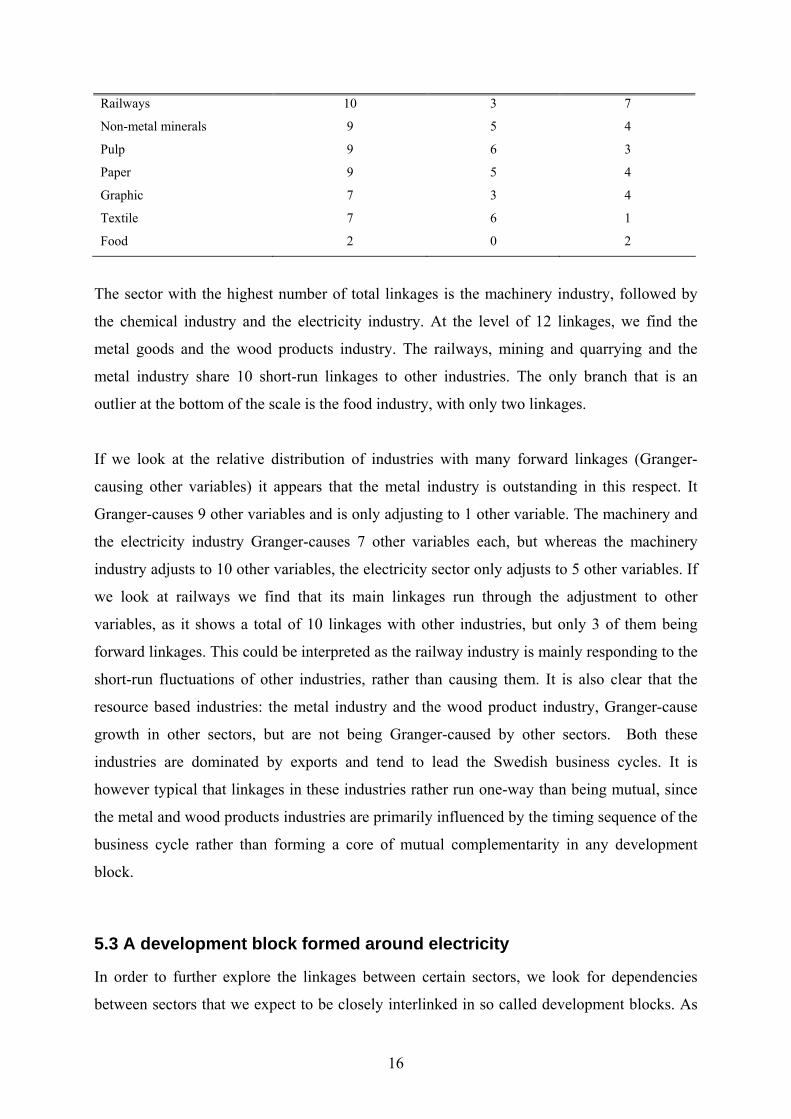
Railways 10 3 7
Non-metal minerals 9 5 4
Pulp 9 6 3
Paper 9 5 4
Graphic 7 3 4
Textile 7 6 1
Food 2 0 2
The sector with the highest number of total linkages is the machinery industry, followed by
the chemical industry and the electricity industry. At the level of 12 linkages, we find the
metal goods and the wood products industry. The railways, mining and quarrying and the
metal industry share 10 short-run linkages to other industries. The only branch that is an
outlier at the bottom of the scale is the food industry, with only two linkages.
If we look at the relative distribution of industries with many forward linkages (Granger-
causing other variables) it appears that the metal industry is outstanding in this respect. It
Granger-causes 9 other variables and is only adjusting to 1 other variable. The machinery and
the electricity industry Granger-causes 7 other variables each, but whereas the machinery
industry adjusts to 10 other variables, the electricity sector only adjusts to 5 other variables. If
we look at railways we find that its main linkages run through the adjustment to other
variables, as it shows a total of 10 linkages with other industries, but only 3 of them being
forward linkages. This could be interpreted as the railway industry is mainly responding to the
short-run fluctuations of other industries, rather than causing them. It is also clear that the
resource based industries: the metal industry and the wood product industry, Granger-cause
growth in other sectors, but are not being Granger-caused by other sectors. Both these
industries are dominated by exports and tend to lead the Swedish business cycles. It is
however typical that linkages in these industries rather run one-way than being mutual, since
the metal and wood products industries are primarily influenced by the timing sequence of the
business cycle rather than forming a core of mutual complementarity in any development
block.
5.3 A development block formed around electricity
In order to further explore the linkages between certain sectors, we look for dependencies
between sectors that we expect to be closely interlinked in so called development blocks. As
16
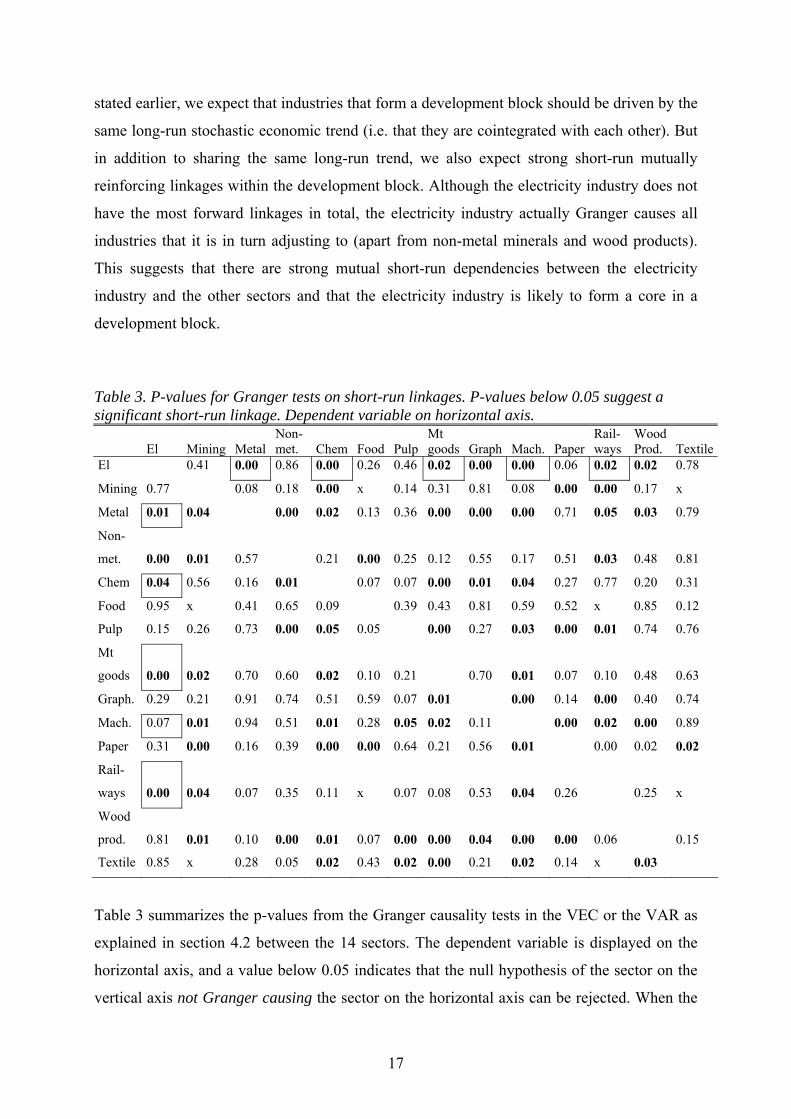
stated earlier, we expect that industries that form a development block should be driven by the
same long-run stochastic economic trend (i.e. that they are cointegrated with each other). But
in addition to sharing the same long-run trend, we also expect strong short-run mutually
reinforcing linkages within the development block. Although the electricity industry does not
have the most forward linkages in total, the electricity industry actually Granger causes all
industries that it is in turn adjusting to (apart from non-metal minerals and wood products).
This suggests that there are strong mutual short-run dependencies between the electricity
industry and the other sectors and that the electricity industry is likely to form a core in a
development block.
Table 3. P-values for Granger tests on short-run linkages. P-values below 0.05 suggest a significant short-run linkage. Dependent variable on horizontal axis.
Textile 0.85 x 0.28 0.05 0.02 0.43 0.02 0.00 0.21 0.02 0.14 x 0.03
Table 3 summarizes the p-values from the Granger causality tests in the VEC or the VAR as
explained in section 4.2 between the 14 sectors. The dependent variable is displayed on the
horizontal axis, and a value below 0.05 indicates that the null hypothesis of the sector on the
vertical axis not Granger causing the sector on the horizontal axis can be rejected. When the
17
null hypothesis is rejected we conclude that there is a significant forward linkage running
from the sector on the vertical axis to the sector on the horizontal axis.5
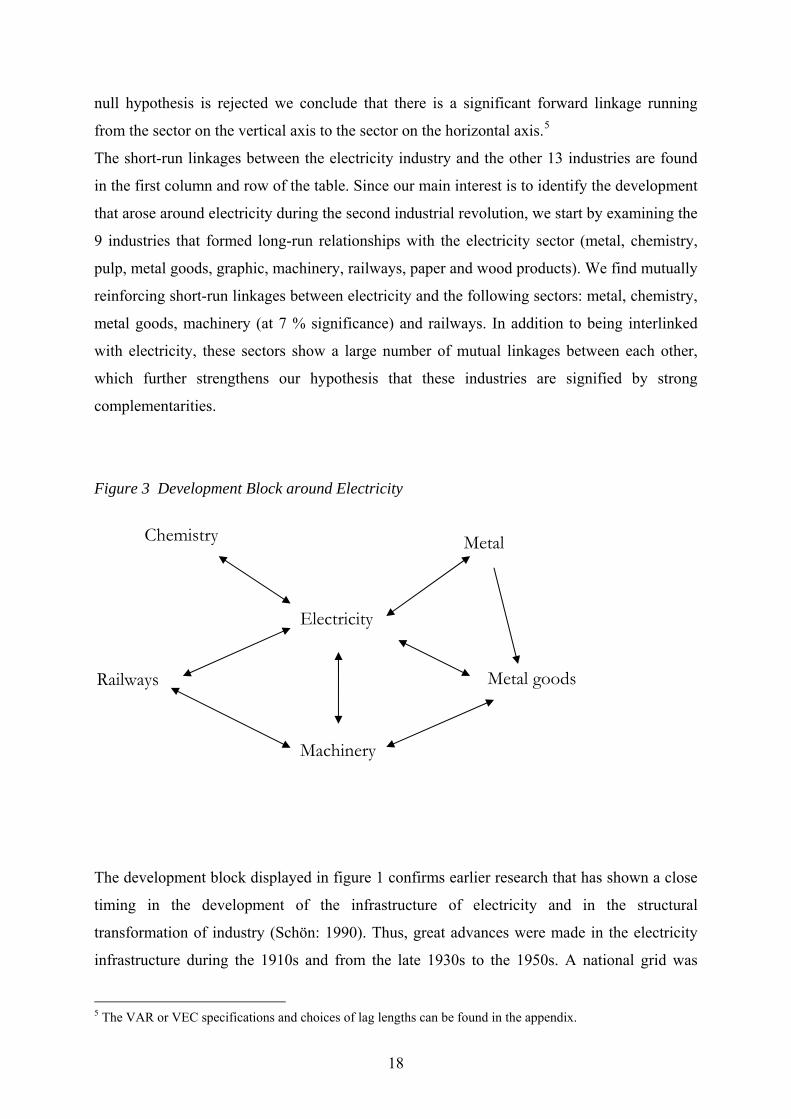
The short-run linkages between the electricity industry and the other 13 industries are found
in the first column and row of the table. Since our main interest is to identify the development
that arose around electricity during the second industrial revolution, we start by examining the
9 industries that formed long-run relationships with the electricity sector (metal, chemistry,
pulp, metal goods, graphic, machinery, railways, paper and wood products). We find mutually
reinforcing short-run linkages between electricity and the following sectors: metal, chemistry,
metal goods, machinery (at 7 % significance) and railways. In addition to being interlinked
with electricity, these sectors show a large number of mutual linkages between each other,
which further strengthens our hypothesis that these industries are signified by strong
complementarities.
Figure 3 Development Block around Electricity
Electricity
Chemistry
Railways
Metal
Machinery
Metal goods
The development block displayed in figure 1 confirms earlier research that has shown a close
timing in the development of the infrastructure of electricity and in the structural
transformation of industry (Schön: 1990). Thus, great advances were made in the electricity
infrastructure during the 1910s and from the late 1930s to the 1950s. A national grid was
5 The VAR or VEC specifications and choices of lag lengths can be found in the appendix.
18
integrated and the technology of high voltage transmission developed that made it possible to
supply industries with electricity at lower prices, in large quantities and with great regularity.
Furthermore, this development of the infrastructure was simultaneous with a more rapid
growth of new sectors. In particular, the machinery industry supplied new generations of
electrical motors and machinery as a complement to the supply shift of electricity and the
motors were in turn dependent upon new qualities of metal and metal goods. This is certainly
relevant also for the electrification of railways. Electrification was first introduced in the
1910s, but it was more forcefully followed from the 1930s. In this connection the Swedish
company ASEA (ABB), as a main supplier of equipment to electricity utilities, also developed
the electricity traction technology in new locomotives. These linkages between electricity,
machinery, metal, metal goods and railways have been traced quantitatively using our
proposed methodology, but in addition we also detect a strong mutual relationship between
electricity production and the chemical industry that calls for further analysis.
5. 4 Linkages between electricity use and growth of an industry In order to explore the role of the electricity share and the effect on growth in value added of
the sectors we first use a basic linear trend analysis to see whether sectors of high electricity
shares have grown faster than sectors with low electricity share. Next we use cointegration
analyses to detect long and short-run inter-linkages between electricity shares and growth
patterns. Last we use the results to modify our previous understanding of development blocks
around electricity.
Since energy plays different roles in different sectors, some being heavy energy users and
others light users, we do not use the electricity intensity (electricity divided by value added)
but rather the electricity share of total energy use as the hypothesized driving force of growth
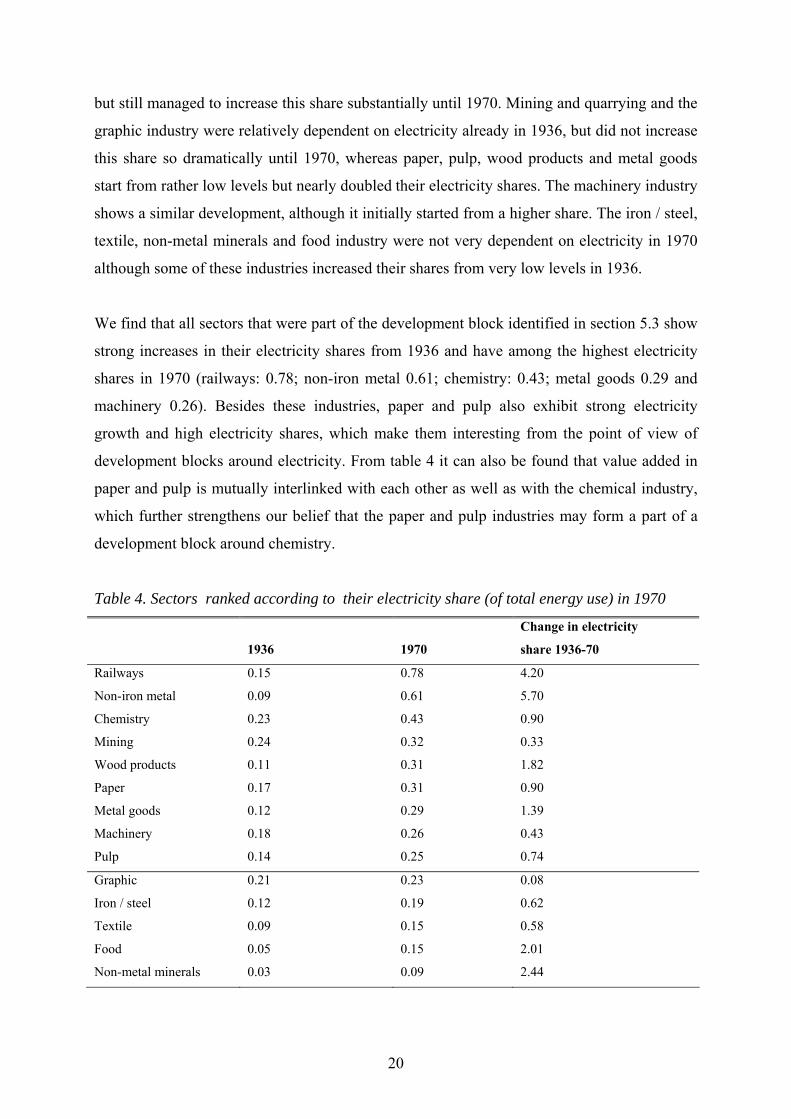
in the industrial sectors. In table 4 we have ranked all 13 industrial sectors (after 1936 we are
able to split up the metal industry into non-iron metal and iron/steel industries, thus increasing
the number of industrial sectors to 13) according to their electricity share in 1970.
As seen from table 5 railways, followed by non-iron metal industry have the largest electricity
share in 1970 and also display the highest growth of the electricity share since 1936. The non-
iron metal is the energy intensive part of the metal industry, since it contains the aluminum
industry. The chemical industry started off with one of the highest electricity shares in 1936
19
but still managed to increase this share substantially until 1970. Mining and quarrying and the
graphic industry were relatively dependent on electricity already in 1936, but did not increase
this share so dramatically until 1970, whereas paper, pulp, wood products and metal goods
start from rather low levels but nearly doubled their electricity shares. The machinery industry
shows a similar development, although it initially started from a higher share. The iron / steel,
textile, non-metal minerals and food industry were not very dependent on electricity in 1970
although some of these industries increased their shares from very low levels in 1936.
We find that all sectors that were part of the development block identified in section 5.3 show
strong increases in their electricity shares from 1936 and have among the highest electricity
shares in 1970 (railways: 0.78; non-iron metal 0.61; chemistry: 0.43; metal goods 0.29 and
machinery 0.26). Besides these industries, paper and pulp also exhibit strong electricity
growth and high electricity shares, which make them interesting from the point of view of
development blocks around electricity. From table 4 it can also be found that value added in
paper and pulp is mutually interlinked with each other as well as with the chemical industry,
which further strengthens our belief that the paper and pulp industries may form a part of a
development block around chemistry.
Table 4. Sectors ranked according to their electricity share (of total energy use) in 1970
1936 1970
Change in electricity
share 1936-70
Railways 0.15 0.78 4.20
Non-iron metal 0.09 0.61 5.70
Chemistry 0.23 0.43 0.90
Mining 0.24 0.32 0.33
Wood products 0.11 0.31 1.82
Paper 0.17 0.31 0.90
Metal goods 0.12 0.29 1.39
Machinery 0.18 0.26 0.43
Pulp 0.14 0.25 0.74
Graphic 0.21 0.23 0.08
Iron / steel 0.12 0.19 0.62
Textile 0.09 0.15 0.58
Food 0.05 0.15 2.01
Non-metal minerals 0.03 0.09 2.44
20
In table 5 we show the ranking of these industries in terms of growth of value added and we
see that the linear economic growth trends coincide rather well with the electrification. In
general sectors with high electricity shares and large increases of that ratio between 1936 and
1970 also grow substantially in value added. To explore whether this is only a coincidence we
turn to long-run cointegration analyses and short-run Granger causality.
21
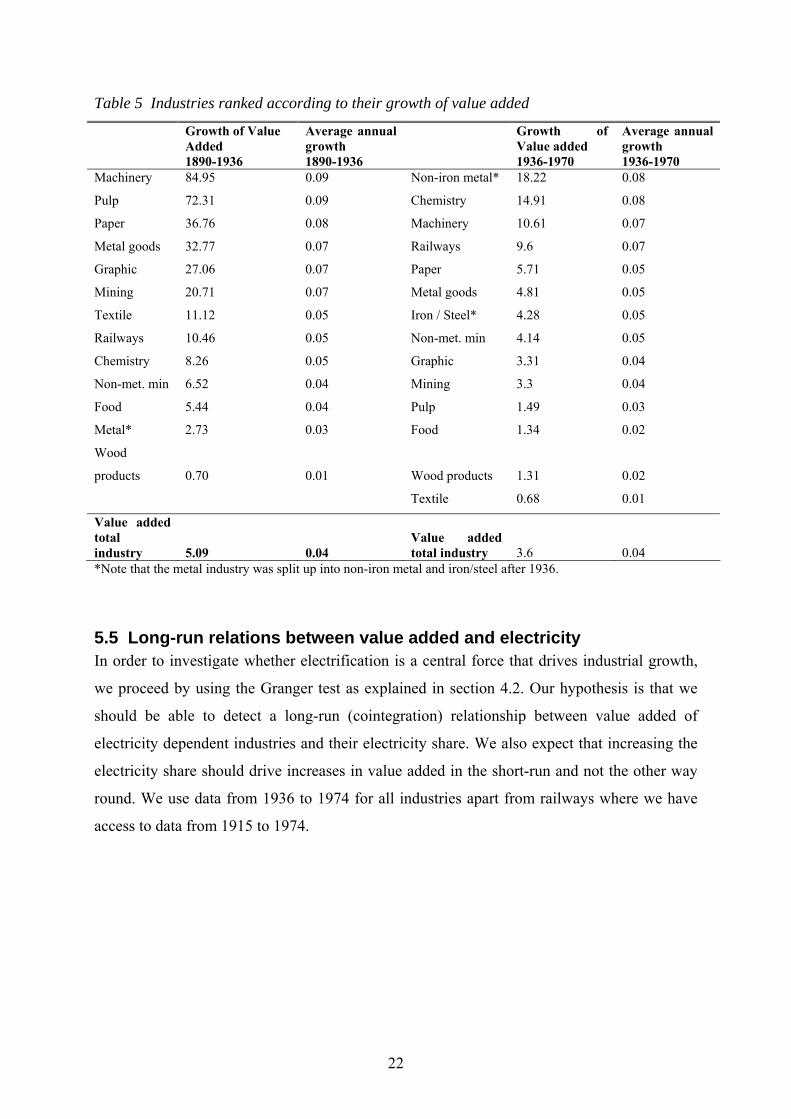
Table 5 Industries ranked according to their growth of value added
Growth of Value Added 1890-1936
Average annual growth 1890-1936
Growth of Value added 1936-1970
Average annual growth 1936-1970
Machinery 84.95 0.09 Non-iron metal* 18.22 0.08
Pulp 72.31 0.09 Chemistry 14.91 0.08
Paper 36.76 0.08 Machinery 10.61 0.07
Metal goods 32.77 0.07 Railways 9.6 0.07
Graphic 27.06 0.07 Paper 5.71 0.05
Mining 20.71 0.07 Metal goods 4.81 0.05
Textile 11.12 0.05 Iron / Steel* 4.28 0.05
Railways 10.46 0.05 Non-met. min 4.14 0.05
Chemistry 8.26 0.05 Graphic 3.31 0.04
Non-met. min 6.52 0.04 Mining 3.3 0.04
Food 5.44 0.04 Pulp 1.49 0.03
Metal* 2.73 0.03 Food 1.34 0.02
Wood
products 0.70 0.01 Wood products 1.31 0.02
Textile 0.68 0.01
Value added total industry 5.09 0.04
Value added total industry 3.6 0.04
*Note that the metal industry was split up into non-iron metal and iron/steel after 1936.
5.5 Long-run relations between value added and electricity In order to investigate whether electrification is a central force that drives industrial growth,
we proceed by using the Granger test as explained in section 4.2. Our hypothesis is that we
should be able to detect a long-run (cointegration) relationship between value added of
electricity dependent industries and their electricity share. We also expect that increasing the
electricity share should drive increases in value added in the short-run and not the other way
round. We use data from 1936 to 1974 for all industries apart from railways where we have
access to data from 1915 to 1974.
22
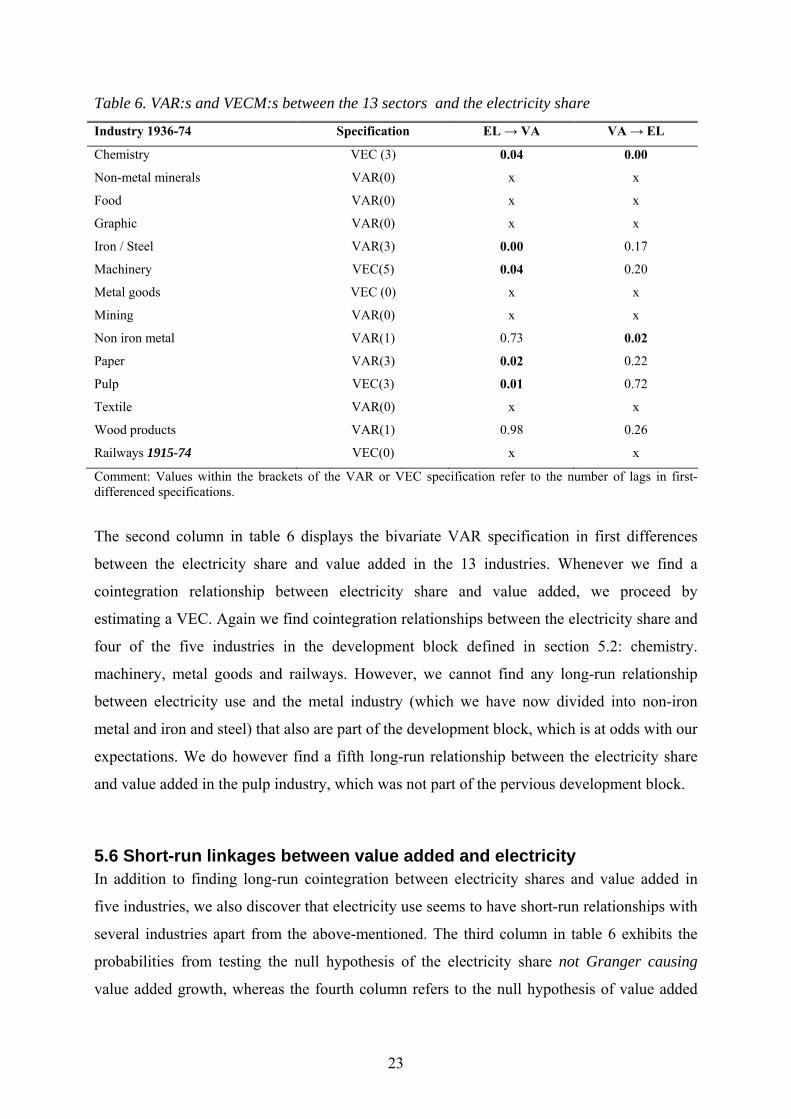
Table 6. VAR:s and VECM:s between the 13 sectors and the electricity share
Industry 1936-74 Specification EL → VA VA → EL
Chemistry VEC (3) 0.04 0.00
Non-metal minerals VAR(0) x x
Food VAR(0) x x
Graphic VAR(0) x x
Iron / Steel VAR(3) 0.00 0.17
Machinery VEC(5) 0.04 0.20
Metal goods VEC (0) x x
Mining VAR(0) x x
Non iron metal VAR(1) 0.73 0.02
Paper VAR(3) 0.02 0.22
Pulp VEC(3) 0.01 0.72
Textile VAR(0) x x
Wood products VAR(1) 0.98 0.26
Railways 1915-74 VEC(0) x x
Comment: Values within the brackets of the VAR or VEC specification refer to the number of lags in first-differenced specifications.
The second column in table 6 displays the bivariate VAR specification in first differences
between the electricity share and value added in the 13 industries. Whenever we find a
cointegration relationship between electricity share and value added, we proceed by
estimating a VEC. Again we find cointegration relationships between the electricity share and
four of the five industries in the development block defined in section 5.2: chemistry.
machinery, metal goods and railways. However, we cannot find any long-run relationship
between electricity use and the metal industry (which we have now divided into non-iron
metal and iron and steel) that also are part of the development block, which is at odds with our
expectations. We do however find a fifth long-run relationship between the electricity share
and value added in the pulp industry, which was not part of the pervious development block.
5.6 Short-run linkages between value added and electricity In addition to finding long-run cointegration between electricity shares and value added in
five industries, we also discover that electricity use seems to have short-run relationships with
several industries apart from the above-mentioned. The third column in table 6 exhibits the
probabilities from testing the null hypothesis of the electricity share not Granger causing
value added growth, whereas the fourth column refers to the null hypothesis of value added
23
growth not Granger causing increases in the electricity share. Whenever the lag length was
determined to 0 and we do not have a short-run relationship between the variables, the column
in denoted with an x. Table 6 displays that short-term changes in the electricity share Granger
causes fluctuations in iron/steel, paper and pulp while we find mutual linkages between the
electricity share and value added in the chemical industry. In the non-iron metal industry we
find that fluctuations in value added seem to drive the short-term evolution of the electricity
share. Increased production in this heavy electricity using industry may have led to bottle
necks that caused expansionary investments in the electricity supply with further price
reductions - such links are basic to the development block approach.
None of the industries with low electricity shares (i.e. food, textile, non-metal minerals) show
any long-term or short-term relationship between value added and electricity shares.
Industries that were rather electricity dependent all ready in 1936 (graphic industry, mining
and quarrying), but had fairly constant electricity shares up until 1970, do not exhibit any
short or long-run relationship either. This could be explained by the fact that both mining and
quarrying and the graphic industry were early in adopting electricity as a source of energy and
have adapted well to the electricity using technology already in 1936, therefore exhausting the
major growth advantages from increasing the electricity share that lay ahead of the majority
of the other industries.
5.7 A modified development block
With the additional information obtained from the cointegration and Granger causality tests
between the electricity share and value added, we may modify our initial development block
somewhat. It seems that the qualities of complementarity between electricity and innovative
behaviour in the leading sectors of the second industrial revolution (machinery, chemistry,
metal products and railways) were a driving force behind long-term growth. In addition, the
cointegration relationship between the electricity share and value added in the pulp industry
suggests that this sector should be added to the development block around electricity. The
pulp industry is likely to be more closely related to the parts around the development block
formed around electricity and the chemical industry, since the production of pulp developed
in close connection with the chemical industry.
In addition to confirming the long-term structure in the development block found in section
5.3, the short-term analysis showed that changes in the electricity share also drove short-term
24
fluctuations in those sectors that increased their electricity share during the time period
(machinery, chemistry, paper, pulp and iron/steel). It therefore seems that we could also add
the paper industry to the second development block formed around electricity, chemistry and
pulp, especially since we found close mutual short-run linkages between paper and pulp and
pulp and chemistry in section 5.3, indicating complementarities between these sectors.
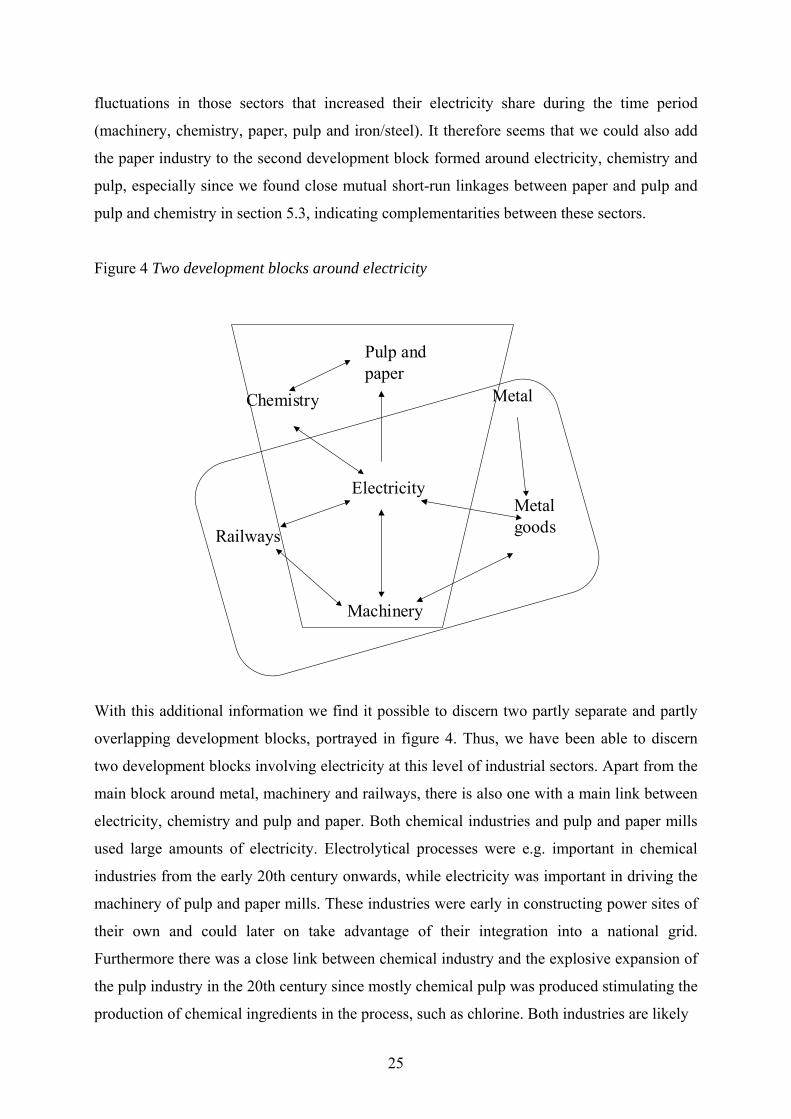
Figure 4 Two development blocks around electricity
Chemistry
Railways
Electricity
Pulp and paper
Metal
Metal goods
Machinery
With this additional information we find it possible to discern two partly separate and partly
overlapping development blocks, portrayed in figure 4. Thus, we have been able to discern
two development blocks involving electricity at this level of industrial sectors. Apart from the
main block around metal, machinery and railways, there is also one with a main link between
electricity, chemistry and pulp and paper. Both chemical industries and pulp and paper mills
used large amounts of electricity. Electrolytical processes were e.g. important in chemical
industries from the early 20th century onwards, while electricity was important in driving the
machinery of pulp and paper mills. These industries were early in constructing power sites of
their own and could later on take advantage of their integration into a national grid.
Furthermore there was a close link between chemical industry and the explosive expansion of
the pulp industry in the 20th century since mostly chemical pulp was produced stimulating the
production of chemical ingredients in the process, such as chlorine. Both industries are likely
25
to be interlinked also with the machinery industries through the adoption of the new
technology introduced with electricity. This macro-level picture conforms very well to prior
micro-level analyses (Dahmén: 1950) and analyses of industrial innovative transformation
and electricity use as well as to more qualitative interpretations of the role of development
blocks in long-term Swedish economic growth (Schön 2000a).
6. Concluding discussion The contributions of this paper are twofold. First, we have proposed a method for
quantitatively tracing the existence of development blocks in time series data that can be used
by other scholars for other countries, datasets and periods. We suggest that cointegration
analyses combined with short-run Granger causality tests are appropriate for such
investigations. Sectors within a development block should share common long-run stochastic
trends and be linked to each other with mutually reinforcing bonds (that is, the direction of
Granger causality should go in both ways). This definition comes naturally from the theory of
development blocks, which states that sectors within a development block are strongly
dependent on each other so that complementarities are a basic feature. This complementary
aspect is captured by the mutually reinforcing linkages of Granger causality. The long-run
common trend consists of everything that unites the sectors, and thus captures common
technologies as well as influences from the external world (business cycles). For a small open
economy like Sweden certainly the export markets play a fundamental role for the evolution
of those common trends. We therefore find that most sectors share many common trends with
other sectors, and thus the long-run common feature is not a sufficient criteria for a
development block. It must be complemented by the short-run mutually reinforcing linkage.
Second we have empirically discerned two development blocks around electricity, allegedly
one of the general purpose technologies of the second industrial revolution. The period we
study is 1900-1974 and we use 14 sectors for our analyses. Those are the electricity
production, mining and quarrying, metal, metal products, manufacturing of non-metal
McKinnon one-sided p-values to the hypothesis of a unit root.
A2. Electricity share in 14 sectors 1936-1974 Level 1st diff Conclusion PP t-stat P-value PP t-stat P-value Trend Intercept Mining -2.009887 0.2815 -10.37816 0.0000 no 0.3632 I(1) Iron/steel -2.168294 0.2207 -9.147958 0.0000 no 0.3953 I(1) Non-iron metal -2.194909 0.2113 -5.533455 0.0000 no 0.0805 I(1) Non-metal minerals -1.015243 0.7384 -4.654000 0.0006 no 0.1190 I(1) Chemistry -0.682947 0.8390 -9.206948 0.0000 no 0.0163 I(1) Food 0.736094 0.9915 -12.06838 0.0000 no 0.0001 I(1) Pulp -1.255065 0.6405 -7.266335 0.0000 no 0.2734 I(1) Metal Goods 0.317429 0.9762 -11.76169 0.0000 no 0.0103 I(1) Graphic -4.670999 0.0005 I(0) Machinery 0.818891 0.9931 0.818891 0.9931 no 0.0752 I(1) Paper -1.163171 0.6805 -8.479996 0.0000 no 0.2661 I(1) Railways 1915-1974 -0.076391 0.9450 -4.061294 0.0031 no 0.0263 I(1) Wood products -1.095314 0.7081 -6.247771 0.0000 no 0.0590 I(1) Textile 1.256897 0.9980 -9.890581 0.0000 no 0.0349 I(1)
McKinnon one-sided p-values to the hypothesis of a unit root.
28
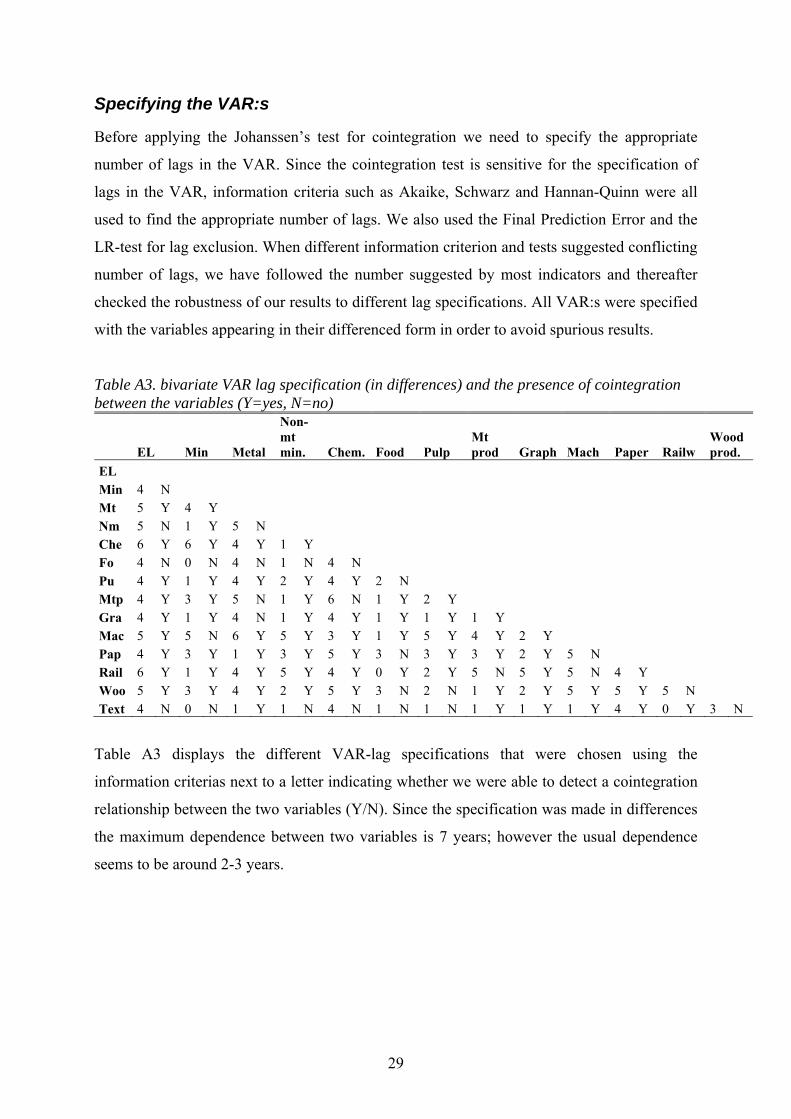
Specifying the VAR:s
Before applying the Johanssen’s test for cointegration we need to specify the appropriate
number of lags in the VAR. Since the cointegration test is sensitive for the specification of
lags in the VAR, information criteria such as Akaike, Schwarz and Hannan-Quinn were all
used to find the appropriate number of lags. We also used the Final Prediction Error and the
LR-test for lag exclusion. When different information criterion and tests suggested conflicting
number of lags, we have followed the number suggested by most indicators and thereafter
checked the robustness of our results to different lag specifications. All VAR:s were specified
with the variables appearing in their differenced form in order to avoid spurious results.
Table A3. bivariate VAR lag specification (in differences) and the presence of cointegration between the variables (Y=yes, N=no)
EL Min Metal
Non-mt min. Chem. Food Pulp
Mt prod Graph Mach Paper Railw
Wood prod.
EL Min 4 N Mt 5 Y 4 Y Nm 5 N 1 Y 5 N Che 6 Y 6 Y 4 Y 1 Y Fo 4 N 0 N 4 N 1 N 4 N Pu 4 Y 1 Y 4 Y 2 Y 4 Y 2 N Mtp 4 Y 3 Y 5 N 1 Y 6 N 1 Y 2 Y Gra 4 Y 1 Y 4 N 1 Y 4 Y 1 Y 1 Y 1 Y Mac 5 Y 5 N 6 Y 5 Y 3 Y 1 Y 5 Y 4 Y 2 Y Pap 4 Y 3 Y 1 Y 3 Y 5 Y 3 N 3 Y 3 Y 2 Y 5 N Rail 6 Y 1 Y 4 Y 5 Y 4 Y 0 Y 2 Y 5 N 5 Y 5 N 4 Y Woo 5 Y 3 Y 4 Y 2 Y 5 Y 3 N 2 N 1 Y 2 Y 5 Y 5 Y 5 N Text 4 N 0 N 1 Y 1 N 4 N 1 N 1 N 1 Y 1 Y 1 Y 4 Y 0 Y 3 N
Table A3 displays the different VAR-lag specifications that were chosen using the
information criterias next to a letter indicating whether we were able to detect a cointegration
relationship between the two variables (Y/N). Since the specification was made in differences
the maximum dependence between two variables is 7 years; however the usual dependence
seems to be around 2-3 years.
29
Literature list
Bresnahan T. F.. E. Brynjolfson. and L. M. Hitt (1999). Information Technology. Workplace
Organization and the Demand for Skilled Labour: Firm Level Evidence. NBER Working
paper W 7136
Carlaw K. I. and R. G. Lipsey (2006) GPT-Driven. Endogenous Growth. The Economic
Journal. 116 (508): 155-174.
Carlsson B. and R. G. H. Henriksson (1991): Development blocks and industrial
transformation: the Dahménian approach to economic development. Industrial Institute for
Economic and Social Research (Industriens utredningsinstitut): Almqvist & Wiksell
International.
Chan S.L. (2001) Empirical tests t o discern linkages between construction and other
economic sectors in Singapore”. Construction Management and Economics. 19 pp. 355-363.
Dahmén E. (1950) Svensk industriell företagarverksamhet. Kausalanalys av den industriella
utvecklingen 1919-1939. Del I-II. Industriens utredningsinstitut. Stockholm
Dahmén E. (1988) Development blocks in industrial economics. The Scandinavian economic
history review. (36:1). p 3-14.
David P. A. (1990) The dynamo and the computer: an historical perspective on the modern
productivity paradox. The American Review. May.
Engle R.F. and C.W.J Granger (1987): Co-Integration and Error Correction: Representation.
Estimation. and Testing. Econometrica. vol. 5. no.2. pp 251-276.
Granger C.W.J (1969) Investigating Causal Relations by Econometric Models and Cross-
spectral Methods. Journal of the Econometric Society. vol. 37. no. 3. pp 424-438.
Granger C.W.J. and P. Newbold (1974). Spurious Regression in Econometrics.
Journal of Econometrics. 2. 111-120.
30
Gordon R. J. (1999) U.S. Economic growth since 1870: One big wave? The American
Economic Review. 89 (2): 123-128.
Helpman E. (1998) General purpose technologies and economic growth. Cambridge Mass:
MIT Press.
Johansen S. (1991) Estimation and testing of cointegration vectors in Gaussian Vector
Autoregressive models. Econometrica 59(6). pp. 1551-1580.
Kander A & Schön L (2003) Economic growth. technical change and energy in Sweden 1870-
2000. working paper for the 5th European Historical Economics Society Conference July 25-
27. Universidad Carlos III. Madrid.
Leontief W. (1966) Input-Output Economics. Oxford University Press. USA
Lundquist K-J. Olander. L-O. Svensson Henning M (2005) Renewal and Obsolescence: An
evolutionary perspective on industry growth and regional development in Sweden 1968-2002.
Department of Social and Economic Geography. Lund University. report 165.
Lundquist K-J. Olander. L-O. Svensson Henning. M (2006) Producer services: Boosters or
followers. An evolutionary approach to producer services and technology shifts in time and
space. Department of Social and Economic Geography. Lund University. report 167.
Maddison A. (1995) Monitoring the world economy 1820-1995. Paris: Development Centre of
the Organisation for Economic Co-operation and Development.
Moser P and T. Nicholas (2004) Was Electricity a General Purpose Technology? Evidence
from Historical Patent Citations. The American Economic Review. 94 (2): 388-394.
Odedokun M.O (1996) Alternative econometric approaches to analysing the role of the
financial sector in economic growth: time series evidence from LDCs” Journal of