United States Environmental Protection Agency Office of Water 4303 EPA 821-R-98-005 JUly 1998 &EPA Document for Final Effluent Limitations Guidelines And Standards For The Pharmaceutical Manufacturing Point Source Category 0" 0 -. 0 0" o "0 " o ,,0
Transcript
United StatesEnvironmental ProtectionAgency
Office of Water4303
EPA 821-R-98-005JUly 1998
&EPA Developm~ntDocument for FinalEffluent Limitations GuidelinesAnd Standards For ThePharmaceutical ManufacturingPoint Source Category
0" 0-. 0 0"
o "0" o ,,0
ACKNOWLEDGMENT AND DISCLAIMER
This report has been reviewed and approved for publication by the Engineering andAnalysis Division, Office of Science and Technology. This report was prepared with the supportof Eastern Research Group, Inc. (Contract No. 68-C5-0025), under the direction and review ofthe Office of Science and Technology. Neither the United States Government nor any of itsemployees, contractors, subcontractors, or their employees make any warrant, expressed orimplied, or assume any legal liability or responsibility for any third party’s use of or the results ofsuch use of any information, apparatus, product, or process discussed in this report, or representsthat its use by such party would not infringe on privately owned rights.
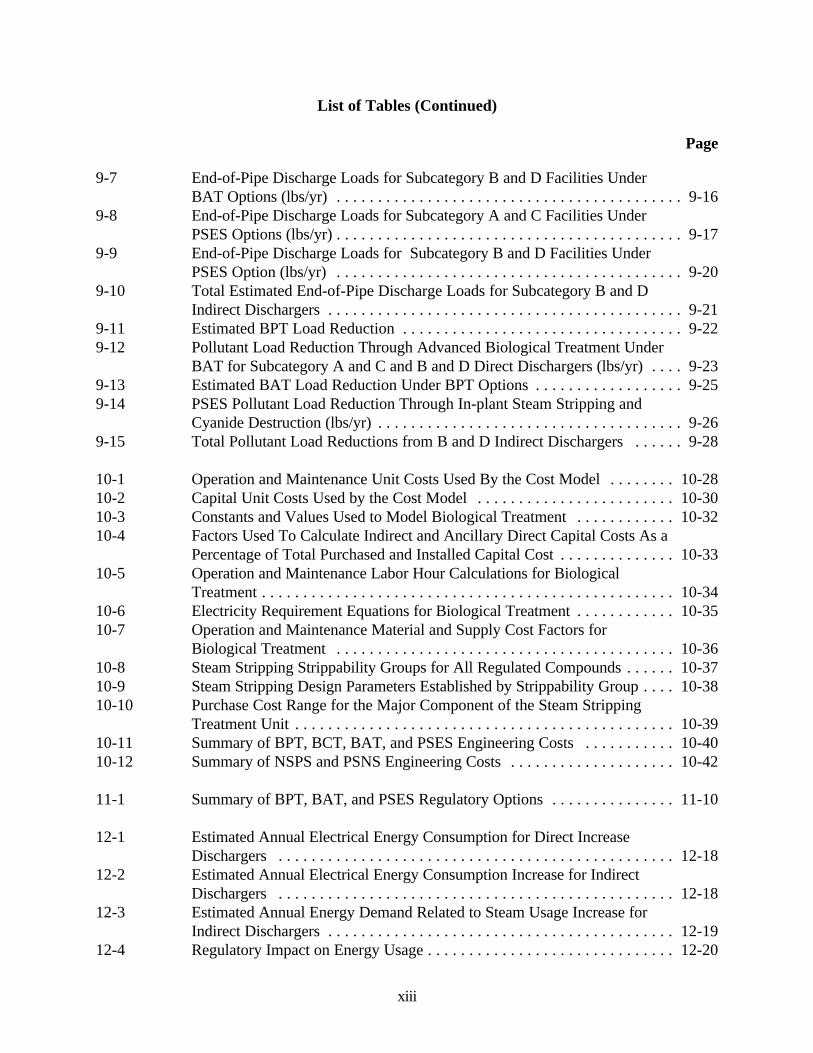
2-1 BPT Effluent Limitations for Subcategories A, B, C, and D . . . . . . . . . . . . . . 2-62-2 BAT Effluent Limitations for Subcategory A - Fermentation Operations and
Subcategory C - Chemical Synthesis Operations . . . . . . . . . . . . . . . . . . . . . . . 2-72-3 BAT Effluent Limitations for Subcategory B - Biological and Natural
2-9 PSNS for Subcategory B - Biological and Natural Extraction Operations andSubcategory D - Mixing, Compounding, or Formulating Operations . . . . . . . 2-14
3-1 Facilities Sampled As Part of the Pharmaceutical Manufacturing Industry Study . . . . . . . . . . . . . . . . . . . . . . . . . . . . . . . . . . . . . . . . . . . . . . . 3-42
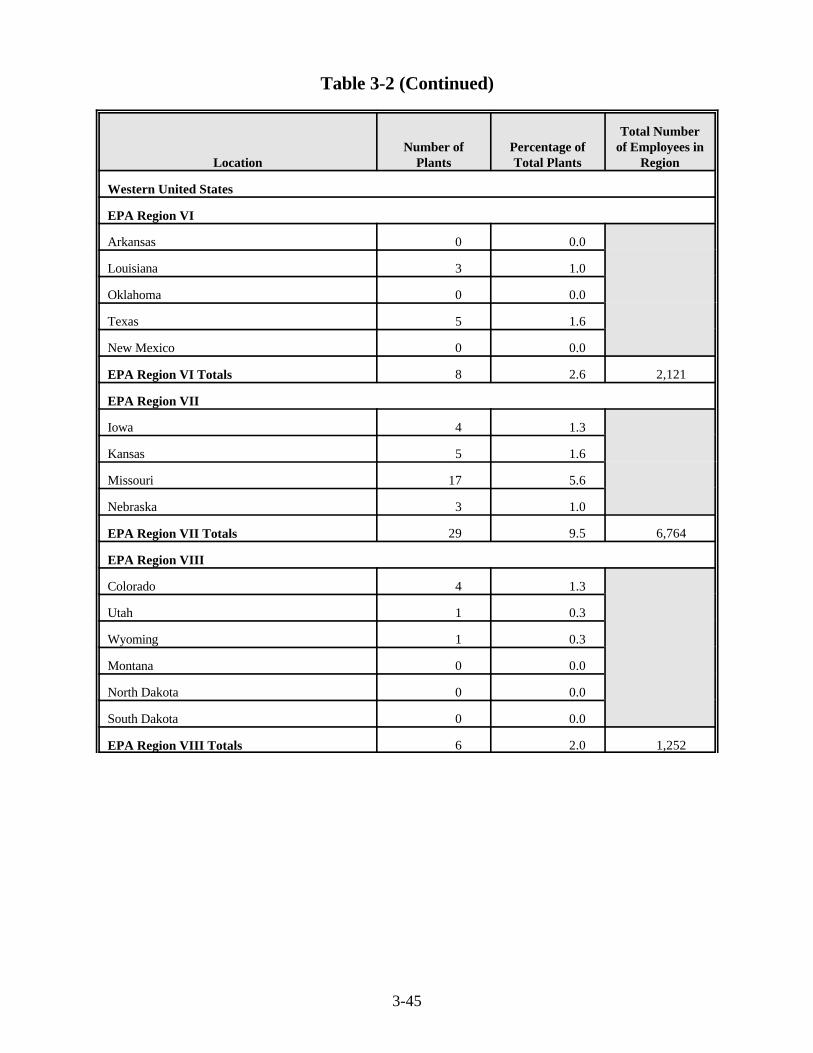
3-2 Pharmaceutical Industry Geographic Distribution . . . . . . . . . . . . . . . . . . . . . 3-433-3 Distribution of Pharmaceutical Manufacturing Facilities by Date of
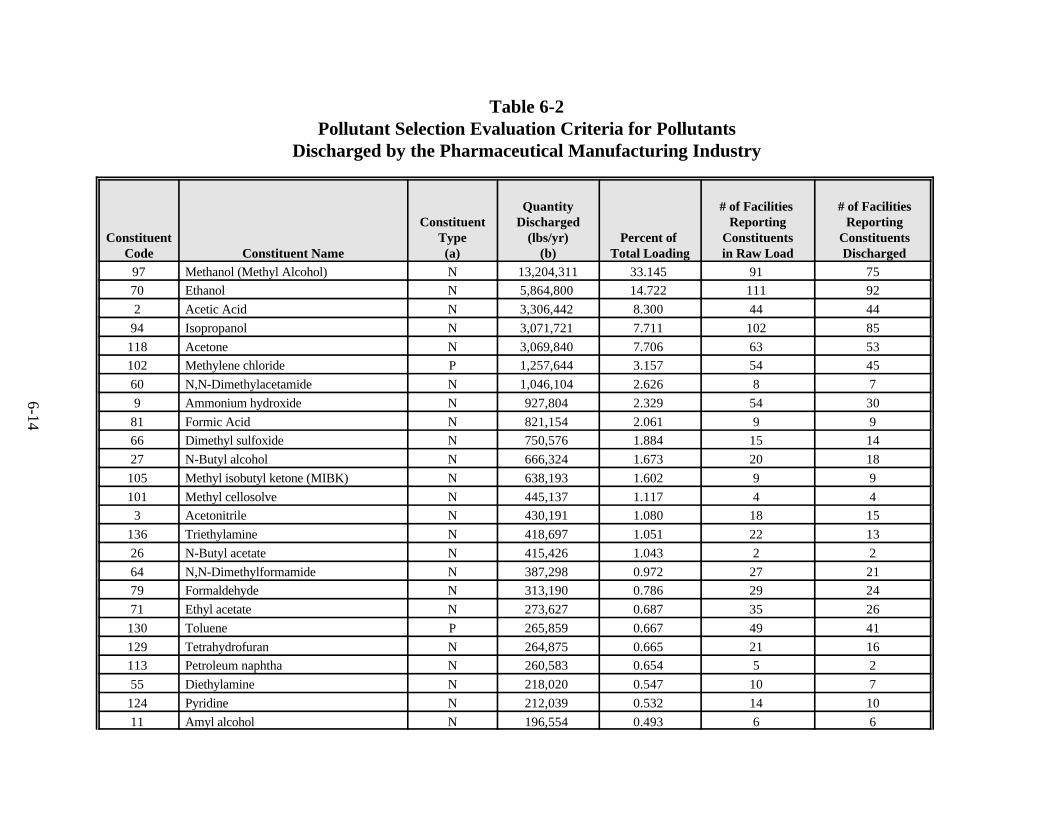
6-1 Pollutants Which May be Present in Pharmaceutical Industry Wastewater . . . 6-126-2 Pollutant Selection Evaluation Criteria for Pollutants Discharged by the
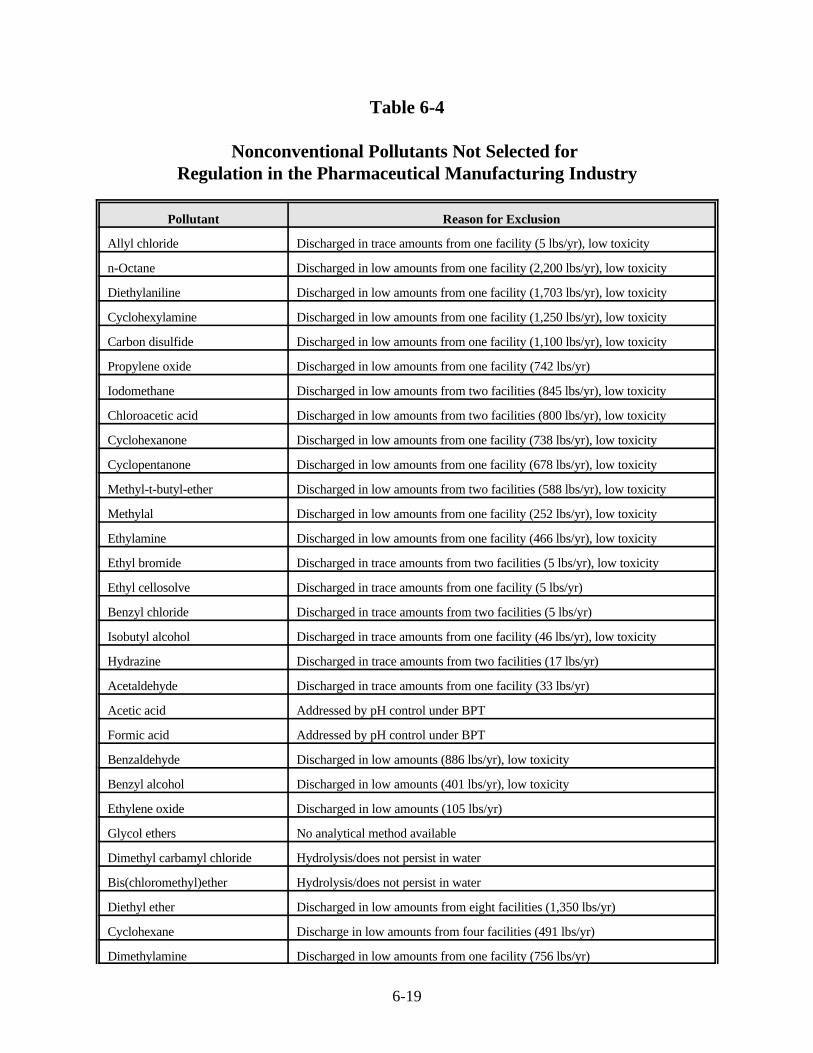
Pharmaceutical Manufacturing Industry . . . . . . . . . . . . . . . . . . . . . . . . . . . . 6-146-3 Priority Pollutants Not Selected for Regulation in the Pharmaceutical
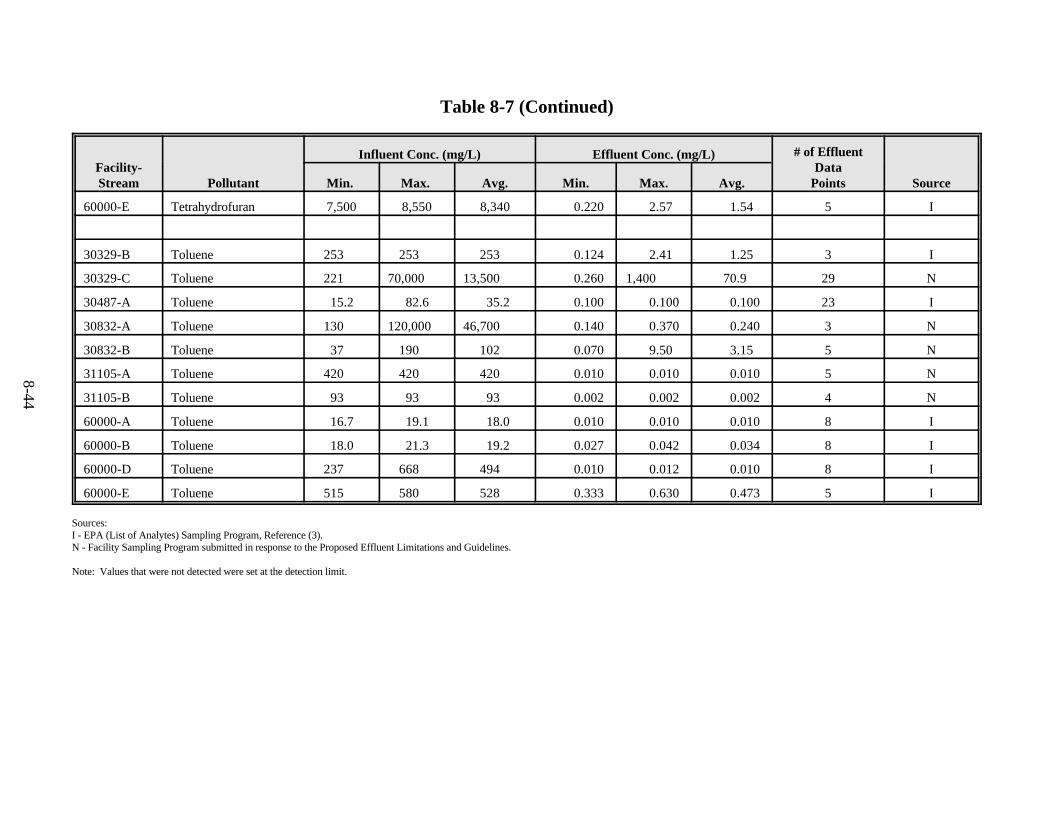
Performance Data Transfers for Subcategory A and C Facilities . . . . . . . . . . 8-568-16 Simulation Results Supporting Steam Stripping with Distillation Treatment
Performance Data Transfers for Subcategory B and D Facilities . . . . . . . . . . 8-588-17 Long-Term Mean Treatment Performance Concentrations for BOD , 5
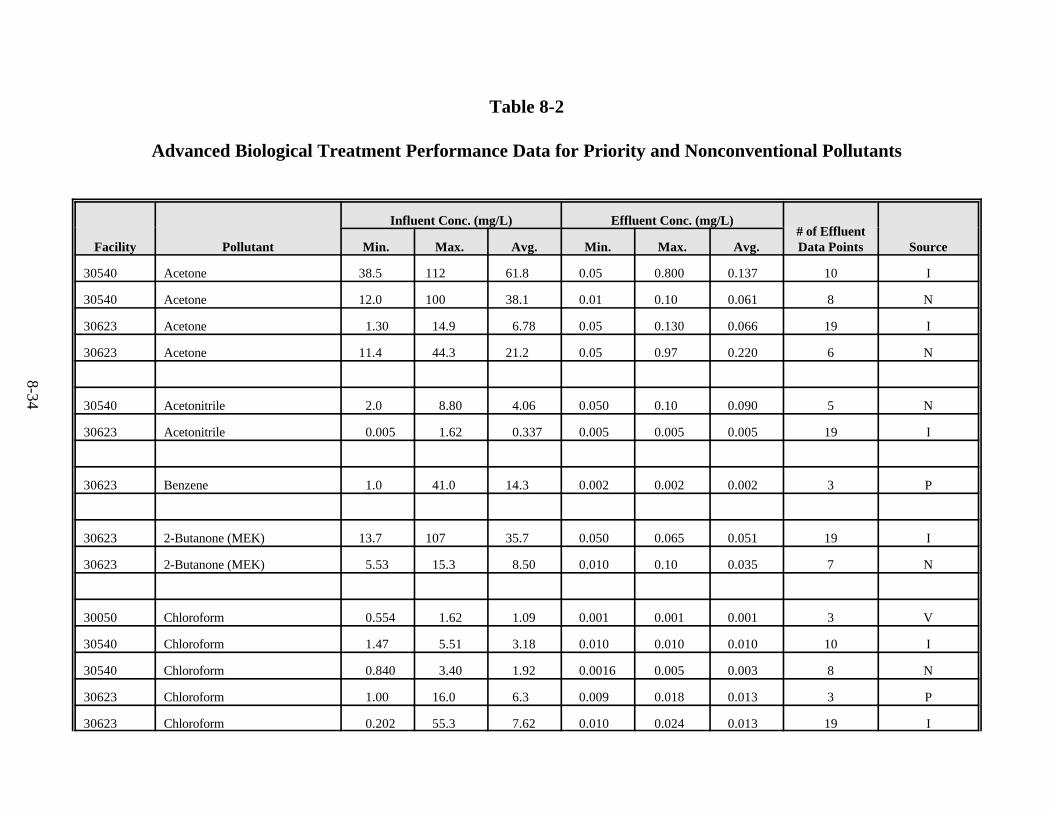
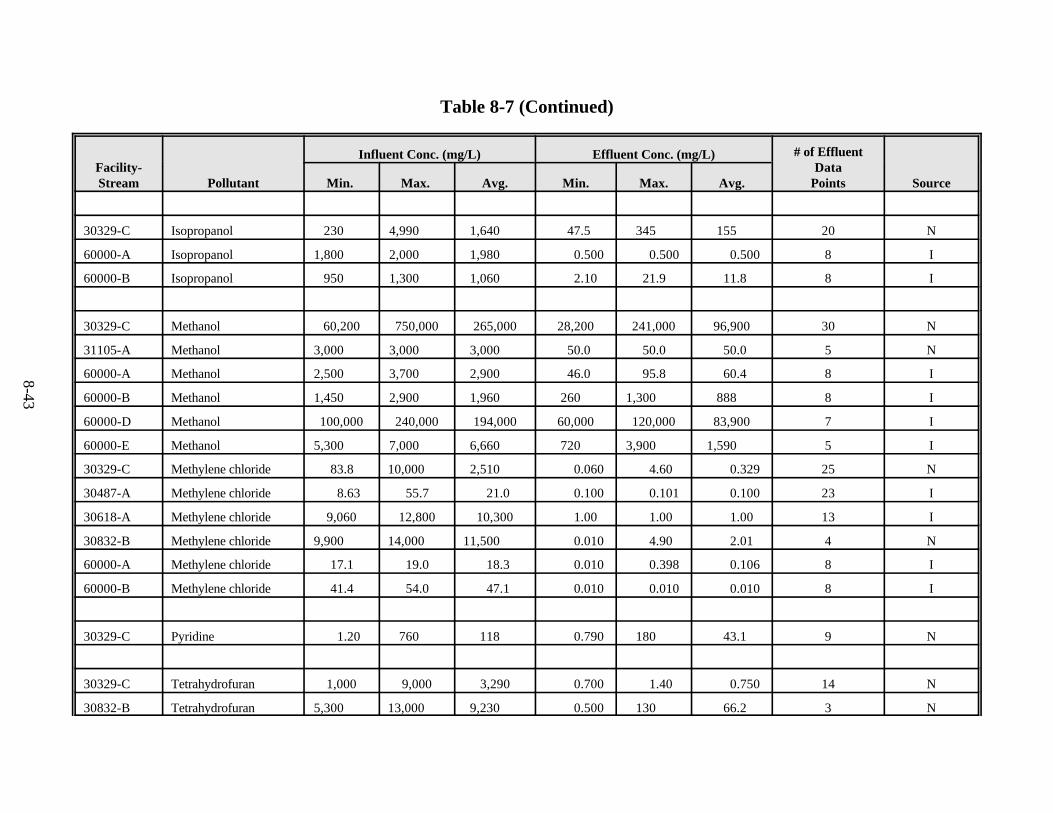
COD, and TSS in Advanced Biological Treatment . . . . . . . . . . . . . . . . . . . . 8-598-18 Long-Term Mean Treatment Performance Concentrations for Priority and
Nonconventional Pollutants with Available Data . . . . . . . . . . . . . . . . . . . . . . 8-608-19 Long-Term Mean Treatment Performance Concentrations for Priority and
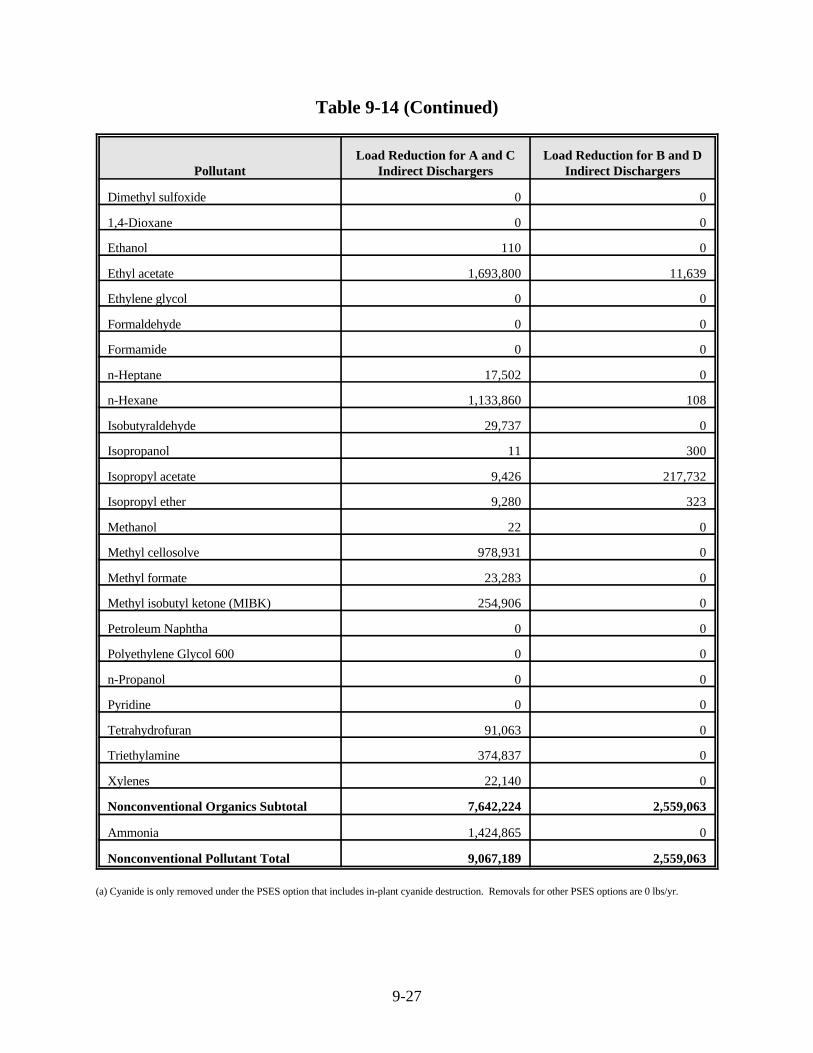
BAT for Subcategory A and C and B and D Direct Dischargers (lbs/yr) . . . . 9-239-13 Estimated BAT Load Reduction Under BPT Options . . . . . . . . . . . . . . . . . . 9-259-14 PSES Pollutant Load Reduction Through In-plant Steam Stripping and
10-1 Operation and Maintenance Unit Costs Used By the Cost Model . . . . . . . . 10-2810-2 Capital Unit Costs Used by the Cost Model . . . . . . . . . . . . . . . . . . . . . . . . 10-3010-3 Constants and Values Used to Model Biological Treatment . . . . . . . . . . . . 10-3210-4 Factors Used To Calculate Indirect and Ancillary Direct Capital Costs As a
Percentage of Total Purchased and Installed Capital Cost . . . . . . . . . . . . . . 10-3310-5 Operation and Maintenance Labor Hour Calculations for Biological
14-1 Summary Results of BCT Cost Test for Subcategory A and C Direct Dischargers (Monetary Values are 1990 $) . . . . . . . . . . . . . . . . . . . . . . . . . . 14-9
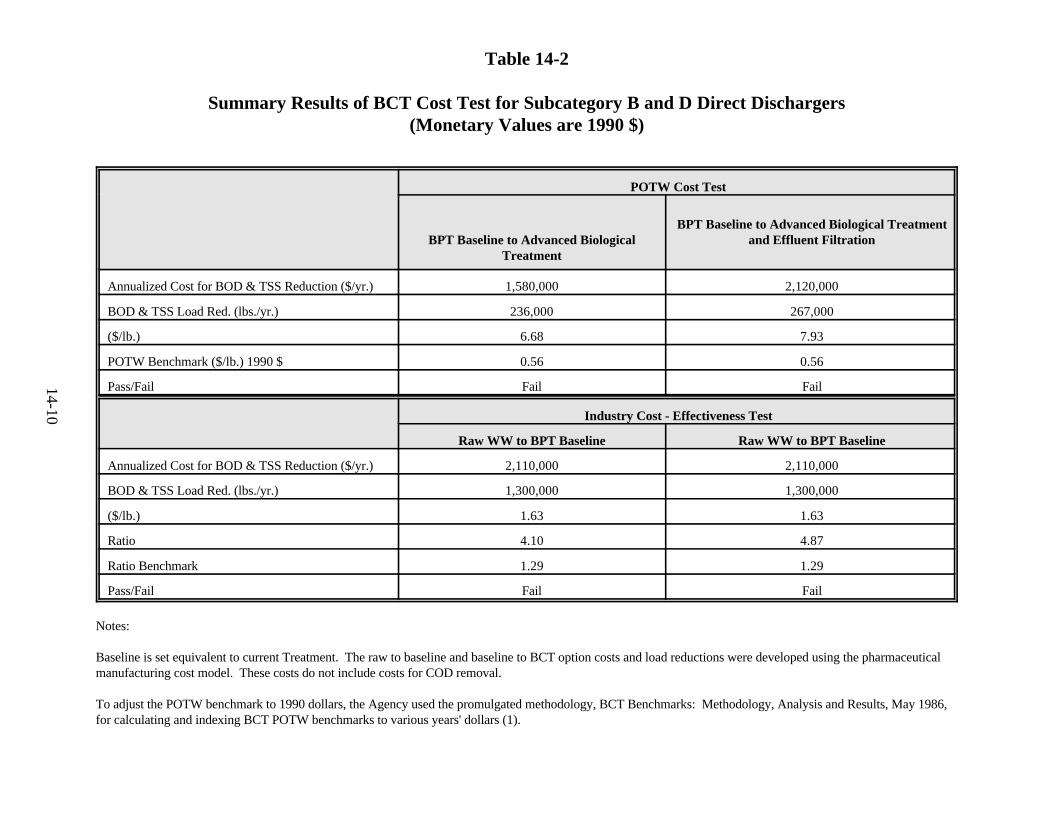
14-2 Summary Results of BCT Cost Test for Subcategory B and D Direct Dischargers (Monetary Values are 1990 $) . . . . . . . . . . . . . . . . . . . . . . . . . 14-10
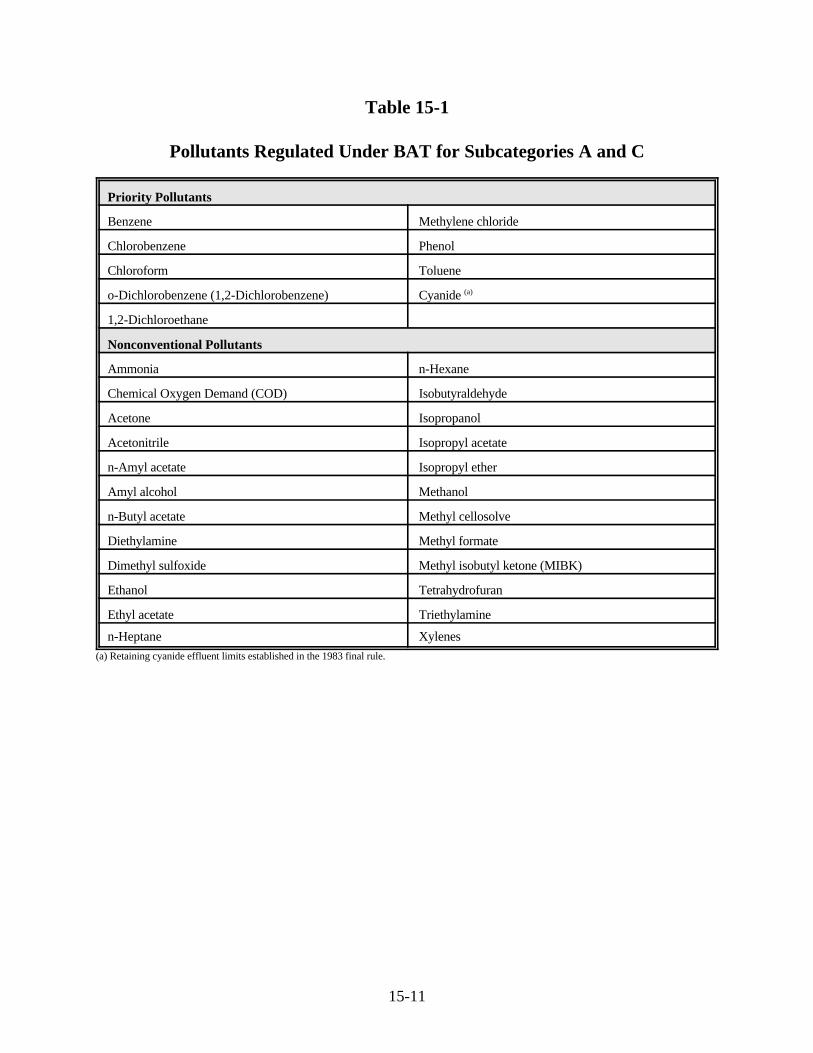
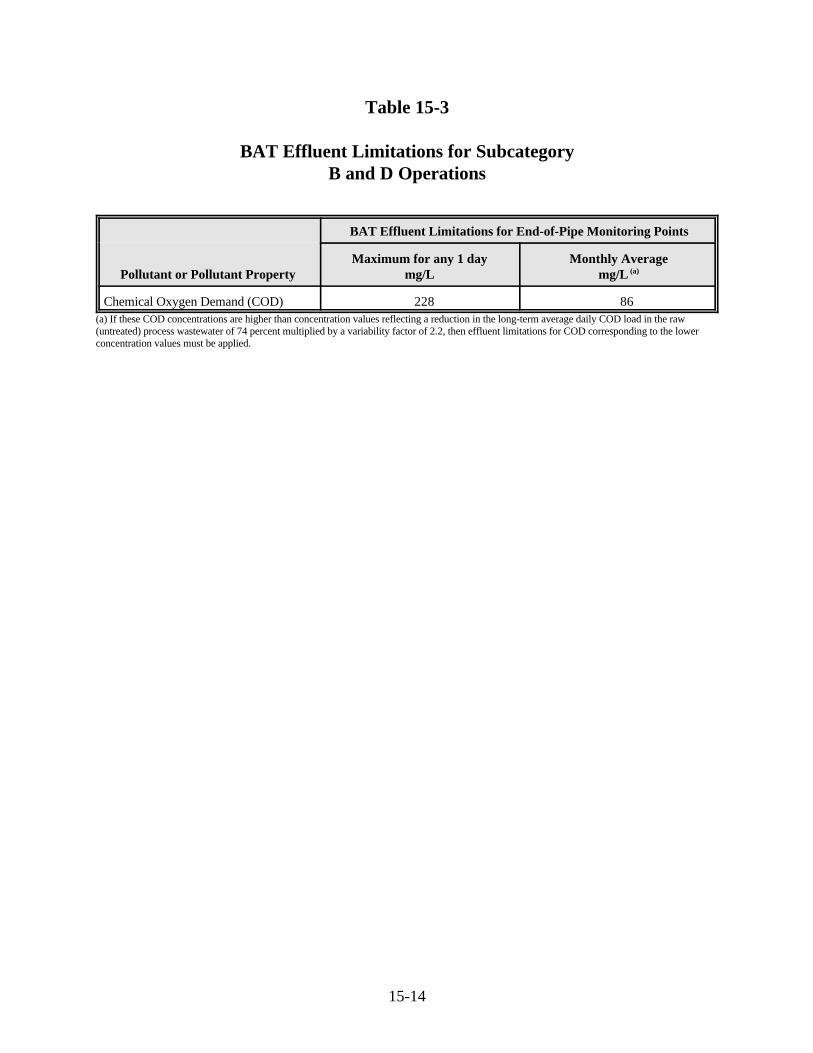
15-1 Pollutants Regulated Under BAT for Subcategories A and C . . . . . . . . . . . 15-1115-2 BAT Effluent Limitations for Subcategory A and C Operations . . . . . . . . . 15-1215-3 BAT Effluent Limitations for Subcategory B and D Operations . . . . . . . . . 15-1415-4 Surrogates for Subcategory A/C Direct Dischargers (Biotreatment) . . . . . . 15-15
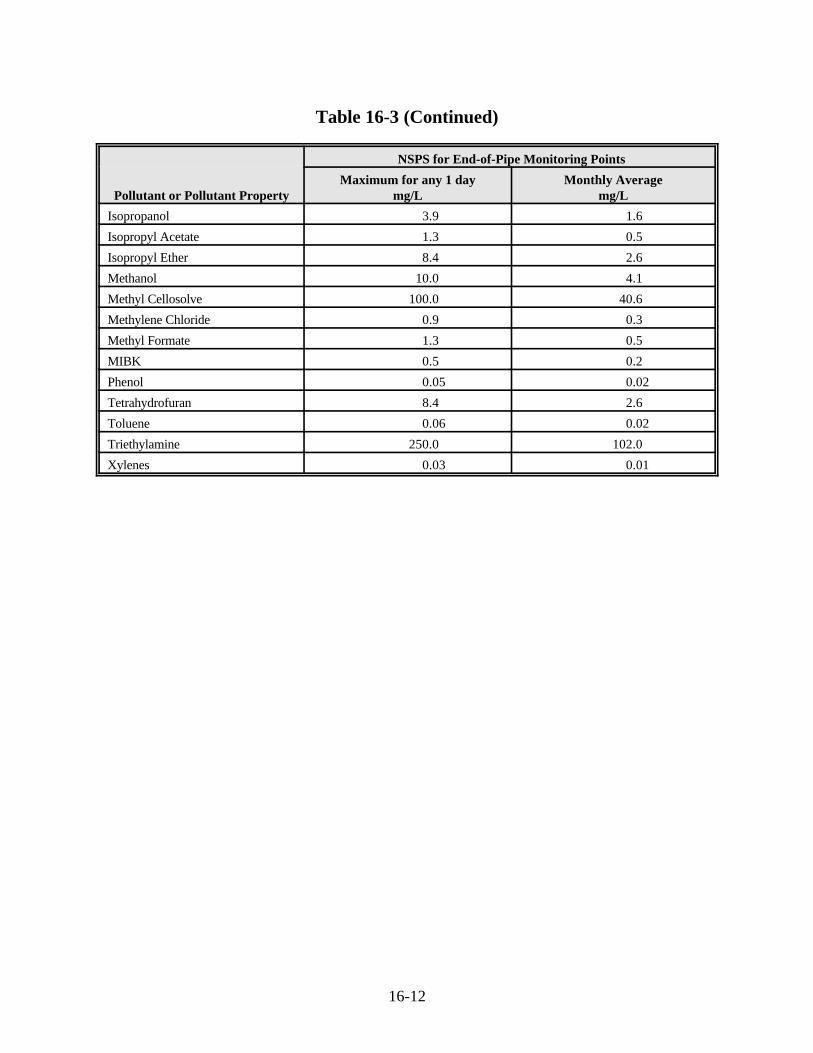
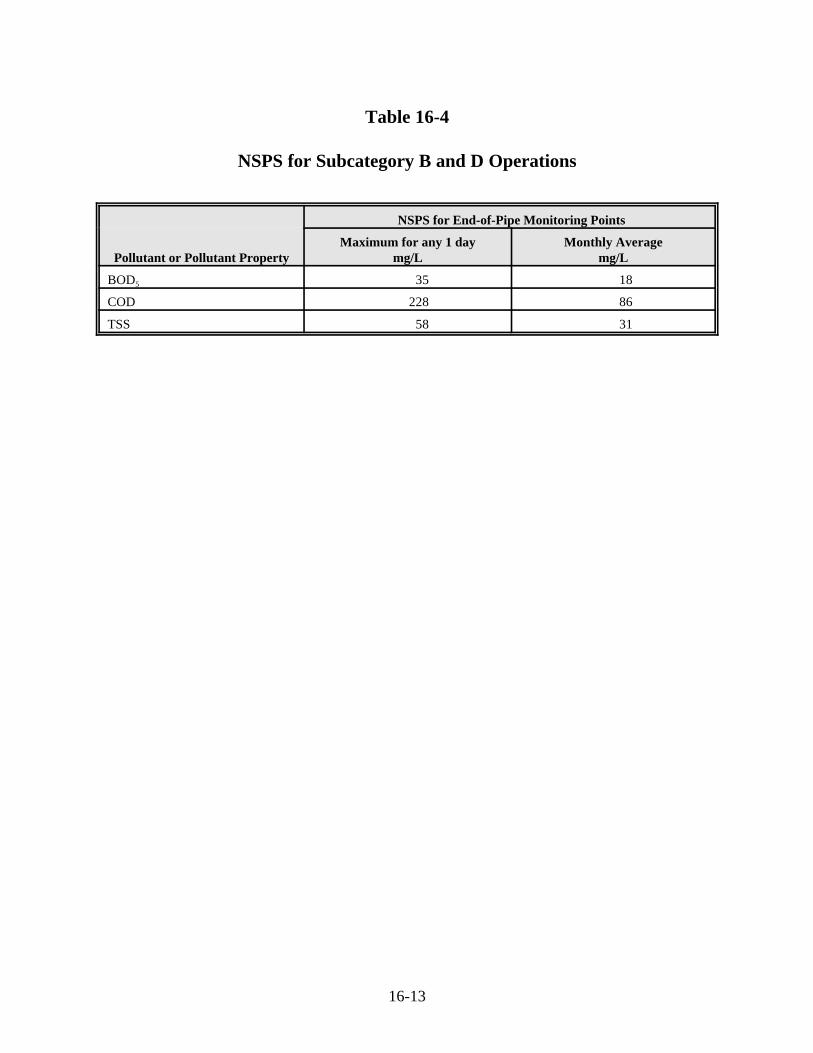
16-1 Pollutants Regulated Under NSPS for Subcategory A and C Facilities . . . . . 16-916-2 Pollutants Regulated Under NSPS for Subcategory B and D Facilities . . . . 16-1016-3 NSPS for Subcategory A and C Operations . . . . . . . . . . . . . . . . . . . . . . . . 16-1116-4 NSPS for Subcategory B and D Operations . . . . . . . . . . . . . . . . . . . . . . . . 16-1316-5 Surrogates for Subcategory A/C Direct Dischargers (Biotreatment) . . . . . . 16-14
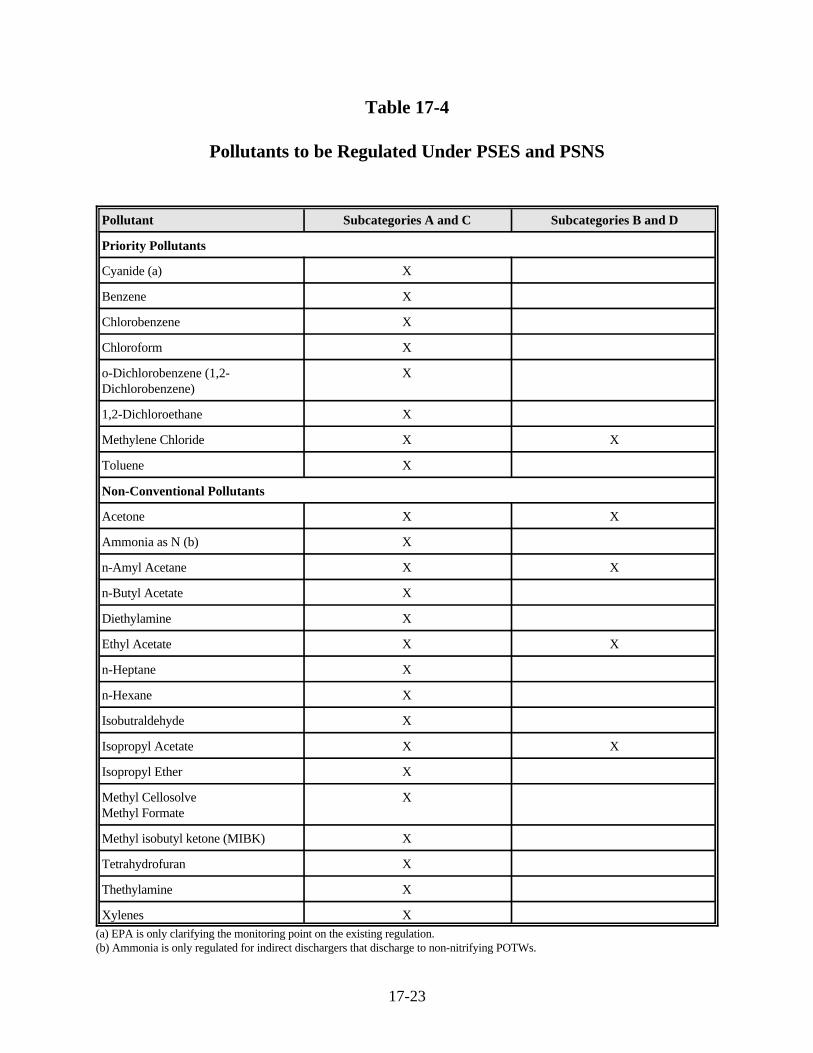
17-4 Pollutants to be Regulated Under PSES and PSNS . . . . . . . . . . . . . . . . . . . 17-2317-5 PSES and PSNS Effluent Limitations for Subcategory A and C
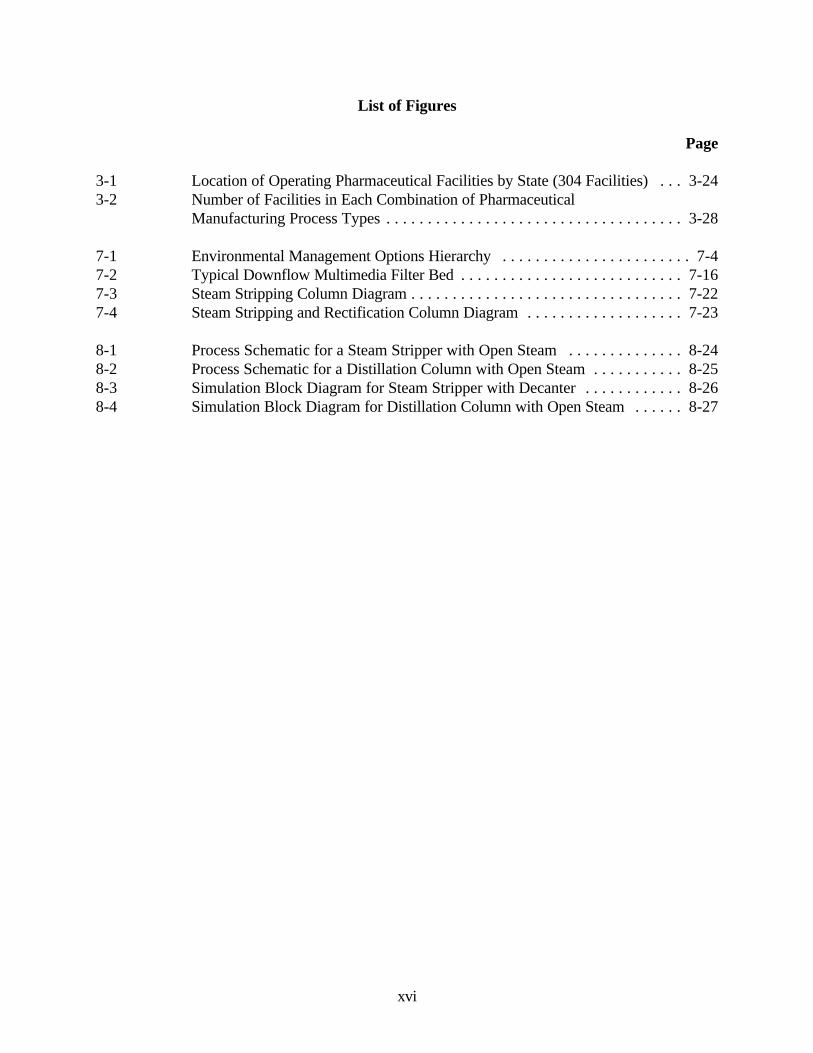
8-1 Process Schematic for a Steam Stripper with Open Steam . . . . . . . . . . . . . . 8-248-2 Process Schematic for a Distillation Column with Open Steam . . . . . . . . . . . 8-258-3 Simulation Block Diagram for Steam Stripper with Decanter . . . . . . . . . . . . 8-268-4 Simulation Block Diagram for Distillation Column with Open Steam . . . . . . 8-27
1-1
SECTION 1
INTRODUCTION
1.1 Legal Authority
The Pharmaceutical Manufacturing Point Source Category Effluent Limitations Guidelines and
Standards are being finalized under the authority of Sections 301, 304, 306, 307, 308, and 501 of
the Clean Water Act (the Federal Water Pollution Control Act Amendments of 1972, 33 U.S.C.
1251 et seq., as amended by the Clean Water Act of 1977, Pub. L. 95-217, and the Water Quality
Act of 1987, Pub. L. 100-4), also referred to as "the Act."
1.2 Background
1.2.1 Clean Water Act
The Federal Water Pollution Control Act Amendments of 1972 established a comprehensive
program to "restore and maintain the chemical, physical, and biological integrity of the Nation's
waters" (101(a)). To implement the Act, EPA is to issue effluent limitations guidelines,
pretreatment standards, and new source performance standards for industrial dischargers.
These guidelines and standards are summarized briefly below:
1. Best Practicable Control Technology Currently Available (BPT) (304(b)(1) of theAct).
BPT effluent limitations apply to all discharges from existing direct dischargers.BPT effluent limitations guidelines are generally based on the average of the bestexisting performance by plants of various sizes, ages, and unit processes within thecategory or subcategory for control of pollutants.
In establishing BPT effluent limitations guidelines, EPA considers the total cost ofachieving effluent reductions in relation to the effluent reduction benefits, the ageof equipment and facilities involved, the processes used, process changes required,engineering aspects of the control technologies, nonwater quality environmental
1-2
impacts (including energy requirements), and other factors as the EPAAdministrator deems appropriate (304(b)(1)(B) of the Act). The Agencyconsiders the category- or subcategory-wide cost of applying the technology inrelation to the effluent reduction benefits. Where existing performance isuniformly inadequate within a category or subcategory, BPT may be transferredfrom a different subcategory or category.
2. Best Available Technology Economically Achievable (BAT) (304(b)(2) of theAct).
In general, BAT effluent limitations guidelines represent the best existingeconomically achievable performance of plants in the industrial subcategory orcategory, based upon available technology. The Act establishes BAT as theprincipal national means of controlling the direct discharge of toxic andnonconventional pollutants to navigable waters. The factors considered inassessing BAT include the age of equipment and facilities involved, the processemployed, potential process changes, and nonwater quality environmental impacts(including energy requirements) (304(b)(2)(B)). The Agency retains considerablediscretion in assigning the weight to be accorded these factors. As with BPT,where existing performance is uniformly inadequate within a category orsubcategory, BAT may be transferred from a different subcategory or category. BAT may include process changes or internal controls, even when thesetechnologies are not common industry practice.
3. Best Conventional Pollutant Control Technology (BCT) (304(b)(4) of the Act).
The 1977 Amendments to the Act established BCT for discharges of conventionalpollutants from existing industrial point sources. 304(a)(4) designated thefollowing as conventional pollutants: biochemical oxygen demand (BOD ), total5
suspended solids (TSS), fecal coliform, pH, and any additional pollutants definedby the Administrator as conventional. The Administrator designated oil and greaseas an additional conventional pollutant on July 30, 1979 (44 FR 44501).
BCT is not an additional limitation, but replaces BAT for the control ofconventional pollutants. In addition to other factors specified in 304(b)(4)(B), theAct requires that BCT limitations be established in light of a two-part "cost-reasonableness" test. American Paper Institute v. EPA, 660 F.2d 954 (4th Cir.1981). EPA's current methodology for the general development of BCTlimitations was issued in 1986 (51 FR 24974, July 9, 1986).
4. New Source Performance Standards (NSPS) (306 of the Act).
NSPS are based on the best available demonstrated control technology. Newplants have the opportunity to install the best and most efficient productionprocesses and wastewater treatment technologies. As a result, NSPS shouldrepresent the most stringent numerical values attainable through the application of
1-3
the best available control technology for all pollutants (i.e., conventional,nonconventional, and toxic pollutants). In establishing NSPS, EPA is directed totake into consideration the cost of achieving the effluent reduction and any non-water quality environmental impacts and energy requirements.
5. Pretreatment Standards for Existing Sources (PSES) (307(b) of the Act).
PSES are designed to prevent the discharge of pollutants that pass through,interfere with, or are otherwise incompatible with the operation of publicly ownedtreatment works (POTWs). The Act authorizes EPA to establish pretreatmentstandards for pollutants that pass through POTWs or interfere with POTWs'treatment processes or sludge disposal methods. The legislative history of the1977 Act indicates that pretreatment standards are to be technology-based andanalogous to the BAT effluent limitations guidelines for removal of toxicpollutants. For the purpose of determining whether to promulgate nationalcategory-wide pretreatment standards, EPA generally determines that there is passthrough of a pollutant and thus a need for categorical standards if the nation-wideaverage percent removal of a pollutant removed by well-operated POTWsachieving secondary treatment is less than the percent removed by the BAT modeltreatment system.
The General Pretreatment Regulations, which set forth the framework for theimplementation of categorical pretreatment standards, are found at 40 CFR Part403. (Those regulations contain a definition of pass through that addresseslocalized rather than national instances of pass through and does not use thepercent removal comparison test described above. See 52 FR 1586, January 14,1987.)
6. Pretreatment Standards for New Sources (PSNS) (307(b) of the Act).
Like PSES, PSNS are designed to prevent the discharges of pollutants that passthrough, interfere with, or are otherwise incompatible with the operation ofPOTWs. PSNS are to be issued at the same time as NSPS. New indirectdischargers, like new direct dischargers, have the opportunity to incorporate intotheir plants the best available demonstrated technologies. The Agency considersthe same factors in promulgating PSNS that it considers in promulgating NSPS.
1.2.2 304(m) Requirements
304(m) of the Clean Water Act (33 U.S.C. 1314(m)), added by the Water Quality Act of 1987,
requires EPA to establish schedules for (I) reviewing and revising existing effluent limitations
guidelines and standards ("effluent guidelines"), and (ii) promulgating new effluent guidelines. On
January 2, 1990, EPA published an Effluent Guidelines Plan (55 FR 80), in which schedules were
1-4
established for developing new and revised effluent guidelines for several industrial categories.
One of the industries for which the Agency established a schedule was the Pharmaceutical
Manufacturing Point Source Category.
Natural Resources Defense Council, Inc. (NRDC) and Public Citizen, Inc., challenged the
Effluent Guidelines Plan in a suit filed in U.S. District Court for the District of Columbia (NRDC
et al. v. Reilly, Civ. No. 89-2980). The plaintiffs charged that EPA's plan did not meet the
requirements of 304(m). A Consent Decree in this litigation was entered by the Court on
January 31, 1992. The terms of the Consent Decree are reflected in the Effluent Guidelines Plan
published on September 8, 1992 (57 FR 41000). This plan required, among other things, that
EPA propose effluent guidelines for the pharmaceutical manufacturing category by January, 1994
and take final action on these effluent guidelines by August, 1995. Recently EPA filed an
unopposed motion requesting an extension of time until July 30, 1998 for the Administrator to
sign the final rule.
1.2.3 Pollution Prevention Act
The Pollution Prevention Act of 1990 (PPA) (42 U.S.C. 13101 et seq., Pub. L. 101-508,
November 5, 1990), “declares it to be the national policy of the United States that pollution
should be prevented or reduced whenever feasible; pollution that cannot be prevented should be
recycled in an environmentally safe manner wherever feasible; and disposal or release into the
environment should be chosen only as a last resort...” (See 6602; 42 U.S.C. 13101(b)).
1.2.4 Prior Regulation of the Pharmaceutical Manufacturing Category
EPA promulgated interim final BPT regulations for the Pharmaceutical Manufacturing Point
Source Category on November 17, 1976 (41 FR 50676; 40 CFR Part 439 Subparts A - E). The
BPT effluent guidelines established limitations for BOD , chemical oxygen demand (COD), TSS,5
and pH for wastewaters discharged by the extraction, the mixing/compounding and formulation,
and the research subcategories and limitations for BOD , COD, and pH for wastewaters5
discharged by the fermentation and the chemical synthesis subcategories.
1-5
On November 26, 1982, EPA proposed regulations applicable to the Pharmaceutical
Manufacturing Point Source Category (47 FR 53584) which proposed to modify and expand
upon the November 17, 1976 regulations. EPA proposed the following:
C To modify the existing BPT TSS effluent limitations guidelines for theextraction, mixing, compounding and formulating, and researchsubcategories;
C To extend these revised BPT TSS effluent limitations guidelines to thefermentation and chemical synthesis subcategories;
C To modify the existing BPT COD effluent limitations guidelines for thefermentation, extraction, chemical synthesis, mixing/compounding andformulation, and research subcategories;
C To propose BPT cyanide effluent limitations guidelines for thefermentation, extraction, chemical synthesis, and mixing/compounding andformulation subcategories;
C To propose BAT COD and cyanide effluent limitations guidelines for thefermentation, extraction, chemical synthesis, and mixing/compounding andformulation subcategories;
C To propose BCT BOD , TSS and pH effluent limitations guidelines for the5
fermentation, extraction, chemical synthesis, and mixing/compounding andformulation subcategories;
C To propose BOD , COD, TSS, cyanide and pH NSPS for the fermentation,5
extraction, chemical synthesis, and mixing/compounding and formulationsubcategories; and
C To propose cyanide PSES and PSNS for the fermentation, extraction,chemical synthesis, and mixing/compounding and formulationsubcategories.
On October 27, 1983 (48 FR 49808), EPA promulgated portions of the November 26, 1982
proposal, proposed additional changes, and postponed portions of the proposed rule. This final
rule included the following:
C Promulgation of BPT TSS limitations for all subcategories equal to amultiple of 1.7 times the existing BPT BOD limitations;5
1-6
C Promulgation of alternative BPT BOD and COD concentration-based5
limitations for the extraction, mixing/compounding and formulation, andresearch subcategories (such alternative limitations were not deemednecessary for the fermentation and chemical synthesis subcategoriesbecause the available data indicated that raw loads were sufficiently high atthese subcategory plants that limitations as low as the alternativelimitations would not be required under BPT);
C Promulgation of BPT, BAT, NSPS, PSES, and PSNS for cyanide based onmonitoring either in-plant after cyanide destruction or end-of-pipe aftercyanide destruction and biological treatment for all but the researchsubcategory;
C Promulgation of pH NSPS for all but the research subcategory;
C Proposal of revised BOD and TSS NSPS based on end-of-pipe filtration in5
combination with advanced biological treatment for all but the researchsubcategory;
C Postponement of a final decision on appropriate BAT limitations and NSPSfor COD until a later date; and
C Postponement of BCT limitations until promulgation of the generalmethodology for determining appropriate levels of conventional pollutantcontrol under BCT.
The October 27, 1983 preamble also included a discussion of BAT effluent limitations guidelines,
NSPS, PSES, and PSNS for Toxic Volatile Organics (TVOs). The Agency decided, at that time,
not to establish regulations controlling the discharge of volatile priority pollutants from
pharmaceutical manufacturing plants based on certain provisions of the previous (1976)
Settlement Agreement with NRDC, lack of data documenting harmful discharges or POTW pass-
through of TVOs, and concern over the costs for treatment. However, the Agency obtained new
data regarding the treatment of methylene chloride at a pharmaceutical manufacturing plant during
a sampling study in which both the plant and EPA participated and began reconsidering its policy
on regulating volatile priority pollutants. On September 9, 1985 (50 FR 36638), the Agency
published a Notice of Availability and request for comments for the Pharmaceutical
Manufacturing Point Source Category; Effluent Limitations Guidelines, Pretreatment Standards,
and New Source Performance Standards (which included the new study data). This notice
1-7
requested comments on the treatment of TVOs by steam stripping, pretreatment of wastewaters,
and any information about changes in solvent usage and facility flows and treatment operations.
On December 16, 1986 (51 FR 45094), the Agency published a final rule for BCT BOD , TSS,5
and pH effluent limitations guidelines for all but the research subcategory. This final rule set the
BCT effluent limitations guidelines equal to the existing BPT BOD , TSS, and pH effluent5
limitations guidelines.
In 1989, EPA withdrew the proposed NSPS for BOD and TSS over concern for the cost-5
effectiveness of TSS control for Subcategories B and D.
On May 2, 1995 (60 FR 21592), EPA proposed regulations applicable to the Pharmaceutical
Manufacturing Point Source Category which proposed to modify and expand upon the 1983 and
1986 final regulations. EPA proposed the following:
C To revise the existing BPT BOD , TSS, and cyanide effluent limitations5
guidelines for the fermentation, extraction, chemical synthesis, and mixing/compounding and formulation subcategories;
C To set BCT equal to the revised BPT for BOD and TSS for the same set5
of subcategories;
C To propose BAT COD, cyanide, priority, and nonconventional pollutanteffluent limitations guidelines for the fermentation, extraction, chemicalsynthesis, and mixing/compounding and formulation subcategories;
C To propose BOD , COD, TSS, cyanide, priority, and nonconventional5
NSPS for the fermentation, extraction, chemical synthesis, and mixing/compounding, and formulation subcategories; and
C To propose cyanide, priority, and nonconventional PSES and PSNS for thefermentation, extraction, chemical synthesis, and mixing/compounding andformulation subcategories.
Based on comments on and data EPA received in response to the May 2, 1995 proposal, and
subsequent follow-up analysis, the Agency presented potential revisions to the proposal
1-8
regulatory options under the CWA in the April 2, 1997 (62 FR 15753) Proposed Maximum
Achievable Control Technology (MACT) Standards for the Pharmaceutical Manufacturing
Industry. EPA published a Notice of Availability (NOA) on August 8, 1997 (62 FR 42732).
EPA published this Notice in order to allow public comment on the data received since the May 2,
1995 CWA proposal, further develop and revise options for the control of the VOCs that were
presented in the April 2, 1997 CAA MACT proposal, and to suggest responses to some
comments on the 1995 CWA proposal.
1.3 Scope of Final Regulations
The final regulation covers the fermentation, extraction, chemical synthesis, and mixing,
compounding and formulating subcategories of the pharmaceutical manufacturing industry. EPA
is promulgating the following:
C Revised BPT effluent limitations guidelines for COD for Subcategories A,B, C and D;
C BCT effluent limitations guidelines for BOD and TSS equal to the existing5
BPT limitations for BOD and TSS; 5
C BAT effluent limitations guidelines for COD, ammonia, and 30 organicpollutants at Subcategories A and C;
C BAT effluent limitations guidelines for COD for Subcategories B and D;
C NSPS effluent limitations guidelines for BOD , COD, and TSS at5
Subcategories A, B, C, and D. Additionally, NSPS effluent limitationsguidelines for ammonia and 30 organic pollutants at Subcategories Aand C;
C PSES and PSNS effluent limitations guidelines for ammonia and 23 organicpollutants at Subcategories A and C; and
C PSES and PSNS effluent limitations guidelines for 5 organic pollutants atSubcategories B and D.
Additionally, EPA is clarifying the existing regulation for cyanide at Subcategories A and C, and
withdrawing the existing regulation for cyanide at Subcategories B and D. These final effluent
1-9
limitations guidelines and standards do not cover discharges generated from the research
subcategory of the Pharmaceutical Manufacturing Point Source Category.
2-1
SECTION 2
SUMMARY
2.1 Introduction
The final regulations for the pharmaceutical manufacturing industry include effluent limitations
guidelines and standards for the control of wastewater pollutants. This document presents the
information and rationale supporting the final effluent limitations guidelines and standards. 2.2
presents the final subcategorization scheme, 2.3 describes the scope of the final regulations, and
2.4 through 2.9 summarize the effluent limitations guidelines and standards.
2.2 Subcategorization
EPA is maintaining the existing subcategorization scheme for this industry (40 CFR Part 439).
These subcategories are summarized in the following table:
Subcategory Code (Subpart) Subcategory
A Fermentation Operations
B Biological and Natural Extraction Operations
C Chemical Synthesis Operations
D Mixing, Compounding, or Formulating Operations
E Pharmaceutical Research Operations
2.3 Scope of Regulations
These regulations apply to Subcategories A through D of the pharmaceutical manufacturing
industry. Subcategory E (Research) operations are not revised by these regulations.
Subcategory E operations at stand-alone facilities or at manufacturing facilities with
Subcategory A, B, C, and/or D operations are covered by the existing BPT effluent limitations
guidelines for Subcategory E.
2-2
Pharmaceutical manufacturers use many different raw materials and manufacturing processes to
create a wide range of products with therapeutic value. Pharmaceutical products are produced by
chemical synthesis, fermentation, extraction from naturally occurring plant or animal substances,
or by refining a technical grade product.
The pharmaceutical products, processes, and activities covered by this regulation include:
C Biological products covered by the U.S. Department of Commerce, Bureauof the Census Standard Industrial Classification (SIC) Code No. 2836, withthe exception of diagnostic substances. (Products covered by SIC CodeNo. 2836 were formerly covered under the 1977 SIC Code No. 2831.)
C Medicinal chemicals and botanical products covered by SIC Code No.2833.
C Pharmaceutical products covered by SIC Code No. 2834.
C All fermentation, biological and natural extraction, chemical synthesis andformulation products considered to be pharmaceutically active ingredientsby the Food and Drug Administration that are not covered by SIC CodeNos. 2833, 2834, or 2836.
C Multiple end-use products derived from pharmaceutical manufacturingoperations (e.g., components of formulations, intermediates, or finalproducts, provided that the primary use of the product is intended forpharmaceutical purposes).
C Products not covered by SIC Code Nos. 2833, 2834, and 2836 or othercategorical limitations and standards if they are manufactured by apharmaceutical manufacturer by processes that generate wastewaters thatin turn closely correspond to those of pharmaceutical products. (Anexample of such a product is citric acid.)
C Cosmetic preparations covered by SIC Code No. 2844 that containpharmaceutically active ingredients or ingredients intended for treatment ofsome skin condition. (This group of preparations does not includeproducts such as lipsticks or perfumes that serve to enhance appearance orto provide a pleasing odor, but do not provide skin care. In general, thisalso excludes deodorants, manicure preparations, shaving preparations andnon-medicated shampoos that do not function primarily as a skintreatment.)
2-3
Products or activities specifically excluded from the pharmaceutical manufacturing category are:
C Surgical and medical instruments and apparatus reported under SIC CodeNo. 3841.
C Orthopedic, prosthetic, and surgical appliances and supplies reported underSIC Code No. 3842.
C Dental equipment and supplies reported under SIC Code No. 3843.
C Medical laboratories services reported under SIC Code No. 8071.
C Dental laboratories services reported under SIC Code No. 8072.
C Outpatient care facility services reported under SIC Code No. 8081.
C Health and allied services reported under SIC Code No. 8091, and notclassified elsewhere.
C Diagnostic devices other than those reported under SIC Code No. 3841.
C Animal feeds that include pharmaceutical active ingredients such asvitamins and antibiotics, where the major portion of the product is non-pharmaceutical, and the resulting process wastewater is not characteristicof process wastewater from the manufacture of pharmaceutical products.
C Foods and beverage products fortified with vitamins or otherpharmaceutical active ingredients, where the major portion of the productis non-pharmaceutical, and the resulting process wastewater is notcharacteristic of process wastewater from the manufacture ofpharmaceutical products.
C Pharmaceutical products and intermediates subject to the provisions of 40CFR part 414, provided their manufacture results in less than 50 percent ofthe total flow of process wastewater that is regulated by 40 CFR part 414at the facility.
In addition, facilities regulated by the organic chemicals, plastics and synthetic fibers (OCPSF)
effluent limitations guidelines and standards (40 CFR 414) that manufacture pharmaceutical
products and intermediates, will be subject to the OCPSF effluent guidelines and standards
provided that the wastewater generated as a result of the manufacture of pharmaceutical products
and intermediates is less than 50% of the total process wastewater flow at the facility.
2-4
2.4 Best Practicable Control Technology Currently Available (BPT)
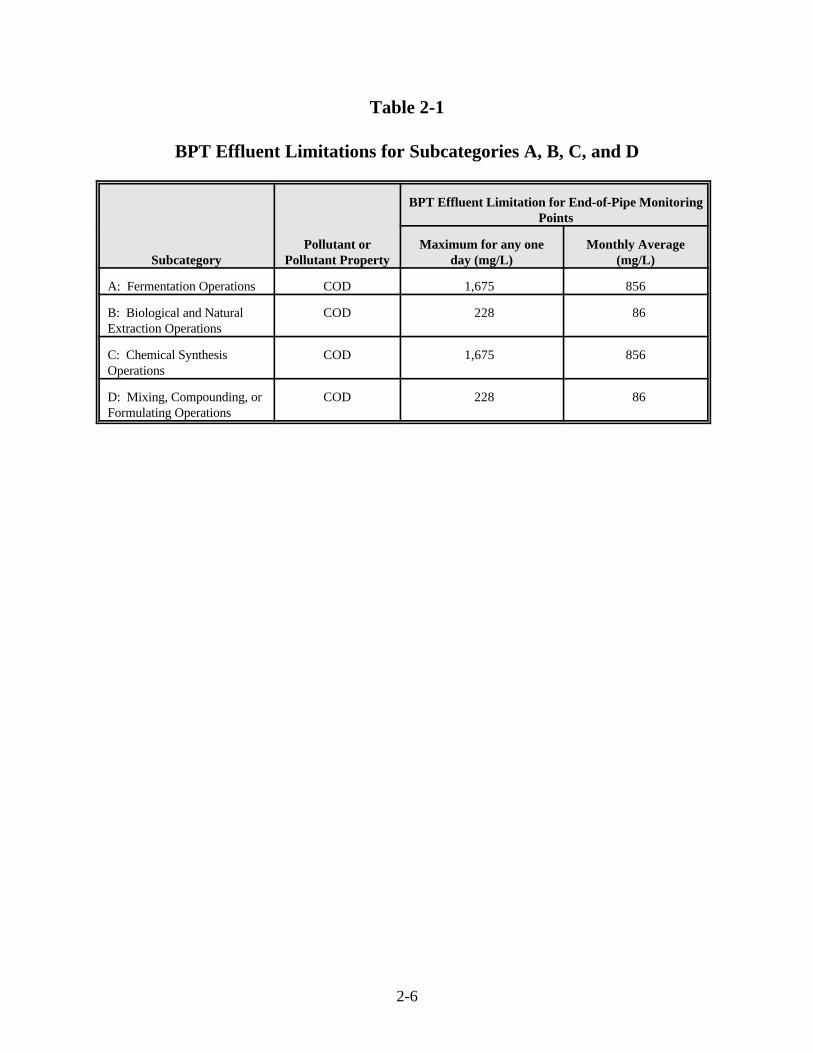
EPA is revising the BPT effluent limitations guidelines for chemical oxygen demand (COD) for
Subcategories A, B, C, and D. Table 2-1 presents these final limitations, which are based on the
application of advanced biological treatment. The existing BPT effluent limitations guidelines for
pH, BOD and TSS are being maintained for all subcategories. The existing BPT effluent5
limitations guidelines for cyanide are being refined; the compliance monitoring requirements for
these limitations have been clarified. Limitations on cyanide for B and D Subcategories are being
withdrawn.
2.5 Best Conventional Pollutant Control Technology (BCT)
Existing BCT effluent limitations guidelines are not being revised.
2.6 Best Available Technology Economically Achievable (BAT)
EPA is revising the BAT effluent limitations guidelines for Subcategories A and C. For
Subcategories A and C, EPA is adding BAT effluent limitations for ammonia as nitrogen (N),
COD, and 30 priority and nonconventional organic pollutants. For Subcategories B and D, EPA
is setting a BAT effluent limitation for COD that is equivalent to the BPT limitation. No
additional BAT effluent limitations are being set for Subcategories B and D. However, EPA is
withdrawing the current BAT effluent limitations for cyanide for Subcategories B and D.
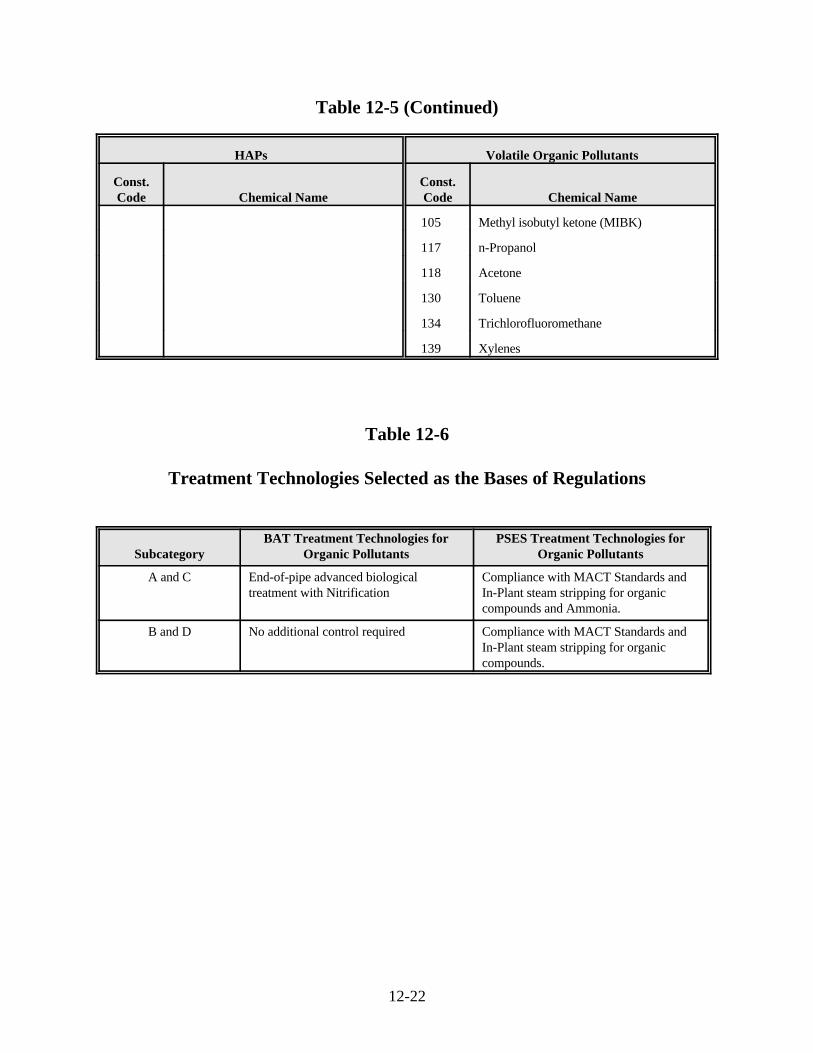
Tables 2-2 and 2-3 present these final effluent limitations guidelines, which are based on the
following: end-of-pipe advanced biological treatment with nitrification for Subcategories A
and C, and end-of-pipe advanced biological treatment for Subcategories B and D.
2.7 New Source Performance Standards (NSPS)
EPA is setting NSPS for priority and nonconventional pollutants for Subcategories A and C. The
NSPS for Subcategories A and C include ammonia (as N) and 30 priority and nonconventional
organic pollutants, based on advanced biological treatment with nitrification.
2-5
EPA is also revising the NSPS controlling discharges of BOD , COD, and TSS for Subcategories5
A, B, C, and D based on advanced biological treatment. EPA is withdrawing cyanide standards
for Subcategories B and D. Final NSPS for Subcategories A and C are presented in Table 2-4.
Final NSPS for Subcategories B and D are presented in Table 2-5.
2.8 Pretreatment Standards for Existing Sources (PSES)
EPA is revising PSES for priority and nonconventional pollutants for Subcategories A, B, C,
and D. For Subcategories A and C, EPA is setting PSES for ammonia (as N) and 23 priority and
nonconventional organic pollutants based on steam stripping. For Subcategories B and D, EPA is
setting PSES for 5 priority and nonconventional organic pollutants based on steam stripping.
Revised PSES for Subcategories A, B, C, and D are presented in Tables 2-6 and 2-7.
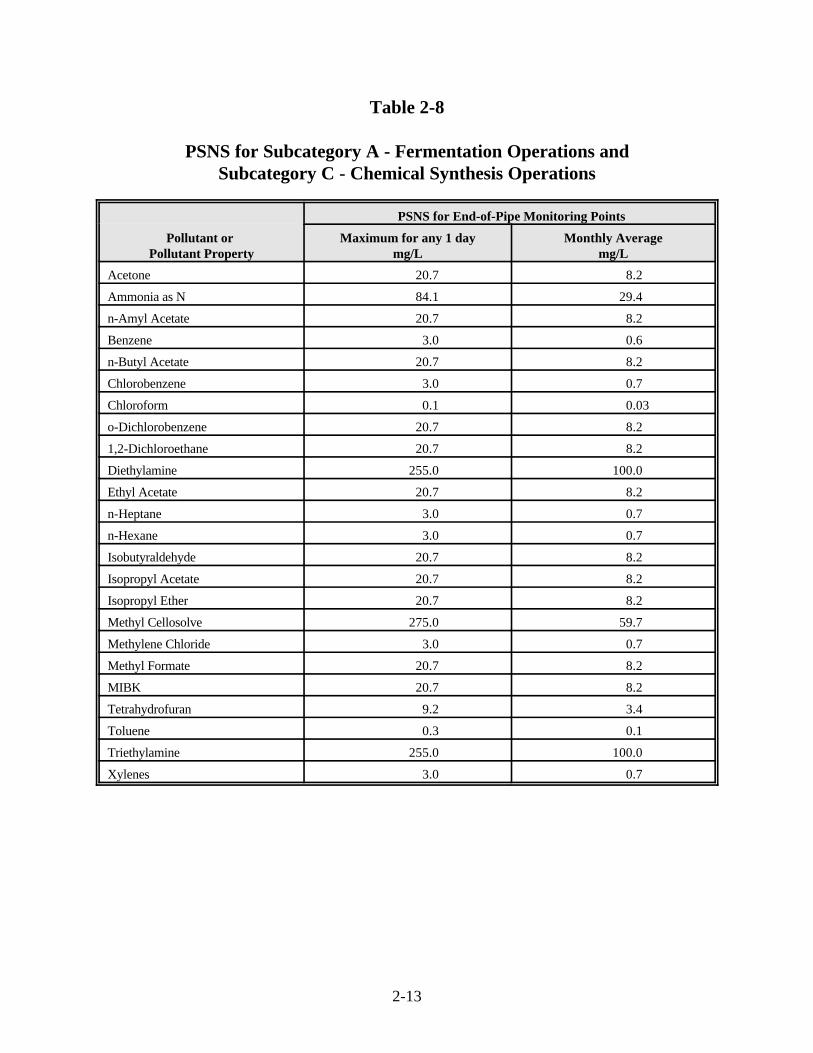
2.9 Pretreatment Standards for New Sources (PSNS)
EPA is revising PSNS for priority and nonconventional pollutants for Subcategories A, B, C,
and D equal to PSES. Revised PSNS for Subcategories A, B, C, and D are presented in
Tables 2-8 and 2-9.
2-6
Table 2-1
BPT Effluent Limitations for Subcategories A, B, C, and D
Subcategory Pollutant Property day (mg/L) (mg/L)Pollutant or Maximum for any one Monthly Average
BPT Effluent Limitation for End-of-Pipe MonitoringPoints
A: Fermentation Operations COD 1,675 856
B: Biological and Natural COD 228 86Extraction Operations
C: Chemical Synthesis COD 1,675 856Operations
D: Mixing, Compounding, or COD 228 86Formulating Operations
2-7
Table 2-2
BAT Effluent Limitations for Subcategory A - Fermentation Operations andSubcategory C - Chemical Synthesis Operations
Pollutant or Maximum for any 1 day Monthly AveragePollutant Property mg/L mg/L
BAT Effluent Limitations for End-of-Pipe Monitoring Points
Acetone 0.5 0.2
Acetonitrile 25.0 10.2
Ammonia as N 84.1 29.4
n-Amyl Acetate 1.3 0.5
Amyl Alcohol 10.0 4.1
Benzene 0.05 0.02
n-Butyl Acetate 1.3 0.5
Chemical Oxygen Demand (COD) 1,675 856
Chlorobenzene 0.15 0.06
Chloroform 0.02 0.01
o-Dichlorobenzene 0.15 0.06
1,2-Dichloroethane 0.4 0.1
Diethylamine 250.0 102.0
Dimethyl Sulfoxide 91.5 37.5
Ethanol 10.0 4.1
Ethyl Acetate 1.3 0.5
n-Heptane 0.05 0.02
n-Hexane 0.03 0.02
Isobutyraldehyde 1.2 0.5
Isopropanol 3.9 1.6
Isopropyl Acetate 1.3 0.5
Isopropyl Ether 8.4 2.6
Methanol 10.0 4.1
Methyl Cellosolve 100.0 40.6
Methylene Chloride 0.9 0.3
Methyl Formate 1.3 0.5
MIBK 0.5 0.2
Phenol 0.05 0.02
Tetrahydrofuran 8.4 2.6
Toluene 0.06 0.02
Triethylamine 250.0 102.0
Xylenes 0.03 0.01
2-8
Table 2-3
BAT Effluent Limitations for Subcategory B - Biological and NaturalExtraction Operations and Subcategory D - Mixing, Compounding, or
Formulating
Pollutant or Maximum for any 1 day Monthly AveragePollutant Property mg/L mg/L
BAT Effluent Limitations for End-of-Pipe Monitoring Points
Chemical Oxygen Demand (COD) 228 86
2-9
Table 2-4
NSPS for Subcategory A - Fermentation Operations andSubcategory C - Chemical Synthesis Operations
Pollutant or Maximum for any 1 day Monthly AveragePollutant Property mg/L mg/L
NSPS for End-of-Pipe Monitoring Points
Acetone 0.5 0.2
Acetonitrile 25.0 10.2
Ammonia as N 84.1 29.4
n-Amyl Acetate 1.3 0.5
Amyl Alcohol 10.0 4.1
Benzene 0.05 0.02
n-Butyl Acetate 1.3 0.5
Chlorobenzene 0.15 0.06
Chloroform 0.02 0.01
o-Dichlorobenzene 0.15 0.06
1,2-Dichloroethane 0.4 0.1
Diethylamine 250.0 102.0
Dimethyl Sulfoxide 91.5 37.5
Ethanol 10.0 4.1
Ethyl Acetate 1.3 0.5
n-Heptane 0.05 0.02
n-Hexane 0.03 0.02
Isobutyraldehyde 1.2 0.5
Isopropanol 3.9 1.6
Isopropyl Acetate 1.3 0.5
Isopropyl Ether 8.4 2.6
Methanol 10.0 4.1
Methyl Cellosolve 100.0 40.6
Methylene Chloride 0.9 0.3
Methyl Formate 1.3 0.5
MIBK 0.5 0.2
Phenol 0.05 0.02
Tetrahydrofuran 8.4 2.6
Toluene 0.06 0.02
Triethylamine 250.0 102.0
Xylenes 0.03 0.01
BOD 267 1115
COD 1,675 856
TSS 472 166
2-10
Table 2-5
NSPS for Subcategory B - Biological and Natural Extraction Operations andSubcategory D - Mixing, Compounding, or Formulating
Pollutant or Maximum for any 1 day Monthly AveragePollutant Property mg/L mg/L
NSPS for End-of-Pipe Monitoring Points
BOD 35 185
COD 228 86
TSS 58 31
2-11
Table 2-6
PSES for Subcategory A - Fermentation Operations andSubcategory C - Chemical Synthesis Operations
Pollutant or Maximum for any 1 day Monthly AveragePollutant Property mg/L mg/L
PSES for End-of-Pipe Monitoring Points
Acetone 20.7 8.2
Ammonia as N 84.1 29.4
n-Amyl Acetate 20.7 8.2
Benzene 3.0 0.6
n-Butyl Acetate 20.7 8.2
Chlorobenzene 3.0 0.7
Chloroform 0.1 0.03
o-Dichlorobenzene 20.7 8.2
1,2-Dichloroethane 20.7 8.2
Diethylamine 255.0 100.0
Ethyl Acetate 20.7 8.2
n-Heptane 3.0 0.7
n-Hexane 3.0 0.7
Isobutyraldehyde 20.7 8.2
Isopropyl Acetate 20.7 8.2
Isopropyl Ether 20.7 8.2
Methyl Cellosolve 275.0 59.7
Methylene Chloride 3.0 0.7
Methyl Formate 20.7 8.2
MIBK 20.7 8.2
Tetrahydrofuran 9.2 3.4
Toluene 0.3 0.1
Triethylamine 255.0 100.0
Xylenes 3.0 0.7
2-12
Table 2-7
PSES for Subcategory B - Biological and Natural Extraction Operations andSubcategory D - Mixing, Compounding, or Formulating
Pollutant or Maximum for any 1 day Monthly AveragePollutant Property mg/L mg/L
PSES for End-of-Pipe Monitoring Points
Acetone 20.7 8.2
n-Amyl Acetate 20.7 8.2
Ethyl Acetate 20.7 8.2
Isopropyl Acetate 20.7 8.2
Methylene Chloride 3.0 0.7
2-13
Table 2-8
PSNS for Subcategory A - Fermentation Operations andSubcategory C - Chemical Synthesis Operations
Pollutant or Maximum for any 1 day Monthly AveragePollutant Property mg/L mg/L
PSNS for End-of-Pipe Monitoring Points
Acetone 20.7 8.2
Ammonia as N 84.1 29.4
n-Amyl Acetate 20.7 8.2
Benzene 3.0 0.6
n-Butyl Acetate 20.7 8.2
Chlorobenzene 3.0 0.7
Chloroform 0.1 0.03
o-Dichlorobenzene 20.7 8.2
1,2-Dichloroethane 20.7 8.2
Diethylamine 255.0 100.0
Ethyl Acetate 20.7 8.2
n-Heptane 3.0 0.7
n-Hexane 3.0 0.7
Isobutyraldehyde 20.7 8.2
Isopropyl Acetate 20.7 8.2
Isopropyl Ether 20.7 8.2
Methyl Cellosolve 275.0 59.7
Methylene Chloride 3.0 0.7
Methyl Formate 20.7 8.2
MIBK 20.7 8.2
Tetrahydrofuran 9.2 3.4
Toluene 0.3 0.1
Triethylamine 255.0 100.0
Xylenes 3.0 0.7
2-14
Table 2-9
PSNS for Subcategory B - Biological and NaturalExtraction Operations and Subcategory D - Mixing, Compounding, or
Formulating Operations
Pollutant or Pollutant Property mg/L mg/L
PSNS for End-of-Pipe Monitoring Points
Maximum for any 1 day Monthly Average
Acetone 20.7 8.2
n-Amyl Acetate 20.7 8.2
Ethyl Acetate 20.7 8.2
Isopropyl Acetate 20.7 8.2
Methylene Chloride 3.0 0.7
3-1
SECTION 3
INDUSTRY DESCRIPTION
3.1 Introduction
This describes the pharmaceutical manufacturing industry by presenting a summary of the data
and information EPA has gathered from previous EPA rulemaking efforts along with data
collected as part of this effort to develop revised effluent limitations guidelines and standards for
the pharmaceutical manufacturing industry. The following topics are discussed in this section:
C 3.2 discusses EPA's data collection methods and information sources;
C 3.3 presents an overview of the industry;
C 3.4 discusses pharmaceutical manufacturing processes; and
C 3.5 discusses trends in the industry.
3.2 Data Collection Methodology and Information Sources
In the course of developing effluent limitations guidelines and standards for the pharmaceutical
manufacturing industry, EPA gathered and evaluated technical data from various sources to create
an industry profile with respect to manufacturing processes, geographical distribution of facilities,
and wastewater generation, treatment, and disposal. These data have also been used to
characterize the pharmaceutical manufacturing industry's wastewater by evaluating the industry's
water use, type of wastewater discharge, and occurrence of conventional, priority, and
nonconventional pollutants in the wastewater. This summarizes the data collection efforts
undertaken by EPA from 1975 to the present.
EPA announced it would collect additional information on this industry by publishing a Federal
Register Notice (50 FR 36638, September 9, 1985) indicating its intent to reconsider whether or
not to regulate methylene chloride and other volatile priority pollutants. In that Notice, EPA
declared it had received new information indicating methylene chloride causes cancer in animals,
3-2
such that the effects of methylene chloride discharges from pharmaceutical manufacturing plants
may be more harmful than previously believed. Additionally, the results of the 1986 Domestic
Sewage Study (DSS) (1) identified pharmaceutical manufacturing facilities as a significant source
of organic pollutants, and found that discharges of organic compounds from these facilities are
largely unregulated. Based on these data, EPA ranked this industry relatively high with respect to
other industries in EPA's 304(m) plan due to environmental need (volatile organic discharges) and
utility to permits and pretreatment programs. Because of the DSS findings, EPA decided to
expand its review beyond priority pollutants to include this industry's use and disposition of
approximately 250 additional nonconventional pollutants.
Before introducing extensive new data collection efforts, EPA reviewed in 1986 available
information and identified missing information that would need to be obtained for the review and
revision of current effluent limitations guidelines and standards for this industry. 3.2.1
summarizes the data and information already available to EPA prior to 1986. Sections 3.2.2
through 3.2.13 describe EPA's new data collection efforts.
3.2.1 Summary of Data Collection Efforts
Data collection efforts conducted by EPA prior to 1986 provided substantial information
regarding manufacturing processes, water use, wastewater characteristics, and treatment
technologies in the pharmaceutical manufacturing industry. Documentation of these efforts was
reviewed in 1986 to identify data and information that would be useful to the effort to develop
revised effluent limitations guidelines and standards for the pharmaceutical manufacturing
industry. This review identified the following major sources of information:
C 308 Portfolio Survey. The original 308 Portfolio Survey was an invaluablesource of information for developing an industry profile and characterizingindustry wastes. It provided the first detailed information on conventionalpollutant parameters in the industry's wastewater and wastewater flowcharacteristics. It was also the first major data source on the use and/orgeneration of priority pollutants by this industry.
3-3
The 308 Portfolio Survey was conducted in two phases. In the fall of1977, EPA distributed the original questionnaire to members of thePharmaceutical Manufacturers' Association (PMA). (Now thePharmaceutical Research and Manufacturers Association, PhRMA.) TheAgency then distributed a second questionnaire to the remainder of theindustry in the spring of 1979.
C PEDCo Reports. In the late 1970s, and concurrent with the data-gathering efforts of the 308 Portfolio Survey, PEDCo Environmental, Inc.(PEDCo), reviewed available literature to identify priority pollutantsassociated with the production of various pharmaceuticalproducts.(2)(3)(4)
C OAQPS Study. EPA's Office of Air Quality Planning and Standards(OAQPS), with the assistance of the PMA, conducted a survey todetermine the use and disposition of the 10 largest volume volatile organicpollutants that each member company purchased in 1975.(5)
In 1985, OAQPS, with the assistance of the PMA, obtained updatedpurchase and disposition data for selected solvents from PMA membercompanies.(6) These data were added to the same type of industry datacollected by OAQPS in 1975.
C Screening and Verification Sampling Program. Beginning in 1978, EPAinitiated the Screening and Verification Sampling Program, under whichwastewater samples were collected from plants with manufacturingoperations representative of the industry. Process and end-of-pipewastewater samples were collected and analyzed for priority, conventional,and nonconventional pollutants in a two-phase program. The first phase,called the screening phase, involved sampling and analyzing the effluentfrom 26 plants to determine the presence of conventional, priority, andnonconventional pollutants. This phase was followed by a verificationphase, in which multiple samples were collected over several days at fivefacilities to verify the presence of the pollutants detected during thescreening phase. Data from the Screening and Verification SamplingProgram, augmented by data collected more recently, were used by EPA tocharacterize pharmaceutical industry wastewater.
C RSKERL/ADA Study. In 1979, the Robert S. Kerr EnvironmentalResearch Laboratory at Ada, Oklahoma (RSKERL/ADA) conducted anapplied research study entitled "Industry Fate Study."(7) The purpose ofthis report was to determine the fate of specific priority pollutants within abiological treatment system. During the study, priority pollutantsassociated with the manufacture of pharmaceuticals were identified at twoindustrial facilities.
3-4
C Toxic Volatile Organics (TVO) Questionnaire. In 1982, EPA distributed asurvey to 15 pharmaceutical manufacturing facilities requesting analyticalinformation on TVO levels in their process wastewater. The survey waslimited to volatile organic priority pollutants only.
C Steam Stripper Sampling. In May of 1983, EPA collected influent andeffluent wastewater samples from a packed column steam stripper and asteam distillation flash tank at Plant 12003. The study was conducted overa five-day period, and provided EPA with analytical data documenting theperformance of this technology treating pharmaceutical manufacturingindustry wastewaters.
C Pilot-Plant Carbon Study. In 1984, U.S. EPA's Water EngineeringResearch Laboratory (WERL) conducted a pilot-plant carbon study todetermine constituents contributing to high chemical oxygen demand(COD) in pharmaceutical manufacturing industry effluents, and to evaluatethe ability of activated carbon adsorption technology to reduce COD levels.
C Domestic Sewage Study. In 1985, EPA sampled a pharmaceuticalmanufacturing facility as part of its efforts to evaluate the discharge ofpriority and hazardous pollutants to POTWs.(1) Samples of the rawwastewater discharge to the local POTW were taken at Plant 30767 duringa 24-hour period.
Data from the above sources were evaluated and summarized in 1986. Additional data collection
efforts were then undertaken to fill the data gaps identified during the analysis of the above data
and to update or replace outdated information. These data collection efforts were:
C A follow-up (to the 1984 WERL study) pilot plant carbon study in 1987;
C Sampling and analysis of wastewater at 13 pharmaceutical manufacturingfacilities between 1986 and 1991;
C A screener questionnaire distributed in May 1989 and a detailedquestionnaire distributed in September 1991;
C Industry self-monitoring data submitted to EPA with the DetailedQuestionnaire;
C EPA bench- and pilot-scale steam stripping, air stripping, and distillationtreatability studies in 1991 and 1993;
3-5
C Product patent reviews for solvent usage;
C POTW Survey distributed in 1993 to nine POTWs receiving wastewaterfrom pharmaceutical manufacturers; and
C Annual pollutant disposition data submitted by industry for the years 1987through 1990 as part of their requirements under 313 of the EmergencyPlanning and Community Right to Know Act of 1986 [Toxic ReleaseInventory (TRI) data].
These data were presented in the record supporting the rulemaking proposed on May 2, 1995. In
response to the proposal, EPA received additional data from industry which was described in a
Notice Of Availability (NOA) published on August 8, 1997. EPA received additional data from
industry in comments on the NOA. Additional data collected by EPA since the May 2, 1995
proposal are summarized below:
C Advanced biological treatment data submitted by industry to EPA inresponse to the May 2, 1995 proposal;
C Steam stripping performance data submitted by industry to EPA inresponse to the May 2, 1995 proposal;
C Technology performance data for cyanide submitted by industry to EPA inresponse to the May 2, 1995 proposal;
C Site visits conducted in 1996 at five pharmaceutical manufacturing facilitiesand three POTWs;
C Sampling and analysis of wastewater at the Barceloneta RegionalWastewater Treatment Plant (BRWTP) in August 1996 and subsequentvisits in April and August 1997;
C Ammonia nitrification data submitted to EPA by industry in response to theAugust 8, 1997 NOA; and
C Additional BPT data submitted to EPA by industry in response to theAugust 8, 1997 NOA.
Discussions of these additional data are presented in Sections 3.2.2 through 3.2.13.
3-6
3.2.2 Follow-Up Pilot-Plant Carbon Study
EPA conducted a follow-up pilot-plant powdered activated carbon (PAC) study in 1987. The
purpose of the study was to reduce COD concentrations by using PAC in pharmaceutical
manufacturing wastewater biological treatment systems without creating additional mixed liquor
suspended solids in the wastewater.
3.2.3 EPA's 1986 - 1991 Sampling at Selected Pharmaceutical Manufacturers
Between 1986 and 1991, EPA conducted sampling episodes at 13 pharmaceutical manufacturing
facilities to: 1) characterize the pollutants in the wastewater being discharged at direct and
indirect discharging facilities, 2) collect pollutant treatment system performance data from
facilities with well-operated biological treatment systems (those systems attaining better than BPT
annual average effluent levels), and 3) obtain treatability data from steam stripping and distillation.
Prior to 1986, the Agency had focused on 5 conventional pollutants and 126 priority pollutants
identified in the 1977 Consent Decree. In 1986, the Agency expanded the analysis of
pharmaceutical manufacturing wastewater and wastewater treatment sludges to determine the
presence and levels of all the pollutants on the "Industrial Technology Division (ITD) List of
Analytes" (hereinafter, the "List of Analytes").
The List of Analytes was derived from the "ITD/RCRA List of Lists" (8) using the following
criteria:
C All analytes on the List of Lists were included on the List of Analytes,except:
-- Analytes which only appear on the "Acutely Toxic Chemicals" List inEPA's Chemical Emergency Preparedness Program (VTOX list);
-- Analytes which hydrolyze or are destroyed by water;
3-7
-- Analytes which are designated for analysis solely by high performanceliquid chromatography (HPLC);
-- Analytes which must be analyzed by a subset of their chemical structure, orderivatized (except for the phenoxy acid herbicides which are analyzed byMethod 615); and
-- Analytes for which no analytical standard is available.
C For analytes which hydrolyze, the hydrolysis product is included (if ananalysis type and standard are available).
C Metal salts are included as the metal (e.g., beryllium, iron, sodium) and asthe anion (e.g., F-, S-, CN-).
When the List of Analytes was first assembled in 1986, it contained 377 analytes.(9) The List of
Analytes was expanded as the need to identify different analytes in the wastewater of different
industries increased. The most recent List of Analytes was published again in 1990 and included
458 analytes.(10)
The List of Analytes was modified in the 1986-1991 sampling programs conducted for the
pharmaceutical manufacturing industry to account for two program-specific needs:
1. After the first two sampling episodes (Nos. 1108 and 1111), EPA determined thatit was not necessary to continue analyzing pharmaceutical manufacturingwastewater and wastewater treatment plant sludges for pesticides/herbicides(Method 1618) and dioxins/furans (Method 1613) unless the presence of theseanalytes was known or suspected. Pesticides/herbicides and dioxins/furans werenot detected during the first two sampling episodes.
2. Analysis of volatile organic pollutants not on the List of Analytes was conductedon a site-specific basis after an assessment of the pre-sampling site visitinformation (i.e., information on solvent use by the pharmaceutical manufacturingfacility). Pharmaceutical manufacturing industry wastewaters were characterizedfor additional analytes such as: ethanol, ethyl acetate, formaldehyde, isopropanol,isopropyl acetate, methanol, methyl formate, and petroleum naphtha.
3-8
During the sampling program, EPA gathered analytical data to characterize the wastewater from
five direct dischargers and eight indirect dischargers. Treatment system performance data were
gathered from three advanced biological treatment systems and two biological pretreatment
systems. Treatment unit performance data documenting the performance of five steam stripping
columns were gathered. The performance of one resin adsorption column and one cyanide
destruction unit was also documented. Table 3-1 summarizes the types of facilities sampled and
types of information collected.
Prior to each sampling episode, a presampling site visit was conducted to gather information on
manufacturing operations, solvent usage, wastewater treatment systems, and possible sample
point locations. Following each visit, a site visit report was prepared which documented the
information gathered and provided recommendations regarding sample point locations. These site
visit reports are included in the Record of this rulemaking.
A draft sampling plan was prepared before each sampling episode to document the procedures to
be followed by the sampling crew during that episode. Prior to the sampling event, EPA sent the
sampling plan to plant personnel for their review and comment. During the sampling episodes,
sampling teams collected, preserved, and shipped the samples to an EPA-contracted laboratory
according to established protocols defined in the sampling plan. EPA offered to split samples
with facility personnel during all episodes.
Following each sampling episode, a sampling episode report was prepared to document facility
manufacturing operations, sampling procedures followed, and analytical results obtained
(including a QA/QC evaluation of these results), and also to provide a discussion of wastewater
treatment plant operation and performance. Sampling plans and reports are also included in the
Record of this rulemaking.
QA/QC evaluations of analytical data began at EPA's Sample Control Center (SCC) when the
data were received from the contract laboratories. The raw data from the laboratories were
reviewed for acceptability based on predefined data quality objectives specified in the respective
analytical methods. The following objectives were reviewed:
3-9
C Sample completeness;C Holding times;C Calibration verification;C Blanks;C Matrix spikes;C Matrix spike duplicates;C Laboratory control samples; andC ICP serial dilution.
After the above-mentioned criteria were reviewed by SCC, a data quality report was issued for
each dataset. Datapoints deemed unacceptable by SCC were deleted from the dataset. Once the
analytical data review was completed, a review was conducted to determine the following:
C The relative percent differences between split sample results;
C The ability to reproduce blind field duplicates; and
C Any significant deviations or upsets in process operations during thesampling event that may have impacted the results obtained.
Data not meeting QA/QC objectives with respect to blind field duplicates established by EPA for
the analytical methods used were discussed in the respective sampling episode reports, and the
impacted data were identified and deleted from the final database as appropriate.
3.2.4 Pharmaceutical Industry Questionnaires
The Pharmaceutical Manufacturing Industry Questionnaire distributed by EPA under authority of
308 of the Clean Water Act is a major source of data and information used in the development of
effluent limitations guidelines and standards for the pharmaceutical manufacturing industry. This
questionnaire requested information on:
C Pharmaceutical products and production processes;
C Chemical use and disposition;
C Wastewater treatment system design and operation parameters;
3-10
C Waste minimization/pollution prevention techniques;
C Wastewater characterization, including long-term self-monitoring data; and
C Financial and economic data for use in assessing economic impact andachievability of regulatory options.
EPA used a two-phase questionnaire approach to collect industry information including a screener
questionnaire and a detailed questionnaire. The industry trade association PMA (now known as
PhRMA) participated in the development of these questionnaires and both questionnaires were
submitted to OMB for clearance. The screener questionnaire was distributed by EPA in May
1989 to 1,163 known or suspected pharmaceutical manufacturers. The screener questionnaire
mailing list was developed after an extensive review of these sources:
C EPA current list of pharmaceutical manufacturers (respondents of the 308Portfolio Survey in 1977 and 1979);
C List of pharmaceutical manufacturers maintained by Noyes DataCorporation (11);
C List of pharmaceutical manufacturers presented in the Physician's DeskReference (12);
C List of pharmaceutical manufacturers presented in the Merck Index (13);
C List of facilities classified under SIC codes 2831, 2833, and 2834 in Dunnand Bradstreet's "Electronic Yellow Pages" (14);
C List of facilities classified under SIC codes 2831, 2833, and 2834 in Dunnand Bradstreet's World Marketing Directory (15);
C List of facilities classified under SIC codes 2831, 2833, and 2834 in theEPA Permit Compliance System (PCS);
C List of facilities classified: 1) as pharmaceutical manufacturers, or 2) underSIC codes 2831, 2833, and 2834 by state and/or regional wastewaterpermitting authorities; and
C List of pharmaceutical manufacturers published in the American MedicalAssociation's Drug Evaluations.(16)
3-11
The screener questionnaire was designed to identify those facilities that could possibly be subject
to the revised BPT, BAT, BCT, and PSES effluent limitations guidelines and standards. Detailed
Questionnaires were then sent to pharmaceutical manufacturing facilities that were identified as:
1) direct dischargers of process wastewater involved in fermentation, natural extraction, chemical
synthesis, or mixing, compounding, or formulating operations, or 2) indirect dischargers of
process wastewater that potentially use solvents in the manufacturing process. Indirect
dischargers that indicated in the screener that they use fermentation, extraction, or chemical
synthesis process operations were assumed to potentially use solvents and were sent detailed
questionnaires. In addition, the Detailed Questionnaire was sent to indirect dischargers utilizing
mixing/compounding/formulating operations if the facility indicated in the screener that they used
solvents in these operations. The Detailed Questionnaire was not sent to facilities reporting zero
discharge or research only operations in the screener questionnaire.
EPA wanted to ensure that the questionnaire was designed to collect representative data from the
industry in the form that the industry maintains the data. Therefore, specific pharmaceutical
manufacturers, as well as their trade association (PMA), were involved in the development of the
Detailed Questionnaire. The PMA was given copies of the original draft of the survey, as well as
subsequent drafts that included significant revisions or modifications.
In 1989, nine plants (six PMA members and three non-PMA members) were sent the Detailed
Questionnaire as part of the pretest program. However, one facility closed prior to receiving the
questionnaire, and a second declined to participate in the pretest program. Industry comments
from the remaining seven facilities were incorporated into the survey, and a revised version was
prepared.
As required by the Paperwork Reduction Act, (44 U.S.C. 3501 et seq.), EPA submitted the
Detailed Questionnaire to the Office of Management and Budget (OMB) for review, and
published a notice in the Federal Register that the questionnaire was available for review and
comment.(17) In August 1990, OMB granted clearance of the technical (Part A) and company-
level financial information (Part B) of the Detailed Questionnaire. OMB denied clearance of
questions asking for facility-specific economic information. Industry representatives argued that
3-12
the industry should not be required to submit such information because it was not readily available
because of standard accounting practices used by the industry, was highly sensitive, and in any
case was not useful in developing effluent limitations guidelines. The Agency considered facility-
level financial data critical to the economic analysis, and following discussions, OMB approved
Part B of the questionnaire. Respondents to Part B had the option of certifying certain conditions
about the economic impacts that will result from costs incurred to comply with the effluent
limitations guidelines and standards that EPA ultimately promulgates pursuant to this rulemaking.
This facility impact certification, signed by an official of the owner company with sufficient
decision-making authority for this certification to be legally binding, could be submitted to EPA in
lieu of completing the facility-level financial data in the Detailed Questionnaire.
In September 1991, EPA sent the Detailed Questionnaire to 280 facilities. This group included all
direct dischargers involved in fermentation, extraction, chemical synthesis, or mixing,
compounding, or formulating operations, all indirect dischargers involved in fermentation,
extraction, and chemical synthesis operations, and a statistical sampling of indirect discharging
facilities conducting mixing, compounding, or formulating operations that used solvents in their
pharmaceutical manufacturing operations.
Not all indirect dischargers that performed mixing, compounding, or formulating operations were
sent a Detailed Questionnaire. EPA determined this was unnecessary because the production
methods, wastewater volume and strength, and treatment operations used among this group of
facilities were similar. EPA expected the variation in the questionnaire responses from this group
of facilities to be very small based on the information from the screener questionnaire supplied by
this group of facilities. Consequently, a randomly selected subset of mixing, compounding, or
formulating facilities that used solvents was surveyed. The random sample was developed using a
methodology that ensured that the Detailed Questionnaire was distributed to facilities within four
plant size groups, based on number of employees.(18)
Of the 280 facilities sent the Detailed Questionnaire, 245 were not closed or exempted and were
deemed eligible to respond. Of the remaining 35 plants, 12 were closed and 23 were exempted
3-13
from completing the questionnaire by EPA because they certified that they no longer
manufactured pharmaceutical products and they had no plans to manufacture them in the future.
EPA received responses from 244 of the 245 eligible facilities (a 99.6% response rate).
The Detailed Questionnaire was designed to gather data and information to develop revised BAT,
BPT, and BCT effluent limitations guidelines and pretreatment standards (PSES, PSNS) intended
to control priority and nonconventional volatile organic pollutants and any other conventional,
priority and nonconventional pollutants of concern found in significant quantities (i.e., treatable
concentrations). The Detailed Questionnaire gathered information on pharmaceutical production,
chemical use and disposition, waste minimization and pollution prevention, wastewater
generation, collection, and conservation, wastewater treatment, steam stripping, wastewater
characteristics and economic and financial data.(19)
The Agency required product-specific information to better understand the industry discharge
pattern for individual pollutants.
The on chemical use and disposition focused on a specific list of chemicals and compounds
identified as associated with the pharmaceutical manufacturing industry. The specific list of 139
pollutants was created after review of the data and information sources then available to
determine all priority and nonconventional pollutants that were known or suspected to be used in
the manufacture of pharmaceuticals. The list of 139 included pollutants meeting at least one of
the following criteria:
C Identified by the 1975 and/or 1985 the Office of Air Quality Planning andStandards (OAQPS) solvent use and disposition data as being discharged inpharmaceutical manufacturing industry wastewaters;
C Identified by the pharmaceutical product patent search as potentially beingused in pharmaceutical manufacture;
C Detected in the wastewaters of the pharmaceutical manufacturing industry;
C Identified as a volatile organic pollutant contained on the DSS list ofanalytes;
3-14
C Identified as a volatile organic pollutant on the ITD List of Analytes; or
C Identified as a volatile organic pollutant that was present in pharmaceuticalmanufacturing industry wastewaters according to the TRI database.
The Agency used the information on chemical use and disposition to provide wastewater loading
estimates for various pollutants and to evaluate individual chemical usage by pharmaceutical
manufacturers. In addition, OAQPS evaluated the chemical emission information in support of its
development of emission standards for hazardous air pollutants as required by the Clean Air Act.
The Agency's Office of Pollution and Prevention (OPP) also evaluated the responses to determine
the extent to which individual chemicals are recycled and reused. Pollution prevention
information on the extent to which source reduction and recycling is practiced in the
pharmaceutical industry has been incorporated into EPA's regulatory development efforts to
identify pollution prevention practices which have the potential for success.
Responses to questions pertaining to wastewater generation and collection have been used by
EPA to characterize wastewater generation by the industry and to develop appropriate plant-by-
plant treatment costs for process wastewater. EPA has used the information on wastewater
treatment present at pharmaceutical facilities to determine the basis for revised regulations and to
develop regulatory option costs. The information about the design and operating characteristics
of in-place technology was also used for establishing the technology basis of the regulatory
options considered and for cost estimating purposes. In addition, the existing wastewater
treatment information was used to estimate air emissions from the treatment of pharmaceutical
manufacturing wastewaters.
The Agency realizes that steam stripping technology is being used by some pharmaceutical
manufacturing facilities primarily to recover volatile organic compounds from wastewater.
Consequently, the Agency solicited data on steam strippers to categorize as accurately as possible
those units in place at pharmaceutical manufacturing plants to identify their design and operating
parameters. The information provided on steam stripping has been used by EPA to evaluate
3-15
what constitutes BAT level steam stripping under the Clean Water Act, as well as MACT level
steam stripping under the Clean Air Act.
Conventional wastewater characteristics, including long-term performance averages supported by
individual data points, were used by the Agency to develop revised limitations and standards for
conventional pollutants. The Agency requested organics data to confirm the presence of priority
and nonconventional pollutants that were expected in discharges of pharmaceutical manufacturing
processes and to provide a source of treatment performance data for EPA's regulatory
development.
The Agency used economic and financial data collected with the questionnaire to evaluate the
economic impact of proposed regulations on the industry and to determine whether PSNS/NSPS
would create a barrier to entry for facilities wishing to enter into pharmaceutical manufacturing.
3.2.5 Industry-Supplied Data
Facilities that discharge wastewater directly to surface waters of the United States must have a
National Pollutant Discharge Elimination System (NPDES) permit, which establishes effluent
limitations for various pollutants and requires the plants to monitor the levels of such pollutants in
their effluent (see 402 CWA, as amended, implemented by 40 CFR 121-125). POTWs also
require facilities to monitor pollutant levels in their wastewater prior to discharge. Additionally,
some facilities with treatment systems monitor intermediate points within the systems to check the
efficiency of the unit. EPA requested that copies of the effluent monitoring data collected by
plants in 1990 be submitted as part of the response to the Detailed Questionnaire. Data from
treatment systems using the technologies described in 7 were entered into a database to establish
the treatment performance of those technologies.
Some facilities and POTWs provided additional data in response to a specific request by EPA or
as follow-up to the data provided in their questionnaire or data gathered during a sampling
episode. These additional data submittals are explained in the following paragraphs.
3-16
In addition to the data submitted by Plant 30701 in their Detailed Questionnaire response, an
additional 20 months of self-monitoring data were submitted to EPA from that direct discharger.
The data were submitted by plant personnel because they felt that the pharmaceutical production
reported in their response to the 1988 pre-test questionnaire was below normal levels. EPA
statisticians analyzed the original questionnaire data and the additional 20 months of data. Since
no significant differences between the datasets were found, the two datasets were combined, and
used in the wastewater characterization of the industry.
In 1991, under authority of 308 of the Clean Water Act, EPA requested that Facility 30542
provide six months' worth of data documenting the performance of their cyanide destruction unit.
Personnel from Plant 30542 collected and analyzed influent and effluent samples from their batch
cyanide destruction (hydrogen peroxide oxidation) unit for six months. These data were
submitted to EPA in November of 1991, and were used in the evaluation of effluent limitations
guidelines and standards for cyanide based on cyanide destruction technology.
In March of 1989, EPA conducted concurrent sampling episodes at Facility 30977 and the POTW
to which they discharged. After those sampling episodes, POTW personnel provided EPA with
additional priority and nonconventional pollutant data as well as data collected characterizing the
wastewater discharged from Facility 30977. These data were ultimately used for wastewater
characterization of the pharmaceutical manufacturing industry.
When personnel from Facility 30832 indicated that the data collected by EPA during a sampling
episode in July of 1986 were not representative of their typical effluent, EPA requested from the
POTW to which that facility discharged, copies of long-term data collected over a 12-month
period. The data submitted by the POTW were added to EPA's database, and have been used to
help characterize pharmaceutical manufacturing wastewaters. Based on comparison to the long-
term data, the data collected during the sampling episode were judged not to be representative of
typical operations at Facility 30832, and were not used in the development of effluent limitation
guidelines and standards.
3-17
3.2.6 Air Stripping, Steam Stripping, and Distillation Pilot Studies
Between October and December 1991, bench-scale and pilot-scale tests were conducted by EPA
to study: 1) air stripping technology for ammonia removal from pharmaceutical manufacturing
plant final effluent, and 2) steam stripping technology for volatile organic pollutant removal from
pharmaceutical manufacturing plant process wastewaters.
The air stripping and steam stripping pilot studies were conducted at a pharmaceutical
manufacturing facility with fermentation, chemical synthesis, formulation, and research operations.
The total facility effluent was used as the feed to the pilot-scale air stripping study. The objective
of this study was to examine the feasibility of obtaining at least 90% ammonia removal using air
stripping technology. The wastewater characterization and treatment performance from the pilot-
scale study are described in more detail in Sections 5 and 8, respectively.
For the steam stripping study, three wastewater streams from the facility were selected for
analysis. The objective of this study was to achieve the lowest practical concentrations of volatile
organic contaminants in the treated effluent, and to collect sufficient data to document these
concentrations. On-site pilot-scale testing was conducted for two of the three streams. Bench-
scale testing of the third wastewater was conducted at a contractor's laboratory because there was
insufficient wastewater volume available at the facility to run the steam stripping test on a pilot-
scale basis. The wastewater characterization and treatment performance from the steam stripping
study are described in more detail in Sections 5 and 8, respectively.
In September 1993, EPA conducted an on-site treatment performance study using a
pharmaceutical manufacturing facility's existing distillation column that treated wastewaters
containing methanol. The objective of the study was to define operating parameters which
resulted in optimum removal of methanol and compounds with similar volatility from wastewater
and to collect sufficient data to document this removal. Waste characterization and treatment
performance of the distillation study are discussed in Sections 5 and 8, respectively.
3-18
3.2.7 Patent Reviews
To better characterize volatile organic pollutant usage in the pharmaceutical manufacturing
industry, EPA reviewed all patents identified for the approximately 1,300 pharmaceutical active
ingredients identified as being manufactured. In 1987 the patents were reviewed for solvents on
the ITD List of Compounds. The patents were reviewed again in 1991 to identify all solvents
potentially used by the industry (not just those on the ITD List of Compounds). These patent
reviews provided information regarding which volatile organic pollutants were most likely used in
the manufacture of pharmaceutical products, and identified the plants at which the volatile organic
pollutants were being used. EPA used patent search information to support the development of
the List of Pollutants analyzed for sampling efforts and for questionnaire development.
3.2.8 POTW Survey
In 1993 EPA surveyed nine POTWs to investigate the effect that indirect discharging
pharmaceutical manufacturing facilities had on the POTWs that received the wastewater. This
survey contained questions about local limits or special conditions which apply to pharmaceutical
manufacturing facilities and volatile or semivolatile organics which caused problems for POTWs.
The POTWs were also asked to explain problems connected with discharges from pharmaceutical
manufacturing operations which they felt needed to be addressed in national regulations, and to
supply other information regarding pharmaceutical manufacturing facility discharges within the
sewer district that bears on the need for pretreatment standards.
Substantive responses were received from six of the surveyed POTWs. The responding POTWs
provided EPA with a list of the pollutants frequently found in their wastewater, details of
problems that result when wastewaters containing slug loads of pollutants are discharged,
comments on the structure of PSES, and monitoring requirements which would be helpful to
POTWs. The detailed responses to the POTW survey are included in the Record for this
rulemaking.
3-19
3.2.9 Toxic Release Inventory (TRI) Data
Facilities which manufacture or use in their process at least 25,000 pounds of a listed toxic
chemical must submit the Toxic Chemical Release Inventory (TRI) Reporting Form as required by
313 of the Emergency Planning and Community Right-to-Know Act. This form, known as Form
R, provides the public with information on the releases of listed toxic chemicals in their
communities and provides EPA with information to determine the need for future regulations.(20)
The quantities of both routine and accidental releases of listed toxic chemicals must be reported,
as well as the maximum amount of the listed toxic chemical on site during the calendar year and
the amount contained in wastes transferred off site. The Agency reviewed the information
provided by the TRIs for the years 1987 through 1990 and for 1994 to assist in characterizing the
chemical use and wastewater discharges from the industry, and to investigate current trends in
chemical use and disposition in the pharmaceutical manufacturing industry.
3.2.10 Industry Data in Response to Proposed Rulemaking
In response to the proposed rulemaking published on May 2, 1995, EPA has acquired a significant
amount of additional data and information from the industry. The new data submitted include: 1)
Biochemical Oxygen Demand (BOD ), Chemical Oxygen Demand (COD), and Total Suspended5
Solids (TSS) data for advanced biological treatment systems; 2) data on ammonia nitrification in
advanced biological treatment systems; 3) advanced biological treatment systems data for organic
pollutants; 4) steam stripping performance data for volatile organic pollutants; and 5) technology
performance data for treatment of cyanide. Below are summaries of each type of new data
provided by industry.
Advanced Biological Treatment Data (Biochemical Oxygen Demand (BOD ), Chemical5
Oxygen Demand (COD), Total Suspended Solids (TSS) and Ammonia)
Additional BOD , COD, and TSS data were submitted with comments on the proposed effluent5
limitations guidelines and standards from five facilities. The data from three of the facilities
represents additional years of data that supplement the 1990 year data that were previously part of
3-20
the technology performance database for advanced biological treatment. Data from one other
facility represents a new source of BOD , COD, TSS performance data which was also added to5
the advanced biological treatment technology performance database. Data from the fifth facility
included only one data pair that was not included in technology performance database. A
discussion of the review of these new data and the evaluation of whether to include them in the
technology performance database is presented in 8.3.
Nitrification in Advanced Biological Treatment Data for Ammonia.
Performance data on ammonia nitrification from one facility were used as the basis of ammonia
limitations at proposal. This facility provided additional ammonia data for a multi-year period.
Three other facilities also submitted ammonia nitrification data in response to the proposed
rulemaking. The other new ammonia data from biological treatment have been added to the
existing ammonia database.
Advanced Biological Treatment Organics Data
New biological treatment performance data for organic pollutants were submitted with comments
on the May 2, 1995 proposal by six facilities. Four of these facilities represented performance of
advanced biological treatment.
Steam Stripping Performance Data
New data representing the performance of steam stripping technology in removing volatile
organic pollutants were submitted with comments on the May 2, 1995 proposal by three facilities.
The additional data reflect treatment by four stream strippers of 23 of the pollutants for which
standards were proposed. In response to the comments on the May 2, 1995 proposal related to
steam stripping of volatile organics, EPA has incorporated the newly submitted data with the data
used at proposal and revised its pretreatment standards for the various parameters.
3-21
Technology Performance Data for Cyanide
EPA received additional cyanide treatment performance data from three facilities. Two of these
facilities use alkaline chlorination treatment and one of these facilities uses hydrolysis treatment.
For one facility, the new data include the individual effluent data points corresponding to the
facility's 308 Questionnaire average 1990 effluent cyanide concentration. For the second facility,
the new data include: 1) part of the raw 1990 data used in developing the facility's 308
Questionnaire average effluent cyanide concentration (the other part of the raw 1990 data used in
the reported averages could not be located by the plant) and 2) additional 1994 cyanide
destruction data. For the third facility, the new data include 1994 cyanide destruction data. In
response to the May 2, 1995 proposal comments related to cyanide, EPA has incorporated the
newly submitted data with the data used at proposal in its evaluation of cyanide.
3.2.11 Site Visits
Since the May 2, 1995, proposal, EPA has performed site visits at five facilities and three
POTW's. The site visits were performed at four pharmaceutical manufacturers which discharge to
a POTW and one pharmaceutical manufacturer which discharges directly to a surface water body.
The respective POTW's were visited to collect information on the issues that affect indirect
dischargers. A summary of the sites visited and the types of information collected are shown
below:
Site Date of Visit Treatment Operations Plant Operations Issues
Information Collected
WW Mfg. Research/Pilot- RegulatoryIndirects-
Abbott Laboratories 4/12/96 - 4/14/96 X X X X
North Shore Sanitary District 4/12/96 - 4/14/96 X X
Pfizer, Inc. 8/20/96 - 8/21/96 X X X
Ganes Chemicals 11/19/96 + 11/22/96 X X X
Bergen County Utilities 11/19/96 + 11/22/96 X XAuthority
ISP Van Dyk 11/20/96 - 11/21/96 X X X
Penick Corp. 11/20/96 - 11/21/96 X X X
Passaic Valley Sewerage 11/20/96 - 11/21/96 X XCommissioners
On May 24, 1996, an engineering site visit was conducted at the Barceloneta Regional
Wastewater Treatment Plant (BRWTP) located in Barceloneta, Puerto Rico in preparation for
sampling at this plant. A sampling episode was performed at the BRWTP from August 10
through August 16, 1996. The purpose of the sampling trip was to characterize the mass balance
of specific organics around the primary treatment units and to characterize the treatment of COD
and ammonia across the entire treatment plant.
A portion of the sampling episode, conducted jointly with representatives of PhRMA, also
focused on determining the aerobic and anoxic biodegradation rates for the seven pollutants of
concern in the primary treatment units. The quantity of mass reduction attributed to biodegration
can be determined from the aerobic and anoxic biodegradation rates. The aerobic and anoxic
rates were determined through lab studies conducted on samples taken during the sampling
episode. The biodegradation rates were determined for each of the seven pollutants of concern
across the grit chamber and the primary clarifier. A sampling episode by PhRMA was conducted
in April 1997 to supplement the August 1996 anoxic biodegradation data. An additional sampling
episode by PhRMA was conducted in August 1997 to enhance the mass balance data for alcohol
losses through the primary clarifier.
3.2.13 Industry Data in Response to Notice of Availability
Lastly, since the August 8, 1997 Notice of Availability (NOA), EPA has received additional data
from six facilities regarding nitrification/denitrification. Additional data were submitted with
comments on the NOA. These data included a pilot-plant study on nitrification, data on two-
stage nitrification from two facilities, and data on single-stage nitrification from two facilities.
EPA also received operating data from one facility on a nitrification feasibility study. Data from
influent and effluent sampling points as well as design data and operating specifications were
provided.
3-23
EPA has also received data from three facilities regarding conventional pollutant treatment.
Additional data were submitted in addition to comments on the NOA. The data from these
facilities are supplemental to data previously provided. Data from influent and effluent sampling
points were provided.
3.3 Overview of the Industry
This provides an overview of the pharmaceutical manufacturing industry by presenting general
information on the geographical locations of facilities, Standard Industrial Classification (SIC)
code distribution, value of shipments and number of employees in the industry, and age of
facilities.
3.3.1 Geographical Location of Manufacturing Facilities
According to the 1989 Pharmaceutical Screener Questionnaire and the 1990 Detailed
Questionnaire, there are 304 pharmaceutical facilities with solvent use which discharge
wastewater in 34 states and the Commonwealth of Puerto Rico. This number includes the 244
facilities which completed the Detailed Questionnaire and the 60 indirect dischargers with mixing,
compounding, or formulating operations which were not sent the Detailed Questionnaire. The
majority of pharmaceutical manufacturing facilities are located in the eastern half of the United
States, with the highest concentration of facilities in New Jersey, New York, Pennsylvania, and
Puerto Rico. A map of the United States with the number of pharmaceutical manufacturing
facilities in each state (or commonwealth) is presented in Figure 3-1. Table 3-2 presents the
number of pharmaceutical manufacturing facilities by state and EPA region, along with the
percentage of total facilities in each state and EPA region, and the total number of employees in
each EPA region.
3.3.2 SIC Code Distribution
Standard Industrial Classification (SIC) codes, established by the U.S. Department of Commerce,
are classifications of commercial and industrial establishments by the type of activity in which
3-24
Figure 3-1. Location of Operating Pharmaceutical Facilities by State (304 Facilities)
3-25
they engage. The primary purpose of SIC codes is to classify the manufacturing industries for the
collection of economic data. An operating establishment is assigned an industry code on the basis
of its primary activity, which is determined by its principal product or group of products. The
principal product of a manufacturing establishment is determined by the value of production.
Pharmaceutical manufacturing facilities generally cover SIC codes 2833, 2834, and/or 2836
(formerly 2831). Other products included under the definition of pharmaceutical manufacturing
facilities are discussed in 3.4.
3.3.3 Value of Shipments and Number of Employees in the Industry
The Department of Commerce provided information on the value of shipments and the number of
total employees in the pharmaceutical manufacturing industry by SIC code.(21) In 1991, the
value of product shipments for SIC codes 2833, 2834, and 2836 were $6.25 billion, $37.4 billion,
and $2.84 billion, respectively. In 1991, the total number of employees in the pharmaceutical
industry for SIC codes 2833, 2834, and 2836 were 12,500, 129,100, and 12,100, respectively.
3.3.4 Age of Facilities
Table 3-3 presents a distribution of pharmaceutical manufacturing facilities by decade when
operations began at the facility and when pharmaceutical manufacturing operations began at the
facility. The majority of facilities which currently manufacture pharmaceuticals began such
operations after 1960. The oldest reported pharmaceutical manufacturing operation began in
1879, while the most recent operation reported began in 1991.
3.4 Pharmaceutical Manufacturing Processes
The pharmaceutical manufacturing industry encompasses the manufacture, extraction, processing,
purification, and packaging of chemical materials to be used as medication for humans and
animals. For this rulemaking, EPA has defined the pharmaceutical manufacturing industry to
include the manufacture of any of the following products:
3-26
C Biological products covered by the U.S. Department of Commerce, Bureauof the Census Standard Industrial Classification (SIC) Code No. 2836, withthe exception of diagnostic substances. (Products covered by SIC CodeNo. 2836 were formerly covered under the 1977 SIC Code No. 2831.)
C Medicinal chemicals and botanical products covered by SIC Code No.2833.
C Pharmaceutical products covered by SIC Code No. 2834.
C All fermentation, biological and natural extraction, chemical synthesis andformulation products considered to be pharmaceutically active ingredientsby the Food and Drug Administration that are not covered by SIC CodeNos. 2833, 2834, or 2836.
C Multiple end-use products derived from pharmaceutical manufacturingoperations (e.g., components of formulations, intermediates, or finalproducts, provided that the primary use of the product is intended forpharmaceutical purposes).
C Products not covered by SIC Code Nos. 2833, 2834, and 2836 or othercategorical limitations and standards if they are manufactured by apharmaceutical manufacturer by processes that generate wastewaters thatin turn closely correspond to those of pharmaceutical products. (Anexample of such a product is citric acid.)
C Cosmetic preparations covered by SIC Code No. 2844 that containpharmaceutically active ingredients or ingredients intended for treatment ofsome skin condition. (This group of preparations does not includeproducts such as lipsticks or perfumes that serve to enhance appearance orto provide a pleasing odor, but do not provide skin care. In general, thisalso excludes deodorants, manicure preparations, shaving preparations andnon-medicated shampoos that do not function primarily as a skintreatment.)
Products or activities specifically excluded from the pharmaceutical manufacturing category are:
C Surgical and medical instruments and apparatus reported under SIC CodeNo. 3841.
C Orthopedic, prosthetic, and surgical appliances and supplies reported underSIC Code No. 3842.
C Dental equipment and supplies reported under SIC Code No. 3843.
3-27
C Medical laboratories services reported under SIC Code No. 8071.
C Dental laboratories services reported under SIC Code No. 8072.
C Outpatient care facility services reported under SIC Code No. 8081.
C Health and allied services reported under SIC Code No. 8091, and notclassified elsewhere.
C Diagnostic devices other than those reported under SIC Code No. 3841.
C Animal feeds that include pharmaceutical active ingredients such asvitamins and antibiotics, where the major portion of the product is non-pharmaceutical, and the resulting process wastewater is not characteristicof process wastewater from the manufacture of pharmaceutical products.
C Foods and beverage products fortified with vitamins or otherpharmaceutical active ingredients, where the major portion of the productis non-pharmaceutical, and the resulting process wastewater is notcharacteristic of process wastewater from the manufacture ofpharmaceutical products.
C Pharmaceutical products and intermediates subject to the provisions of 40CFR part 414, provided their manufacture results in less than 50 percent ofthe total flow of process wastewater that is regulated by 40 CFR part 414at the facility.
3.4.1 Types of Pharmaceutical Processes and Products
There are four general types of manufacturing processes used by pharmaceutical manufacturing
facilities. The four process types are: fermentation, biological and natural extraction, chemical
synthesis, and mixing, compounding, or formulating. Figure 3-2 presents a bar graph of the
number of facilities which use each type of manufacturing process. Table 3-4 presents examples
of typical products from each type of manufacturing process.
3-28
Figure 3-2. Number of Facilities in Each Combination of Pharmaceutical Manufacturing Process Types
3-29
3.4.2 General Process Descriptions
General process descriptions for each type of process operation are described in the following
subsections. The specific processing steps on individual process lines may differ from these
general descriptions as process operations will be tailored to the specific product being produced.
3.4.2.1 Fermentation
Most antibiotics and steroids are produced by the fermentation process, which involves three
basic steps: inoculum and seed preparation, fermentation, and product recovery. Production of a
fermentation pharmaceutical begins in the seed preparation step with spores from the plant master
stock. The spores are activated with water, nutrients, and warmth; they are then propagated
through the use of agar plates, test tubes, and flasks until enough mass is produced for transfer to
the seed tank. In some fermentations, a single seed tank may provide inoculum for several
fermentations. In this type of operation, the seed tank is never emptied completely, so the
remaining seed serves as the inoculum for the next batch. The seed tank is emptied, sterilized,
and reinoculated only when contamination occurs.
Fermentation is conventionally a large-scale batch process. The fermentation step begins with a
water wash and steam sterilization of the fermenter vessel. Sterilized nutrient raw materials in
water are then charged to the fermenter. Microorganisms grown from seed to aid in the
fermentation process are transferred to the fermenter from the seed tank and fermentation begins.
During fermentation, air is sparged into the batch and temperature is carefully controlled. After a
period that may last from 12 hours to one week, the fermenter batch whole broth is ready for
filtration. Filtration removes mycelia (i.e., remains of the microorganisms), leaving the filtered
aqueous broth containing product and residual nutrients that are ready to enter the product
recovery phase.
There are three common methods of product recovery: solvent extraction, direct precipitation,
and ion exchange or adsorption. Solvent extraction is a recovery process in which an organic
solvent is used to remove the pharmaceutical product from the aqueous broth and form a more
3-30
concentrated solution. With subsequent extractions, the product is separated from any
contaminants. Further removal of the product from the solvent can be done by either
precipitation, solvent evaporation, or further extraction processes. Normally, solvents used for
product recovery are recovered and reused. However, small portions left in the aqueous phase
during the solvent "cut" can appear in the plant's wastewater stream. Based on information from
the Detailed Questionnaire, the solvents most often used in fermentation operations are acetone,
methanol, isopropanol, ethanol, amyl alcohol, and MIBK. Table 3-5 lists solvents used in
fermentation operations.
Direct precipitation using heavy metal precipitating agents is another common method of product
recovery. The method involves first precipitating the product as a metal salt from the aqueous
broth, then filtering the broth, and finally extracting the product from the solid residues. Copper
and zinc are priority pollutant metals known to be used in the precipitation process.(2)
Ion exchange or adsorption involves removal of the product from the broth, using solid materials
such as ion exchange resin, adsorptive resin, or activated carbon. The product is recovered from
the solid phase using a solvent, then recovered from the solvent by evaporation.
Occasionally, a fermentation batch becomes infested with a phage, a virus that attacks
microorganisms necessary to the fermentation process. Phage infection is rare in a well-operated
plant, but when it occurs, the plant may discharge very large amounts of wastewater in a short
period of time because of the decontamination process. Typically, the infested batch is discharged
early, and its nutrient pollutant concentration is higher than that of spent broth.
Steam is the major sterilizing medium for most equipment. However, detergents and
disinfectants, to the extent that they are used, can contribute to waste loads. An example of a
commonly used chemical disinfectant is phenol, a priority pollutant. Air pollution control
equipment sometimes installed to clean fermentation waste off-gas is another wastewater source.
The air and gas vented from the fermenters usually contain odoriferous substances (e.g., oxides of
nitrogen and sulfur) and large quantities of carbon dioxide. Treatment is often necessary to
deodorize the gas before release to the atmosphere. Some plants use incineration methods; others
3-31
use liquid scrubbers. The blowdown from scrubbers may contain absorbed chemicals, soluble
organic compounds, and insoluble organic oils and waxes.
Spent fermentation broth contributes pollutants to wastewater from the food materials contained
in the broth, such as sugars, starches, protein, nitrogen, phosphate, and other nutrients.
Fermentation wastes are very amenable to biological treatment. The spent broth can be
satisfactorily handled by biological treatment systems in a concentrated form. Equalizing the
broth prior to treatment helps avoid system upsets that may occur if the biota receive too high
feed concentrations at one time.
Data from the Detailed Questionnaire generally show that process wastewater from fermentation
plants is characterized by high BOD , COD, and TSS concentrations; relatively large flows; and a5
pH range of approximately 4.0 to 8.0.
3.4.2.2 Biological and Natural Extraction
Many materials used as pharmaceuticals are derived from such natural sources as the roots and
leaves of plants, animal glands, and parasitic fungi. These products have numerous and diverse
pharmaceutical applications, ranging from tranquilizers and allergy-relief medications to insulin
and morphine. Also included in this group is blood fractionation, which involves the production
of plasma and its derivatives.
Despite their diversity, all extractive pharmaceuticals have a common characteristic: they are too
complex to synthesize commercially. They are either very large molecules, and/or their synthesis
results in the production of several stereoisomers, only one of which has pharmacological value.
Extraction is an expensive manufacturing process which requires collecting and processing large
volumes of specialized plant or animal matter to produce small quantities of products. Facilities
utilize extraction when there are no other reasonable alternatives for producing a desired active
ingredient.
3-32
The extraction process consists of a series of operating steps beginning with the processing of a
large quantity of natural or biological material containing the desired active ingredient. After
almost every step, the volume of material being handled is reduced significantly. In some
processes, reductions may be in orders of magnitude, and complex final purification operations
may be conducted on quantities of materials only a few thousandths of the volume handled in
earlier steps. Neither continuous processing methods nor conventional batch methods are suitable
for extraction processing. Therefore, a unique assembly-line, small-scale batch processing method
is used. Material is transported in portable containers through the plant in 75- to 100-gallon
batches. A continuous line of containers is sent past a series of operating stations. At each
station, operators perform specific tasks on each batch in turn. As the volume of material being
handled decreases, individual batches are continually combined to maintain reasonable operating
volumes, and the line moves more slowly. When the volume is reduced to a very small quantity,
the containers also become smaller, with laboratory-size equipment used in many cases. An
extraction plant may produce one product for a few weeks; then, by changing the logistical
movement of containers and redefining tasks to be conducted at each station, the plant can
convert to the manufacture of a different product.
Residual wastes from an extraction plant essentially will be equal to the weight of raw material,
since the active ingredients extracted are generally present in the raw materials at very low levels.
Solid wastes are the greatest source of the pollutant load; however, solvents used in the
processing steps can cause both air and water pollution. Detergents and disinfectants used in
equipment cleaning operations are normally found in the wastewater.
Priority pollutants, including methylene chloride, toluene, chloroform, 1,2-dichloroethane, and
phenol, were identified as being used in the manufacturing of extractive pharmaceuticals in the
Detailed Questionnaire. The cations of lead and zinc are known to be used as precipitating
agents. Phenol was identified as a disinfecting chemical. The other priority pollutants found were
used as processing solvents. The Detailed Questionnaire identified nonconventional pollutants
most often used in the extractive manufacturing process as ethanol, methanol, n-amyl acetate,
isopropanol, and acetone. These nonconventional pollutants may be used as processing solvents.
Table 3-6 lists solvents used in biological or natural extraction operations.
3-33
Solvents are used in two ways in extraction operations. Some solvents are used to remove fats
and oils that would contaminate the products. These "defatting" extractions use an organic liquid
that dissolves the fat but not the product material. Solvents are also used to extract the product
itself. For example, when plant alkaloids are treated with a base, they become soluble in such
selected organic solvents as benzene, chloroform, and 1,2-dichloroethane.
Ammonia is used in many extraction operations because it is necessary to control the pH of water
solutions from both animal and plant sources to separate valuable components from waste
materials. Ammonium salts are used as buffering chemicals, and aqueous or anhydrous ammonia
is used as an alkalinizing reagent. The high degree of water solubility of ammonium salts prevents
unwanted precipitation of salt, and they do not react chemically with animal or plant tissue. Such
basic materials as hydroxides and carbonates of alkali metals do not have these advantages.
The principal sources of wastewater from biological/natural extraction operations are: 1) spent
raw materials (e.g., waste plasma fractions, spent media broth, plant residues); 2) floor and
equipment wash water; 3) chemical wastes (e.g., spent solvents); and 4) cleanup of spills.
Wastewater from extraction plants is generally characterized by low BOD , COD, and TSS5
concentrations; small flows; and pH values of approximately 6.0 to 8.0.
3.4.2.3 Chemical Synthesis
Most of the active ingredients marketed and sold as drugs are manufactured by chemical
synthesis. Chemical synthesis is the process of manufacturing pharmaceuticals using organic and
inorganic chemical reactions. Since most of these compounds are produced in batch operations,
the conventional batch reaction vessel is the major piece of equipment used on the process line.
The reaction vessel is one of the most standardized equipment designs in the industry. Generally,
it is made of either stainless steel or glass-lined carbon-steel, and it contains a carbon-steel outer
shell suitable for either cooling water or steam. Inside the vessel is a motor-driven agitator and a
3-34
baffle. Vessels of this type are made in many different sizes, with capacities ranging from 0.02 to
11.0 m or more.3
The basic vessels may be fitted with different attachments depending on the process needs of the
product to be manufactured. Baffles usually contain sensors to measure the temperature of the
reactor contents. Dip tubes may be used to introduce reagents into the vessels below the liquid
surface. The vessel's agitators may be powered by two-speed motors or by variable-speed motor
drives. The reactor may be mounted on load cells to accurately weigh the reactor contents. The
batch reactors are typically installed with only the top heads extending above the plant operating
floor to provide the operator with easy access for loading and cleaning. Also, one of the top
nozzles may be fitted with a floodlight and another with a glass cover to enable an operator to
observe the reactor contents.
The reactors can be modified for additional uses. By using heating or refrigeration devices, the
chemicals may be boiled or chilled in them, according to process needs. By adding reflux
condensation equipment, the vessel may perform complete reflux operations (i.e., recycling of
condensed vapors). The vessels can also become evaporators if vacuum is applied. The reactors
may also be used to perform solvent extraction operations and, by operating the agitator at a slow
speed, the vessels can serve as crystallizers.
Synthetic pharmaceutical manufacture consists of using one or more of these reactor vessels to
perform, in a step-by-step fashion, the various operations necessary to make the product.
Following a definite recipe, the operator (or, increasingly, a programmed computer) adds
reagents; increases or decreases the flow rate of cooling water, chilled water, or steam; and starts
and stops pumps which transfer the reactor contents to another vessel. At appropriate steps in the
process, solutions are pumped either through filters or centrifuges, or into solvent recovery
headers or waste sewers.
The reactor vessels with an assembly of auxiliary equipment are usually arranged into independent
process units, which are suitable for the complete or partial manufacture of many different
pharmaceutical compounds. Only with the highest volume products is the process unit
3-35
"dedicated" to manufacturing only one product. Large pharmaceutical plants may have many
such units, while smaller plants may have only one or two.
Each pharmaceutical product is usually manufactured in a "campaign," in which one or more
process units are used for a few weeks or months to manufacture enough compound to satisfy the
projected sales demand. Campaigns are usually tightly scheduled, with detailed coordination
extending from procurement of raw materials to packaging and labeling of the product. For a
variable period of time, a process unit actively manufactures a specific compound. At the end of
the campaign for one product, another is scheduled to follow. After equipment cleaning, the same
equipment is then used to make a completely different product, using different raw materials,
executing a different recipe, and creating different wastes.
A variety of priority pollutants are used as reaction and purification solvents during chemical
synthesis. According to the Detailed Questionnaire, priority pollutants used by facilities during
the chemical synthesis process include benzene, chlorobenzene, chloroform, chloromethane, o-
dichlorobenzene, 1,2-dichloroethane, methylene chloride, phenol, toluene, and cyanide.
The Detailed Questionnaire identified the top five nonconventional pollutants associated with
chemical synthesis as methanol, acetone, isopropanol, ethyl acetate, and ethanol. Six-member
ring compounds, such as xylene, pyridine, and toluene, are also widely used organic solvents
because they are stable compounds that do not easily take part in chemical reactions. These
compounds are used either in the manufacture of synthesized pharmaceuticals or are produced as
the result of unwanted side reactions. Table 3-7 lists solvents used in chemical synthesis
operations.
Solvents are used in chemical synthesis processes to dissolve gaseous, solid, or viscous reactants
in order to bring all the reactants into close molecular proximity. Solvents also serve to transmit
heat to or from the reacting molecules. By physically separating molecules from each other,
solvents slow down some reactions that would otherwise take place too rapidly, resulting in
unwanted side reactions and excessive temperature increases.
3-36
Some solvents are also used to control the reaction temperature. It is common practice in a
batch-type synthesis to select a solvent which is compatible with the reaction and which has a
boiling point the same as the desired reaction temperature. Heat is then applied to the reaction
mass at a rate sufficient to keep the mixture boiling continuously. Vapors that rise from the
reaction vessel are condensed, and the liquefied solvent is allowed to drain back into the reaction
vessel. This refluxing prevents both overheating and overcooling of the reactor contents, and can
automatically compensate for variations in the rate of release or absorption of chemical energy.
Many plants operate solvent recovery units that purify contaminated solvents for reuse. These
units usually contain distillation columns, and may also include solvent/solvent extraction
operations in which a second solvent is used to separate impurities. These operations may result
in aqueous wastes that contain residues fully or partially saturated with residual solvent.
Wastewater is generally produced with each chemical modification that requires filling and
emptying the batch reactors. This wastewater can contain unreacted raw materials, as well as
some solvents, along with a large number of compounds that differ due to the varied chemical
reactions performed (e.g., nitration, amination, halogenation, sulfonation, alkylation). Chemical
synthesis effluent generally has a high BOD and COD waste load. The pollutants in chemical5
synthesis wastewater vary with respect to toxicity and biodegradability. The production steps
may generate acids, bases, cyanides, metals, and other pollutants, while the waste process
solutions and vessel wash water may contain residual organic solvents. Occasionally, chemical
synthesis wastewater is incompatible with biological treatment systems because it is too
concentrated or too toxic for the biomass in the treatment system. Thus, it may be necessary to
equalize and/or chemically pretreat some chemical synthesis wastewater prior to biological
treatment.
Primary sources of wastewater from chemical synthesis operations are: 1) process wastes such as
spent solvents, filtrates, and concentrates; 2) floor and equipment wash water; 3) pump seal
water; 4) wet scrubber wastewater; and 5) spills. Wastewater from chemical synthesis plants can
be characterized as having high BOD , COD, and TSS concentrations; large flows; and extremely5
variable pH values, ranging from 1.0 to 11.0.
3-37
3.4.2.4 Mixing, Compounding, or Formulating
Pharmaceutically active ingredients are generally produced by batch processes in bulk form and
must be converted to dosage form for consumer use. Common dosage forms for the consumer
market are tablets, capsules, liquids, and ointments. In addition, active ingredients can also be
incorporated into patches and time release capsules.
Tablets are formed in a tablet press machine by blending the active ingredient, filler, and binder.
The filler (e.g., starch, sugar) is required to dilute the active medicinal ingredient to the proper
concentration, and a binder (e.g., corn syrup or starch) is necessary to bind the tablet particles
together. A lubricant (e.g., magnesium stearate) may be added for proper tablet machine
operation. The dust generated during the mixing and tableting operation is collected and usually
recycled directly to the same batch, while broken tablets generally are collected and recycled to
the granulation operation in a subsequent lot. Some tablets are coated by tumbling with a coating
material and then dried. After the tablets have been coated and dried, they are sent to the
packaging unit where they are bottled. Tablet-coating operations can be a significant source of air
emissions of solvents if solvent-based coatings are used, and can contribute solvents to the plant
wastewater if certain types of air pollution control equipment (wet scrubbers or activated carbon)
are used to capture solvent vapors from tablet-coating operations. Wastewater from the wet
scrubber is likely to be sewered as is the condensate from the steam used to regenerate the
activated carbon.
The first step in capsule production is to form a hard gelatine shell. The shells are produced by
machines that dip rows of rounded metal dowels into a molten gelatine solution, and then strip the
capsules from the dowels after the capsules have cooled and solidified. Imperfect capsules are
remelted and reused, if possible, or sold for glue manufacture. Most pharmaceutical companies
purchase empty capsules from a few specialty producers. The active ingredient and filler are
mixed before being poured by machine into the empty gelatine capsules. The filled capsules are
bottled and packaged. As in tablet production, some dust is generated, which is recycled to the
production line. Liquid preparations are formulated for injection or oral use. In both cases, the
liquid active ingredient is first weighed and then dissolved in water. Injectable solutions are
3-38
bulk-sterilized by heat or filtration and then poured into sterilized bottles. Oral liquid preparations
can be bottled directly without the sterilization steps. Wastewater is generated by general cleanup
operations, spills, and breakage.
Ointments are produced by blending an active ingredient(s) with an ointment base such as
polyethylene glycol. The blended product is then poured into tubes by machine and packaged.
Wastewater generated from these operations are all from equipment cleaning operations.
The primary objective of mixing, compounding, or formulating operations is to convert the
manufactured products into a final, usable form. The necessary production steps typically have
small wastewater flows because very few of the unit operations generate wastewater. The
primary use of water is in the actual formulating process, where it is used for cooling and for
equipment and floor washing.
Wastewater sources from mixing, compounding, or formulating operations are: 1) floor and
equipment wash water, 2) wet scrubbers, and 3) spills. The use of water to clean out mixing
tanks can periodically flush dilute wastewaters of unusual composition into the plant sewer
system. The washouts from mixing tanks may be used to prepare the master batches of the
pharmaceutical compounds and may contain inorganic salts, sugars, and syrup. Other sources of
contaminated wastewater are dust and fumes from scrubbers, either in building ventilation systems
or on specific equipment. In general, this wastewater is readily treatable by biological treatment
systems.
An analysis of the pollutant information in the pharmaceutical manufacturing database shows that
wastewater from mixing, compounding, or formulating plants normally has low BOD , COD, and5
TSS concentrations; relatively small flows; and pH values of 6.0 to 8.0.
3.4.3 Pharmaceutical Manufacturing Process Variability
The wastewater effluent flow and composition from a typical pharmaceutical manufacturing
facility can be highly variable. Factors contributing to such variability are:
3-39
C Campaigning;C Batch processing; andC Wastewater commingling.
Because many pharmaceutical products are manufactured in campaigns, most wastewater is
generated during product changeover. The process equipment must be cleaned out to avoid
product contamination. The composition of the wastewater will vary according to the products
that were manufactured on that process line.
Pharmaceuticals are manufactured by batch and continuous manufacturing operations. Batch-type
production is by far the most common manufacturing technique, as presented in the production
operation breakdown in Table 3-8. Many pharmaceutical facilities conduct multiple batch
operations, some in series and some concurrently. Often several of the required batch processes
are performed at the same time in separate reactors, each with its own schedule. Each batch may
have unique waste stream characteristics. In fermentation operations, it can take a few days to
several weeks to complete the ferment, during which little or no wastewater is generated.
However, during product recovery operations, high-volume, high-strength wastewaters are
generated.
It is also common practice in the pharmaceutical manufacturing industry to commingle organic-
contaminated wastewaters. In many cases commingling is necessary to collect sufficient
wastewater volume to properly operate an economically sized treatment unit such as a steam
stripper. Commingled wastes may be added to the treatment unit feed tank on a variable
schedule, thus altering the feed composition on a real-time basis. In other cases, segregating for
purposes of recovery and treatment may be appropriate and cost effective.
A variety of solvents are used in the pharmaceutical manufacturing industry and end up in the
industry's wastewater. Many solvents are process-specific and cannot be interchanged in other
pharmaceutical processes. In addition, solvents must be approved by the FDA for each process.
FDA regulations require that before a change can be made to an approved process, industry must
meet the requirements of product purity and product efficacy as specified in the FDA approval.
3-40
Consequently, simplification of wastestream composition by chemical substitution to a common
solvent may not be possible or desirable. Nonetheless, EPA has worked with the Food and Drug
Administration (FDA) to encourage pollution prevention in the final guidelines and standards.
See 7.2.1.2 for a more detailed discussion of EPA and FDA efforts towards pollution prevention
in the pharmaceutical industry.
3.5 Trends in the Industry
The "Preliminary Data Summary for the Pharmaceutical Point Source Category" (22) gives a
snapshot of the pharmaceutical manufacturing industry in the late 1970s and the early 1980s. By
comparing these pre-1986 sources to the data available in the 1989 Pharmaceutical Screener
Questionnaire and the 1990 Detailed Questionnaire, trends in the manufacturing process types
used by pharmaceutical manufacturing facilities, the treatment technologies used at
pharmaceutical manufacturing facilities, and the chemicals used in their manufacturing processes
were observed. These trends are described in the following subsections.
3.5.1 Manufacturing Process Types
Since 1986, the number of pharmaceutical manufacturing facilities engaging in fermentation has
increased, while those engaging in biological or natural extraction has decreased. These trends
are shown in the following table.
Type of Facility Process Prior to 1986 Process in 1989/1990Percentage of Facilities Using Percentage of Facilities Using
Fermentation 7.8 14.5
Biological or Natural Extraction 17.0 14.5
Chemical Synthesis 29.3 30.3
Mixing, Compounding, or 80.0 80.0Formulating
The total of the percentages is not 100 because any one facility may manufacture multiple process types.
3-41
3.5.2 Treatment Technologies in Use
Table 3-9 presents the trends in wastewater treatment technologies used by pharmaceutical
manufacturing facilities. Since 1986, the use of neutralization, equalization, activated sludge,
Notes: PC = packed column; FT = flash tank; DP = distillation pot.Subcategory refers to the type of manufacturing operations performed at the facility.
Subcategory A = Fermentation Subcategory D = FormulationSubcategory B = Extraction Subcategory E = Research and DevelopmentSubcategory C = Chemical Synthesis
3-43
Table 3-2
Pharmaceutical IndustryGeographic Distribution(a)
Location Plants Total Plants RegionNumber of Percentage of of Employees in
Total Number
Eastern United States
EPA Region I:
Connecticut 7 2.3
Maine 0 0.0
Massachusetts 9 3.0
New Hampshire 0 0.0
Rhode Island 1 0.3
Vermont 0 0.0
EPA Region I Totals 17 5.6 7,025
EPA Region II
New Jersey 46 15.1
New York 28 9.2
Puerto Rico 34 11.2
Virgin Islands 0 0.0
EPA Region II Totals 108 35.5 60,322
EPA Region III
Delaware 2 0.7
Maryland 3 1.0
Pennsylvania 17 5.6
Virginia 4 1.3
West Virginia 1 0.3
District of Columbia 0 0.0
EPA Region III Totals 27 8.9 14,558
Table 3-2 (Continued)
Location Plants Total Plants RegionNumber of Percentage of of Employees in
Total Number
3-44
EPA Region IV
Alabama 0 0.0
Georgia 5 1.6
Florida 2 0.7
Mississippi 2 0.7
North Carolina 11 3.6
South Carolina 4 1.3
Tennessee 7 2.3
Kentucky 0 0.0
EPA Region IV Totals 31 10.2 12,927
EPA Region V
Illinois 14 4.6
Indiana 12 4.0
Ohio 11 3.6
Michigan 9 3.0
Wisconsin 2 0.7
Minnesota 4 1.3
EPA Region V Totals 52 17.1 37,235
Eastern U.S. Total 235 77.3 132,067(EPA Regions I-V)
Table 3-2 (Continued)
3-45
Location Plants Total Plants RegionNumber of Percentage of of Employees in
Total Number
Western United States
EPA Region VI
Arkansas 0 0.0
Louisiana 3 1.0
Oklahoma 0 0.0
Texas 5 1.6
New Mexico 0 0.0
EPA Region VI Totals 8 2.6 2,121
EPA Region VII
Iowa 4 1.3
Kansas 5 1.6
Missouri 17 5.6
Nebraska 3 1.0
EPA Region VII Totals 29 9.5 6,764
EPA Region VIII
Colorado 4 1.3
Utah 1 0.3
Wyoming 1 0.3
Montana 0 0.0
North Dakota 0 0.0
South Dakota 0 0.0
EPA Region VIII Totals 6 2.0 1,252
Table 3-2 (Continued)
Location Plants Total Plants RegionNumber of Percentage of of Employees in
Total Number
3-46
EPA Region IX
Arizona 1 0.3
California 22 7.2
Nevada 0 0.0
Hawaii 0 0.0
EPA Region IX Totals 23 7.6 9,520
EPA Region X
Alaska 0 0.0
Idaho 0 0.0
Oregon 0 0.0
Washington 3 1.0
EPA Region X Totals 3 1.0 534
Western U.S. Total 69 22.7 20,191(EPA Regions VI-X)
U.S. Totals 304 100 152,258
(a) Employment obtained from the 1989 Screener Questionnaire. Facility locations obtained from the Detailed Questionnaire and the 1989 Screener Questionnaire.
3-47
Table 3-3
Distribution of Pharmaceutical Manufacturing Facilitiesby Date of Initiation of Operations(a)
Decade Operations Began Operations Began
Number of Facilities Reporting
Facility Pharmaceutical Manufacturing
Prior to 1930s 19 10
1930s 6 5
1940s 14 14
1950s 17 18
1960s 26 27
1970s 47 46
1980s 50 57
1990s 4 5
No Response 61 62
Total 244 244
(a)Data obtained from 244 facilities responding to the Detailed Questionnaire.
3-48
Table 3-4
Example Pharmaceutical Products byManufacturing Process and Classification
Fermentation Products Extraction Products Chemical Synthesis Products Formulating ProductsMixing/Compounding/
Antibiotics Antineoplastic Agents Antibiotics Cold FormulasAmphotericin Vinblastine Aztreonam Benedryl elixirChlortetracycline Vincristine Clindamycin Dermatological AgentsLincomycin Enzymes and Digestive Aids Antihistamines CalamineNystatin Pancreatin USP Mecfizune dihydrochloride Salicylic acidPenicillin G Papain Cardiovascular Agents PowdersPenicillin V Central Depressants Methyldopa Desenex PowderStreptomycin Codeine Central Stimulants MouthwashVancomycin Morphine Sulphate Amitriptyline Listerine
Antineoplastic Agents Noscapine Caffeine Tablets and CapsulesDextran Thebaine Central Depressants Contact
Type of Operation OperationTotalFermentation Extraction Synthesis Formulating
Number of Operations
Percent ofMixing/TotalBiological Chemical Compounding/
Manufacturing Processes
Batch 309 189 1,059 3,675 5,232 99
Continuous 16 1 16 8 41 1
Total Number of Operations 325 190 1,075 3,683 5,273 100
Percent of Total Operations 6 4 20 70 100
Percent of Subcategory Operations which are 95 99 99 100 99Batch
(a) Production data obtained from 244 facilities responding to the Detailed Questionnaire.
3-53
Table 3-9
Trends in Treatment Technologies Usedat Pharmaceutical Manufacturing Facilities(a)
Treatment Technology Technology Prior to 1986 Technology in 1989/1990
Percentage of Facilities Using Percentage of Facilities UsingThis Type of Treatment This Type of Treatment
Neutralization 26.0 44.3
Equalization 20.1 28.6
Activated sludge 16.9 20.5
Settleable solids removal 13.3 NA
Primary sedimentation 12.0 NA
Aerated lagoon 7.5 4.9
Primary clarification 3.9 9.8
Chlorination 3.6 2.5
Polishing ponds 3.2 NA
Waste stabilization pond 2.9 2.5
Trickling filter 2.9 2.0
Multimedia filtration 2.3 6.1
Steam stripping 1.9 5.7
Evaporation 1.9 NA
Secondary clarification 1.6 20.9
Granular activated carbon 1.3 3.3
Oxidation 1.0 2.0
Dissolved air flotation 1.0 NA
pH adjustment NA 50.0
Phase separation NA 12.3
The total of the percentages is not 100 because any one facility may have multiple treatment technologies and somefacilities do not have treatment in place.
NA - Not available.
(a) Data obtained from reference 22 and the responses to the Detailed Questionnaire.
3-54
Table 3-10
Trends in Average Annual Discharges ofCompounds Between the Years 1987 and 1994
1. U.S. EPA, Office of Water Regulations and Standards. Report to Congress on theDischarge of Hazardous Waste to Publicly Owned Treatment Works. U.S.Environmental Protection Agency, Washington, D.C., February 1986.
2. PEDCo Environmental. The Presence of Priority Pollutant Materials in theFermentation Manufacture of Pharmaceuticals. Submitted to the U.S.Environmental Protection Agency.
3. PEDCo Environmental. The Presence of Priority Pollutants in the ExtractiveManufacture of Pharmaceuticals. Submitted to the U.S. Environmental ProtectionAgency, October 1978.
4. PEDCo Environmental. The Presence of Priority Pollutants in the SyntheticManufacture of Pharmaceuticals. Submitted to the U.S. Environmental ProtectionAgency, March 1979.
5. U.S. EPA, Office of Air Quality Planning and Standards. Control of VolatileOrganic Emissions from Manufacture of Synthesized Pharmaceutical Products. 450/2-78-029, U.S. Environmental Protection Agency, Research Triangle Park,North Carolina, December 1978.
6. Letter from Thomas X. White, Pharmaceutical Manufacturers Association, toDavid Beck, U.S. EPA/OAQPS, August 18, 1986.
7. U.S. EPA. Industry Fate Study. 600/2-79-175, August 1979.
8. U.S. EPA, Office of Water. List Of Lists: A Catalog Of Analytes And Methods. 21W-4005, U.S. Environmental Protection Agency, Washington, D.C., August1991.
9. U.S. EPA, Office of Water Regulations and Standards. The 1986 IndustrialTechnology Division List Of Analytes. U.S. Environmental Protection Agency,Washington, D.C., February 25, 1986.
10. U.S. EPA, Office of Water Regulations and Standards. The 1990 IndustrialTechnology Division List Of Analytes. U.S. Environmental Protection Agency,Washington, D.C., May 2, 1990.
11. Derenzo, D.J. Pharmaceutical Manufacturers of the United States. Noyes DataCorporation, 1987.
13. Windholz, M., ed. The Merck Index, Tenth Edition. Merck and Co., Inc.,Rahway, NJ, 1983.
REFERENCES
3-56
14. Dialog Information Services, Inc. Electronic Yellow Pages ManufacturersDirectory. 1985.
15. Dun and Bradstreet International. The World Marketing Directory. New York,NY, 1989.
16. American Medical Association. Drug Evaluation, Sixth Edition. 1986.
17. 55 FR 21236, May 23, 1990.
18. Memorandum: Indirect D/D/E Questionnaire Sampling, from G. Zipf to Dr. H.Kahn, June 10, 1991.
19. U.S. EPA, Office of Water Regulations and Standards. Supporting Statement forOMB Review: Detailed Questionnaire for the Pharmaceutical ManufacturingIndustry. U.S. Environmental Protection Agency, Washington, D.C., May 1990.
20. U.S. EPA, Office of Toxic Substances. Toxic Chemical Release InventoryReporting Package for 1990. U.S. Environmental Protection Agency,Washington, D.C., January 1991.
21. U.S. Department of Commerce. Annual Survey of Manufactures. Bureau of theCensus Industry Division, Washington, D.C., 1993.
22. U.S. EPA, Office of Water Regulations and Standards. Preliminary DataSummary for the Pharmaceutical Manufacturing Point Source Category. EPA440/1-89/084, U.S. Environmental Protection Agency, Washington, D.C.,September 1989.
4-1
SECTION 4
INDUSTRY SUBCATEGORIZATION
4.1 Introduction
The purpose of subcategorization is to group together facilities of similar characteristics so that
effluent limitations guidelines and standards representative of each group can be developed. This
provides each subcategory with a uniform set of effluent limitations guidelines which take into
account technological achievability and economic impacts unique to that subcategory.
For this final rulemaking, EPA considered the following factors in the subcategorization of the
pharmaceutical manufacturing industry:
C Manufacturing processes;C Wastewater characteristics and treatability;C Product types;C Raw materials;C Plant size;C Plant age;C Plant location;C Nonwater quality environmental impacts; andC Treatment costs and energy requirements.
After evaluating the above factors, the Agency determined that subcategorization of the
pharmaceutical manufacturing industry is necessary. The results of these evaluations are
presented in the following sections:
C 4.2 discusses the regulatory background of subcategorization in thepharmaceutical manufacturing industry;
C 4.3 presents the final subcategorization basis; and
C 4.4 presents conclusions.
4-2
4.2 Background
The original subcategorization scheme for the pharmaceutical manufacturing industry was
published in the November 17, 1976 Federal Register.(1) This subcategorization scheme was
based on the operations listed below:
C Subcategory A - Fermentation OperationsC Subcategory B - Biological and Natural Extraction OperationsC Subcategory C - Chemical Synthesis OperationsC Subcategory D - Mixing, Compounding, or Formulating OperationsC Subcategory E - Pharmaceutical Research Operations.
Subsequently, EPA published proposed effluent limitations guidelines and standards for the
pharmaceutical manufacturing industry in November 1982. As discussed in the preamble to the
1982 regulation, EPA proposed to combine Subcategories A through D above into a single
subcategory.(2) Along with comments on the November 1982 proposal, EPA received additional
influent and effluent conventional and nonconventional pollutant data. EPA statistically analyzed
both new and existing influent and effluent conventional and nonconventional pollutant data for all
direct dischargers to determine if the proposed change to create a single subcategory was
appropriate. A detailed discussion of the data sources and the statistical comparisons used is
presented in IV of the 1983 Final Development Document (3), and is summarized below.
The statistical comparisons of conventional pollutants and the nonconventional pollutant COD
indicated that the subcategorization scheme should separate fermentation and chemical synthesis
operations (Subcategory A and C) from extraction and mixing, compounding, or formulating
operations (Subcategory B and D). The analyses showed that the influent and effluent
conventional pollutant and COD concentrations, as well as discharge flows, of facilities with
Subcategory A and C operations are similar and that these same characteristics are similar
between facilities with Subcategory B and D operations. These characteristics are different,
however, between the Subcategory A and C facility group and the Subcategory B and D facility
group. These differences indicated that different effluent discharge levels of conventional
pollutants and COD would be expected when facilities in both groups used the same control
4-3
technology. However, because the existing separate subcategories accommodated these
differences and because permitting authorities and the regulated industry were familiar with that
scheme, EPA decided to maintain the existing subcategorization scheme at that time.
In the May 2, 1995 proposal, EPA proposed to continue to maintain the existing
subcategorization scheme. As part of this proposal, EPA also indicated that Subcategory E
(research) was limited to bench-scale research operations and was not intended to cover pilot-
plant development operations. The majority of commenters on the May 2, 1995 proposal
supported the continuation of the existing subcategorization scheme. Several industry
commenters, however, opposed limitations on the types of wastewaters included in the
Subcategory E group and argued that pilot-plant operations have been and should continue to be
included under the Subcategory E definition.
After considering the comments received concerning the regulation of wastewaters from pilot-
scale operations, EPA has decided not to change the existing description of the research
subcategory in the applicability section. EPA concluded that it did not have sufficient information
concerning Subcategory E generated wastewaters to change the existing description. If pilot-
scale manufacturing operations occur at stand-alone research facilities or during research
operations at manufacturing facilities, then BAT and BCT limits for these wastewaters can be
determined by permit writers on a best professional judgment (BPJ) basis. Similarly, such
wastewater generated at indirect discharging facilities may be addressed by the regulations found
at 40 CFR 403.5 and by local limits on a case-by-case basis.
EPA has reviewed the additional characterization data collected since the 1983 final rulemaking to
determine if the previous subcategorization scheme is still appropriate. The results of that review
are described in 4.3.
4-4
4.3 Final Subcategorization Basis
For this rulemaking, EPA is finalizing the following four subcategories:
1. Subcategory A - Fermentation Operations;2. Subcategory B - Biological and Natural Extraction Operations; 3. Subcategory C - Chemical Synthesis Operations; and4. Subcategory D - Mixing, Compounding, or Formulating Operations.
Where the subcategory operation definitions are as follows:
C Fermentation. A chemical change induced by a living organism or enzyme,specifically, bacteria, or the microorganisms occurring in unicellular plantssuch as yeast, molds, or fungi. Process operations that utilize fermentationto manufacture pharmaceutically active ingredients define Subcategory A.
C Biological and Natural Extraction. The chemical and physical extraction ofpharmaceutically active ingredients from natural sources such as plant rootsand leaves, animal glands, and parasitic fungi. The process operationsinvolving biological and natural extraction define Subcategory B.
C Chemical Synthesis. The process(es) of using a chemical reaction or aseries of chemical reactions to manufacture pharmaceutically activeingredients. The chemical synthesis process operations define SubcategoryC.
C Mixing, Compounding, or Formulating. Processes through whichpharmaceutically active ingredients are put in dosage forms. Processesinvolving mixing, compounding, or formulating define Subcategory D.
This subcategorization scheme is consistent with the conclusions drawn during the
subcategorization analysis for the 1983 final rulemaking and with characterization data collected
since 1983 and industry profile information gathered with the Detailed Questionnaire.
The following paragraphs discuss EPA's consideration of the nine factors listed in the beginning of
this in determining appropriate subcategories for the pharmaceutical manufacturing industry.
4-5
The primary bases for subcategorization of facilities in this industry were found to be
manufacturing processes and wastewater characteristics.
4.3.1 Manufacturing Processes
There are four basic manufacturing operations used in the pharmaceutical manufacturing industry:
1) fermentation, 2) biological or natural extraction, 3) chemical synthesis, and 4) mixing,
compounding, and formulating. The following paragraphs present a brief overview of each of the
manufacturing operations and the sources and characteristics of wastewater from each. A
detailed discussion of these manufacturing operations is provided in 3.4.
Fermentation is the usual method for producing antibiotics and steroids. The process involves
three basic steps: inoculum and seed preparation, fermentation, and product recovery. Most of
the wastewater is generated from the fermentation and product recovery steps. Fermentation is
typically a large-scale batch process. Product recovery is accomplished by solvent extraction,
direct precipitation, ion exchange, and/or adsorption. Based on responses to the Detailed
Questionnaire, the solvents most often used in fermentation operations are acetone, methanol,
isopropanol, ethanol, and amyl alcohol. Priority pollutants used in fermentation operations
include methylene chloride, toluene, and phenol. Copper and zinc are priority pollutant metals
known to be utilized where precipitation is used for product recovery. Due to the food materials
contained in spent fermentation broth, fermentation wastewaters are very amenable to biological
treatment. Data from responses to the Detailed Questionnaire show that wastewater from
fermentation plants is generally characterized by high BOD , COD, and TSS concentrations, large5
flows, and a pH range of approximately 4.0 to 8.0.
In biological and/or natural extraction manufacturing operations, pharmaceutical products are
extracted from such natural sources as plant material, animal glands, and parasitic fungi through a
series of volume reduction and chemical extraction steps. These operations are usually conducted
on a much smaller scale than fermentation or chemical synthesis operations. The principal sources
of wastewater from biological and natural extraction operations are spent raw materials (plant or
animal tissue residue), floor and equipment washes, and spent solvents. Solvents used in
4-6
purification and extraction steps include the priority pollutants methylene chloride, toluene,
chloroform, and 1,2 dichloroethane as well as the nonconventional pollutants ethanol, methanol,
n-amyl acetate, isopropanol, and acetone. The priority pollutant phenol is used as a disinfecting
chemical in this process. Ammonium salts are used for pH control during the extraction process.
Data from responses to the Detailed Questionnaire show that wastewater from extraction
operations is generally characterized by relatively low BOD , COD, and TSS concentrations, low5
flows, and pH values ranging from approximately 6.0 to 8.0.
Chemical synthesis is the process by which most drug compounds are manufactured. Chemical
synthesis is generally a batch process using a conventional batch reaction vessel and involves
techniques such as alkylations, carboxylation, esterifications, halogenations, and sulfonations.
During chemical synthesis, wastewater is generally produced with each chemical modification that
requires filling and emptying of the batch reactors. Primary sources of wastewater from chemical
synthesis operations are process wastes (spent solvents, filtrates, and concentrates), floor and
equipment washes, pump seal water, wet scrubber wastewater, and spills. A wide variety of
priority pollutant and nonconventional chemicals are used as reaction and purification solvents
during chemical synthesis. Priority pollutants used during chemical synthesis include several
chlorinated alkanes and chlorinated aromatic compounds. The major nonconventional pollutants
reported in the Detailed Questionnaire were methanol, acetone, isopropanol, ethyl acetate,
ethanol, and the six-member ring compounds xylene, pyridine, and toluene. Wastewater from
chemical synthesis operations is generally characterized by relatively high BOD , COD, and TSS5
concentrations, large flows, and a wide pH range.
Mixing, compounding, and formulating plants receive bulk pharmaceutical active ingredients as
raw materials and subsequently manufacture final dosage forms for consumer use (tablets, liquids,
capsules, ointments, etc.). Mixing, compounding, and formulating operations typically involve
few production steps which generate wastewater. The primary wastewater sources from these
operations are floor and equipment wash water, wet scrubbers, and spills. Wastewater from
mixing, compounding, and formulating operations normally has low BOD , COD, and TSS5
concentrations, relatively small flows, and pH values ranging from 6.0 to 8.0.
4-7
Pilot-plant operations conducted at pharmaceutical manufacturing facilities can include biological
studies, chemical research, and product development activities. Wastewaters from pilot-plant
operations conducted in conjunction with and related to existing pharmaceutical manufacturing
operations is covered by this final rule because these pilot plant operations would most likely
generate wastewater with characteristics similar to the commercial manufacturing operations.
Each type of manufacturing operation in the pharmaceutical manufacturing industry is distinct.
Fermentation and chemical synthesis manufacturing operations are typically large-scale batch
processes characterized by large flows and relatively high BOD , COD, and TSS concentrations. 5
Biological extraction and mixing, compounding, and formulating operations are characterized by
low wastewater flows and relatively low BOD , COD, and TSS concentrations.5
Because of these distinct manufacturing operations and the related wastewater characteristics, the
Agency considered manufacturing processes as a basis for subcategorization of this industry.
4.3.2 Wastewater Characteristics and Treatability
As discussed in 4.3.1, each type of manufacturing process in the pharmaceutical manufacturing
industry is distinct, and wastewaters are generated by differing unit operations and exhibit
somewhat different characteristics. This summarizes discharge flow and wastewater
characterization data submitted by the pharmaceutical manufacturing industry in the Detailed
Questionnaire.
Tables 4-1 through 4-4 present flow, raw wastewater, and treated effluent characterization data
from responses to the Detailed Questionnaire. The tables are arranged by subcategory (A, B, C,
and D) and distinguish direct versus indirect dischargers. Because many facilities have operations
from more than one subcategory, some data are presented for subcategory groups in the tables.
Facilities with any manufacturing operations from Subcategories A or C, even those with
manufacturing operations from Subcategory B and/or D, were included with the A, C, and A + C
only facilities because most of the flow and pollutant load at these facilities comes from
4-8
Subcategory A or C manufacturing operations. Additional discussion of wastewater
characterization data is presented in 5.0.
Table 4-1 presents discharge flow rate and BOD , COD, and TSS concentration averages and5
ranges in untreated wastewater. The table shows similar BOD , COD, and TSS average5
concentrations between facilities with Subcategory A and C operations and between facilities with
Subcategory B and D operations. The table also shows that facilities with manufacturing
operations from Subcategories A and/or C exhibit higher relative flows and BOD , COD, and5
TSS concentrations than those facilities with manufacturing operations from Subcategories B
and/or D.
Tables 4-2 and 4-3 present low, high, and average priority and nonconventional organic pollutant
concentration summary data for untreated wastewater. Organic pollutant data presented are the
sums of individual pollutants reported as being present in the Detailed Questionnaire. These data
do not indicate significant differences in pollutant concentrations for organics between
Subcategory A and/or C wastewaters and Subcategory B and/or D wastewaters.
Table 4-4 presents low, high, and average pollutant concentration data for BOD , COD, and TSS5
in treated effluent from direct dischargers. These data do not represent the performance of any
specific treatment technology, but are indicative of current overall treatment performance within
the industry. These data indicate that BOD , COD, and TSS are generally treated to lower levels5
at the Subcategory B and/or D facilities. 8 discusses in detail the performance of specific
wastewater treatment technologies in the pharmaceutical manufacturing industry. The data
presented in 8 for advanced biological treatment systems, an important treatment technology
commonly used in the pharmaceutical manufacturing industry, also indicate that Subcategory
B and/or D facilities treat BOD , COD, and TSS to lower levels than can be achieved at the5
facilities with Subcategory A and/or C manufacturing operations.
The treatment performance data presented in 8 do not demonstrate any differentiation in
treatment performance for priority and nonconventional organic pollutants among facilities with
operations in different subcategories.
4-9
In summary, the distinctly different manufacturing operations identified in 4.2 result in distinctly
different influent flow and pollutant concentrations between facilities with manufacturing
operations from Subcategories A and/or C and facilities with manufacturing operations from
Subcategories B and/or D. Facilities with manufacturing operations from Subcategories B and/or
D are able to achieve lower treated effluent concentrations of BOD , COD, and TSS than facilities5
with operations from Subcategories A and/or C, using the same treatment technology.
4.3.3 Product Types
Manufacturing processes under the SIC code system in the pharmaceutical manufacturing industry
are divided into the following:
C SIC 2833 Medicinal Chemicals and Botanical Products;C SIC 2834 Pharmaceutical Preparations; andC SIC 2836 Biological Products.
Medicinal chemicals and botanical products include three major product areas: fermentation
products, chemical synthesis products, and natural extraction products. Fermentation products
are primarily antibiotics and steroids. Chemical synthesis products include intermediates used to
produce other chemical compounds as well as hundreds of bulk chemical products. Natural
extraction products include such items as gland derivatives, animal bile salts and derivatives, and
herb and tissue derivatives. Pharmaceutical preparations (formulation products) are formulated
from bulk active ingredients prior to being marketed to the public. Biological products include
materials extracted from biological materials such as vaccines, serums and various plasma
derivatives.(4)
Because product types are a function of the manufacturing process used, the Agency concludes
that the nature of the product manufactured is incorporated into the basis for subcategorization.
4-10
4.3.4 Raw Materials
The pharmaceutical manufacturing industry draws upon worldwide sources for the myriad of raw
materials it needs to produce medicinal chemicals. Fermentation operations require many new
raw materials falling into general chemical classifications such as carbohydrates, carbonates, steep
liquors, nitrogen and phosphorus compounds, anti-foam agents and various acids and bases.
These chemicals are used as carbon and nutrient sources (1), as foam control additives, and for
pH adjustment in fermentation processes. Various solvents, acids, and bases are also required for
extraction and purification processes. Hundreds of raw materials are required for the many batch
chemical synthesis processes used by the industry. These include organic and inorganic
compounds and are used in gas, liquid, and solid forms.(4)
Plant and animal tissues are also used by the pharmaceutical manufacturing industry to produce
various biological and natural extraction products. The raw materials used in formulation
operations are the products from other manufacturing operations. These include bulk chemicals
from fermentation and chemical synthesis operations and such items as biles, blood fractions,
salts, and various derivatives from biological and natural extraction operations.(4)
Because such a vast number and wide variety of raw materials are used within the industry, it is
not practical to base subcategories directly on the raw materials used. In addition, the nature of
raw materials used by the pharmaceutical manufacturing industry are related to the manufacturing
process, and therefore, are indirectly accounted for in the final basis for subcategorization.
4.3.5 Plant Size
The Agency has determined that plant size in terms of production has no significant or consistent
impact on the effectiveness of treatment technologies or wastewater characteristics and therefore
did not consider plant size as a basis for subcategorization.
4-11
4.3.6 Plant Age
The age of a pharmaceutical manufacturing plant is an indefinite parameter primarily due to
continual upgrading and modernization most facilities have undertaken in order to remain
competitive. The cornerstone age (the age of the original facility) was evaluated relative to raw
waste load and treated effluent load without any apparent relationship. The Agency therefore did
not consider plant age as a basis for subcategorization.
4.3.7 Plant Location
The locations of pharmaceutical manufacturing facilities are typically based on a number of
factors, including:
C Sources of raw materials;C Proximity to markets for products;C Availability of an adequate water supply;C Cheap energy sources;C Proximity to proper modes of transportation;C Reasonably priced labor markets; andC Tax considerations.
The majority of pharmaceutical manufacturing plants are located in New Jersey, New York,
Pennsylvania, and Puerto Rico. Based on a review of available data, plant location does not affect
the characteristics or treatability of process wastewater streams. The Agency therefore did not
consider geographic location as a basis for subcategorization.
4.3.8 Nonwater Quality Environmental Impacts
Nonwater quality environmental impacts characteristics for the pharmaceutical manufacturing
industry include:
C Sludge production;C Waste solvent generation;
4-12
C Air pollution derived from wastewater generation and treatment; andC Steam and electrical energy consumption due to wastewater treatment.
These factors all relate to the characteristics of the wastewater treated. Because wastewater
characteristics are specifically accounted for in the final subcategorization approach, the Agency
considers all non-water quality environmental impacts to be adequately addressed by the final
subcategorization approach.
4.3.9 Treatment Costs and Energy Requirements
The same treatment unit operation, such as steam stripping to remove volatile organic pollutants,
could be utilized to treat wastewater from a variety of sources. However, the cost of treatment
and the energy required will vary depending on flow rates and wastewater characteristics.
Because wastewater characteristics are specifically accounted for in the final subcategorization
approach, treatment costs are adequately addressed. Therefore, while treatment costs, as
discussed in 10, were considered by the Agency in selecting the technology bases for this final
regulation, the Agency concludes that subcategorization based on treatment costs is not
appropriate.
4.4 Conclusions
Based on EPA's review of industry data, as described earlier in this section, the Agency concludes
that it is appropriate to maintain the four existing subcategories based on the different types of
manufacturing operations used by the pharmaceutical manufacturing industry. The four
subcategories for the pharmaceutical manufacturing industry covered by this final regulation are:
C Subcategory A - Fermentation Operations;C Subcategory B - Biological and Natural Extraction Operations;C Subcategory C - Chemical Synthesis Operations; andC Subcategory D - Mixing, Compounding, or Formulating Operations.
4-13
Due to the similarities identified above between the characteristics and treatability of wastewater
from fermentation and chemical synthesis operations, the Agency is establishing equivalent
effluent limitations guidelines for Subcategories A and C. The Agency is also establishing
equivalent effluent limitations guidelines for Subcategories B and D due to the similarity in
characteristics and treatability of wastewater from biological extraction and mixing, compounding,
and formulating operations.
At facilities that conduct fermentation and/or chemical synthesis operations, as well as biological
extraction and/or mixing, compounding, or formulating operations, the vast majority of the
wastewater discharge flow and pollutant load originates from the fermentation and chemical
synthesis operations. Most facilities with fermentation and/or chemical synthesis operations
conduct such operations at integrated facilities where other pharmaceutical manufacturing
operations are also conducted, with discharges to a common wastewater treatment system. The
Agency's treatment performance data reflect the integrated nature of such facilities.
For the purpose of analyzing and presenting data in subsequent sections of this development
document, pharmaceutical manufacturing facilities are considered either Subcategory A and C
facilities, or Subcategory B and D facilities. Due to the predominance of wastewater discharge
flow and pollutant load from Subcategory A and C operations when these operations are
conducted along with other pharmaceutical manufacturing operations at the same facility, and
because of the integrated nature of such facilities, facilities with any Subcategory A or C
operations are considered Subcategory A and C facilities. Subcategory B and D facilities are
those facilities that have Subcategory B and/or D operations only.
4-14
Table 4-1
Summary of Discharge Flow Rate, Conventional Pollutants and COD Concentrations inUntreated Wastewater
Type of 1983Discharge Subcategory Pollutant Low High Ave. Low High Ave.
(a) Facilities with combinations of manufacturing operations from other than Subcategories A, B, C, D, AC, and BD are included as other.
NA = Not available.
4-16
Table 4-2
Summary of Priority Pollutant Concentrations in Untreated Wastewater
Type of Current Cyanide or ContributingDischarge Subcategory Priority Data Low High Ave.
# of Facilities Untreated Wastewater Conc. (mg/L)
Direct A only C 0P 0
C only C 1 - - 4,850P 4 0.4 404 196
A and C only C 1 - - 1,730P 4 20 657 306
Other(a) C 1 - - 38P 6 0.3 11,900 2,860
Indirect A only C 0P 0
C only C 1 - - 5P 17 0.2 4,850 589
A and C only C 0P 1 - - 619
Other(a) C 2 229 850 539P 32 0 79,900 3,630
Direct B only P 0
D only P 3 0.2 30 10
B and D only P 0
Indirect B only P 1 - - 691
D only P 23 0.00 31,400 1,450
B and D only P 2 14.65 350 182
(a)"Other subcategory" denotes facilities which manufacture products in the following subcategories or subcategorycombinations: ABD, ACD, AD, CD, ABCD, AB, BC, ABC, and BCD.P - Priority organic pollutants.C - Cyanide.B/D facilities did not report any cyanide in their loads or waste streams.
4-17
Table 4-3
Summary of Nonconventional Pollutant Concentrations inUntreated Wastewater
Type of 1983 Ammonia or Other ContributingDischarge Subcategory Nonconventionals Data Low High Ave.
# of FacilitiesUntreated WastewaterConcentrations (mg/L)
Direct A only N 0A 0
C only N 5 16 15,600 3,270A 1 - - 228
A and C only N 4 282 7,450 3,030A 1 - - 21
A and/or C N 8 114 39,500 9,930+ Other(a) A 5 0.05 842 332
Indirect A only N 2 54 107 81A 1 - - 0.05
C only N 21 0 54,100 7,530A 12 10 948 354
A and C only N 2 6,860 20,800 13,900A 0
A and/or C N 52 0 385,400 12,900+ Other(a) A 27 0 217,700 8,890
Direct B only N 0A 0
D only N 7 0 14,200 3,130A 1 - - 0.7
B and D only N 1 - - 6A 0
Indirect B only N 7 0 2,010 694A 1 - - 16
D only N 54 0 492,400 12,900A 4 0.5 348 99
B and D only N 9 45 49,700 9,200A 0 -
(a)Facilities with combinations of manufacturing operations from other than Subcategories A, B, C, D, AC, and BD areincluded as other.N - Nonconventional.A - Ammonia.
4-18
Table 4-4
Summary of Conventional Pollutants and COD TreatedEffluent Concentrations
Type of 1983Discharge Subcategory Pollutant Low High Ave.
Effluent Concentrations (mg/L)
Direct A only BOD 66 189 1285
COD 1,400 1,700 1,550TSS 97 264 180
C only BOD 0 15 85
COD 0 923 268TSS 0 53 33
A and C only BOD 8 211 905
COD 216 834 530TSS 9 232 122
A and/or C BOD 8 68 35+ Other(a) COD 123 679 277
5
TSS 12 143 71
Direct B only BOD - - -5
COD - - -TSS - - -
D only BOD 0 145 175
COD 0 1,140 123TSS 2 34 11
B and D only BOD NA NA 45
COD NA NA 27TSS NA NA 16
(a)Facilities with combinations of manufacturing operations from other than Subcategories A, B, C, D, AC, and BD areincluded as other.
NA = Not available.
4-19
1. U.S. EPA. Pharmaceutical Manufacturing Point Source Category; Interim FinalRulemaking, 41 Federal Register 50676 (November 17, 1976).
2. U.S. EPA. Pharmaceutical Manufacturing Point Source Category EffluentLimitations Guidelines, Pretreatment Standards, and New Source PerformanceStandards; Proposed Regulation, 47 Federal Register 53584 (November 26, 1982).
3. U.S. EPA, Office of Water. Development Document for Effluent LimitationsGuidelines and Standards for the Pharmaceutical Manufacturing Point SourceCategory. EPA 440/1-83/084, U.S. Environmental Protection Agency,Washington, D.C., September 1983.
4. U.S. EPA, Office of Water. Development Document for Interim Final EffluentLimitations and Proposed New Source Performance Standards for thePharmaceutical Manufacturing Point Source Category. EPA 440/1-75/060, U.S.Environmental Protection Agency, Washington, D.C., December 1976.
REFERENCES
5-1
SECTION 5
WATER USE AND WASTEWATER CHARACTERIZATION
5.1 Introduction
The 1990 Detailed Questionnaire and the 1989 Pharmaceutical Screener Questionnaire distributed
by EPA identified 304 facilities which used solvents and discharged wastewater from
pharmaceutical manufacturing processes. The following information, based on questionnaire and
screener responses, is presented in this section:
C 5.2 discusses water use and sources of wastewater;
C 5.3 discusses wastewater volume by type of discharge;
C 5.4 presents water conservation measures;
C 5.5 discusses sources of wastewater characterization data; and
C 5.6 discusses wastewater characterization.
5.2 Water Use and Sources of Wastewater
As described in 3.4.1, there are four types of pharmaceutical manufacturing operations:
fermentation; biological and natural extraction; chemical synthesis; and mixing, compounding, or
formulating. Water use and sources of wastewater for each process are described in more detail
below.
5.2.1 Pharmaceutical Process Wastewater Sources
Process wastewater is defined by 40 CFR 122.2 as "any water which, during manufacturing or
processing, comes into direct contact with or results from the production or use of any raw
material, intermediate product, finished product, by-product, or waste product."
5-2
Water is used and wastewater is generated in pharmaceutical manufacturing processes as follows:
C Water of reaction: water formed during the chemical reaction.
C Process solvent: water used to transport or support the chemicals involvedin the reaction process; this water is usually removed from the processthrough a separation stage, such as centrifugation, decantation, drying, orstripping.
C Process stream washes: water added to the carrier, spent acid, or spentbase which has been separated from the reaction mixture, in order to purifythe stream by washing away the impurities.
C Product washes: water added to the reaction medium to purify anintermediate or final product by washing away the impurities (this water issubsequently removed through a separation stage); or water used to washthe crude product after it has been removed from the reaction medium.
C Spent Acid/Caustic: spent acid and caustic streams, which may beprimarily water, discharged from the process during the separation stepswhich follow the reaction step in which acid and basic reagents are used tofacilitate, catalyze, or participate.
C Condensed steam: steam used as a sterilizing medium and in steamstrippers for solvent recovery and wastewater treatment.
Other sources of process wastewater associated with pharmaceutical manufacturing operations
include:
C Air pollution control scrubber blowdown: water or acidic or basiccompounds used in air emission control scrubbers to control fumes fromreaction vessels, storage tanks, incinerators, and other process equipment.
C Equipment and floor washes: water used to clean process equipmentbetween product campaigns and during unit shutdowns and floors duringgeneral housekeeping or for spill cleanup.
C Pump seal water: direct contact water used to cool packing and lubricatepumps.
5-3
The following materials are excluded from the definition of process wastewater, because of their
significant potential to upset the normal operation of biological wastewater treatment plants:
C Trimthyl silanol;C Any active anti-microbial materials;C Wastewater from imperfect fermentation batches; andC Process area spills.
The following waters and wastewaters are excluded from the definition of process wastewater:
C Non-contact cooling water;
C Utility wastewaters;
C General site surface runoff;
C Groundwater (e.g., contaminated groundwaters from on-site or off-sitegroundwater remediation projects); and
C Other waters generated on site that are not process wastewaters.
Permitting the discharge of such waters and wastewaters must be considered separately from
pharmaceutical manufacturing industry process wastewater.
Table 5-1 presents the amount of process wastewater generated daily in the pharmaceutical
manufacturing industry that contains the organic pollutants of concern in the pharmaceutical
manufacturing industry (see Table 6-1). Table 5-2 presents the amount of process wastewater
generated daily which does not contain organic pollutants of concern. Pharmaceutical
manufacturing wastewater associated directly with the manufacturing process as well as pump
seal water and water from equipment washes is considered process wastewater in Tables 5-1 and
5-2. Table 5-3 presents the amount of wastewater generated daily from the air pollution control
devices.
5-4
5.2.2 Other Facility Wastewater Sources
In addition to process wastewater, other types of wastewater may be generated during
pharmaceutical manufacturing. This wastewater may include noncontact cooling water (used in
heat exchangers), noncontact ancillary water (boiler blowdown, bottle washing), sanitary
wastewater, and wastewater from other sources (stormwater runoff). Tables 5-4 through 5-7
present the amount of wastewater generated from these sources. Table 5-8 presents the total
amount of wastewater generated by pharmaceutical manufacturing facilities by subcategory.
5.3 Wastewater Volume by Type of Discharge
This discusses the types of wastewater discharges which apply to the pharmaceutical
manufacturing industry, the discharge status of the pharmaceutical manufacturing facilities, and
presents total industry discharge flow rates by type of discharge.
5.3.1 Type of Discharge Definitions
There are three types of discharge which apply to the pharmaceutical manufacturing industry:
direct, indirect, and zero discharge. Definitions for these discharge types are listed below.
Direct discharge refers to the discharge of a pollutant or pollutants directly to waters of the
United States (not to a publicly owned treatment works). Facilities that directly discharge
wastewaters do so under the National Pollutant Discharge Elimination System (NPDES) permit
program.
Indirect discharge refers to the discharge of pollutants indirectly to waters of the United States,
through publicly owned treatment works (POTWs).
Zero discharge refers to no discharge of pollutants to waters of the United States, as a result of
either reuse of process water back into the product, no water use, recycle off site or within the
5-5
plant in other processes, or disposal on or off site (e.g., by incineration, evaporation, or deep-well
injection) that does not result in discharge to waters of the United States.
5.3.2 Discharge Status of Pharmaceutical Manufacturing Facilities
As discussed in 3.2.4, EPA received 244 responses to the Detailed Questionnaire. A breakdown
of facility discharge status for facilities that responded to the Detailed Questionnaire and the 60
indirect discharging Subcategory D facilities with solvent use that were not sent a Detailed
Questionnaire are presented in Table 5-9. Seven facilities changed discharge status in the time
frame between the screener questionnaire and the Detailed Questionnaire. These facilities
reported that they discharged wastewater in the screener questionnaire, but they reported zero
discharge in the Detailed Questionnaire.
The flow rate and wastewater characterization data presented in this are representative of these
297 facilities.
5.3.3 Flow Rates by Type of Discharge
The total amount of process wastewater discharged from pharmaceutical manufacturing processes
to waters of the United States in 1990 was approximately 104.2 MGD, compared to 105.5 MGD
generated. Eighty-one percent of all process wastewater discharged was discharged directly to a
receiving stream while 19% was discharged indirectly. Over 93% of the wastewater discharged in
the pharmaceutical manufacturing industry is from facilities with fermentation and chemical
synthesis operations. Table 5-10 presents the volumes of pharmaceutical process wastewater
discharged by subcategory in 1990.
5.4 Water Conservation Measures
Water conservation measures were implemented with regard to process wastewater by 137 of the
244 respondents to the Detailed Questionnaire. Water conservation measures implemented
include: careful monitoring of water use, installation of automatic monitoring and alarm systems
5-6
on in-plant discharges, implementation of alternative production processes requiring less water,
conversion from barometric to surface condensers, reuse of wastewater from other manufacturing
processes, reuse of noncontact water as process makeup water, and treatment of contact cooling
water to allow reuse. Table 5-11 presents the number of facilities which implemented these water
conservation measures.
Table 5-12, based on the responses to the waste minimization of the Detailed Questionnaire,
presents the number of facilities reporting a reduction in wastewater generated (expressed as a
range in gal/yr) between 1989 and 1990.
5.5 Sources of Wastewater Characterization Data
3.2 described the many wastewater data collection efforts undertaken for development of these
final effluent limitations guidelines and standards. Sources that produced data on raw wastewater
characteristics included the Detailed Questionnaire and EPA sampling at pharmaceutical
manufacturing facilities. Results of these data-gathering efforts are described in more detail
below.
5.5.1 Data from the Detailed Questionnaire
The Detailed Questionnaire was used to gather raw wastewater information from pharmaceutical
manufacturing facilities for conventional, priority, and nonconventional pollutants. These data are
presented in 5.6.
5.5.2 EPA Pharmaceutical Manufacturers Sampling Program
To expand and augment the wastewater characterization data obtained in previous data-gathering
efforts, EPA conducted sampling episodes at 13 pharmaceutical manufacturing facilities between
1986 and 1991. Through this sampling effort, EPA verified the presence of many of the
conventional, priority, and nonconventional pollutants that were indicated as known or believed to
be present in pharmaceutical manufacturing wastewater based on earlier data-gathering efforts.
5-7
The sampling program was designed to characterize the wastewaters from both direct and indirect
dischargers. Direct dischargers selected for participation in the sampling program were those that
met the following criteria:
C The facility attained better than BPT-level annual average effluentconcentrations for BOD , COD, and TSS with its biological treatment5
system, and
C The facility's raw wastewater discharge contained significant amounts ofvolatile organic pollutants.
Indirect dischargers selected for participation in the sampling program were those that discharged
significant levels of volatile organic pollutants in their wastewater and/or operated a wastewater
pretreatment facility. Because EPA concentrated its sampling efforts at facilities with many
pollutants and high concentrations of pollutants, the facilities selected were all Subcategory A and
C facilities. 5.6 presents wastewater characterization data from these sampling episodes.
5.6 Wastewater Characterization
The pharmaceutical manufacturing industry generates process wastewaters containing a variety of
pollutants. Most of this process wastewater receives some treatment, either in-plant at the
process unit prior to commingling with other facility wastewaters or in an end-of-pipe wastewater
treatment system. This presents wastewater characterization data for pharmaceutical
manufacturing facilities. Data from the Detailed Questionnaire are presented in Sections 5.6.1
through 5.6.3 and data from EPA's sampling program are presented in 5.6.4. 5.6.5 presents a
discussion of sulfide and sulfate containing compounds in pharmaceutical wastewaters.
5.6.1 Conventional Pollutants and COD
The two conventional pollutants in pharmaceutical manufacturing wastewater characterized by
data from the Detailed Questionnaire are BOD and TSS.5
5-8
BOD , the quantity of oxygen used in the aerobic stabilization of wastewater streams, is the most5
widely used measure of general organic pollution in wastewater. This analytical determination
involves measuring dissolved oxygen used by microorganisms to biodegrade organic matter, and
varies with the amount of biodegradable matter that can be assimilated by biological organisms
under aerobic conditions. EPA Method 405.1 is used to measure BOD . The nature of specific5
chemicals discharged into wastewater affects the BOD due to the differences in susceptibility of5
different molecular structures to microbiological degradation. Compounds with lower
susceptibility to decomposition by microorganisms or that are toxic to microorganisms tend to
exhibit lower BOD values than compounds that biodegrade readily. Consequently, while BOD5 5
can provide a gross indication of the presence of organic pollutants, it is not a good indicator for
the presence of specific toxic organic pollutants.
Total solids in wastewater is defined as the residue remaining upon evaporation at just above the
boiling point. Total Suspended Solids (TSS) consist of the non-filterable residues which are
retained by a glass filter and dried to a constant weight at 103-105 C (as specified in EPA Methodo
160.2). Raw wastewater TSS content is a function of the manufacturing processes, as well as the
manner in which fine solids may be removed during a processing step. The total solids are
composed of matter which is settleable, in suspension or in solution, and can be organic,
inorganic, or a mixture of both. Settleable portions of the suspended solids are usually removed
in a primary clarifier. Finer materials are carried through the system, and in the case of an
activated sludge system, become enmeshed with the biomass where they are then removed with
the sludge during secondary clarification. Some manufacturing facilities may show an increase in
TSS in the effluent from the treatment plant. This characteristic is usually associated with
biological systems and indicates that secondary clarification may be inefficient in removing
secondary solids. Treatment systems that include polishing ponds or lagoons may also exhibit this
characteristic due to algae growth.
COD, a nonconventional pollutant, is also characterized in this because it is generally used with
BOD as a ratio to determine the amount of pollutants in the wastewater. COD is a measure of5
organic material in wastewater that can be oxidized as determined by subjecting the waste to a
powerful chemical oxidizing agent (such as potassium dichromate or potassium permanganate) in
5-9
an acidic medium. COD can be analyzed by EPA Methods 410.1 and 410.2. The COD test can
show the presence of organic materials that are not readily susceptible to attack by biological
microorganisms. As a result of this difference, COD values are almost invariably higher than
BOD values for the same sample. The COD test cannot be substituted directly for the BOD test5 5
because the COD/BOD ratio is extremely variable and is dependent on the specific chemical5
constituents in the wastewater. In addition, the COD test measures refractory organics, which the
BOD test does not. A COD/BOD ratio for the wastewater from a single manufacturing facility5 5
with a constant product mix or from a single manufacturing process may be established. This
ratio is applicable only to the wastewater from which it was derived and cannot be used to
estimate the BOD of another facility's wastewater. It is often established by facility personnel to5
monitor process and treatment plant performance with a minimum of analytical delay.
Information gathered from the 1987 COD study described in 3.2.2 indicates that pharmaceutical
manufacturing wastewaters contain COD which is comprised of many organic compounds (not all
of which could be identified in the study). One of the objectives of the study was to evaluate the
effectiveness of biological treatment and PAC in removing toxic organic compounds, which
contribute to the COD effluent concentration. In order to accomplish this objective, aquatic
bioassay tests were performed on both raw wastewater and treated effluents from pilot-scale
units. Acute and chronic bioassay tests were performed. The acute bioassay tests performed used
the median lethal concentration (LC ) as the end point of the test. The LC value is the50 50
concentration of sample which results in the death of half of the test organisms over the duration
of the test. The concentration of the sample is expressed in terms of percent effluent, (i.e., 50
percent effluent contains half sample and half dilution water). The chronic bioassay tests
performed included the no observed effect concentration (NOEC) and the lowest observed effect
concentration (LOEC). The NOEC is the highest concentration of sample which caused no
statistically significant adverse effect on the observed organism. The LOEC is the lowest
concentration of sample which caused an adverse effect on the organism of interest.
Table 5-13 summarizes the acute bioassay test results. These test results show the raw waste
acute toxicity (LC ) is greatly reduced by biological treatment.50
5-10
The chronic data from both test periods indicate that the raw waste exhibited very high chronic
toxicity with respect to both reproduction and survival. Table 5-14 summarizes the chronic
bioassay test results.
The results of these tests show that COD is a good measurement of the organic chemical content
in wastewaters and thus can be used as a surrogate measurement for the pharmaceutical industry
whose wastewaters are dominated by organics. Biological treatment can greatly reduce COD
concentrations from raw wastewater and therefore reduce wastewater toxicity.
Untreated wastewater and final effluent wastewater characterization of COD, BOD , and TSS5
was obtained from a table in the Detailed Questionnaire requesting 1990 long-term averages (in
mg/L) and flow (in GPD). Table 5-10 presents this information by subcategory and type of
discharge. Final effluent data represent the characteristics of wastewater sent to a POTW or
discharged to surface water, and do not represent any one level or type of treatment.
Untreated wastewater concentrations and final effluent concentrations reported are not paired
data. Low and high concentrations for BOD , COD, and TSS presented in Table 5-15 represent5
the range of values reported and are not from a single facility. The average concentration in the
table was calculated by adding the concentration data available from each facility and dividing by
the number of facilities.
The summary data shown in Table 5-15 do not necessarily represent only pharmaceutical
manufacturing process wastewater, and as a result, for some subcategories, such as the
Subcategory C only direct dischargers, the untreated and final effluent wastewater concentrations
are biased low. EPA expects the untreated wastewater characteristics of both direct and indirect
discharging Subcategory C only facilities to be similar. The similarity in wastewater
characteristics between direct and indirect discharging facilities is shown in Table 5-15 for the
Subcategory A only, Subcategory A/C (only), and Subcategory A/C (other) facilities, where raw
concentrations for BOD5, COD and TSS are similar between direct and indirect dischargers for
each respective subcategory.
5-11
EPA concludes that the reason for the discrepancy between the direct and indirect discharging
Subcategory C only facilities is that wastwater flows and pollutant concentrations do not solely
represent flows and concentrations from pharmaceutical manufacturing process wastewater.
Rather, they represent flows and concentrations that may include dilution water or water from
other sources. Of the eight direct discharging Subcategory C only facilities, six dilute their
pharmaceutical wastewater stream, sent through wastewater treatment, with water from other
sources to some degree (ranging from 22 percent to greater than 99 percent). These additional
water sources may be characterized by lower BOD and COD concentrations, resulting in a low5
bias of raw wastewater and effluent concentrations for conventional and non-conventional
parameters. EPA believes the reported concentrations for Subcategory C only direct discharging
facilities represent other water in addition to pharmaceutical manufacturing process wastewater.
Therefore, EPA expects the untreated wastewater pollutant concentrations from Subcategory C
only direct dischargers to be similar to wastewater pollutant concentrations from Subcategory C
only indirect dischargers, and has determined these concentrations warrant regulation.
5.6.2 Priority Pollutants
Priority pollutants regulated by this final rule (listed in 6.6) were reported as used by 93
pharmaceutical manufacturing facilities in their responses to the Detailed Questionnaire.
According to the Detailed Questionnaire, the list of priority pollutants used contained both
volatile and semivolatile compounds. The priority pollutants used in the greatest quantities are
methylene chloride, toluene, and chloroform. Table 5-16 presents untreated wastewater and final
effluent wastewater characterization data for these priority pollutants. Concentrations of priority
pollutants in untreated wastewater were calculated from pollutant discharge load information and
influent flow rates to the wastewater treatment plant. The pollutant load in untreated wastewater
was calculated as the sum of the following: air emissions from wastewater prior to discharge, the
pollutant load in wastewater discharged to surface water and/or the sewer, and the pollutant load
degraded and/or destroyed in the treatment process. Concentrations of priority pollutants in final
effluent wastewater were calculated from the pollutant load in wastewater discharged to surface
water and/or the sewer and effluent flow rates from the wastewater treatment plant. Final effluent
5-12
concentrations represent the concentration of priority pollutants in the wastewater sent to a
POTW or discharged to surface water, and do not represent any one level or type of treatment.
The total mass of priority pollutants in untreated wastewater and final effluent was divided by the
respective flow rate to calculate untreated wastewater and final effluent concentrations at each
facility. Low and high concentrations presented in Table 5-16 represent the range of total
concentration values from the facilities in the subcategory. Average concentrations were
calculated by adding the total mass of priority pollutants from each facility with available data and
dividing by the sum of the flows at these facilities. Discharge loads of specific priority pollutants
are presented in 9.
5.6.3 Nonconventional Pollutants
Nonconventional pollutants regulated by this final rule (listed in 6.7) were reported as used by 225
pharmaceutical manufacturing facilities in their responses to the Detailed Questionnaire.
According to the respondents, the nonconventional pollutants used in the largest quantities are
methanol, ethanol, acetone, and isopropanol. Table 5-17 presents untreated wastewater and final
effluent wastewater characterization data for these nonconventional pollutants.
The nonconventional pollutant COD is discussed in 5.6.1 because COD data were collected in the
same manner as BOD and TSS data. In addition, COD/BOD ratios are used by facilities to5 5
monitor pharmaceutical manufacturing processes and treatment plant performance.
Ammonia is shown separately in Table 5-17 since it is not an organic compound and has rather
distinct characteristics. Sampling data in the treatment performance database for ammonia are
reported as ammonia as nitrogen (N) concentrations. Ammonia loads reported in the 1990
Detailed Questionnaire represent ammonium hydroxide load. To provide a consistent basis of
comparison when examining ammonia discharge loads, the ammonium hydroxide loads were
converted to ammonia as N loads, by multiplying the ammonium hydroxide load by 0.4. This
multiplier accounts for the stoichiometric difference between nitrogen and ammonia and
ammonium hydroxide.
5-13
In Table 5-17, concentrations of nonconventional pollutants in untreated wastewater were
calculated from pollutant discharge load information and influent flow rates to the wastewater
treatment plant reported in the 1990 Detailed Questionnaire. The pollutant load in untreated
wastewater was calculated as the sum of the following: air emissions from wastewater prior to
discharge, the pollutant load in wastewater discharged to surface water and/or the sewer, and the
pollutant load degraded and/or destroyed in the treatment process. Concentrations of
nonconventional pollutants in final effluent wastewater were calculated from the pollutant load in
wastewater discharged to surface water and/or the sewer and effluent flow rates from the
wastewater treatment plant. Final effluent concentrations represent the concentration of
nonconventional pollutants in the wastewater sent to a POTW or discharged to surface water, and
do not represent any one level or type of treatment.
The total mass of nonconventional pollutants in untreated wastewater and final effluent was
divided by the respective flow rate to calculate untreated wastewater and final effluent
concentrations at each facility. Low and high concentrations presented in Table 5-17 represent
the range of concentration values from the facilities in the subcategory. Average concentrations
were calculated by adding the total mass of nonconventional pollutants from each facility with
available data and dividing by the sum of the flows at these facilities. Discharge loads of specific
nonconventional pollutants are presented in 9.
5.6.4 Sampling Data
Table 5-18 summarizes untreated wastewater and final effluent wastewater characterization data
from EPA sampling episodes. Priority and nonconventional pollutants in the table refer to
pollutants proposed for regulation in Sections 6.6 and 6.7. Untreated wastewater data were
collected from 11 of the 13 pharmaceutical facilities sampled. Final effluent data were collected
from 8 of the 13 pharmaceutical facilities sampled. Final effluent wastewater characterization
data do not represent any one level or type of treatment. Treatment performance data for specific
treatment technologies are presented in 8.
5-14
Untreated wastewater concentrations and final effluent concentrations reported are not paired
data. Low and high concentrations for ammonia as N, COD, nonconventional organics, and
priority organics presented in Table 5-18 represent the range of values reported and are not from
a single facility. The priority organic and nonconventional organic concentrations presented are
the sum of the concentrations of individual organic constituents detected at the respective
facilities. The average concentration was calculated by adding the concentration data available
from each facility and dividing by the number of facilities. Full sets of sampling characterization
data can be found in the sampling episode reports in the Record for this rulemaking.
5.6.5 Sulfide/Sulfate Containing Compounds
EPA has discussed with representatives of POTWs which receive pharmaceutical manufacturing
wastewaters concerns related to sulfide/sulfate containing compounds discharged into POTW
sewer systems. Sulfide and sulfate containing compounds discharged to POTW sewers are
converted to hydrogen sulfide and released into the air under low pH conditions in the sewer lines
or pumping stations leading to the POTW. The hydrogen sulfide that is produced has been
measured at concentrations that create a worker safety concern and may also be an explosion
concern. For example, EPA received comments from a POTW that documents on case of both
worker health and safety problems along with corrosion problems as a result of pharmaceutical
waste containing high sulfates converting to hydrogen sulfide in the collection system. Current
treatment approaches that the Agency is aware of to reduce hydrogen sulfide emissions from
POTW sewer lines include pH monitoring and the addition of ferrous chloride to sequester the
sulfides in wastewater and also the addition of peroxide at pumping stations to oxidize hydrogen
sulfide. Generation of hydrogen sulfide is a common concern related to the handling of untreated
sewage. However, due to a lack of data specific to the discharge and treatment of these
compounds in the pharmaceutical manufacturing industry, EPA did not further consider these
pollutants in developing national standards. Specific problems related to sulfide/sulfate containing
compounds discharged by pharmaceutical manufacturing facilities should be addressed on a case-
by-case basis.
5-15
Table 5-1
Process Wastewater GeneratedWhich Contains Organic Compounds
Subcategory and Discharge Mode Average Quantity Generated (MGD)
A and/or C Direct 77.62
A and/or C Indirect 10.54
B and/or D Direct 0.15
B and/or D Indirect 3.12
Total 91.43
Table 5-2
Process Wastewater GeneratedWhich Does Not Contain Organic Compounds
Subcategory and Discharge Mode Average Quantity Generated (MGD)
A and/or C Direct 5.45
A and/or C Indirect 5.03
B and/or D Direct 1.29
B and/or D Indirect 2.31
Total 14.08
5-16
Table 5-3
Wastewater Resulting FromAir Pollution Control
Subcategory and Discharge Mode Average Quantity Generated (MGD)
A and/or C Direct 1.85
A and/or C Indirect 2.14
B and/or D Direct 0.01
B and/or D Indirect 0.33
Total 4.33
Table 5-4
Wastewater Resulting FromNoncontact Cooling Water
Subcategory and Discharge Mode Average Quantity Generated (MGD)
A and/or C Direct 55.71
A and/or C Indirect 42.36
B and/or D Direct 10.72
B and/or D Indirect 4.99
Total 113.78
5-17
Table 5-5
Wastewater Resulting FromNoncontact Ancillary Water
Subcategory and Discharge Mode Average Quantity Generated (MGD)
A and/or C Direct 16.72
A and/or C Indirect 4.24
B and/or D Direct 0.83
B and/or D Indirect 2.24
Total 24.03
Table 5-6
Sanitary Wastewater
Subcategory and Discharge Mode Average Quantity Generated (MGD)
A and/or C Direct 1.10
A and/or C Indirect 4.46
B and/or D Direct 0.77
B and/or D Indirect 2.96
Total 9.29
5-18
Table 5-7
Wastewater From Other Sources
Subcategory and Discharge Mode Average Quantity Generated (MGD)
A and/or C Direct 3.22
A and/or C Indirect 2.44
B and/or D Direct 0.48
B and/or D Indirect 3.34
Total 9.48
Table 5-8
Total Amount of Wastewater Generated from PharmaceuticalManufacturing Facilities
Subcategory and Discharge Mode Total Quantity Generated (MGD)
A and/or C Direct 161.67
A and/or C Indirect 71.21
B and/or D Direct 14.25
B and/or D Indirect 19.29
Total 266.42
5-19
Table 5-9
Facility Discharge Status by Subcategory
Subcategory Discharge Facilities Discharge Facilities Indirect Discharges TotalNumber of Direct Number of Indirect Have Both Direct and
Number of Facilities That
A/C 23 88 1 112
B/D 12 171 2 185
Total 35 259 3 297(a)
(a) Seven facilities reported zero discharge in the Detailed Questionnaire.
Table 5-10
Volume of Process Wastewater Discharged by Subcategory
Subcategory Surface Water (MGD) to POTW (MGD) Discharged (MGD)
Volume of Process Volume of ProcessWastewater Discharged to Wastewater Discharged Total Process Water
A/C 82.78 14.77 97.55
B/D 1.44 5.21 6.65
Total 84.20 19.98 104.20
5-20
Table 5-11
Water Conservation Measures ImplementedFor Process Wastewater(a)
Water Conservation Measure Last 5 Years Earlier Total ResponsesImplemented Implemented
Careful monitoring of water use 79 58 137
Installation of automatic monitoring and alarm 36 20 56systems on in-plant discharges
Implementation of alternative production 20 6 26processes requiring less water
Conversion from barometric to surface condensers 6 12 18
Reuse of noncontact water as process makeup 3 6 9water
Reuse of wastewater from other manufacturing 6 3 9processes
Treatment of contact cooling water to allow reuse 4 4 8
(a)Of the 244 facilities completing the Detailed Questionnaire, 137 responded that water conservation measures wereimplemented with regard to process wastewater.
5-21
Table 5-12
Number of Facilities Reporting a Reduction in WastewaterGenerated between 1989 and 1990
Reduction in Wastewater Quantity(gal/yr) Number of Facilities
(a)NOEC = the highest concentration of sample which caused no statistically significant adverse effect on the observedorganism. Reported results are average values from up to four sets of daily tests for each test period.(b)LOEC = The lowest concentration of sample which caused an adverse effect on the organism of interest. Reportedresults are average values from up to four sets of daily tests for each test period.
5-23
Table 5-15
BOD , COD, and TSS Concentrations in Untreated Wastewater and Final Effluent5
Type of CurrentDischarge Subcategory Pollutant Low High Ave. Low High Ave. Low High Ave.
D only(a) BOD NA 4,650 601 0 4,950 580 0 42,600 6805
COD NA 6,610 907 0 2,660 502 0 42,600 680TSS NA 2,060 283 0 2,410 238 0 42,600 680
B and D BOD 150 2,940 800 10 307 140 1 1,050 186only(a) COD 184 2,600 1,070 184 413 282 1 1,050 186
5
TSS 24 743 265 24 100 63 1 1,050 186
(a)Some of these facilities provided BOD , COD, and TSS loadings and flows by stream. The loadings and flows were summed for all streams in the facility, and the total concentration and flow were used in5
this average.
(b)"Other Subcategory" denotes facilities which manufacture products in the following subcategories or subcategory combinations: ABD, ACD, AD, CD, ABCD, AB, BC, ABC, and BCD.
NA - Not available.
5-25
Table 5-16
Cyanide and Total Priority Organic Pollutant Concentrationsin Pharmaceutical Manufacturing Process Wastewater
Type of Current Cyanide or ContributingDischarge Subcategory Priority Data Low High Ave. Low High Ave. Low High Ave.
# of Facilities Untreated Wastewater Conc. (mg/L) Final Effluent Conc. (mg/L) Flow (1,000 GPD)
Direct A only C 0P 0
C only C 1 - - 4,850 - - 5 - - 2P 4 0.4 404 196 0 5 2 3 1,340 389
A and C only C 1 - - 1,730 - - 0.4 - - 3P 4 20 657 306 0 17 5 114 7,210 2,160
Type of Current Cyanide or ContributingDischarge Subcategory Priority Data Low High Ave. Low High Ave. Low High Ave.
# of Facilities Untreated Wastewater Conc. (mg/L) Final Effluent Conc. (mg/L) Flow (1,000 GPD)
Indirect B only P 1 - - 691 - - 0 - - 11
D only P 23 0.00 31,400 1,450 0 31,400 1,380 0 278 28
B and D only P 2 14.65 350 182 2 15 8 13 676 345
(a)"Other subcategory" denotes facilities which manufacture products in the following subcategories or subcategory combinations: ABD, ACD, AD, CD, ABCD, AB, BC, ABC, and BCD. P - Priority organicpollutants.C - Cyanide.B and D facilities did not report any cyanide in their loads or waste streams.
5-27
Table 5-17
Ammonia and Total Nonconventional Organic Pollutant Concentrationsin Pharmaceutical Manufacturing Process Wastewater
Type of Current Ammonia or ContributingDischarge Subcategory Nonconventional Data Low High Ave. Low High Ave. Low High Ave.
# of Facilities Untreated Wastewater Conc. (mg/L) Final Effluent Conc. (mg/L) Flow (1,000 GPD)
Direct A only N 0A 0
C only N 5 16 15,600 3,270 0.3 155 36 3 1,340 322A 1 - - 91.2 - - 15.6 - - 1,340
A and C only N 4 282 7,450 3,030 0 138 35 114 7,210 2,160A 1 - - 8.4 - - 7.6 - - 7,210
D only N 7 0 14,300 3,130 0 6,110 928 0 20 6A 1 - - 0.3 - - 0 - - 13
B and D only N 1 - - 6 - - 6 - - 63A 0
5-28
Table 5-17 (Continued)
Type of Current Ammonia or ContributingDischarge Subcategory Nonconventional Data Low High Ave. Low High Ave. Low High Ave.
# of Facilities Untreated Wastewater Conc. (mg/L) Final Effluent Conc. (mg/L) Flow (1,000 GPD)
Indirect B only N 7 0 2,010 694 0 1,700 423 0 200 32A 1 - - 6.4 - - 0 - - 1
D only N 54 0 492,000 12,900 0 492,000 10,600 0 309 23A 4 0.2 139 39.6 0 17.6 4.8 0 5 2
B and D only N 9 45 49,700 9,200 45 48,400 6,840 0 676 101A 0 -
(a)"Other subcategory" denotes facilities which manufacture products in the following subcategories or subcategory combinations: ABD, ACD, AD, CD, ABCD, AB, BC, ABC, and BCDA - Ammonia as N (where ammonium hydroxide x 0.4 (mg) = ammonia as N (mg))N - Nonconventional organic pollutants
5-29
Table 5-18
Pharmaceutical Manufacturing Industry Wastewater Characterization DataBased on EPA Sampling Episodes
Type of Sub- Data DataDischarge category Pollutant Points PointsLow High Ave. Low High Ave. Low High Ave. Low High Ave.
(a)"Other subcategory" denotes facilities which manufacture products in the following subcategories or subcategory combinations: ABD, ACD, AD, CD, ABCD, AB, BC, ABC, and BCD.NA - Not available.
5-31
REFERENCES
1. Memorandum: The COD of Pharmaceutical Wastewaters, from Frank Hund tothe Public Record. April 1, 1988.
2. Memorandum from Alan Messing, DynCorp-Viar. April 4, 1994.
6-1
SECTION 6
POLLUTANTS SELECTED FOR REGULATION
6.1 Introduction
EPA has reviewed wastewater characterization data available from the Detailed Questionnaire
responses and EPA sampling results to determine the presence or absence of conventional,
nonconventional, and priority pollutants in pharmaceutical manufacturing process wastewaters.
Using this information, EPA determined pollutants likely to be present and pollutants identified as
being discharged by the pharmaceutical manufacturing industry. This presents the results of that
study and identifies the pollutants and pollutant parameters the Agency is regulating under BPT,
BCT, and BAT effluent limitations guidelines and NSPS, PSNS, and PSES, as appropriate.
EPA is authorized to regulate conventional and priority pollutants under Sections 304(a)(4) and
301(b)(2)(C) of the Clean Water Act (CWA), respectively. The list of toxic pollutants from 307
of the CWA has been expanded to include 126 priority pollutants identified in the Settlement
Agreement of NRDC vs. Train.(1) In addition, the Agency may also regulate other
nonconventional pollutants, taking into account factors such as treatable amounts, toxicity,
analytical methods, frequency of occurrence, use of indicator pollutants, and the pass through of
pollutants at Publicly Owned Treatment Works (POTWs).
The following information is discussed in these sections:
C 6.2 discusses the pollutants considered for regulation;
C 6.3 discusses the pollutants discharged by the pharmaceuticalmanufacturing industry;
C 6.4 presents the pollutant selection evaluation criteria;
C 6.5 discusses the conventional pollutants considered and selected forregulation;
6-2
C 6.6 discusses the priority pollutants considered and selected for regulation;and
C 6.7 discusses the nonconventional pollutants considered and selected forregulation.
6.2 Pollutants Considered for Regulation
Prior to 1986, the Agency's regulatory focus for the pharmaceutical manufacturing industry was
on five conventional pollutants and 126 priority pollutants. In 1986, the Agency expanded the
analysis of the industry's wastewater to determine the presence and levels of the Industrial
Technology Division (ITD) List of Analytes, which was derived from the ITD List of Lists, as
described in 3.2.3. The List of Analytes was revised in 1990 to include 458 analytes. EPA
conducted a study to determine which of these 458 analytes could potentially be discharged in
pharmaceutical manufacturing wastewaters in significant amounts. The study included a review
of the prior pharmaceutical rulemaking and available literature, an evaluation of EPA and industry
sampling data obtained prior to 1986, data reported in the Detailed Questionnaire, data submitted
by the industry in connection with the Detailed Questionnaire, data obtained from EPA sampling
at pharmaceutical manufacturing facilities, and industry-supplied corrections to the Detailed
Questionnaire data.(2) These data-collection efforts were discussed in greater detail in 3.
The Agency's evaluation of the industry resulted in a list of 146 conventional, nonconventional,
and priority pollutants and pollutant parameters which may be present in the industry's wastewater
(see Table 6-1). The pollutants and pollutant parameters identified as likely to be present are
predominantly volatile and semivolatile organic compounds. Other parameters which may be
present are ammonia and cyanide. Although metals are used in some pharmaceutical
manufacturing processes, they were not discharged at concentrations high enough to warrant
control on an industry-wide basis. 3 describes in detail the criteria used by the Agency to identify
those pollutants which may be present in the industry's wastewater.
6-3
6.3 Pollutants Discharged by the Pharmaceutical Industry
EPA requested discharge information on 143 of the 146 pollutants and pollutant parameters
which may be present in the industry's wastewater in the Detailed Questionnaire sent to
pharmaceutical manufacturing facilities in Subcategories A, B, C, and D. Discharge information
was not collected on pH, oil and grease, and fecal coliform. Regulations governing control of pH
in pharmaceutical manufacturing wastewater are not being revised. Oil and grease and fecal
coliform are not significant pollutants in this industry. The Agency used the responses to this
questionnaire to identify which of the pollutants likely to be present were being discharged by the
industry.
Responses to 3-1 of the Detailed Questionnaire indicated that the following 17 priority pollutants
and 36 nonconventional pollutants identified as potentially present in the industry's wastewater
were not reported as discharged in pharmaceutical manufacturing wastewaters in 1990:
Priority Pollutants Not Reported as Discharged
Acrolein 1,2-Dichloropropane
Acrylonitrile Hexachlorocyclapentadiene
Benzidine Hexachloroethane
Bromoform Nitrobenzene
Bromomethane 2-Nitrophenol
Chloroethane 4-Nitrophenol
p-Dichlorobenzene Trichloroethylene
1,1-Dichloroethane Vinyl Chloride
1,1-Dichloroethene
Nonconventional Pollutants Not Reported as Discharged
Acetophenone N-Dipropylamine
4-Aminobiphenyl Epichlorohydrin
Benzotrichloride Ethyl Cyanide
Benzyl Bromide 2-Hexanone
Biphenyl Iodoethane
2-Bromo-Propanoylbromide 2-Methoxyaniline
N-Butylamine Methyl Methacrylate
Nonconventional Pollutants Not Reported as Discharged
6-4
sec-Butyl Alcohol N-Nitrosomorpholine
Catechol n-Pentane
2-Chloroacetophenone B-Propiolactone
3-Chloro-4-Fluoroaniline 1,3-Propane Sulfone
Chloromethyl Methyl Ether Propionaldehyde
Cresol (Mixed) 1,2-Propyleneimine
Cumene Styrene
1,2-Dibromoethane Tetrachloroethene
Diethyl Carbonate 1,2-trans-Dichloroethene
Diethyl-ortho Formate 2,4,5-Trichlorophenol
1,1-Dimethylhydrazine Vinyl Acetate
These 17 priority and 36 nonconventional pollutants were excluded from consideration for
regulation, leaving 90 conventional, priority, and nonconventional pollutants and pollutant
parameters reported as discharged as potential candidates for regulation.
6.4 Pollutant Selection Evaluation Criteria
Having identified those pollutants of concern being discharged by the pharmaceutical
manufacturing industry, the Agency next considered which of those pollutants should be
controlled. The NRDC Consent Decree included a defined set of criteria for selecting pollutant
parameters to be regulated.(1) While no longer bound by the conditions of the NRDC Consent
Decree, the Agency used a similar screening protocol for selecting pollutants and pollutant
parameters for this regulation. Pollutants were excluded from consideration for regulation based
on the following criteria:
C The pollutant is discharged in relatively small amounts (<3,000 lbs peryear) and is neither causing nor likely to cause toxic effects;
C The pollutant is not effectively treated by the use of treatment technologiesselected under BAT or PSES;
C The pollutant is reported or detected in the effluent from a small number ofsources, and is uniquely related to these sources;
6-5
C The pollutant cannot be analyzed by EPA-approved or other state-of-the-art established methods;
C Additionally, pollutants considered for regulation that were found to haveminimal load reduction through implementation of BAT and PSES for A/Cand B/D subcategories were not selected for regulation.
The Agency considered the available pollutant data (from existing rulemakings and available
literature, evaluation of existing data, data obtained from the Detailed Questionnaire, data
submitted by industry, and data obtained from EPA sampling at pharmaceutical manufacturing
facilities) against the selection criteria cited above. Sections 6.4.1 through 6.4.4 summarize EPA's
assessment of these evaluation criteria for 86 priority and nonconventional pollutants discharged
by the pharmaceutical manufacturing industry. The other 4 of the 90 constituents identified as
being discharged by the pharmaceutical manufacturing industry (cyanide, COD, and the
conventional pollutants BOD and TSS) are considered in Sections 6.5, 6.6, and 6.7. Table 6-25
summarizes the information obtained for each of the 86 priority and nonconventional pollutants
identified as discharged by the pharmaceutical manufacturing industry.
6.4.1 Quantity Discharged
The quantity of each of the 86 priority and nonconventional pollutants discharged by the
pharmaceutical manufacturing industry in 1990 ranged from 1 lb/yr to 13,200,000 lbs/yr. Table 6-
2 lists these pollutants by total quantity discharged in process wastewaters. Table 6-2 also
presents the percentage of total organic loading contributed by each constituent. Those pollutants
discharged at 98,400 lbs/yr and above represent approximately 99% of the total organic loading
discharged in 1990.
6.4.2 Treatability
Pollutant treatability was evaluated for the two main technologies utilized by the pharmaceutical
manufacturing industry, biological treatment and steam stripping. Steam stripping treatability was
evaluated using a pollutant's Henry's Law Constant. Biological treatability was evaluated by
considering available biotreatability rate constants (Kmax) and/or the ratio of BOD to theoretical
6-6
oxygen demand (ThOD) (4,5). Henry's Law and Kmax constants, as well as the BOD/ThOD
ratio, are general indicators of treatability. All pollutants were found to be treatable by either
steam stripping or biological treatment.
6.4.3 Number of Facilities Discharging Pollutants
Table 6-2 lists the number of facilities reporting discharges of each pollutant and the number of
facilities reporting a pollutant in their raw 1990 loads.
Some pollutants were found to be discharged by only one facility in 1990 and were unique to that
one facility. Other pollutants such as benzene were reported as discharged by only one facility in
1990 but were present at more than one facility. Due to the variable nature of this industry, EPA
has not excluded pollutants for regulation that may be present at more than one facility and are
discharged in significant amounts. Benzene is a good case in point, since even though only one
facility identified it as discharged in 1990 it was found to be present in 10 of the samples taken by
EPA in August 1996 at the Barceloneta Regional Wastewater Treatment Plant which is a POTW
that receives predominately pharmaceutical wastewaters along with domestic and food-processing
wastewaters.
6.4.4 Load Removed
After identifying pollutants to be considered, EPA analyzed the load reduction of these pollutants.
9 provides specific information on calculation of pollutant loads and pollutant load reduction.
Table 6-5 presents the pollutant load reductions expected through implementation of BAT and
PSES regulations for A/C and B/D facilities.
6.5 Conventional Pollutants Considered and Selected for Regulation
Conventional pollutants include BOD , TSS, fecal coliform, pH, and oil and grease. These5
pollutants are general indicators of water quality rather than specific compounds. BOD , TSS,5
6-7
and pH are regulated by current BPT limitations; with this final rule, EPA is retaining the existing
BPT limitations for BOD , TSS, and pH.5
Oil and grease and fecal coliform were not considered for regulation in the pharmaceutical
manufacturing industry. Although oil and grease may appear in some plant process wastewater, it
is not sufficiently widespread or discharged at concentrations high enough to justify regulation on
an industry-wide basis. Fecal coliform is related to sanitary discharges and not discharges from
specific pharmaceutical manufacturing process wastewaters and, therefore, was also not
considered for regulation.
6.6 Priority Pollutants Considered and Selected for Regulation
6.6.1 Priority Pollutants Considered for Regulation
Thirty-two priority pollutants were considered for regulation in the pharmaceutical manufacturing
industry (see Table 6-1). Seventeen of these were not reported as discharged in pharmaceutical
manufacturing wastewaters based on the Detailed Questionnaire. Of the fifteen remaining, six
were not selected for regulation because they were discharged on an industry-wide basis at less
than 3,000 lbs/yr. A review of their treatability, treatment performance data availability, number
of facilities discharging, analytical methods, and load discharged does not support the need for
regulation. Table 6-3 lists these six priority pollutants and the reasons for their exclusion from the
list of pollutants to regulate. The remaining 9 were identified as candidates for regulation:
The remaining priority pollutant selected for regulation at B/D facilities is methylene chloride.
6-9
6.7 Nonconventional Pollutants Selected for Regulation
6.7.1 Nonconventional Pollutants Considered for Regulation
One hundred and nine nonconventional pollutants were considered for regulation in the
pharmaceutical manufacturing industry (see Table 6-1). Thirty-six of these were not reported as
discharged in pharmaceutical manufacturing wastewaters from process wastewaters based on the
Detailed Questionnaire. Of the remaining 73 nonconventional pollutants considered, 34 were not
selected for regulation for the following reasons:
C Twenty-seven pollutants were discharged on an industry-wide basis at lessthan 3,000 lbs/yr. A review of their treatability, treatment performancedata availability, number of facilities discharging, analytical methods, andload discharged does not support the need for regulation.
C Acetic acid and formic acid were excluded due to their low toxicity andbecause they will be treated by normal pH control measures as required bythe pH range specified within the regulation.
C Glycol ethers were excluded due to the lack of an available analyticalmethod. Methyl cellosolve, the predominant glycol ether reported as beingused by the industry, has been selected for regulation at subcategory A/Cfacilities, where it is found.
C Dimethyl carbamyl chloride and Bis(chloromethyl)ether were excludedbecause they hydrolize in water and therefore do not persist in water.
C 2-methylpyridine was excluded because the pollutant is reported ordetected in the effluent from one source and is uniquely related to thissource.
C Trichlorofluoromethane was excluded because the pollutant was detectedin the effluent from one source and is uniquely related to this source.
Table 6-4 lists these 34 nonconventional pollutants and the reasons for their exclusion from the
list of pollutants to regulate. The remaining 39 were identified by the Agency as candidates for
Table 6-2Pollutant Selection Evaluation Criteria for Pollutants
Discharged by the Pharmaceutical Manufacturing Industry
Constituent Type (lbs/yr) Percent of Constituents ConstituentsCode Constituent Name (a) (b) Total Loading in Raw Load Discharged
Constituent Discharged Reporting ReportingQuantity # of Facilities # of Facilities
97 Methanol (Methyl Alcohol) N 13,204,311 33.145 91 75
70 Ethanol N 5,864,800 14.722 111 92
2 Acetic Acid N 3,306,442 8.300 44 44
94 Isopropanol N 3,071,721 7.711 102 85
118 Acetone N 3,069,840 7.706 63 53
102 Methylene chloride P 1,257,644 3.157 54 45
60 N,N-Dimethylacetamide N 1,046,104 2.626 8 7
9 Ammonium hydroxide N 927,804 2.329 54 30
81 Formic Acid N 821,154 2.061 9 9
66 Dimethyl sulfoxide N 750,576 1.884 15 14
27 N-Butyl alcohol N 666,324 1.673 20 18
105 Methyl isobutyl ketone (MIBK) N 638,193 1.602 9 9
101 Methyl cellosolve N 445,137 1.117 4 4
3 Acetonitrile N 430,191 1.080 18 15
136 Triethylamine N 418,697 1.051 22 13
26 N-Butyl acetate N 415,426 1.043 2 2
64 N,N-Dimethylformamide N 387,298 0.972 27 21
79 Formaldehyde N 313,190 0.786 29 24
71 Ethyl acetate N 273,627 0.687 35 26
130 Toluene P 265,859 0.667 49 41
129 Tetrahydrofuran N 264,875 0.665 21 16
113 Petroleum naphtha N 260,583 0.654 5 2
55 Diethylamine N 218,020 0.547 10 7
124 Pyridine N 212,039 0.532 14 10
11 Amyl alcohol N 196,554 0.493 6 6
6-15
Table 6-2 (Continued)
Constituent Type (lbs/yr) Percent of Constituents ConstituentsCode Constituent Name (a) (b) Total Loading in Raw Load Discharged
Constituent Discharged Reporting ReportingQuantity # of Facilities # of Facilities
37 Chloroform P 181,517 0.456 16 14
77 Ethylene glycol N 165,860 0.416 13 12
15 Benzene P 120,200 0.302 2 1
10 n-Amyl acetate N 113,485 0.285 5 5
29 Tert-Butyl alcohol N 98,408 0.247 7 5
106 2-Methylpyridine N 48,800 0.122 1 1
95 Isopropyl acetate N 47,924 0.120 10 9
93 Isobutyraldehyde N 35,654 0.089 3 2
115 Polyethylene glycol 600 N 31,219 0.078 8 8
84 N-Heptane N 27,894 0.070 12 11
139 Xylenes N 27,361 0.069 14 13
67 1,4-Dioxane N 24,422 0.061 5 5
48 o-Dichlorobenzene P 21,499 0.054 2 2
62 N,N-Dimethylaniline N 18,155 0.046 3 2
25 2-Butanone (MEK) N 17,426 0.044 6 4
83 Glycol ethers N 14,483 0.036 6 6
103 Methyl formate N 12,616 0.032 4 3
117 N-Propanol N 11,439 0.029 6 4
96 Isopropyl ether N 11,314 0.028 4 4
22 Bis(Chloromethyl)ether N 11,221 0.028 1 1
114 Phenol P 10,919 0.027 18 12
87 N-Hexane N 10,796 0.027 17 8
80 Formamide N 7,184 0.018 5 4
35 Chlorobenzene P 5,606 0.014 5 4
51 1,2-Dichloroethane P 4,612 0.012 8 6
12 Aniline N 4,603 0.012 4 4
63 Dimethylcarbamyl chloride N 3,973 0.010 1 1
6-16
Table 6-2 (Continued)
Constituent Type (lbs/yr) Percent of Constituents ConstituentsCode Constituent Name (a) (b) Total Loading in Raw Load Discharged
Constituent Discharged Reporting ReportingQuantity # of Facilities # of Facilities
134 Trichlorofluoromethane N 3,850 0.010 2 1
132 1,1,2-Trichloroethane P 2,954 0.007 2 2
111 n-Octane N 2,200 0.006 1 1
56 Diethylaniline N 1,703 0.004 1 1
58 Diethyl ether N 1,350 0.003 13 8
45 Cyclohexylamine N 1,250 0.003 1 1
31 Carbon disulfide N 1,100 0.003 1 1
14 Benzaldehyde N 886 0.002 3 3
91 Iodomethane N 845 0.002 2 2
33 Chloroacetic acid N 800 0.002 2 2
61 Dimethylamine N 756 0.002 4 1
123 Propylene oxide N 742 0.002 1 1
44 Cyclohexanone N 738 0.002 1 1
46 Cyclopentanone N 678 0.002 1 1
100 Methyl-t-butyl-ether N 588 0.001 2 2
43 Cyclohexane N 491 0.001 10 4
72 Ethylamine N 466 0.001 1 1
18 Benzyl alcohol N 401 0.001 16 16
99 Methylamine N 310 0.001 9 2
98 Methylal N 252 0.001 1 1
39 Chloromethane P 204 0.001 2 2
126 1,1,2,2-Tetrachloroethane P 120 0 1 1
78 Ethylene oxide N 105 0 3 3
131 1,1,1-Trichloroethane P 91 0 4 4
73 Ethylbenzene P 90 0 1 1
92 Isobutyl alcohol N 46 0 1 1
1 Acetaldehyde N 33 0 1 1
6-17
Table 6-2 (Continued)
Constituent Type (lbs/yr) Percent of Constituents ConstituentsCode Constituent Name (a) (b) Total Loading in Raw Load Discharged
Constituent Discharged Reporting ReportingQuantity # of Facilities # of Facilities
89 Hydrazine N 17 0 2 2
75 Ethyl cellosolve N 5 0 1 1
20 Benzyl Chloride N 5 0 2 2
7 Allyl chloride N 5 0 1 1
74 Ethyl bromide N 5 0 2 2
82 Furfural N 4 0 3 1
128 Tetrachloromethane P 1 0 1 1 (a) N-Nonconventional Pollutant
P-Priority Pollutant(b) Quantity discharged is equal to the discharge to surface water and/or sewer (1lbs) from Table 3-2 of the Detailed Questionnaire.
6-18
Table 6-3
Priority Pollutants Not Selected forRegulation in the Pharmaceutical Manufacturing Industry
Pollutant Reason for Exclusion
Tetrachloromethane Discharged in trace amounts from one facility (1 lb/yr)
Ethylbenzene Discharged in trace amounts from one facility (90 lbs/yr), low toxicity
1,1,1-Trichloroethane Discharged in trace amounts (91 lbs/yr), low toxicity
1,1,2,2-Tetrachloroethane Discharged in low amounts from one facility (120 lbs/yr)
Chloromethane Discharged in low amounts from two facilities (204 lbs/yr)
1,1,2-Trichloroethane Discharged in low amounts from two facilities (2,954 lbs/yr)
6-19
Table 6-4
Nonconventional Pollutants Not Selected for Regulation in the Pharmaceutical Manufacturing Industry
Pollutant Reason for Exclusion
Allyl chloride Discharged in trace amounts from one facility (5 lbs/yr), low toxicity
n-Octane Discharged in low amounts from one facility (2,200 lbs/yr), low toxicity
Diethylaniline Discharged in low amounts from one facility (1,703 lbs/yr), low toxicity
Cyclohexylamine Discharged in low amounts from one facility (1,250 lbs/yr), low toxicity
Carbon disulfide Discharged in low amounts from one facility (1,100 lbs/yr), low toxicity
Propylene oxide Discharged in low amounts from one facility (742 lbs/yr)
Iodomethane Discharged in low amounts from two facilities (845 lbs/yr), low toxicity
Chloroacetic acid Discharged in low amounts from two facilities (800 lbs/yr), low toxicity
Cyclohexanone Discharged in low amounts from one facility (738 lbs/yr), low toxicity
Cyclopentanone Discharged in low amounts from one facility (678 lbs/yr), low toxicity
Methyl-t-butyl-ether Discharged in low amounts from two facilities (588 lbs/yr), low toxicity
Methylal Discharged in low amounts from one facility (252 lbs/yr), low toxicity
Ethylamine Discharged in low amounts from one facility (466 lbs/yr), low toxicity
Ethyl bromide Discharged in trace amounts from two facilities (5 lbs/yr), low toxicity
Ethyl cellosolve Discharged in trace amounts from one facility (5 lbs/yr)
Benzyl chloride Discharged in trace amounts from two facilities (5 lbs/yr)
Isobutyl alcohol Discharged in trace amounts from one facility (46 lbs/yr), low toxicity
Hydrazine Discharged in trace amounts from two facilities (17 lbs/yr)
Acetaldehyde Discharged in trace amounts from one facility (33 lbs/yr)
Acetic acid Addressed by pH control under BPT
Formic acid Addressed by pH control under BPT
Benzaldehyde Discharged in low amounts (886 lbs/yr), low toxicity
Benzyl alcohol Discharged in low amounts (401 lbs/yr), low toxicity
Ethylene oxide Discharged in low amounts (105 lbs/yr)
Glycol ethers No analytical method available
Dimethyl carbamyl chloride Hydrolysis/does not persist in water
Bis(chloromethyl)ether Hydrolysis/does not persist in water
Diethyl ether Discharged in low amounts from eight facilities (1,350 lbs/yr)
Cyclohexane Discharge in low amounts from four facilities (491 lbs/yr)
Dimethylamine Discharged in low amounts from one facility (756 lbs/yr)
Table 6-4 (Continued)
Pollutant Reason for Exclusion
6-20
Methylamine Discharged in low amounts from two facilities (310 lbs/yr)
Furfural Discharged in trace amounts from one facility (4 lbs/yr)
2-Methylpyridine Discharged from one facility (48,800 lbs/yr), unique to one facility
Trichlorofluoromethane Discharged in low amounts from one facility (13,850 lbs/yr), unique to onefacility
6-21
1. Natural Resources Defense Council, Inc, et al., v. Russel E. Train, 8 ERC 2120(D.D.C. 1976) modified and Natural Resources Defense Council, Inc., et al., v.Douglas M. Costle, 12 ERC 1833 (D.D.C. 1979).
2. U.S. EPA, Office of Water Regulations and Standards. Preliminary DataSummary for the Pharmaceutical Manufacturing Point Source Category, EPA440/1-89/084, U.S. Environmental Protection Agency, Washington, D.C. September 1989.
REFERENCES
7-1
SECTION 7
DESCRIPTION OF THE CONTROL AND TREATMENT OPTIONS
7.1 Introduction
This describes the control and treatment options considered by the Agency for promulgation of
BPT, BCT, BAT, NSPS, PSES and PSNS effluent limitations guidelines and standards for the
pharmaceutical manufacturing industry. The following information is presented in this section:
C 7.2 discusses the pollution prevention measures and major wastewatertreatment technologies used by the industry; and
C Section 7.3 discusses the development of control and treatment options.
7.2 Pollution Prevention Measures and Wastewater Treatment Technologies inthe Pharmaceutical Manufacturing Industry
This describes pollution prevention practices and major wastewater treatment technologies used
in the pharmaceutical manufacturing industry according to responses to the Detailed
Questionnaire. 7.2.1 defines pollution prevention and describes how pollution prevention
techniques are implemented in the industry. Sections 7.2.2 through 7.2.11 describe the major
wastewater treatment technologies used in the industry based on responses to the Detailed
Questionnaire. These treatment technologies include:
C Advanced biological treatment (7.2.2):C Multimedia filtration (7.2.3);C Polishing pond treatment (7.2.4);C Cyanide destruction (7.2.5);C Steam Stripping and Steam Stripping with Rectification (7.2.6);C Granular activated carbon adsorption (7.2.7);C pH adjustment/neutralization (7.2.8);C Equalization (7.2.9); C Air stripping (7.2.10); andC Incineration (7.2.11).
7-2
Each technology includes a general description of how the technology works, what types of
pollutants the technology treats, and how the pharmaceutical manufacturing industry currently
uses the technology.
Table 7-1 presents the total number of facilities (out of the 244 facilities responding to the
Detailed Questionnaire) that reported using each of these major technologies.
7.2.1 Pollution Prevention
The Agency examined pollution prevention practices in an effort to incorporate pollution
prevention into the regulatory options developed. Although shown to be effective at reducing
pollutant loadings and volumes of wastes generated at pharmaceutical manufacturing facilities,
pollution prevention measures were not incorporated into the various technology options
considered as bases for the final limitations and standards because of obstacles specific to the
pharmaceutical manufacturing industry. However, the Agency believes that numerous facilities
will choose to integrate pollution prevention practices into a cost-effective strategy to comply
with the final effluent limitations guidelines and standards, where site-specific circumstances allow
them to do so. This provides a general description of pollution prevention as it applies to the
pharmaceutical manufacturing industry, and discusses the Agency's efforts to incorporate
pollution prevention into the regulatory development process.
7.2.1.1 General Description
Pollution prevention is defined as the use of materials, processes, or practices that reduce or
eliminate the creation of pollutants or wastes at the source. Also known as source reduction,
pollution prevention includes practices that reduce the use of hazardous and nonhazardous
materials, energy, water, or other natural resources. With the Pollution Prevention Act of 1990,
Congress established pollution prevention as a national policy, declaring that the creation of
pollutants should be prevented or reduced during the production cycle whenever feasible. (1)
7-3
Pollution prevention in the manufacturing community can be achieved by changing production
processes to reduce or eliminate the generation of waste at the source. Pollution control and
Examples of pollution prevention activities reported by pharmaceutical manufacturing facilities
include the following:
C Product Changes - Eliminate product packaging, and reformulate vitaminproduct filmcoats to remove volatile organic pollutants.
C Input Material Process Changes - Eliminate and/or reduce acetic acid,acetone, aerosols, chloroform, methanol, methylene chloride, toluene, and1,1,1-trichloroethane from various production processes.
C Technology Process Changes - Install solvent recovery units; implementautomated cleaning system for wastewater reduction; design closed-loopsolvent recovery units for all new processes; and replace solvent-basedcleaning units with water-based cleaning units.
C Improved Operating Practices - Separate nonquality products frombatches earlier in production process; improve reclamation systems and
7-8
distillation capabilities; combine solvent waste streams to avoid need formultiple recovery systems; and reduce overall waste solvent generation.
requirements, sludge production, substrate removal rate constant (K), and percent BOD of5
effluent TSS. Pharmaceutical manufacturing industry averages for some of these parameters are
presented in the following table.
Parameter Average AverageSubcategories A and C Subcategories B and D
Food to Microorganism Ratio (lb/lb/day) 0.561 0.054MLSS (mg/L) 5,521 3,443Sludge Retention Time (hours) 33.0 22.9K 11.14 2.06%BOD of TSS 23 245
Ammonia treatment by nitrification is achieved in biological treatment units by incorporating two
additional sets of autotrophic microorganisms. The first set of microorganisms (Nitrosomonas
bacteria) converts ammonia to nitrites and the second set (Nitrobacter bacteria) converts nitrites
to nitrates. These microorganisms are maintained in the treatment tank in a similar fashion as the
microorganisms described above (addition of oxygen, nutrients, etc). Nitrification can be
accomplished in either a single or two-stage activated sludge system. Indicators of nitrification
capability are 1) biological monitoring for ammonia oxidizing bacteria (AOB) and nitrite oxidizing
bacteria (NOB) to determine if nitrification is occurring, and 2) analysis of the nitrogen balance to
determine if nitrifying bacteria reduce the amount of ammonia and increase the amount of nitrite
and nitrate. Common design criteria for single and two-stage systems with nitrification capability
are:
Parameter Single Stage Two-Stage
Suspended growth Food/Microorganism ratio 0.05-0.15 <0.15(g BOD /g MLVSS/d)5
Sludge retention time (days) 20-30 10-20
MLVSS (mg/L) 2,000 - 3,000 1,500 - 2,500
pH (standard units) 7.2 - 8.5 7.2 - 8.5
7-14
7.2.2.2 Industry Application
Based on responses to the Detailed Questionnaire, 58 of 244 responding facilities in the
pharmaceutical manufacturing industry use some form of activated sludge treatment process, 12
use aerated lagoons, 5 use trickling filters, and 3 use RBC treatment. Most of these facilities are
operated at or near the facility off-site wastewater discharge point (end-of-pipe). There are no
specific data regarding whether the treatment units are used primarily to reduce concentrations of
conventional pollutants or organic constituents in the wastewater. However, it is likely that these
systems were initially designed to treat BOD and COD.5
7.2.3 Multimedia Filtration
7.2.3.1 General Description
Multimedia filtration is used in the pharmaceutical manufacturing industry to reduce TSS in
wastewater. This technology may also serve to treat BOD in wastewater by removing BOD5 5
associated with particulate matter. A multimedia filtration system operates by introducing a
wastewater to a fixed bed of inert granular media. Suspended solids are removed from the
wastewater by one or more of the following processes: straining, interception, impaction,
sedimentation, and adsorption. This operation is continued until there is either solids
"breakthrough" (solids concentration increases to an unacceptable level in the discharge from the
bed), or the head loss across the bed becomes too great (due to trapped solids) to operate the bed
efficiently.
If either of these conditions occurs, the bed must be cleaned by backwashing before it can be
operated effectively again. Backwashing usually is accomplished by reversing the flow to the bed
and introducing a "clean" stream of wash water. Wash water is introduced until the bed becomes
fluidized (expanded). At this point, the solids are washed from the bed and carried away from the
unit. It is common to return the backwashed solids stream to the biological treatment system (if
applicable).
7-15
In multimedia filtration, a series of layers, each with a progressively smaller grain size medium
(traveling from inflow to outflow of the bed) are used in the filtration bed. This design allows
solids to penetrate deeper into the bed before becoming fixed, thus increasing the capacity of the
bed and decreasing the buildup of head loss in the unit. Typical filtration media include garnet,
crushed anthracite coal, resin beads, and sand. Though downflow (gravity flow) systems are the
most common, upflow and biflow (influent is introduced above and below the filter medium, and
the effluent discharges from the center of the filter medium) filtration units can also be used.
Figure 7-2 shows a cross-of a typical downflow, multimedia filtration bed. (4)
Some key design parameters associated with multimedia filtration units include wastewater flow
rate, hydraulic loading rate, and filter medium depth. The following table shows ranges of values
for each of these parameters for treatment units currently operated in the pharmaceutical
manufacturing industry.
Parameter Range Units
Flow Rate 0.03 - 2.18 MGDHydraulic Loading Rate 2.0 - 5.0 gpm/ftDepth of Medium 6 - 72 inches
2
7.2.3.2 Industry Application
Based on responses to the Detailed Questionnaire, 6 of 244 responding pharmaceutical
manufacturing facilities use multimedia filtration treatment. This treatment is generally performed
after biological treatment (if applicable) for additional TSS removal prior to wastewater
discharge. Multimedia filtration can also provide limited treatment of BOD by removing the5
BOD load associated with suspended solids. The following is the breakdown of specific5
applications of multimedia filtration treatment in the industry: four facilities use multimedia
filtration as a tertiary wastewater treatment, one facility uses it to treat noncontact cooling water
prior to recycle, and one facility uses it as a treatment prior to granular activated carbon (GAC)
treatment.
7-16
Figure 7-2. Typical Downflow Multimedia Filter Bed
7-17
7.2.4 Polishing Pond
7.2.4.1 General Description
Polishing ponds are used in the pharmaceutical manufacturing industry to remove TSS from
wastewater using gravity settling. Some BOD removal associated with the settling of suspended5
solids may also occur.
The wastewater is introduced at one end of the pond and ultimately flows out the other end. The
pond is designed such that the water retention time is long enough and the water velocity is slow
enough to allow solids to fall out of suspension. If the flow is too fast, or other mixing is added
to the system, solids may be maintained in suspension and discharged from the pond.
To avoid anaerobic conditions in the bottom portion of the pond, these units must be designed to
be shallow, which may require a large land area if flow to the unit is high. Depths of polishing
ponds currently used in the industry range from 2.5 to 14 feet. Retention times range from 0.2 to
14.6 days. In the past, polishing ponds have been designed with an earthen liner only; however,
current regulations require installation of a minimum of two liners and a leak detection system (40
CFR 264.221) for most new applications to this industry. Polishing ponds will accumulate solids
over time and will therefore require periodic cleanout.
7.2.4.2 Industry Application
Based on responses to the Detailed Questionnaire, 8 of 244 responding pharmaceutical
manufacturing facilities use polishing ponds to treat wastewater. This treatment is not currently
common in the industry, and because of increasing regulatory requirements governing the use of
ponds (surface impoundments), facilities have limited plans for installation of more of these units.
For the facilities that use polishing ponds, this technology is generally used to treat wastewater
just prior to discharge to the receiving stream or POTW.
7-18
7.2.5 Cyanide Destruction
7.2.5.1 General Description
Several cyanide destruction treatment technologies are currently used in the pharmaceutical
manufacturing industry, including alkaline chlorination, hydrogen peroxide oxidation, and basic
hydrolysis. The alkaline chlorination treatment process involves reacting free cyanide with
hypochlorite (formed by reacting chlorine gas with an aqueous sodium hydroxide solution) to
form nitrogen and carbon dioxide. The reaction is a two-step process and is normally performed
separately in two reactor vessels. Because treatment is normally performed in batches, it is
necessary to use an additional equalization tank to store accumulated wastewater during
treatment. The reactors need to be equipped with agitators, and both reaction steps require close
monitoring of pH and oxidation/reduction potential (ORP). These reactions are normally
performed at ambient temperatures. (5)
Hydrogen peroxide treatment involves adding hydrogen peroxide to cyanide-bearing wastewater
to convert free cyanide to ammonia and carbonate ions. This treatment is normally performed
batch-wise in a reaction vessel or vessels. The treatment process consists of heating the
wastewater to approximately 125EF and adjusting the pH in the reaction vessel to approximately
11. Hydrogen peroxide is added to the vessel and is allowed to react for approximately one hour.
Required equipment for this process includes reaction vessel(s), storage vessels for hydrogen
peroxide and a pH adjustment compound (typically sodium hydroxide), an equalization tank, and
feed systems for hydrogen peroxide and sodium hydroxide.(5)
Hydrolysis treatment involves reacting free cyanide with water under basic conditions to produce
formate and ammonia. This process requires approximately one hour to proceed and is typically
performed at a temperature between 170 and 250EC, and at a pH of between 9 and 12.
Hydrolysis is normally performed in a reactor vessel equipped with a heat exchanger and a system
to store and deliver sodium hydroxide (or other basic compound).
7-19
7.2.5.2 Industry Application
Based on responses to the Detailed Questionnaire, 10 of 244 responding pharmaceutical
manufacturing facilities use cyanide destruction treatment. Of these, six use alkaline chlorination,
three use hydrogen peroxide oxidation, and one uses hydrolysis. Most of these facilities apply the
cyanide destruction technologies in the process area that generates the cyanide-bearing
wastewater, and most of the treatment units are operated in batch mode.
7.2.6 Steam Stripping and Steam Stripping with Rectification
Steam stripping and steam stripping with rectification are used both in industrial chemical
production (for chemical recovery and/or recycle) and in industrial waste treatment to remove
gases and/or organic chemicals from wastewater streams by providing steam to a tray or packed
column. Under both technologies, differences in relative volatility between the organic chemicals
and water are used to achieve a separation. The more volatile components of the feed mixture
concentrate in the vapor, while the less volatile components concentrate in the liquid residue
(bottoms). Steam stripping and steam stripping with rectification are effective treatment for a
wide range of aqueous streams containing organics and ammonia. Appropriately designed and
operated columns can treat a variety of waste streams ranging from wastewaters containing a
single volatile constituent to complex organic/inorganic mixtures. Steam stripping and steam
stripping with rectification can be used both as in-plant processes to recover concentrated
organics from aqueous streams and as end-of-pipe treatment to remove organics from
wastewaters prior to discharge or recycle. For most effective wastewater treatment, columns
should be placed after the process generating the wastewater and before the wastewater is
combined with other wastewater that does not contain the pollutants being treated. Wastewater
with high concentration and low flow is easier and less expensive to treat than wastewater with
high flow and/or low concentration. In addition, the amount of volatiles emitted to the air can be
minimized if columns are placed prior to exposure of the wastewater stream to the atmosphere.
7-20
7.2.6.1 General Description
Steam stripping and steam stripping with rectification can be conducted as either a batch or
continuous operation in a packed tower or fractionating column (sieve tray or bubble cap) with
more than one stage of vapor-liquid contact. In a steam stripping column, the wastewater feed
enters near the top of the column and then flows downward by gravity, countercurrent to the
steam which is introduced at the bottom of the column. In a steam stripping with rectification
column, the wastewater feed enters lower down the column to allow for a rectification above the
feed. In the rectification section, a portion of the condensed vapors are refluxed to the column to
countercurrently contact the rising vapors. This process concentrates the volatile components in
the overhead stream.
Steam may either be directly injected or reboiled, although direct injection is more common. The
steam strips volatile pollutants from the wastewater, which are then included in the upward vapor
flow. As a result, the wastewater contains progressively lower concentrations of volatile
compounds as it moves toward the bottom of the column. The extent of separation is governed
by physical properties of the volatile pollutants being stripped, the temperature and pressure at
which the column is operated, and the arrangement and type of equipment used.
The difference between steam stripping columns and steam stripping with rectification columns is
the location of the feed stream. Stripping columns have a feed stream located near the top of the
column while steam stripping with rectification columns have a feed stream located further down
the column. Pollutants that phase separate from water can usually be stripped from the
wastewater in a steam stripper (a column without rectifying stages). Pollutants that are not
phase-separable, such as methanol, need a column with rectifying stages to achieve a high
concentration of the pollutants in the overhead stream.
The ancillary equipment used in conjunction with steam stripping and steam stripping with
rectification columns includes a condenser and subcooler, pumps for the feed, overhead, bottoms,
and reflux streams, a feed preheater and bottoms cooler, a decanter, a storage tank, a distillate
tank, and an air pollution control device to contain any vapors from the condenser. The
7-21
condenser and subcooler condense and cool the overhead stream to a temperature amenable for
storage and disposal. The pumps supply the force to move the waste stream: either into the
column at the feed position or at a point above the feed in the case of a reflux stream. The
bottoms pump moves the bottoms from the stripping column to the bottoms cooler, and the
overheads distillate pump moves the distillate from the decanter to the distillate receiver tank.
The feed preheater/bottoms cooler is a heat exchanger that heats the feed before it enters the
column at the same time it cools the bottoms stream so that it can be sent to a storage area or
treatment system. The decanter separates the aqueous layer from the organic layer after the
stream comes from the condenser and subcooler. The aqueous layer can be refluxed back to the
column while the organic layer is usually disposed of or reused. The storage tank provides a
steady feed for the steam stripper column, equalizing flow and waste variability. An air pollution
control device may be needed to contain any pollutants that do not condense in the condenser and
would otherwise escape to the air. Wet scrubbers, carbon adsorption devices, or venting to a
combustion device may be used to control air emissions. Figure 7-3 shows a flow diagram of a
typical steam stripping treatment system and Figure 7-4 shows a flow diagram of a typical steam
stripping with rectification treatment system.
The typical construction material for steam stripping and steam stripping with rectification
columns in the pharmaceutical manufacturing industry is stainless steel. If a wastewater stream is
highly corrosive, a more corrosion-resistant material, such as Hastelloy or Teflon®-lined carbon
steel, may be required for construction of the column. The majority of pharmaceutical
manufacturing facilities which currently use steam stripping and/or steam stripping with
rectification columns to treat their wastewater use stainless steel.
Salts and other pollutants may contribute to scaling and corrosion inside the column. Timely
maintenance should be provided to deter scaling problems. Costs of these measures are discussed
in 10.
The key design parameters for stripping columns are the steam-to-feed ratio and the number of
trays or equilibrium stages in packed columns. These parameters are calculated using the
7-22
Figure 7-3. Steam Stripping Column Diagram
7-23
Figure 7-4. Steam Stripping and Rectification Column Diagram
7-24
equilibrium ratio of the least strippable contaminant in the wastewater stream and the removal
efficiency required to treat the contaminant to the desired concentration. Typical ranges for
steam-to-feed ratios vary from 1:3 to 1:35, and the typical number of trays or equilibrium stages
vary from 2 to 20. Generally, columns with smaller diameters are packed while columns with
larger diameters have trays. Typical column packings are Pall rings, Rashing rings, Berl saddles,
and Intalox saddles.
7.2.6.2 Industry Application
In responses to the Detailed Questionnaire, 61 of 244 responding facilities in the pharmaceutical
manufacturing industry reported using steam stripping with rectification for solvent recovery
operations. Fourteen facilities reported using steam strippers for wastewater treatment.
However, a review of these 14 facilities resulted in a determination by the Agency that only four
were actually using the technology for wastewater treatment, while the other ten facilities were
using the strippers for solvent recovery purposes. Steam stripping and steam stripping with
rectification columns are currently used in this industry as stand-alone treatment or as
pretreatment before biological treatment. They are also used to recover specific constituents from
waste streams. Direct dischargers tend to use steam stripping or steam stripping with rectification
as a pretreatment before biological treatment more frequently than as a stand-alone treatment,
whereas indirect dischargers tend to use steam stripping or steam stripping with rectification more
as a stand-alone treatment or to recover a specific constituent from the waste stream.
7.2.7 Granular Activated Carbon Adsorption
7.2.7.1 General Description
Granular activated carbon (GAC) adsorption is used in the pharmaceutical manufacturing industry
to treat BOD , COD, or organic constituents in wastewater. Adsorption is a process in which5
soluble or suspended materials in water are bonded onto the surface of a solid medium. Activated
carbon is an excellent medium for this process because of its high internal surface area, high
7-25
attraction to most adsorbates (the constituents to be treated), and the fact that it is hydrophobic
(water will not occupy bonding sites and interfere with the adsorption process). Constituents in
the wastewater bond onto the GAC grains until all surface bonding sites are occupied. At this
point, the carbon is considered to be "spent", and requires regeneration, cleaning, or disposal.
Activated carbon is normally produced in two standard grain sizes: powdered activated carbon
(PAC) with diameters less than a 200 mesh, and GAC with diameters greater than 0.1 mm. PAC
is generally added to the wastewater, whereas GAC is normally used in flow-through fixed bed
units.
For treatment units, GAC is packed into one or more beds or columns. Multiple beds are more
common, and are normally operated in series because this design allows for monitoring between
beds, and therefore minimizes the risk of discharging wastewater from the system with
concentrations above acceptable levels. Wastewater flows through a bed and is allowed to come
in contact with all portions of the GAC. The GAC in the upper layers of the bed is spent first as
bonding sites are occupied, and the GAC in progressively lower regions is spent over time as the
adsorption zone moves down through the unit. When contaminant concentrations begin to
increase at the bottom of the bed above acceptable levels, the bed is considered to be spent and
must be removed. The above description assumes that beds are operated in downflow mode;
however, it is also possible to use an upflow design for GAC systems.
Once a bed is spent, the carbon can be treated in three ways: regeneration, backwash, or disposal.
Normally, it is possible to use high heat (1,500 to 1,700E F), steam, or chemical treatment to
regenerate the spent carbon. These processes remove contaminants from the carbon without
significantly affecting the carbon itself; however, some carbon is lost each time this procedure is
performed, and carbon performance decreases slightly with each regeneration. Because the bonds
formed between the GAC and the adsorbate are not generally strong, it may also be possible to
backwash the carbon bed as described in 7.2.3. If the carbon cannot be regenerated or
backwashed, it must be disposed of as a solid waste.
7-26
The performance of GAC treatment units can be affected by several factors. Three important
design criteria are saturation loading, wastewater TSS concentration, and hydraulic loading.
Saturation loading is a treatment performance coefficient relating mass of contaminant adsorbed
versus mass of carbon used. If this coefficient is very low (as is the case for highly soluble
constituents), a GAC system will not perform efficiently. Parameters that effect solubility (i.e.,
pH and temperature) must also be considered when calculating a design saturation loading for a
system. High TSS concentrations in wastewater will foul the GAC system. Solids will occupy
bonding sites on the carbon and will get plugged in the pore spaces between GAC grains. If this
happens, head loss may occur and a portion of the carbon bed will not be used for treatment.
Flushing to remove solids can upset the mass flux zone in the GAC system. In some cases, it may
be necessary to install some type of filtration prior to GAC treatment to keep TSS concentrations
within acceptable limits. The effectiveness of GAC can only improve with lower TSS, and ideally,
TSS levels in the influent should be as close to zero as possible. The amount of time the
wastewater spends in contact with the GAC is directly related to hydraulic loading rate. If this
time is not long enough, effluent contaminant concentrations will be higher than expected.(3)(4)
7.2.7.2 Industry Application
Based on responses to the Detailed Questionnaire, 10 of 244 responding pharmaceutical
manufacturing facilities use GAC treatment to reduce concentrations of organic constituents (and
BOD and COD) in wastewater. This treatment is generally used to treat wastewater directly5
from a production area or somewhere prior to the facility treatment plant. GAC treatment can
also be used to remove organics following biological treatment.
7.2.8 pH Adjustment/Neutralization
7.2.8.1 General Description
Because many treatment technologies used in the pharmaceutical manufacturing industry are
sensitive to pH fluctuations, pH adjustment, or neutralization, may be required as part of an
7-27
effective treatment system. A pH adjustment system normally consists of a small tank (10 to 30
minutes retention time) with mixing and a chemical addition system. To adjust pH to a desired
value, either acids or caustics can be added in the mixing tank. Some treatment technologies
require a high or low pH to effectively perform treatment (e.g., air stripping of ammonia requires
a pH of 10 to 11). pH is generally adjusted to between 6 and 9 prior to final discharge.
7.2.8.2 Industry Application
Based on responses to the Detailed Questionnaire, 126 of 244 responding facilities in the
pharmaceutical manufacturing industry use pH adjustment or neutralization treatment of wastes.
Retention times for these treatment units average approximately one hour.
7.2.9 Equalization
7.2.9.1 General Description
Because many of the treatment technologies listed in this are performed continuously and some
are sensitive to spikes of high flow or high contaminant concentrations, it is necessary to include
equalization as a part of most treatment systems. Equalization is normally performed in large
tanks or basins designed to hold a certain percentage of a facility's daily wastewater flow.
Equalization will equalize high- and low-flow portions of a typical production day by allowing
wastewater to be discharged to downstream treatment operations at a constant flow rate.
Equalization can also provide a continuous wastewater feed to operations such as biological
treatment that perform more effectively under continuous load conditions.
The mixing that occurs in an equalization basin minimizes spikes of various contaminants in the
discharged wastewater. This equalization will prevent loss of treatment effectiveness or treatment
system failures associated with these spikes.
7-28
7.2.9.2 Industry Application
Based on responses to the Detailed Questionnaire, 70 of 244 responding facilities in the
pharmaceutical manufacturing industry use equalization. Retention times for these treatment units
average approximately 20 hours.
7.2.10 Air Stripping
7.2.10.1 General Description
Air stripping is used in the pharmaceutical manufacturing industry to remove volatile organic
constituents from wastewater. Air stripping can also be used to remove ammonia from
wastewater. Air stripping is normally performed in a countercurrent, packed tower or tray tower
column. In these systems, the wastewater is introduced at the top of the column and allowed to
flow downward through the packing material or trays. Air is simultaneously delivered at the
bottom of the column and blows upward through the water stream. Volatile organics are stripped
from the water stream, transferred to the air stream, and carried out of the system at the top of the
column. Treated water discharges from the bottom of the column. If ammonia treatment is
desired, the pH of the waste stream would be adjusted to between 10 and 11 prior to introduction
to the column.
7.2.10.2 Industry Application
Based on responses to the Detailed Questionnaire, 2 of 244 responding pharmaceutical
manufacturing facilities use air strippers to treat wastewater. This technology is not common in
the industry, and its use has decreased due to increasingly strict air emission regulations. Because
the standard air stripper design simply transfers pollutants from water to air, the Agency does not
regard it as an acceptable treatment technology and is not including air stripping as part of the
technology base of any of the regulatory options.
7-29
7.2.11 Incineration
7.2.11.1 General Description
Incineration is used in the pharmaceutical manufacturing industry to treat organic and inorganic
constituents in wastewater. This treatment is typically performed in a fixed bed or multiple hearth
incinerator equipped with an acid gas scrubber for control of generated hydrochloric acid.
Contaminants in the wastewater are destroyed by combustion and the remaining water vapor is
discharged to the atmosphere.
7.2.11.2 Industry Application
Based on responses to the Detailed Questionnaire, 12 of 244 responding pharmaceutical
manufacturing facilities use incinerators to treat wastewater. Because incineration is costly and
energy-intensive when used to treat high-water content streams and does not allow for direct
recycle or reuse of constituents contained in wastewater, the Agency is not including incineration
as part of the technology basis for any of the regulatory options.
7.3 Development of Control and Treatment Options
7.3.1 Introduction
This describes the combinations of treatment technologies that the Agency evaluated as
technology options for the basis of the promulgated regulations:
C Best practicable control technology currently available (BPT);C Best conventional pollutant control technology (BCT);C Best available technology economically achievable (BAT);C New source performance standards (NSPS);C Pretreatment standards for existing sources (PSES); andC Pretreatment standards for new sources (PSNS).
7-30
Treatment technologies for each option are selected from the list of technologies presented in 7.2,
and include advanced biological treatment, advanced biological treatment with nitrification,
cyanide destruction, and steam stripping. In addition, BCT was also evaluated for additional TSS
removal using multimedia filtration and polishing pond treatment.
These promulgated regulations establish limits on the discharge of pollutants from industrial point
sources. The regulations are based upon the performance of specific technologies, but do not
require the use of any specific technology. The regulations applicable to direct dischargers (BPT,
BCT, BAT, NSPS) are effluent limitations guidelines and standards that are applied to individual
facilities through NPDES permits issued by EPA or authorized states under 402 of the CWA.
The regulations applicable to indirect dischargers (PSES, PSNS) are standards, and are
administered by local permitting authorities (i.e., the government entity controlling the POTW to
which the industrial wastewater is discharged). The final pretreatment standards are designed to
control pollutants that pass through or interfere with POTWs.
The treatment technologies that form the basis of the BPT options were selected to provide
reduction of BOD , COD, and TSS, in pharmaceutical manufacturing wastewater. The treatment5
technologies that form the basis of the BCT options were selected to provide reduction of BOD5
and TSS beyond the removals of these pollutants achieved by BPT effluent limitations guidelines.
The treatment technologies that form the basis of BAT, PSES, NSPS, and PSNS options were
selected to provide reduction of organic constituents, COD, ammonia, and cyanide. 6 identifies
the list of organic constituents regulated by these options.
Sections 7.3.2 through 7.3.7 provide discussions of each of the regulatory options described
above, including the treatment technologies that form the basis of each option, and the rationale
for the development of each of the options. Technologies included under each regulatory option
may vary by subcategory and are therefore presented in separate subsections for Subcategories
A and C and Subcategories B and D, respectively. Table 7-3 summarizes the regulatory options,
identifying the treatment technologies included under each one.
7-31
7.3.2 Best Practicable Control Technology Currently Available (BPT)
Effluent limitations guidelines based on the best practicable control technology currently available
establish quantitative limits on the direct discharge of pollutants from existing industrial point
sources. BPT effluent limitations guidelines are based upon the average of the best existing
performance, generally in terms of treated effluent discharged by facilities of various sizes, ages,
and unit processes within an industry or subcategory. BPT effluent limitations guidelines are most
commonly developed for the control of conventional and nonconventional pollutants, but also
may be used for the control of priority pollutants.
In developing BPT, the Agency considers the total cost of applying the technology in relation to
the effluent reduction benefits to be achieved from the technologies; the size and age of equipment
and facilities; the processes used; the engineering aspects of applying various types of control
techniques; process changes; and nonwater quality environmental impacts, including energy
requirements.
7.3.2.1 Subcategories A and C
EPA considered five regulatory options as BPT for Subcategories A and C as part of the
development of the proposed effluent limitations guidelines for the pharmaceutical manufacturing
industry. These options are discussed in detail in the technical development document supporting
the proposed rule, and are not discussed further in this section. In the May 2, 1995 proposal, the
selected options were based on the application of advanced biological treatment. After gathering
additional data after proposal and reviewing comments on the proposed rule and the supplemental
Notice of Availability to the proposed rule, the Agency considered four options for the final BPT
limitations for Subcategories A and C. Under the first option, EPA would not revise the existing
BPT limitations for BOD , TSS, COD and cyanide. Under the second option, EPA would revise5
the BPT limitations based on advanced biological treatment only for COD, and revise the
monitoring requirements for the existing cyanide limitations. Under option three, EPA would
revise BPT limitations for BOD and TSS based on advanced biological treatment and revise the5
monitoring requirements for the existing cyanide limitations. Under the fourth option, EPA
7-32
would revise BPT limitations for BOD , TSS, and COD based on advanced biological treatment,5
and revise the monitoring requirements for the existing cyanide limitations. The three options
with advanced biological treatment are based on a system installed immediately prior to the off-
site wastewater discharge point (end-of-pipe). As discussed in 8, advanced biological treatment
provides significant removal of BOD , COD, and TSS and is widely used in the pharmaceutical5
manufacturing industry.
7.3.2.2 Subcategories B and D
EPA considered three regulatory options as BPT for Subcategories B and D as part of the
development of the proposed effluent limitations guidelines for the pharmaceutical manufacturing
industry. These options are discussed in detail in the technical development document supporting
the proposed rule, and are not discussed further in this section. In the May 2, 1995 proposal, the
selected options were based on the application of advanced biological treatment. After gathering
additional data after proposal and reviewing comments on the proposed rule and the supplemental
Notice of Availability to the proposed rule, the Agency considered four options for the final BPT
limitations for Subcategories B and D. Under the first option, EPA would not revise the existing
BPT limitations for BOD , TSS, COD and withdraw the existing cyanide limitations. Under the5
second option, EPA would revise the BPT limitations based on advanced biological treatment
only for COD, and withdraw the existing cyanide limitations. Under option three, EPA would
revise BPT limitations for BOD and TSS based on advanced biological treatment and withdraw5
the existing cyanide limitations. Under the fourth option, EPA would revise BPT limitations for
BOD , TSS, and COD based on advanced biological treatment, and withdraw the existing cyanide5
limitations.
7.3.2.3 Rationale
Advanced biological treatment is the basic treatment in each of the technology options described
above. Biological treatment is a well-established method for treating BOD and COD in5
wastewater and is the most common method in the pharmaceutical manufacturing industry for
treating BOD . Of the facilities in the industry that reported using biological treatment, 74% use5
7-33
the activated sludge process. The secondary clarifier, which is a standard component of the
biological treatment system, provides TSS treatment of the wastewater prior to discharge from
the system.
The treatment performance of these regulatory options considered for promulgation is discussed
in 8.
7.3.3 Best Conventional Pollutant Control Technology (BCT)
Effluent limitations guidelines based on the best conventional pollutant control technology
establish quantitative limits on the direct discharge of conventional pollutants from existing
industrial point sources. In contrast to BPT guidelines that are devised as the average of the best
existing performance by a group of like facilities, BCT guidelines are developed by identifying
candidate technologies and evaluating their cost-reasonableness. Effluent limitations guidelines
based upon BCT may not be less stringent than BPT effluent limitations guidelines. As such, BPT
effluent limitations are a "floor" below which BCT effluent limitations guidelines cannot be
established. EPA uses a BCT cost test methodology in determining whether it is "cost-
reasonable" for industry to control conventional pollutants at a level more stringent than would be
required by BPT effluent limitations. This methodology is fully described in 14.
In performing the BCT cost test, a BPT baseline must be developed to serve as the starting point
against which more stringent technologies are analyzed. In each subcategory at proposal, EPA
conducted the BCT analysis assuming the baseline was the proposed BPT level of advanced
biological treatment. EPA received comments that this was not an appropriate choice for the
BPT baseline, and that instead the level of control associated with the existing BPT effluent
limitations guidelines should be used as the BPT baseline in the cost test. In consideration of
these comments, EPA has modified the BPT baseline in the cost test to be equal to the level of
control associated with the existing BPT effluent limitations guidelines.
7-34
7.3.3.1 Subcategories A and C
The BCT treatment options for Subcategories A and C are the same as the BCT options
considered at proposal: a no revision option; revision of BOD , TSS and COD based on5
advanced biological treatment; revision of BOD and TSS based on advanced biological treatment5
and effluent filtration; revision of BOD and TSS based on advanced biological treatment and5
polishing ponds; and revision of BOD and TSS based on advanced biological treatment and5
effluent filtration and polishing ponds.
7.3.3.2 Subcategories B and D
The BCT treatment options for Subcategories B and D are the same as the BCT options
considered at proposal: a no revision option; revision of BOD and TSS based on advanced5
biological treatment; and revision of BOD and TSS based on advanced biological treatment and5
effluent filtration.
7.3.3.3 Rationale
The rationale for the use of advanced biological treatment under BCT is the same as that
presented for BPT. EPA also evaluated whether additional TSS control using effluent filtration
and/or polishing ponds was cost reasonable under the BCT cost test. TSS is a conventional
pollutant present at significant levels and effluent filtration and polishing ponds provide a greater
degree of control of TSS than advanced biological treatment.
7.3.4 Best Available Technology Economically Achievable (BAT)
Effluent limitations guidelines based on the best available technology economically achievable
establish quantitative limits on the direct discharge of priority and nonconventional pollutants to
waters of the United States. These limits are based upon the performance of specific
technologies, but they do not require the use of any specific technology. BAT effluent limitations
guidelines are applied to individual facilities through NPDES permits issued by EPA or authorized
7-35
states under 402 of the CWA. The facility then chooses its own approach to complying with its
permit limitations.
The technology selected by the Agency to define the BAT performance may include end-of-pipe
treatment, process changes, and internal controls, even when these technologies are not common
industry practice. BAT performance is established for groups of facilities with shared
characteristics. Where a group of facilities demonstrates uniformly inadequate performance in
controlling pollutants of concern, BAT may be transferred from a different subcategory or
industrial category.
A primary consideration in selecting BAT is the effluent pollutant reduction capability of the
available technologies. Implementation of the best available technology must be economically
achievable by the industry, so the cost of applying the technology is also considered. Other
factors considered in establishing BAT include:
C The processes used;
C Engineering aspects of the application of various types of controltechniques;
C Potential process changes;
C Age and size of equipment and facilities; and
C Nonwater quality environmental impacts, including energy requirements.
7.3.4.1 Subcategories A and C
EPA considered four regulatory options as BAT for Subcategories A and C as part of the
development of the proposed effluent limitations guidelines for the pharmaceutical manufacturing
industry. These options are discussed in detail in the technical development document supporting
the proposed rule, and are not discussed further in this section. In the May 2, 1995 proposal, the
selected options were based on the application of in-plant steam stripping and hydrogen peroxide
7-36
oxidation followed by end-of-pipe advanced biological treatment for Subcategories A and C, and
application of end-of-pipe advanced biological treatment for Subcategories B and D.
After proposal, the Agency gathered additional data and reviewed comments on the proposed rule
and the Supplemental Notice of Availability to the proposed rule. The Agency also considered
the regulatory effects of the Maximum Achievable Control Technology (MACT) standards for the
Pharmaceutical Manufacturing Industry, which were proposed on April 2, 1997, to control
emissions of Hazardous Air Pollutants (HAPs) from storage tanks, process vents, equipment
leaks, and wastewater. The MACT standards, for releases from wastewater, provide for in-plant
control, or equivalent control of the wastestreams that contain sufficient quantities of volatile
organic pollutants. Since the wastestreams that require control by in-plant steam stripping will
receive that control under MACT, the Agency has decided to change its model BAT technology
basis for VOCs to avoid duplicative regulations. As a result of this additional data and associated
analyses, EPA considered three options as the basis of promulgated regulations. All three options
modify the existing BAT regulations to parallel the BPT regulations and to clarify the compliance
monitoring point for the existing cyanide limitations. The first option is a no cost revision which
includes revised limitations for COD equal to the final BPT limitations and clarifies the monitoring
requirements for cyanide. The second option adds limitations for 30 organic pollutants based on
advanced biological treatment, revised limitations for COD equal to the final BPT limitations and
clarifies the monitoring requirements for cyanide. The third option adds limitations for 30 organic
pollutants based on advanced biological treatment, ammonia limitations based on one or two stage
biological nitrification technology, incorporates the revised COD limitations and clarifies the
monitoring requirements for cyanide.
7.3.4.2 Subcategories B and D
EPA considered two final BAT regulatory options. The first option is a no cost option consisting
of the withdrawal of the existing cyanide limitations and the addition of the BPT revised COD
limitations. The second option includes the withdrawal of the existing cyanide limitations and the
addition of the BPT revised COD limitations and limitations based only on advanced biological
7-37
treatment for the same organic pollutants selected for regulation at the Subcategory A and C
facilities.
7.3.4.3 Rationale
Advanced biological treatment is the basic treatment operation in the technology options
described above. Advanced biological treatment is a proven method for treating COD and
organic constituents in pharmaceutical manufacturing industry wastewater. Treatment
performance data for advanced biological treatment and the other technologies included in the
BAT options are provided in 8. Of the facilities in the industry that reported using biological
treatment, 74% use the activated sludge process. Biological treatment systems, including
activated sludge systems, can achieve significant ammonia removal through nitrification.
Nitrification can be achieved through adjusting the operating parameters of a single stage system
or by using a two stage system.
In-plant steam stripping, which was considered as a treatment technology in the effluent
guidelines proposal, was not included in the list of BAT regulatory options for promulgation.
Steam stripping was originally included to control highly volatile components that would not be
treated, but would be air stripped. EPA has determined that MACT standards will provide this
control, and these standards have been promulgated concurrently. The inclusion of steam
stripping treatment beyond what is currently provided under the MACT standards for BAT would
be unnecessary and duplicative.
Because cyanide and ammonia are not present at concentrations of concern in Subcategory
B and D wastewaters, cyanide destruction and ammonia treatment are not included under the
Subcategory B and D options.
7.3.5 New Source Performance Standards (NSPS)
The basis for new source performance standards under 306 of the CWA is the best available
demonstrated technology. Industry has the opportunity to design and install the best and most
7-38
efficient processes and wastewater treatment facilities at new facilities. Accordingly, Congress
directed EPA to consider the best demonstrated alternative processes, process changes, in-plant
control measures, and end-of-pipe wastewater treatment technologies that reduce pollution to the
maximum extent feasible. In response to that directive, and as with the development of options
for the BAT effluent limitations guidelines, EPA considered effluent reductions attainable by the
most advanced and demonstrated process and treatment technologies at pharmaceutical
manufacturing facilities.
7.3.5.1 Subcategories A and C
EPA considered two regulatory options as the basis of NSPS for Subcategories A and C as part
of the development of the proposed effluent limitations guidelines for the pharmaceutical
manufacturing industry. These options are discussed in detail in the technical development
document supporting the proposed rule. In the May 2, 1995 proposal, the selected option was
based on the application of in-plant steam stripping with rectification and hydrogen peroxide
oxidation followed by end-of-pipe biological treatment to a treatment level achieved by the best
performing facility for Subcategories A and C. After proposal, the Agency gathered additional
data, reviewed comments on the proposed rule and the Supplemental Notice of Availability to the
proposed rule, and considered the regulatory effects of the MACT standards for the industry.
The MACT standards for releases from wastewater provide for in-plant control (or equivalent) of
the wastestreams that contain sufficient quantities of volatile organic pollutants. Since the
wastestreams that require control by in-plant steam stripping will receive this control under
MACT, the Agency has decided to remove this component of its NSPS technology basis for
VOCs to avoid duplicative regulations.
EPA evaluated technology options capable of achieving greater pollutant removal of conventional
pollutants (BOD and TSS), COD, organics, cyanide, and ammonia than those selected as the5
basis for existing source limitations (BPT, BCT, and BAT). The only option potentially capable
of achieving additional removals involves the use of granular activated carbon (GAC) absorption
technology. This technology is capable of reducing the COD from some direct discharging A and
C Subcategory facilities. However, there is only limited GAC performance data available, from
7-39
one pilot study. EPA ultimately concluded that this study did not provide a sufficient basis to
develop NSPS limitations.
Therefore, EPA considered a single NSPS option based on the best available demonstrated
control technologies, which include advanced biological treatment with nitrification and cyanide
destruction. NSPS under this option are the same as BAT effluent limitations for 30 organic
pollutants, cyanide, and ammonia. EPA is also promulgating revised NSPS for BOD , COD, and5
TSS at a level equal to the discharge characteristics of the best performing BPT plants. For COD
this is equivalent to the BAT/BPT level of control.
7.3.5.2 Subcategories B and D
Similar to Subcategories A and C, for Subcategories B and D EPA considered a single NSPS
option based on the best available demonstrated control technology, which is advanced biological
treatment. The revised NSPS for BOD , COD, and TSS associated with this option is at a level5
equal to the discharge characteristics of the best performing BPT plants. For COD this is
equivalent to the BAT/BPT level of control.
7.3.5.3 Rationale
Because new plants have the opportunity to install the best and most efficient wastewater
treatment technologies, NSPS should be based on the most stringent control technology
demonstrated for all pollutants of concern (conventional, nonconventional, and priority
pollutants). The NSPS options include the most advanced wastewater treatment technologies
demonstrated to effectively treat pharmaceutical manufacturing industry wastewater. The NSPS
options address the treatment of conventional, nonconventional, and priority pollutants in
Subcategory A and/or C and Subcategory B and/or D wastewaters. Because cyanide and
ammonia are not present in wastewaters at concentrations of concern at existing Subcategory
B and D facilities, cyanide destruction and ammonia treatments are not included under the NSPS
option for Subcategories B and D.
7-40
7.3.6 Pretreatment Standards for Existing Sources (PSES)
Pretreatment standards for existing sources establish quantitative limits on industrial discharges to
POTWs. PSES are designed to prevent the discharge of pollutants which pass through, interfere
with, or are otherwise incompatible with the operation of POTWs. The CWA requires
pretreatment for pollutants that pass through POTWs in amounts that would exceed direct
discharge effluent limitations or limit POTW sludge management alternatives, including the
beneficial use of sludges on agricultural lands. The transfer of a pollutant to another media (air)
through volatization does not constitute treatment. Pretreatment standards are to be technology-
based and analogous to BAT for removal of priority and nonconventional pollutants. Like
effluent guidelines limitations and standards based on BPT, BCT, BAT, and NSPS, PSES do not
require the use of any specific technology.
7.3.6.1 Subcategories A and C
In developing the final PSES for Subcategories A and C, EPA considered three options. The first
option was not to develop pretreatment standards for ammonia or any of the VOC pollutants, and
to modify the monitoring requirements for the existing cyanide standards. The second option
builds on compliance with the MACT standard with additional pretreatment standards for VOC’s
based on steam stripping technology and ammonia based on steam stripping or nitrification. The
second option also includes modification of the existing cyanide monitoring requirements. The
third option is the same as the second option, with the addition of revised pretreatment standards
for cyanide based on an in-plant technology unit consisting of either hydrogen peroxide oxidation
technology or alkaline chlorination technology, depending on individual facility conditions.
7.3.6.2 Subcategories B and D
For Subcategories B and D, EPA considered two options. The first option was not to add
regulated pollutants to the existing PSES and, since cyanide is not present in wastewaters for
these subcategory facilities, to withdraw the existing cyanide standards. Thus, compliance with
the MACT standard would be the only requirement for controlling VOC pollutants. The second
7-41
option was to add pretreatment standards for VOCs based on steam stripping in addition to
withdrawing the existing cyanide standards. No ammonia standards were considered since
facilities in these subcategories do not generate significant levels of ammonia in their wastewaters.
7.3.6.3 Rationale
Steam stripping is an effective technique for the removal of priority and nonconventional
pollutants of concern in pharmaceutical manufacturing wastewater. Steam stripping provides
effective pretreatment of wastewater that is further treated off-site by biological treatment at a
POTW. The regulatory options beyond no revision use steam stripping to control the additional
discharge of VOCs not controlled by the MACT standards.
Cyanide and ammonia are not present at concentrations of concern in Subcategory B and D
wastewaters; therefore, cyanide destruction and ammonia treatment are not included under the
Subcategory B and D options. It was also determined that biological treatment beyond what is
currently provided at the POTW would not be appropriate treatment of wastewater from all
pharmaceutical facilities. Therefore, the PSES regulatory options for Subcategories A, B, C, and
D include in-plant steam stripping without any end-of-pipe biological treatment.
7.3.7 Pretreatment Standards for New Sources (PSNS)
Pretreatment standards for new sources establish quantitative limits on the indirect discharge of
priority and nonconventional pollutants to waters of the United States. 307(c) of the CWA
requires EPA to promulgate PSNS at the same time it promulgates NSPS. New indirect
dischargers, like new direct dischargers, have the opportunity to incorporate the best available
demonstrated technologies, including process changes, in-plant controls, and end-of-pipe
treatment technologies.
As discussed in 17, EPA determined that a range of priority and nonconventional organic
pollutants, ammonia, and cyanide pass through POTWs. PSNS are applicable to these pollutants.
7-42
7.3.7.1 Subcategories A, B, C, and D
For all subcategories, EPA considered the same technology options under PSNS as under PSES.
For the final rule, EPA was not able to identify a technology option that would achieve greater
removal of pollutants than the PSES technology options.
7.3.7.2 Rationale
New indirect dischargers, like new direct dischargers, have the opportunity to incorporate into
their plants the best available wastewater treatment technologies. Therefore, the treatment
technologies included in the PSNS options are the most advanced wastewater treatment
technologies demonstrated to effectively treat pharmaceutical manufacturing industry wastewater.
The PSNS technology options address the treatment of organics, ammonia, and cyanide in
Subcategory A and C wastewater and organics in Subcategory B and D wastewater in a manner
similar to the PSES technology options. Since cyanide and ammonia are not present in
wastewater at concentrations of concern at Subcategory B and D facilities, cyanide destruction
and ammonia treatment are not included under the Subcategory B and D options. EPA did not
consider a technology option employing advanced biological treatment for the same reasons EPA
rejected end-of-pipe advanced biological treatment as part of the PSES technology options.
7-43
Table 7-1
Summary of Major Treatment Technologies Used in the PharmaceuticalManufacturing Industry
Number of Facilities Using the Technology(a)
Technology A and C B and DSubcategories Subcategories
Distillation 12 3Distillation with reflux 28 5Rectification 12 1
Wastewater treatmentSteam stripping 4 0(b)
Carbon Adsorption 6 4
Polishing Pond 2 6
Air Stripping 2 0
Incineration 10 1
(a)Data based on responses from the Detailed Questionnaire (244 responding facilities).(b)In their Detailed Questionnaire responses, 14 facilities reported using steam stripping for wastewater treatment; however, based on a review of eachof these facilities, EPA determined that only four facilities were actually using the technology for wastewater treatment.
7-44
Table 7-2
Pharmaceutical Manufacturing Facilities Quantity of ChemicalsRecycled/Reused (1990)
Chemical Name Reporting Recycled/Reused (lbs)Number of Facilities Total Quantity
Acetone 2 17,107,958
Acetonitrile 2 10,518,000
n-Butyl acetate 1 37,302,726
1,2-Dichloroethane 2 187,020
Ethyl acetate 1 10,243,000
Ethyl alcohol 1 122,304,000
Heptane 1 5,680,400
Hexane 1 248,082
Isopropanol 1 27,441
Methanol 7 19,027,784
Methylene chloride 7 92,599,587
Pyridine 1 451,000
Tetrahydrofuran 1 76,666
Toluene 6 19,185,893
Triethylamine 1 29,534
TOTAL 334,989,091
7-45
Table 7-3
Summary of Regulatory Options
Regulation Option Name Facilities Facilities
Technology Basis
Subcategory A and C Subcategory B and D
BPT No Revision (MACT Only) Current Treatment Technology Current Treatment Technologyand Withdraw Cyanide
Clarify Cyanide, Revise COD Advanced Biological Treatment Advanced Biological TreatmentOnly and Revised Monitoring and Withdraw Cyanide
Requirements for Cyanide
Clarify Cyanide, Revise BOD Advanced Biological Treatment Advanced Biological Treatment5
and TSS Only and Revised Monitoring and Withdraw CyanideRequirements for Cyanide
Clarify Cyanide and Revise Advanced Biological Treatment Advanced Biological TreatmentBOD , TSS, & COD and Revised Monitoring and Withdraw Cyanide5
Requirements for Cyanide
BCT No Revision Current BPT Current BPT
Revise BOD & TSS Advanced Biological Treatment Advanced Biological Treatment5
Revise BOD & TSS Advanced Biological Treatment Advanced Biological Treatment5
and Effluent Filtration and Effluent Filtration
Revise BOD & TSS Advanced Biological Treatment --5
and Polishing Pond
Revise BOD & TSS Advanced Biological Treatment --5
and Effluent Filtration andPolishing Pond
BAT Revise COD to BPT Limits Advanced Biological Treatment Advanced Biological Treatmentand Clarify Cyanide and Revised Monitoring and Withdraw Cyanide
Requirements for Cyanide
Add Organics Only, Revise Advanced Biological Treatment Advanced Biological TreatmentCOD to BPT Limits, and and Revised Monitoring and Withdraw CyanideClarify Cyanide Requirements for Cyanide
Add Organics and Ammonia, Advanced Biological TreatmentRevise COD to BPT Limits, with Nitrification, and Revisedand Clarify Cyanide Monitoring Requirements for
Cyanide
Ammonia and cyanide limits donot apply for B/D facilities
Table 7-3 (Continued)
Regulation Option Name Facilities Facilities
Technology Basis
Subcategory A and C Subcategory B and D
7-46
NSPS Revise Equal to Promulgated Advanced Biological Treatment Advanced Biological TreatmentLevel of BPT/BAT Control with Nitrification, and Revised and Withdraw Cyanide
Monitoring Requirements forCyanide
PSES No Revision (MACT Only) Current Treatment Technology Current Treatment Technologyand Clarify Cyanide and Revised Monitoring and Withdraw Cyanide
Requirements for Cyanide
Organics Only and Withdraw In-Plant Steam Stripping forCyanide Organic Compounds and
This option was not consideredfor A/C Facilities
Withdraw Cyanide
Organics and Ammonia, and In-Plant Steam Stripping forClarify Cyanide Organic Compounds and
Ammonia, and RevisedMonitoring Requirements forCyanide (Nitrification may beused for Ammonia)
Ammonia and Cyanide limitsdo not apply for B/D Facilities
Organics and Ammonia, and In-Plant Steam Stripping forRevise Cyanide Organic Compounds and
Ammonia, and In-PlantCyanide Destruction(Nitrification may be used forAmmonia)
Ammonia and Cyanide limitsdo not apply for B/D Facilities
1. U.S. EPA, Washington, D.C. Facility Pollution Prevention Guide, May 1992.
2. U.S. EPA, Office of Research and Development. Guides to Pollution Prevention: The Pharmaceutical Industry. EPA 625/7-91/017, U.S. Environmental ProtectionAgency, Washington, DC, October 1991.
3. U.S. EPA, Office of Solid Waste. Treatment Technology Background Document,January 1991.
4. Metcalf & Eddy, Inc., revised by G. Tchobanoglous. Wastewater Engineering: Treatment, Disposal, and Reuse, Second Edition; V. Te Chow, R. Eliassen, andR.K. Linsley, eds. McGraw Hill, Inc., New York, New York, 1979.
5. U.S. EPA, Office of Water. Development Document for Effluent LimitationsGuidelines and Standards for the Aluminum Forming Point Source Category. EPA440/1-84/073, U.S. Environmental Protection Agency, Washington, D.C., June1984.
REFERENCES
8-1
SECTION 8
PERFORMANCE OF THE CONTROL AND TREATMENT OPTIONS
8.1 Introduction
This discusses the treatment performance data collected and available to the Agency for the
treatment technologies discussed in 7 and for the constituents and pollutant parameters to be
regulated discussed in 6. The subsections below list, by technology, criteria applied to available
datasets to determine which data corresponded to well-designed/well-operated treatment units
that are used in developing long-term mean (LTM) performance levels. Those data meeting the
criteria are presented in this section.
The following information is presented in this section:
C 8.2 provides an overview of the treatment performance databasesdeveloped by the Agency and their sources.
C 8.3 provides a technology-by-technology evaluation of treatmentperformance data, lists the criteria used to identify data associated withwell-designed/well-operated systems, and summarizes those datasets thatmeet the well-designed/well-operated criteria.
C 8.4 presents the Agency's rationale for the data transfers developed for thisregulation, including process simulation modeling conducted by EPA tosupport transfers.
C 8.5 discusses the development of LTMs for conventional pollutants andCOD.
C 8.6 discusses the development of the LTM for cyanide.
C 8.7 discusses the development of LTMs for priority and nonconventionalpollutants.
C 8.8 discusses the development of the LTM for ammonia.
8-2
8.2 Treatment Performance Databases
There are four main sources of treatment performance data available to the Agency: EPA
sampling data; industry-supplied self-monitoring data; data gathered from EPA-sponsored
treatability studies; and data collected as part of other research efforts. These sources are
described in detail in 3.2. The treatment performance data used from these sources are discussed
in greater detail below.
8.2.1 EPA Pharmaceutical Manufacturers Sampling Program Data
Beginning in 1978, EPA conducted the Screening and Verification Sampling Programs. Under
these programs, wastewater samples were collected from plants with manufacturing operations
representative of the pharmaceutical manufacturing industry. In the screening program, in-plant
and end-of-pipe wastewater samples from 26 plants were screened for the presence of 129
priority pollutants. Typical sample collection periods were 24 hours during the screening phase.
The Agency conducted follow-up sampling (referred to as the verification phase) at five facilities
to verify the presence, levels, frequency of discharge, and treatability of the pollutants detected
during the screening program. The typical verification sampling program was three days in
length.
Between 1983 and 1991, EPA also conducted 15 different sampling episodes at 13
pharmaceutical manufacturing facilities. Data were collected for all pollutants on the List of
Analytes during these sampling efforts. These data were used to characterize the pollutants in the
wastewater discharged by direct and indirect facilities, to generate pollutant treatment system
performance data from facilities with well-operated biological treatment systems, and to obtain
treatability data characteristic of the operation of steam stripping columns.
The treatment performance data collected from these sampling episodes were incorporated into a
sampling database. These data were evaluated against the criteria defined in 8.3 to establish data
representative of well-designed/well-operated steam stripping, and biological treatment systems
for priority and nonconventional pollutants.
8-3
8.2.2 Industry-Supplied Self-Monitoring Data
Self-monitoring data were supplied by pharmaceutical manufacturers to the Agency as part of
their response to the Detailed Questionnaire (self-monitoring data were also submitted by the
seven facilities that participated in the 1989 pretest questionnaire). In addition, the Agency
requested self-monitoring data from Facility 30542 on the performance of their cyanide
destruction unit, which employs in-plant hydrogen peroxide oxidation treatment. Several
pharmaceutical facilities also submitted self-monitoring data with their comments on the Proposed
Pharmaceutical Effluent Guidelines and Limitations and the Notice of Availability. All self-
monitoring treatment performance data were evaluated against the criteria defined in 8.3 to
establish data representative of well-designed/well-operated treatment units. Data that conformed
to the criteria were placed into the Self-Monitoring Database. This database includes biological
treatment performance data for conventional, priority, and nonconventional pollutants as well as
cyanide treatment performance data. EPA also has TSS industry-supplied self-monitoring data in
connection with multi-media filtration and polishing pond treatment.
8.2.3 EPA Treatability Studies Data
In 1984, the Agency collected granular activated carbon treatability data for total COD. The data
collected as part of this treatability study were evaluated to establish data representing well-
designed/well-operated GAC treatment for COD.
In late 1991, the Agency collected steam stripping treatability data for several volatile organic
pollutants generated at a pharmaceutical manufacturing facility using a pilot-scale and bench-scale
steam stripper. Additionally, the Agency collected distillation treatability data in September of
1993 for methanol, using an existing full-scale distillation column in operation at a pharmaceutical
manufacturing facility. The data collected as part of these treatability studies were evaluated
against the criteria defined in 8.3 to identify data representative of well-designed/well-operated
steam stripping and distillation treatment for priority and nonconventional pollutants.
8-4
8.2.4 Other Research Sources
In 1979, the Robert S. Kerr Environmental Research Laboratory at Ada, Oklahoma conducted an
applied research study to determine the fate of specific priority pollutants within a biological
treatment system.(1) In the course of the study, priority pollutants associated with the
manufacture of pharmaceuticals were identified at two industrial facilities. The data collected as
part of this study were evaluated against the criteria defined in 8.3 to identify data representative
of well-designed/well-operated biological treatment for priority pollutants.
8.3 Evaluation of Treatment Performance Data
This subpresents the criteria used to evaluate well-designed/well-operated performance for each
technology. The treatment performance data that meet these editing criteria are also presented
below.
8.3.1 Advanced Biological Treatment
The Agency has defined "advanced" biological treatment at pharmaceutical manufacturing
facilities as those with existing BPT-level performance or better, for treating BOD and COD. 5
Advanced biological treatment performance was defined in 7.2.2.1 as systems that consistently
surpass, on a long-term basis, 90% BOD reduction and 74% COD reduction from raw waste5
levels in pharmaceutical manufacturing wastewater, as required by the existing BPT effluent
limitations guidelines (40 CFR Part 439).
These reductions in BOD and COD represent the initial criteria used to identify best performer5
datasets for advanced biological treatment. For BOD , COD, and TSS, an additional criteria5
established for best performer datasets was that the treatment system represented by the data treat
a predominant amount (49% or more by volume) of pharmaceutical process wastewater in
relation to other process wastewaters treated by the system. In response to comments on the
proposed rulemaking, EPA has used only treatment performance data collected from biological
treatment systems that contain less than 25% nonprocess water to calculate long-term mean
8-5
performance. This data exclusion is based on the previous EPA effluent limitations guidelines and
standards rulemaking for the Organic Chemicals, Plastics and Synthetic Fibers (OCPSF) industry
(52 FR 42522) and ensures that the data used are representative of process wastewater treatment
without undue dilution from nonprocess water sources.
Table 8-1 presents the BOD , COD, and TSS datasets that meet the criteria listed above for best5
performance. A review of these datasets shows that each is consistently achieving far greater
reductions in BOD , COD, and TSS discharges than the other plants subject to the existing BPT5
regulations. Facilities 30010, 30540, and 30623 represent best treatment performance for
conventional pollutants and COD for Subcategory A and C facilities. Facility 30637 represents
best treatment performance for conventional pollutants and COD for Subcategory B and D
facilities.
For the identification of applicable datasets for organic pollutants, the facility must achieve BOD5
and COD removal representative of "advanced" biological treatment. Additional review criteria
included:
C The treatment facility must process a predominant amount ofpharmaceutical process wastewater compared to other process wastewater. A predominate amount is defined as >49%;
C The data should be for a constituent or pollutant parameters selected forregulation or to be used as a data transfer;
C The data must be representative of advanced biological treatmenttechnology (e.g., datasets representing biological treatment plus powderedactivated carbon adsorption were removed from consideration);
C The data from facilities that supplied influent data only should be excluded;
C The data must be from facilities where the average influent pollutantconcentration was at least 10 times greater than the analytical detectionlimit so that treatment being achieved could be measured;
C The facility must treat less than 25% nonprocess water through thebiological treatment facility; and
8-6
C The data must be from sampling events consisting of three or more datapoints.
Table 8-2 presents the organic constituent datasets that meet the criteria listed above for best
performance. For organic constituents, treatment performance data do not demonstrate a
difference in treatment based on subcategory, and were considered together. These data are
considered representative of treatment performance for all subcategories.
8.3.2 Nitrification
The Agency has evaluated single and two-stage biological treatment at pharmaceutical
manufacturing facilities to identify nitrification performance data. Nitrification can be
accomplished in either a single or two-stage activated sludge system. Two indicators of
nitrification are the presence of ammonia oxidizing bacteria and nitrite oxidizing bacteria, and
analysis of the nitrogen balance to determine if nitrifying bacteria reduce the amount of ammonia
and increase the amount of nitrite and nitrate. 7.2.2.1 identified common design criteria for single
and two-stage systems with nitrification capability. In EPA’s evaluation of its one stage biological
treatment data, some systems were found to nitrify part of the time. In these cases, EPA
considered in its nitrification database those data points associated with nitrification behavior.
The treatment performance demonstrated by the edited data sets closely resembles the treatment
performance of the data sets which exhibited consistent nitrification. Table 8-3 presents the
nitrification treatment performance data that represent nitrification. All of this performance data
is taken from biological treatment systems achieving at least 90% BOD removal and 74% COD5
removal.
8.3.3 Multimedia Filtration
The Agency has obtained industry-supplied self-monitoring treatment performance data for
tertiary filtration from one Subcategory A and C pharmaceutical manufacturing facility (Facility
50007) and from two Subcategory B and D pharmaceutical manufacturing facilities (Facilities
12053 and 12317). TSS reductions through treatment were calculated using these data; datasets
8-7
that did not include influent concentrations were not included in the calculations. Table 8-4
presents the data that describe the treatment performance of these tertiary filters.
8.3.4 Polishing Ponds
The Agency has obtained industry-supplied self-monitoring treatment performance data describing
polishing pond treatment from one Subcategory A and C pharmaceutical manufacturing facility.
TSS reductions through treatment were calculated using these data. The calculated reductions
were used in developing the TSS LTM representing polishing pond treatment. Table 8-5 presents
the polishing pond treatment performance data.
8.3.5 Cyanide Destruction
The Agency requested cyanide destruction data in the Detailed Questionnaire. Ten facilities
reported using cyanide destruction systems, including the following types of treatment: hydrogen
facility). EPA considered all of the individual datasets representative of the various cyanide
destruction technologies in use. EPA considered two different technologies to represent
achievable cyanide reduction: hydrogen peroxide oxidation and alkaline chlorination. Two
technologies were considered because of the potential safety hazard hydrogen peroxide oxidation
may cause when used to treat pharmaceutical cyanide wastewaters with high organic content.
Hydrogen peroxide may be highly reactive with organic chemicals and may release oxygen in the
chemical process which may combust causing unsafe working conditions. Alkaline chlorination
on the other hand, does not release oxygen in the chemical process of converting cyanide to a
nitrogen gas and carbonate.
As discussed in 3.2.5, EPA requested Facility 30542 to develop a long-term database
documenting the performance of their hydrogen peroxide oxidation cyanide destruction unit. The
facility submitted six months of data to EPA in November 1991. EPA also sampled the cyanide
destruction unit of this facility during an on-site sample episode. The dataset that represents the
performance of hydrogen peroxide oxidation was obtained from treatment batches with analytical
8-8
sampling of each treated batch to achieve a treated cyanide concentration <1mg/L. Facility 30567
developed a long-term database documenting the performance of their alkaline chlorination unit.
The facility submitted 1990 data with their detailed questionnaire. The dataset that represents the
performance of alkaline chlorination was obtained from treatment batches with analytical sampling
of each treated batch. This dataset achieved on average a 99.9% cyanide removal. The self-
monitoring data submitted by Facility 30542 along with EPA-collected sampling data from this
facility's system were used to develop the LTMs for cyanide based on hydrogen peroxide
oxidation. The self-monitoring data submitted by Facility 30567 were used to develop the LTMs
for cyanide based on alkaline chlorination.
Hydrogen Peroxide Oxidation treatment performance data from Facility 30542 were evaluated
and those data points which represent an effluent cyanide concentration in excess of 1.0 mg/L
were removed from the dataset that represents best performance. Four of 36 effluent data points
were removed based on this criterion. These batches should have been recycled to cyanide
destruction treatment but were discharged at the time of the data collection due to a false negative
result from the facility's internal test procedure for cyanide which did not identify the effluent
concentrations above the 1.0 mg/L target.
Alkaline Chlorination treatment performance data from Facility 30567 were evaluated. Only the
datasets that showed 99% or more removal of cyanide were used as BAT treatment performance
data. There were 256 datasets included in the treatment performance database and 46 effluent
data points were removed based on this criterion. These batches should have been recycled to
cyanide destruction treatment because they are not representative of BAT treatment performance.
Table 8-6 presents the cyanide destruction treatment performance data.
8.3.6 Steam Stripping
The Agency collected steam stripping performance data from four EPA sampling episodes and
from one EPA-sponsored pilot study.(5)(6)(7)(8)(9) The Agency also collected distillation
performance data from one EPA-sponsored study.(10) In addition, the Agency received industry
supplied steam stripping monitoring data from multiple facilities.
8-9
The data from these sampling episodes and treatability studies were evaluated against steam
stripping treatment performance criteria. (32)
Only those constituents to be regulated were included in the database. All data points that were
collected from a flash tank or distillation pot were excluded since these technologies are not
considered "equivalent" to the BAT technology. Influent and effluent datasets where the influent
concentration was not detected, showed a negative percent removal or that showed no removal
after treatment were excluded. Data were excluded if collected while a stripper was not at steady
state, because these data would not be representative of BAT performance. Steady state for the
purpose of this comparison was defined as the point where temperatures and flow rates are
constant. All data point pairs with an influent concentration lower than the long-term means
shown in Table 8-19 were deleted. All data point pairs collected from a steam stripper with
inadequate steam to feed ratios or an inadequate number of equilibrium stages in the stripper were
deleted (see Table 10-7). Data which came from a single wastewater stream at one facility that
was deemed to have an atypical matrix, i.e., did not lend itself to BAT performance, and were
reported at a detection limit an order of magnitude or more than EPA's promulgated method
minimum level, were not used.
The Agency received several comments arguing against the use of the distillation performance
data collected by the Agency at proposal. The Agency performed an alcohol distillation pilot
study at a pharmaceutical facility to represent optimum performance for the removal of alcohols
and other compounds with similar strippability. Commenters argued that the wastewater stream
evaluated in that study was not representative of "typical" pharmaceutical industry wastewater
since it did not contain a mix of organic solvents, rather it was predominantly a methanol and
water stream. In response to these comments, the Agency has not used this dataset in the
determination of the final limitations and standards.
All other treatment performance data were then evaluated against the criteria listed above.
Table 8-7 presents the data meeting these criteria for the steam stripping options. For organic
constituents, treatment performance data do not indicate a difference in treatment based on
8-10
subcategory, and were considered together. These data are considered representative of
treatment performance for all subcategories.
The Agency has also evaluated the use of air stripping for the removal of ammonia.(9) Since the
average ammonia concentration of the plant wastewater stream for the air stripping study was
significantly less than that expected, the Agency made three test runs at varying V/L ratios with
plant wastewater spiked with ammonia. The optimum V/L ratio for ammonia stripping in these
runs was found to be 510 cfm/gpm and the treatment performance data from this run represent
well-designed/well-operated treatment performance for ammonia removal. The treatment
performance data from this run are presented below. The Agency is transferring this air stripping
treatment performance data to represent treatment achievable by steam stripping. Each of these
technologies are based on the same mass transfer principals and steam stripping is a more effective
treatment technology than air stripping since it is conducted at elevated temperatures at which
ammonia is more volatile. Therefore, steam stripping will be as or more effective than air
stripping in removing ammonia from wastewater. Table 8-8 presents the air stripping treatment
performance data which are being used to represent treatment performance achievable by steam
stripping.
The Agency received several comments arguing against the use of the ammonia air stripping pilot
study performance data. EPA disagrees with these comments and maintains that the data
collected from the air stripping study can be extrapolated to steam stripping limitations, since
steam stripping will produce better removals than air stripping. The study was performed on-site
at a pharmaceutical plant that produces a variety of products including products in the A, C, and
D Subcategories.
EPA agrees that steam stripping performance is highly dependent on wastewater pH. The pilot
study was performed for pH ranges between 10 and 12. The results of the pilot study show
optimal air stripping performance between these levels. EPA expects that comparable ammonia
removals from steam stripping at a lower pH will result in similar effluent concentrations as air
stripping at a higher pH.
8-11
Additional steam stripping data from industry submitted after proposal show that under
appropriate operating conditions (proper pH, steam to feed ratio, equilibrium temperatures, and
sufficient stages) ammonia concentrations lower than the promulgated long-term mean can be
achieved. In one data submittal from full-scale steam stripping operating data, the average
influent ammonia concentration was 129 mg/L with effluent ammonia concentrations ranging
from non-detect (<5 mg/L) to 5 mg/L. In a pilot steam stripping study data submittal, effluent
ammonia concentration values were all non-detect.
8.4 Evaluation of Treatment Performance Data Transfers
The Agency does not have treatment performance data for all constituents and pollutant
parameters promulgated for regulation. The Agency has transferred treatment performance data
from constituents with data to constituents without data that are deemed to be treated similarly.
The transferred data are being used to develop limitations and standards for pollutants for which
EPA does not have data. This discusses the treatment performance data transfers used by the
Agency.
8.4.1 Advanced Biological Treatment Performance Data Transfers
As shown in Table 8-2, EPA has performance data from advanced biological treatment for 24
organic constituents. To develop a basis of transfer for the 25 organic constituents considered for
regulation for which EPA does not have sufficient performance data, the Agency grouped the
organic constituents by structural and biodegradability groups and identified data transfers within
these groups.
The organic constituents selected for regulation were grouped by biodegradability, including
"high", "medium", and "low" biodegradability. These biodegradability groups were developed
using Kmax values and the ratio of BOD to theoretical oxygen demand (BOD /ThOD). The5 5
Kmax biodegradation rate is based on Monod-type kinetics, which assumes that biodegradation of
any one constituent is independent of the concentrations of other constituents as long as no
constituents are inhibitory or toxic to the microorganisms. Inhibition or toxicity by one
8-12
constituent may slow or halt the degradation of other constituents. As the Kmax value increases,
biodegradability increases. Large values of the ratio BOD /ThOD (e.g., >50%) indicate that the5
compound is readily biodegradable. Low ratios (e.g., < 20%) indicate that the compound is either
slowly biodegradable or only partially biodegradable.(13)
Constituents were placed in the "high" biodegradability group if the Kmax value was greater than
4.00 E-06 or the BOD /ThOD ratio was greater than 50%. Because neither a Kmax value nor a5
BOD /ThOD ratio were found for methyl formate, this constituent was placed in the "high" group5
due to its similar structure to ethyl acetate which is in the "high" group.
Constituents were placed in the "medium" biodegradability group if there was a broad range of
BOD /ThOD ratios (e.g., a BOD /ThOD ratio between 20% and 70%). Constituents were also5 5
placed in the "medium" biodegradability group if the Kmax value was greater than 1.00 E-07 and
less than 4.00 E-06. Because Kmax values and BOD /ThOD ratios were not found for5
diethylamine, 2-methylpyridine, and triethylamine, these constituents were placed in the "medium"
group, based on the following information:
C Literature suggests biodegradability of diethylamine, but reports it isinhibitory to bacterial and algal cell division (14);
C 2-methylpyridine is very similar in structure to pyridine, which is in the"high" group; however, 2-methylpyridine was placed in the "medium"group because the extra methyl group of this constituent makes it lessbiodegradable (16); and
C A 200 mg/L solution of triethylamine is 100% biodegraded buttriethylamine is also reported to be 50% inhibitory to nitrifyingbacteria.(15)
Constituents were placed in the "low" biodegradability group if the Kmax value was less than 1.00
E-07 or BOD /ThOD ratios were less than 20%. Because Kmax values and BOD /ThOD ratios5 5
were not found for amyl alcohol, formamide, and N,N-dimethylacetamide, these constituents were
placed in the "low" group, based on the following information:
8-13
C Very slow biodegradation has been shown for amyl alcohol. An activatedsludge unit demonstrated only 3.7% removal of ThOD of this compound in24 hours.(15)
C Very slow biodegradation has been shown for formamide. An activatedsludge unit demonstrated only 11.8% removal of ThOD of this compoundin 24 hours.(15)
C N,N-Dimethylacetamide was placed in the "low" group due to its structuralsimilarity to formamide.(15)
Table 8-9 presents the structural and biodegradability groups for the organic constituents and
ammonia for which EPA has best performance data and for the other organic constituents selected
for regulation without best performance data.
8.4.1.1 Data Transfer Methodology
Once the biodegradability groups were assigned, appropriate data transfers were identified
whereby treatment performance data were transferred from constituents with data to constituents
for which the Agency did not have treatment performance data. Transfers were made between
structurally similar constituents from within the same structural group (with the exception of the
amines and those constituents without treatment performance data in the miscellaneous group).
Transfers were made from less treatable to more treatable constituents, based on their
biodegradability groupings and general guidelines regarding biological treatability (i.e., decreasing
biodegradability with increased branching or shortening of carbon chains).(16) Table 8-9 presents
the biological treatment performance data transfers. For some of the constituents listed in Table
8-9, treatment performance data were not available, and transfers of long-term means were not
identified using the general methodology outlined above. Treatment performance data transfers
were developed for these constituents based on the following methodology: transfers were still
based on structural similarity, although a few of the transfers were not between constituents from
the same structural group. Where more than one constituent was a candidate from which to
transfer a long-term mean performance level, the constituent with the higher long-term mean was
chosen. All of these transfers were between constituents that are similar in terms of relative
biodegradability. The specific rationale supporting each data transfer is discussed below.
8-14
8.4.1.2 Alcohol Structural Group
The data transfers within the alcohol structural group are from ethanol to ethylene glycol, tert-
butyl alcohol, n-butyl alcohol, n-propanol, and amyl alcohol. In addition to having similar
structures, ethylene glycol was included in the high biodegradability group while ethanol was
included in the medium biodegradability group, suggesting a transfer of data from a more
treatable to a less treatable constituent. Both n-propanol and amyl alcohol have similar structures
to ethanol and have longer carbon chains, suggesting easier biodegradability. The transfer from
ethanol to tert-butyl alcohol and n-butyl alcohol is based on structural similarity.
8.4.1.3 Aldehyde Structural Group
The data transfer within the aldehyde structural group is from formaldehyde to isobutyraldehyde.
Isobutyraldehyde has a longer carbon chain attached to the carbonyl group, which should enhance
its biodegradability. The ratio of BOD to ThOD is 65% for isobutyraldehyde compared to 60%5
for formaldehyde, indicating isobutyraldehyde is as biodegradable as formaldehyde, thereby
supporting this transfer.
8.4.1.4 Amide Structural Group
Within the amide structural group, the data transfers are from N,N-dimethylformamide to N,N-
dimethylacetamide and formamide. For N,N-dimethylacetamide, the additional methyl group
attached to the acetamide should make it more biodegradable than N,N-dimethylformamide. For
formamide, N,N-dimethylformamide is the most structurally similar constituent to this amide for
which data are available.
8-15
8.4.1.5 Amine Structural Group
The amide, N,N-dimethylformamide, is used as the source of data transfer for diethylamine and
triethylamine, since their structures are very similar. Both amines are less branched than N,N-
dimethylformamide and, therefore, predicted to be more biodegradable than N,N-
dimethylformamide.
8.4.1.6 Aromatic Structural Group
Within the aromatic structural group, data transfers are from 2-methylpyridine to aniline,
N,N-dimethylaniline, chlorobenzene, pyridine, and o-dichlorobenzene. Aniline and pyidine, which
are in the high biodegradability group, are predicted to be more biodegradable than 2-
methylpyridine, which is in the medium biodegradability group. o-Dichlorobenzene and
chlorobenzene, which are in the medium biodegradability group, are predicted to be as
biodegradable as 2-methylpyridine, which is also in the medium biodegradability group. The other
data transfer is based on the fact that N,N-dimethylaniline is closest in structure to
2-methylpyridine, an aromatic constituent for which treatment performance data are available.
8.4.1.7 Ester Structural Group
Data transfers in the ester structural group are from isopropyl acetate to n-butyl acetate and from
ethyl acetate to n-amyl acetate and methyl formate. For all three transfers, the constituent
transferred to is less complex and/or has a longer carbon chain attached to the ester group,
making it easier to biodegrade.
8.4.1.8 Ether Structural Group
In the ether structural group, data transfers are from tetrahydrofuran to polyethylene glycol 600,
1,4-dioxane, and isopropyl ether. The transfer from tetrahydrofuran to 1,4-dioxane is based on
the structural similarity of these constituents and the more highly branched structure of
tetrahydrofuran. Both constituents have the same Kmax value, also supporting the rationale that
8-16
1,4-dioxane should be at least as biodegradable as tetrahydrofuran. Tetrahydrofuran was chosen
as the transfer basis for the other ethers without available treatment performance data since these
constituents have similar structures.
8.4.1.9 Ketone and Alkane Structural Groups
In the ketone and alkane structural groups, data transfers are from acetone to methyl isobutyl
ketone (MIBK) and from n-hexane to petroleum naphtha. MIBK and acetone are in the same
structural group and both are considered highly biodegradable. Also MIBK has a greater Kmax
value than acetone, suggesting easier biodegradability for MIBK. N-hexane, an alkane, is the
most structurally similar compound with performance data to petroleum naphtha. Petroleum
naphtha is actually a petroleum distillate fraction containing a mixture of aromatic and straight
chain hydrocarbons, with characteristics similar to both alkanes and aromatics.
8.4.1.10 Miscellaneous Structural Group
From the miscellaneous structural group, treatment performance data transfers are from ethanol
to methyl cellosolve and from chloromethane to dimethyl sulfoxide. In each case, data were
transferred from the most structurally similar constituent or group of constituents for which
performance data are available.
8.4.2 Steam Stripping Treatment Performance Data Transfers
The Agency has treatment performance data from well-designed/well-operated steam stripping
units for ten potentially regulated organic constituents. The ten candidate pollutants for
regulation were used to develop a basis of performance data transfer for the other 27 potentially
regulated organic constituents, by grouping all organic constituents into strippability groups based
on their Henry's Law Constant. Data transfers were then made within each group from the least
strippable compound to more strippable compounds.
Xi × H ' Yi × P
8-17
(8-1)
Long term means were calculated for the ten potentially regulated pollutants from well-
designed/well-operated steam stripping data. The calculated long-term means were then
transferred to other pollutants within strippability groups. The Agency assigned long-term means
for every potentially regulated pollutant; although, not every pollutant with a steam stripping
long-term mean is necessarily being regulated under the promulgated steam stripping option. The
POTW pass-through analysis precluded some of the pollutants with well-designed/well-operated
steam stripping performance data from regulation. These pollutants are discussed within the
context of steam stripping treatment performance data even though they are not regulated
pollutants by the selected steam stripping option.
Henry's Law is used to relate the equilibrium of the vapor-phase concentration of a solute to its
liquid-phase concentration. In its traditional formulation, shown in Equation 8-1, Henry's Law
expresses vapor-liquid equilibrium when the total pressure is low (less than 2 atm) and when the
solute concentration is also low (less than 1 mol%).(19)
Where: Xi = solute liquid-phase mole fractionH = Henry's Law ConstantYi = solute vapor-phase mole fractionP = pressure.
While the solute concentration in the wastewater from facilities in the pharmaceutical
manufacturing industry may be more than 1 mol%, Henry's Law Constants still provide a good
measure of relative strippability, and can be used to rank the constituents and place them in
strippability groups.
In environmental applications, Henry's Law is often used to relate the equilibrium vapor-phase
concentration of a contaminant to its concentration in water. For a given contaminant in water,
the Henry's Law Constant is directly proportional to the contaminant's vapor pressure and
inversely proportional to its solubility. A contaminant with a high vapor pressure and low
solubility in water has a high Henry's Law Constant. Conversely, a contaminant that has a low
8-18
vapor pressure and/or is very soluble in water has a low Henry's Law Constant. For all
contaminants, the Henry's Law Constant is a function of temperature and pressure.
These fundamental relationships allow Henry's Law Constants to be used to judge how effective
treatment technologies that rely on liquid-to-vapor mass transfer will be and to judge the relative
effectiveness of these technologies on different constituents. For example, constituents with high
Henry's Law Constants are easily removed from water by steam stripping, while constituents with
low Henry's Law Constants are not.
Table 8-10 presents, for each potentially regulated organic constituent and ammonia, the Henry's
Law Constant (presented in decreasing order), the structural group, and the transfer group for the
steam stripping option. In many cases, differing Henry's Law Constants for the same constituent
were reported in differing data sources. In cases where different values were reported, those
values presented in the EPA literature sources (20) or values from EPA's Surface Impoundment
Modeling System (SIMS) database (18) were generally chosen as the preferred values. If no
values were listed in any of these sources, then values were chosen from other sources based on
best engineering judgment. All reported values for Henry's Law Constant are at 25EC and 1 atm
(760 mmHg).
No Henry's Law Constants were found for polyethylene glycol 600 (PEG 600) and petroleum
naphtha. PEG 600 is a mixture of condensation polymers of ethylene glycol with an average
molecular weight of 600. The Henry's Law Constant for ethylene glycol, the "building block" of
this polymer, was transferred to PEG 600 due to structural similarity. Petroleum naphtha is not a
specific compound but a cut of petroleum that distills within a certain temperature range. Based
on best engineering judgment, petroleum naphtha was placed in the "low" strippability group.
The Henry's Law Constant for petroleum naphtha was transferred from the constituent with the
lowest Henry's Law Constant in the "low" strippability group.
EPA has determined based on the Henry's Law constants and physical properties that eight of the
constituents listed in Table 8-10 are not strippable. These constituents cannot be effectively
treated by steam stripping and, therefore, do not have treatment performance data associated with
8-19
stripping treatment. These constituents may be regulated under regulatory options which include
biotreatment but will not be regulated under regulatory options that include only steam stripping.
Sections 8.4.2.1 through 8.4.2.3 describe the steam stripping option treatment performance data
transfers within each treatability group and the basic rationale behind each data transfer.
8.4.2.1 High Treatability Group
Three constituents with treatment performance data are included in the high treatability group,
containing constituents which are easiest to strip. These constituents are chloroform, methylene
chloride, and toluene. The long-term mean treatment performance level for methylene chloride,
the least strippable of the constituents in the high treatability group, was transferred to the other,
more strippable constituents in the high treatability group without treatment performance data.
The long-term mean treatment performance level for methylene chloride is 0.20 mg/L.
8.4.2.2 Medium Treatability Group
Three constituents with treatment performance data, acetone, 2-butanone (also referred to as
methyl ethyl ketone), and tetrahydrofuran are included in the medium treatability group. The
long-term mean treatment performance level for acetone, the least strippable of the constituents in
the medium treatability group, was transferred to the other, more strippable constituents in the
medium treatability group without treatment performance data. The long-term mean treatment
performance level for acetone is 4.1 mg/L under the steam stripping option.
8.4.2.3 Low Treatability Group
Treatment performance data are available for four constituents in the low treatability group:
isopropanol, ethanol, pyridine, and methanol. The treatment performance data for isopropanol
was transferred to more strippable constituents in the low treatability group for which treatment
performance data are not available. The long-term mean treatment performance level for
isopropanol is 11.8 mg/L. The treatment performance data for ethanol was transferred to n-
8-20
propanol. The long-term mean treatment performance data for ethanol is 355 mg/L. Treatment
performance data for methanol were transferred to the remaining constituents in the low
treatability group for which no data were available. The long-term mean treatment performance
level for methanol is 1,240 mg/L.
8.4.3 ASPEN Simulation Modeling to Support Steam Stripping TreatmentPerformance Data Transfers
This provides technical support for the data transfers made in developing the long-term mean
treatment performance levels for the steam stripping treatment option. In particular, this focuses
on how process modeling was used to support the data transfers. 8.4.3.1 provides a general
overview of the ASPEN simulation model. 8.4.3.2 describes the methodology used for
supporting data transfers for steam stripping. The results of the ASPEN simulations are presented
in 8.4.3.3. ASPEN simulations were performed using a steam stripping design similar to the
designs forming the basis of the final regulations. The relative behavior demonstrated in these
simulations document that constituents within the same stripping group can achieve equivalent or
similar effluent concentrations.
8.4.3.1 Overview of ASPEN
Since the 1970s, the process industries (chemical, petroleum, pharmaceutical, etc.) have
increasingly relied on computer models to design and predict the performance of process
equipment. The types of models typically used in these industries for this task are not statistical
or empirical, but rely on engineering fundamentals such as the principles of thermodynamics and
unit operations.
Two process models (also called process simulators) were used to support the development of the
pharmaceutical manufacturing effluent guidelines: ASPEN/SP™ (Version 7.0) and ASPEN
Plus™ (Version 8.5), commercial process design programs available respectively from Simulation
Sciences, Inc. and Aspen Technologies, Inc. Both programs are descendants of the original
ASPEN program which was developed at MIT during the period of 1976-1981 under the
8-21
sponsorship of the Department of Energy and 55 industrial participants. Both programs give
similar results and are widely accepted in industry for modeling chemical, petroleum, and
environmental processes.
Key features of process simulation packages like ASPEN/SP™ and ASPEN Plus™ include the
following:
C A large database of compounds and their properties which allow formodeling a wide range of processes;
C An extensive library of thermodynamic models (equations of state andactivity coefficient models) for calculating the properties of mixtures; and
C A wide range of computer algorithms for modeling unit operations such asmixers, reactors, absorbers, strippers, and distillation columns.
8.4.3.2 Methodology for Data Transfer Simulations
As discussed previously, effluent data were collected on actual operating columns and pilot
columns treating pharmaceutical manufacturing wastewater. For those pollutants where
treatment performance data were not available, data were transferred from pollutants for which
data were collected. The approach to making data transfers was two-part:
1) Transfers were made based on the physical properties that determinestrippability, and
2) The proposed transfers were checked by simulating typical strippingsystems using the ASPEN process simulators.
In using the ASPEN programs to support the data transfers, a five-step methodology was
followed:
1) Each of the pollutants to be regulated was placed in one of sevenstrippability categories, with Group 1 representing pollutants that are moststrippable and Group 7 representing pollutants that are not strippable.
8-22
2) Simple flowsheets for typical stripping systems were developed and theappropriate unit-operations models were selected.
3) Values were assumed for the key process variables (number of equilibriumstages and liquid to vapor (L/V) ratio). These key inputs vary amongstrippability groups because less strippable pollutants will operate at lowerL/V ratios and require more stages. Influent concentrations for eachpollutant were based on the maximum and average loadings reported in theDetailed Questionnaire.
4) The thermodynamic models for liquid-vapor equilibrium calculations wereselected. To model the nonideal nature of most pollutants in water, anactivity coefficient model was used.
5) The results of steps 1 through 4 were developed into simulation input files. Simulations were then run to determine if the transferred long-term meanperformance level could be met by each pollutant assuming it was presentat its maximum and average loading. If the long-term mean performancelevel could be met with either the maximum or average influent loading, thedata transfer was considered acceptable. Note that in all cases the long-term mean performance level could be met at the maximum influent loadsby increasing the number of stages or decreasing the L/V ratio assumedunder step 3 (thus, ability to achieve performance levels is independent offeed concentrations for a given constituent).
8.4.3.3 Strippability Groups
As discussed above, each of the pollutants proposed for regulation was placed in one of seven
strippability groups. Placement was based on published Henry's Law Constants at 25EC and 1
atm. Table 8-11 presents these categories and the pollutants in each group. Note that these
groups are different than the data transfer groups presented in Table 8-10, as they have been
established for a different purpose. The data transfer groups presented in Table 8-10 were
established for the purpose of transferring direct measurement data. The strippability groups
discussed here were established for the purpose of assigning key process design variables for
simulation purposes, and for cost estimating purposes, as discussed in 10.3.5. However, the
grouping presented in Table 8-10 and these presented here share two important characteristics:
1) both grouping systems are based on a ranking of pollutants by Henry's Law constant from
8-23
highest to lowest, and 2) pollutants considered not strippable are the same under both grouping
systems.
8.4.3.4 Flowsheet Development
Two examples of typical steam stripping/distillation systems were identified: a stripper/decanter
system for treating contaminants that have low water solubility and will form a phase-separable
overhead product, and a distillation column with reflux for treating contaminants that are highly
water soluble and will not likely form a phase-separable overhead product. Figures 8-1 and 8-2
illustrate these process configurations.
Process simulation flowsheets were developed for these configurations. For modeling
contaminants that form a phase-separable overhead product, the flowsheet in Figure 8-3 was
used. In this flowsheet, the stripper was modeled using the equilibrium-stage distillation
algorithm in ASPEN, RADFRAC. The decanter was modeled using the three-phase flash
algorithm, FLASH3, and the feed/effluent exchanger was modeled with the heater algorithm,
HEATER.
For modeling situations where the contaminants are highly water soluble, the flowsheet shown in
Figure 8-4 was used. A reflux ratio high enough to achieve a concentrated overhead product
(contaminant weight percent $ 33) was assumed.
The key part of the ASPEN simulations is the column calculations. The RADFRAC model, which
makes these calculations, is a general distillation model which uses the equilibrium-stage
concept.(30) The required inputs to model a distillation column using the RADFRAC model are
the feed wastewater flow rate, the steam flow rate, the pressure drop across the column, and the
number of equilibrium stages. The algorithm used in RADFRAC makes simultaneous mass and
energy balances at each stage. This algorithm is based on the "inside-out" concept developed by
Boston.(30) The distillation, absorption, and stripping models used in most process simulators
utilize this approach.
8-24
Figure 8-1. Process Schematic for a Steam Stripper with Open Steam
8-25
Figure 8-2. Process Schematic for a Distillation Column with Open Steam
8-26
Figure 8-3. Simulation Block Diagram for Steam Stripper with Decanter
8-27
Figure 8-4. Simulation Block Diagram for Distillation Column with Open Steam
8-28
8.4.3.5 Estimation of Key Input Variables
As previously noted, the two most important process variables which determine the removal
efficiency of a steam stripper or a distillation column are: 1) the number of equilibrium stages,
and 2) the L/V ratio in the column. Table 8-12 presents the number of equilibrium stages and L/V
ratios assumed for each strippability group. The assumed stages were chosen so that the total
column height would be reasonable for a packed column assuming a height equivalent to one
theoretical plate (HETP) of 2 to 3 feet. Two rectifying stages were assumed for strippability
groups 3 through 6. The L/V ratios were then chosen to ensure high pollutant removal
efficiencies. Other process inputs (feed water temperature, column pressure, condenser
temperature, etc.) were based on typical industry values and are shown in Table 8-12. The values
selected for these inputs will have less impact on the simulation results than the assumed number
of stages or L/V ratio.
8.4.3.6 Selection of Thermodynamic Models
Since pharmaceutical manufacturing waste streams are generally nonideal mixtures, the liquid-
vapor equilibrium calculations in the steam stripper simulations were performed using the
UNIversal QUAsi Chemical (UNIQUAC) activity coefficient model. The UNIQUAC model is
one of many commonly used activity coefficient models. It is a widely accepted tool for modeling
nonideal solutions.
The UNIQUAC model uses binary interaction parameters in its calculations. These parameters
can be determined from experimental vapor-liquid equilibrium data or they can be estimated using
the UNIFAC group contribution method. With the UNIFAC method, the binary interaction
between two compounds is estimated from the interactions between the different functional
groups that make up the two compounds. The UNIFAC database, which consists of values for
the interaction parameters between different functional groups, is available in several
references.(24,27) For the ASPEN/SP™ simulations performed, the binary interaction
parameters for the UNIQUAC model were taken either from the DECHEMA data series (26) or
generated using UNIFAC. The validity of using UNIFAC was confirmed by comparing calculated
8-29
K-values (estimated with ASPEN/SP™ using UNIFAC) to published K-values for several
contaminants. Table 8-14 summarizes these results.
8.4.3.7 Summary of Simulation Results
Tables 8-15 and 8-16 present the results of the treatment performance data transfer simulation
runs for Subcategory A and/or C facilities and Subcategory B and/or D facilities, respectively.
These results show that simulating the average pollutant loading will result in an effluent
concentration from steam stripping with distillation less than the pollutant's proposed long-term
mean performance level for steam stripping with distillation. The Agency also found that in
almost all cases simulating the maximum pollutant loading would also result in effluent
concentrations less than the proposed long-term mean performance levels. Although ASPEN
simulations were performed prior to proposal and were based on the proposed long-term mean
performance levels for steam stripping with distillation, the methodology for determining pollutant
transfers has not been modified for the final rule. Since transfers of experimental data were made
from pollutants that are less strippable (i.e., a lower Henry's Law Constant) to pollutants that are
more strippable, the effluent limitations guidelines should be attainable for all pollutants where
well-designed, well-operated steam stripping and distillation columns are installed.
8.5 Long-Term Mean Development for Conventional Pollutant Parameters andCOD
The conventional pollutants BOD and TSS along with the nonconventional pollutant COD are5
controlled using advanced biological treatment under the regulatory options considered for the
pharmaceutical manufacturing industry, as described in 7.
Using the treatment performance data presented in 8.3.1, a statistical analysis of the data was
conducted to develop a long-term mean concentration and variability factors for BOD , TSS, and5
COD for advanced biological treatment. The results of this analysis are presented in Table 8-17.
A detailed description of the statistical analysis and the results from this analysis are presented in
8-30
the Statistical Support Document for the Final Effluent Limitations Guidelines for the
Pharmaceutical Manufacturing Industry (EPA-821-B-98-007) (hereafter referred to as the
Statistical Support Document).
To develop the concentration-based long-term means and variability factors for each pollutant
parameter, EPA modeled the concentration data using a modification of the delta-lognormal
distribution. The modified delta-lognormal distribution model assumes that all nondetects occur
at the detection limit and that the measured concentrations follow a lognormal distribution (i.e.,
the logarithms of the measured data are normally distributed). The modified delta-lognormal
distribution is identical to a lognormal distribution if there are no nondetects in the data.
8.6 Long-Term Mean Development for Cyanide
For most of the regulatory options considered, as described in 7, cyanide limitations would not be
revised, but the monitoring requirements would be clarified in Subcategories A and C and cyanide
limitations would be withdrawn in Subcategories B and D.
For one of the PSES options considered, revised cyanide limitations were developed using the
treatment performance data presented in 8.3.5. A statistical analysis of this data was conducted to
develop a long-term mean concentration and variability factors for cyanide. For facilities using
hydrogen peroxide oxidation, the long-term mean concentration developed for cyanide is 0.24
mg/L. For facilities using alkaline chlorination, the long term mean concentration developed for
cyanide is 4.8 mg/L. A detailed description of the statistical analysis and the results from this
analysis are presented in the Statistical Support Document.
EPA is not revising existing cyanide limitations or standards for Subcategories A and C because
the new cyanide performance data indicate there would not be a large enough cyanide load
removal to warrant changing the existing standard. EPA is clarifying that the existing cyanide
limitations or standards must be met in-plant unless a facility can show a measurable cyanide load
at end-of-pipe. The final regulation withdraws cyanide limitations or standards for subcategories
B and D because cyanide is not present in the wastewaters of those subcategories.
8-31
8.7 Development of Long-Term Mean Concentrations for Priority andNonconventional Pollutants
Sections 6.6 and 6.7 list the priority and nonconventional pollutants selected for regulation in the
pharmaceutical manufacturing industry. Priority and nonconventional pollutants are controlled
under the regulatory options considered for the pharmaceutical manufacturing industry described
in 7, using either advanced biological treatment or steam stripping.
Using the treatment performance data presented in Sections 8.3.1 and 8.3.6, the Agency
conducted a statistical analysis of the data to develop a long-term mean and variability factors for
those priority and nonconventional pollutants with advanced biological and steam stripping
treatment performance data. A detailed description of the statistical analysis and the results from
this analysis are presented in the Statistical Support Document. Table 8-18 presents the long-
term mean treatment performance concentrations developed for these pollutants using the datasets
identified in Tables 8-2 and 8-7.
For priority and nonconventional pollutants without advanced biological or steam stripping
treatment performance data, a transfer was applied as discussed in Section 8.4. Table 8-19
presents the long-term mean treatment performance concentrations for priority and
nonconventional pollutants after application of the treatment performance data transfers.
8.8 Long-Term Mean Development for Ammonia
Ammonia is controlled under the regulatory options considered for the pharmaceutical
manufacturing industry described in 7.
Advanced biological treatment with nitrification performance data for ammonia are presented in
8.3.2. Air stripping treatment performance data for ammonia are presented in 8.3.6; the air
stripping data are being used to represent treatment achievable by steam stripping. A detailed
description of the statistical analysis of these data and the results from this analysis are presented
in the Statistical Support Document. EPA is not regulating ammonia for Subcategories B and D
8-32
because ammonia is not present in Subcategory B and D wastewaters at concentrations of
concern.
The long-term mean treatment performance concentration developed for ammonia through
advanced biological treatment with nitrification is 12.5 mg/L. The long-term mean treatment
performance concentration for ammonia applicable to steam stripping treatment is 9.91 mg/L.
8-33
Table 8-1
Advanced Biological Treatment Performance Data for BOD , COD, and TSS5
Facility Pollutant Points SourceMin. Max. Avg. Min. Max. Avg.
Influent Conc. (mg/L) Effluent Conc. (mg/L)# of
EffluentData
30010 BOD 10 2,080 971 3.0 695 47.6 600 SMD5
COD 157 3,750 2,030 31.0 1,904 296 951 SMD
TSS - - - 1.0 604 55.3 694 SMD
30540* BOD 230 9,730 2,440 11.0 528 98.4 1756 SMD5
COD 526 12,000 4,960 197 10,100 744 365 SMD
TSS - - - 16.3 2,710 155 365 SMD
30623 BOD 566 5,880 2,520 0.8 19.7 4.7 356 SMD5
COD 986 11,600 5,080 27.9 189 98.3 51 SMD
TSS - - - 0.5 254 18.7 356 SMD
30637 BOD 566 5,880 2,620 16.0 660 77.8 366 SMD5
COD 986 11,600 5,280 108.0 1,700 883 366 SMD
TSS - - - 8.0 577 106 366 SMD
* Data from facility 30540 has been corrected to account for the nonprocess water discharge after treatment.
30540 2-Methylpyridine 0.941 4.08 2.83 0.050 0.050 0.050 10 I
30540 2-Methylpyridine 0.161 1.60 0.643 0.010 0.011 0.011 8 N
30623 Phenol 0.010 0.651 0.169 0.010 0.022 0.011 7 I
30623 Tetrahydrofuran 1.59 75.0 25.4 0.005 3.48 1.22 9 I
30623 Tetrahydrofuran 1.68 7.88 5.35 0.007 1.36 0.048 8 N
30010 Toluene 56.0 71.0 61.3 0.010 0.010 0.010 3 V
30050 Toluene 0.078 0.193 0.131 0.001 0.001 0.001 3 V
30540 Toluene 0.146 0.484 0.311 0.010 0.010 0.010 10 I
30540 Toluene 0.410 3.00 1.26 0.005 0.006 0.0055 8 N
30623 Toluene 1.21 38.0 10.4 0.010 0.010 0.010 10 I
30623 Toluene 1.0 4.0 2.33 0.002 0.053 0.019 3 P
30623 Toluene 14.5 39.8 24.4 0.010 0.110 0.029 7 N
8-38
Table 8-2 (Continued)
Facility Pollutant Data Points SourceMin. Max. Avg. Min. Max. Avg.
Influent Conc. (mg/L) Effluent Conc. (mg/L)# of Effluent
30540 Trichlorofluoromethane 1.32 2.25 1.77 0.010 0.043 0.018 10 I
30540 Total Xylenes 37.0 170 94.5 0.005 0.005 0.005 4 N
Sources:I - EPA (List of Analytes) Sampling Program.P - Facility Self-Monitoring Data from 1989 Pretest Questionnaires.V - Verification Sampling Program.N - Facility Sampling Program Submitted in Response to the Proposed Effluent Limitations and Guidelines.
Note: Values that were not detected were set at the detection limit.
8-39
Table 8-3
Nitrification Treatment Performance Data for Ammonia
Facility Pollutant Points SourceMin. Max. Avg. Min. Max. Avg.
Influent Conc. (mg/L) Effluent Conc. (mg/L)# of Data
Two-Stage System
31040 Ammonia as N 1.0 533.0 166.0 1.0 167.0 15.2 529 A
30759 Ammonia as N 2.2 166.0 58.0 1.4 94.8 13.0 937 A
Single-Stage System
30540 Ammonia as N 23.0 47.5 40.7 1.4 3.7 2.53 10 I
30669 Ammonia as N 33.0 338 181.28 1.0 155.0 15.05 115 N
30542 Ammonia as N 0.28 101 29.48 0.09 46.4 2.96 124 N
Sources: A = new data (post-NOA); I = EPA (List of Analytes) sampling; N= new data (post-proposal)
8-40
Table 8-4
Multimedia Filtration Treatment Performance Data for TSS
Facility Pollutant Data Points SourceMin. Max. Avg. Min. Max. Avg.
Influent Conc. (mg/L) Effluent Conc. (mg/L)# of Effluent
50007 TSS 4.0 110 24.2 2.0 60.0 12.8 466 SMD
12053 TSS 5.5 106 26.2 0.40 35.0 6.84 84 SRI
12317 TSS 1.0 83.0 18.8 1.0 41.0 5.87 248 SRI
SMD - Self-Monitoring Database, Reference (2).SRI - Self-Monitoring Database from the 10/27/83 NSPS proposed rule containing facility self-monitoring data from 1982 and 1983, Reference(4).
Note: Values that were not detected were set at the detection limit.
8-41
Table 8-5
Polishing Pond Treatment Performance Data for TSS
Facility Pollutant Points SourceMin. Max. Avg. Min. Max. Avg.
Influent Conc. (mg/L) Effluent Conc. (mg/L)# of Data
SMD/I - Combined datasets from the Self-Monitoring Database and the EPA (List of Analytes) Sampling Program at Facility30542, References (2), (3).SMD - Self-Monitoring Database, Reference (2).
8-42
Table 8-7
Well-Designed/Well-Operated Steam Stripping Treatment Performance Data for Priority and Nonconventional Pollutants
Facility- DataStream Pollutant Points SourceMin. Max. Avg. Min. Max. Avg.
Influent Conc. (mg/L) Effluent Conc. (mg/L) # of Effluent
30329-C Acetone 977 20,000 3,750 0.730 103 32.3 20 N
30487-A Acetone 59.1 151 89.0 0.818 5.84 2.65 23 I
30832-B Acetone 1,800 9,700 5,220 7.80 1,800 732 5 N
31105-A Acetone 78 78 78 0.050 0.050 0.050 5 N
31105-B Acetone 340 340 340 0.069 16.0 4.07 4 N
60000-A Acetone 731 769 746 0.197 0.769 0.389 8 I
60000-B Acetone 1,100 1,570 1,290 1.22 9.68 5.61 8 I
30329-C Tetrahydrofuran 1,000 9,000 3,290 0.700 1.40 0.750 14 N
30832-B Tetrahydrofuran 5,300 13,000 9,230 0.500 130 66.2 3 N
8-44
Table 8-7 (Continued)
Facility- DataStream Pollutant Points SourceMin. Max. Avg. Min. Max. Avg.
Influent Conc. (mg/L) Effluent Conc. (mg/L) # of Effluent
60000-E Tetrahydrofuran 7,500 8,550 8,340 0.220 2.57 1.54 5 I
30329-B Toluene 253 253 253 0.124 2.41 1.25 3 I
30329-C Toluene 221 70,000 13,500 0.260 1,400 70.9 29 N
30487-A Toluene 15.2 82.6 35.2 0.100 0.100 0.100 23 I
30832-A Toluene 130 120,000 46,700 0.140 0.370 0.240 3 N
30832-B Toluene 37 190 102 0.070 9.50 3.15 5 N
31105-A Toluene 420 420 420 0.010 0.010 0.010 5 N
31105-B Toluene 93 93 93 0.002 0.002 0.002 4 N
60000-A Toluene 16.7 19.1 18.0 0.010 0.010 0.010 8 I
60000-B Toluene 18.0 21.3 19.2 0.027 0.042 0.034 8 I
60000-D Toluene 237 668 494 0.010 0.012 0.010 8 I
60000-E Toluene 515 580 528 0.333 0.630 0.473 5 I
Sources:I - EPA (List of Analytes) Sampling Program, Reference (3).N - Facility Sampling Program submitted in response to the Proposed Effluent Limitations and Guidelines.
Note: Values that were not detected were set at the detection limit.
8-45
Table 8-8
Air Stripping Treatment Performance Data for Ammonia
Facility Pollutant Points SourceMin. Max. Avg. Min. Max. Avg.
Influent Conc. (mg/L) Effluent Conc. (mg/L)# of Data
67 1,4-Dioxane 4.89E-06 ether high Tetrahydrofuran
8-48
Table 8-9 (Continued)
Constituent BOD /ThOD Biodegradability ConstituentCode Constituent Name Kmax Value (a) Ratio Structural Group Group Transferred From
5
129 Tetrahydrofuran 4.89E-06 ether high Data available
96 Isopropyl ether 6.7% ether low Tetrahydrofuran
105 Methyl isobutyl ketone 4.89E-06 4.4%-79% ketone high Acetone(MIBK)
118 Acetone 3.61E-07 50% ketone high Data available
25 2-Butanone (MEK) 5.60E-07 46% ketone medium Data available
84 n-Heptane 4.25E-06 alkane high Data available
87 n-Hexane 4.25E-06 63% alkane high Data available
43 Cyclohexane 4.25E-06 alkane high Data available
113 Petroleum naphtha alkane n-Hexane
3 Acetonitrile 5.00E-06 misc. high Data available
101 Methyl cellosolve 7.1% misc. low Ethanol
9 Ammonia (aqueous) 2.70E-06 misc. medium Data available
66 Dimethyl sulfoxide misc low Chloromethane
(a) Units for Kmax values are (gram constituent/gram biosludge/second)Kmax values: Reference (18).BOD /ThOD ratios: References (14), (15), (16), and (17).5
8-49
Table 8-10
Steam Stripping Treatment Performance Data Transfers
Constituent Code Constituent Name (atm/gmole/m3) Source Structural Group Transfer Group Transferred FromHenry's Law Constant Constituent
84 N-Heptane 2.85E+00 (a) n-alkane high Methylene chloride
87 N-Hexane 1.55E+00 (a) n-alkane high Methylene chloride
130 Toluene 5.93E-03 (a) aromatic high Data available
15 Benzene 5.55E-03 (c) aromatic high Methylene chloride
139 Xylenes 5.10E-03 (a) aromatic high Methylene chloride
35 Chlorobenzene 3.93E-03 (b) aromatic high Methylene chloride
37 Chloroform 3.39E-03 (b) chlorinated alkane high Data available
101 Methyl cellosolve 2.90E-03 (a) misc. high Methylene chloride
102 Methylene chloride 2.68E-03 (a) chlorinated alkane high Data available
96 Isopropyl ether 2.24E-03 (c) ether medium Acetone
48 o-Dichlorobenzene 1.94E-03 (b) aromatic medium Acetone(1,2-Dichlorobenzene)
51 1,2-Dichloroethane 1.10E-03 (c) chlorinated alkane medium Acetone
26 N-Butyl acetate 4.68E-04 (a) ester medium Acetone
10 N-Amyl acetate 3.91E-04 (a) ester medium Acetone
9 Ammonia (aqueous) 3.28E-04 (b) misc. medium Data available
95 Isopropyl acetate 3.17E-04 (e) ester medium Acetone
93 Isobutyraldehyde 1.47E-04 (e) aldehyde medium Acetone
136 Triethylamine 1.38E-04 (a) amine medium Acetone
71 Ethyl acetate 1.20E-04 (c) ester medium Acetone
8-50
Table 8-10 (Continued)
Constituent Code Constituent Name (atm/gmole/m3) Source Structural Group Transfer Group Transferred FromHenry's Law Constant Constituent
55 Diethylamine 1.10E-04 (a) amine medium Acetone
129 Tetrahydrofuran 1.10E-04 (f) ether medium Data available
105 MIBK 9.40E-05 (a) ketone medium Acetone
103 Methyl formate 8.10E-05 (g) ester medium Acetone
25 2-Butanone (MEK) 4.36E-05 (b) ketone medium Data available
118 Acetone 3.67E-05 (a) ketone medium Data available
97 Methanol 2.70E-06 (b) alcohol low Data available
114 Phenol 3.97E-07 (a) alcohol not strippable -
79 Formaldehyde 3.27E-07 (a) aldehyde not strippable -
3 Acetonitrile 2.01E-07 (a) misc. not strippable -
8-51
Table 8-10 (Continued)
Constituent Code Constituent Name (atm/gmole/m3) Source Structural Group Transfer Group Transferred FromHenry's Law Constant Constituent
64 N,N-Dimethylformamide 1.29E-07 (g,h) amide not strippable -
115(j) Polyethylene glycol 600 1.08E-07 (g) alcohol not strippable -
77 Ethylene glycol 1.08E-07 (e) alcohol not strippable -
60 N,N-Dimethylacetamide 4.55E-08 (g,h) amide not strippable -
66 Dimethyl sulfoxide 6.00E-09 (g,h) misc. not strippable -
Sources:
(a) EPA Literature Values, Reference (20).(b) SIMS Model Database, Reference (18).(c) Alternate EPA Literature Values, References (21), (22), and (23).(d) UNIFAC Value, Reference (24).(e) TSDF Air Emission Model, Reference (25).(f) Toxics Database.(g) Best Engineering Judgement.(h) DECHEMA, Reference (26).
Notes: All values for Henry's Law Constant are at 25EC and 1 atm. The LTM for constituents without data was transferred from the constituent with the lowest Henry's Law Constant in the transfer group except where noted.
Ammonia data are from air stripping treatment performance.
8-52
Table 8-11
Strippability Groups for Potentially Regulated Compounds Established forAssigning Process Design Variables for Steam Stripping Technology
Compound/Group (atm/gmole/m )Henry's Law Constant
3
Group 1
n-Heptane 2.85E+00
n-Hexane 1.55E+00
Group 3
Toluene 5.93E-03
Benzene 5.55E-03
Xylenes 5.10E-03
Chlorobenzene 3.93E-03
Chloroform 3.39E-03
Methyl cellosolve 2.90E-03
Methylene chloride 2.68E-03
Isopropyl ether 2.24E-03
o-Dichlorobenzene (1,2-Dichlorobenzene) 1.94E-03
1,2-Dichloroethane 1.10E-03
Group 4
N-Butyl acetate 4.68E-04
N-Amyl acetate 3.91E-04
Ammonia (aqueous) 3.28E-04
Isopropyl acetate 3.17E-04
Isobutyraldehyde 1.47E-04
Triethylamine 1.38E-04
Ethyl acetate 1.20E-04
Diethylamine 1.10E-04
Tetrahydrofuran 1.10E-04
Methyl isobutyl ketone (MIBK) 9.40E-05
Methyl formate 8.10E-05
Group 5
2-Butanone (MEK) 4.36E-05
Acetone 3.67E-05
Amyl alcohol 2.23E-05
Formamide 1.92E-05
N,N-Dimethylaniline 1.75E-05
tert-Butyl alcohol 1.17E-05
Isopropanol 8.07E-06
Table 8-11 (Continued)
Compound/Group (atm/gmole/m )Henry's Law Constant
3
8-53
n-Propanol 6.85E-06
Ethanol 6.26E-06
n-Butyl alcohol 5.57E-08
Pyridine 5.30E-06
1,4-Dioxane 4.88E-06
Aniline 2.90E-06
Group 6
Methanol 2.70E-06
Petroleum naphtha 2.70E-06
Group 7
Phenol 3.97E-07
Formaldehyde 3.27E-07
Acetonitrile 2.01E-07
N,N-Dimethylformamide 1.29E-07
Polyethylene glycol 600 1.08E-07
Ethylene glycol 1.08E-07
N,N-Dimethylacetamide 4.55E-08
Dimethyl sulfoxide 6.00E-09
8-54
Table 8-12
Key Process Inputs for Data Transfer Simulations
Strippability EquilibriumGroup Stages Total Stripping Stages L/V V/L
1 4 4 12.0 0.083
2 4 4 12.0 0.083
3 6 4 10.0 0.100
4 10 8 7.5 0.133
5 14 12 4.0 0.250
6 14 12 3.0 0.333
Table 8-13
Secondary Process Inputs for Data Transfer Simulations
Input Value Basis
Thermodynamics Calculated UNIQUAC/UNIFAC
Mass & Energy Balances Calculated Inside/Outside Algorithm by Boston
Steam Pressure 40 psig Field Test Experience
Column Pressure Drop (includes delta P 4 psig Field Test Experienceacross condenser)
Approach for Feed/Effluent HX (Feed 20EF Field Test Experience(a)
temperature of approximately 200EF)
(a) Approach for Feed/Effluent HX is the temperature difference between the inlet bottom temperature and the outlet temperature of the feed to thecolumn.
8-55
Table 8-14
Comparison of UNIFAC K-Values and Literature K-ValuesAt 25EEC In Water
Chemical ReferenceEstimated with UNIFAC Literature Values
K-Values(a)
Acetone 2.2 2.0 29
Chloroform 221.0 188. 25
Ethanol 0.5 0.3, 1.7 30/29
Isopropyl alcohol 2.1 0.4, 8.3 30/29
Methanol 0.1 0.2, 7.5 30/29
Methylene chloride 140.0 177.2 25
Methyl isobutyl ketone (MIBK) 3.4 2.8, 5.2 30/29
Tetrahydrofuran (THF) 6.4 6.1 30
Toluene 436.7 377.8 18
(a)The K-value of a compound in water at infinite dilution is referred to as the Henry's Law Constant of that compound.
8-56
Table 8-15
Simulation Results Supporting Steam Stripping with Distillation TreatmentPerformance Data Transfers for Subcategory A and C Facilities
Compound Strippability Estimated Influent Effluent Level Group (mg/L) (mg/L) (mg/L)
(a)ASPEN Simulated Mean Performance
(b)
Proposed Long-Term
Group 1
n-Heptane 242 <0.005 0.10
n-Hexane 16,600 (c) <0.005 0.10
Group 3
Toluene 4,760 <0.010 0.1
Benzene 46.2 <0.010 0.10
Xylenes 328 <0.010 0.10
Chlorobenzene 106 <0.010 0.10
Chloroform 257 <0.010 0.01
Methylene chloride 3,380 (c) <0.010 0.10
Isopropyl ether 19.2 <0.050 0.39
1,2-Dichloroethane 575 <0.010 0.39
Group 4
Tetrahydrofuran 1,820 <0.005 1.54
n-Butyl acetate 828 <0.500 0.39
n-Amyl acetate 2,870 <0.500 0.39
Isopropyl acetate 966 <0.500 0.39
Isobutyraldehyde 67.3 <0.180 0.39
Triethylamine 3,240 <0.050 0.39
Ethyl acetate 16,300 <0.500 0.39
Diethylamine 1,440 <0.010 0.39
Methyl isobutyl ketone 9,780 <0.005 0.39(MIBK)
Methyl formate 276 <0.500 0.50
Group 5
Pyridine 1,110 0.247 1.00
2-Butanone 262 <0.050 25.8
Acetone 3,680 <0.050 0.39
Amyl alcohol 486 <0.500 1.52
N,N-Dimethylaniline 1,670 <0.050 1.52
tert-Butyl alcohol 254 <0.500 1.52
Isopropanol 3,190 <0.050 1.52
n-Propanol 261 <0.050 1.52
Table 8-15 (Continued)
Compound Strippability Estimated Influent Effluent Level Group (mg/L) (mg/L) (mg/L)
(a)ASPEN Simulated Mean Performance
(b)
Proposed Long-Term
8-57
Ethanol 28,900 0.697 1.52
n-Butyl alcohol 37,900 0.159 1.52
1,4-Dioxane 180 <0.050 1.52
Aniline 22.8 <0.010 1.52
Group 6
Methanol 20,000 (d) (e) 1.040 1.52
(a) All estimated influents are industry average unless otherwise noted.(b) The < sign indicates estimated concentration is below detection limit.(c) Simulated with concentration at solubility limit.(d) Approximate concentration during field test. (e) Influent is not an industry average.
Note: Simulations were not run for methyl cellosolve, formamide, and petroleum naphtha, since appropriate physical property data were not available.
8-58
Table 8-16
Simulation Results Supporting Steam Stripping with Distillation TreatmentPerformance Data Transfers for Subcategory B and D Facilities
Compound/Group (mg/L) Average (A) (mg/L) (mg/L)
Estimated Influent is an ASPEN Simulated Term MeanInfluent Industry Effluent(a) Performance Level
Estimated Proposed Long-
Group 1
n-Hexane 423 A <0.005 0.10
Group 3
Toluene 66.1 A <0.010 0.10
Chloroform 7.8 A <0.010 0.01
Methylene chloride 3,380 A (b) <0.010 0.10
Isopropyl ether 28.3 A <0.050 0.10
Group 4
N-Amyl acetate 400 A <0.500 0.39
Isopropyl acetate 110 A <0.500 0.39
Triethylamine <0.1 A <0.050 0.39
Ethyl acetate 1,070 A <0.500 0.39
Group 5
Pyridine 45.0 A 0.2 1.00
Acetone 42,700 A <0.050 0.39
Isopropanol 2,650 A <0.050 1.52
Ethanol 2,920 A 0.7 1.52
n-Butyl alcohol 7.3 A 0.2 1.52
Group 6
Methanol 20,000 (b) 1.0 1.52
(a) The < sign indicates estimated concentration is below detection limit.(b) Simulated with concentration at solubility limit.(c) Approximate concentration during field test.
Note: Simulations were run for those regulated constituents with raw loads reported in the Detailed Questionnaire.
8-59
Table 8-17
Long-Term Mean Treatment Performance Concentrations for BOD , COD, and TSS in Advanced Biological Treatment5
SubcategoryDischarge Status BOD COD TSS
Long-Term Mean Concentration(mg/L)
5
A and C/Direct 74.3* 637 105*
B and D/Direct 13.5* 55.4 23.4*
*Only applicable to NSPS
8-60
Table 8-18
Long-Term Mean Treatment Performance Concentrations for Priority andNonconventional Pollutants with Available Data
* - Long-term mean concentration set at ML for pollutant.
8-63
REFERENCES
1. U.S. EPA. Industry Fate Study. 600/2-79-175, U.S. Environmental ProtectionAgency, Washington, D.C., August 1979.
2. Self-Monitoring Database developed for the Pharmaceutical ManufacturingIndustry.
3. EPA (ITD, List of Analytes) Sampling Program Database.
4. SRI. Self-Monitoring Database. October 27, 1983.
5. Wastewater Sampling Episode Report, May 23-27, 1983, Episode 857. Preparedby E.C. Jordan Co. for the U.S.EPA Industrial Technology Division.
6. Wastewater Sampling Episode Report, September 12-16, 1988, Episode 1356. Prepared by E.C. Jordan Co. for the U.S.EPA Industrial Technology Division.
7. Wastewater Sampling Episode Report, September 19-23, 1988, Episode 1623. Prepared by E.C. Jordan Co. for the U.S.EPA Industrial Technology Division.
8. Wastewater Sampling Episode Report, June 5-9, 1989, Episode 1748. Preparedby E.C. Jordan Co. for the U.S.EPA Industrial Technology Division.
9. Gardner, D.A., R.A. Osantowski, and P.A. Thompson, Radian Corporation. Treatment of Pharmaceutical Wastewater by Steam Stripping and Air Stripping. Prepared for the Risk Reduction Engineering Laboratory, U.S. EnvironmentalProtection Agency, Office of Research and Development, September 1992.
10. Gardner, D.A., P.A. Thompson, and C.A. Beitler, Radian Corporation. Treatmentof Pharmaceutical Wastewater by Distillation - Final Report. Prepared for the RiskReduction Engineering Laboratory, U.S. Environmental Protection Agency, Officeof Research and Development, July 28, 1994.
11. Osantowski, R., R. Wullschleger, Rexnord Inc. Evaluation of Activated Carbonfor Enhanced COD Removal from Pharmaceutical Wastewater - Final Report. Prepared for the Water Engineering Research Laboratory, U.S. EnvironmentalProtection Agency, Office of Research and Development, 1985.
12. Gardner, D.A., and R.A. Osantowski, Radian Corporation. Pilot Plant Evaluationof Biological Treatment of Pharmaceutical Wastewater With and Without PACAddition. Prepared for the Water Engineering Research Laboratory, U.S.Environmental Protection Agency, Office of Research and Development,December 1987.
8-64
13. Memorandum: Biodegradability of Chemical Compounds, from Marc Gill, RadianCorporation, to Kirsten Mahsman, Radian Corporation, January 21, 1993.
14. DeRenzo, D.J. Biodegradation Techniques for Industrial Organic Wastes, 1980.
15. Verschueren, K. Handbook of Environmental Data on Organic Chemicals, SecondEdition, Van Nostrand Reinhold Company, New York, New York, 1983.
16. Lyman, W.J., W.F. Reehl, and D.H. Rosenblatt. Handbook of Chemical PropertyEstimation Methods. McGraw Hill Book Company, New York, New York, 1982.
17. Windholz, M., et. al. The Merck Index, Ninth Edition. Merck and Co., Inc.,Rahway, New Jersey, 1976.
18. U.S. EPA. Surface Impoundment Modeling System Database (SIMS Database). September 1989.
19. Carroll, J.J. What Is Henry's Law? Chemical Engineering Progress. September1991.
20. U.S. EPA, Office of Air Quality Planning and Standards. Models for EstimatingAir Emission Rates from Superfund Remedial Actions. U.S. EnvironmentalProtection Agency, Research Triangle Park, North Carolina, March 8, 1993.
21. Warner, H.P., J.M. Cohen, and J.C. Ireland. Determination of Henry's LawConstants of Selected Priority Pollutants. EPA/600/D-87/229, Washington, D.C.,July 1987.
22. U.S. EPA. Handbook of RCRA Groundwater Monitoring Constituents; PhysicalProperties. EPA/530/R-92-022, U.S. Environmental Protection Agency,Washington, D.C., September 1992.
23. U.S. EPA, Office of Research and Development. Treatability Manual, Volume 1: Treatability Data. EPA/600/8/80/042, U.S. Environmental Protection Agency,July 1980.
24. Fredenslund, A., R.L. Jones, and J.M. Prausnitz. Group-Contribution Estimationof Activity Coefficients in Nonideal Liquid Mixtures, AIChE Journal, Vol. 21., No.6, November 1975.
25. U.S. EPA. Hazardous Waste Treatment, Storage, and Disposal Facilities AirEmissions Models. EPA 450/3-87-026, Washington, D.C., December 1987.
8-65
26. Gmehling, J. and U. Onken. Vapor-Liquid Equilibrium Data Collection Aqueous-Organic Systems. Chemistry Data Series, Vol. 1, Part 1. DECHEMA DeutscheGesellschaft für Chemisches Apparatewesen, Chemische Technik undBiotechnologie e.V., Frankfort, Germany, 1991.
27. Walas, S.M. Phase-Equilibria in Chemical Engineering. Butterworth-Heinemann,Stoneham, MA, 1985.
28. Howard, P.H. Handbook of Environmental Fate and Exposure Data for OrganicChemicals, Vol II. Lewis Publishers, Chelsea, MI, 1989.
29. Machay, D. and W.Y. Shiu. "A Critical Review of Henry's Law Constants forChemicals of Environmental Interest," J. Phys. Chemical Ref. Data. Vol. 10,No. 4, 1981.
30. Boston, J.F. Inside-Out Algorithms for Multicomponent Separation ProcessCalculations. Presented in Symposium on Computer Applications to ChemicalEngineering Process Design and Simulation, I/EC Division of ACS, 178th NationalACS Meeting, Washington D.C., 1979.
31. U.S. EPA. Statistical Support Document for the Final Effluent LimitationsGuidelines for the Pharmaceutical Manufacturing Industry. EPA-821-B-98-007,U.S. Environmental Protection Agency, Washington, D.C., 1998.
32. Memorandum: Methodology for inclusion in the Steam Stripping Database, fromMelissa Cantor, DynCorp, to Pharmaceutical Rulemaking Record, June 25, 1997.
9-1
SECTION 9
POLLUTANT REDUCTION ESTIMATES
9.1 Introduction
EPA obtained data on pollutant loads generated by pharmaceutical manufacturing processes and
the ultimate fate of these loads from Detailed Questionnaire responses. Using these data and the
treatment performance data presented in 8, the Agency has developed estimates of raw and
current pollutant discharge loads from the pharmaceutical manufacturing industry. The Agency
also calculated the pollutant discharge loads that would remain after implementation of each of
the regulatory options considered.
The following information is presented in this section:
C 9.2 presents the estimated raw loads of regulated pollutants in processwastewaters based on responses to the Detailed Questionnaire;
C 9.3 presents the loads of regulated pollutants currently being dischargedbased on responses to the Detailed Questionnaire;
C 9.4 discusses estimated end-of-pipe discharge loads for each regulatoryoption; and
C 9.5 discusses the pollutant load reductions expected through steamstripping and advanced biological treatment.
9.2 Raw Loads
The Agency estimated raw loads, by potentially regulated pollutant, which are generated by
pharmaceutical manufacturing processes based on responses to the Detailed Questionnaire. The
raw load was estimated as the sum of the discharge load, air emissions from wastewater load, and
degraded/destroyed load. These loads from the detailed questionnaire for each facility were
summed by pollutant across all facilities within a subcategory group. Table 9-1, located at the end
9-2
of this section, lists the estimated raw loads for each pollutant by subcategory and type of
discharge.
The raw loads for the Subcategory D indirect dischargers were scaled up according to the
methodology discussed in 3.2.4 and presented in Reference (1). This scale-up was used to
estimate the total amount of pollutants for all Subcategory D indirect dischargers, including the
facilities which were not sent a Detailed Questionnaire. Table 9-2 summarizes the total amount of
pollutant load in untreated wastewater from Subcategory B and D indirect dischargers.
9.3 Current Baseline Loads
The current baseline loads are those loads, by potentially regulated pollutant, which are currently
discharged by pharmaceutical manufacturing processes to a POTW or to surface water based on
responses to the Detailed Questionnaire. Those discharge loads, available from the Detailed
Questionnaire for each facility, were summed by pollutant across all facilities within a subcategory
group. Table 9-3 lists the current baseline loads for each pollutant by subcategory group and type
of discharge.
The current baseline loads for the Subcategory D indirect dischargers were scaled up according to
the methodology discussed in 3.2.4 and presented in Reference (1). This scale-up was used to
estimate the total amount of pollutants for all Subcategory D indirect dischargers, including the
facilities which were not sent a Detailed Questionnaire. Table 9-4 summarizes the total amount of
pollutants currently discharged by Subcategory B and D indirect dischargers.
9.4 End-of-Pipe Discharge Loads for Each Regulatory Option
End-of-pipe discharge loads for the BPT, BAT, and PSES regulatory options are presented by
subcategory and pollutant in this section. These loads were calculated in the following manner.
For each facility, current discharge loads were converted to an estimated current effluent
concentration using the pollutant discharge load, facility process wastewater flow, and a
conversion factor. For each facility, current estimated effluent concentrations were then
9-3
compared to the long term mean concentrations at the end of the treatment train for a particular
regulatory option. The lower of these concentrations was used along with the facility flow and an
appropriate conversion factor to determine facility specific end-of-pipe discharge loads (2), (3).
Loads from all facilities within a subcategory group were then summed to provide the
subcategory-wide estimates.
9.4.1 BPT
The regulatory options under BPT address the loads and concentrations of BOD , COD, and TSS5
at Subcategory A, B, C, and D direct discharger facilities. Indirect dischargers are not regulated
under BPT.
The regulatory options beyond no revision considered under BPT for Subcategories A, B, C and
D direct discharger facilities incorporate advanced biological treatment. Options considered
include: 1) no revisions to the existing BPT, 2) revise COD only and clarify cyanide, 3) revise
BOD and TSS only and clarify cyanide, and 4) revise BOD , COD, and TSS and clarify cyanide. 5 5
Estimated end-of-pipe discharge loads are presented in Table 9-5 for BOD , COD, and TSS5
removed by advanced biological treatment and the options considered.
9.4.2 BAT
The regulatory options considered under BAT beyond no revision address the loads and
concentrations of priority and nonconventional pollutants, including ammonia and cyanide where
appropriate.
The regulatory options considered under BAT beyond no revision for Subcategory A and C direct
discharging facilities incorporate advanced biological treatment and advanced biological treatment
with nitrification. Options considered include: 1) revise COD and clarify cyanide, 2) add organics
only, revise COD, and clarify cyanide, and 3) add organics and ammonia, revise COD, and clarify
cyanide. Table 9-6 presents estimated end-of-pipe discharge loads for these options. COD end-
9-4
of-pipe discharge loads are equivalent to the BPT end-of-pipe discharge loads presented in Table
9-5.
The regulatory option considered under BAT beyond no revision for Subcategory B and D direct
discharging facilities incorporates advanced biological treatment. Options considered include: 1)
revise COD and withdraw cyanide, and 2) add organics only, revise COD, and withdraw cyanide.
Because ammonia is not present at concentrations of concern in Subcategory B and D
wastewaters, ammonia nitrification is not included as part of the technology basis for these
subcategories. Also, because cyanide is not present at concentrations of concern in Subcategory
B and D wastewaters, the regulatory options withdraw the existing cyanide limitations. Table 9-7
presents estimated end-of-pipe discharge loads for this option. COD end-of-pipe discharge loads
are equivalent to the BPT end-of-pipe discharge loads presented in Table 9-5.
9.4.3 PSES
The regulatory options considered under PSES beyond no revision address the loads and
concentrations of priority and nonconventional organic pollutants and where appropriate,
ammonia and cyanide. PSES is being revised for Subcategory A, B, C, and D indirect discharging
facilities. Direct dischargers are not regulated under PSES.
The regulatory options beyond no revision considered under PSES for Subcategory A and C
indirect discharging facilities include: 1) in-plant steam stripping for organic compounds and
ammonia, and clarify cyanide, and 2) in-plant steam stripping for organic compounds and
ammonia, plus in-plant cyanide destruction. Table 9-8 presents end-of-pipe discharge loads for
these options.
The regulatory option beyond no revision considered under PSES for Subcategory B and D
indirect discharging facilities is in-plant steam stripping for organic compounds. Because
ammonia is not present at concentrations of concern in Subcategory B and D wastewaters,
ammonia is not included as part of the technology option. Also, because cyanide is not present at
concentrations of concern in Subcategory B and D wastewaters, the regulatory options withdraw
9-5
the existing cyanide limitations. Table 9-9 presents estimated end-of-pipe discharge loads for this
option at Subcategory B and D indirect dischargers.
The end-of-pipe loads for the Subcategory D indirect discharging facilities were scaled up
according to the methodology discussed in 3.2.4 and in Reference (1). An estimate of the total
end-of-pipe discharge loads for the Subcategory D indirect discharging facilities including those
not sent a Detailed Questionnaire are presented in Table 9-10.
9.5 Pollutant Load Reduction Estimates
Pollutant load reductions through each regulatory option are discussed in this section. The
regulatory options are summarized in Table 7-3 of 7.
9.5.1 BPT
Load reductions through advanced biological treatment for three options are shown in Table 9-
11: COD revised; BOD and TSS revised; and BOD , COD, and TSS revised.5 5
9.5.2 BAT
Table 9-12 presents load reductions through advanced biological treatment and advanced
biological treatment with nitrification for organic pollutants and ammonia under BAT for
Subcategories A and C and load reductions through advanced biological treatment for organic
pollutants under BAT for Subcategories B and D. These load reductions correspond to the load
reduction between current baseline loads and BAT end-of-pipe loads for both A and C; and B and
D direct dischargers.
Under BAT, there is also removal of BOD and COD associated with the organics treatment5
upgrades. The load removals for BOD and COD under BAT are listed in Table 9-13. The first5
set of removal numbers assume revision of BPT limitations for BOD and COD, with additional5
incidental COD removal associated with the organics treatment. The second set of removal
9-6
numbers assumes no revision of BPT limitations for BOD and COD, and compliance at BAT5
with a COD limitation equivalent to the BPT COD limitation. Under this approach, there is also
incidental BOD removals associated with the COD treatment.5
9.5.3 PSES
As discussed in 7 of this document, EPA considered multiple regulatory options of PSES for the
four manufacturing subcategories. One option is current treatment (i.e., no revision); this option
results in no additional load reductions under PSES. The remaining options are based on in-plant
steam stripping. Table 9-14 presents load reductions through in-plant steam stripping for organic
compounds and ammonia. These load reductions include the regulated pollutant load reductions
achievable by in-plant steam stripping where the in-plant steam strippers see a raw pollutant load
prior to air emissions or current on-site treatment.
For the Subcategory A and C PSES option that includes in-plant cyanide destruction, there would
be an additional reduction of 1,024 lbs/yr of cyanide.
Load reductions for the Subcategory D indirect dischargers were scaled up according to the
methodology discussed in 3.2.4 and presented in Reference (1). An estimate of the total load
reductions for the Subcategory D indirect dischargers including those not sent a Detailed
Questionnaire are presented in Table 9-15.
9-7
Table 9-1
Estimated Raw Loads by Subcategory Group and Discharge Mode(lbs/yr)
Nonconventional Total 59,076,142 107,416 77,825,876 6,188,939(a)
(a) Untreated load for facilities for which questionnaire data were available. Estimated total priority and nonconventional pollutant load for allfacilities is 7,452,000 lbs/yr.
NA - Not available
Table 9-2
Total Pollutant Load in Untreated Wastewaterfrom Band D Indirect Dischargers
Subcategory B and D Subcategory D Indirect Total Subcategory BIndirect Dischargers from Dischargers Without and D Indirectthe Detailed Questionnaire Questionnaire Dischargers
Total Raw Load forPriority andNonconventionalPollutants (lbs/yr)
6,991,000 461,000 7,452,000
9-10
Table 9-3
Current Pollutant Discharge Loads by Subcategory Group and Discharge Mode
Nonconventional Total 2,531,193 23,230 30,228,558 1,586,824 (a)
(a) Load for facilities for which questionnaire data were available. Estimated total priority and nonconventional pollutant load for all facilities is2,063,000 lbs/yr.
(b) Load for facilities based on detailed questionnaire loadings, DMR reports, sampling, and self-monitoring data (4).
NA - Not available
Table 9-4
Total Pollutant Load Currently Dischargedfrom B and D Indirect Dischargers
Subcategory B and D Subcategory D Indirect Total Subcategory BIndirect Dischargers from Dischargers Without and D Indirect
the Detailed Questionnaire Questionnaire Dischargers
Total Current BaselineLoads for Priority and
NonconventionalPollutants (lbs/yr)
1,603,000 460,000 2,063,000
9-13
Table 9-5
Estimated End-of-Pipe BPT Discharge Load
Pollutant Discharge Load (lbs/yr) Discharge Loads (lbs/yr)Subcategory A and C BPT Subcategory B and D BPT
No Revisions Option
BOD 2,981,441 145,7535
TSS 5,538,216 149,383
COD 29,345,638 544,204
Revise COD Only Option
BOD * 423,766 44,1135
TSS 5,538,216 149,383
COD 17,551,857 107,097
Revise BOD and TSS Option5
BOD 1,636,442 22,9995
TSS 2,945,822 35,861
COD* 28,591,100 192,065
Revise BOD , COD and TSS Option5
BOD 423,766 22,9995
TSS 2,945,822 35,861
COD 17,551,857 107,097
* - These pollutants are incidentally removed under the option.
9-14
Table 9-6
End-of Pipe Discharge Loads for Subcategory A and C Facilities Under BAT Options
(lbs/yr)
Pollutant Treatment Nitrification
Discharge Loads (lbs/yr)
Advanced Advanced BiologicalBiological Treatment with
Priority Organics
Chloroform 118 118
1,2-Dichloroethane 171 171
Methylene chloride 1,663 1,663
Phenol 5 5
Toluene 127 127
Priority Organics Subtotal 2,084 2,084
Priority Pollutants
Cyanide 42 42
Priority Pollutant Total 2,116 2,116
Nonconventional Organics
Acetone 1,349 1,349
Acetonitrile 5,224 5,224
n-Amyl acetate 877 877
Amyl alcohol 826 826
2-Butanone (MEK) 14 14
tert-Butyl alcohol 2,844 2,844
N,N-Dimethylacetamide 135 135
N,N-Dimethylformamide 35 35
Dimethyl sulfoxide 3 3
Ethanol 10,163 10,163
Ethyl acetate 3,803 3,803
Ethylene glycol 39 39
Formaldehyde 1,038 1,038
Table 9-6 (Continued)
Pollutant Treatment Nitrification
Discharge Loads (lbs/yr)
Advanced Advanced BiologicalBiological Treatment with
9-15
Formamide 12 12
n-Hexane 128 128
Isopropanol 9,940 9,940
Isopropyl acetate 894 894
Isopropyl ether 1 1
Methanol 12,920 12,920
Methyl formate 957 957
Methyl isobutyl ketone (MIBK) 533 533
Pyridine 14 14
Tetrahydrofuran 5,307 5,307
Triethylamine 53 53
Xylenes 60 60
Nonconventional Organics Subtotal 57,169 57,169
Ammonia 1,128,044 327,130
Nonconventional Pollutant Total 1,185,213 384,299
9-16
Table 9-7
End-of-Pipe Discharge Loads for Subcategory B and D Facilities Under BAT Options
(lbs/yr)
Pollutant Advanced Biological Treatment
Acetone 8
Ethanol 377
Formaldehyde 58
Isopropanol 195
Methanol 98
Polyethylene Glycol 600 154
Nonconventional Pollutant Total 890 (a)
(a) There are no priority pollutant end-of-pipe discharge loads for Subcategory B and D direct discharging facilities.
9-17
Table 9-8
End-of-Pipe Discharge Loads for Subcategory A and C Facilities Under PSES Options
(lbs/yr)
Pollutant Organics DestructionIn-Plant Steam Stripping for Organics plus In-Plant Cyanide
Nonconventional Pollutant Total 9,067,189 2,559,063
(a) Cyanide is only removed under the PSES option that includes in-plant cyanide destruction. Removals for other PSES options are 0 lbs/yr.
9-28
Table 9-15
Total Pollutant Load Reductions from B and D Indirect Dischargers
Subcategory B and D Subcategory D TotalIndirect Dischargers Indirect Dischargers Subcategory B
Submitted in Detailed Without and D IndirectQuestionnaire Questionnaire Dischargers
Total Load Reduction ThroughIn-Plant Steam Stripping forOrganic Compounds (lbs/yr)
3,314,000 44,500 3,358,500
9-29
1. Memorandum: Subcategory D Indirect Scale-Up Methodology, from K.Mahsman, Radian Corporation, to the Public Record, September 1994.
2. Memorandum: Final Pollutant Loading Estimates for the PharmaceuticalManufacturing Industry - Subcategory A/C and B/D Direct and IndirectDischarging Facilities, from K. Mahsman and M. Willett, Radian Corporation, toF. Hund, USEPA/EAD, August 31, 1994.
3. Letter from M. Willett, Radian Corporation, to K. Koon, Versar, December 15,1994.
4. Memorandum: Ammonia Data Used for Subcategory A/C Direct FacilityLoadings, from T. Brenza, Eastern Research Group, to the Public Record, March1998.
REFERENCES
10-1
SECTION 10
COSTS OF TECHNOLOGY BASES OF REGULATIONS
10.1 Introduction
Previous sections have described the respective BPT, BCT, BAT, NSPS, PSES, and PSNS
technology options that were considered as the bases of regulations for the pharmaceutical
manufacturing industry. This presents the estimated engineering costs associated with installing
and operating each of these technology bases. These costs are calculated to determine the overall
economic impact on the industry of complying with each regulatory option.
The following information is discussed in this section:
C 10.2 discusses the costing methodology;
C 10.3 discusses cost modeling and summarizes cost estimating assumptionsand design bases of the technologies that make up the regulatory options;and
C 10.4 presents the cost estimates by regulatory option.
10.2 Costing Methodology
To accurately determine the impact of the effluent limitations guidelines and standards on the
pharmaceutical manufacturing industry, it is necessary to calculate costs associated with
regulatory compliance. A cost model was developed to represent each of the regulatory options
under BPT, BCT, BAT, PSES, PSNS, and NSPS. The cost model is used to calculate costs for
each option based on the treatment technologies used as the basis for that option. These costs are
estimates of actual compliance costs; however, the regulations do not require that a facility install
or possess the technologies specified as the bases, but only that the appropriate limitations be met.
10-2
The Agency has selected a facility-by-facility approach to costing as opposed to a model facility
approach, because of the variability of processes and resultant wastewaters among pharmaceutical
manufacturing facilities. Detailed facility information was available from responses to the
Detailed Questionnaire and comments on the proposed regulations, which was used to
characterize the wastewater and assess existing treatment technologies at each facility. It should
be noted, however, that in certain instances, engineering assumptions regarding facility operations
were made, or industry average data were used when facility-specific information were not
available. Thus, for any given facility, the costs estimated may deviate from those that would
actually be experienced by the facility. However, since these assumptions were based on industry-
wide data, the resulting estimates are considered accurate when evaluated on an industry-wide,
aggregate basis.
When practical and appropriate, facilities were given credit for existing treatment on site, based
on an evaluation of the following criteria:
C Biological treatment system aeration capacity (in million gallons);
C Clarifier overflow rate (in gallons per minute per square foot);
C Presence of adequate equalization treatment;
C Presence of steam stripping or steam stripping with distillation treatmentthat achieved adequate removal of organic compounds; and
C Presence of cyanide destruction treatment - this credit was given wholly orpartially based on comparison to the treatment systems selected as thetechnology bases.
These treatment credits were used to develop cost estimates for system upgrades instead of new
systems where appropriate. At facilities that currently meet the limitations associated with a
regulatory option, no compliance costs beyond necessary additional monitoring were estimated.
10-3
10.2.1 Cost Model Structure
The model used to calculate wastewater treatment costs was developed based on research into
various existing costing approaches and use of customized computer software tools. The model
consists mainly of a series of technology modules, each of which calculates the costs associated
with a particular treatment technology. These modules can be combined as appropriate to
assemble each of the various regulatory options. A more detailed discussion of the cost model
and its origins is given in Section 10.3.
Operation and maintenance (O&M) and capital costs were calculated by the model for each
technology and then summed for all technologies at each facility. The facility capital and O&M
costs were combined and totaled by subcategory and discharge type (e.g. Subcategory A and C -
indirect discharger).
Annual O&M costs consist of all costs related to operating and maintaining the treatment system
for a period of one year. Sources for O&M costs primarily included literature references and
engineering judgement (typically used in the case of estimating required operator hours). O&M
costs typically include the following:
C Chemical usage;
C O&M labor;
C Removal, transportation, and disposal of any waste solids, sludges,solvents, or other waste products generated by the treatment system; and
C Utilities, such as electricity and steam, required to run the treatmentsystem.
Table 10-1 presents the O&M unit costs most commonly used by the model and includes
references for the origin of each cost.
10-4
Capital costs consist of direct and indirect costs associated with purchase and installation of
wastewater treatment equipment. Primary sources for the capital costs were vendor quotes and
literature references. Table 10-2 presents the unit capital costs most commonly used by the model
and includes references for the origin of each cost. Typically, direct capital costs include the
following:
C Purchase and installation of treatment equipment;
C Purchase and installation of piping, instrumentation, pumps, and otherancillary equipment;
C Electrical hookups;
C Any required site preparation (e.g., excavation);
C Construction of buildings or other structures.
In addition to direct capital costs, indirect costs are also included in the estimate of total capital
cost. Indirect capital costs typically include engineering costs and contractor's fees.
For each technology, it is assumed that ancillary direct capital costs and required indirect capital
costs can be accounted for by using a factor related to purchased and installed capital cost.
Table 10-3 lists these factors for all applicable treatment technologies.
Because all facility-specific information in the questionnaire database is from 1990, all costs are
adjusted to 1990 dollars. This adjustment allows direct comparison between reported financial
data and costs for each facility. Costs are adjusted using the Marshall and Swift 1990 annual
index (915.1) and the index value for the year in which the costs were originally reported using
the following formula:
AC = OC(915.1/OCI) (10-1)
where: AC = Adjusted cost, $OC = Original cost, $OCI = Original cost year index
10-5
The wage rate for all required labor to properly operate and maintain the systems associated with
the technology bases was based on a weighted average, where data were obtained from two
sources: (1) the U.S. National Bureau of Labor Statistics, and (2) industry supplied wage rates.
In 1990, the U.S. National Bureau of Labor Statistics reported that the average wage rate for all
production workers in the Drug Manufacturing industry was $12.90 per hour. This rate was then
increased by 115% to account for supervision (15%), and overhead (100%) to arrive at a total
rate of $27.74 per hour. This cost was assumed for the entire industry except where industry
supplied wage rates. The weighted average wage rate for the entire industry was $27.89 per
hour.
The cost for electricity used by various treatment technologies was obtained from two sources:
(1) 1990 U.S. Department of Energy Statistics for Investor-Owned Utilities for Commercial
Facilities and (2) industry supplied energy costs. The U.S. Department of Energy rate was given
as $0.048 per kilowatt-hour. This cost was averaged with industry supplied costs for a rate of
$0.059 per kilowatt-hour for facilities in the United States. The rate of $0.080 per kilowatt-hour
for facilities in Puerto Rico was derived from an industry supplied rate.
The cost for steam usage was based on a weighted average, where data were obtained from two
sources (1) Plant Design & Economics for Chemical Engineers, Peters and Timmerhaus, Fourth
Edition, and (2) industry supplied steam costs. The unit cost obtained from source (1) was $3.20
per 1,000 pounds of 100 psig steam, and represents the high end of the range of costs given for
100 psig steam. This cost was assumed for the entire industry (U.S.) except where industry
supplied steam costs. The weighted average steam cost for facilities in the United States was
$4.20 per 1000 pounds of 100 psig steam. The steam cost of $6.91 per 1000 pounds of 100 psig
steam for facilities in Puerto Rico was derived from industry supplied costs. These unit costs are
listed along with other O&M unit costs in Table 10-1.
For the cost estimating effort, it was assumed that all Subcategory A and C facilities and
Subcategory B and D direct discharger facilities operate 350 days per year, and that Subcategory
B and D indirect discharger facilities operate 250 days per year. These assumptions are based on
operating modes observed during engineering site visits. If a facility supplied the actual number
10-6
of operating days per year, this number was used. It is also assumed, because of the nature of the
technology, that all biological treatment systems operate 365 days per year, regardless of
subcategory.
10.3 Cost Modeling
10.3.1 Evaluation of Existing Cost Models
Before a costing methodology could be developed, existing cost models were researched and
evaluated to determine which, if any, existing algorithms for costing various treatment
technologies could be used to develop costs for wastewater treatment systems and treatment
system upgrades in the pharmaceutical manufacturing industry. The following models were
initially considered for potential use:
C The Wastewater Treatment System Design and Cost Model (WTSDCM)developed by EPA in the early 1980s for various metal manufacturing-related industries;
C The Cost of Remedial Action model (CORA);
C The Remedial Action Cost Engineering and Requirements (RACER)model;
C The Advanced System for Process Engineering (ASPEN);
C The Computer Assisted Procedure for the Design and Evaluation ofwastewater Treatment systems (CAPDET); and
C The pesticide industry models developed by EPA for pesticide chemicalsmanufacturers and pesticide formulators, packagers, and repackagers,respectively.
The WTSDCM model was eliminated because of the lack of similarity between pharmaceutical
and metal manufacturing industry wastewaters and related treatment techniques. The CORA
model was also eliminated because it had been superseded by the more recently developed
RACER model. The remainder of the cost models were considered further.
10-7
The RACER model was determined not to be applicable because it was designed to address
remedial treatment activities associated with cleanup of contaminated sites, and not industrial
wastewater treatment. ASPEN was also determined not to be applicable because, while serving
as an excellent process simulation tool, it is not set up to serve the cost estimating purposes
required. It also models only the steam stripping treatment technology included in the basis for
the regulatory options.
The remaining models (CAPDET and the pesticide industry models) were determined to have
some appropriate design and costing information, but were not configured properly to be used
directly to cost the pharmaceutical manufacturing industry. Based on this conclusion, it was
determined that the most effective way to model costs for the industry would be through
development of a new cost model.
The resulting cost model is an integrated computer model that uses design and costing
information taken from many sources, including CAPDET and the pesticides industry models.
The cost model includes program files that design and cost all technologies included as bases for
the regulatory options discussed in 7, and data files that include all pertinent facility data.
10.3.2 Model Driver
Because the pharmaceutical manufacturing industry cost model (hereafter referred to as the cost
model) is basically a collection of computer "modules" designed to calculate costs for each of the
basic technologies, it was necessary to include a program to organize the modules and track the
costs for the entire industry. This program has been designated as the model "driver". The model
driver performs the following major functions associated with generating industry costs for each
of the regulatory options:
C Locate and open all necessary input data files;
C Store input data entered by a user of the model;
C Open and run each of the technology modules in the appropriate order;
10-8
C Track all costs and pollutant concentrations generated by the technologymodules; and
C Send tracked costs by subcategory, discharge type, and regulatory optionto a storage file which may be printed or maintained in electronic form.
The following sections list the major technologies included as modules within the cost model, and
describe the major assumptions and costing methodology used for each.
10.3.3 Advanced Biological Treatment
Advanced biological treatment is used to control BOD , COD, and TSS and to degrade various5
organic pollutants. The biological treatment systems are designed based on COD loads, or BOD5
and TSS loads, and desired removal efficiency. Organic pollutant reduction also occurs through
well-operated biological treatment systems. The installation of extended aeration activated sludge
biological treatment was assumed for cost estimating purposes for BOD , COD, TSS and5
organics. For ammonia the installation of a second stage activated sludge nitrification system was
assumed for cost estimating purposes. As shown in Table 7-1, activated sludge treatment is the
most common biological treatment used in the pharmaceutical manufacturing industry. All of the
facilities that form the bases for the limitations based on biological treatment use activated sludge
biological treatment on site.
Typically, an extended aeration activated sludge biological treatment system consists of the
following major equipment:
C An equalization basin;C An aeration basin;C A secondary clarifier; andC A sludge handling system, if necessary.
10-9
10.3.3.1 Overview of Costing Methodology
Facilities requiring additional treatment of BOD , COD, TSS, or organics were costed for5
installing a biological treatment system capable of removing these pollutants down to the long-
term mean performance concentrations for this technology that are discussed in 8.5. If a facility
had no biological treatment on site, a new treatment system was costed. If a facility had
biological treatment on site, an upgrade to the existing system was costed.
Various types of upgrades were possible for a facility with existing treatment on site. If additional
BOD , COD, or organics removal was required, an additional aeration basin was installed in5
parallel with the existing treatment unit. If additional TSS treatment was also required, additional
clarifiers were installed in parallel with the existing clarifiers. If the costed biological treatment
system, whether an upgrade or new system, was determined to generate excess biological solids, a
new sludge handling system was installed. If ammonia removal was required, an additional
aeration basin was installed as a second stage nitrification system with clarifiers.
10.3.3.2 Design Bases and Assumptions
The design of the aeration basin for biological treatment of BOD , COD, TSS and organic5
pollutants, and secondary clarifier are based on a combination of relationships and equations
developed by Eckenfelder and from field data for suspended growth biological treatment. The
design of the aeration basin for biological treatment of ammonia through nitrification are based on
relationships and equations developed by Metcalf and Eddy. Costing equations were taken from
CAPDET for equalization basins, package extended aeration activated sludge units (facility flows
less than 0.5 MGD), full-size extended aeration activated sludge units (flows greater than 0.5
MGD), and circular secondary clarifiers.
Design equations for biological treatment systems were similar for new units and for upgrades.
The following is a list of key design assumptions for costing biological treatment for
pharmaceutical manufacturing facilities:
10-10
C Values for key design parameters associated with biological treatment wereestablished based on subcategory-specific information obtained from theDetailed Questionnaire Responses. These values are listed in Table 10-3.
C The retention time for designed clarifiers is 5 hours.
C The retention time for designed equalization basins is 24 hours (if a newequalization basin is necessary).
C The sludge generated by the biological treatment unit has the followingcharacteristics:
- 1% solids in the sludge from the clarifier to the sludge thickener;
- 5% solids in the sludge from the thickener to the filter press;
- 13% solids in filter press cake; and
- Sludge density equal to 80 lbs/ft .3
C Generated sludge is thickened, dewatered, and hauled off site forincineration as a nonhazardous waste.
C Installation of any of the equipment associated with biological treatmentwill not require purchase of additional land. In response to concern aboutthis assumption, the agency solicited information from facilitiesdocumenting the need for the purchase of additional land for upgrades totheir biological treatment system. Commenters which responded to thesolicitation all have the land available on-site. Therefore, this assumptionhas been maintained.
C One or more floating surface mixers are necessary for operation of theequalization basin. (It is assumed that 30 horsepower per million gallonsare required for mixing in the equalization basin.)
C Fix-mounted surface aerators will be used for treatment of BOD , COD,5
organics, and ammonia.
10.3.3.3 Costing Methodology
Cost equations for purchase and installation of equipment associated with equalization, aeration,
and secondary clarification were obtained from CAPDET. The costs for the following standard-
sized equipment were also obtained from CAPDET: package aeration plant (100,000 gal/day) and
10-11
clarification tank (90-foot diameter). The following costs were obtained from vendors or costing
references: chemical unit costs, excavation unit cost, reinforced concrete installation unit cost,
sludge filter press costs, and sludge hauling and disposal costs. Tables 10-1 and 10-2 presents all
unit costs listed above.
The following are included in the total capital cost calculated for each facility requiring biological
treatment (all equipment costs include purchase and installation):
C A reinforced, concrete equalization basin (if not already existing at thefacility);
C Floating surface mixers for the equalization basin, if necessary;
C A reinforced concrete aeration basin, with associated fixed-mountedsurface aerators, if necessary (aeration basins are provided at facilities withno existing biological treatment, at those needing ammonia nitrification, orwhere existing treatment is not adequate);
C A reinforced concrete clarifier, if necessary (clarifiers are provided atfacilities with no existing biological treatment, or where existing suspendedsolids removal is not adequate);
C Any earthwork required for site preparation prior to installing theequalization basin, aeration basin, or clarifier (earthwork includes theconstruction of curbs and dikes for secondary containment);
C A platform and pedestrian bridge over the aeration basin;
C Sludge thickening tank(s); and
C Filter press(es) for sludge dewatering.
Table 10-4 presents the factors that are used by the cost model to account for ancillary direct and
all indirect capital costs.
The following are included in the total O&M costs calculated for each facility:
10-12
C O&M labor;C Electricity usage;C Chemical purchases;C Miscellaneous O&M materials and supplies; andC Sludge hauling and incineration.
Table 10-5 lists operation and maintenance labor hour requirements for various activities
associated with biological treatment.
All operation and maintenance hour requirement calculations except those used for sludge
handling were based on assumptions and equations from CAPDET. Sludge handling labor hour
requirements were developed based on engineering judgement regarding the labor required for
operation and maintenance of the filter press or presses.
Electricity usage was calculated using relationships provided in CAPDET. Table 10-6 presents
the electricity requirement equations that are used by the cost model for each portion of the
biological treatment system. Miscellaneous O&M material and supply costs are based on factors
provided in CAPDET. Table 10-7 presents the operation and maintenance material and supply
factors that are used by the cost model for biological treatment operations.
Table 10-1 lists unit costs for chemical purchases and sludge hauling and incineration.
10.3.4 Cyanide Destruction Treatment
There are two technologies that are used as the basis for cyanide destruction: hydrogen peroxide
treatment and alkaline chlorination treatment. Hydrogen peroxide technology would be used by
the majority of facilities while facilities with a potential safety hazard would be required to comply
with limitations based on alkaline chlorination. Hydrogen peroxide destruction is used by Facility
30542 and represents the basis of the treatment performance data used by EPA to develop the
limitation for cyanide for facilities currently using hydrogen peroxide destruction. The system
designed and costed by the cost model has a greater degree of control than the system used by
Facility 30542, in that laboratory analysis of treated batches of wastewater for cyanide is required
10-13
prior to discharge. This approach minimizes the potential for releases of wastewater with cyanide
concentrations above the proposed limitations. Facility 30542 currently uses a qualitative field
technique to measure cyanide after treatment which does not provide the same level of precision
and accuracy as the EPA-approved analytical method.
Alkaline chlorination is used by Facility 30567 and represents the basis of the treatment
performance data used by EPA to develop the limitation for cyanide for facilities currently using
alkaline chlorination or hydrolysis technologies. The equipment designed and costed is the same
as that designed and costed for hydrogen peroxide destruction.
The cyanide destruction treatment system costed for the pharmaceutical manufacturing industry
includes the following equipment: four pumps (influent, effluent, sodium hydroxide, and either
hydrogen peroxide or sodium hypochlorite feed pumps), five tanks (pH adjustment, reactor, either
hydrogen peroxide or sodium hypochlorite feed, sodium hydroxide feed, and treated wastewater
storage), two agitators (for the reactor and pH adjustment tanks), and a pre-engineered building
to house the treatment unit. If the required volumes of the chemical additives were less than 5.7
gal/day, 55-gallon drums are used for storage instead of storage tanks.
10.3.4.1 Overview of Costing Methodology
Costs for in-plant cyanide destruction treatment were included for all facilities that reported the
presence of cyanide in their wastewater in the Detailed Questionnaire and who discharged in 1990
cyanide concentrations above the long-term mean treatment performance concentrations provided
in 8. In-plant streams are defined as cyanide-bearing wastewater streams prior to dilution with
non-cyanide-bearing wastewater. Facilities that had portions of the technology bases for this
treatment already on site were given credit for these elements, and therefore did not incur costs
associated with a complete, new treatment system.
10-14
10.3.4.2 Design Bases and Assumptions
Cyanide destruction treatment using hydrogen peroxide is based on the reaction of cyanide with
hydrogen peroxide under basic conditions to form ammonia and carbonate ions. Cyanide
destruction treatment using alkaline chlorination is based on the reaction of cyanide with sodium
hypochlorite under basic conditions to form sodium chloride and carbonate ions. Facilities with
high organic concentrations may not be able to use hydrogen peroxide oxidation because of
potential safety hazards the reaction may cause. Components that comprise the treatment system
were selected based on the system used by Facility 30542. The cost estimates generated by the
cost model are based on the following treatment steps:
C Collection of the wastewater in the pH adjustment tank.
C Addition of sodium hydroxide to raise the pH in the tank.
C Transfer of wastewater to the reactor vessel.
C Addition of either hydrogen peroxide or sodium hypochlorite to the reactorto treat cyanide, followed by field cyanide analysis.
C If the batch fails the field analysis, it is reacted again with either additionalhydrogen peroxide or sodium hypochlorite. If it passes, the wastewater istransferred to the storage tank for laboratory analysis.
C If the batch fails laboratory analysis, it is returned to the hydrogen peroxidereaction vessel for additional treatment. If it passes, it is discharged to theend-of-pipe treatment system (if applicable).
Costs for equipment and chemicals are based on vendor information.
The following key assumptions and design bases were used to cost cyanide destruction treatment:
C There is adequate land to install the treatment unit at each facility requiringcyanide destruction;
C All equipment is sized based on in-plant flow rate reported for wastestreams containing cyanide; and
10-15
C Cyanide destruction treatment is operated in a batch mode, with up tothree batches treated per day.
10.3.4.3 Costing Methodology
The treatment system components were chosen based on the system used by Facility 30542. Unit
costs for the following were obtained from vendors or costing reference manuals: spill
containment drum pallets, pumps, tanks, agitators, earthwork for building installation, pre-
engineered building purchase and installation, chemical purchases, and laboratory and field
monitoring. Tables 10-1 and 10-2 present these unit costs.
The following are included in the direct capital cost calculated for each facility requiring cyanide
destruction treatment:
C Tanks for pH adjustment, reaction, storage of either hydrogen peroxide orsodium hypochlorite, storage of sodium hydroxide, and storage of treatedwastewater prior to discharge;
C For smaller volumes (less than 5.7 gal/day), 55-gallon drums to storechemicals used for cyanide destruction, instead of tanks (if drums are used,drum spill containment pallets are included);
C Pumps for delivering influent wastewater to the system, removing effluentfrom the system, delivering either hydrogen peroxide or sodiumhypochlorite to the reaction tank, and delivering sodium hydroxide to thepH adjustment tank;
C Agitators in the reaction and pH adjustment tanks;
C Earthwork to prepare the site for installation of a pre-engineered building(earthwork includes the construction of curbs and dikes for spillcontainment); and
C A building to house the cyanide destruction treatment system.
Table 10-4 presents the factors for calculating ancillary direct and all indirect capital costs.
10-16
The following are included in the total O&M costs calculated for each facility:
C O&M labor (assumed to be 1 hour per day);C Materials and supplies;C Chemical purchases;C Field monitoring for cyanide concentration;C Laboratory monitoring for cyanide concentration; andC Electricity usage.
Maintenance material and supply costs are calculated based on the following relationships to
installed equipment costs: 1% is used for pumps, 2% is used for storage tanks, and 5% is used
for reaction tanks and agitators. Maintenance of pumps is also assumed to require one hour per
day of operator labor.
Field and laboratory monitoring are assumed to occur once per batch for cyanide destruction
treatment. Table 10-1 lists unit costs for cyanide monitoring. Electricity costs are based on pump
usage.
10.3.5 Steam Stripping
Steam stripping is used to treat organic pollutants and ammonia in wastewater. In a steam
stripping column, the wastewater to be treated is introduced near the top of the column and is
allowed to flow downward through the column by gravity. Steam is simultaneously introduced at
the bottom of the column, and flows countercurrently to the wastewater. In steam stripping
columns, organic compounds and ammonia enter the vapor phase as the steam contacts the
wastewater, and are carried out of the top of the column with the steam. The column overheads
are condensed from vapor to liquid. A portion of the condensed overheads are returned to the
top of the column as reflux, the remaining portion is disposed of off-site. If the condensed
overheads form an aqueous and organic layer, a decanter is used so that the portion returned to
the column is the aqueous layer, while the portion disposed of is the organic layer. Treated
wastewater exits the column from the bottom.
10-17
The following equipment is assumed to be required to perform steam stripping: stripping column,
feed preheater/bottoms cooler, steam condenser, subcooler, decanter, air pollution control device,
bottoms pump, spare pump, piping, and instrumentation. Multiple units may be required for any
or all of the equipment listed above, due to high facility flow rates or if multiple process streams
requiring steam stripping exist at a facility. The air pollution control device is costed as an acid
scrubber if ammonia is present in the waste stream; otherwise it is costed as a carbon canister.
Facilities may find that it is cost effective to route vents from the steam stripper unit to an existing
incinerator or other air pollution control system. This approach was not costed as part of this
effort because information on existing air pollution control systems was not available.
10.3.5.1 Overview of Costing Methodology
Data supplied by the pharmaceutical industry to EPA's Office of Air Quality Planning and
Standards (OAQPS) were used to develop assumptions regarding facility process wastewater
stream flow and load distributions. Every facility was assigned four theoretical waste streams.
Relative flows and stream loads are consistent among all facilities. Stream 1 for each facility
represents 44 percent of the total facility wastewater flow as reported in the Detailed
Questionnaire, and it comprises 1 percent of its total pollutant load (in pounds). Stream 2
represents 9 percent of the flow, and comprises 2 percent of the total pollutant load. Stream 3
represents 19 percent of the flow, and 6 percent of the total load. Stream 4 represents 28 percent
of the total flow, and contains 91 percent of the pollutant load.
Facilities were costed for steam stripping of all process wastewater streams with concentrations of
regulated pollutants above the long-term mean treatment performance concentrations for the
steam stripping options, provided in 8. Cost estimates are based on the installation of the
technology at an in-plant location. An in-plant location is defined as prior to dilution by non-
process wastewater, commingling with other process wastestreams not containing regulated
pollutants at treatable levels, and any conveyance, equalization, or other treatment units which are
open to the atmosphere.
10-18
Facilities were given credit for steam stripping on site if an existing column was used to treat
organic pollutants in wastewater to concentrations below the long-term mean treatment
performance concentrations for steam stripping. If steam stripping treatment existed on site that
did not treat organics to these levels, effluent from the existing column was considered as influent
to the new column to be costed. It may be possible for facilities to improve performance of
existing steam stripping columns to meet the required levels. However, the facility-specific
information provided in responses to the Detailed Questionnaire was not adequate to determine if
this would be possible for individual cases. Therefore, new columns were costed for all facilities
not meeting the long-term mean treatment performance concentrations. The modeled compliance
costs for facilities able to optimize their existing steam stripping column performance will be
higher than actual compliance costs.
Facilities were also given credit for steam strippers to be put in place to meet the upcoming
maximum achievable control technology (MACT) standards. These strippers were assumed to be
in place on streams that EPA's Office of Air Quality Planning and Standards (OAQPS) deemed
cost effective. If these strippers could treat organic pollutants in wastewater to concentrations
below the long-term mean treatment performance concentrations, no additional steam strippers
were costed. Otherwise, steam strippers were costed to treat the effluent from the OAQPS
strippers down to the long-term mean treatment performance concentrations, provided in 8.
10.3.5.2 Design Bases and Assumptions
The steam stripping systems designed and costed by the cost model are based on achieving
sufficient treatment of the least strippable compound present in the process wastewater stream
being treated. Strippability groups were created for the purpose of establishing the design bases
for steam stripping treatment. The strippability groups contain all regulated compounds and
range from most easily stripped (Group 1) to not strippable at all (Group 8). Table 10-8 lists all
potentially regulated compounds by these strippability groups.
10-19
The least strippable compound is selected for a particular stream based on the following criteria:
C Only compounds with concentrations above the steam stripping long-termmean treatment performance concentration are considered;
C Only compounds in the least strippable group (excluding the nonstrippablegroup) of any compounds at the facility are considered; and
C Within the least strippable group, the compound with the lowest Henry'sLaw Constant is selected.
Design parameters for the steam stripping column are selected based on the least strippable
compound and its concentration in the process wastewater to be treated. Key steam stripping
design parameters are:
C K value - the volatility or equilibrium ratio for a contaminant in avapor/liquid system at the temperature and pressure of the column.
C Number of equilibrium stages - the number of contact units in a columnwithin which the concentration of components in the liquid phase is inequilibrium with the concentration of components in the vapor phase.
C Steam-to-feed ratio - the volume of steam required to treat a given volumeof wastewater.
Table 10-9 lists the steam stripping design parameters for constituents in Groups 1 through 7 (no
values are given for compounds in Group 8 because they are not considered treatable by steam
stripping).
Process simulations were used to assist in establishing the cost module design basis in two ways:
1. Process simulations were used to develop process designs that would achieve thelong-term steam stripping performance levels for each of the strippability groups,typical numbers of equilibrium stages and feed/steam (L/V) ratios were determinedusing process simulations discussed in 8 for pollutants in each of the strippabilitygroups; and
10-20
2. Simulations were also used to help estimate a typical K value for pollutants in eachstrippability group.
The model scans all pollutants in each stream at each facility for strippability group and for
concentration. If any regulated pollutants are above the steam stripping long-term mean
treatment performance concentration and are considered strippable, then treatment is costed for
the stream. EPA evaluated each of the four process desegregated streams separately; therefore, a
facility might have four steam stripping systems costed. The largest allowable diameter column
designed by the model is 15 feet. This limitation is based on the difficulty associated with
transporting larger columns. If a column larger than 15 feet is required, multiple columns are
costed.
It is assumed that facilities requiring steam stripping treatment will have adequate space within
existing enclosed process buildings.
10.3.5.3 Costing Methodology
Design equations were obtained from engineering texts, ASPEN methodology, and input from
design engineers. Most unit costs were obtained from algorithms found in Peters and
Timmerhaus, Fourth Edition (12). Others were obtained from vendor quotes. Unit costs were
included in the cost model for the following: packed and tray columns, storage tanks, condensers,
decanters, subcoolers, pumps, air pollution control devices, and feed preheaters. These unit costs
were developed using algorithms dependent on multiple variables, and are presented in the
Pharmaceuticals Manufacturing Industry Cost Documentation Report, which can be found in the
Administrative Record of this rulemaking. Table 10-10 provides the purchase costs for the
smallest and largest size of each major component of the steam stripping treatment unit, as
designed and costed for all pharmaceutical manufacturing facilities that responded to the Detailed
Questionnaire.
10-21
These costs are for individual components only, some systems may require the installation of
multiple components. Pump costs and chemical additive costs were obtained from vendor quotes.
These unit costs are presented in Tables 10-1 and 10-2.
The following are included in the total capital cost calculated for each facility requiring steam
stripping treatment:
C Stainless steel column(s), including either packing or trays (packing wasused for columns with diameters less than 48 inches; trays were used forlarger diameter columns);
C Stainless steel feed preheater(s)/bottoms cooler(s) to prepare influentwastewater for treatment and to maintain an acceptable temperature in theeffluent from the column;
C Stainless steel steam condenser(s)/subcooler(s) to convert overheads fromvapor to liquid;
C Decanter(s) to separate distilled organic compounds from water to bereturned to the column;
C Air pollution control device(s) to remove noncondensible organics orammonia from the vent stream;
C Stainless steel feed collection and storage tanks with capacity to 24 hours;
C Stainless steel distillate collection tank with capacity to 24 hours; and
C Pumps to deliver influent wastewater to the column, refluxed wastewaterback to the column inlet, effluent bottoms to storage tank, distillate tocollection tank, and sodium hydroxide to the feed storage tank if pHadjustment is necessary (pH adjustment is required for streams that containammonia; stripping is performed at a pH of 9 for ammonia-bearingstreams).
Stainless steel components were costed because of the corrosion potential of pharmaceutical
manufacturing wastewater. Hastelloy was considered as a construction material, and may be
necessary on a site-specific basis. However, for the purpose of calculating industry-wide costs,
stainless steel was considered the most appropriate construction material.
10-22
Table 10-4 lists the factors that are used by the model to account for ancillary direct and all
indirect capital costs.
The following are included in the O&M costs calculated for each facility:
C O&M labor;
C Steam usage;
C Chilled water usage for the condenser and subcooler;
C Hydrochloric acid addition to the ammonia scrubber (if necessary) orcarbon canister replacement for air pollution control;
C Sodium hydroxide addition, if pH adjustment is necessary;
C Hauling and disposing of waste hydrochloric acid (if any) and wastesolvents decanted from the column overhead stream;
C Miscellaneous O&M materials and supplies (assumed to be equal to 4% ofthe total capital cost); and
C Electricity usage.
O&M labor requirements are based on 12 labor hours per day to properly operate and maintain
the steam stripping unit. Steam usage is calculated based on the facility flow rate and the selected
steam-to-feed ratio.
Hydrochloric acid usage in the ammonia scrubber is calculated based on the amount of ammonia
in the overhead stream from the column. It is assumed that 20% of the ammonia removed from
the waste stream will be vented to the air pollution control device, and that the mass (pounds) of
hydrochloric acid required will be 2.12 times the mass of the removed ammonia. The value 2.12
is based on the reaction of hydrochloric acid with ammonia in the air pollution control device.
Carbon canister usage is based on the total mass of organic compounds removed from the waste
stream. Based on ASPEN simulations, it is assumed that 0.29% of the overheads from the
column will be vented to the air pollution control device. Based on EPA data from air emission
10-23
studies at Superfund sites, it is assumed that 10 pounds of carbon will be required for each pound
of organics removed in the air pollution control device.
Sodium hydroxide usage is calculated based on the presence of ammonia in the waste stream and
the flow rate of the stream. Hauling and disposing of waste hydrochloric acid and waste solvents
is based on unit costs displayed in Table 10-1. Electrical usage is calculated based on pump usage
and pump horsepower.
10.3.6 Contract Hauling
Cost estimates for contract hauling of wastewater were developed for facilities with low flows.
The treatment consists of storing untreated wastewater at the current end-of-pipe discharge point,
and then hauling it off site for incineration. It has been determined that this approach is more
cost-effective than other in-plant or end-of-pipe treatments for flows below 30 gallons per day.
The equipment required to perform this treatment depends on whether drums or a storage tank
are used to store the wastewater. For drum storage, the only equipment required is the drums. If
a storage tank is used, the equipment includes the tank and a discharge pump. It is assumed that
for each scenario, the facility will have enough existing space for wastewater storage, requiring no
additional land or facility improvement costs.
10.3.6.1 Overview of Costing Methodology
No credit was given to facilities for existing treatment on site. It was assumed that contract
hauling would be performed at facilities with discharge flows below 30 gal/day and regulated
pollutants at concentrations above the long-term mean treatment performance, regardless of the
existing level of treatment.
10-24
10.3.6.2 Design Bases and Assumptions
The following assumptions were made for costing contract hauling:
C Facilities with zero wastewater discharge, no regulated pollutants reported,or no concentrations of regulated constituents above limitations did notincur any costs.
C Wastewater from all facilities requiring contract hauling requiredincineration.
C Any facility with a flow rate greater than 30 gal/day was not considered.
C The incineration facility was assumed to be 500 miles from the generatingfacility.
The selection of drums versus a storage tank for on site storage prior to disposal is based on the
on-site storage time required to generate 5,000 gallons of wastewater. If it takes longer than 45
days to accumulate 5,000 gallons on site (approximately 110 gal/day), drums are used to store the
wastewater. If it takes less than 45 days to generate 5,000 gallons, a storage tank is used instead.
Spill prevention for the drum storage system is provided by including spill prevention drum pallets
for the storage area. These pallets provide a contained space beneath the drums to collect any
leakage or spills.
10.3.6.3 Cost Methodology and Assumptions
Required costs for the following were obtained from vendor information: tanks, pumps, hauling,
incineration, drums, and spill prevention pallets. Tables 10-1 and 10-2 present these unit costs.
The following were included in the total capital cost for each facility requiring contract hauling:
C Storage tank purchase and installation, if necessary (assumed to be an11,000-gallon tank); and
10-25
C Discharge pump purchase and installation (assumed to be a 70-gpm pump),if necessary.
The following items are included as O&M costs for contract hauling:
C Drum purchase, if necessary;
C Spill prevention pallet purchase, if necessary;
C Electricity requirements for the pump, if necessary;
C Tank or drum area daily inspection (15 minutes per day);
C Loading and unloading of wastewater for transport;
C Transport of wastewater to the disposal facility (assumed to be 500 miles);and
C Incineration of the wastewater.
10.3.7 Compliance Monitoring
Compliance monitoring costs were calculated for all pharmaceutical manufacturing facilities that
discharge wastewater. Costs represent analytical analysis costs based on which pollutants were
reported in 1990 to be discharged in a facility's wastewater. Monitoring is required at the end of
pipe for all regulatory options.
Costs for monitoring the discharge levels of BOD , COD, and TSS have not been included, as no5
incremental costs above those which the plants are presently incurring are anticipated. Cyanide
monitoring costs are included as part of the cyanide treatment cost module and are not calculated
in the monitoring module. It is assumed that no additional physical equipment is required to
perform monitoring.
10-26
10.3.7.1 Overview of Costing Methodology
For purposes of estimation, facilities were costed for weekly end-of-pipe (EOP) monitoring for
compounds that were reported in 1990 to be discharged in a facility's wastewater, and one annual
EOP full analytical scan for all regulated pollutants. Permit writers or pretreatment authorities
will determine the frequency of monitoring on a per facility basis. All facilities will be required to
perform the annual EOP full analytical scan.
10.3.7.2 Cost Methodology
There are no capital items associated with compliance monitoring. The only O&M costs included
for this activity are the laboratory analytical costs. It is assumed that the labor required to
perform monitoring sampling is negligible compared to labor requirements already existing at each
facility. It is also assumed that any materials required for monitoring are already present at the
facility or are provided by the laboratory performing the analyses. All analytical cost information
was provided by vendors of analytical services.
10.4 Engineering Costs by Regulatory Option
Table 10-11 presents a summary of estimated BPT, BCT, BAT, and PSES engineering costs,
broken down by subcategory, discharge type, and regulatory option. Costs shown include capital
and operation and maintenance (including energy usage) costs totaled for each group of applicable
facilities.
It should be noted that advanced biological treatment costs are incorporated into both the BPT
and BAT costs for direct dischargers. Facilities would install only one treatment system adequate
to comply with both BPT and BAT limitations.
Table 10-12 presents a summary of estimated NSPS and PSNS engineering costs on an amortized
yearly basis.
Amortized Capital Cost ($/yr) ' Capital Cost ($)i (1 % i)n
(1 % i)n & 1
10-27
For NSPS and PSNS, costs were developed using the existing facility information to model
potential new source facilities. NSPS and PSNS costs were developed on an annualized basis
using amortized yearly costs and assuming a Subcategory A and/or C facility flow rate of 1 MGD
and a subcategory B and/or D facility flowrate of 0.1 MGD.
The amortized yearly costs are equal to the sum of amortized capital costs and the yearly
operation and maintenance costs. The capital costs are amortized using the following equation:
where: I = Interest rate of .07
n = Equipment depreciation period of 16 years.
10-28
Table 10-1
Operation and Maintenance Unit Costs Used By the Cost Model
Unit Disposal Costs
Activity Cost (1990 $) Units Reference
Incinerate drums of liquid waste 480.10 55-gallon drum 2
Dispose of bulk wastewater 5.02 gallon 2
Incinerate solvents in bulk 280.00 ton 3,4,36
Incineration of waste HCL 280.00 ton 4
Dispose of biological treatment sludge 50.00 ton 5 (a)
Unit Hauling Costs
Activity Cost (1990 $) Units Reference
Haul solvents 29.02 ton 4
Haul drums/bulk wastewater full load (80 drums or2,626.00
(a) All equations yield values in kilowatt-hours.(b) This equation represents operating aerators 90% of the time, every day, year-round.FLOW - Facility flowrate (MGD).TICA - Total installed capacity of aeration (horsepower).SA - Clarifier surface area (ft ).2
10-36
Table 10-7
Operation and Maintenance Material and Supply Cost Factors for BiologicalTreatment
Activity Miscellaneous O&M Cost
Package aeration 1.74 (FLOW)-0.2497
Full-size aeration 4.225 - 0.975log (TICA)
Clarification 1 percent of total clarification purchased and installedequipment costs
FLOW - Facility flowrate (MGD)TICA - Total installed capacity of aeration (horsepower)
10-37
Table 10-8Steam Stripping Strippability Groups for All Regulated Compounds
Compound Strippability Group Compound GroupStrippability
n-Heptane 1 Acetone 5
n-Hexane 1 Amyl alcohol 5
Benzene 3 2-Butanone (MEK) 5
Chlorobenzene 3 tert-Butyl alcohol 5
Chloroform 3 N,N-Dimethylaniline 5
o-Dichlorobenzene 3 Formamide 5
1,2-Dichloroethane 3 Isopropanol 5
Isopropyl Ether 3 Methyl Formate 5
Methyl Cellosolve 3 MIBK 5
Methylene Chloride 3 Ethanol 6
Toluene 3 n-Propanol 6
Xylenes 3 Aniline 7
Ammonia 4 n-Butyl alcohol 7
n-Amyl Acetate 4 1,4-Dioxane 7
n-Butyl Acetate 4 Pyridine 7
Diethylamine 4 Methanol (Methyl alcohol) 7
Ethyl Acetate 4 Petroleum naphtha 7
Isobutyraldehyde 4 Acetonitrile 8
Isopropyl Acetate 4 N,N-Dimethylacetamide 8
Tetrahydrofuran 4 N,N-Dimethylformamide 8
Triethylamine 4 Dimethyl sulfoxide 8
Ethylene glycol 8
Formaldehyde 8
Phenol 8
Polyethylene glycol 600 8
10-38
Table 10-9
Steam Stripping Design Parameters Established by Strippability Group
Strippability Concentration of Least Equilibrium Feed-to- SteamGroup Strippable Contaminant K Value Stages Ratio
Number of
1 ALL 10,219 4 12.0
2 ALL 1874.2 4 12.0
3 ALL 400 6 12.0
4 < 2,000 44.5 8 12.0
> 2,000 44.5 10 12.0
5 5,000 < conc. # 10,000 21.6 14 12.1
# 1,000 21.6 10 12.3
1,000 < conc. # 5,000 21.6 14 12.9
10,000 < conc. # 50,000 21.6 14 10.9
> 50,000 21.6 14 9.7
6
< 1,000 11.5 14 12.0
1,000 < conc. # 5,000 11.5 14 8.8
5,000 < conc. # 10,000 11.5 14 7.9
> 10,000 11.5 14 6.8
7 10,000 < conc. # 20,000 7.8 14 5.5
< 5,000 7.8 14 7.8
5,000 < conc. # 10,000 7.8 14 6.3
20,000 < conc. # 30,000 7.8 14 5.1
> 30,000 7.8 14 4.6
8 NA NA NA NA
conc. - Concentration in mg/L.ALL - Compounds in Groups 1, 2, and 3 are considered very strippable; therefore, all expected influent concentrationscan be treated to limitations using the design criteria listed.NA - Compounds in Group 8 are not considered strippable; therefore, no design parameters are listed.
10-39
Table 10-10
Purchase Cost Range for the Major Component of the Steam StrippingTreatment Unit
Component Cost Size Cost Size
Smallest Unit Largest Unit
Packed Column $17,552 Diameter = 10 in. $141,724 Diameter = 32 in.
Tray Column $67,710 Diameter = 14 in. $208,528 Diameter = 35 in.
Condenser and Subcooler $4,430 Surface area = 52 ft $34,439 Surface area = 1,327 ft2 2
Revise BOD & TSS Advanced Biological 31,872,354 19,036,759 -- -- --Treatment and EffluentFiltration PolishingPond
BAT Revise COD to Advanced Biological 0 0 Advanced Biological 0 0BPT Limits and Treatment and Revised Treatment andClarify Cyanide Monitoring Withdraw Cyanide
Requirements forCyanide
Add Organics Only, Advanced Biological 1,440,154* 1,775,563* Advanced Biological 887,021* 248,325*Revise COD to Treatment and Revised Treatment andBPT Limits and Monitoring Withdraw CyanideClarify Cyanide Requirements for
Cyanide
Add Organics and Advanced Biological 5,569,135 2,423,725 NA NAAmmonia, Revise Treatment withCOD to BPT Nitrification, andLimits, and Clarify Clarify CyanideCyanide
Ammonia limits donot apply for B/Dfacilities
Table 10-11 (Continued)
Regulation Option and C Facilities Cost ($/yr) ($/yr) and D Facilities Cost ($/yr) Cost ($/yr)Subcategory A Capital O&M Cost Subcategory B Capital O&M
10-41
PSES No Revision Current Treatment 0 0 Current Treatment 0 0(MACT Only) and Technology and Technology andClarify Cyanide revised monitoring Withdraw Cyanide
requirements forCyanide
Organics Only and NA NA In-Plant Steam 17,880,239 4,643,632Withdraw Cyanide Stripping for Organic
This option was notconsidered for A/Cfacilities Compounds and
Withdraw Cyanide
Organics and In-Plant Steam 80,864,749 28,597,243 NA NAAmmonia, and Stripping for OrganicClarify Cyanide Compounds and
Ammonia (and revisedmonitoringrequirements forCyanide(nitrificationing beused for ammonia))
Ammonia andCyanide limits donot apply for B/Dfacilities
Organics and In-Plant Steam 81,192,219 28,839,569 NA NAAmmonia and Stripping for OrganicRevise Cyanide Compounds and
ammonia and in-plantcyanide destruction(nitrification may beused for ammonia)
Ammonia andcyanide limits donot apply for B/Dfacilities
* Costs for this option were calculated based on the list of pollutants considered for regulation, rather than the list selected for regulation. Actual costs wouldbe slightly less due to reduced monitoring requirements.
10-42
Table 10-12
Summary of NSPS and PSNS Engineering Costs
Regulation Option and C Facilities Cost ($/yr) (MGD) and D Facilities Cost ($/yr) (MGD)Subcategory A Annualized Flowrate Subcategory B Annualized Flowrate
Costs at Set SetCosts at
NSPS Revise Equal to Advanced Biological $225,189 1 Advanced Biological $70,218 0.1Promulgated Level Treatment with Treatmentof BPT/BAT Nitrification, and
1. Radian Corporation. Proposed Pharmaceutical Manufacturing Industry CostDocumentation Report. Herndon, Virginia, October 1994. Prepared for the U.S.Environmental Protection Agency.
2. Radian Corporation. Final Pesticide Formulators, Packagers and RepackagersCost and Loadings Report. Herndon, Virginia, March 1994. Prepared for theU.S. Environmental Protection Agency.
3. Information submitted by Hoffman-LaRoche to EPA at an October 7, 1993meeting.
4. Personal communication with R. Bobal, Hoffman-LaRoche, April 27, 1993.
5. U.S. EPA. 1990 Pharmaceutical Manufacturing Industry Survey. OMB No.2040-0146, September 1991.
6. Personal communication with Chemical Waste Management, March 29, 1993.
7. Chemical Marketing Reporter. Issues from June 2, 1990 and December 3, 1990.
8. Personal communication with Technician at Dubois Chemicals USA, May 13,1993.
9. Personal communication with National Bureau of Labor Statistics representative,March 13, 1992.
10. Personal communication with Department of Energy representative, February 18,1993.
11. Peters, M.S. and K.D. Timmerhaus. Plant Design and Economics for ChemicalEngineers, Fourth Edition. McGraw-Hill, Inc., New York, New York, 1990.
12. Personal communication with NSSI Recovery representative, March 13, 1992.
13. R.S. Means Co., Inc. Means Site Work Cost Data. 1989.
14. Personal communication with Rich Davis, Pfeizer Corp., May 4, 1993.
15. Lancaster Laboratories. 1994 Schedule of Services.
16. Pereira, P.E., et al. 1986 Dodge Construction Systems Costs, McGraw-HillInformation Systems Company, Princeton, New Jersey.
10-44
17. R.S. Means Co., Inc. Building Construction Cost Data. 1986.
18. R.S. Means Co., Inc. Means Site Work Cost Data. 1989.
20. R.S. Means Co., Inc. Means Site Work Cost Data. 1989.
21. Harris, R.W., M.J. Cullinane and P.T. Sun, eds. Process Design and CostEstimating Algorithms for the Computer Assisted Procedure for Design andEvaluation of Wastewater Treatment Systems (CAPDET). United States ArmyEngineer Waterways Experiment Station, Vicksburg, Mississippi, 1982. (Preparedfor the U.S. Environmental Protection Agency).
22. Richardson Engineering Services, Inc. Process Plant Construction EstimatingStandards. 1992
23. Personal communication with representative of MET-CHEM Corporation, March15, 1993.
24. Non-Ferrous Metals Forming Rulemaking, Tank Costs. May 1989.
25. New Pig Corporation. 1992 Catalogue of Equipment Prices.
26. Engineering costing calculations performed by Barbara Wong, RadianCorporation, March 10, 1994.
27. Non-Ferrous Metals Forming Rulemaking, Pump Costs. May 1989.
28. Columbian Tank Company. Installed Tank Unit Costs for 1992.
29. Personal communication with Jim Gault, Aqua-aerobics, November 4, 1992.
30. Non-Ferrous Metals Forming Rulemaking, Agitator Costs. May 1989.
31. Non-Ferrous Metals Manufacturing Rulemaking, Components of Total CapitalInvestment. May 1989.
32. Administrative Record for the Proposed Effluent Limitations Guidelines andStandards for the Metal Products and Machinery Phase I Point Source Category. U.S. Environmental Protection Agency, May 30, 1994.
33. [Comments to Proposed Effluent Limitations Guidelines and Standards for thePharmaceutical Point Source Category. U.S. Environmental Protection Agency,May 1995.] PhRMA, BI Chemicals.
10-45
34. Schering Labs, BI Chemicals, Upjohn.
35. Schering Labs, BI Chemicals.
36. BI Chemicals, Abbott, Eli Lilly, Schering Labs, Hoffmann-LaRoche, Mallinckrodt,Upjohn.
37. Cost Model Unit Cost Documentation, DCN 8292.
11-1
SECTION 11
REGULATORY OPTIONS SELECTION
11.1 Introduction
This presents the final selected regulatory options for the pharmaceutical manufacturing industry
and discusses the factors considered in determining the selected options for BPT, BAT, NSPS,
PSES, and PSNS. Factors considered included: reduction in pollutant discharges to the
environment, costs to the industry, age of the equipment and facilities involved, the manufacturing
processes used, process changes required, nonwater quality environmental impacts, engineering
aspects of the control technologies, and energy requirements.
The regulatory options selected provide the technology basis of the effluent limitations guidelines
and standards presented in Sections 13 (BPT), 15 (BAT), 16 (NSPS), and 17 (PSES and PSNS).
Selection of the BCT option is determined by the BCT cost test analysis, which is discussed in 14.
Owners or operators of facilities subject to these regulations would not be required to use the
specific wastewater treatment technologies selected by EPA to establish the limitations and
standards. Rather, a facility could choose to use any combination of process changes, water use
changes, and wastewater treatment to comply with the limitations and standards provided that the
limitations and standards are not achieved through prohibited dilution.
Sections 11.2 through 11.6 provide an overview of the regulatory options considered, the options
selected as the bases of the final regulation, and the rationale for options selected under BPT,
BAT, NSPS, PSES, and PSNS, respectively.
11.2 BPT
Effluent limitations guidelines based on the best practicable control technology currently available
apply to direct discharges and are generally based on the average of the best existing performance,
in terms of treated effluent discharged by facilities in a subcategory. BPT focuses on end-of-pipe
11-2
treatment technology and such process changes and internal controls that are common industry
practice. Based on 304(b)(1)(B) of the CWA, the factors considered in assessing BPT include:
C The cost of achieving effluent reductions in relation to the effluentreduction benefits;
C The age of equipment and facilities involved;
C The process used;
C Process changes required;
C Engineering aspects of the control technologies;
C Nonwater quality environmental impacts (including energy requirements);and
C Other factors the Administrator deems appropriate.
The Agency is not changing the current BPT effluent limitations set for pH in the November 17,
1976 interim final regulation for the pharmaceutical manufacturing industry.
Table 11-1 lists the BPT regulatory options considered by the Agency as discussed in 7.3.2.
EPA has determined to revise BPT effluent limitations only for COD for Subcategories A, B, C,
and D. EPA is also clarifying the compliance monitoring requirements for the existing BPT
limitations for cyanide for Subcategories A and C, and withdrawing the existing cyanide
limitations for Subcategories B and D. By revising BPT (and BAT) for COD, plants will not only
remove large amounts of COD, but also achieve significant incidental removals of BOD and TSS. 5
For this reason, EPA has determined that it is not necessary to separately revise the BPT limits for
BOD and TSS in this case.5
EPA has determined to revise BPT for COD because the biological treatment technology used as
a basis for the limitations really represents BPT technology and is widely used in the industry. 31
11-3
of 38 direct discharging pharmaceutical manufacturing facilities currently use on-site activated
sludge biological treatment as part of their wastewater treatment systems.
The bulk parameter and nonconventional pollutant COD is an indicator of organic matter in the
wastestream that is susceptible to strong oxidation, and as such would also contain much of the
BOD that would be measured. In addition, limited studies and discharge monitoring data have5
identified toxicity associated with the COD levels contained in effluents from pharmaceutical
manufacturing facilities.
With regard to cyanide, EPA is retaining the existing BPT limitations for the A and C
subcategories. EPA did not revised the BPT cyanide limitations because the removal achievable
by the limitations was estimated to be less than 38 pounds per year and was deemed to be not
significant in relation to the annualized costs.
However, EPA is modifying the requirements for compliance monitoring (for Subcategories A
and C). The current limitations require compliance monitoring after cyanide treatment and before
dilution with other wastestreams, or in the alternative, monitoring after mixing with other
wastestreams based on a standard dilution factor. The modified monitoring requirements do not
change the prohibition on dilution to meet the effluent limitations for cyanide. Monitoring for
compliance with the existing limitations is required in-plant, prior to the commingling of cyanide-
bearing wastestreams with non-cyanide-bearing wastestreams for those facilities where the
cyanide levels would be below the level of detection at the end-of-pipe monitoring location. The
only change in the monitoring requirements is to eliminate the current dilution standard that
applied industry-wide, and to allow individual facilities to demonstrate that end-of-pipe
monitoring for cyanide is feasible (i.e., cyanide is detectable once dilution effects are accounted
for); those facilities may continue to monitor at the end-of-pipe. EPA is withdrawing the cyanide
limitations for Subcategories B and D, as cyanide is not used or generated in these subcategories.
11-4
11.3 BAT
Effluent limitations guidelines based on the best available technology economically achievable
represent the best existing economically achievable performance of plants in the industrial
subcategory. The CWA establishes BAT as the principal national means of controlling the direct
discharge of priority pollutants and nonconventional pollutants to waters of the United States.
Based on 304(b)(2)(B) of the CWA, the factors considered in assessing BAT include:
C The age of equipment and facilities involved;
C The process used;
C Process changes required;
C Engineering aspects of control technologies;
C The cost of achieving effluent reduction;
C Nonwater quality environmental impacts (including energy requirements);and
C Other factors the Administrator deems appropriate.
The Agency retains considerable discretion in assigning the weight to be accorded these factors.
BAT may include process changes or internal controls, even when these technologies are not
common industry practice.
Table 11-1 lists the BAT regulatory options considered by the Agency as discussed in 7.3.4.
Analysis of the impacts of these options in terms of reduction in pollutant discharges to the
environment, costs to industry, and nonwater quality environmental impacts (including energy
impacts) are described in 9, 10, and 12, respectively.
For Subcategories A and C, EPA evaluated the costs and economic impacts associated with each
option and determined that all the options were economically achievable. After considering the
pollutant load removals, the costs, as well as the non-water quality environmental impacts
11-5
associated with the options, EPA selected the third option which adds effluent limitations for 30
organic pollutants, ammonia and COD and clarifies the cyanide monitoring requirements. EPA
believes that this option is economically achievable and there are no significant adverse non-water
quality impacts associated with it. In addition, EPA believes the discharge loadings of ammonia,
COD and the organic pollutants are significant from Subcategory A and C facilities, and that
limitations on these discharges are appropriate. EPA has also evaluated the technology bases of
the final BAT limitations in the context of the BAT statutory factors, i.e., the age of equipment
and facilities involved, the process(es) employed, potential process changes and non-water quality
impacts such as energy requirements. EPA believes the final BAT limitations are appropriate
based on its assessment of these factors in relation to A and C subcategory facilities.
For Subcategories B and D, EPA has identified only the pollutant COD for control by BAT
limitations based on advanced biological treatment (the technology selected as the basis for the
BPT limitations). As discussed under BPT, cyanide is not a pollutant of concern for Subcategory
B and D operations and EPA is withdrawing the current BAT cyanide limitations for facilities
with subcategories B and D operations. EPA also has determined that ammonia is not a pollutant
of concern for these subcategories since ammonia is not found in significant amounts in
wastewaters from these operations.
EPA has evaluated the discharge loadings of organic pollutants from Subcategory B and D
facilities and has determined that 95 percent of the discharge of organic pollutants is from two
facilities. Most direct discharging Subcategory B and D facilities do not discharge any organic
pollutants. EPA believes these organic pollutant discharges are not sufficient to justify national
regulations for these subcategories. If permit writers determine the need to further control the
organic pollutants from the two facilities, the appropriate limits contained in the Subcategory A
and C BAT regulations may be used. EPA has selected the first option, which is to only add the
BPT revised COD limitations to BAT for Subcategory B and D facilities, and to withdraw the
existing cyanide limitations.
11-6
11.4 NSPS
The basis for new source performance standards under 306 of the CWA is the best available
demonstrated technology. Industry has the opportunity to design and install the best and most
efficient pharmaceutical manufacturing processes and wastewater treatment systems at new
plants. Accordingly, Congress directed EPA to consider the best demonstrated alternative
processes, process changes, in-plant control measures, and end-of-pipe wastewater treatment
technologies that reduce pollution to the maximum extent feasible. In response to that directive,
and as with the development of options for the BAT effluent limitations guidelines, EPA
considered effluent reductions attainable by the most advanced and demonstrated process and
treatment technologies at pharmaceutical manufacturing facilities.
The general approach followed by the Agency for developing NSPS options was, where
appropriate, to evaluate the best demonstrated processes for control of priority and
nonconventional pollutants at the process level and best demonstrated end-of-pipe treatment for
control of conventional pollutants and additional control of certain nonconventional pollutants.
The factors considered in assessing NSPS include:
C The demonstration status of the process and wastewater treatmenttechnologies;
C The cost of achieving effluent reductions;
C Nonwater quality environmental impacts; and
C Energy requirements.
For Subcategories A, B, C, and D, EPA evaluated technology options capable of achieving
greater pollutant removal of conventional pollutants (BOD and TSS), COD, organics, cyanide5
and ammonia than the selected bases for existing source limitations (BPT, BCT, and BAT). The
only option potentially capable of achieving additional removals involves the use of granular
activated carbon (GAC) adsorption technology. This technology is capable of reducing the COD
11-7
from some direct discharging A and C subcategory facilities. However, there is only limited GAC
performance data available, from one pilot study.
Therefore, EPA is promulgating NSPS equal to the final BAT effluent limitations for organic
pollutants, cyanide, and ammonia. EPA is also promulgating revised NSPS for BOD , COD and5
TSS for all four subcategories at a level equal to the discharge characteristics of the best
performing BPT plants. For COD this is equivalent to the BAT/BPT level of control. These final
standards are based on the best available demonstrated control technologies, which include
advanced biological treatment for all four subcategories, and cyanide destruction and nitrification
for Subcategories A and C. In developing these final standards, the Agency considered factors
including the cost of achieving effluent reductions, non-water quality environmental impacts, and
energy requirements. EPA finds that the final standards represent the best available demonstrated
control technologies, are economically achievable and have acceptable non-water quality
environmental impacts.
11.5 PSES
Pretreatment standards for existing sources are designed to prevent the discharge of pollutants
which pass through, interfere with, or are otherwise incompatible with the operation of POTWs.
The CWA requires pretreatment for pollutants that interfere with or pass through POTWs in
amounts that would exceed direct discharge effluent limitations or limit POTW sludge
management alternatives, including the beneficial use of sludges on agricultural lands. The
Agency is also requiring pretreatment for pollutants that pass through POTWs due to the
pollutant exhibiting significant volatilization prior to treatment by a POTW. The transfer of a
pollutant to another media (air) through volatilization does not constitute treatment. PSES are to
be technology-based and analogous to BAT for removal of priority and nonconventional
pollutants.
Table 11-1 lists the PSES regulatory options considered by the Agency as discussed in 7.3.6.
11-8
For Subcategory A and C facilities, due to the low pollutant removals achievable by the revised
cyanide standards (approximately 1,000 lbs. Per year with 97 percent of the removals coming
from one facility) in relation to the compliance costs, EPA has decided not to revise the existing
cyanide standards, and has selected the option to add organics and ammonia only and modify the
current cyanide monitoring requirements. The selected option adds standards for ammonia and
the 23 organic pollutants determined to pass through (see 17), and modifies the monitoring point
for the current cyanide pretreatment standards for Subcategories A and C.
EPA is setting pretreatment standards for ammonia for Subcategories A and C because of the high
loads of ammonia currently being discharged by a number of pharmaceutical facilities to POTWs
that do not have nitrification capability and receive wastewaters from Subcategory A and C
facilities. However, EPA is aware that some POTWs treating pharmaceutical wastewaters from
these subcategories have nitrification capability, and EPA has made a determination of no pass
through for ammonia at these POTWs. Thus, PSES ammonia limitations will not apply to
Subcategory A and C facilities discharging to POTWs with nitrification capability.
The pollutants regulated under the selected PSES option of Subcategories A and C have been
determined to pass through and the pollutant removals are high with respect to the compliance
costs. The costs for this option are economically achievable and the nonwater quality
environmental impacts are acceptable.
For PSES for Subcategories B and D, EPA has selected the second option (organics only and
withdraw cyanide). EPA is basing this selection on the fact that the five pollutants regulated
under this option have been determined to pass through, and the pollutant removals are high with
respect to the compliance costs. EPA has decided to withdraw the existing cyanide standards,
since cyanide is not present in wastewaters for these subcategory facilities. The costs for this
option are economically achievable, and the nonwater quality environmental impacts are
acceptable.
11-9
11.6 PSNS
Pretreatment standards for new sources are designed to prevent the discharge of pollutants that
pass through, interfere with, or are otherwise incompatible with the operation of POTWs. The
CWA requires pretreatment for pollutants that pass through POTWs or limit POTW sludge
management alternatives, including the beneficial use of sludges on agricultural lands.
The development of regulatory options for PSNS is analogous to the development of options for
NSPS, in that the new source has the opportunity to design and install the best and most efficient
pharmaceutical manufacturing processes and wastewater treatment facilities. Accordingly,
Congress directed EPA to consider the best demonstrated alternative processes, process changes,
in-plant control measures, and end-of-pipe wastewater treatment technologies that reduce
pollution to the maximum extent feasible. In response to that directive, EPA considered effluent
reductions attainable by the most advanced and demonstrated process and treatment technologies
at pharmaceutical manufacturing facilities. The factors considered in assessing PSNS include:
C The demonstration status of the process and wastewater treatmenttechnologies;
C The cost of achieving effluent reductions;
C Nonwater quality environmental impacts; and
C Energy requirements.
EPA selected PSNS limits equal to PSES for Subcategories A, B, C, D. EPA was unable to
identify a technology that would achieve greater removal of the pollutants to be controlled by the
PSES being promulgated and is therefore promulgating PSNS equal to PSES for all four
Subcategories.
11-10
Table 11-1
Summary of BPT, BAT, and PSES Regulatory Options
Regulation Option Name Subcategory A and C Facilities Subcategory B and D Facilities
Technology Basis
BPT No Revision (MACT Only) Current Treatment Technology Current Treatment Technology andWithdraw Cyanide
Clarify Cyanide, Revise Advanced Biological Treatment and Advanced Biological Treatment andCOD Only Revised Monitoring Requirements for Withdraw Cyanide
Cyanide
Clarify Cyanide, Revise Advanced Biological Treatment and Advanced Biological Treatment andBOD and TSS Only Revised Monitoring Requirements for Withdraw Cyanide5
Cyanide
Clarify Cyanide and Revise Advanced Biological Treatment and Advanced Biological Treatment andBOD , TSS, & COD Revised Monitoring Requirements for Withdraw Cyanide5
Cyanide
BAT Revise COD to BPT Limits Advanced Biological Treatment and Advanced Biological Treatment andand Clarify Cyanide Revised Monitoring Requirements for Withdraw Cyanide
Cyanide
Add Organics Only, Revise Advanced Biological Treatment and Advanced Biological Treatment andCOD to BPT Limits, and Revised Monitoring Requirements for Withdraw CyanideClarify Cyanide Cyanide
Add Organics and Ammonia, Advanced Biological Treatment withRevise COD to BPT Limits, Nitrification, and Revised Monitoringand Clarify Cyanide Requirements for Cyanide
Ammonia and cyanide limits do notapply for B/D facilities
PSES No Revision (MACT Only) Current Treatment Technology and Current Treatment Technology andand Clarify Cyanide Revised Monitoring Requirements for Withdraw Cyanide
Cyanide
Organics Only and Withdraw In-Plant Steam Stripping for OrganicCyanide Compounds and Withdraw Cyanide
This option was not considered forA/C Facilities
Organics and Ammonia, and In-Plant Steam Stripping for OrganicClarify Cyanide Compounds and Ammonia, and
Revised Monitoring Requirements forCyanide (Nitrification may be used forAmmonia)
Ammonia and Cyanide limits do notapply for B/D Facilities
Organics and Ammonia, and In-Plant Steam Stripping for OrganicRevise Cyanide Compounds and Ammonia, and In-
Plant Cyanide Destruction(Nitrification may be used forAmmonia)
Ammonia and Cyanide limits do notapply for B/D Facilities
12-1
SECTION 12
NONWATER QUALITY ENVIRONMENTAL IMPACTS
12.1 Introduction
Sections 304(b) and 306 of the CWA require EPA to consider the nonwater quality environmental
impacts associated with effluent limitations guidelines and standards. In accordance with these
requirements, EPA has considered the potential effect of the final regulatory options for the
pharmaceutical manufacturing industry on energy consumption, air emissions, and solid waste
generation. Sections 12.2, 12.3, and 12.4, respectively, discuss these nonwater quality
environmental impacts. The Agency's development of air emission standards is discussed in 12.5.
12.2 Energy Impacts
Energy impacts to the pharmaceutical manufacturing industry from the final regulatory options
will include increased electrical usage and increased energy usage in the generation of steam for
steam stripping. These energy impacts are discussed below in Sections 12.2.1 and 12.2.2.
12.2.1 Electrical Usage
According to the Department of Energy, the pharmaceutical manufacturing industry purchased
approximately 5,404 × 10 kWh of electrical energy in 1990, accounting for 0.7% of the total6
U.S. industrial electrical energy purchase (756,646 × 10 kWh) in 1990.(1) The Agency6
evaluated the annual incremental increase in electrical power consumption expected under each
regulatory option for direct dischargers. These estimated annual incremental increases (in kWh)
are shown in Table 12-1.
For Subcategory A and C operations, the Agency is promulgating the second BPT Option (clarify
CN and revise COD only) and the third BAT Option (Add Organics and Ammonia). Taken
12-2
together, these options would increase the electrical power consumption by less than 0.1 percent
of the total electrical power purchased in 1990 by the pharmaceutical manufacturing industry.
For Subcategory B and D operations, the Agency is promulgating the second BPT Option (clarify
CN and revise COD only) and the first BAT Option (No revision). Taken together these options
would increase the electrical power consumption by less than 0.02 percent of the total electrical
power purchased in 1990 by the industry.
For indirect dischargers regulated under PSES, changes in electrical energy consumption are
shown in Table 12-2.
For Subcategory A and C operations, the Agency is promulgating the third PSES Option (add
Organics and Ammonia, and clarify CN) and would increase the electrical power consumption by
less than 0.1 percent of the total electrical power purchased in 1990 by the industry. For
Subcategory B and D operations, the Agency is promulgating the second PSES Option (add
Organics and withdraw CN) and would increase the electrical power consumption by less than
0.01 percent of the total electrical power purchased in 1990 by the industry.
12.2.2 Energy Usage in the Generation of Steam
Of greater impact is the energy usage required to generate steam under the regulatory options that
include steam stripping. Steam stripping is part of PSES options considered for Subcategory A
and C indirect dischargers and Subcategory B and D indirect dischargers. The impacts of steam
usage under BAT and BPT options are negligible. The Agency evaluated the annual incremental
increase in energy usage from steam generation expected under each of the PSES options. These
estimated annual incremental increases (in kWh/yr) are shown in Table 12-3.
According to the Department of Energy (1), the pharmaceutical manufacturing industry purchased
approximately 6,953 × 10 kWh of fuel and electric energy in 1990. For Subcategory A and/or C6
operations at indirect dischargers, the Agency is promulgating the third PSES Option (Add
Organics and Ammonia, and clarify CN) which would increase the energy consumption for steam
12-3
generation by about 7 percent of the total fuel and electrical power purchased in 1990. For
Subcategory B and/or D operations at indirect dischargers, the Agency is promulgating the
second PSES Option (Add Organics and withdraw CN) which would increase the energy
consumption for steam generation by an amount less than one percent of the total fuel and
electrical power purchased in 1990.
It should be noted that since proposal, EPA has modified its steam stripping module to
incorporate a revised approach for determining stream characteristics, resulting in a better
estimation of the energy consumption for steam generation associated with steam stripping
options. At proposal, EPA assumed from the detailed questionnaire responses that wastewater
streams containing high concentrations of volatile organic pollutants could not be segregated from
streams containing minimal or no concentrations of these pollutants. The Agency has since
revised its methodology to distribute the process wastewater flow and load according to the
disaggregation approach used in the MACT Standards, which assumes that pharmaceutical
process wastewaters can be represented by four streams. Using this disaggregation approach has
provided a better estimate of the volume of wastewater that is subject to steam stripping, and,
therefore, a better estimate of the energy demand related to steam usage.
Table 12-4 summarizes the estimated increase in energy usage (including electrical power and
steam generation) associated with the final regulations. Compliance with the final regulations is
estimated to increase the industry's energy usage by approximately 7.6 percent. While the steam
generation required under the final regulations requires increased energy consumption, the
Agency notes that the potential for solvent recovery and reuse will help to offset these energy
expenditures. The Agency concludes that the effluent reduction benefits from the final regulation
exceed the potential adverse impacts from the increase in energy consumption that is projected.
12.3 Air Emission Impacts
Pharmaceutical manufacturing facilities generate wastewaters that contain varying concentrations
of organic compounds, some of which are listed as Hazardous Air Pollutants (HAPs) in Title 3 of
the Clean Air Act Amendments (CAAA) of 1990. Table 12-5 lists the HAPs and volatile organic
12-4
pollutants present in pharmaceutical manufacturing wastewaters, as reported by facilities
responding to the Detailed Questionnaire (volatile organic pollutants were identified as those
constituents that could be analyzed by standard EPA methods for volatile organics such as gas
chromatography mass spectrometry (GCMS) by analytical method 1624 (40 CFR Part 136) or
GC by analytical method 8015.(2)). Prior to discharge, pharmaceutical manufacturing
wastewaters typically pass through a series of collection and treatment units that are open to the
atmosphere. Atmospheric exposure of organic-containing wastewaters can result in significant
volatilization of HAPs, volatile organic pollutants, and other organic pollutants to the air.
Air emissions of HAPs, volatile organic pollutants, and other organic pollutants may occur from
wastewater collection units such as process drains, manholes, trenches, sumps, and junction
boxes, and from wastewater treatment units such as neutralization and equalization basins, settling
basins, clarifiers, biological treatment units, air and steam strippers lacking air pollution control
devices, and other units that expose wastewater to the air.
To determine the impact of the final regulation on air emissions, the Agency had to first determine
the current amount of organic constituents emitted into the air from pharmaceutical
manufacturing wastewaters. 12.3.1 describes the air emissions estimated by facilities responding
to the Detailed Questionnaire. 12.3.2 discusses the regulatory impact on air emissions based on a
comparison of current air emissions from pharmaceutical manufacturing wastewaters to projected
air emissions from pharmaceutical manufacturing wastewaters of facilities complying with the
final regulation.
This also discusses the estimated impact on criteria pollutant emissions in the generation of steam
for regulatory options which include steam stripping.
12.3.1 Current Air Emissions Based on Detailed Questionnaire Responses
In response to 3a of the Detailed Questionnaire, entitled "Compound or Chemical Usage and
Disposition," facilities estimated the quantities of virgin chemicals used and disposed of during
manufacturing of pharmaceutical products in calendar year 1990. As part of the chemical usage
12-5
and disposition reporting, facilities were asked to estimate the amount of virgin chemicals used in
pharmaceutical manufacturing operations that were: 1) emitted into the air from wastewater prior
to discharge, 2) degraded and/or destroyed, and 3) discharged to a surface water and/or a POTW.
These three disposition methods summarize the fate, or disposal pathways, of organic constituents
present in pharmaceutical manufacturing wastewaters. Overall, a total of 8.5 million pounds of
organic pollutants were reported as emitted into the air in 1990 from pharmaceutical
manufacturing wastewaters based on summarized Detailed Questionnaire responses.
Upon examining responses to the Detailed Questionnaire regarding the fate of wastewater organic
constituents, the Agency suspected that a greater percentage of wastewater organic constituents
are emitted to the air than most facilities reported. The Agency noted that several indirect
dischargers that had no on-site wastewater treatment systems reported a large percentage of
wastewater organic constituents degraded and/or destroyed on site. It is improbable that such
high rates of degradation and/or destruction could be achieved in the absence of any wastewater
treatment system, such as biological treatment or incineration. In addition, some plants with open
impoundments or basins with mechanical agitators or aerators, reported relatively small
percentages of air emissions from wastewater in Table 3-2 of the Detailed Questionnaire. The
responses to the Detailed Questionnaire also lacked in most cases an indication of the estimation
method used in determining the load discharged as air emissions from wastewater.
Because of these deficiencies in the Detailed Questionnaire responses, EPA believes that the
industry reported data provides a minimum estimate of air emissions. The Agency believes that
the actual amount of air emissions from pharmaceutical manufacturing wastewaters is greater than
the total described above.
12.3.2 Regulatory Impact on Air Emissions
Air emissions from pharmaceutical manufacturing facilities will be controlled by the MACT
Standards and the effluent limitations guidelines and standards described in this document. For
indirect dischargers, these regulations share the common technology basis of in-plant steam
stripping.
12-6
The use of in-plant steam stripping as part of the Agency's promulgated regulatory options will
impact air emissions in two ways. First, priority and nonconventional pollutants that are currently
released as air emissions from wastewater at pharmaceutical manufacturing facilities will be
removed and condensed by in-plant steam stripping for recycle, reuse, or disposal. Second, the
generation of steam for steam stripping will result in increased emissions of criteria pollutants
(CO, NO , VOC, SO , and particulate matter). A brief description of the regulatory impact of thex 2
MACT standards is provided in 12.3.2.1, and EPA's evaluation of these air emission impacts are
described in Sections 12.3.2.2 and 12.3.2.3 below.
12.3.2.1 Regulatory Impact of the MACT Standards on Air Emissions
The MACT Standards that are being promulgated in conjunction with these effluent standards will
control HAP emissions from wastewater treatment and wastewater collection devices at major
source pharmaceutical plants using steam stripping as the reference control technology. The final
MACT Standards for the pharmaceutical industry will reduce emissions of many of the HAPs
listed in 112(b)(1) of the CAAA. The alternatives considered in the development of this
regulation, including those alternatives selected as standards for new and existing sources, are
based on process and emissions data received from the existing facilities known by EPA to be in
operation. The major HAPs emitted by facilities covered by the MACT standards include
methylene chloride, methanol, toluene, and hydrogen chloride. The significant reductions in HAP
emissions required by the final MACT standards will also result in incidental reductions in
nonHAP air emissions because many nonHAPs are found in the same wastewater streams as the
HAPs, and thus will be steam stripped along with the HAPs. Further description of the reduction
in air emissions resulting from the promulgated MACT Standards is provided in the next section.
12.3.2.2 Reduction in Air Emissions Due to Promulgated Effluent Standards
As discussed in 11, the Agency is promulgating effluent limitations guidelines and standards for
ammonia and organic pollutants based on the following in-plant and end-of-pipe treatment
technologies, as shown in Table 12-6.
12-7
For Subcategory A and/or C direct and indirect dischargers, there are significant air emissions
which the MACT controls are designed to address. As a result of the application of these MACT
controls, the load of VOCs to POTWs from pharmaceutical manufacturing plants would be
reduced by approximately 48 percent. The Agency estimates that these MACT strippers will
provide HAP and nonHAP load removals, as shown in Table 12-7.
For Subcategory A and/or C direct dischargers, the BAT treatment technology (advanced
biological treatment plus ammonia nitrification) applied at the end-of-pipe location will result in
the removal of some additional HAP and nonHAP load. In addition, for Subcategory A and/or C
and Subcategory B and/or D indirect dischargers, the PSES treatment technology (in-plant steam
stripping) applied to streams that are not already controlled by the application of MACT
wastewater strippers will also result in the removal of additional HAP and nonHAP load. Some
of this load may also have been air emissions from wastewater. The Agency estimates that the
wastewater strippers costed to achieve compliance with the options beyond no revision put
forward by the Office of Water will provide HAP and nonHAP load removals, as shown in
Table 12-8.
12.3.2.3 Criteria Pollutant Air Emissions
EPA evaluated the impact of steam generation requirements, under regulatory options that include
in-plant steam stripping, on criteria pollutant emissions. To develop this estimate, total steam
generation requirements were estimated using the pharmaceutical cost model and it was assumed
that the steam would be generated in industrial boilers with no emission controls. Ninety-five
percent of the required boiler fuel is assumed to be natural gas and the remaining 5% supplied by
low sulfur Number 6 fuel oil.(3) The calculation of criteria pollutant air emissions is presented in
the calculation package entitled Calculation of Air Emissions Related to Steam Generation, dated
May 19, 1998.(4) Table 12-9 presents an estimate of the resultant criteria pollutant emissions.
For those PSES options selected as the basis of regulation (organics and ammonia, clarify cyanide
for A/C indirects; organics only, withdraw cyanide for B/D indirects), the resultant criteria
12-8
pollutant emission total is 308 tons/yr or 0.62 x 10 lbs/yr. The Agency concludes that the air6
emission and effluent reduction benefits of hazardous air pollutants, priority, nonconventional, and
conventional pollutants outweigh the potential negative impacts of increased emissions of criteria
air pollutants.
12.4 Solid Waste Impacts
The Agency has evaluated the following solid waste impacts which would be expected due to the
application of the final BPT, BCT, BAT, and PSES effluent limitations guidelines and standards:
C The increase in dry sludge generation due to the application of advancedbiological treatment;
C The increase in waste solvent generation due to the application of in-plantsteam stripping; and
C The increase in waste hydrogen chloride (HCl) due to scrubber liquorgenerated by facilities with wastewaters containing ammonia.
These impacts are discussed below in Sections 12.4.1, 12.4.2, and 12.4.4, respectively. 12.4.3
presents an overview of EPA's waste minimization and combustion strategy including EPA's
approach for clean fuels.
12.4.1 Dry Sludge Generation
Based on the responses to the Detailed Questionnaire, pharmaceutical manufacturers generated
approximately 112,000 tons of dry sludge in 1990. Table 12-10 presents the amount of sludge
(dry basis) generated in 1990 by Subcategory A and/or C and Subcategory B and/or D direct and
indirect dischargers as well as the estimated amount of additional dry sludge that would be
generated by Subcategory A and/or C and Subcategory B and/or D direct and indirect dischargers
facilities complying with the final effluent limitations guidelines. On an industry-wide basis, some
sludge generated may be hazardous because it may contain hazardous constituents. For purposes
of estimating compliance costs, all sludge generated was assumed to require disposal as hazardous
12-9
waste, so that the cost of such disposal was accounted for where it was required. Not all facilities
actually generate sludge that is considered hazardous, so the cost of sludge disposal may be
overestimated for these facilities.
Compliance with BPT/BCT is expected to increase the mass of wastewater treatment sludge
generated by Subcategory A and/or C direct dischargers by 343 tons/yr, a result of increased
solids generation and removal at facilities upgrading to advanced biological treatment systems.
This represents approximately a 1% increase in the current sludge generation rate of 36,400
tons/yr for Subcategory A and/or C direct dischargers.
Compliance with BPT/BCT is expected to increase the mass of wastewater treatment sludge
generated by Subcategory B and/or D direct dischargers by 194 tons/yr, a result of increased
solids generation and removal at facilities upgrading to advanced biological treatment systems.
This represents less than a 7% increase in the current sludge generation rate of 2,760 tons/yr for
Subcategory B and/or D direct dischargers.
Compliance with BAT is expected to increase the mass of wastewater treatment sludge generated
by Subcategory A and/or C direct dischargers by 308 tons/yr, a result of increased solids
generation and removal at facilities upgrading to advanced biological treatment systems including
nitrification. This represents approximately a one percent increase in the current sludge
generation rate of 36,400 tons/yr for Subcategory A and/or C direct dischargers.
BAT is not being revised for Subcategory B and/or D direct dischargers and therefore will not
increase the mass of wastewater treatment sludge generated.
Compliance with BAT/BPT/BCT is anticipated to improve the quality of wastewater treatment
sludge by reducing mass loadings of pollutants exported in sludge through conversion to organic
material. The Agency concludes that there will be no adverse non-water quality environment
impacts regarding sludge management.
12-10
No additional sludge is expected to be generated by facilities that discharge indirectly as a result
of the final regulations.
12.4.2 Waste Solvent Generation
Compliance with PSES for Subcategory A and/or C and Subcategory B and/or D indirect
dischargers is expected to increase the amount of waste solvents generated by pharmaceutical
manufacturing facilities as a result of in-plant steam stripping. The amount of waste solvents
recovered as a result of steam stripping by Subcategory A and/or C and Subcategory B and/or D
indirect dischargers would be approximately 10,600 and 3,310 tons/yr, respectively. As discussed
previously, the use of in-plant steam stripping would remove a significant amount of organic
pollutants from the wastewater prior to atmospheric exposure of the wastewater and the
subsequent emission of pollutants into the air.
Organic solvent overheads generated under the promulgated PSES options will create the
opportunity for additional solvent recovery or reuse in the pharmaceutical manufacturing industry.
For example, the Agency is aware of at least one pharmaceutical manufacturer that is currently
distilling methanol from a process wastewater stream and recycling the concentrated methanol
overheads back into their process operation. The Agency is also aware of at least two other
pharmaceutical manufacturers that steam strip their process wastewaters and sell the solvent
overheads for profit. Where possible, facilities would be expected to recover solvents for reuse
within the process or for use in other industrial processes.
The solvent overheads will also have a value associated with their energy content. The Agency
has estimated that the energy value of the solvent overheads generated under the promulgated
options will be 14.3 million kWhr/yr for Subcategory A and/or C indirect dischargers and 4.4
million kWh/yr for Subcategory B and/or D indirect dischargers.
12-11
12.4.3 Waste Minimization and Combustion Strategy
In May 1994, the EPA Administrator announced a Draft Hazardous Waste Minimization and
Combustion Strategy that is pertinent to the pharmaceutical manufacturing industry. The Draft
Strategy provides the central framework for EPA's federal effort to maximize the source
reduction and recycling of hazardous wastes under RCRA. The Draft Strategy focuses on a
number of specific goals, including reducing the amount and toxicity of hazardous waste that is
generated, particularly when such reductions would benefit more than one environmental medium.
The Draft Strategy also encompasses a number of other features, including public outreach, public
involvement and environmental justice, permitting, enforcement, risk assessments, and good
science.(5)
In April 1996, EPA proposed Revised Standards for Hazardous Waste Combustors (61 FR
17358). In June 1998, the Revised Standards for Hazardous Waste Combustors Final Rule -
Part 1 was published. This final rule addresses four elements of the April 1996 proposal: RCRA
comparable fuel exclusion; permit modifications for hazardous waste combustion units;
notification of intent to comply; and waste minimization and pollution prevention criteria for
compliance extensions.
12.4.3.1 Waste Minimization
The Draft Strategy has both short-term and a longer-term phases. In the short-term, EPA will
address the source reduction and environmentally sound recycling of halogenated (and metal-
bearing) combustible wastes. The longer-term effort will encompass all RCRA hazardous wastes,
taking a more comprehensive approach to how wastes are generated and managed, and the role
waste minimization can play as a preferred "mode of management" over other forms of waste
management (e.g., treatment, storage, and disposal). This source reduction (waste minimization)
strategy should reduce the long-term demand for combustion and other waste management
Const. Const.Code Chemical Name Code Chemical Name
12-22
105 Methyl isobutyl ketone (MIBK)
117 n-Propanol
118 Acetone
130 Toluene
134 Trichlorofluoromethane
139 Xylenes
Table 12-6
Treatment Technologies Selected as the Bases of Regulations
Subcategory Organic Pollutants Organic PollutantsBAT Treatment Technologies for PSES Treatment Technologies for
A and C End-of-pipe advanced biological Compliance with MACT Standards andtreatment with Nitrification In-Plant steam stripping for organic
compounds and Ammonia.
B and D No additional control required Compliance with MACT Standards andIn-Plant steam stripping for organiccompounds.
12-23
Table 12-7
Estimated HAP and nonHAP Load Removalsfor MACT Wastewater Strippers
Subcategory Discharge Status Wastewater Strippers (lbs/yr)HAP and nonHAP Load Removals for MACT
A and C Direct 14.1 × 10⁶
A and C Indirect 41.4 x 10⁶
B and D Direct 0
B and D Indirect 0
Table 12-8
Estimated HAP and nonHAP Load Removals for PSES OptionsBased on Steam Stripping
Subcategory Status Based on Steam StrippingDischarge Removals for PSES Options
HAP and NonHAP Load
A and C (a) Indirect 10.7 x 10⁶
B and D Indirect 3.3 x 10⁶
(a) For Subcategories A and C the PSES option includes regulation of ammonia.
12-24
Table 12-9
Increase in Criteria Pollutant Emissions from Steam Generation (tons/year)
CriteriaPollutant Add Organics and Ammonia Add Organics
Subcategory A and C Indirects Subcategory B and D Indirects
CO 38 5
NO 164 21x
VOC 6 1
SO 47 62
PM 18 2
Total 273 35Source: Reference 4.
Table 12-10
Regulatory Impact on Solid Waste Generation
Subcategory Subcategory Subcategory Subcategory BA and C Direct B and D Direct A and C Indirect and D Indirect
Dischargers Dischargers Dischargers Dischargers
Current dry sludge 36,400 2,760 68,500 4,630generated (tons/yr)
BPT/BCT Increase in 343 194 -- --dry sludge generation(tons/yr)
BAT Increase in dry 308 -- -- --sludge generation(tons/yr)
PSES Increase in waste -- -- 10,600 3,310solvent generation(tons/yr)
PSES Increase in waste -- -- 283 --HCl generation(tons/yr)
-- = No impact on solid waste generation
12-25
Table 12-11
Summary of MACT Standards for New and Existing Sources of ProcessWastewater
Emission Source New or Existing? Applicability Cutoff Control EfficiencyRequirement
Wastewater New and Existing >1 Mg/yr total HAP 1,300 ppmw at POD 99% reduction ofload from all POD of partially soluble partially solublewithin a process or HAPs HAPsany single POD
5,200 ppmw at POD 99% reduction ofof total HAP load partially soluble
HAPs
90% reduction ofsoluble HAPs
95% reduction oftotal HAP usingbiotreatment
>1 Mg/yr total HAP 10,000 ppmw at 99% reduction ofload from facility POD of total HAP partially soluble
load HAPs
90% reduction ofsoluble HAPs
95% reduction oftotal HAP usingbiotreatment
New >1 Mg/yr total HAP 110,000 ppmw at 99% reduction ofload from all POD POD of soluble soluble HAPswithin a process or HAPsany single POD
POD: Point of determination
12-26
1. U.S. Department of Commerce. 1990 Annual Survey of Manufacturers, Statisticsfor Industry Groups and Industries. M90(AS)-1, March 1992.
REFERENCES
2. Test Methods for Evaluating Solid Waste, Physical/Chemical Methods, SW-846,3rd Edition, may 1991.
3. U.S. Department of Energy. Annual Energy Review 1996. DOE Report No. DOE/EIA-0384(96).
4. Calculation of Air Emissions Related to Steam Generation. Prepared by R. Sieber, Radian Corporation. December 15, 1994. Updated May 19, 1998.
5. U.S. EPA. Draft Hazardous Waste Minimization and Combustion Strategy. EPAReport No. 530-D-94-002, U.S. Environmental Protection Agency, Washington,D.C., May 1994.
6. U.S. EPA, Office of Solid Waste. Reengineering RCRA for Recycling. U.S.Environmental Protection Agency, Washington, D.C., April 22, 1994.
13-1
SECTION 13
BEST PRACTICABLE CONTROL TECHNOLOGY (BPT)
13.1 Introduction
Effluent limitations guidelines based on the best practicable control technology currently available
establish quantitative limits on the direct discharge of pollutants from existing industrial point
sources. BPT effluent limitations guidelines are based upon the average of the best existing
performance, in terms of treated effluent discharged by facilities of various sizes, ages, and unit
processes within a category or subcategory. BPT effluent limitations guidelines most commonly
focus on the control of conventional and nonconventional pollutants, but can also control priority
pollutants, such as cyanide.
BPT effluent limitations guidelines are based upon the performance of specific technologies, but
do not require the use of any specific technology. BPT effluent limitations guidelines are applied
to individual facilities through NPDES permits issued by EPA or authorized states under Section
402 of the CWA. The facility then chooses its own approach to comply with its permit
limitations.
In developing BPT, the Agency considered the total cost of applying the technologies in relation
to the effluent reduction benefits achieved from the technologies; the size and age of equipment
and facilities; the processes used; the engineering aspects of applying various types of control
techniques; process changes; and nonwater quality environmental impacts, including energy
requirements.
The BPT effluent limitations are based on advanced biological treatment for Subcategories A, B
C, and D, as discussed in Section 11.
13-2
The following information is discussed in this section:
C Section 13.2 reviews the subcategories and the pollutants to be regulatedby BPT and presents the final BPT effluent limitations guidelines; and
C Section 13.3 discusses BPT effluent limitations guidelines implementationwith regard to NPDES permits, point of application, and monitoring andcompliance issues.
13.2 Summary of the BPT Effluent Limitations Guidelines
13.2.1 Regulated Subcategories
BPT effluent limitations guidelines, as discussed in Section 7.3, are for Subcategories A, B, C,
and D direct dischargers. As discussed in Section 4.3, Subcategories A, B, and C include
wastewater discharges resulting from the manufacture of pharmaceuticals by fermentation,
biological or natural extraction processes, and chemical synthesis processes, respectively.
Subcategory D includes wastewater discharges resulting from mixing, compounding, and
formulating of pharmaceutical products.
13.2.2 Regulated Pollutants
Since the BPT guidelines were last revised in 1983, there have been significant improvements in
secondary treatment. Therefore, it is appropriate to revise the BPT limitations to reflect the best
practicable control technology currently available.
The BPT effluent limitations guidelines revise COD effluent limitations for Subcategories A, B, C,
and D. Raw wastewaters from pharmaceutical facilities are characterized by high COD
concentrations. EPA found a correlation between effluent COD and aquatic toxicity in the 1987
pilot-plant carbon study which was conducted on pharmaceutical industry wastewaters. Also,
COD loads can deplete oxygen levels in the water resulting in adverse health effects in fish,
including mortality, and reduction in biological diversity. EPA previously promulgated COD
13-3
limits of minimum 74% removal, however, facilities can meet this limitation while still discharging
effluents with high COD levels.(3)
Under the revised BPT COD regulations, facilities must comply with the new COD concentration
limitations, promulgated with this rulemaking, or the 74% reduction of COD, whichever is more
stringent.
The revised BPT in this rulemaking clarifies existing in-plant cyanide limitations for Subcategory
A and C facilities. Compliance monitoring for cyanide should occur immediately after cyanide
destruction, before commingling cyanide-bearing wastestreams with non-cyanide-bearing
wastestreams, unless a facility can demonstrate that cyanide is detectable at end-of-pipe. The
1983 cyanide limitations for Subcategory B and D direct dischargers are being withdrawn; these
subcategories do not use or generate cyanide.
The BPT effluent limitations guidelines for BOD and TSS have not been revised, however,5
revision of the BPT effluent limitations guidelines for COD will achieve incidental removals of
BOD and TSS. However, the incidental removal of TSS is expected to be significantly less than5
the incidental removal of BOD as a result of the new COD limitations. The BOD effluent5 5
limitations, expressed as mass loading, require a minimum 90% reduction in the long-term
average daily BOD load of the raw (untreated) process wastewater, multiplied by a variability5
factor of 3.0. The effluent limitation for TSS, expressed as a mass loading, must be calculated as
1.7 times the BOD limitation. The pH effluent limit, established in the 1976 Final Rule5
(41 FR 50676) to be the range of 6.0 to 9.0 standard units for all subcategories, will not be
amended. As discussed in Section 6.5, other conventional pollutants, such as fecal coliform and
oil and grease, will not be regulated under BPT, because they are not pollutants of concern for
this industry.
13.2.3 The BPT Effluent Limitations Guidelines
The BPT effluent limitations guidelines for each subcategory are based on a combination of long-
term mean effluent concentrations and variability factors that account for day-to-day variation in
13-4
measured treated effluent concentrations. Long-term means, discussed in Section 8, are target
values that a facility's treatment system should achieve on a long- term, average basis. The
variability factors, discussed in the Statistical Support Document(1), located in the Administrative
Record for this rulemaking, represent the ratio of an elevated value, expected to occur only rarely,
to the long-term mean. The purpose of the variability factor is to allow for variations in effluent
concentrations that comprise the long-term mean. A facility that designs and operates its
treatment system to achieve a long-term mean on a consistent basis should be able to comply with
the daily and monthly limitations in the course of normal operations.
Table 13-1 presents the maximum daily and monthly average BPT effluent limitations guidelines
for end-of-pipe monitoring points for Subcategories A, B, C, and D based on long-term mean
treatment performance concentrations and associated variability factors.
The limitations for COD were calculated using available data sets from best-performing advanced
biological treatment systems. The long-term mean concentration was multiplied by the 1-day and
30-day variability factors for each data set. This resulted in data set specific limitations. The mean
value of the dataset specific limitations based on the 1-day variability factor is the BPT maximum
limitation for any one day; the mean value based on the 30-day variability factor is the BPT
monthly average limitation.
13.3 Implementation of the BPT Effluent Limitations Guidelines
13.3.1 NPDES Permit
BPT effluent limitations guidelines are applied to individual facilities through NPDES permits
issued by EPA or authorized states under Section 402 of the CWA.
The effluent limitations guidelines are concentration-based and, as such, do not regulate
wastewater flow. For end-of-pipe effluent limitations, permit writers will use a reasonable
estimate of process wastewater discharge flow allowing for up to 25 percent non-process water
13-5
through treatment. The flow estimates and the concentration-based limitations are used to
develop mass-based limitations for the NPDES permit.
"Process wastewater" discharge is defined by 40 CFR 122.2 to include wastewaters resulting from
manufacture of pharmaceutical products that come in direct contact with raw materials,
intermediate products, and final products, and surface runoff from the immediate process area that
has the potential to become contaminated. Noncontact cooling waters, utility wastewaters,
general site surface runoff, groundwater, and other nonprocess water generated on site are
specifically excluded from this definition. The end-of-pipe limitations are developed from
performance data at facilities which contain less than 25 percent nonprocess water through their
biological treatment facility. Therefore, the end-of-pipe limitations for BPT apply to the
pharmaceutical process wastewater allowing for up to 25 percent nonprocess wastewater.
Nonprocess flow in excess of 25 percent should be handled separately in establishing permit
limits.
Using current facility information provided by the permit applicant, the permitting or control
authority must determine the appropriate wastewater discharge flow to use when developing mass
based limitations. In cases where the permit writer deems the wastewater discharge flow claimed
by industry to be excessive, he/she may develop a more appropriate process wastewater discharge
flow for use in computing the mass effluent limitations. The permit writer should review the
following items to evaluate whether process wastewater discharge flow is excessive.
C Component flows, to ensure that the claimed flows are, in fact, processwastewater discharge flows as defined by 40 CFR 122.2.
C Plant operations, to ensure that sound water conservation practices arebeing followed. Examples include minimization of process water uses andreuse or recycle of intermediate process waters or treated wastewaters atthe process area and in wastewater treatment operations (pump seals,equipment and area washdowns, etc.).
C Barometric condenser use at the process level. Often, barometriccondensers will generate relatively large volumes of slightly contaminatedwater. Replacing barometric condensers with surface condensers can
13-6
reduce wastewater volumes significantly and result in collection ofcondensates that may be returned to the process.
To establish an NPDES permit for a direct discharger, the permit writer should determine the
facility's subcategorization and use the corresponding concentration-based effluent limitations as a
basis for developing the mass-based limitations. The permit writer should then use best
professional judgment to determine the facility's annual average wastewater discharge flow (i.e.,
the permit writer should consider only the sources of "process wastewater discharge," as defined
previously, when determining the annual average process wastewater discharge flow, allowing for
up to 25 percent nonprocess wastewater). The annual average flow is defined as the average of
daily flow measurements calculated over at least a year; however, if available, three to five years
of data are preferable to obtain a representation of average daily flow.(2)
If no historical or actual process wastewater flow data exist, the permitting authority is advised to
establish a reasonable estimate of the facility's projected flow representative of the entire term of
the permit. This may include a request for the facility to measure process wastewater flows for a
representative period of time to establish a flow basis. If a plant is planning significant changes in
production during the effective period of the permit, the permitting authority may consider
establishing multiple tiers of limitations as a function of these production changes. Alternatively,
a permit may be modified during its term, either at the request of the permittee or another
interested party, or on EPA's initiative, to increase or decrease the flow basis in response to a
significant change in production (40 CFR 124.5, 122.62). A change in production may be an
"alteration" of the permitted activity or "new information" that could provide the basis for a
permit modification (40 CFR 122.62(a)).
The permit writer should use the facility’s annual average process wastewater discharge flow and
no more than 25 percent additional flow contributed by existing nonprocess wastewater
discharges to convert the end-of-pipe concentration-based limitations into mass-based limitations.
13-7
13.3.2 Point of Application
The BPT effluent limitations guidelines at Subcategory A, B, C, and/or D direct dischargers
would be applicable to the final effluent at the point of discharge to waters of the United States
and before dilution with significant amounts of nonprocess waters (i.e., end-of-pipe).
13.3.3 Monitoring and Compliance
The monitoring frequency for BPT effluent limitations guidelines for Subcategory A, B, C, and/or
D direct dischargers should be determined by the permit authority.
Compliance with the end-of-pipe effluent limitations guidelines should be determined by
multiplying the regulated pollutant concentration, measured in the effluent sample, by a
conversion factor and by the total applicable wastewater flow discharged during the effluent
sampling period, which is typically 24 hours. Thus, the mass compliance value should be based
on the applicable flow discharged on the day of sampling, not on the long-term average flow rate
used to establish the permit limitations and standards.
13-8
Table 13-1
BPT Effluent Limitations Guidelines for Direct Dischargers
Subcategory Pollutant Property one day (mg/L) (mg/L)Pollutant or Maximum for any Monthly Average
BPT Effluent Limitation for End-of-Pipe Monitoring Points
(a)
A - Fermentation Operations COD 1,675 856
B - Biological and Natural ExtractionOperations COD 228 86
C - Chemical Synthesis Operations COD 1,675 856
D - Mixing, Compounding, orFormulating Operations COD 228 86
(a) If these COD concentrations are higher than concentration values reflecting a reduction in the long-term average daily COD load in the raw(untreated) process wastewater of 74 percent multiplied by a variability factor of 2.2, then effluent limitations for COD corresponding to the lowerconcentration values must be applied.
13-9
REFERENCES
1. U.S. EPA, Office of Water. Statistical Support Document for the EffluentLimitations Guidelines for the Pharmaceutical Manufacturing Industry. EPA-821-B-98-007, U.S. Environmental Protection Agency, Washington, D.C., 1998.
2. U.S. EPA, Office of Water. Training Manual for NPDES Permit Writers. EPA833-B-93-003, U.S. Environmental Protection Agency, Washington, D.C., 1993.
3. Osantowski, Richard and Richard Wullschleger. Evaluation of Activated Carbonfor Enhanced COD Removal from Pharmaceutical Wastewater. Rexnord, Inc.,Milwaukee, WI, 1987.
14-1
SECTION 14
BEST CONVENTIONAL TECHNOLOGY
14.1 Introduction
Effluent limitations guidelines based on best conventional technology establish quantitative limits
on the direct discharge of conventional pollutants from existing industrial point sources. In
contrast to BPT guidelines, which are based on the average of the best existing performance by a
group of facilities, BCT guidelines are developed by identifying candidate technologies and
evaluating their cost-reasonableness. Effluent limitations guidelines based upon BCT may not be
less stringent than BPT effluent limitations guidelines. As such, BPT effluent limitations are a
"floor" below which BCT efficient limitations guidelines cannot be established. As discussed
below, EPA has developed a BCT cost test methodology to assist the Agency in determining
whether it is "cost-reasonable" for industry to control conventional pollutants at a level more
stringent than would be required by BPT effluent limitations.
The following information is presented in this section:
C Section 14.2 discusses the Agency's general methodology for determiningBCT effluent limitations for industry;
C Section 14.3 reviews the subcategories and pollutants proposed to beregulated by BCT, describes the application of the general BCTmethodology to the pharmaceutical manufacturing industry, and presentsthe proposed BCT effluent limitation guidelines; and
C Section 14.4 discusses BCT effluent limitations guideline implementation.
14.2 General Methodology for BCT Effluent Limitations Development
The July 9, 1986 Federal Register (51 FR 24974) presents the Agency's general methodology for
developing BCT effluent limitations guidelines. BCT effluent limitations guidelines are based on
the performance of the pollution control technology selected as BCT. As noted in 51 FR 24974,
14-2
the first step in determining BCT is to establish that a BCT option is technologically feasible
(defined as providing conventional pollutant control beyond the level of control provided by
application of BPT). If a BCT option is found to be technologically feasible, the Agency applies a
two-part BCT cost test to evaluate the "cost-reasonableness" of the BCT option. The BCT cost
test consists of a POTW test and an industry cost-effectiveness test that the BCT option must
pass to be considered as a basis for BCT effluent limitations guidelines. The results of these tests
along with other industry-specific factors are evaluated to determine BCT. The POTW cost test,
the industry cost-effectiveness test, and the process of BCT determination are discussed below.
14.2.1 POTW Cost Test
The POTW cost test compares the cost-effectiveness of an industrial treatment system upgrade to
meet the BCT requirements to the benchmark cost-effectiveness of a POTW upgrade. For a BCT
option to pass the POTW cost test, the cost per pound of conventional pollutant removed by
upgrading from BPT to the BCT option at industrial direct dischargers must be less than the cost
per pound of conventional pollutant removed by upgrading POTWs from secondary treatment to
advanced secondary treatment. Specifically, the upgrade cost to industry must be less than the
POTW benchmark of $0.25 per pound (in 1976 dollars) for industries whose cost per pound is
based on long-term performance data (Tier I POTW benchmark), or must be less than $0.14 (in
1976 dollars) per pound for industries whose cost per pound is not based on long-term
performance data (Tier II POTW benchmark).
As noted in 51 FR 24974, the conventional pollutants measured for removal during the two-part
BCT cost test are BOD and TSS. Oil and grease may be used along with BOD and TSS to5 5
calculate pollutant removal for BCT options when deemed appropriate for the industry and
technology being evaluated. Fecal coliform and pH are not included in the calculations because
control of these pollutants is not measurable as "pounds removed". An acceptable interval for
controlling pH is evaluated with respect to the particular processes of a BCT option. Generally,
the acceptable pH interval for BCT will be the same as that for BPT. Maintaining the acceptable
interval is an inherent cost of the BCT option and must be economically achievable and cost-
reasonable (51 FR 24974).
14-3
14.2.2 Industry Cost-Effectiveness Test
To remain a viable option, a BCT option must also pass an industry cost-effectiveness test which
consists of computing a ratio of two incremental costs. The first increment is the cost per pound
of pollutant load removed by the BCT option relative to BPT; the second increment is the cost
per pound of pollutant load removed by BPT relative to no treatment (i.e., raw wastewater). The
ratio of the two incremental costs (first cost divided by the second cost) is compared to an
industry benchmark. The industry benchmark is a ratio of two POTW incremental costs: 1) the
cost per pound of pollutant removed for a POTW to upgrade from secondary treatment to
advanced secondary treatment, and 2) the cost per pound of pollutant removed for a POTW to
upgrade from no treatment to secondary treatment. If the first ratio (BCT option to BPT) is
lower than the industry benchmark, the BCT option passes the industry cost-effectiveness test.
The Tier I industry benchmark, for industries whose ratio is based on long-term performance data,
is 1.29. The Tier II industry benchmark, for industries whose ratio is not based on long-term
performance data, is 0.68.
In calculating the ratio of a BCT option to BPT, the Agency will consider any BCT option cost
per pound less than $0.01 to be equivalent to zero costs. The Agency believes that a BCT option
with zero cost per pound of pollutant removed satisfies the Congressional intent for cost-
reasonableness.
14.2.3 BCT Determination
BCT is determined by evaluating results of both the POTW test and the industry cost-
effectiveness test as measures of cost-reasonableness. In addition, Section 304 (b)(4)(B) of the
CWA instructs the Agency to consider "other factors deemed appropriate" when making BCT
determinations; other factors are considered on an industry-specific basis. Generally, BCT is the
most stringent technology option (i.e., the technology option that achieves the greatest pollutant
reduction) to pass both parts of the cost test. If all BCT options for an industry category or
subcategory fail either or both of the tests, or if no BCT option more stringent than BPT is
identified, then BCT is set equal to BPT.
14-4
The owners or operators of facilities subject to BCT are not required to use the specific
technologies selected by EPA to establish BCT, but may choose to use any combination of
process technologies and wastewater treatment to comply with NPDES permit limitations derived
from BCT effluent limitations guidelines.
14.3 BCT Effluent Limitations Guidelines Development for the PharmaceuticalManufacturing Industry
14.3.1 Regulated Subcategories
BCT effluent limitations guidelines, as discussed in Section 7.3, are being promulgated for
Subcategories A, B, C, and D.
14.3.2 Regulated Pollutants
The final BCT effluent limitations guidelines establish BOD and TSS effluent limitations. The pH5
effluent limitation under BCT will be the equivalent of the pH limitation established by BPT.
14.3.3 Application of General BCT Methodology to the PharmaceuticalManufacturing Industry
The Agency applied the general methodology for BCT effluent limitations guidelines development
to the pharmaceutical manufacturing industry subcategories. First, technologically feasible BCT
options that provide a greater degree of conventional pollutant control than BPT were identified.
Section 7.3.3 describes the BCT options evaluated by the BCT determination process. After
determining that the BCT options were technologically feasible, the Agency applied the two-part
BCT cost test. The results of the BCT cost test were used to establish the technology basis for
the final BCT effluent limitations guidelines.
14-5
The following subsections discuss the BPT baseline established for the two-part BCT cost test,
the BCT options evaluated, the use of the pharmaceutical cost model to generate costs for this
analysis, the two-part BCT cost test results, and the final BCT effluent limitations guidelines for
the pharmaceutical manufacturing industry subcategories.
14.3.3.1 BCT Cost Test Baseline
To apply the two-part BCT cost test to the pharmaceutical manufacturing industry, a baseline
technology representing the current BPT limitations (before any revision) was defined to serve as
the comparison point for the more stringent BCT options. The methodology for BCT
determination (as documented in 51 FR 24974) requires that this point of comparison is BPT.
Thus, the baseline technology used in the two-part BCT cost test is the current (1990) treatment
level.
14.3.3.2 BCT Options
Subcategories A and C
As described in Section 7.3.3, there are four BCT technology options for Subcategories A and C
beyond current treatment:
C Advanced Biological Treatment;
C Advanced Biological Treatment and Effluent Filtration;
C Advanced Biological Treatment and Polishing Pond; and
C Advanced Biological Treatment and Effluent Filtration and Polishing Pond.
14-6
Subcategories B and D
As described in Section 7.3.3, there are two BCT technology option for Subcategories B and D
beyond current treatment:
C Advanced Biological Treatment; andC Advanced Biological Treatment and Effluent Filtration.
14.3.3.3 Pharmaceutical Manufacturing Cost Model
The Agency used the pharmaceutical manufacturing cost model (described in Section 10) to
calculate baseline conventional pollutant control costs and corresponding costs for the BCT
options. The annualized conventional pollutant control costs for the baseline and BCT options
are calculated in 1990 dollars.
14.3.3.4 BCT Cost Test Results
Table 14-1 summarizes the results of the two-part BCT cost test for Subcategory A and C direct
dischargers. Table 14-2 summarizes the results of the two-part BCT cost test for Subcategory B
and D direct dischargers. All results are based on the use of long-term performance (i.e., Tier I)
data. Results of the POTW cost test and the industry cost-effectiveness test are discussed below.
POTW Cost Test Results
Results of the POTW cost test are summarized in the upper portion of Tables 14-1 and 14-2. For
Subcategory A and C direct dischargers, one BCT option passed the POTW cost test (BPT
baseline to advanced biological treatment). For Subcategory B and D direct dischargers, all BCT
options failed the POTW cost test.
As an example of POTW test application, consider the first BCT option for Subcategory A and C
direct dischargers. The cost of upgrading from the BPT baseline (current treatment) to the BCT
14-7
option (advanced biological treatment) is $2,190,000 per year (in 1990 dollars). The load
reduction of BOD and TSS achieved by upgrading to the BCT option is 3,940,000 lbs/yr. Thus,5
upgrading from the BPT baseline to the BCT option results in a ratio of 0.557 $/lb (dollars
expended to pounds of BOD and TSS removed). This ratio is less than the Tier I POTW5
benchmark (in 1990 dollars) of 0.56 $/lb. (The POTW benchmark of 0.56 $/lb, expressed in 1990
dollars, was calculated using the May 1986 promulgated methodology entitled BCT Benchmarks:
Methodology, Analysis and Results for Calculating and Indexing BCT POTW Benchmarks to
Various Years' Dollars (1).) Since the cost per pound of pollutant removed is less than the
POTW benchmark, this BCT option for Subcategory A and C direct dischargers passed the
POTW cost test.
Industry Cost-Effectiveness Test Results
Results of the industry cost-effectiveness test are presented in the lower portion of Tables 14-1
and 14-2. For Subcategory A and C direct dischargers, all BCT options failed the industry cost-
effectiveness test. For Subcategory B and D direct dischargers, all BCT options failed the
industry cost-effectiveness test.
As an example of industry cost-effectiveness test application, consider the first BCT option for
Subcategory A and C direct dischargers. From the POTW test, the incremental cost per pound of
pollutant removed associated with upgrading from the BPT baseline to the BCT option was 0.557
$/lb. The cost of upgrading from no treatment (i.e., raw wastewater) to the BPT baseline is
$25,800,000 per year (in 1990 dollars). The load reduction of BOD and TSS achieved by5
upgrading from no treatment to the BPT baseline is 97,800,000 lbs/yr. Thus, the incremental cost
per pound of pollutant load removed for Subcategory A and C direct dischargers upgrading from
no treatment to the BPT baseline is 0.264 $/lb. The ratio of these two incremental costs is 2.11
(i.e., 0.557 divided by 0.264). Since this ratio (2.11) is greater than the industry benchmark of
1.29, the BCT option failed the industry cost-effectiveness test.
14-8
14.3.3.5 Conclusions
Based on the results of the two-part BCT cost test and the criteria discussed in Section 14.1.3 for
BCT determination, the final BCT effluent limitations guidelines for Subcategory A and C and
Subcategory B and D direct dischargers are equal to BPT limitations for BOD and TSS for those5
subcategories.
14-9
Table 14-1
Summary Results of BCT Cost Test for Subcategory A and C Direct Dischargers(Monetary Values are 1990 $)
POTW Cost Test
BPT Baseline to Advanced Biological Treatment and Effluent Biological Treatment and Effluent Filtration and PolishingBiological Treatment Filtration Polishing Pond Pond
BPT Baseline to Advanced BPT Baseline to Advanced Biological Treatment andBPT Baseline to Advanced
Annualized Cost for BOD & TSS 2,190,000 4,060,000 19,700,000 23,000,000Reduction ($/yr.)
BOD & TSS Load Red. (lbs./yr.) 3,940,000 4,860,000 5,400,000 7,060,000
($/lb.) 0.557 0.836 3.64 3.27
POTW Benchmark ($/lb.) 1990 $ 0.56 0.56 0.56 0.56
Pass/Fail Pass Fail Fail Fail
Industry Cost - Effectiveness Test
Raw WW to BPT Baseline Raw WW to BPT Baseline Raw WW to BPT Baseline Raw WW to BPT Baseline
Annualized Cost for BOD & TSS 25,800,000 25,800,000 25,800,000 25,800,000Reduction ($/yr.)
BOD & TSS Load Red. (lbs./yr.) 97,800,000 97,800,000 97,800,000 97,800,000
($/lb.) 0.264 0.264 0.264 0.264
Ratio 2.11 3.17 13.8 12.4
Ratio Benchmark 1.29 1.29 1.29 1.29
Pass/Fail Fail Fail Fail Fail
Notes:
Baseline is set equivalent to current Treatment. The raw to baseline and baseline to BCT option costs and load reductions were developed using the pharmaceutical manufacturing cost model. These costs donot include costs for COD removal.
To adjust the POTW benchmark to 1990 dollars, the Agency used the promulgated methodology, BCT Benchmarks: Methodology, Analysis and Results, May 1986, for calculating and indexing BCT POTWbenchmarks to various years' dollars (1).
14-10
Table 14-2
Summary Results of BCT Cost Test for Subcategory B and D Direct Dischargers(Monetary Values are 1990 $)
POTW Cost Test
BPT Baseline to Advanced Biological and Effluent FiltrationTreatment
BPT Baseline to Advanced Biological Treatment
Annualized Cost for BOD & TSS Reduction ($/yr.) 1,580,000 2,120,000
BOD & TSS Load Red. (lbs./yr.) 236,000 267,000
($/lb.) 6.68 7.93
POTW Benchmark ($/lb.) 1990 $ 0.56 0.56
Pass/Fail Fail Fail
Industry Cost - Effectiveness Test
Raw WW to BPT Baseline Raw WW to BPT Baseline
Annualized Cost for BOD & TSS Reduction ($/yr.) 2,110,000 2,110,000
BOD & TSS Load Red. (lbs./yr.) 1,300,000 1,300,000
($/lb.) 1.63 1.63
Ratio 4.10 4.87
Ratio Benchmark 1.29 1.29
Pass/Fail Fail Fail
Notes:
Baseline is set equivalent to current Treatment. The raw to baseline and baseline to BCT option costs and load reductions were developed using the pharmaceuticalmanufacturing cost model. These costs do not include costs for COD removal.
To adjust the POTW benchmark to 1990 dollars, the Agency used the promulgated methodology, BCT Benchmarks: Methodology, Analysis and Results, May 1986,for calculating and indexing BCT POTW benchmarks to various years' dollars (1).
14-11
REFERENCES
1. U.S. EPA. BCT Benchmarks: Methodology, Analysis, and Results forCalculating and Indexing BCT POTW Benchmarks to Various Year’s Dollars.U.S. Environmental Protection Agency, Washington, D.C., May 1986.
15-1
SECTION 15
BEST AVAILABLE TECHNOLOGY ECONOMICALLY ACHIEVABLE (BAT)
15.1 Introduction
Effluent limitations guidelines based on the best available technology economically achievable
establish quantitative limits on the direct discharge of priority and nonconventional pollutants to
waters of the United States. These limits are based upon the performance of specific
technologies, but do not specify which technologies must be used to achieve compliance. BAT
effluent limitations guidelines are applied to individual facilities through NPDES permits issued by
EPA or authorized states under Section 402 of the CWA. Each facility then chooses its own
approach to comply with its permit limitations.
The technology selected by the Agency to define the BAT performance may include end-of-pipe
treatment, process changes, and internal controls, even when these technologies are not common
industry practice. Section 7 provides an overview of the technologies assessed by the Agency.
BAT performance is established for groups of facilities (subcategories) with shared
characteristics. Where a group of facilities demonstrates uniformly inadequate performance in
controlling pollutants of concern, BAT may be transferred from a different subcategory or
industrial category.
For Subcategory A and C facilities, EPA chose the BAT regulatory option to add organics and
ammonia, revise COD to BPT limits, and clarify the monitoring requirements for cyanide. The
Agency selected end-of-pipe advanced biological treatment with nitrification of ammonia as the
technology basis for the BAT effluent limitations guidelines for Subcategory A and/or
Subcategory C direct dischargers. The Agency chose to revise COD to BPT limits and withdraw
cyanide limitations for Subcategory B and D facilities. The Agency selected BPT treatment
technology (advanced biological treatment) as the basis for the BAT effluent limitations guidelines
15-2
for Subcategory B and/or Subcategory D direct dischargers. The rationale behind these selections
is discussed in Section 11.
The following information is presented in this section:
C Section 15.2 reviews the subcategories and the pollutants to be regulatedby BAT and presents the BAT effluent limitations guidelines; and
C Section 15.3 discusses BAT effluent limitations guidelines implementationwith regard to point of application, NPDES permits, and monitoring andcompliance issues.
15.2 Summary of the BAT Effluent Limitations Guidelines
15.2.1 Regulated Subcategories
Revised BAT effluent limitations guidelines are for Subcategories A, B, C, and D. As discussed
in Section 4.3, Subcategories A, B, and C include wastewater discharges resulting from the
manufacture of pharmaceuticals by fermentation, biological or natural extraction processes, and
chemical synthesis processes, respectively. Subcategory D includes wastewater discharges
resulting from mixing, compounding, and formulating of pharmaceutical products.
15.2.2 Regulated Pollutants
The BAT guidelines establish effluent limitations for the priority and nonconventional pollutants
listed in Table 15-1 for direct dischargers in Subcategories A and C. EPA is not establishing BAT
effluent limitations guidelines for Subcategory B and D operations except to set BAT COD
limitations equivalent to the BPT COD limitations. Conventional pollutants are regulated under
BPT and BCT and are not discussed here.
The revised BAT in this rulemaking clarifies existing in-plant cyanide limitations for Subcategory
A and C facilities. Compliance monitoring for cyanide should occur immediately after cyanide
15-3
destruction, before commingling cyanide-bearing waste streams with non-cyanide bearing waste
streams, unless a facility can demonstrate that cyanide is detectable at end-of-pipe. The 1983
cyanide limitations for Subcategory B and D direct dischargers are being withdrawn; these
subcategories do not use or generate cyanide.
15.2.3 The BAT Effluent Limitations Guidelines
The BAT effluent limitations guidelines for each subcategory are based on a combination of long-
term mean treatment performance concentrations and variability factors that account for day-to-
day variation in measured treated effluent concentrations. Long-term mean treatment
performance concentrations, discussed in Section 8, are target values that a facility's treatment
system should achieve on a long-term, average basis. The variability factors, discussed in the
Statistical Support Document(1), which is located in the Record for this rulemaking, represent the
ratio of an elevated value, expected to occur only rarely, to the long-term mean. The purpose of
the variability factor is to allow for variations in effluent concentrations that comprise the long-
term mean. A facility that designs and operates its treatment system to achieve a long-term mean
on a consistent basis should be able to comply with the daily and monthly limitations in the course
of normal operations.
Table 15-2 presents the maximum daily and monthly average BAT effluent limitations guidelines
for Subcategory A and C operations. These limitations were determined by multiplying the long-
term means for each subcategory by the respective pollutant's 1-day and 4-day variability factors.
A 4-day variability factor was used to develop the BAT monthly average limitations, with the
exception of COD for which a 30-day variability factor was used. Table 15-3 presents the
maximum daily and monthly average BAT COD effluent limitations guidelines for Subcategory B
and D operations.
The BAT effluent limitations guidelines for acetonitrile, benzene, diethylamine, dimethyl
sulfoxide, ethanol, n-heptane, methanol, methyl cellosolve, and triethylamine are based on the
analytical method minimum level. The minimum level for a pollutant is the level at which an
analytical system gives recognizable signals and an acceptable calibration point. For pollutants
15-4
with a long-term mean below the minimum level, typically in cases where treatment performance
was established through data transfer, the final long-term mean was set at a value no lower than
the minimum level for the pollutant. The final effluent limitations are determined by applying
1-day and 4-day variability factors to the final long-term means.
The BAT cyanide effluent limit, established in the 1983 Final Rule to be a daily maximum of 33.5
mg/L and a maximum monthly average of 9.4 mg/L for all subcategories, is not being revised for
Subcategories A and C. The cyanide effluent limit is being withdrawn for Subcategories B and D
because EPA has determined that cyanide is neither used nor generated by facilities with these
subcategory operations.
15.3 Implementation of the BAT Effluent Limitations Guidelines
The BAT effluent limitations guidelines for Subcategory A and C operations are presented in
Table 15-2. EPA is not establishing BAT effluent limitations guidelines for Subcategory B and D
operations except to set a BAT COD limitation equivalent to the BPT COD limitation.
15.3.1 Establishing List of Pollutants for Compliance Monitoring
Permitting authorities should establish permit limitations and compliance monitoring requirements
for each regulated pollutant, listed in Table 15-1, generated or used at a pharmaceutical
manufacturing facility with Subcategory A and/or C operations. Limitations and routine
compliance monitoring should not be required for regulated pollutants not generated or used at a
facility. A determination that regulated pollutants are not generated or used should be based on a
review of all raw materials and chemical processes used, considering resulting products and by-
products. The determination that a regulated pollutant is not generated or used would need to be
confirmed by annual chemical analyses of wastewater from each monitoring location. Such
confirmation would be provided by an analytical measurement of a non-detect value.
15-5
Facilities discharging more than one regulated organic pollutant may monitor for a single
surrogate pollutant to demonstrate an appropriate degree of control for a specified group of
pollutants. For the purpose of identifying surrogates, pollutants are grouped according to
treatability classes; Table 15-4 presents the treatability classes identified for advanced biological
treatment, which is the BAT technology basis for organic pollutant limitations. For treatability
classes with more than one possible surrogate pollutant, the analyte with the highest concentration
or loadings should be chosen as the surrogate pollutant. Plants may monitor for a surrogate
pollutant(s) only if they demonstrate that all other pollutants receive the same degree of treatment.
An individual plant may choose to demonstrate by selecting a monitoring pollutant for a given
treatability class and maintaining documentation, including flow information and sampling results,
that all pollutants in that treatability class receive equivalent treatment. The documentation is then
submitted to the permit authority for approval.
15.3.2 Point of Application
The BAT effluent limitations for ammonia, COD, and the organic pollutants listed in Table 15-2
are end-of-pipe limitations and applicable to the final effluent at the point of discharge to waters
of the United States, prior to non-process dilution waters. This compliance point is identical to
the point used to demonstrate compliance with the BPT effluent limitations guidelines.
Compliance monitoring for cyanide should occur in-plant, unless a facility can show a measurable
amount of cyanide at end-of-pipe, instead of a non-detect in accordance with 40 CFR 403.6 (e)(2)
and 403.6 (e)(4).
15.3.3 Permit Limitations
End-of-pipe permit limitations based on the BAT limitations for ammonia, COD, and organic
constituents will be mass-based. Permit writers should use a reasonable estimate of process
wastewater discharge flow and the concentration-based limitations listed in Table 15-2 to develop
mass-based limitations for the NPDES permit.
15-6
"Process wastewater discharge" is defined by 40 CFR 122.2 to include wastewaters resulting from
pharmaceutical products manufacturing that come in direct contact with raw materials,
intermediate products, and final products, and surface runoff from the immediate process area that
has the potential to become contaminated. Noncontact cooling waters, utility wastewaters,
general site surface runoff, groundwater, and other nonprocess water generated on site are
specifically excluded from this definition. The end-of-pipe limitations are developed from
performance data at facilities which contain less than 25 percent nonprocess water through their
biological treatment facility. Therefore, the end-of-pipe limitations for BAT apply to the
pharmaceutical process wastewater allowing for up to 25 percent nonprocess wastewater. Non
process flow in excess of 25 percent should be handled separately in establishing permit limits.
Using current facility information provided by the permit applicant, the permitting or control
authority must determine the appropriate process wastewater discharge flow to use when
developing mass-based limitations. In cases where the permit writer deems the process
wastewater discharge flow claimed by industry to be excessive, he/she may develop a more
appropriate process wastewater discharge flow for use in computing the mass-based limitations.
The permit writer should review the following items to evaluate whether process wastewater
discharge flow is excessive:
C Component flows, to ensure that the claimed flows are, in fact, processwastewater discharge flows as defined by 40 CFR 122.2.
C Plant operations, to ensure that sound water conservation practices arebeing followed. Examples include minimizing process water uses andreusing or recycling intermediate process waters or treated wastewaters atthe process area and in wastewater treatment operations (pump seals,equipment and area washdowns, etc.).
C Barometric condenser use at the process level. Often, barometriccondensers will generate relatively large volumes of slightly contaminatedwater. Replacing barometric condensers with surface condensers canreduce wastewater volumes significantly and result in collection ofcondensates that may be returned to the process.
15-7
Once the permit writer has reviewed the permit application, best professional judgment should be
used to determine the facility's annual average wastewater discharge flow (i.e., the permit writer
should consider only the sources of "process wastewater discharge," as defined previously, when
determining the annual average process wastewater discharge flow allowing for up to 25 percent
nonprocess wastewater). The annual average flow is defined as the average of daily flow
measurements calculated over at least a year; however, if available, three to five years of data are
preferable to obtain a representation of average daily flow(2).
If no historical or actual process wastewater flow data exist, the permitting authority is advised to
establish a reasonable estimate of the facility's projected flow expected to be representative during
the entire term of the permit. If a plant is planning significant production changes during the
effective period of the permit, the permitting authority may consider establishing multiple tiers of
limitations as a function of these production changes. Alternatively, a permit may be modified
during its term, either at the request of the permittee or another interested party, or on EPA's
initiative, to increase or decrease the flow basis in response to a significant change in production
(40 CFR 124.5, 122.62). A change in production may be an "alteration" of the permitted activity
or "new information" that could provide the basis for a permit modification (40 CFR 122.62(a)).
After determining the facility's annual average process wastewater flow, the permit writer would
use this flow and not more than 25 percent nonprocess wastewater to convert the concentration-
based limitations into mass-based limitations for ammonia, COD, and organic constituents for
control at the end-of-pipe.
Additional detailed guidance on the establishment of permit limitations, including examples, is
available in the Guidance for Implementing the Pharmaceutical Manufacturing Industry
Regulations.
In-plant permit limitations for cyanide, based on the 1983 BAT limitations, will be concentration-
based, and not converted to a mass basis. A concentration basis for cyanide offers a direct
benchmark to assess whether the in-plant control technology is achieving the intended level. In-
15-8
plant wastestreams that require control may be generated or treated on a variable, batch basis,
causing difficulty in establishing accurate mass-based permit limitations. Also, compliance is
hindered, because the permitted facility cannot make a direct measurement to determine if its
control technology is performing at the required level. Concentration-based permit limitations
eliminate these problems and offer a direct measure of cyanide to both the permitting authority
and the permitted facility that BAT performance levels are being achieved.
15.3.4 Monitoring and Compliance
Compliance monitoring for ammonia, COD, and all regulated organic constituents should be
performed on a frequency basis established by the permit authority. EPA's monitoring costs for
this regulation assumed compliance monitoring for ammonia and all regulated organic constituents
on a weekly basis for Subcategory A and C facilities, and monitoring for COD on a daily basis for
Subcategory A, B, C, and D facilities. The list of pollutants for which monitoring would be
required at Subcategory A and C facilities includes all regulated constituents listed in Table 15-1
generated or used in pharmaceutical manufacturing processes at the facility. Based on the
limitations, monitoring of ammonia, COD, and organic constituents generated or used in
pharmaceutical manufacturing processes would occur prior to discharge to waters of the United
States and before dilution with significant amounts of nonprocess waters.
Compliance with mass-based permit limitations is determined by multiplying the measured
concentration of a regulated pollutant in the effluent sample by a conversion factor and by the
total wastewater flow at the monitoring location during the effluent sampling period. Thus, the
mass compliance value should be based on the total flow discharged on the day of sampling, not
on the long-term average process water flow rate that provided the basis for establishing the
permit limitations and standards.
Compliance monitoring for cyanide should occur in-plant, prior to commingling or dilution with
non-cyanide-bearing wastewater, unless a facility can show end-of-pipe monitoring for cyanide is
feasible. To show that end-of-pipe monitoring is feasible, the facility would need to demonstrate
15-9
compliance with cyanide limitations, adjusted as necessary to account for dilution with non-
cyanide-bearing wastewater, at a level above the detection limit for cyanide.
The list of pollutants for which monitoring would be required should be updated based on
consideration of raw material and process changes throughout the facility and an annual scan for
all pollutants listed in Table 15-1. The annual scan should be performed at the compliance
monitoring point(s) to identify any regulated pollutants in the wastewater. Permit monitoring and
compliance should be required at all monitoring locations for all pollutants detected at any
locations.
Dischargers must use the test methods promulgated at 40 CFR Part 136.3 or incorporated by
reference in the tables of that part, when available, to monitor pollutant discharges from the
pharmaceutical manufacturing industry, unless specified otherwise in part 439 (see 40 CFR
401.13) or by the permitting authority.
As a part of the final rule, EPA promulgated additional test methods for the pollutants to be
regulated under Part 439 for which there are no test methods listed at 40 CFR Part 136.3. To
support the Part 439 regulations at the time of proposal, EPA published test methods developed
specifically for the pharmaceutical industry in a compendium entitled, “Analytical Methods for the
Determination of Pollutants in Pharmaceutical Manufacturing Industry Wastewater,” EPA-821-B-
94-001. These test methods were discussed in the proposed rule and have been revised in
response to public comment. The revised test methods are available for monitoring some
pollutants covered by today’s final rule. The revised test methods have been published in a
revised compendium (the “Pharmaceutical Methods Compendium, Revision A;” EPA-821-B-98-
016, 1998), with the same title as the proposed compendium.
In addition, EPA is allowing use of applicable drinking water methods that have been
promulgated at 40 CFR Part 141 and use of ASTM Methods D3371, D3695, and D4763, for
monitoring of the pollutants included in this rulemaking. The final rule allows for use of these
additional test methods for several reasons: (1) it allows greater flexibility in monitoring; (2) it
conforms use of methods in EPA’s drinking water and wastewater programs; (3) it moves toward
15-10
a performance-based measurement system; and (4) it allows use of technical standards as
contemplated by the National Technology Transfer and Advancement Act of 1995 (NTTAA).
15-11
Table 15-1
Pollutants Regulated Under BAT for Subcategories A and C
(a) Retaining cyanide effluent limits established in the 1983 final rule.
15-12
Table 15-2
BAT Effluent Limitations for Subcategory A and C Operations
Pollutant or Pollutant Property mg/L mg/L
BAT Effluent Limitations for In-Plant Monitoring Points
Maximum for any 1 day Monthly Average
Cyanide 33.5 9.4(a)
(a) Cyanide effluent limit established in the 1983 final rule.
Pollutant or Pollutant Property mg/L mg/L
BAT Effluent Limitations for End-of-Pipe Monitoring Points
Maximum for any 1 day Monthly Average (a)
COD 1,675 856(a) If these COD concentrations are higher than concentration values reflecting a reduction in the long-term average daily COD load in the raw(untreated) process wastewater of 74 percent multiplied by a variability factor of 2.2, then effluent limitations for COD corresponding to the lowerconcentration values must be applied.
Pollutant or Pollutant Property mg/L mg/L
BAT Effluent Limitations for End-of-Pipe Monitoring Points
Maximum for any 1 day Monthly Average
Ammonia as N 84.1 29.4
Acetone 0.5 0.2
Acetonitrile 25.0 10.2
n-Amyl Acetate 1.3 0.5
Amyl Alcohol 10.0 4.1
Benzene 0.05 0.02
n-Butyl Acetate 1.3 0.5
Chlorobenzene 0.15 0.06
Chloroform 0.02 0.01
o-Dichlorobenzene 0.15 0.06
1,2-Dichloroethane 0.4 0.1
Diethylamine 250.0 102.0
Dimethyl Sulfoxide 91.5 37.5
Ethanol 10.0 4.1
Ethyl Acetate 1.3 0.5
n-Heptane 0.05 0.02
Table 15-2 (Continued)
Pollutant or Pollutant Property mg/L mg/L
BAT Effluent Limitations for End-of-Pipe Monitoring Points
Maximum for any 1 day Monthly Average
15-13
n-Hexane 0.03 0.02
Isobutyraldehyde 1.2 0.5
Isopropanol 3.9 1.6
Isopropyl Acetate 1.3 0.5
Isopropyl Ether 8.4 2.6
Methanol 10.0 4.1
Methyl Cellosolve 100.0 40.6
Methylene Chloride 0.9 0.3
Methyl Formate 1.3 0.5
MIBK 0.5 0.2
Phenol 0.05 0.02
Tetrahydrofuran 8.4 2.6
Toluene 0.06 0.02
Triethylamine 250.0 102.0
Xylenes 0.03 0.01
15-14
Table 15-3
BAT Effluent Limitations for SubcategoryB and D Operations
Pollutant or Pollutant Property mg/L mg/L
BAT Effluent Limitations for End-of-Pipe Monitoring Points
Maximum for any 1 day Monthly Average (a)
Chemical Oxygen Demand (COD) 228 86(a) If these COD concentrations are higher than concentration values reflecting a reduction in the long-term average daily COD load in the raw(untreated) process wastewater of 74 percent multiplied by a variability factor of 2.2, then effluent limitations for COD corresponding to the lowerconcentration values must be applied.
15-15
Table 15-4
Surrogates for Subcategory A/C Direct Dischargers (Biotreatment)
Group Compound Surrogate (yes/no)
Alcohols Ethanol Yes
Isopropanol Yes
Methanol Yes
Phenol No
Amyl alcohol No
Aldehydes Isobutyraldehyde No
Alkanes n-Heptane Yes
n-Hexane Yes
Amides & Amines Triethylamine No
Diethylamine No
Aromatics Toluene Yes
Xylenes Yes
Chlorobenzene No
o-Dichlorobenzene No
Benzene No
Chlorinated Alkanes Methylene chloride Yes
Chloroform Yes
1,2-Dichloroethane Yes
Esters & Ethers Ethyl acetate Yes
Tetrahydrofuran Yes
Isopropyl acetate No
n-Amyl acetate No
Isopropyl ether No
n-Butyl acetate No
Methyl formate No
Ketones Acetone Yes
MIBK No
Miscellaneous Ammonia (aqueous) No
Acetonitrile No
Dimethyl sulfoxide No
Methyl cellosolve NoYes - Surrogate pollutant for that group.No - Not a surrogate pollutant for that group.
15-16
1. U.S. EPA, Office of Water. Statistical Support Document for the EffluentLimitations Guidelines for the Pharmaceutical Manufacturing Industry. EPA-821-B-98-007. U.S. Environmental Protection Agency, Washington, D.C., 1998.
2. U.S. EPA, Office of Water. Training Manual for NPDES Permit Writers. EPA833-B-93-003, U.S. Environmental Protection Agency, Washington, D.C., 1993.
REFERENCES
16-1
SECTION 16
NEW SOURCE PERFORMANCE STANDARDS (NSPS)
16.1 Introduction
The basis for new source performance standards under Section 306 of the CWA is the best
available demonstrated technology. Industry has the opportunity to design and install the best and
most efficient process operations and wastewater treatment systems at new pharmaceutical
manufacturing facilities. Accordingly, Congress directed EPA to consider the best demonstrated
alternative processes, process changes, in-plant control measures, and end-of-pipe wastewater
treatment technologies that reduce pollution to the maximum extent feasible. In response to that
directive, and as with the development of options for the BAT effluent limitations guidelines, EPA
considered effluent reductions attainable by the most advanced treatment technologies at
pharmaceutical manufacturing facilities.
NSPS establish quantitative limits on the direct discharge of conventional, priority, and
nonconventional pollutants to waters of the United States. These standards are based upon the
performance of specific advanced technologies, but do not specify which technologies must be
used to achieve compliance. NSPS are applied to individual facilities through NPDES permits
issued by EPA or authorized states under Section 402 of the CWA. Each facility then chooses its
own approach to complying with its permit limitations.
NSPS apply to all new sources in the pharmaceutical manufacturing industry. The NPDES permit
regulations define the term "new source" at 40 CFR 122.2 and 122.29. According to these
regulations, to be "new", a source must:
C Be constructed at a site at which no other source is located;
C Totally replace the process or production equipment that causes thedischarge of pollutants at an existing source; or
16-2
C Be a process substantially independent of an existing source at the samesite, considering the extent of integration with the existing source and theextent to which the new source is engaged in the same general type ofactivity as the existing source.
The Agency has selected end-of-pipe advanced biological treatment with nitrification of ammonia
as the technology basis for the NSPS for Subcategories A and C. The performance level of the
advanced biological treatment system component of NSPS for Subcategories A and C is
equivalent to the selected BPT, for COD, and BAT, for priority, nonconventional organic
pollutants and ammonia. Standards for conventional pollutants (BOD , TSS and pH) are being5
established for new sources consistent with that same performance level.
The Agency has selected end-of-pipe advanced biological treatment as the technology basis for
the NSPS for Subcategories B and D. The performance level of the advanced biological
treatment system component of NSPS for Subcategories B and D is equivalent to the selected
BPT for COD. Standards for conventional pollutants (BOD , TSS and pH) are being established5
for new sources consistent with that same performance level. The rationale behind these
selections is discussed in Section 11.
The following information is presented in this section:
C Section 16.2 reviews the subcategories and the pollutants to be regulatedby NSPS and presents the NSPS; and
C Section 16.3 discusses NSPS implementation with regard to point ofapplication, permit limitations, and monitoring and compliance issues.
16.2 Summary of the NSPS
16.2.1 Regulated Subcategories
The NSPS, as discussed in Section 7.3 are for Subcategories A, B, C, and D. As discussed in
Section 4.3, Subcategories A, B, and C include wastewater discharges resulting from the
16-3
manufacture of pharmaceuticals by fermentation, biological or natural extraction processes, and
chemical synthesis processes, respectively. Subcategory D includes wastewater discharges
resulting from mixing, compounding, and formulating of pharmaceutical products.
16.2.2 Regulated Pollutants
The NSPS establish effluent limitations for the conventional, priority, and nonconventional
pollutants listed in Table 16-1 for direct dischargers in Subcategories A and C. In addition, the
NSPS establish effluent limitations for the conventional, and nonconventional pollutants listed in
Table 16-2 for direct dischargers in Subcategories B and D.
The NSPS in this rulemaking clarifies existing in-plant cyanide limitations for Subcategory A and
C facilities. Compliance monitoring for cyanide should occur immediately after cyanide
destruction, before commingling cyanide-bearing waste streams with non-cyanide-bearing waste
streams, unless a facility can demonstrate that cyanide is detectable at end-of-pipe. The 1983
cyanide limitations for Subcategory B and D direct dischargers are being withdrawn; these
subcategories do not use or generate cyanide.
16.2.3 NSPS
The NSPS for each subcategory are based on a combination of long-term mean effluent values
and variability factors that account for day-to-day variation in measured treated effluent
concentrations. Long-term means, discussed in Section 8, are target values that a facility should
achieve on a long-term, average basis. The variability factors, discussed in the Statistical Support
Document(1), which is located in the Administrative Record for this rulemaking, represent the
ratio of an elevated value, expected to occur only rarely, to the long-term mean. The purpose of
the variability factor is to allow for variations in measured effluent concentrations that comprise
the long-term mean. A facility that designs and operates its treatment system to achieve a long-
term mean on a consistent basis should be able to comply with the daily and monthly limitations in
the course of normal operations.
16-4
EPA is promulgating NSPS equal to the final BAT effluent limitations for 30 organic pollutants,
cyanide and ammonia for Subcategory A and C facilities. NSPS for Subcategory A, B, C, and D
facilities are also being revised for BOD , COD and TSS, at a level equal to the discharge5
characteristics of the best performing BPT plants.
Table 16-3 presents the maximum daily and monthly average NSPS for Subcategory A, and C
operations. Table 16-4 presents the maximum daily and monthly average NSPS for Subcategory
B and D operations.
The NSPS for acetonitrile, benzene, diethylamine, dimethyl sulfoxide, ethanol, n-heptane,
methanol, methyl cellosolve, and triethylamine are based on the analytical method minimum level.
The minimum level for a pollutant is the level at which an analytical system gives recognizable
signals and an acceptable calibration point. For pollutants with a long-term mean below the
minimum level, typically in cases where treatment performance was established through data
transfer, the final long-term mean was set at a value no lower than the minimum level for the
pollutant. The final effluent limitations are determined by applying 1-day and 4-day variability
factors to the final long-term means.
The pH effluent limit, established in the 1976 Final Rule (41 FR 50676) to be the range of 6.0 to
9.0 standard units for all subcategories, is not being revised. The NSPS cyanide effluent limit,
established in the 1983 Final Rule to be a daily maximum of 33.5 mg/L and a maximum monthly
average of 9.4 mg/L for all subcategories, is not being revised for Subcategories A and C. The
cyanide effluent limit is being withdrawn for Subcategories B and D, because EPA has determined
that cyanide is neither used nor generated by facilities with these subcategory operations.
16-5
16.3 Implementation of NSPS
16.3.1 Establishing List of Pollutants for Compliance Monitoring
Permitting authorities should establish permit limitations and compliance monitoring requirements
for each pollutant listed in Table 16-1 for Subcategory A and C facilities, or Table 16-2 for
Subcategory B and D facilities, generated or used at a pharmaceutical manufacturing facility.
Limitations and routine compliance monitoring should not be required for regulated pollutants not
generated or used at a facility. A determination that regulated pollutants are not generated or
used should be based on a review of all raw materials and chemical processes used, considering
resulting products and by-products. The determination that a regulated pollutant is not generated
or used should be confirmed by annual chemical analyses of wastewater from each monitoring
location. Such confirmation would be provided by an analytical measurement of a non-detect
value.
Facilities discharging more than one regulated organic pollutant may monitor for a single
surrogate pollutant to demonstrate an appropriate degree of control for a specified group of
pollutants. For the purpose of identifying surrogates, pollutants are grouped according to
treatability classes; Table 16-5 presents the treatability classes identified for advanced biological
treatment, which is the BAT technology basis for organic pollutant limitations. For treatability
classes with more than one possible surrogate pollutant, the analyte with the highest concentration
should be chosen as the surrogate pollutant. Plants may monitor for a surrogate pollutant(s) only
if they demonstrate that all other pollutants receive the same degree of treatment.
An individual plant may choose to demonstrate by selecting a monitoring pollutant for a given
treatability class and maintaining documentation, including flow information and sampling results,
that all pollutants in that treatability class receive equivalent treatment. The documentation is then
submitted to the permit authority for approval.
16-6
16.3.2 Point of Application
The NSPS for pollutants listed in Tables 16-3 and Table 16-4 are end-of-pipe standards and are
applicable to the final effluent at the point of discharge to waters of the United States, prior to
non-process dilution waters. Compliance monitoring for cyanide should occur in-plant, unless a
facility can show a measurable amount of cyanide at end-of-pipe, instead of a non-detect in
accordance with 40 CFR 403.6 (e)(2) and 403.6 (e)(4).
16.3.3 Permit Limitations
End-of-pipe permit limitations based on the NSPS limitations for ammonia, conventional, and
non-conventional organic pollutants would be mass-based.
Permit writers should use a reasonable estimate of process wastewater discharge flow, allowing
for no more than 25% nonprocess wastewater flow, and the concentration-based standards listed
in Tables 16-3 and 16-4 to develop mass-based permit limitations for the NPDES permit. Section
15.3.3 presents guidance regarding how a reasonable estimate of process wastewater discharge
flow should be established. Additional detailed guidance on establishing permit limitations is
available in the Guidance for Implementing the Pharmaceutical Manufacturing Industry
Regulations.
EPA expects permit limitations for cyanide at in-plant locations based on the 1983 NSPS
limitations should be concentration-based, and would not be converted to a mass basis. A
concentration basis offers a direct benchmark to assess whether the in-plant control technology is
achieving the intended NSPS level. In-plant wastestreams that require control may be generated
or treated on a variable, batch basis. In such a setting, mass-based permit limitations are difficult
to establish accurately, hindering compliance because a direct measurement of the control
technology performance cannot be made. Concentration-based permit limitations eliminate these
problems and offer a direct measure of cyanide to both the permitting authority and the permitted
facility that NSPS performance levels are being achieved.
16-7
16.3.4 Monitoring and Compliance
Compliance monitoring for the NSPS pollutants should be performed on a frequency basis
established by the permit authority. EPA's monitoring costs for this regulation assume compliance
monitoring for ammonia and all regulated organic constituents on a weekly basis for Subcategory
A and C facilities and monitoring for BOD , COD, and TSS on a daily basis for Subcategory A,5
B, C, and D facilities. The list of pollutants which require monitoring includes all regulated
constituents listed in Table 16-1 for A/C Subcategory facilities, or Table 16-2 for B/D
Subcategory facilities, generated or used in pharmaceutical manufacturing processes at the
facility. Under the NSPS, monitoring for BOD , COD, TSS, pH, ammonia, and organic5
constituents generated or used in pharmaceutical manufacturing processes would occur at the
point of discharge to waters of the United States and before dilution with significant amounts of
nonprocess waters.
Compliance with mass-based permit limitations is determined by multiplying the measured
concentration of a regulated pollutant in the effluent sample by a conversion factor and by the
total wastewater flow at the monitoring location during the effluent sampling period. Thus, the
mass compliance value should be based on the total flow discharged on the day of sampling, not
on the long-term average process water flow rate that provided the basis for establishing the
permit limitations and standards.
Monitoring for cyanide for Subcategories A and C would be performed in-plant, prior to
commingling or dilution with non-cyanide-bearing wastewater, unless a facility can show end-of-
pipe monitoring for cyanide is feasible. To show that end-of-pipe monitoring is feasible, the
facility would need to demonstrate compliance with cyanide limitations, adjusted as necessary to
account for dilution with non-cyanide-bearing wastewater, at a level above the detection limit.
The list of pollutants for which EPA proposes to require monitoring should be updated based on
consideration of raw material and process changes throughout the facility and an annual scan for
all pollutants in Table 16-1 for Subcategory A/C facilities. The annual scan should be performed
at the compliance monitoring point(s) to identify any regulated pollutants in the wastewater.
16-8
Permit monitoring and compliance should be required at all monitoring locations for all pollutants
detected at any locations.
Dischargers must use the test methods promulgated at 40 CFR Part 136.3 or incorporated by
reference in the tables of that part, when available, to monitor pollutant discharges from the
pharmaceutical manufacturing industry, unless specified otherwise in part 439 (see 40 CFR
401.13) or by the permitting authority.
As a part of the final rule, EPA promulgated additional test methods for the pollutants to be
regulated under Part 439 for which there are no test methods listed at 40 CFR Part 136.3. To
support the Part 439 regulations at the time of proposal, EPA published test methods developed
specifically for the pharmaceutical industry in a compendium entitled, “Analytical Methods for the
Determination of Pollutants in Pharmaceutical Manufacturing Industry Wastewater,” EPA-821-B-
94-001. These test methods were discussed in the proposed rule and have been revised in
response to public comment. The revised test methods are available for monitoring some
pollutants covered by today’s final rule. The revised test methods have been published in a
revised compendium (the “Pharmaceutical Methods Compendium, Revision A;” EPA-821-B-98-
016, 1998), with the same title as the proposed compendium.
In addition, EPA is allowing use of applicable drinking water methods that have been
promulgated at 40 CFR Part 141 and use of ASTM Methods D3371, D3695, and D4763, for
monitoring of the pollutants included in this rulemaking. The final rule allows for use of these
additional test methods for several reasons: (1) it allows greater flexibility in monitoring; (2) it
conforms use of methods in EPA’s drinking water and wastewater programs; (3) it moves toward
a performance-based measurement system; and (4) it allows use of technical standards as
contemplated by the National Technology Transfer and Advancement Act of 1995 (NTTAA).
16-9
Table 16-1
Pollutants Regulated Under NSPS for Subcategory A and C Facilities
Conventional Pollutants
BOD TSS5
Priority Pollutants
Benzene 1,2-Dichloroethane
Chlorobenzene Methylene chloride
Chloroform Phenol
o-Dichlorobenzene (1,2-Dichlorobenzene) Toluene
Cyanide (a)
Nonconventional Pollutants
Ammonia n-Hexane
COD (Chemical Oxygen Demand) Isobutyraldehyde
Acetone Isopropanol
Acetonitrile Isopropyl acetate
n-Amyl acetate Isopropyl ether
Amyl alcohol Methanol
n-Butyl acetate Methyl cellosolve
Diethylamine Methyl formate
Dimethyl Sulfoxide Methyl isobutyl ketone (MIBK)
Ethanol Tetrahydrofuran
Ethyl acetate Triethylamine
n-Heptane Xylenes(a) Retaining cyanide effluent limits established in the 1983 final rule.
16-10
Table 16-2
Pollutants Regulated Under NSPS for Subcategory B and D Facilities
Conventional Pollutants
BOD TSS5
Nonconventional Pollutants
COD (Chemical Oxygen Demand)
16-11
Table 16-3
NSPS for Subcategory A and C Operations
Pollutant or Pollutant Property mg/L mg/L
NSPS for In-Plant Monitoring Points
Maximum for any 1 day Monthly Average
Cyanide 33.5 9.4(a)
(a) Cyanide effluent limit established in the 1983 Final Rule.
Pollutant or Pollutant Property mg/L mg/L
NSPS for End-of-Pipe Monitoring Points
Maximum for any 1 day Monthly Average
BOD 267 1115
COD 1,675 856
TSS 472 166
Pollutant or Pollutant Property mg/L mg/L
NSPS for End-of-Pipe Monitoring Points
Maximum for any 1 day Monthly Average
Ammonia as N 84.1 29.4
Acetone 0.5 0.2
Acetonitrile 25.0 10.2
n-Amyl Acetate 1.3 0.5
Amyl Alcohol 10.0 4.1
Benzene 0.05 0.02
n-Butyl Acetate 1.3 0.5
Chlorobenzene 0.15 0.06
Chloroform 0.02 0.01
o-Dichlorobenzene 0.15 0.06
1,2-Dichloroethane 0.4 0.1
Diethylamine 250.0 102.0
Dimethyl Sulfoxide 91.5 37.5
Ethanol 10.0 4.1
Ethyl Acetate 1.3 0.5
n-Heptane 0.05 0.02
n-Hexane 0.03 0.02
Isobutyraldehyde 1.2 0.5
Table 16-3 (Continued)
Pollutant or Pollutant Property mg/L mg/L
NSPS for End-of-Pipe Monitoring Points
Maximum for any 1 day Monthly Average
16-12
Isopropanol 3.9 1.6
Isopropyl Acetate 1.3 0.5
Isopropyl Ether 8.4 2.6
Methanol 10.0 4.1
Methyl Cellosolve 100.0 40.6
Methylene Chloride 0.9 0.3
Methyl Formate 1.3 0.5
MIBK 0.5 0.2
Phenol 0.05 0.02
Tetrahydrofuran 8.4 2.6
Toluene 0.06 0.02
Triethylamine 250.0 102.0
Xylenes 0.03 0.01
16-13
Table 16-4
NSPS for Subcategory B and D Operations
Pollutant or Pollutant Property mg/L mg/L
NSPS for End-of-Pipe Monitoring Points
Maximum for any 1 day Monthly Average
BOD 35 185
COD 228 86
TSS 58 31
16-14
Table 16-5
Surrogates for Subcategory A/C Direct Dischargers (Biotreatment)
Group Compound Surrogate (yes/no)
Alcohols Ethanol Yes
Isopropanol Yes
Methanol Yes
Phenol No
Amyl alcohol No
Aldehdes Isobutyraldehyde No
Alkanes n-Heptane Yes
n-Hexane Yes
Amides & Amines Triethylamine No
Diethylamine No
Aromatics Toluene Yes
Xylenes Yes
Chlorobenzene No
o-Dichlorobenzene No
Benzene No
Chlorinated Alkanes Methylene chloride Yes
Chloroform Yes
1,2-Dichloroethane Yes
Esters & Ethers Ethyl acetate Yes
Tetrahydrofuran Yes
Isopropyl acetate No
n-Amyl acetate No
Isopropyl ether No
n-Butyl acetate No
Methyl formate No
Ketones Acetone Yes
MIBK No
Miscellaneous Ammonia (aqueous) No
Acetonitrile No
Dimethyl sulfoxide No
Methyl cellosolve NoYes-Surrogate pollutant for that groupNo-Not a surrogate pollutant for that group
16-15
1. U.S. EPA, Office of Water. Statistical Support Document for the EffluentLimitations Guidelines for the Pharmaceutical Manufacturing Industry EPA-821-B-98-002. U.S. Environmental Protection Agency, Washington, D.C., 1998.
REFERENCES
17-1
SECTION 17
PRETREATMENT STANDARDS FOR EXISTING SOURCES (PSES) AND PRETREATMENT STANDARDS FOR NEW SOURCES (PSNS)
17.1 Introduction
Pretreatment standards for existing sources are designed to prevent the discharge of pollutants
which pass through, interfere with, or are otherwise incompatible with the operation of POTWs.
The CWA requires pretreatment for pollutants that pass through POTWs in amounts that would
exceed direct discharge effluent limitations or limit POTW sludge management alternatives,
including the beneficial use of sludges on agricultural lands. EPA also determines that there is
pass through of a pollutant if the pollutant exhibits significant volatilization prior to treatment by
POTWs. Pretreatment standards are to be technology-based and analogous to the BAT for
removal of priority and nonconventional pollutants.
Section 307(c) of the CWA requires EPA to promulgate pretreatment standards for new sources
at the same time that it promulgates NSPS. New indirect discharging facilities, like new direct
discharging facilities, have the opportunity to incorporate the best available demonstrated
technologies, including process changes and in-plant treatment technologies that reduce pollution
to the maximum extent feasible. Pretreatment standards for new sources (see Section 16 for a
discussion of the definition of new source) are to be technology-based and analogous to the NSPS
for the removal of priority and nonconventional pollutants.
The owners or operators of facilities subject to PSES or PSNS are not required to use the specific
process technologies and wastewater treatment technologies selected by EPA to establish the
PSES or PSNS, but may choose to use any combination of process technologies and wastewater
treatments to comply with permit limitations derived from the PSES or PSNS.
The Agency has selected in-plant steam stripping for organics and ammonia as the technology
basis for the PSES for Subcategory A and C operations. The Agency has selected in-plant steam
stripping for organics as the technology basis for the PSES for Subcategory B and D operations.
17-2
The Agency has selected in-plant steam stripping for organics and ammonia as the technology
basis for PSNS for Subcategory A and C operations. The Agency also selected in-plant steam
stripping for organics as the PSNS for Subcategory B and D operations. The rationale behind
these selections is discussed in Section 11.
The Agency is making changes to the current PSES/PSNS effluent limitations set for cyanide in
the October 27, 1983 regulation for the pharmaceutical manufacturing industry. Specifically,
EPA is withdrawing the PSES/PSNS regulation for cyanide at Subcategory B and D facilities.
EPA is retaining the existing PSES/PSNS regulations for cyanide at Subcategory A and C
facilities. In addition, the Agency is clarifying that the existing in-plant cyanide limitations apply
to Subcategory A and C facilities unless a facility can demonstrate compliance with the existing
end-of-pipe cyanide limitations and standards with a measurable amount of cyanide in the facility’s
effluent. A facility effluent cyanide concentration of “not detect” is more likely to represent
dilution instead of treatment and therefore, in these cases, the limitations and standards should be
applied in-plant at the point of cyanide destruction.
The following information is presented in this section:
C Section 17.2 reviews the subcategories regulated by PSES and PSNS, theresults of the Agency's POTW pass-through analysis to determinepollutants regulated by PSES and PSNS, and presents the selected PSESand PSNS; and
C Section 17.3 discusses PSES and PSNS implementation with regard topoint of application, permit limitations, and monitoring and complianceissues.
17.2 Summary of PSES and PSNS
17.2.1 Regulated Subcategories
PSES and PSNS have been revised for Subcategories A, B, C, and D. As discussed in Section
4.3, Subcategories A, B, and C include wastewater discharges resulting from the manufacture of
17-3
pharmaceuticals by fermentation, biological or natural extraction processes, and chemical
synthesis processes, respectively. Subcategory D includes discharges resulting from mixing,
compounding, and formulating of pharmaceutical products.
17.2.2 POTW Pass-Through Analysis
The Agency has evaluated POTW pass through for those pollutants selected for regulation as
listed in Section 6.6 and 6.7. In determining whether a pollutant is expected to pass through a
POTW, the Agency assessed the following:
C Whether the pollutant would be volatilized from conveyance systems,equalization or other treatment units or POTW head works which are opento the atmosphere;
C Whether the nation-wide average percentage of a pollutant removed bywell-operated POTWs achieving secondary treatment is less than thepercentage removed by the BAT model treatment system; or
C Whether there are any specific instances of POTW interference, upset, orpass through known to the Agency as being caused by the pollutantsselected for regulation.
For promulgation, EPA used an inclusive approach to determine pass through instead of a divided
multi-pronged approach when considering pass through criteria. At proposal and for the NOA,
EPA considered whether a pollutant would readily volatilize to the air prior to treatment or
whether a pollutant would pass through based on the BAT/POTW pollutant percent removal
comparison. If a pollutant met the pass-through criteria for either of these criteria, the pollutant
was considered to pass through. For promulgation, EPA adopted a more unified approach where
a pollutant needed to meet the pass through criteria based on pollutant volatility, solubility, and
the BAT/POTW pollutant percent removal comparison in order to be considered to pass through.
The approach was developed in consideration of the unique characteristics of pharmaceutical
industry wastewater, and the attributes of the selected BAT and PSES technology bases. Lastly,
pollutants known to cause treatment problems at POTWs accepting pharmaceutical
manufacturing wastewaters were considered for regulation.
17-4
Presented below are brief descriptions of PSES pass-through analysis methodologies utilized for
proposal and the NOA as well as a more detailed discussion of the methodology and results of the
adopted PSES pass-through analysis used for the final regulation.
17.2.2.1 May 2, 1995 Approach
In the May 2, 1995 proposal, the Agency used a two-pronged approach for identifying pollutants
that potentially pass through POTWs. This approach consisted of the volatility override and
POTW percent removal in comparison with the BAT percent removal. Both criteria were carried
through for the final POTW pass-through analysis, with some modifications to the data editing.
Pollutant Volatility Analysis
POTW pass-through was assumed to occur for those compounds with significant volatilization in
the collection systems and head works of POTWs, thereby reducing the amount of organics that
can be biodegraded in the POTW secondary treatment works. In evaluating a pollutant’s
volatility, EPA looked at the pollutant’s Henry’s Law Constant, the emissions predicted for that
pollutant by WATER7 modeling for direct dischargers (1), and whether the pollutant was
identified as a wastewater pollutant requiring control in the Hazardous Organic NESHAP (HON)
(59 FR 19402, 4/22/94) (2).
Based on the analysis of Henry’s Law Constants, the estimate of pollutant air emissions from the
WATER7 fate analysis at direct dischargers and the inclusion of pollutants in the HON
wastewater provisions, those pollutants with a Henry’s Law Constant equal to or greater than that
of methanol (1.0 x 10⁻⁶ atm/gmole/m3) were identified as being volatile. These pollutants were
determined to potentially be volatilized to the air before reaching treatment at POTWs and were
therefore considered to pass through.
17-5
BAT and POTW Percent Removal Analysis
The traditional pass-through analysis evaluates the percentage removal of a pollutant in POTWs
nationwide with the proposed BAT percent removal for the same pollutant. In evaluating the
POTW percent removal nationwide, EPA primarily used the Domestic Sewage Study Report (3)
as well as other sources of bench- and pilot-scale biological treatment performance data. The
Agency used pollutant loading information provided by the industry in their 1990 detailed
questionnaire responses and the long-term mean treatment performance concentrations developed
for each pollutant after application of the BAT treatment technology(ies) in developing BAT
percent removal values.
POTW pollutant percent removals were determined either from specific sources or by transfer of
a POTW percent removal from a similar constituent when data were not available. POTW
percent removal data were collected from the following sources: The Domestic Sewage Study
(DSS), sampling episode report for the Syracuse POTW, and the US EPA Risk Reduction
Engineering Laboratory (RREL) Treatability Database (4). BAT pollutant percent removals were
determined using the raw loadings data (represented as the sum of the pollutant load from air
emissions from wastewater prior to discharge, discharges to surface water, or degraded/destroyed
on-site) and the effluent loadings data (calculated from the proposed BAT long-term mean
treatment performance concentrations, facility wastewater flow, and appropriate conversion
factors) that would be achieved if BAT were in place at these facilities. A percent removal was
then determined between the raw and effluent loads for each candidate pollutant. A load
weighted average percent removal was calculated to represent nationwide BAT percent removal
where multiple direct discharging facilities were discharging the same pollutant of concern.
Evidence of Pass-Through
In February 1993, EPA sent a survey to nine POTWs known to receive pharmaceutical
manufacturing industry discharges. These responses were reviewed to identify pharmaceutical
candidate pollutants from pharmaceutical plants that may be causing upsets or pass-through at
POTWs. In addition, data collected by EPA from the Syracuse POTW and data submitted
17-6
previously to EPA by the Syracuse POTW were also reviewed for evidence of pollutants that may
cause POTW upset or pass through. Based on these reviews, POTW personnel have reported
POTW interference or upset by discharges from pharmaceutical facilities of ammonia,
tetrahydrofuran, and dimethyl sulfoxide (5).
17.2.2.2 August 8, 1997 NOA Approach
EPA used the same basic approach for determining pollutant POTW pass-through for the NOA as
at proposal. EPA considered pollutant volatility, BAT pollutant percent removal compared to
POTW pollutant percent removal, and potential POTW upsets. The following paragraphs note
the revisions made to the original POTW pass-through analysis upon receiving public comments
to the proposal and additional data.
Pollutant Volatility
EPA considered three options for the volatile override approach for the NOA. The first option
was to have the override cutoff at a Henry’s Law Constant of 1.0×10⁻⁵ atm/gmole/m3 based on
the precedent in the OCPSF rulemaking (52 FR 42522). The second option was to have an
override cutoff based on a Henry’s Law Constant of 1.0×10⁻⁴ atm/gmole/m3. The last option
was to eliminate the volatility override approach. The three options were considered in response
to commenters who opposed the proposed cutoff claiming it was too low.
Percent Removal Analysis
EPA made modifications to its BAT pollutant percent removal and POTW pollutant percent
removal analyses based on comments from the industry and acquired new data.
BAT Percent Removal
The following modifications were made to the proposal BAT pollutant percent removal
calculations:
17-7
1. Facility data sets that had an influent load less than ten times the proposedoption load were removed from consideration;
2. BAT percent removal was calculated for each facility pollutantcombination, and the median percent removal for each pollutant was usedto compare with the POTW percent removal; and
3. Three different options, each considered as the basis for BAT were used todetermine POTW pass-through. The first option included steam strippingfollowed by advanced biological treatment; the second, biologicaltreatment; and the third, based on EPA’s OAQPS percent removal ofpartially soluble/ soluble pollutants assuming 99% and 90% removal,respectively.
POTW Percent Removal
The following modifications were made to the POTW pollutant percent removal calculations:
1. Unacclimated DSS data were discarded from further evaluation andacclimated DSS data were used;
2. Data sets were edited so that influent concentrations less than ten times thedetection limit were discarded from further evaluation (this did not apply tothe acclimated DSS data because raw data from the DSS are not available);
3. DSS data were compared with other POTW sources and EPA determinedthat the data showed no significant differences between the percentremovals achieved by the DSS POTWs and the POTWs submitting theirown data. Therefore, the DSS percent removals were considered reliable;
4. The nationwide POTW pollutant percent removal was calculated as themedian of all acclimated POTW data submitted; and
5. The data transfers made from secondary alcohols to primary alcohols wereevaluated. Transfers to primary alcohols were revised such that thetransfers were made from a primary alcohol.
17-8
Comparison of BAT and POTW Percent Removals
EPA considered differential ranges between BAT pollutant percent removal and POTW pollutant
percent removal, assuming that once the percent removals were within a certain range of each
other, they were essentially equivalent. Differential ranges of 2% and 5% were considered
equivalent to a no pass-through determination. That is, if the POTW removal percentage was
within 2 or 5 percent of the BAT removal percentage for a pollutant, the pollutant would be
determined not to pass through.
17.2.2.3 Adopted Approach
After reviewing the public comments received on the August 8, 1997 NOA pass-through
methodology evaluation, the Agency again examined its methodology and instituted a final set of
changes. The Agency modified its two-pronged approach to a more inclusive approach and
several criteria were met before a pollutant was determined to pass through a POTW. These
criteria included: a volatility analysis, an evaluation of solubility in water, and a BAT and POTW
pollutant percent removal comparison. Again, this approach was developed in consideration of
the unique characteristics of pharmaceutical industry wastewater.
Volatility Analysis
Consistent with the OCPSF, Pesticides, and Central Waste Treaters (CWT) rule, EPA considered
pollutants with a Henry’s Law Constant greater than 1.0x10⁻⁵ atm/gmole/m3 to significantly
volatilize to the air before reaching treatment at a POTW. This cutoff level is greater than the
cutoff level presented at proposal and addresses commenters concerns that the proposal cutoff
level was too low. The list of organic pollutants that EPA has determined pass through POTWs
based on this criterion are shown in Table 17-1.
17-9
BAT and POTW Percent Removal Comparison
The Agency evaluated the percentage removed by the BAT model treatment systems using the
detailed questionnaire data submitted by direct dischargers and the long-term mean treatment
performance concentrations developed for the BAT treatment technology as discussed in Section
8. At the time of the NOA, data pairs with raw influent loads less than ten times the proposed
option load were removed from the analysis. For promulgation, EPA modified this approach so
that all pollutant data sets were edited to remove data pairs with raw influent concentrations less
than ten times the pollutant detection limit. The adopted approach better indicates whether
pollutants are present in raw wastewater at treatable levels. The approach used at the NOA for
determining median BAT pollutant percent removal was also adopted for the final rule.
The sources of the average percentage of a pollutant removed by well-operated POTWs achieving
secondary treatment included the acclimated percent removals reported in the Domestic Sewage
Study, data from the 40 Plant Study, the USEPA Risk Reduction Engineering Laboratory
Treatability Database (RREL), and various reports of POTW performance submitted to EPA
prior to and after the May 2, 1995 proposal. The data editing criteria used at the NOA for editing
POTW percent removals were not modified for the final rule. The list of organic pollutants that
EPA has determined pass-through POTWs based on this criterion are also shown in Table 17-1.
The Agency decided not to use a 2 or 5 percent differential and concluded that the most
reasonable approach is to accept the available data as the best information on the relative percent
removals of BAT and POTWs and to perform a BAT/POTW comparison directly based on that
data. EPA decided that such an approach was unbiased in that it does not favor either the over-
statement or under-statement of pass-through for the pollutants.
Water Soluble Compounds
The Agency used several sources to evaluate the fate of alcohols and related compounds in
pharmaceutical manufacturing wastewater treatment systems. For the purpose of this analysis,
17-10
water soluble compounds are alcohols or related compounds that are biodegradable and are no
more strippable than amyl alcohol (based on a Henry’s Law Constant cutoff of 2.23x10⁻⁵
atm/gmole/m ). EPA adopted this approach in order to be consistent with the MACT standards3
which state that water soluble compounds are less likely to volatilize than compounds that are
partially soluble. The following data sources were used in this analysis:
C EPA and Pharmaceutical Research and Manufacturers Association(PhRMA) wastewater samples collected from the primary treatment worksat the Barceloneta POTW in Barceloneta, Puerto Rico;
C WATER8 air emissions modeling of the Barceloneta POTW;
C An industry submitted literature study evaluating volatilization potential insewers; and
C An industry submitted study evaluating volatilization potential in anenclosed equalization tank.
EPA and PhRMA conducted sampling at the Barceloneta POTW to obtain data on the removal of
alcohols (methanol, ethanol, and isopropanol) and other oxygenates in the primary treatment
works of a POTW. The Barceloneta POTW was selected for sampling because the influent
wastewater to this POTW was known to contain measurable quantities of alcohols and other
pollutants for which pretreatment standards were proposed in May 1995. Three separate
sampling episodes were conducted at this POTW. They consisted of:
C In August 1996, EPA and PhRMA collected wastewater samples from theinfluent to the treatment system, the effluent from the aerated grit chamber,and the effluent from the primary clarifier. EPA’s lab analyzed the resultsusing analytical Method 1671, whereas PhRMA’s lab analyzed the resultsusing Method 8015. EPA performed a biodegradation study to determinethe extent to which pollutants were aerobically biodegraded in the aeratedgrit chambers.
C In April 1997, PhRMA conducted an anaerobic (anoxic) biodegradationstudy on the primary clarifier influent using Methods 1671 and 8015. EPAused the data obtained from Method 1671 to determine the overallbiodegradation and volatilization rates associated with the August 1996data.
17-11
C In August 1997, PhRMA conducted additional sampling around theprimary clarifier to determine if more frequent sampling would explain allor part of the alcohol losses measured in the August 1996 study.
Samples were collected in the influent and effluent from treatment units. Percent loss across the
treatment units was calculated from the influent and effluent mass from the unit. Percent losses
were assumed to be due to two major fate pathways: biodegradation and volatilization. Knowing
the overall percentage loss and the loss estimated to be attributed to biodegradation (both aerobic
and anoxic), EPA estimated the percent of loss attributed to volatilization. The sampling results
shown in Table 17-2 indicate the range of percent loss of alcohols in the primary treatment units
due to volatilization.
In addition, EPA performed WATER8 air emissions modeling of the Barceloneta POTW using
the sampled pollutant influent concentrations in order to obtain an estimate of how much
volatilization of volatile organic pollutants occurs throughout the entire POTW system (6). The
results of the modeling study shown in Table 17-3 show less volatilization in the primary
treatment portion than the measured data from the Barceloneta POTWs sampling episode
suggests.
EPA also evaluated an industry submitted study evaluating sewer losses for water soluble
compounds. The results of this study indicate that volatilization of methanol and ethanol in closed
sewers is expected to be minimal with maximum emission rates of 0.03 and 0.19% being
projected under most sewer conditions, respectively. However, under open sewer conditions,
volatilization percentages of methanol and ethanol could be as high as 6.5 and 20%,
respectively (7).
Since the August 8, 1997 NOA, EPA also has received information on a study conducted by
Pfizer at its Groton, CT production facility to analyze the volatilization of methanol from their
enclosed equalization tank (primary treatment at their biological treatment system). The
equalization tank is covered and vented to a combustion device and is mixed with a jet aeration
system. The headspace of the tank is under negative pressure due to an induced airflow by an
auxiliary combustion blower downstream of the tank vent. The study included air samples to
17-12
determine the concentration of the selected organics in the head space of the equalization tank and
influent and effluent wastewater samples.
The results of the above study show an average methanol concentration of 500 mg/L in the
equalization tank and an average vent gas methanol concentration of 70 ppmv. This results in a
volatilization loss of methanol of 0.31% (assuming that the only loss of methanol in the tank is
volatilization).
POTW Pass-Through Determination
Based on EPA’s review of the total body of measurement and modeling data, data from other
POTWs, a facility submitted equalization study, literature articles submitted by commenters, and
facility submitted data for on-site wastewater treatment systems related to the volatilization of
water soluble organics in pharmaceutical manufacturing industry wastewater, EPA has concluded
that these pollutants will not volatilize to a significant extent to the air prior to treatment and are
biodegraded in POTWs. Although these data sources yield conflicting information as to the
extent of volatilization and biodegradation in primary and secondary treatment, most results show
at least 90% treatment (biodegradation) of alcohols (not including volatilization). This percentage
is in accordance with the 90% treatment required by the MACT for soluble HAPs and is
equivalent to the losses likely occurring at direct discharger biological treatment systems.
Therefore, EPA concludes that alcohols and related compounds will not pass through. The list of
organic pollutants that EPA has determined pass-through POTWs based on this criterion are also
shown in Table 17-1.
Organic pollutants that meet the pass-through criteria based on volatility, the BAT/POTW percent
removal comparison, and solubility in water were selected for regulation for indirect dischargers.
Of the three pollutants (dimethyl sulfoxide, tetrahydrofuran, and ammonia) identified as problem
pollutants from the 1993 POTW survey, dimethyl sulfoxide is a pollutant that is not treated by
steam stripping, the technology basis for PSES and PSNS, and EPA has not promulgated
pretreatment standards for this pollutant. Tetrahydrofuran is found to pass through POTWs since
17-13
it meets the before mentioned pass-through criteria. Ammonia is considered to pass through
because many POTWs do not have nitrification capability that is part of the BAT model treatment
system and therefore they will not achieve as much ammonia removal as the BAT model
treatment system. However, EPA concluded that ammonia does not pass through for indirect
discharging facilities that discharge to POTWs with nitrification capabilities based on an
evaluation of EPA and POTW nitrification data. Thus, PSES ammonia limitations will not apply
to Subcategory A and C facilities discharging to POTWs with well-operated nitrification systems.
POTWs with nitrification capability are defined as being able to oxidize ammonium salts to nitrites
(via nitrosamas bacteria) and then further oxidize nitrites to nitrates (via nitribacter bacteria) and
achieve greater removals of ammonia than POTWs without nitrification. Nitrification can be
accomplished in either a singe or two-stage activated sludge system. Indicators of nitrification
capability are 1) biological monitoring for ammonia oxidizing bacteria (AOB) and nitrite oxidizing
bacteria (NOB) to determine if nitrification is occurring, and 2) analysis of the nitrogen balance to
determine if nitrifying bacteria reduce the amount of ammonia and increase the amount of nitrite
and nitrate.
EPA did receive and review data to determine whether COD should be considered to pass
through POTWs. EPA has determined based on its data that COD does not pass through POTWs
and is not regulating COD under PSES or PSNS. With regard to the priority pollutant cyanide,
EPA found that this pollutant passes through POTWs because the removal of cyanide by the BAT
cyanide destruction systems is significantly greater than the documented removals by well-
operated POTWs achieving secondary treatment. For a detailed discussion of the Agency's
POTW pass-through analysis see the memorandum entitled, "Final POTW Pass-Through Analysis
for the Pharmaceutical Manufacturing Industry" (8) which is located in the Record for this
rulemaking.
17.2.3 Regulated Pollutants
Section 6.0 of this document discusses potential pollutants to regulate for the pharmaceutical
manufacturing industry. The set of potential pollutants to regulate for Subcategory A and C
17-14
dischargers is different from the set of potential pollutants to regulate for Subcategory B and D
dischargers. EPA separately applied the pass-through criteria to both sets to determine the final
list of regulated pollutants for each respective subcategory. EPA is regulating 24 priority and
nonconventional pollutants (including ammonia, where applicable, and cyanide) for indirect
dischargers in Subcategories A and C. EPA is regulating 5 priority and nonconventional
pollutants for indirect dischargers in Subcategories B and D.
The final PSES and PSNS establish effluent standards for the priority and nonconventional
pollutants listed in Table 17-4 for indirect discharges in Subcategories A, B, C, and D.
17.2.4 PSES and PSNS
The effluent limitations for PSES and PSNS for each subcategory are based on a combination of
long-term mean treatment performance concentrations and variability factors that account for day-
to-day variation in measured treated effluent concentrations. Long-term mean treatment
performance concentrations, discussed in Section 8, are target values that a facility should achieve
on a long-term, average basis. The variability factors, discussed in the Statistical Support
Document (9), which is located in the Record for this rulemaking, represent the ratio of an
elevated value that would be expected to occur only rarely to the long-term mean. The purpose
of the variability factor is to allow for variations in effluent concentrations that comprise the long-
term mean. A facility that designs and operates its treatment system to achieve a long term mean
on a consistent basis should be able to comply with the daily and monthly limitations in the course
of normal operations.
The PSES are the same for Subcategories A and C, and then the same for Subcategories B and D.
The same is true for PSNS. The PSES and PSNS for Subcategories A and C are presented in
Table 17-5. The PSES and PSNS for Subcategories B and D are presented in Table 17-6. These
standards were determined by multiplying the long-term mean treatment performance
concentrations for the selected treatment technology bases by the respective 1-day and 4-day
variability factors (VFs).
17-15
The PSES/PSNS for diethylamine, methyl cellosolve, and triethylamine are based on the analytical
method minimum level. The minimum level for a pollutant is the level at which an analytical
system gives recognizable signals and an acceptable calibration point. For pollutants with a long-
term mean below the minimum level, typically in cases where treatment performance was
established through data transfer, the final long-term mean was set at a value no lower than the
minimum level for the pollutant. The final pretreatment standards are determined by applying 1-
day and 4-day variability factors to the final long-term means.
The PSES/PSNS cyanide effluent standard, established in the 1983 Final Rule to be a daily
maximum of 33.5 mg/L and a maximum monthly average of 9.4 mg/L for all subcategories, is not
being revised for Subcategories A and C. The cyanide limit is being withdrawn for Subcategories
B and D because EPA has determined that cyanide is neither used nor generated by facilities with
these subcategory operations.
The PSES/PSNS ammonia standard for Subcategory A and C operations that discharge to non-
nitrifying POTWs is being set equal to the corresponding BAT ammonia effluent limit. EPA has
decided to set the PSES/PSNS ammonia standard at a level higher than the standards based on
steam stripping treatment performance data in response to commenters who want to be able to
comply with the ammonia standards at indirect dischargers using biological treatment with
nitrification technology.
17.3 Implementation of the PSES and PSNS
The PSES and PSNS standards for Subcategory A and C and Subcategory B and D operations
are presented in Tables 17-5 and 17-6, respectively.
17.3.1 Establishing List of Pollutants for Compliance Monitoring
Permitting authorities should establish permit limitations and compliance monitoring requirements
for each regulated pollutant listed in Table 17-4, generated or used at a pharmaceutical
manufacturing facility. Limitations and routine compliance monitoring should not be required for
17-16
regulated pollutants not generated or used at a facility. A determination that regulated pollutants
are not generated or used should be based on a review of all raw materials used and an assessment
of all chemical processes used, considering resulting products and by-products. The
determination that a regulated pollutant is not generated or used would need to be confirmed by
annual chemical analyses of wastewater from each monitoring location. Such confirmation would
be provided by an analytical measurement of a non-detect value.
Facilities discharging more than one regulated organic pollutant may monitor for a single
surrogate pollutant to demonstrate an appropriate degree of control for a specified group of
pollutants. For the purpose of identifying surrogates, pollutants are grouped according to
treatability classes; Table 17-7 presents the treatability classes identified for steam stripping, which
is the PSES/PSNS technology basis for organic pollutant limitations. For treatability classes with
more than one possible surrogate pollutant, the analyte with the highest concentration or loadings
should be chosen as the surrogate pollutant. Plants may monitor for a surrogate pollutant(s) only
if they demonstrate that all other pollutants receive the same degree of treatment.
An individual plant may choose to demonstrate by selecting a monitoring pollutant for a given
treatability class and maintaining documentation, including flow information and sampling results,
that all pollutants in that treatability class receive equivalent treatment. The documentation is then
submitted to the permit authority for approval.
17.3.2 Point of Application
The PSES and PSNS standards for wastewaters from Subcategory A, B, C, and D operations are
applicable at an end-of-pipe discharge point for all pollutants (except cyanide), as denoted in
Tables 17-5 and 17-6. The end-of-pipe monitoring point should be placed prior to discharge to
the POTW sewer system. Cyanide should be monitored in-plant for Subcategory A and C
wastewaters unless a facility can show a measurable amount of cyanide at end-of-pipe, instead of
a non-detect in accordance with 40 CFR 403.6 (e)(2) and 403.6 (e)(4).
17-17
17.3.3 Permit Limitations
End-of-pipe permit limitations based on the PSES and PSNS limitations for ammonia (for
Subcategories A and C) and organic constituents will be mass-based. To determine PSES and
PSNS limits, permit writers should use a reasonable estimate of process wastewater discharge
flow and the concentration-based standards listed in Tables 17-5 and 17-6 to develop mass-based
permit limitations. Section 15.3.3 presents guidance regarding how a reasonable estimate of
process wastewater discharge flow would be established after final PSES and PSNS are adopted.
EPA expects that permit limitations for cyanide, based on the 1983 PSES limitations, at in-plant
locations will be concentration-based, and not converted to a mass basis. A concentration basis
should be used for cyanide because it offers a direct benchmark to assess whether the in-plant
control technology is achieving the intended PSES and PSNS levels. In-plant wastestreams that
require control may be generated or treated on a variable, batch basis. In such a setting, mass-
based permit limitations are difficult to establish accurately, and compliance is hindered because
the permitted facility cannot make a direct measurement to determine if its control technology is
performing at the required level. Concentration-based permit limitations eliminate these problems
and offer a direct measure of cyanide to both the permitting authority and the permitted facility
that PSES and PSNS performance levels are being achieved.
17.3.4 Monitoring and Compliance
The compliance monitoring frequency for ammonia and all other regulated organic constituents
should be performed on a frequency basis established by a permit writer or pretreatment authority.
EPA’s monitoring costs for this regulation assumed compliance monitoring for ammonia (for
Subcategory A and C facilities) and all regulated organic constituents on a weekly basis for
Subcategory A, B, C, and D facilities. The list of pollutants for which monitoring will need to be
performed includes all constituents from Subcategory A, B, C, and D operations listed in Table
17-4 generated or used in pharmaceutical manufacturing processes at the facility unless the facility
discharges ammonia to a POTW with nitrification capabilities in which case an ammonia no pass-
through determination may apply. Monitoring of regulated constituents generated or used in any
17-18
pharmaceutical manufacturing processes at the facility would occur at every process wastewater
end-of-pipe discharge point for compliance with PSES and PSNS effluent standards.
Compliance with mass-based permit limitations is determined by multiplying the measured
concentrations of a regulated pollutant in the effluent sample by a conversion factor and the total
wastewater flow at the monitoring point during the effluent sampling period. Thus, the mass
compliance value should be based on the total flow discharged on the day of sampling, not on the
long-term average flow rate that provided the basis for establishing the permit limitations.
Compliance monitoring for cyanide should occur in-plant, prior to commingling or dilution with
non-cyanide-bearing wastewater, unless a facility can show end-of-pipe monitoring for cyanide is
feasible. To show that end-of-pipe monitoring is feasible, the facility would need to demonstrate
compliance with cyanide limitations, adjusted as necessary to account for dilution with non-
cyanide-bearing wastewater, at a level above the detection limit for cyanide.
The list of pollutants for which monitoring would be required should be updated based on
consideration of raw material and process changes throughout the facility and an annual scan for
all regulated pollutants listed in Table 17-4. The annual scan should be performed at the
compliance monitoring point(s) to identify any regulated pollutants in the wastewater. Permit
monitoring and compliance should be required at all monitoring locations for all pollutants
detected at any locations.
Dischargers must use the test methods promulgated at 40 CFR Part 136.3 or incorporated by
reference in the tables of that Part, when available, to monitor pollutant discharges from the
pharmaceutical manufacturing industry, unless specified otherwise in Part 439 (See 40 CFR
401.13) or by the permitting authority.
As a part of the final rule, EPA promulgated additional test methods for the pollutants to be
regulated under Part 439 for which there are no test methods listed at 40 CFR Part 136.3. To
support the Part 439 regulations at the time of proposal, EPA published test methods developed
17-19
specifically for the pharmaceutical industry in a compendium entitled, “Analytical Methods for the
Determination of Pollutants in Pharmaceutical Manufacturing Industry Wastewater,” EPA-821-B-
94-001. These test methods were discussed in the proposed rule and have been revised in
response to public comment. The revised test methods are available for monitoring some
pollutants covered by the final rule. The revised test methods are available for monitoring some
pollutants covered by the final rule. The revised test methods have been published in a revised
compendium (the “Pharmaceutical Methods Compendium, Revision A”; EPA-821-B-98-016,
1998) with the same title as the proposed compendium.
In addition EPA is allowing use of applicable drinking water methods that have been promulgated
at 40 CFR Part 141 and use of ASTM Methods D3371, D3695, and D4763, for monitoring of the
pollutants included in this rulemaking. The final rule allows for use of these additional test
methods for several reasons: (1) it allows greater flexibility in monitoring, (2) it conforms use of
methods in EPA’s drinking water and wastewater programs, (3) it moves toward a performance-
based measurement system, and (4) it allows use of technical standards as contemplated by the
National Technology Transfer and Advancement Act of 1995 (NTTAA).
17-20
Table 17-1
Organic Pollutants Considered for Regulation That Pass Through POTWs
Passes Through Based Passes Through Based Passes Through Basedon Volatilization on Water Soluble on Evaluation of %
17-21
Phenol (b)
n-Propanol X
Pyridine X
Tetrahydrofuran X X X
Toluene X X X
Triethylamine X X X
Xylenes X X X
(a) Assumes a volatile override cutoff of Henry's Law Constant $ 1 x 10 atm/gmole/m .-5 3
(b) These pollutants are not treatable by the PSES/PSNS technology and are not regulated under PSES/PSNS in thefinal rule.NA - No POTW % removal available.
17-22
Table 17-2
EPA and PhRMA Sampling Results for Primary Treatmentat Barceloneta POTW
Data from Method 1671
Pollutant Loss Volatilization Loss Volatilization Loss(a) Volatilization (a)
(a) The ranges shown represent the average loss or volatilization amounts on Day 1 and 2, respectively.
Table 17-3
Water8 Modeling Results for Primary and Secondary Treatment at BRWTP
Pollutant % % % % % %
Percent Percent Percent Percent Percent Percent Volatilization in Biodegradation Volatilization in Biodegradation Overall Overall
Primary in Primary Secondary in Secondary Volatilization Biodegradation
Methanol 2.1 0.0 2.0 90.8 4.0 90.5
Ethanol 2.2 0.0 0.5 97.7 2.7 92.9
Isopropanol 4.2 0.0 10.8 74.0 14.3 77.0
Acetone 8.0 0.0 3.2 94.9 10.7 84.8
Chloroform 40.9 0.0 58.7 40.5 71.2 23.9
Methylene 38.9 0.0 70.4 28.6 78.2 17.8Chloride
Toluene 46.1 0.0 36.9 62.7 60.4 32.4
Note: Volatilization and biodegradation percentages may not add up to 100% since some of the compound remains in the effluentand some goes out with the sludge.
17-23
Table 17-4
Pollutants to be Regulated Under PSES and PSNS
Pollutant Subcategories A and C Subcategories B and D
Priority Pollutants
Cyanide (a) X
Benzene X
Chlorobenzene X
Chloroform X
o-Dichlorobenzene (1,2- XDichlorobenzene)
1,2-Dichloroethane X
Methylene Chloride X X
Toluene X
Non-Conventional Pollutants
Acetone X X
Ammonia as N (b) X
n-Amyl Acetane X X
n-Butyl Acetate X
Diethylamine X
Ethyl Acetate X X
n-Heptane X
n-Hexane X
Isobutraldehyde X
Isopropyl Acetate X X
Isopropyl Ether X
Methyl Cellosolve XMethyl Formate
Methyl isobutyl ketone (MIBK) X
Tetrahydrofuran X
Thethylamine X
Xylenes X(a) EPA is only clarifying the monitoring point on the existing regulation.(b) Ammonia is only regulated for indirect dischargers that discharge to non-nitrifying POTWs.
17-24
Table 17-5
PSES and PSNS Effluent Limitations for Subcategory A and C Operations
Pollutant or Pollutant Property mg/L mg/L
PSES/PSNS for In-Plant Monitoring Points
Maximum for any 1 day Monthly Average
Cyanide (1) 33.5 9.4
(1) Cyanide effluent limit established in the 1983 final rule, applies to Subcategory A and C operations only.
(2) Ammonia is only regulated for indirect dischargers that discharge to non-nitrifying POTWs.
17-25
Table 17-6
PSES and PSNS Effluent Limitations for Subcategory B and D Operations
Pollutant or Pollutant PropertyPSES Effluent Limitations End-of-Pipe Monitoring Point
Maximum for any 1 day mg/L Monthly Average mg/L
Acetone 20.7 8.2
n-Amyl Acetate 20.7 8.2
Ethyl Acetate 20.7 8.2
Isopropyl Acetate 20.7 8.2
Methylene Chloride 3.0 0.7
17-26
Table 17-7
Steam Stripping Surrogates for Indirect Dischargers
Strippability Group Compound Surrogate (Yes/No)
High Methylene Chloride Yes
Toluene Yes
Chloroform Yes
Methyl Cellosolve No
Xylenes No
n-Heptane No
n-Hexane No
Chlorobenzene No
Benzene No
Medium Acetone Yes
Ammonia as N Yes
Ethyl acetate Yes
Tetrahydrofuran Yes
Triethyamine No
MIBK No
Isopropyl acetate No
Diethylamine No
1,2-Dichloroethane No
n-Amyl acetate No
Isopropyl ether No
n-Butyl acetate No
Methyl formate No
Isobutraldehyde No
o-Dichlorobenzene NoYes-Surrogate pollutant for that strippability group.No-Not a surrogate pollutant.
17-27
REFERENCES
1. Memorandum: WATER7 Analysis of the Fate of Organic Pollutant LoadsThrough Pharmaceutical Facilities; from Mary Willett and Colleen Kane, RadianCorporation, to Pharmaceutical Proposed Administrative Record, May 18, 1994.
3. USEPA, Office of Water Regulations and Standards, February 1986, Report toCongress on the Discharge of Hazardous Wastes to Publicly Owned TreatmentWorks. (Referred to as the Domestic Sewage Study "DSS") Appendix O-MedianPercent Removal from Acclimated Systems.
4. USEPA, Effluent Guidelines Division, September 1982, "Fate of PriorityPollutants in Publicly Owned Treatment Works-Final Report."
5. Memorandum: Summary of POTW Survey Responses; from Kirsten Mahsman,Radian Corporation, to Frank Hund and Ed Terry, USEPA/EAD, November 15,1993.
6. “WATER8 Modeling Analyses of BRWTP Sampling Data,” July 1997.
7. "Emissions of High-Solubility VOCs from Municipal Sewers,” Richard L. Corgi,Ph.D., January 1996.
8. USEPA, Engineering and Analysis Division, July 1998, “Final POTW Pass-Through Analysis for the Pharmaceutical Manufacturing Industry.”
9. USEPA, Office of Water. Statistical Support Document for the EffluentLimitations Guidelines for the Pharmaceutical Manufacturing Industry. EPA-821-B-98-007. U.S. Environmental Protection Agency, Washington, D.C., 1988.