Development of a 103-Year Development of a 103-Year High-Resolution Climate High-Resolution Climate Data Set for the Data Set for the Conterminous United States Conterminous United States Wayne Gibson Wayne Gibson 1 , Christopher Daly , Christopher Daly 1 , Tim , Tim Kittel Kittel 2 , Doug Nychka , Doug Nychka 2 , Craig Johns , Craig Johns 2 , Nan , Nan Rosenbloom Rosenbloom 2 , Alan McNab , Alan McNab 3 , and George , and George Taylor Taylor 1 1 Spatial Climate Analysis Service, Oregon State University, Corvallis, OR 97331, USA 2 National Center for Atmospheric Research, Boulder, CO 80307, USA 3 National Climatic Data Center, Asheville, NC 29901, USA
Transcript
Development of a 103-Year High-Development of a 103-Year High-Resolution Climate Data Set for Resolution Climate Data Set for the Conterminous United Statesthe Conterminous United States
Wayne GibsonWayne Gibson11, Christopher Daly, Christopher Daly11, Tim Kittel, Tim Kittel22, , Doug NychkaDoug Nychka22, Craig Johns, Craig Johns22, Nan Rosenbloom, Nan Rosenbloom22, ,
Alan McNabAlan McNab33, and George Taylor, and George Taylor11
1 Spatial Climate Analysis Service, Oregon State University, Corvallis, OR 97331, USA
2 National Center for Atmospheric Research, Boulder, CO 80307, USA
3 National Climatic Data Center, Asheville, NC 29901, USA
IntroductionIntroductionWhy is the data set so useful?Why is the data set so useful?• uniqueunique• complete in space and time for long time period (US, 103 years)complete in space and time for long time period (US, 103 years)• high resolution (4km)high resolution (4km)• spatial QC of the station data prior to modelingspatial QC of the station data prior to modeling• many applications need this type of datamany applications need this type of data
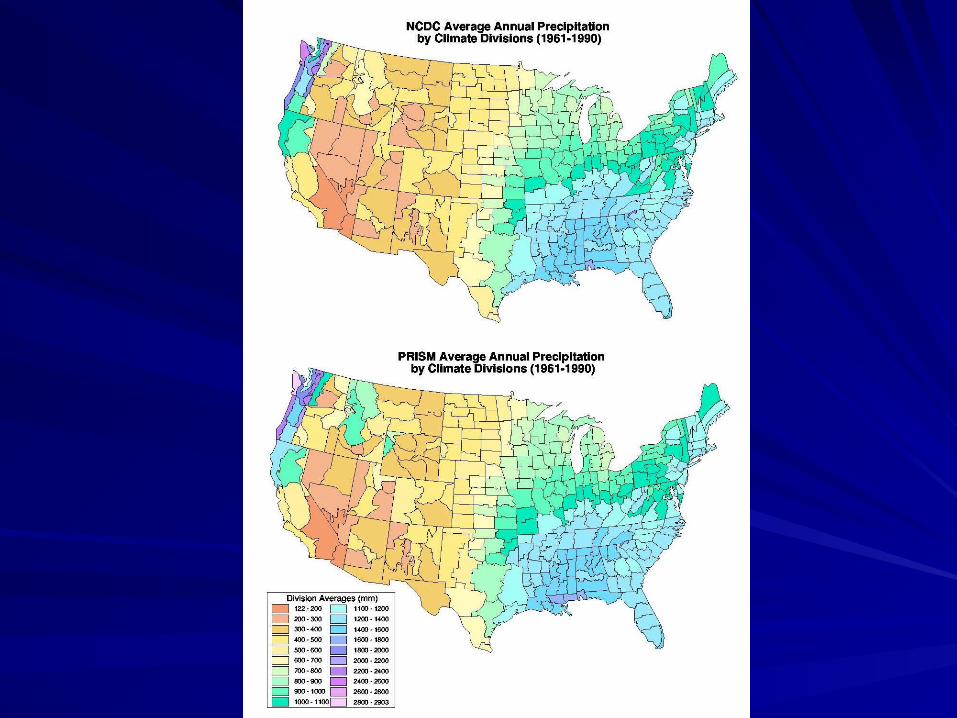
Methodology used to create gridsMethodology used to create grids• Statistical infilling of incomplete station data (NCAR)Statistical infilling of incomplete station data (NCAR)• PRISM model used to spatially map the station dataPRISM model used to spatially map the station data
PRISM productsPRISM products- Official USDA 1961-1990 normals for the USOfficial USDA 1961-1990 normals for the US- New NCDC Climate Atlas of the US (48 parameters)New NCDC Climate Atlas of the US (48 parameters)- Canada, China, European Alps, Pacific Islands, Puerto RicoCanada, China, European Alps, Pacific Islands, Puerto Rico
Project OverviewProject OverviewMain objectiveMain objective• To create serially complete, high quality, topographically To create serially complete, high quality, topographically
sensitive, high resolution grids for the conterminous United sensitive, high resolution grids for the conterminous United States (ppt, Tmin, and Tmax)States (ppt, Tmin, and Tmax)
• To create a serially complete infilled station data setTo create a serially complete infilled station data set
ProgressionProgression• Year 1: Year 1: Preliminary precipitation grids created for 1948-1993Preliminary precipitation grids created for 1948-1993
• Year 2: Year 2: Development of a semi-automated Quality Control (QC) Development of a semi-automated Quality Control (QC) system (ASSAY QC, based on PRISM)system (ASSAY QC, based on PRISM)
• Year 3: Year 3: Development of a more robust methodology for station Development of a more robust methodology for station data infilling (National Center for Atmospheric Research)data infilling (National Center for Atmospheric Research)
• Year 4: Year 4: Creation of final grids for the time period 1895-1997Creation of final grids for the time period 1895-1997
Collection of Station DataCollection of Station DataHCNHCN: Historical Climate Network (1895-1997): Historical Climate Network (1895-1997)
COOPCOOP: National Weather Service Cooperative Network : National Weather Service Cooperative Network (1895-1997)(1895-1997)
MCCMCC: COOP data from the Midwestern Climate Center : COOP data from the Midwestern Climate Center (1895-1947)(1895-1947)
SNOTELSNOTEL: SNOwpack TELemetry Network, National : SNOwpack TELemetry Network, National Resource Conservation Service (1978-1997)Resource Conservation Service (1978-1997)
AGAG: Agricultural climate data (1961-1993): Agricultural climate data (1961-1993)
MISCMISC: Miscellaneous data (storage gauges, snow : Miscellaneous data (storage gauges, snow course)course)
Inconsistencies between Station Data NetworksInconsistencies between Station Data Networks
Observation Networks over TimeObservation Networks over Time
Observing Networks Over Time
0
1000
2000
3000
4000
5000
6000
7000
8000
9000
10000
1880 1900 1920 1940 1960 1980 2000 2020
Date
Ob
serv
atio
ns
COOP
HCN
MCC
SNOTEL
Observation Networks vs ElevationObservation Networks vs Elevation
317 291 294
1463
0
200
400
600
800
1000
1200
1400
1600
Ele
vati
on
(m
)
COOP HCN MCC SNOTEL
Median Elevation of Observing Networks
Data QC: Station Metadata ChecksData QC: Station Metadata Checks
ElevationElevation• Using Geographical Information Systems Using Geographical Information Systems
(GIS) (GIS)
Latitude, longitude, and elevation: Latitude, longitude, and elevation: • Analyzed each stations metadata for changesAnalyzed each stations metadata for changes
Total of 100 metadata errorsTotal of 100 metadata errors• Horizontal position errors <= 2 degreesHorizontal position errors <= 2 degrees• Elevation errors <= 1200 mElevation errors <= 1200 m
Data QC: PRISM based QC system – ASSAY QCData QC: PRISM based QC system – ASSAY QC
What is Bad DataWhat is Bad Data• Data having transcription errorsData having transcription errors
• We are not attempting to identify errors such as gauge under catch, observation methods, or We are not attempting to identify errors such as gauge under catch, observation methods, or instrumentation changes.instrumentation changes.
ASSAY QC – automated methodASSAY QC – automated method• Jackknifed predictionJackknifed prediction• Compare predicted to observed valueCompare predicted to observed value• Tag large differences as “candidate” outliers. Tag large differences as “candidate” outliers. • Process of evaluating detection of outliers with actual station data (monthly and daily Process of evaluating detection of outliers with actual station data (monthly and daily
observations)observations)
Post ProcessingPost Processing• Additional Check to “Candidates” Applied Based on Closest/Highest Weighted Station:Additional Check to “Candidates” Applied Based on Closest/Highest Weighted Station:
- DistanceDistance- ElevationElevation- Precipitation AmountPrecipitation Amount- Large Outliers in the ObservationsLarge Outliers in the Observations
• Manual ChecksManual Checks
List of “Bad” Observation. Mark as Missing.List of “Bad” Observation. Mark as Missing.
2371 monthly data errors out of 6,345,675 2371 monthly data errors out of 6,345,675 station-months for a detection rate of station-months for a detection rate of 0.0374%0.0374%
This are about 2 errors per monthly grid, This are about 2 errors per monthly grid, not insignificantnot insignificant
Also keep in mind that there is a Also keep in mind that there is a propagation of errors in space. (50km propagation of errors in space. (50km radius or greater)radius or greater)
Example OutlierExample Outlier
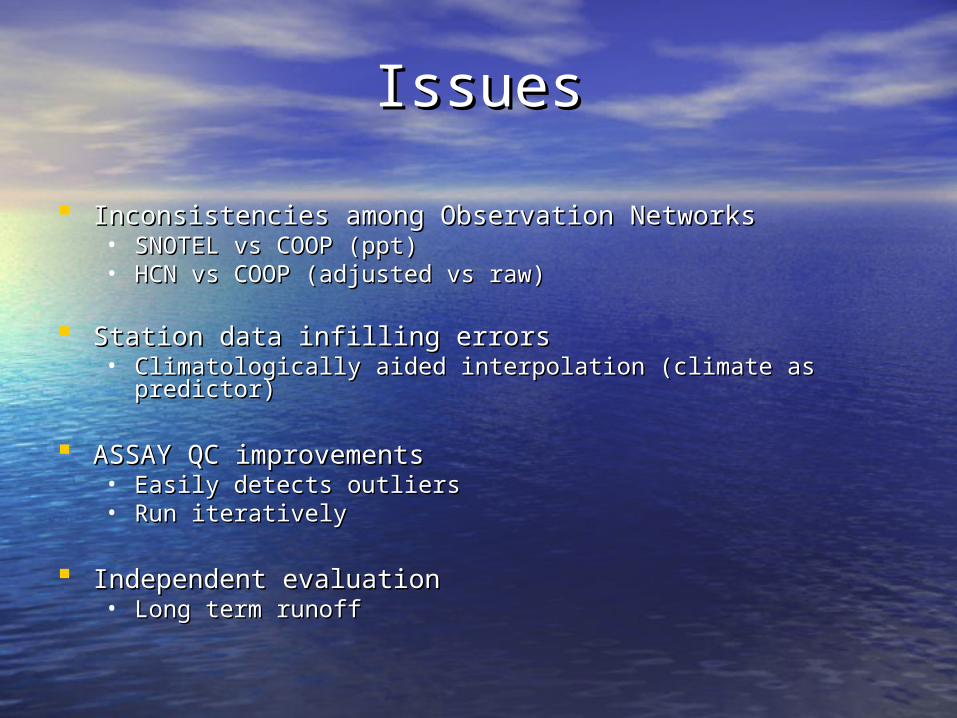
IssuesIssues
Inconsistencies among Observation NetworksInconsistencies among Observation Networks• SNOTEL vs COOP (ppt)SNOTEL vs COOP (ppt)• HCN vs COOP (adjusted vs raw)HCN vs COOP (adjusted vs raw)
Station data infilling errorsStation data infilling errors• Climatologically aided interpolation (climate as predictor)Climatologically aided interpolation (climate as predictor)