Page 1
i
Development of a framework for a successful outsourcing process.
What are the criteria for successful outsourcing?
By
SAMANTHA ZAMBEZI
28230362
Submitted in partial fulfillment of the requirements for the degree of
BACHELORS OF INDUSTRIAL ENGINEERING
In the
FALCULTY OF ENGINEERING, BUILT ENVIRONMENT AND INFORMATION
TECHNOLOGY
October 2011
Page 2
i
ABSTRACT
This paper’s purpose is to provide a guideline into making the right outsourcing decisions. As
markets become more competitive and the need for differentiation becomes critical to remain
competitive in today’s markets, outsourcing has emerged as tool to achieve this. Focus on core
competencies and access to expertise is just some of the benefits of outsourcing. The main
objective of this project is to develop a framework that will serve as a guideline to managers in
making the correct outsourcing decisions. The research achieves this by exploring those
activities critical to the success of an outsourcing project. This is achieved through a
comprehensive literature study around the four phases of outsourcing; the decision making
phase, selection and negotiation phase, the transition phase and the management phase. The
project further investigates how well these activities are implemented in South African
industries. 123 questionnaires were distributed to different industries in South Africa and
industry professionals were requested to confirm activities that were performed during the
outsourcing process. The questionnaires required the company to rank on a Likert scale the
extent to which outsourcing affected certain performance areas. Cost being the primary driver of
most outsourcing decisions, to further investigate the outcomes of outsourcing the project
explores the effect outsourcing has on the financial performance of different industries in
different geographical locations. It was found that most companies who outsource do
experience an improvement in profitability and return of assets. However, this improvement in
performance is not statistically significant. The project further investigates if this improvement is
related to the value of the outsourcing contract. Findings concluded that; there is a positive
significant relationship between the growth rate of the financial indicators and the size of the
outsourcing deal. The research revealed that there are a great number of firms in South Africa
that do not apply a structured outsourcing process. The managers of these companies believe
that to have to pay someone full time to manage the process and have endless meetings and
investigations on the reasons for outsourcing are counterproductive and reduce the potential
gains. However, commitment to the outsourcing relationship and a through transition phase
proved to be positively associated with improvement in quality. The findings from the literature
and from the study were used to develop an outsourcing framework and scorecard.
Page 3
iv
TABLE OF CONTENTS
1. INTRODUCTION AND STATEMENT OF THE PROBLEM ..................................................................... 1
1.1 INTROUCTION AND BACKGROUND .................................................................................................. 1
1.2 PROBLEM STATEMENT ..................................................................................................................... 1
1.3 AIMS AND OBJECTIVES OF THE PROJECT ......................................................................................... 1
1.4 PROJECT SCOPE ................................................................................................................................ 2
1.5 METHODOLOGY ................................................................................................................................ 3
1.6 CONCLUSION .................................................................................................................................... 4
2. LITERATURE REVIEW .................................................................................................................... 4
2.1 INTODUCTION................................................................................................................................... 4
2.2 DEFINITION AND BACKGROUND OF OUTSOURCING ....................................................................... 6
2.3 THE KEY DRIVERS OF OUTSOURCING ............................................................................................... 7
2.4 THE OUTSOURCING LIFE-CYCLE ........................................................................................................ 9
2.4.1 THE DECISION MAKING PHASE .................................................................................................... 10
2.4.2 VENDOR SELECTION AND CONTRACTING ................................................................................... 15
2.4.3 TRANSITION TO OUTSOURCING .................................................................................................. 18
2.4.4 MANAGING THE OUTSOURING PROJECT .................................................................................... 22
2.5 PROBLEMS WITH THE OUTSOURCING PROCESS ............................................................................ 26
2.6 BACKGROUND AND DEVELOPMENT OF THE OUTSOURCING FRAMEWORK ................................. 27
2.7 OUTSOURCING DECISION MAKING TOOLS..................................................................................... 28
2.8 THE EFFECTS OF OUTSOURCING .................................................................................................... 29
2.8.1 OUTSOURCING AND FIRM PERFORMANCE ................................................................................. 29
2.8.2 MEASURING THE EFFECTS OF OUTSOURCING ............................................................................ 30
2.9 REVIEW OF AVAILABLE STATISTICAL TEST ...................................................................................... 32
2.10SUMMARY ..................................................................................................................................... 37
3. DEVELOPMENT OF HYPOTHESES ................................................................................................. 38
3.1 Introduction .................................................................................................................................... 38
3.2 Key drivers of outsourcing .............................................................................................................. 38
3.3 OUTSOURCING AND FIRM PERFORMANCE .................................................................................... 38
3.3.1 EFFECTS OF OUTSOURCING: A QUANTITATIVE ANALYSIS ........................................................... 38
Page 4
iv
3.3.2 EFFECT OF OUTSOURCING A QUALITATIVE ANALYSIS ................................................................ 39
4. Methodology ............................................................................................................................. 39
4.1 KEY DRIVERS OF OUTSOURCING .................................................................................................... 39
4.2 MEASURING THE EFFECTS OF OUTSOURCING ............................................................................... 39
4.2.1 EFFECTS OF OUTSOURCING: A QUANTITATIVE ANALYSIS ........................................................... 40
4.2.2.EFFECT OF OUTSOURCING A QUALITATIVE ANALYSIS ................................................................ 42
5. DATA ANALYSIS AND RESULTS .................................................................................................... 43
5.1 TESTING OF FIRST HYPOTHESIS ...................................................................................................... 44
5.2 TESTING OF SECOND HYPOTHESIS ................................................................................................. 45
5.3 TESTING OF THIRD HYPOTHESIS ..................................................................................................... 47
5.3 TESTING OF FOURTH HYPOTHESIS ................................................................................................. 54
5.5 DATA VALIDITY ............................................................................................................................... 60
5.6 RELIABILITY OF RESULTS ................................................................................................................. 61
5.7 LIMITATIONS OF STUDY .................................................................................................................. 61
6. DISCUSSION OF RESULTS ............................................................................................................ 61
6.1 SUMMARY OF FINDINGS ................................................................................................................ 61
6.2 THE REVISED SCORECARD .............................................................................................................. 63
6.3 THE OUTSOURCING FRAMEWORK ................................................................................................. 63
6.4 CONCLUSION .................................................................................................................................. 64
6.5 MEETING RESEARCH OBJECTIVES ................................................................................................... 65
6.6 RECOMMENDATIONS FOR FUTURE RESEARCH .............................................................................. 65
7. BIBLOGRAPHY ............................................................................................................................ 66
8. APPENDICES .............................................................................................................................. 55
APPENDIX A: AN EXAMPLE OF A DECISION MAKING SCORECARD ....................................................... 71
APPENDIX B: QUESTIONNAIRE ............................................................................................................. 72
APPENDIX C: SUMMARY DATA OF OUTSOURCING DEALS ................................................................... 78
APPENDIX D: REVISED SCORECARD ...................................................................................................... 79
APPENDIX E: PRELIMINARY OUTSOURCING FRAMEWORK .................................................................. 81
Page 5
iv
LIST OF FIGURES
Figure 1.1: Scope of the project
Figure 2.1: Literature study breakdown structure
Figure 2.2: A review of outsourcing life-cycle models
Figure 2.3: A modified decision making phase flow diagram
Figure 2.4: A proposed outsourcing team structure
Figure 2.5: Transition from business strategy to sourcing strategy
Figure 2.6: The sourcing strategies matrix by Mclvor (2000)
Figure 2.7: the major steps involved in moving from business strategy to partner strategy.
Figure 2.9: an example of the transition methodology followed by the Charter Group
Figure 2:10: An example of a transition methodology
Figure 2.11 an example of a risk management mode
Figure 2.12: Performance management framework
Figure 5.1: Bar chart illustrating key outsourcing drivers for the companies in the sample
Figure 5.2: Bar chart showing the percentage of companies that experienced an increase in
performance after outsourcing
Page 6
1
1 INTRODUCTION AND STATEMENT OF THE PROBLEM
1.1 INTRODUCTION AND BACKGROUND
Many companies fail to experience the benefits anticipated from their outsourcing initiatives.
This is because many decisions are made with limited insight and information. The decision
to outsource is based on the choice of which parts of the business will save more on cost,
rather than how the decision affects the long-term capabilities of the organization. “To
survive economically today, organizations must transform themselves and their markets in
an ever more daunting challenge to redefine the business world before it redefines them”.
(Brown & Wilson, 2005). There is a need for companies to take on a more modern approach
to outsourcing.
IMPERIAL Logistics is a third party logistics service provider. IMPERIAL wants to educate its
customers on the modern approach to outsourcing. Customers still adopt the old philosophy
of using cost as the main driver of outsourcing decisions. Customers should use outsourcing
as a strategic tool to achieve competitive advantage. Customers must realize that the real
power of outsourcing lies in the innovations that outside specialist bring to their business.
“No longer should outsourcing service providers be viewed as tools for becoming more
efficient but as powerful forces of change” (Brown and Wilson, 2005).
1.2 PROBLEM STATEMENT
The customers of IMPERIAL Logistics need to take on a modern approach to outsourcing in
order to realize its true benefits and gain competitive advantage on core functions. Many
companies adopt a short-term perspective, being motivated primarily by the search for direct
cost reductions. Typically managers seem to believe that no strategic planning is required.
This leads to them learning from mistakes that could have been avoided. Guidelines are
therefore needed to help management make the correct outsourcing decisions so that the
true benefits can be realized.
1.3 AIMS AND OBJECTIVES OF THE PROJECT
The study aims to investigate those management practices during the outsourcing process
that are key drivers of outsourcing performance. The project aims to explore the outsourcing
process in order to determine what drives the success of an outsourcing project from both a
Page 7
2
theoretical and practical perspective. The project also aims to investigate to what extent
outsourcing improves performance. The main objectives of this project are to:
Perform a literature survey around critical success factors for the outsourcing
process and outsourcing framework.
To identify criteria from the research, this will form the basis for the development of a
scorecard that can be used by companies to evaluate the effectiveness of their
outsourcing process.
To link different management practices during the outsourcing process to the
benefits of outsourcing thereby distinguishing between successful and unsuccessful
outsourcing practices.
To investigate the need for an outsourcing framework to guide managers into making
the right outsourcing decisions and to investigate key reasons why managers
outsource.
To investigate the extent to which outsourcing improves firm performance.
1.4 PROJECT SCOPE
The project aims to investigate what activities are critical to the success of an outsourcing
project. In order to achieve this, the entire outsourcing process must be analyzed. The
project will focus on the four phases of outsourcing as identified by Griessel (1998:25).
Within these four phases the project will explore the activities critical to the success of an
outsourcing project. The phases are depicted in the Figure 1.1. The figure illustrates all
subjects of discussion necessary to achieve the project aims mentioned above. The
investigation is not limited to the South African industry. It will also examine how outsourcing
affects performance of companies representing different industries and geographic
locations.
The final and main deliverable is a framework that will guide managers into making the
correct outsourcing decisions so that the true benefits of outsourcing can be realized. To
develop this framework it is necessary to develop hypotheses in order to prove the
legitimacy of the framework. The framework will be developed from theories and relevant
literature. It is therefore necessary to prove if the literature and real life practices and
outcomes are in agreement.
Page 8
3
Figure 1.1: Scope of project
1.5 METHODOLOGY
From a theoretical perspective outsourcing projects fails due to poor decision making. The
study assumes that management practices and decisions made during the outsourcing
process influence the success of the outsourcing project and firm performance. To
investigate the assumption questionnaires were distributed to different industries in South
Africa. The different companies were requested to illustrate the extent to which outsourcing
activities are conducted. This was accomplished using a self-assessment/evaluation
scorecard (Appendix B).
A further investigation to determine the extent to which outsourcing improves firm financial
performance was carried out. The purpose of this investigation was to answer the underlying
question that most of IMPERIAL logistics client’s need addressed “Does outsourcing
improve financial performance?” This investigation will further support the theory that
outsourcing is a strategic tool for improving business performance. The population under
study is firms from a wide range of industries; banking, packaging, manufacturing, mining,
aerospace etc in different geographical locations. Data was collected using publicly
available balance sheets and income statements. The methodology is further discussed in
chapter four.
Page 9
4
1.6 CONCLUSION
The chapter describes the research objects to be achieved. The chapter identifies the need
for research hypothesis to further support the literature and provide a strong argument and
reasoning for the outsourcing framework to be developed. The hypotheses are developed
and discussed in chapter three. The chapter introduced the research methodology that is
further discussed in chapter four. The next chapter investigates the activities critical to the
outsourcing process as well as the key drivers.
2 LITERATURE REVIEW
2.1 INTRODUCTION
One of the primary aims of the project is to establish management activities and key factors
that add to or affect the outcomes of an outsourcing project. This is achieved through a
systematic analysis of the four phases of the outsourcing process. The following chapter
gives a clear understanding of the theory behind the outsourcing process. A clear and
comprehensive understating of the entire process is necessary to develop a successful
framework. Outsourcing is a popular research area. This means that there are many
opinions on the subject. This implies that care must be taken before referencing a source.
This was achieved by including perspectives and information in which there was clear
consensus between authors. The literature also explores the effects of sourcing on firm
performance. To identify the effects outsourcing has on firm performance is another
objective of the study. Different financial and non-financial indicators are reviewed. The
literature also investigates statistical tests available to assist in the selection of the most
appropriate test. Being an exploratory project a statistical test is to be used to test the
hypotheses developed in chapter 4. Figure 2.1 illustrates the literature breakdown. The
purpose of the figure is to map all the areas that are to be discussed in this chapter and to
clarify the organization of work.
Page 10
5
2.2 Background
and definition of
outsourcing
2.8 The effects of
outsourcing
2.8.2 Measuring
the effects of
outsourcing
2.4 The
outsourcing life
cycle
2.5 Problems with
the outsourcing
process
2.6 The
outsourcing
framework
2.6.1
Requirements for
the outsourcing
framework
2.4.1 Decision
making phase
2.4.2 Selection
and negotiation
phase
2.3 Key drivers of
Outsourcing
2.4.3 Transition
phase
2.4.4 Management
phase
2.7 Decision
making tool
2. Literature
Review
2.7.2 The
scorecard
2.7.1The decision
making matrix
2.9 A review of
available statistical
test
2.8.1 Outsourcing
and Firm
performance
Figure 2.1: Literature study breakdown structure
Page 11
6
2.2 DEFINITION AND BACKGROUND OF OUTSOURCING
Definition
Rob Hanfield, (2006) of N.C State University defined outsourcing as “The strategic use
of outside resources to perform activities traditionally handled by internal staff and
resources”. According to Bilderbeek, (2011) outsourcing is “the management of day to
day execution of an entire business function by a third party service provider”. Some
authors will argue that the function needs not to have been performed in-house (Bucji,
2001) and some will insist that not the entire business function needs to be out sourced
(Structural Cybernetics, 1996;). The different kinds (BPO, IT outsourcing etc) and levels
(tactic, strategic and transformational) of outsourcing contribute to the endless debates
of what constitutes its definition.
Background and evolution
Outsourcing is not a new concept. It is one of the oldest business ideas (Burhholder,
2005). It originated as a practice in the 1950s, but it wasn’t till the 1980s it became a
strategy adopted by organizations (Hatonen and Eriksson., 2009). Outsourcing in this
context consisted of products or components. Today, many changes have taken place in
the outsourcing industry, most of which have been evolutionary (Casale, 2011). The
strong emphasis on providing efficient customer service, the strategic value of focusing
on core businesses and re-engineering have resulted in this evolution (Hill, 1994; Leib,
1992). Table 2.1 depicts the difference between traditional and transformational
practices of outsourcing.
Page 12
7
Table 2.1: Transformational vs. Traditional Outsourcing Transformational Outsourcing Traditional Outsourcing
Business focused Operational focused
Centered on creating value Centered on cutting cost
Assists in managing uncertainty Assists in establishing controls
Aligns with business processes that
revolutionize in harmonization with
strategic goals
Aligns with unchanged business processes
Based on fashioning a network of
partnerships in the new connected global
economy
Based on external (primarily IT) specialist
realizing higher performance for the client than
internal non-specialist resources
Business cost and re-engineering
facilitate perpetual value creation
Removes non-core functions from the
business to provide a one-time discharge on
capital
Source: Adapted from “The black book of outsourcing” by Douglas Brown and Scott Wilson
2.3 THE KEY DRIVERS OF OUTSOURCING
Table 2.2 gives an overview of the key drivers of the outsourcing decision established by
four previous studies (The outsourcing institute, 1998; Richard Gamble, 2003; Gewald and
Dibben, 2009; Andrew Hewat, 2011). The authors of previously cited studies established a
ranking of their own according to the results obtained from the companies surveyed. In this
study an overall ranking of the findings was established. Double ranking was used. In each
study; ten points were awarded to the top reason for outsourcing identified, 8 points were
awarded to the second reason, 6 to the third, 5 to the fourth, 4 to the fifth and 2 to the sixth.
The maximum score in Table 2.2 should be 40; in this case all studies would have identified
the same reason to be the top driver of outsourcing. From the table, it is clear that cost
reduction (34), access to world class capabilities (30) and focus on core competencies (24)
are the top three reasons for outsourcing.
Page 13
8
Table 2.2: Reasons for outsourcing – summary of previous surveys
Type of reason The outsourcing institute,
1998: all industries
Andrew Hewat lodestar,
2011:wide range of
industries
Richard Gamble, 2003:
All industries
Gewald and Dibben,
2009: wide range of
industries
Score
Cost related 3. Cost related 2. Predictable cost 1. Reduce cost 1.Cost advantage 34
Access to world
class capabilities
2. Access to world class
capabilities
1. Having access to skilled
work force
3. Gain access to world
class resources
3. Access to specialized
resources
30
Core business
focus related
6. Improve Companies
focus
3. Focus on core business 2. Improve core focus 2. Focus on core
competencies
24
Re-engineering 1. Acceleration of re-
engineering benefits
10
Resource related 4. Free up resources for
other purposes
4. Free up resources 10
Service/quality
related
4. Quality improvement 5
Asset utilization
and efficiency
related
5. Resources not
available internally
4
Problem related 5. Function to difficult to
manage or out of control
4
Page 14
9
2.4 OUTSOURCING LIFE-CYCLE
In order to build a comprehensive model and identify the activities critical to the success of
an outsourcing project, it is necessary to understand the process of outsourcing itself. The
process of outsourcing has a clear evolutionary path and a specific process (Everett and
Dixson, 2006). Many books and articles have been published on the subject of outsourcing.
However, only a few frameworks that describe the overall stages and layout of the
outsourcing process exist. Figure 2.2 is an overview of some of the models available.
Decision making
phase/Strategy
Vendor selection
and negotiationTransition Management
Brown and
Wilson(2005) Make the
decision to
outsource
Define the scope
Negotiate
agreement
Sign contract
Plan the
transition
Budget and
forecast cost
Administrate
Cost/Budget
Manage
partnership
Integrate delivers
Monitor
performance
Click and
Duening (2005) Developing
outsourcing team
Analyzing the
outsourcing
opportunity
Select correct
vendor
Developing
contract
Transition to
outsourcing Operate
Ronan Mclvor
(2005)
Analyze
capabilities
Analyze value
chain
Develop
sourcing
strategies
Analyze
relationship
Select vendor
Design and sign
contract
Transition
Establish
relationship
Manage and
evaluate
relationship
Lever (1997)
and Zhu et al
(2001)
Planning and
discovery
Benchmarking
internal service
levels
Assessing
business impact
Developing and
negotiating
vendor contract
Short listing
vendors
Developing
outsourcing time-
line
Developing
communication
plan
Preparation for
the transfer of
resources
Creation of
transition plan
and checklist
Monitoring of
performance
Post-outsourcing
review
Cullen and
Willcocks
(2003)
Investigate
opportunities
Target the
functions
Strategize
Select and
negotiate with
vendor
Make the
transition
Manage the
project
Source
Figure 2.2: A review of outsourcing life-cycle models
Page 15
10
After examining the different models the activities were grouped into the four phases of
outsourcing as identified by Griessel (1998:25); decision making phase, Selection and
negotiation phase, transition phase and management phase (see Figure 2.2). Within each
phase are key deliverables and tasks critical to the success of an outsourcing project.
Understanding of each of the phases and associated task will assist companies conducting
outsourcing projects. An analysis of the outsourcing process will be conducted with the help
of the outsourcing process frameworks mentioned in Figure 2.2.
2.4.1 THE DECISION TO OUTSOURCE
One of the problems with outsourcing is that it has become very fashionable
(Faulhaber,2007; Skidmore, 2003). Most authors would agree that despite this popularity
outsourcing is not necessarily right for every company nor is it for every process/function
in a given company (Maynard,1999; Duening and Click,2005; Burkholder, 2006;
AuBchon; Antonucci,1998; Lankford, 1999; Corbett,2004). However, the need to
outsource due to the realization of greater business benefits (improve financial,
operational, and management performance) has never been greater (Patel and Anon,
2005). Historically, the primary reason for outsourcing has been to reduce operating cost
and this remains a primary factor (Gartner, 2007; Fafadia, 2010; Simmons, 2010).
Today, leading firms have adopted more sophisticated outsourcing strategies and have
been outsourcing core processes such as design, engineering, manufacturing and
marketing. “These organizations have benefited greatly from accessing the specialist
capabilities of suppliers in a range of business processes” (Mclvor, 2000). Outsourcing
has become a key element of business performance transformation, which concentrates
resources on core competencies and aligns all resource decisions with key business
strategy.
With the many advantages of outsourcing it is not difficult for organizations to justify a
decision to at least investigate outsourcing opportunities. The most effective way to
analyze an outsourcing opportunity is through a systematic process (Duening and Click,
2005). Figure 2.3 is a summary of the outsourcing decision phase. The figure was
designed using three sources that outlined key activities of the decision phase (Patel,
2005; Duening and Click 2005, Brown and Wilson, 2005). This process has been
designed to integrate and align the decision-making process with long term
organizational strategic objectives and near term organizational needs. If handled
Page 16
11
systematically, the analysis and selection process can be an effective way for an
organization to examine itself.
Establish
Project team
Define
Business
Objectives
Develop
Outsourcing
strategy
Internal
Analysis
Evaluate core
competencies
Risk-Benefit
analysis
Figure 2.3: A modified decision making phase flow diagram
SELECTION OF PROJECT TEAM
The outsourcing project requires an interdisciplinary approach due to its very nature.
Interdisciplinary skills are needed to manage an outsourcing project effectively (Taplin,
2007). Effective management of outsourcing requires a team structure. Figure 2.4 is a
recommended outsourcing team structure (Click and Duening, 2005). This structure
begins with an executive level steering team that is responsible for initiating the
outsourcing project, communicating its links to the corporate strategy and seeing the
project goals are being met. It is important for management to set the overall direction
for making outsourcing decisions which must be in the context of the organizations’
strategic goals.
Steering team
Vendor selection
team
Analysis teamManagement team
Project Team Structure
Figure 2.4: A proposed outsourcing team structure
Page 17
12
THE IMPORTANCE OF STRATEGY
The nature of the objectives set influence the outsourcing agreement to be made. The
setting of correct objectives will ensure that the company’s and service provider’s
objectives are in line. “The absence of objectives will frustrate the ability to test the
appropriateness of the proposed course of action and deficient objectives many lead to
the adoption of inappropriate course of action” (Barry and White, 1997). The setting of
meaningful and measurable objectives is, therefore a critical success factor.
TWO IMPORTANT TERMS
Business strategy: “The first step towards business evolution” (Duening and Click,
2005). Business strategy covers a broader scope that is, markets, business models,
competitive approach, business processes, partnerships etc. Companies must
implement the business strategy in every decision making process (Patel and Aran,
2005).
Sourcing strategy: Defines who will fulfill various parts of the objectives as defined by
the business strategy. The activity could be a project, a service or a process.” Business
strategy drives outsourcing strategy” (Hewat, 2010).
The business strategy can simply be defined as; what is to be done. “The next step is
not to define how the fulfillment of the defined objectives is achieved. Rather, the
enterprise would have to identify what sources will fulfill different business process, that
is, who will do it” (Patel and Aran, 2005).
“This is an emerging world in which objectives become more important than how to
achieve them, and external collaboration is leveraged not only to extend but mostly to
add value to the enterprises’ business capabilities”(Patel and Aran, 2005). Figure 2.5
“shows an enterprise in the partnership based world where the value chains of external
vendors are closely connected to the value chain of the organization” (Duening and
Click, 2005).
Page 18
13
Business objectives Organization
Vendor
Vendor
Vendor
Vendor
What Who
Business strategy Sourcing strategy
Figure 2.5: Transition from business strategy to sourcing strategy
DEVELOPING THE OUTSOURCING STRATEGY
Before making any outsourcing decision it is first necessary to understand and know the
business’s core competencies and what gives it a competitive differentiation.
Understanding the business core before making outsourcing decision is the first
essential step in strategic outsourcing (Hook, 2003; Mclvor,2000)
STUDY THE INTERNAL ENVIRONMENT
An organization must first survey its internal operations before selecting the function to
outsource (Barry and White 1996). This requires a bottoms up analysis of its resources,
capabilities and core competencies.
THE SOURCING STRATEGY MATRIX
Companies use different metrics and decision making models in order to define
outsourcing strategies. Although every sourcing strategy exercise tends to be different,
common traits and activities can be identified. According to Mclovr (2008), when
developing an outsourcing strategy understanding of the following three dimensions is
critical to the success of the outsourcing project:
The contribution of the process to competitive advantage
The relative capability of the process. (how competitive the activity is compared
to external markets)
The potential for supplier opportunism
Page 19
14
Figure 2.6, is a simple matrix developed by Mclvor (2008) to help companies decide if
outsourcing is right for any process. Similar matrixes with same concept have been
developed and used in practice (Gillette’s category positioning matrix; Chou, Brun,
Gamarra: “Supply chain strategies”; Adam Murry: Costing, outsourcing and Contracts;
Jean-Phillppe Massin, 2006. “How to Define a Sourcing Strategy and Appropriate
Tactics”. Strategic Sourcing Europe).
Invest to perform
internally
Outsource
Outsource
Perform internally and
develop
Outsource
Outsource
OR OR
Keep internal
RELATIVE CAPABILITY POSITION
LESS CAPABLE MORE CAPABLECO
NT
RIB
UT
ION
TO
CO
MP
ET
ITIV
E A
DV
AN
TA
GE
NO
T T
OO
CR
ITIC
AL
TO
CO
MP
ET
ITIV
E A
DV
AN
TA
GE
CR
ITIC
AL
TO
CO
MP
ET
ITIV
E
AD
VA
NT
AG
ETHE SOURCING STRATEGIES
Figure 2.6: The sourcing strategies matrix by Ronan Mclvor
The process may seem tedious and or slow, but the rewards are great if done properly
(Karamouzis, 2004). For example1; Summit Information Systems, a software developer
for credit unions, is a success story grown out of this process.” SIS outsourced disaster
recovery services four years ago for its data centre. Mr Steinbash, the individual
responsible for the processing centre was extremely nervous initially. However, after
assessing the core functions of the firm, it became clear that this function was not central
to their business strategy and could be performed more efficiently by someone else. Mr
Steinbash felt that the firm best equipped to manage disaster recovery systems was
Hewlett-Packard, but his biggest concern was a lack of control”--- Steinbashed managed
the transition to HP very closely and found that the two organizations had a good sense
1 “Simple successful Outsourcing” October 1 2005 CIO Magazine
Page 20
15
of each other. The need to micro-manage the process eventually disappeared. The
process continues well because Steinbash followed the steps for effective outsourcing.
2.4.2 VENDOR SELECTION AND CONTRACTING
Finding the right vendor and developing an appropriate contract are essential to any
organizations outsourcing initiative. The concern of giving control overrides the relief of
not having the day-to-day operations responsibility. It is therefore necessary to carefully
consider the elements of an effective outsourcing contract to help avoid many of the risk
that contribute to the failure of outsourcing.
IDENTIFYING AND SELECTING THE RIGHT VENDOR
The identification and selection process has a life-cycle of its own. Though the process
is subjective, dependent on how well the buyer and vendor firms relate to one another, it
can be conducted systematically. “Large firms such as Xerox that pioneered BPO
(Business process outsourcing) have well developed systematic approaches for
identifying and selecting outsourcing vendors “(Duening and Click, 2005). Figure 2.7 is a
description of the basic steps involved in vendor selection. The diagram was formed
using the different outsourcing frameworks identified in Figure 2.1
When the correct vendor in selected from the start, the benefits associated with an
effective outsourcing relationship are sooner realized. A systematic process is also more
likely to reveal the various alternative vendors in the market and help the buyer
distinguish among several service options.
As more and more suppliers enter the market, they are developing means to differentiate
themselves. Vendor markets are becoming more dynamic by the day and it is easy for
new firms with new innovative approaches to enter these markets; making a systematic
selection process very important (Chronis, 2004).
Page 21
16
1. Appointment of
vendor selection
team
2. Gather Vendor
information/ issue
request for
information
4. Defining and
refining goals
5. Requirements
Assessment
3. Set a realistic
schedule
6 Define
evaluation criteria
and weightings
8. Prepare request
for proposal
9. Evaluate
proposals
7. Develop a long
list
10 Select vendor
Figure 2.7: the major steps involved in moving from business strategy to partner strategy.
FOUNDATION TASK
Before the designing of the Request for Proposal or the signing of any contacts, it is
important for the organization to first understand the type of relationship it wants to
achieve over the life time of the contract. “The amount of time it takes to structure a deal
depends on the type of relationship being built” (Kopeck, 2004). According to Kopeck
(2004), the president of Campass North America, key considerations include the
following:
Pricing: Is the client willing to pay a premium for specialized expertise and
business knowledge, or is low cost the primary objective.
Vendor involvement: Does the client expect a high or low degree of input and
advice from the outsourcer.
Length of relationship: Does the client seek a long-term relationship, or are
frequent vendor changes to be expected.
Number of qualified vendors: Are the services sought by the client highly
specialized or widely available.
DESIGING THE REQUEST FOR PROPOSAL
A Request for proposal is a document that is used by many organizations to receive
offers of services or goods from a potential vendor (Tatum, 2003). This is a critical
document in the vendor selection phase and must be taken seriously (Murray, 2003;
Lackow, 2001).The quality of the vendor selected will have an impact on the outsourcing
project. The structure of a RFP will vary depending on the organizations and what they
Page 22
17
hope to gain from the response (Murray, 2003). Some generic elements include in a
RFP are (Bucki, 2010; Murray, 2003; Brown and Wilson, 2005; Patel, 2005):
Purpose of document
Submission details
Business overview and summary
Detailed specifications
Terms and conditions
Selection criteria
It is a good idea to attach the contract to the RFP (Rosetta, 2004). This is a good
negotiation tactic to get the supplier to accept as much as your terms and conditions as
possible.
EVALUATION OF PROPOSALS: VENDOR SELECTION
The vendor selection process can be a very complicated and emotional undertaking
(Bucki, 2010). Once a good vendor is selected, relationship management will determine
the success of the project/relationship (Lackow, 2001). A good and detailed RFP,
structured to measure potential providers does not guarantee that the right vendor will
be selected. The evaluation and selection process must be objective. People reviewing
the proposals and making the decision may have their favorite and this will cloud their
judgment (Harder, 2004). The main objective of this phase is to minimize human
emotion and political positioning in order to arrive at a decision that is in the right interest
of the company.
DEVELOPMENT OF A SUCESSFUL CONTRACT
Successful outsourcing depends on an exhaustive process (Cullen & Willcock, 2005).
Companies must understand all risk of the undertaking and be very cautious before
entering into a binding agreement. The following are elements essential to an
outsourcing contract complied form six sources (Mehrban,2009; Malarvannan, 2008;
Halvey and Melby, 1996; Gamble, 2003; Burge, 2009; Goolsby, 2010):
1. Include termination clause for breach of contract: contract should enable a
company to identify that a breach of contract is likely to occur. Company must
have the ability to take action before a breach occurs and disrupts operations.
Page 23
18
2. Flexibility (A renegotiation agreement): Allow companies to respond quickly to
change. Effectively managing an outsourcing relationship requires both parties to
be able to react to change in both their own business and the wider economy.
3. Resolution procedure: To minimize threat to operations and fallout between
outsourcer and client, an effective dispute procedure is essential.
4. Regulatory Risk: The contract should address competition or confidentially
issues. These are a major concern for the client company. A well drafted
contract can help address and lessen the risk attached to such concerns.
5. Responsibility and payment obligations: A good contract will indicate who will
conduct which activities and when the activities must be executed. “The contract
should cover key commercial aspects of the deal, ensuring the outsourcing
customer will have its requirements fulfilled without incurring additional cost or
paying for sever services it does not require.
6. A solid legal frame work: Experts have emphasized that there is a lack of
continuity after the signing of the deal. This will harm the project from the start.
7. Assignability clause: This should be included in the case of a change in
ownership. This termination clause will serve to be convenient in the long run.
8. Benchmarking clause: This gives the buyer the right to periodically benchmark
the provider’s services and price in comparison to other outsourcers.
2.4.3 TRANSITION TO OUTSOURCING
Applying a structured transition is identified as one of the six key success factors for
outsourcing (The outsourcing institute, 2010). Success of the outsourcing project is
linked to the effectiveness of the transition to outsourcing. It is at this phase where the
outsourcing relationship is first tested. The center of outsourcing surveyed 56 buyers.
These buyers of outsourced services were buyers who have implemented successful
outsourcing strategies, they all agreed that “their transition phase was the point that
either threatened to derail their relationship or that allowed for long-term success”. They
also agreed that the transition phase was a key indicator of the direction of the
relationship.
Page 24
19
What does the transition phase involve?
Transition is the process of migrating knowledge, systems and operating capabilities.
Three facets that must be accounted for (The outsourcing institute):
Technology: “the movement or replication of the required technical environment,
includes the setup of all required software, hardware and network processes”.
Process: This includes the documentation of the current process and transferring
of knowledge to the outsourced team members.
People component: Outsourcing is a people-centric business and not a process-
centric event. The management of the human factor is critical to the success of
the transition phase.
TRANSTION BEST PRACTICES
A formal process allows organization to pay special attention to the people, process and
technologies that are currently being employed and involves a process that is aligned
with the needs of the business. Six best practices for outsourcing transitions identified by
Sampath Head Business Transitions and Mavle Senior Manager Transitions at Infosys
(2010) are:
1. Methodology
In the process of choosing the best-fit service provider, an evaluation criteria to be
considered is a methodology for delivering transitions. Methodology is important for
the following reasons.
1. It indicated how important a service provider treats the transition phase
2. It is an indication of how well the service provider is likely to work with the buyer
and indication of service provider maturity.
3. Level of supplier consistency
Page 25
20
Key elements of a good methodology:
Tollgates and Audits: The development of a series of milestones and success
criteria, or phase gates that determine whether the transition team can move
forward.
Ease of implementation: A good methodology is one that is easy to implement
and understood by project team.
Use of tool and techniques, example, project management tools like MS project,
project management systems (PMS), risk management tools like Failure Mode
Effect Analysis (FMEA), and quality management tools like Six sigma, Pareto
analysis are essential.
Effectiveness of tracking progress
2. Robust planning process
Planning of transition needs to be given attention and time. The following are key
activities to be considered: Integrating timelines and expectations, Resource
allocation, Success criterion
3. Governance
Failing to organize and implement a governance structure is where a lot of transitions
fail. A “no-slack” execution of the governance structure during the transition phase
helps ensure continuous alignment of stakeholders to project goals, tracking of
status and changes if any. The following are key activities to be considered:
Stakeholder analysis, Frequency of communication, Mode of communication
4. Approach to managing risks
Risk needs to be monitored continuously throughout the transition. Risk
management involves: Risk Identification, Risk mitigation strategy and Risk tracking.
5. Buyer readiness
Determining buyer readiness should be done during the planning stage. This is more
critical when the buyer is outsourcing processes for the first time. The following are
key activities to be considered: Management support, Change management,
Resource allocation
Page 26
21
6. Partnership approach
How the buyer and the service provider teams work during the lays the foundation
and tone of the relationship for the duration of the contract. The following are key
activities to be considered: Approach to solving issues and Mutual trust.
TRANSITION METHODOLOGIES
In this section are examples of transition methodologies that are used in practice. The
two examples were chosen because they have all of the elements required for a good
methodology. The examples also show how transition methodology is applied in
practice.
Charter Group is a company that offers financial services. Carter group follows a six
sigma methodology along with PPMA (Professional Practice Management systems).
Figure 2.9 is an example of the transition methodology followed by the Charter Group.
According to their executives “We have a highly experienced transition team with strong
industrial expertise which gives us the confidence to execute your processes on time
and reengineer them during transition”.
Migration
Planning
Assign Project
Manager
Project Team
Identification
Communication Plan
Understand Client
-Technology
- Operations
- HR
High level SIPC
Detailed Project Plan
Process
Understanding
Map “As Is process”
Activity Analysis and
Categorization
Volume Analysis
Current process
Performance and
Baseline
CTQ identification
Identify Risk
Program
Design and
Development
Finalize: CTQ
FMEA
Recruitment needs in
terms of skills and
reporting
requirements
SLA/SOW for Pilot
and Productio
Program
Implementation
Implement “As Is”
Process
Pilot Monitoring
Create Improvement
plans
Initiate Projects where
CTQs not being met
T
O
L
L
G
A
T
E
T
O
L
L
G
A
T
E
Figure 2.9: an example of the transition methodology followed by the Charter Group
Benefits of this process
A flawless migration and minimal disruption due to Milestone driven, proven, flexible
methodology.
Identification of Improvement areas in productivity and process reengineering
opportunities at the start, use of COPC approach and Six sigma guidelines.
Page 27
22
Complete control of process life-cycle through frequent review and sign-offs with the
client.
Many companies use a dedicated transition management team called SMART-
Specialized Migration and Review Team. SMART is “an experienced transition team
comprising of multidisciplinary expertise in Operations, Quality and Information,
Technology and trained Business Process Transition and Project management that
assist in integrating all aspects of the outsourcing solution. Examples of companies that
use SMART (Global Edge, Kale MPS, Pacific), Figure 2.10 is the transition methodology
employed, which takes into account all three phases of the outsourcing services
transition; pre-transition, transition and post transition/steady phase.
Figure 2:10: An example of a transition methodology
Source: [online]. http://www.kaboodle.com
2.4.4 MANAGING THE OUTSOURCING PROJECT
One of the quickest roads to outsourcing failure is to think that because you have
outsourced a function, you no longer have to pay attention to it (Doyle, 2004).
Companies need a management process for continuously evaluating service delivery
Page 28
23
and communication feedback to improve services. Cullen & Willcock, (2005) investigated
the key activities for outsourcing success. His study was based on 100 outsourcing
cases from 1994-2003. He discovered that there is link between the outsourcing
management activities in Table 2.3 and outsourcing success. The different activities
were ranked according to the degree of importance to the outsourcing success from the
perspective of seven large organizations.
Table 2.3: Outsourcing management activities
Key Activity Ranking
Invest in the relationship (plan, assess and improve) 5
Meaningful reporting and analysis 4.6
Regular communication and meetings 5
Diligent documentation and administration 4.7
Managing risk and plan contingencies 4.9
Manage issues, variations and disputes4 4.9
Effective continuous improvement and streamlining 4.7
Evaluate and audit supplier (controls, performance, and compliance) 4.3
Evaluate organization both as a customer and contract manager 4.6
RELATIONSHIP MANAGEMENT
Handley and Benton (2009), conducted a study to investigate the reasons behind
outsourcing failure. Detailed data from 198 sourcing executives were used to investigate
the influence that relationship management processes have on achieving outsourcing
results. He concluded that outsourcing management teams should focus on the
development of a cooperative and mutually committed relationship with the provider if
the organization is to fully realize their performance expectations. “The results indicated
that organizations that wish to incorporate outsourcing must invest resources into the
development of strong relationship management competence”. As organizations
outsource core activities it is important that they are able to successfully coordinate and
control outsourced business functions. The NOA (National Outsourcing Association,
UK), have included relationship management as one of the key drivers to outsourcing
success and essential to any strategic outsourcing program.
MANAGEMENT OF COMMUNICATION
Effective outsourcing requires clients and vendors to have adequate levels of shared
knowledge concerning the product and service being provided (Yalaho, Nahar, & Wu,
2002; Sung and Young 2003), these authors investigated the success and failures of
Page 29
24
outsourcing projects and concluded that “relational exchange attributes between vendor
and clients is essential to successful outsourcing”.
RISK MANAGEMENT
Any organization considering an outsourcing strategy proposition must be ready to risk a
little. There are hundreds of terror stories of companies that have nearly gone bankrupt
because they failed to plan accordingly (Burkholder, 2005). All risk of outsourcing should
be considered before one makes the decision to use a third party. Only when aware of
the risk will one be able to develop a satisfactory analysis and service agreement, and
arrive at a decision that is justified through the consideration of all factors. “It is better to
be prepared in advance for the appearance of hidden cost and the possible occurrence
of unlikely events” (Duening and click, 2005).
Each phase of outsourcing has its own risk; project planning and project management
risks, supplier selection risks, outsource contracting risks and negotiation risks, transition
and start-up risks, outsource contact and supplier performance risks. Risk management
is a task that needs to be conducted thought out the projects life-cycle. Outsourcing
organizations need to use models to help develop strategies and tactics for assessing
and managing project risk. Figure 2.11 shows an example of a risk management model.
This is a generic risk management model adapted by IBM Global services. The idea is to
evaluate the project’s risks continuously.
RISK MANAGEMENT
Risk Identification
Risk Probability and
Impact Analysis
Risk Response
Planning
Risk Tracking &
Control
Risk Management Process
Figure 2.11 an example of a risk management mode
Page 30
25
MANAGING OUTSOURCING PERFORMANCE
Benchmarking
The main objective behind benchmarking is to understand and evaluate current position
of a business in relation to “best practices” in order to identify areas for improvement.
Outsourcing contracts these days include a benchmarking clause. This allows buyer to
benchmark the provider’s prices in comparison to other outsourcers (Goolsby, 2010).
Buyers use benchmarking as a way of identifying outsourcing financial benefits. The
following is an example of a relationship that “Outsourcing Center” studied in 2004-2009
in its annual Outsourcing Excellence Awards Program:
“Cost reduction was the buyer’s objective, but its CEO mandated that no cost-cutting
strategy could result in sacrificing the level of production of quality of the work. The
company recognized that it would achieve the greatest cost reduction through labor
arbitrage in an offshore outsourcing solution. It then conducted a benchmarking study to
onshore and offshore outsourcing providers’ solutions to determine their quality and
performance benchmarks against their prices”.
Governance
Governance is a structure that is put in place to support day-to-day outsourcing
management and decision making. Sourcing managers are to ensure that the
relationship is meeting business requirements and responsive to change. Operational
manager make sure that milestones and service levels are being met. Gartner research
(2004) shows that without a strong governance structure, an outsourcing arrangement
will most likely fail within 18 months. In an interview with business weekly, according to
Murphy (2004) “Outsourcing relationships that are effective have mature governance
practices and greater investment in managing the relationship”. According to Weigler of
Sourcing Interests Group (2004), companies do not devote sufficient attention to their
own responsibilities, “companies underestimate, understaff, and underfund the roles that
manage the outsourcing relationships”. In an outsourcing situation, you need an internal
team to manage the relationship and ensure alignment with business goals.
THE OUTSOURCING PEFORMANCE MANAGEMENT FRAMEWORK
Performance management professionals often use the “SMART” method to measure
outsourcing success. It is a flexible framework designed to set clear expectations and
measure success (Figure 2.12).
Page 31
26
Specific
Measureable
Aligned
Realistic
Trusted
Ask the “W questions”: why, what, who, when, where and what if.
Measure the key performance indicators: cost savings, service
improvement and employee satisfaction.
Align the performance management effort with internal technology,
business strategy and workforce performance.
Use the “seven Cs” to set realistic expectations: cost, compromise,
control, culture, communication, contingency and compassion.
Establish trust by meeting expectations, by willingness to compromise
and by being dependable, predictable and ethical.
Performance Management Outsourcing Framework
Figure 2.12: Performance management framework. Source: Adkins, S. 2005
The above framework is one of the few that sets out a guideline for management in the
measurement of outsourcing performance and takes into account the activities of each
phase.
2.5 PROBLEMS WITH THE OUTSOURCING PROCESS
Although the trend towards outsourcing has increased dramatically over the years some
companies still struggle to experience the benefits anticipated from their outsourcing
initiatives. A survey of companies and organizations buying outsourcing services revealed
that: 2
1. Fifty-five percent of the companies reported that they have outsourcing challenges
because their companies lack project management skills (i.e., they have no experienced
outsourcing governance)
2. Fifty-five percent reported they lack a good process for specifying the work
3. Forty-eight percent said they did not have the right metrics for measuring performance
2 Julie Giera, “Outsourcing Management: Align Management Techniques to the outsourcing Model IT View and
Business View Planning Assumption,” September 30, 2003, www.forrester.com/Cart?addDocs=32555. Three forrester reports were used to compile this information: the above mentioned report and Stephanie Moore, William Martorelli, Adam Brown, “Midyear 2004 update: North America Off-shore outsourcing” July 14, 2004, also Stephanie Moore. “IT Trends 2004: Offshore Outsourcing,” December 2003
Page 32
27
Although there are a number of outsourcing frameworks, only a few companies have taken
a strategic approach to outsourcing decisions, with many companies still deciding to
outsource based on short-term cost reduction motives (Davision, 2004; Mclvor, 2005; Ford,
1993). To add, Aron and Singh (2005) found out that companies are spending too much
time evaluating functions that should and should not outsource. Barthelemy, (2003) found
that seven “deadly sins” underlie most failed outsourcing efforts: (1) outsourcing activities
that should not be outsourced; (2) selecting the wrong vendor; (3) writing a poor contract; (4)
Overlooking personnel issues; (5) losing control over the outsourced activity; (6) overlooking
the hidden costs of outsourcing; and (7) failing to plan an exit strategy. Further, a 2003
survey in outsourcing essentials revealed that 58% of buyers responded that successful
outsourcing is mostly dependent on selecting the right vendors, 45% agreed that the
ongoing management is most important and 38% insists that a properly structured contract
leads to a successful deal.
2.6 BACKGROUND TO THE DEVELOPMENT OF THE OUTSOURCING FRAME WORK
The outsourcing framework was developed by researchers to overcome the major
weaknesses of outsourcing (Mclvor, 2000). The main purpose of a framework is to make
recommendations of what to do and what should be done (Hogwood and Gunn, 1984).
There seems to be an agreement between authors in the literature of the importance of the
outsourcing decision and some of the general guidance on the factors that should be
considered. That is, cost, risks, strategic approach and supplier relationships (Mclvor et al,
2000). Most Authors do provide factors and issues to consider without proposing a
systematic procedure that would guide companies through the process. Jennings, (1997),
Quinn and Hilmer, (1994) do provide factors and questions to be considered without
proposing a framework.
2.6.1 REQUIREMENTS FOR THE OUTSOURCING FRAMEWORK
This section describes the requirements of the outsourcing framework in order to
address the limitations discussed in the previous section. According to Ronan Mclvor et
al, (2000) the outsourcing framework must overcome these limitations by addressing the
following key aspects of the outsourcing process:
1. Value chain perspective. The outsourcing decision needs to be approached from an
activity perspective within the company’s value chain (Porter, 1985)
Page 33
28
2. Core competency thinking. Consideration of core competencies in the framework is
essential
3. Supply base influences. The framework must consider the impact that supply base
has on the outsourcing process. That is development and management of a
competence-based supplier network.
4. Performance measurement. Performance measurement is essential for outsourcing
success. In outsourcing it is important to analyze performance at the level of the
business process (Frei and Harker,1999).
5. Strategic context. The main driver of an outsourcing decision. Failure to place
outsourcing within a strategic context will lead to a “piecemeal” approach.
2.7 OUTSOURCING DECISION MAKING TOOLS
2.7.1 THE DECISION MAKING MATRIX
A decision making matrix evaluates and prioritizes a list of options using a specified
criteria. It is applied when one option must be selected and when a decision must be
made based on several criteria. A good example of a decision making matrix is the
sourcing strategy matrix illustrate previously (see Figure 2.6). A decision making matrix
can also be applied in the vendor selection process.
2.7.2 THE SCORECARD
A score card in this context is a tool designed to assist you to understand where you are,
what’s working, what’s not working and where to pay the most attention to improve
performance. To improve on current processes most companies use the Outsourcing
Decision-Making Score card in Appendix A (Brown and Wilson, 2005). The score card
ensures that decisions are:
More inclusive
More accurate
More controlled
However this score card is not comprehensive enough and does not include issues
rarely addressed in the typical outsourcing process.
CIMA developed a score card to assist the board of any organization to engage
effectively in the strategic process. The score card is based “on the premise that
Page 34
29
executive management is responsible for conducting the detailed strategic planning
while the board needs to provide effective oversight”. The scorecard gives the board a
simple tool that can be used to focus on most important strategic issues and to provide a
constructive challenge to management by asking the right, searching questions (Tilley,
2010). In context, the scorecard conveys the point that decisions are not taken in
isolation.
2.8 THE EFFECTS OF OUTSOURCING
2.8.1 OUTSOURCING AND FIRMS PERFORMANCE
“Outsourcing has emerged as a management tool that shifts the organizational structure
of companies” (Tompkins, 2006). However, according to a Deloitte consulting study,
64% of respondents indicated that outsourced activities were brought back in-house and
44% did not realize cost savings (Handley, 2009). Dun and Bradstreet’s study found that
20%-25% of outsourcing relationships fail within two years and half after within five (Daig
et al, 2001). Deloitte conducted another study with 300 business executives. The survey
revealed that 34% were satisfied with their provider’s innovation, 75% of the service
providers interviewed felt that their clients were “ill prepared for the outsourcing initiative”
often lacking a well developed strategy (Handley, 2009). These findings suggest that
there is a gap between outsourcing expectations and reality.
When deciding what activities to outsource, it is necessary to analyze the impact of
these decisions on the overall organizations and business performance (Arauji et al,
2003). It is therefore important to find out what variables may act as a link between the
benefits obtained from outsourcing and firm performance. Various authors have studied
the consequences and effects that outsourcing has had on a firm. Studies include: The
effects of outsourcing a specific functional division without providing overall vision
(Jones, 1993), Hays et al, (2000) examined the impact of outsourcing on the firm’s value
without analyzing the results. In a study conducted by Giley and Rasheed (2000), they
did not find an outsourcing-performance relationship although “strategy and then
dynamism of the environment “were found to be “mediating” factors of this relationship.
An investigation starts with “an initial connection between outsourcing and
representative measure of results achieved through cost efficiency or the creation of
greater market value” (Jiang and Qureshi, 2005). However, no author seems to have
Page 35
30
established a precise relationship between the outsourcing process and the business
and organization performance.
2.8.2 MEASURING OUTSOURCING PERFORMANCE
Effects of outsourcing using financial statements
Most research on defining the value and effects of outsourcing on firm’s performance
has been qualitative, using case studies, interviews and questionnaires. IBM’s Research
study was the first to apply ”rigorous statistical analysis” to measure the impact of an
outsourcing agreement. The following financial indicators of a company’s performance
have been developed form six different sources (Jiang, 2006; Lin and Huang, 2010;
Gilley and Rasheed, 2000; Yasin, Kemal and Altinkemer, 2009; Congnizant 2009;
Lopez, 2009) all of which studied the financial impact of outsourcing on firm
performance.
Important financial indicators
Productivity: Is a measure of the outputs of the organization against its inputs. It
includes quantity and/or value of products and services (outputs) measured against
the costs incurred or time used through the production of such outputs (inputs).
Inputs can include capital, material, tools and employees. (Enabling, 2008).
Cash management: This is the process of collecting, managing and investing cash.
According to investopedia, this is a key component of ensuring a company’s financial
stability and solvency.
Market ratios: Market Value Ratios relate an observable market value, the stock
price, to book values obtained from the firm’s financial statements. Two types: Price-
Earnings ratio, calculated by dividing the current market value of the stock by the
earnings per share. Market-to-Book Ratio relates to the firm’s market value per share
to its book value per share. This ratio indicated management’s success in creating
value for its stockholders. (price per share/book value per share)
Return on assets: Investopedia explains return on assets as “an indicator of how
profitable a company is relative to its total assets. It gives an idea of how efficiently
the assets are being used to generate profits. (Net income/ total assets).
Earnings before interest and taxes: This is an indication of a company’s
profitability before income tax and interest are deducted (Foo, 2009). (Revenue-
Operating expenses).
Page 36
31
Profit margin: This is a measure of profitability. Calculated as net income divided by
revenues or net profit divided by sales. This measure is very useful when comparing
companies in similar industries. A higher profit margin indicates that the company
has greater control over its cost compared to its competitors (Investopedia).
Return on equity: According to Kennon, (2001) ROE is one of the most important
profitability metrics mainly because a business that had a high return on equity is
more likely to be one that is capable of generating cash internally. This ratio reveals
how much profit a company has generated in comparison to the total amount of
shareholder equity (total assets-total liabilities).(Net income/ Shareholders equity).
Useful metric for comparison.
Inventory turnover: Reveals how frequently a company’s inventory is sold and
replaced within a financial reporting period (Bierley, 2008). Calculated as:
Sales/Inventory or Cost of Goods Sold/Average Inventory.
Profitability: Measured as the amount of income before tax divided by total revenue.
This is used by most banks as an indicator of improved performance.
Qualitative indicators of the effects of outsourcing
The table below gives examples of important performance dimensions used to measure
the effects of outsourcing on firm performance.
Page 37
32
Table 2.4: Qualitative indicators of the effects of outsourcing
Indicator Source
Cost related
Allow resources to focus on core competencies
Gottfredson et al (2005) and Leonard Barton (1992)
Increase economies of scale Bozarth et al (1998)
Flexibility related
Allow resources to focus on core competencies
Gottfredson et al (2005) and Leonard Barton (1992)
Improve process responsiveness Narasimhan and Das (1999), and Weber et al (1991)
Increase supply chain flexibility Lee (2004)
Increase volume capability Loh and Venkatraman (1992)
Innovation related
Access to specific labour and other technology expertise
Bozarth et al (1998), Loh and Venkatraman (1992)
Increase expenditure on Research and development
Hojnik (2005)
Quality related
Improve product performance design quality
Bozarth et al (1998), Loh and Venkatraman (1992)
Improve conformance quality Bozarth et al (1998), Loh and Venkatraman (1992)
2.9 A REVIEW OF AVAILABLE STATISTICAL TEST
The purpose of this section is to explore available statistical test and models that will help to
determine the various proposed relationships.
2.9.1 REGRESSION
Regression analysis is the most frequently used statistical tool (Rutherford, 2001).
Regression allows for the examination of relationships between an unlimited number of
independent variables and a dependent variable. In studies involving the effects of
outsourcing most authors define the independent variables as factors that influence
Page 38
33
outsourcing and the dependent variable is usually a performance measure or an
outcome of outsourcing. Most of the studies take on a simple approach by using simple
linear regression to determine relationships (Thakur and Farok, 2008). In its simplest
form regression analysis involves finding the best straight line relationship to explain how
the variation in an outcome (or dependent) variable, Y, depends on the variation in a
predictor (or independent or explanatory) variable X (Vinsnes et al, 2001). The linear
relationship is described as follows:
…(1.1)
However a hypothesized relationship will be as follows:
…(1.2)
Where is the error representing other factors that influence the independent variable. I
many situations the outcome will depend on more than one explanatory variable. This
lead to what is known as multiple regression. Regression analysis allows examination of
the relationships between unlimited number of predictor variables. The regression
equation will be as follows:
and are called the regression coefficients and estimated from the study data by
a mathematical process called least squares. The amount of variation in the dependent
variable that is accounted for by variation in the predictor variables is measured by the
value of the coefficient of determination, often called R square adjusted. The closer is to
1 the better. If R square is one then the regression model is accounting for all variation in
the outcome variable (Altman, 1991; Campbell and Machin, 1993).Other studies utilized
more complicate regression models. These include times series models and logistic
regression models (Fritson and Wuillenwber, 2006; Frazier et al, 2006)
.
2.9.2 CORRELATION
Correlation is used to quantify the association between the measured X and Y variables.
Linear regression is applied if one variable (X) is likely to precede or cause the other
variable (Y) (Motulsky, 1995). In the context of this report correlation is used mostly in
research where data has been collected from questionnaires (Hojnik, 2005).
Page 39
34
A correlation can be defined as a single number that describes the degree of relationship
between two variables (Trochim, 2006). Correlation can be calculated using the following
formula:
∑ ∑ ∑
∑ ∑ ∑ ∑
…(1.4)
Where:
N = number of pairs of score
∑ = Sum of the products of paired scores
∑ = Sum of x scores
∑ = Sum of y scores
∑ = sum of squared x scores
∑ = sum of squared y scores
Source: Selecting statistics
R is a number between -1 and 1. If r is less than zero you have an inverse relationship
otherwise you have a direct relationship.
2.9.3 ANALYSIS OF VARIANCE (ANOVA)
Researchers that use this method are interested in whether the mean dependent
variable scores contained in the experiment vary significantly (Rutherford, 2001).
Analysis of variance (ANOVA) suits most effect conceptions by testing for differences
between three or more means (Motulsky, 1995).
2.9.4 WILCOXON TEST
The wilcoxon test applies to two sample designs involving repeated measures, matched
pairs or “before” and “after” measures. Some authors use this test to determine the
degree of difference in performance between an outsourcing firm and a control group
(Fritson and Wullenwber, 2006). The control group is either defined as a non-
outsourcing firm during the same time period or as the period prior outsourcing. This
method is used as an alternative to the t-test when the population cannot be assumed
Page 40
35
normally distributed. Most common use is to determine if there is a difference before and
after.
2.9.5 THE T-TEST
The t-test is the most commonly used statistical data analysis procedure for hypothesis
testing. There are several types of t-test but, the most common is the two-sample t-test.
This test simply tests whether or no two independent populations have different mean
values on some measure. For example, compare whether systolic blood pressure differs
between a control and treated ground, or between men and women or any other group.
The statistics t-test allows us to answer these questions by using the t-test statistic to
determine a p-value that indicates how likely we could have gotten the results by
chance. If there is a less than 5% chance of getting the observed differences by chance,
we reject the null hypothesis and say we found a statistically significant difference
between the two groups. Correlation or regression is used to see how two variables vary
together (blood pressure and heart rate), the t-test compares one variable (e.g. blood
pressure) between two groups. The above mentioned techniques all employ a t-test to
check significance of data.
The table on the next page is a summary of the different test and also provides guidance
in selecting of the right test.
Page 41
36
Table 2.5: summary of available statistical test
Describe one
group
Compare one
group to a
hypothetical
value
Mean, Standard
deviation
Median,
Interquartile rangePropotion Kaptan Meier
One-sample t-test Wilcoxon testChi-square or
Binomial test
Compare two
unpaired groupsUnpaired t-test Mann-Whitney test Fisher’s test
Log-rank test or
Mantel Hantel
Haenszel
Compare two
paired groupsPaired t-test McNemar’s test
Conditional
proportional
hazards regression
Compare three
or more
matched groups
One-way ANOVA Krusal-Wallis test Chi-square testCox propotional
hazards regression
Compare three
or more
matched groups
Reoeated
measures ANOVAFriedman test Cochrane Q
Conditional
proportional
hazards regression
Quantify
association
between two
variables
Pearson correlatonSpearman
Correlation
Contingency
coefficients
Predict value
from another
measure
Simple linear
regression or non-
linear regression
Non-parametric
regression
Simple logistic
regression
Cox proportional
hazard regression
Predict value
from several
measures or
binomial
variables
Multiple linear
regression or
Multiple non-linear
regression
Logistic regressionCox proportional
hazard regression
Survival Time
Binomial (two
possible
outcomes)
Rank Score or
MeasuremeasurementGoal
Type of data
Wilcoxon test
Adapted from Intuitive Biostatistics: Choosing a statistical test chapter 37 Harvey Motulsky, 1995
Page 42
37
2.10 SUMMARY
This chapter gives an overview of the different outsourcing process frameworks. These
frameworks were used to identify the different phases of the outsourcing process.
Previous works, finding, case studies and expert’s perspectives were used to investigate
the critical success factors and activities of an outsourcing project.
The chapter also analyzed best practice techniques that are being employed in practice.
These included; a proposed project team structure, the sourcing strategy matrix
developed by Mclovr (2000), the Charter Group transition methodology, the SMART
transition methodology, the performance management outsourcing framework and the
decision making scorecard. An investigation of current literature was carried out to find
out why firms do not experience the benefits of outsourcing. The chapter analyses the
key problems with the outsourcing process and the current frameworks available to
address these problems. It was discovered that lack of a structured process and
performance measuring techniques are some of the key problems. Current framework
does not provide guidelines rather just tasks to be conducted and most of these
frameworks fail to address the entire outsourcing life cycle. These frameworks have a
particular emphasis on the decision making phase.
It is assumed that outsourcing improves firm’s performance and that firms who carry out
the majority of the above mentioned key activities will experience a greater
improvement. Different authors have undertaken research to discover the impact of
outsourcing on business performance. Most of which however, have failed to find a
direct relationship between outsourcing and performance as well as between
outsourcing and key drivers. Past research involved an analysis of case studies and it
was IBM Global Services that conducted the first quantitative research on the effects of
outsourcing. Although their research proved that outsourcing improves firm’s
performance their findings were limited to the impact of IT outsourcing on business
performance.
Statistical test are used to investigate relationships between variables. These tests
include; unpaired and paired t-test, pearson and spearman correlation; linear and non-
linear regression etc.
Page 43
38
3. DEVELOPMENT OF HYPOTHESES
3.1 INTRODUCTION
The previous section reviewed current literature on; the key drivers of outsourcing, the
outsourcing process, the outsourcing framework and the effects of outsourcing. Before
developing the structured framework to assist managers with making the correct outsourcing
decisions, there is a need to further investigate the subject of outsourcing. This chapter will
develop a set of hypothesis from the literature to assist with the investigation. There is little
practical evidence that following the structured outsourcing processes mentioned in chapter
2 and consideration of the critical success factors improve firm performance. The next
sections of the project aim to collect evidence that outsourcing has a positive effect on firm
performance and that success of the project is related to key outsourcing activities.
3.2 THE KEY DRIVERS OF OUTSOURCING
From the literature it is clear that cost reduction remains the primary driver of an outsourcing
decision. The first hypothesis will be stated as follows:
Hypothesis 1: Cost is the primary driver of the decision to outsource.
The purpose of the above hypothesis is to assist IMPERIAL Logistics in understanding why
their firms in South Africa take on outsourcing projects and to compare the result to findings
in the literature.
3.3 OUTSOURCING AND FRIM PERFORMANCE
3.3.1 EFFECTS ON OUTSOURCING: A QUANTITATIVE ANALYSIS
Theory suggests that outsourcing is a way of improving a firm’s operational efficiency
and financial performance, especially in the short-run. Outsourcing firms should
experience an immediate cost advantage. Outsourcing firms may also achieve benefits
in the long run compared to firms relying on in-house expertise. As a result we expect
firms engaging in outsourcing to experience an improvement in performance during the
period the outsourcing contract was signed. The second hypothesis is stated as follows:
Hypothesis 2: Firm performance improves as a result of outsourcing.
Outsourcing contracts vary in size and in expenditure. While some firm may choose to
focus on a single process another many outsource several business functions. The size
Page 44
39
of the deal can have an impact on the improvement of the firm’s performance especially
in the long term. The third hypothesis is stated as follows:
Hypothesis 3: The extent to which firm’s performance improves as a result of
outsourcing increases as the value of the outsourcing deal increases.
3.3.2 THE OUTSOURCING PROCESS AND FRIM PERFORMANCE: A QUALITATIVE
ANALYSIS
Firms that follow a structured procedure performing all critical and key activities
indentified in the different phases of the outsourcing process will receive greater
improvement in performance. Firms that have a strategic approach; conduct a thorough
identification and evaluation of core competencies; have a structured risk management
procedure; have a smooth transition and effective management procedures should
receive a greater improvement on business performance. The fourth hypothesis is stated
as follows:
Hypothesis 4: success of an outsourcing project is related to the critical activities that
must be performed during the different outsourcing phases.
4. METHODOLOGY
This chapter sets out the methodology used to gather and analyze information.
4.1 THE KEY DRIVERS OF OUTSOURCING
Hypothesis 1: In the literature, different reasons for outsourcing were identified. Many
authors study these reasons on the Likert scales of importance (e.g. Bhatnagar et al, 1999;
Baily et al, 2002). In this empirical study a questionnaire (Appendix B) was distributed to
several companies from different industries. Companies were asked to rate seven of the key
drivers of outsourcing identified in the literature on a five step Likert scale. The scores of
each of the reasons were summed and the key driver of outsourcing for the firms in the
sample was the factor that had the largest overall score.
4.2 MEASURING THE EFFECTS OF OUTSOURCING
At the company level the effects of outsourcing are measured using financial and
nonfinancial indicators. The analysis is separated into two investigations; a fact based
quantitative study and a survey based qualitative study.
Page 45
40
4.2.1 EFFECTS OF OUTSOURCING: A QUANTITATIVE STUDY
Sample Selection and data sources
The research is done using multiple case studies representing different industries and
geographic locations.33 outsourcing deals made between the years 2000-2008 were
analyzed. Five leading online news sources, ComputerWeekly, ABI/INFORM, The
Outsourcing Center, The OutsourcingMag and Outsourcing Alert were used to search
and compile all press releases and news on outsourcing deals. A variety of combinations
of key words (e.g. outsourcing, deals, contracts, announcements, transaction) were used
in the search. A total of 124 outsourcing deals were found. The data was further refined
to those companies who’s financial statements were available to the public online.
Financial information was collected on each company’s investor web page. The search
was limited to mega outsourcing deals publicly announced and those between the year
2000 and 2008. Outsourcing deals of less than $10million were not included due to the
fact that the impact on firm’s financial performance as a result of outsourcing will not be
traceable. Companies who had other financial announcements such as mergers around
the time the outsourcing contract was signed were excluded from the data.
The name of the outsourcing firm, the year of the outsourcing contract, the expenditure
in US$, the industry the firm operates and the name of the vendor were recorded
(Appendix C).
To make the study more unique from other previous research, the study analyzed the
performance of the different companies three year after the initial sourcing contract was
signed and a year before the contract was signed. One year period is too short to
capture the full effects of outsourcing as transaction cost may have lowered performance
in the year after outsourcing (Jiang, Frazier et al. 2006). Looking at a period of more
than three year will reduce reliability of data as we can be less sure that other effects
than outsourcing events influence the results.
Model specification
Hypothesis 2: A difference tests was employed to evaluate the effects of outsourcing on
firm performance. To perform this test the change in the financial indicators of the
outsourcing companies a year before and three years after implementation must be
analyzed. To test for the significance of the difference between the two sets of data a
parametric t-test and the non-parametric Wilcoxon signed rank test was performed. The
Page 46
41
Wilcoxon signed rank test was used to find out if there is a difference between the
samples and to what degree. The equation model is written as follows:
(3.1)
Where: denotes the value for company in Appendix C, Z is any performance indicator
and t is the period in which the outsourcing contract was signed
Performance measures
The most frequently used performance measures from the literature are used in the
investigation. These performance measures are most reliable when investigating the
financial impacts of outsourcing. Table 4.1 below is a list of the performance measures
used in the study:
Table 4.1: Construction of performance measures
Performance measure Numerator Denominator
Profitability Income before tax and interest Total revenue
Return on total Assets Net income Total assets
Return on total equity Net income Total equity
Hypothesis 3: To find out if there is a relationship between the value of the outsourcing
deal and performance a linear regression analysis will be conducted. The following
regression model will be used to determine the relationships:
For ROE, ROA}
Where:
Y: dependent variable
X: independent or explanatory variable
In this study, X is the value of the outsourcing deal in US$ million and Y is the growth
rate of performance measure . is the intercept, is the slope for the independent
variable X and is the standard error.
Using the performance measures in Table 4.1, the growth rate of each of the indicators
will be calculated using the formula below:
Page 47
42
√
(3.3)
Where ROE, ROA} and t is the year the outsourcing contract was
signed.
The study aims to prove that the rate of improvement in performance is directly related
to the value of the outsourcing deal. Regression analysis was used to determine the
degree to which the two variables are related. Next are descriptions of the regression
variables and an explanation of the rationale for including them in the model by providing
support from the literature.
Dependent and independent variables
Measures collected from balance sheets and income statement were used to calculate
profitability, ROA and ROE (all serve as dependent variables). These are all common
measures used in the studies of (Yasin et al, 2009). Regression analysis using financial
performance ratios have the advantage that they can capture different aspects of firm
performance, and are commonly used in the literature. The amount the company spent
on the deal is the independent variable in this scenario. The dependent variables will be
generated using equation (3.3) stated above. The study is to test if the magnitude of the
growth rate is related to the value of the outsourcing deal.
4.2.2 THE OUTSOURCING PROCESS AND IMPACT ON FRIMS PERFORMACE A
QUALITATIVE STUDY
Critical activities are those activities considered most important and whose level of
application/performance has had a positive correlation with overall company
performance. Managers have different perspectives as to which outsourcing activities
must be performed when conducting an outsourcing project. Theory suggests that
outsourcing leads to success in operations. Theory also suggests that the extent of this
success is related to critical activities of the outsourcing process.
Data collection
The process involved the construction of an evaluation/self-assessment scorecard in the
form a checklist. The scorecard was separated into different sections, strategy, core
competencies, risk, design of the contract, relationship, transition and management.
These measures where developed from a comprehensive review of current literature
Page 48
43
and had been reviewed by other industry experts. Questionnaires (Appendix B) were
distributed to industry professionals. Companies were required to confirm the critical
activities under each heading that were performed or that are performed when carrying
out an outsourcing project. Each company will have a different score on the total
activities performed and factors that were taken into consideration. The study assumes
that there is a positive relationship between the average scores in each section and the
improvement in the firm’s performance.
The companies were further asked to rank the effect that the outsourcing initiative had
on the company’s performance on a five step Likert scale. Different dimensions that
companies use to measure performance were gathered from the literature and used to
develop the questionnaire. The performance scale is measured relative to how well a
specific area in the organization has improved as a result of outsourcing.
Sample size
Questionnaires were distributed to both; clients of IMPERIAL Logistic and selected
companies listed on the Mcgrewer BFA database. Each questionnaire was accompanied
by a cover letter explaining the objectives of the survey and instructions. 123
questionnaires were distributed to the South African firms. The companies where given a
response time of six weeks. The sample consists of companies in various industries in
South Africa.
Statistical test specification
Correlation analysis was used to determine if there is a positive relationship between key
outsourcing activities and firm performance.
5. DATA COLLECTION, ANALYSIS AND RESULTS
Before the framework or revised scorecard can be developed it is necessary to test and
prove the theories developed from the literature. This is carried out by testing the
hypotheses developed in chapter 3. The purpose of this section is to test these four
hypotheses.
Page 49
44
5.1 TESTING OF FIRST HYPOTHESIS
123 questionnaires were distributed to industry professionals. Each company was given six
weeks to complete the questionnaire. Reminder letters were distributed three weeks after
distribution to increase the response rate. 21 questionnaires were collected of which only 13
were used in the study. The questionnaires were scanned for consistency to the responses
provided. Table 5.1 is a summary of the sample used in the study.
Table 5.1: Survey Statistics Survey Statistics
Number of questionnaires distributed 123
Number of questionnaires collected 21
Number of usable questionnaires 13
Mean respondent experience 14 years
Mean firm size 513 employees
Industry Types (% of sample)
Manufacturing 27.27%
Finance/banking 18.18%
Consulting 18.18%
Aviation/Aerospace 9.09%
Mining 18.18%
construction 9.09%
Reasons for outsourcing
The results of the analysis have been summarized in Table 5.2 Descriptive statistics
(means, and standard deviations) have been calculated for each reason.
Page 50
45
Table 5.2: Reasons for outsourcing
Reason N Average Value
Standard deviation Minimum Maximum
Accelerate re-engineering benefits 13 2.307 1.315587 1 4
Access to world class capabilities 13 3.6923 1.1094 1 4
Reduce cost 13 3.4615 1.391365 1 4
Improve performance 13 3.2308 1.363442 1 4
Focus on core competencies 13 3.7692 1.480644 1 4
Function too difficult to manage or out of control 13 1.8461 1.463224 1 4
Reduce risk 13 2.1538 1.214232 1 4
Make capital funds available 13 2 1.290994 1 4
From the table above it is clear that the main reason for outsourcing for the companies in
the sample is to focus on core-competencies. Figure 5.1 illustrates these results graphically.
Figure 5.1: Bar chart illustrating key outsourcing drivers for the companies in the sample
The maximum score for each reason for outsourcing should be 65; in this case all
companies in the sample would have identified the same reason to be the top driver of
outsourcing. From the bar graph, it is clear that focus on core competencies (49), access to
world class capabilities (48) and to reduce cost (45) are the top three reasons for
outsourcing. The top three reasons are similar to those identified in the literature. However,
the rankings differ. In the literature cost was identified as the primary driver for the
0 10 20 30 40 50 60
Accelerate reengineering benefits
Access to world class capabilities
Reduce cost
Improve performance
Focus on core competencies
Function to difficult to manage or out of control
Reduce risk
Make capital funds available
Reasons for outsourcing
Page 51
46
outsourcing decision. It would not be wrong to conclude that the reasons for outsourcing are
consistent with the literature and the results of previous studies.
5.2 TESTING OF SECOND HYPOTHESIS
The objective of the following analysis is to provide evidence that there is a difference in firm
performance before and after outsourcing. The Wilcoxon test described in the literature and
in the previous chapter was used to test this difference.
The null hypothesis is stated as follows: There is no difference in performance measure ( )
before and after outsourcing, where = {Profitability, ROE, ROA}
The alternative hypothesis is stated as follows: There is a difference in performance
measure ( ) before and after outsourcing where = {Profitability, ROE, ROA}
The table below is a summary data from the non-parametric t-test
Table 5.3: summary of results from Wilcoxon test
Performance measures Test Statistic W Z score P-value
Profitability 89 102.06 0.1925
ROE -8 -0.0854 0.5363
ROA 142 97.23 0.0721
The study requires 95% certainty, therefore .
The study fails to reject null hypothesis as the p-value >0.05 for all . An immediate increase
in profitability, return on equity and return on assets is not necessary experienced as a result
of outsourcing. However, from the data it is clear that there is a greater degree of difference
in ROA after outsourcing compared to the other performance measures. However, the
above results are not a surprise, as with previous research the financial impacts of
outsourcing on firm performance tend to be statistically insignificant. Figure 5.2 is a bar chart
that reveals the percentage of the companies in the sample that experienced an increase in
performance after outsourcing.
Page 52
47
Figure 5.2: Bar chart showing the percentage of companies that experienced an increase in performance after
outsourcing
5.3 TESTING OF THIRD HYPOTHESIS
Data analysis was conducted using the statistical software SPSS. The following is a
description of the analysis that was conducted in the study to prove hypothesis 3.
PROFITABILITY
Equation (3.2) was used to investigate the relationship between the value of the outsourcing
deal and the average growth rate of the profitability ratio. The growth rate was calculated
using the following formula.
√
Where t is the year the outsourcing contract was signed.
The formula measures the average rate the company’s profitability grew three years after
the outsourcing contract was signed. Table 5.4 is a summary of the data generated from the
analysis.
61.29%
45.16%
64.52%
profitability ROE ROA
Percentage Companies that experiened an increase in performance measures
Page 53
48
Table 5.4: Profitability: summary of regression statistics and coefficients
Profitability and value of outsourcing deal
Regression Statistics
Multiple R R Square Adjusted R Square Observations
.377a .142 .114 .24193
Coefficients Standard error T Statistic P-value
Intercept .936 .054 17.205 .000***
B Variable 6.573E-5 .000 2.230 .033*
Table 5.5: Profitability: ANOVA output from regression
AVOVA output from regression
Df Sum of squares Mean square F value Pr(>F)
Regression 1 .291 .291 4.972 .033*
Residuals 32 1.756 .059
The null hypothesis is stated as: the value of the outsourcing deal has no effect on the
average growth rate of the profitability ratio.
The alternative hypothesis is stated as: There is a direct relationship between the value of
the outsourcing deal and the average growth rate of the profitability ratio.
The study requires a 95% certainty. This means that 95% of the time, the experiment will
produce the similar results. The p-value is 0.033 which is less than 0.05. The null
hypothesis is rejected. There is a statistically positive relationship between the value of the
outsourcing deal and the average growth rate of the profitability ratio.
The coefficient of determination is 0.142; therefore, about 14.2% of the variation in the
profitability growth rate is explained by the value of the outsourcing deal. The regression
equation will not be very useful for making predictions since the value of R Square is not
very close to 1.
Reliability and Validation
Assessment of the Assumption for Regression Analysis
In a linear regression analysis it is assumed that the distribution of the residuals (error in
estimation the dependent variable Y ̂̂)) in the population is normal at every level of
Page 54
49
predicted Y (dependent variable) and constant in variance across all levels of Y. The charts
below (Figure 5.6 (a) and (b)) illustrate the residual plots derived from the data. Figure 5.6
(c) illustrates the normal probability plot and Figure 5.6 (d) shows the scatter plot.
Residual Plot Studentized Residual Plot
(a) (b)
(c) (d)
Figure 5.6: Scatter plots form regression analysis (profitability vs value of outsourcing deal)
The residual plot shows a random scatter of points (independencies) with a near constant
spread (variance). The studentized residual plot shows a random scatter of points
(independencies) with no values going beyond the standard deviation reference lines.
The normal probability plot of the residuals shows the points close to a diagonal line;
Page 55
50
therefore, the residuals appear to be approximately normally distributed. Thus, the
assumptions for regression analysis appear to be met.
The alternative hypothesis is therefore valid. However, it is to be noted that though there is a
statistically significant positive relationship between the profitability growth rate and the
value of the deal, it is a weak relationship.
RETURN ON EQUITY
Equation (3.2) was once again used to investigate the relationship between the value of the
outsourcing deal and the average growth rate of the ROE ratio. The growth rate was
calculated using the following formula.
√
Where t is the year the outsourcing contract was signed.
The table below is a summary of the results obtained from the investigation.
Table 5.6: ROE: summary of regression statistics and coefficients
ROE and
value of
outsourcing
deal
Regression Statistics
Multiple R R Square Adjusted R Square Observations
0.5657 0.3201 0.2989 33
Coefficients Standard error T Statistic P-value
Intercept 8.77e-01 7.794e-02 11.263 1.14e-12 ***
B Variable 1.689e-0.4 4.351e-05 3.882 0.000488 ***
Table 5.7: ROE: ANOVA output from regression
AVOVA output from regression
Df Sum of squares Mean square F value Pr(>F)
Regression 1 1.9651 1.95511 15.067 0.0004879 ***
Residuals 32 4.1736 0.13043
The null hypothesis is stated as: the value of the outsourcing deal has no effect on the
average growth rate of the ROE ratio.
Page 56
51
The alternative hypothesis is stated as: There is a direct relationship between the value of
the outsourcing deal and the average growth rate of the ROE ratio.
The study requires a 95% certainty. The p-value is 0.000488 with three levels of
significance. The null hypothesis is rejected. There is a direct relationship between the value
of the outsourcing deal and the average growth rate of the ROE ratio.
The coefficient of determination is 0.3201; therefore, about 32.01% of the variation of the
ROE growth rate is explained by the value of the outsourcing deal. Not all variation can be
explained by the fitted model.
Reliability and Validation
Assessment of the Assumption for Regression Analysis
The charts below (Figure 5.7 (a) and (b)) illustrate the residual plots derived from the data.
Figure 5.7 (c) illustrates the normal probability plot and Figure 5.7 (d) shows the scatter plot.
Residual Plot Studentized Residual Plot
(a) (b)
Page 57
52
(c) (d) Figure 5.7: Scatter plots form regression analysis (ROE vs value of outsourcing deal)
The data points shown in the residual plot are randomly scattered with an acceptable
variance. The studentized residual plot shows a random scatter of points (independencies)
with no values beyond standard deviation reference lines. The normal probability plot of
the residuals shows the points close to a diagonal line; therefore, the residuals appear to be
approximately normally distributed. The assumptions for regression analysis appear to be
met.
RETURN ON ASSETS
Equation (3.2) was used to investigate the relationship between the value of the outsourcing
deal and the average growth rate of the ROA ratio. The growth rate was calculated using the
following formula.
√
Where t is the year the outsourcing contract was signed.
The table below is a summary of the results obtained from the investigation.
Page 58
53
Table 5.8: ROA: summary of regression statistics and coefficients
ROA and value of outsourcing deal
Regression Statistics
Multiple R R Square Adjusted R Square Observations
0.4779 0.2284 0.2043 33
Coefficients Standard error T Statistic P-value
Intercept 0.98083 0.0635883 15.425 *2.26e-16 ***
B Variable 0.0001092 0.0000355 3.078 0.000488 **
Table 5.9: ROA: ANOVA output from regression
AVOVA output from regression
Df Sum of squares Mean square F value Pr(>F)
Regression 1 0.82242 0.82241 9.4728 0.004255 **
Residuals 32 2.77818 0.08682
The null hypothesis is stated as: the value of the outsourcing deal has no effect on the
average growth rate of the ROA ratio.
The alternative hypothesis is stated as follows: There is a direct relationship between the
value of the outsourcing deal and the average growth rate of the ROA ratio.
The study requires a 95% certainty. The p-value is 0.004255 with two levels of
significance. The null hypothesis is rejected. There is a direct relationship between the value
of the outsourcing deal and the average growth rate of the ROA ratio.
The coefficient of determination is 0.2284; therefore, about 22.84% of the variation in the
ROA growth rate is explained by the value of the outsourcing deal.
Reliability and Validation
Assessment of the Assumption for Regression Analysis
The charts below (Figure 5.8 (a) and (b)) illustrate the residual plots derived from the data.
Figure 5.8 (c) illustrates the normal probability plot and Figure 5.8 (d) shows the scatter plot.
Page 59
54
Residual Plot Studentized Residual Plot
(c) (b)
(c) (d) Figure 5.6: Scatter plots form regression analysis (ROA vs value of outsourcing deal)
The data points shown in the residual plot are randomly scattered with an acceptable
variance. The studentized residual plot shows a random scatter of points (independencies)
with no values beyond standard deviation reference lines. The normal probability plot of
the residuals shows the points close to a diagonal line; therefore, the residuals appear to be
approximately normally distributed. Therefore the data meets the assumptions for
regression.
SUMMARY OF CORRELATION
The table below is a summary of the relationships between the value of the outsourcing deal
and the average growth rates of the three selected performance measures.
Page 60
55
Table: 5.10: summary of correlation between growth rate of; profitability, ROA, ROE with value of outsourcing deal
Measure Value of outsourcing deal Percentage Ranking
Profitability 0.142 14.2% 3
Return on equity 0.3201 32.01% 1
Return on assets 0.2284 22.84% 2
5.4 THE OUTSOURCING PROCESS AND IMPACT ON FRIMS PERFORMACE A
QUALITATIVE STUDY
TESTING OF FOURTH HYPOTESIS
In this section the analysis aims to prove that success of an outsourcing project is related to
the critical activities that must be performed during the different outsourcing phases.
Testing Normality of Sample
An assessment of the normality of data is a prerequisite for many statistical tests as normal
data is an underlying assumption in parametric testing. Statistical test have the advantage of
making an objective judgment in comparison to graphical interpretation which requires
experience in interpreting normality graphically. Table 5.11 below presents the results from
two well known tests of normanlity, namely the kolmogoroy Simiroc Test and the Shapiro-
Wilk Test. Shapiro-Wilk Test is more appropriate for small sample sizes but can also handle
sample sizes as large as 2000. For this reason, the Shapiro-Wilk test was used in the study
as the numerical means of assessing normality.
Table 5.11: Tests of Normality
Kolmogorov-Smirnova Shapiro-Wilk
Statistic df Sig. Statistic df Sig.
Flexibility .259 13 .017 .802 13 .007
Cost .158 13 .200* .896 13 .116
Innovation .487 13 .000 .429 13 .000
Quality .237 13 .045 .803 13 .007
a. Lilliefors Significance Correction *. This is a lower bound of the true significance.
Page 61
56
It is clear from Table 5.11 that only the cost variable meets the assumption of normality. If
the sig. value of the Shapiro-Wilk Test is greater than 0.05 the data is normal. If it is below
0.05 then the data significantly deviates from a normal distribution.
From the results it clear that the data collected deviates from a normal distribution.
Spearman’s rank correlation was therefore used to measure statistical dependence between
the variables in the sample.
Correlation Analysis
Data was analyzed using the Statistical Package for Social Sciences (SPSS), version 19 for
Windows. A correlation analysis was performed to determine the relationship between the
activities carried out during the outsourcing process and the effects of outsourcing. Table
5.12 summaries the results of correlation analysis between the elements of the outsourcing
process and selected non-financial indicators of company performance for the companies in
the sample. The blue area highlights the results with statistically significant correlations.
Page 62
57
Table 5.12: Summary of the results of Spearman’s rho
Cost Innovation Flexibility Quality
Strategy Spearman's rho .379 -.189 .218 -.269
Sig. (2-tailed) .202 .536 .475 .374
N 13 13 13 13
Core
Competencies
Spearman's rho .018 .299 .154 -.023
Sig. (2-tailed) .955 .321 .615 .941
N 13 13 13 13
Risk Spearman's rho .022 -.062 .381 -.024
Sig. (2-tailed) .943 .840 .199 .938
N 13 13 13 13
Contract
Completeness
Spearman's rho -.171 -.297 .148 .134
Sig. (2-tailed) .577 .325 .629 .663
N 13 13 13 13
Relationship Spearman's rho .274 .335 -.393 .656*
Sig. (2-tailed) .364 .263 .184 .015
N 13 13 13 13
Transition Spearman's rho -.077 -.096 .097 .661*
Sig. (2-tailed) .803 .756 .753 .014
N 13 13 13 13
Management Spearman's rho -.123 -.060 .302 .056
Sig. (2-tailed) .690 .845 .317 .855
N 13 13 13 13
*. Correlation is significant at the 0.05 level (2-tailed). **. Correlation is significant at the 0.01 level (2-tailed).
The following comments are made only for statistically significant associations between the
elements of the outsourcing process and the effects of outsourcing. A commitment to and
investment in the outsourcing relationship is statistically positively associated with the quality
effect (r= 0.656, p= 0.015). The percentage of the variability shared is determined by
squaring the correlations and then multiplying by 100. Hence, relationship commitment
shares about 43% of its variability with quality. The critical activities conducted during the
transition phase are positively associated with improvement in quality (r= 0.661, p=0.014)
with 43.69% variability.
It should be noted that all associations are relatively weak, which means that these direct
links are also influenced by other factors.
Page 63
58
Reliability Test
The questions in the questionnaire represented under the different heading (appendix B)
were designed to measure the specific trait as it influences the outsourcing project.
It is possible that some of the respondents may have given answers that did not reflect the
true outsourcing process. Due to the awareness that a questionnaire was being answered
the respondent may have overestimated certain responses to shed a light on the specific
company.
Reliability of the data was assessed according to the degree of consistency on the rankings.
The threat to reliability is reduced in the study by ensuring that instructions were
unambiguous and simple. IMPERIAL Logistics has knowledge on the performance of the
companies that the questionnaires were distributed to. It will therefore be easy to track those
companies who over estimated performance.
Cronbach’s alpha is a measure of internal consistency, that is, how closely related a set of
items are as a group. A high alpha value is often used as evidence that the items measure
an underlying construct. Table 5.13 is a summary of the reliability test of each of the
correlations in Table 5.12. The test assessed the reliability of each dependent variable
(Cost, Innovation, Flexibility, and Quality) against the independent variables/factors
(Strategy, Core Competencies, Risk, Contract Completeness, Relationship, Transition and
Management).
Table 5.3: Summary of Cronbach alpha test
Dependent
variable
Cronbach’s alpha Cronbach's Alpha Based on Standardized
Items
Cost 0.706 0.764
Innovation 0.746 0.773
Flexibility 0.701 0.760
Quality 0.771 0.803
A reliability coefficient of 0.70 or higher is considered acceptable (Santos, 1999). The alpha
coefficients in Table 5.13 are greater than 070, suggesting that the items have an
acceptable internal consistency. The variable/responses in the survey produced an overall
alpha value of 0.714 defending the suitability of using correlation analysis to prove the
research hypothesis.
Page 64
59
Verification
The low response rate of the questionnaires required a further analysis of the outsourcing
process and its effects. The scorecard in Appendix B has a list of activities that are carried
out during the outsourcing process. These activities have been derived from the literature.
To confirm the theory that performing activities listed is essential and affects the outcome of
the benefits of outsourcing a case study analysis was conducted. 36 outsourcing cases
were studied. The purpose was to verify the activities listed on the scorecard and to provide
support to the theory that was not provided for by the correlation analysis.
Case studies are most appropriate for exploratory and explanatory research, since they are
able to capture a greater depth and breadth of detail on the subject’s activities (Leidner and
Jarvenpaa, 1993). They are particularly powerful techniques to answer “how” and “why”
questions. The qualitative approach is particularly suitable for studying phenomena in which
little previous research has been conducted and it is not supported by strong theoretical
base (Benbasat et al, 1987). Case studies based on interviews and document reviews were
used to gain a greater understanding to the reasons why outsourcing projects fail. Construct
validity was established by triangulation and chain of evidence. The following are examples
of typical cases used in the study;
Page 65
60
KEY FINDINGS
Each case described a root cause/s for the reason for failure for each contract. The key findings
are summarized in Table 5.14 as follows:
Case 9
A telecommunications company ended its 10 year IT outsourcing deal five years early. The
company outsourced support for IT infrastructure and customer and billing systems at the end 2003
and the deal was signed in 1998. According to an interview “The outsourcing deal which was
cancelled, was poorly negotiated and because the two companies failed to invest adequately in
managing the relationship disputes that arose from a lack of clarity escalated and caused the
relationship to break down five years early.”
Case 15
The collapse of an outsourcing relationship between a retail company and a consulting firm
revealed just how spectacularly outsourcing can fail if executed for the wrong reasons. In an
interview the company said that “change of focus” was behind the bold move. Major problems right
at the scoping stage of the deal contributed to its failure. Detailed knowledge of the project was not
acquired at the beginning phases to manage the project effectively.
Case 4
A financial service provider ended its 10 year contract with a consulting firm in less than two years.
“The decision to scrap the contract was all about cost savings. The failed contract was not flexible
enough to accommodate the changing needs of its customer.”
Page 66
61
Table 5.14: key findings for the reasons for failed outsourcing contracts
Reason for failure
Strategy and core
competencies
related
A vague understanding of business objective
Losing sight of the key objectives of the outsourcing decision
Pressure for managers to reduce cost leading to poor decision
making in the early stages
Unrealistic expectations
Relationship/contract
related
Poor cultural fit and compatibility of the parties
Poor communication; parties not proactively sharing necessary
information
Unclear expectations and objectives were provided to vendor/s
Contract not providing for sufficient flexibility
Business managers' lack of involvement in establishing effective
agreements.
A poorly negotiated contract
no investment in the relationship
Suppliers inability to deliver promised service levels
Risk related Failure to address risk of hidden cost
Transition related Inability to perform all task listed on the transition plan check list
Failure to meet transition targets due to inadequate resources for
necessary for a smooth transition to take place
Confidence lost in supplier’s ability to provide efficient service
due to lack of structured transition plan/methodology
Management related Lack of "centralised control" and "adequate governance".
Insufficient benchmarking
Poor governance structure for managing the ongoing relationship
5.5 VALIDITY
QUESTIONNAIRE
The questionnaire was developed from a theory building approach based on the literature
and was reviewed by industry experts. This establishes content validity.
FINANCIAL DATA
This data was collected using balance sheets and income statements made publicly
available. These statements represented audited data and high level of validity.
Page 67
62
5.6 RELIABILITY
Different analyses were performed on the data. Reliability test were performed in each
analysis and have been described in chapter five. The findings were compared to similar
studies and proved to be consistent to pervious research.
5.7 LIMITATIONS
36% of the respondents admitted that the questionnaire was not applicable to their particular
company because they did not employ a structured outsourcing process. This greatly
reduced the sample size and hindered the study. Time limited the study as there was not
enough time to collect a greater sample and enhance the structure of the questionnaire.
Regression and correlation research demonstrate that it is possible to predict one variable
from another. However, two variables can be associated without there being a casual
relationship between the variables. Therefore, causal conclusions from correlation findings
cannot be made because it is not possible to rule out all alternative explanations for the
relationship. The study revealed a positive association between quality and commitment to
the outsourcing relationship. There is therefore a relationship between the two variables but,
all other alternative explanations for the correlation cannot be ruled out. For every
correlation study, there is the possibility that some third variable caused the two variables
without there being a causal relationship between the variables. Factor analysis is used to
investigate such relationships. Factor analysis was initially carried out and the results
revealed a Kaiser-Meyer-Olkin (KMO) measure of 0.445. This meant that the sample size
was not adequate enough to deduce conclusions from the analysis. The sampling adequacy
should be greater than 0.5 for a satisfactory analysis to proceed.
Most literature and case studies on outsourcing are western literature and cases. However,
the outsourcing process is generic and is applicable to different organizations with cultural
differences.
6 DISCUSSION OF RESULTS
6.1 SUMMARY OF FINDINGS
Hypothesis 1
Companies outsource for different reasons. The key reason for outsourcing for the
companies in the sample was to focus on core-competencies. The top three reasons for
Page 68
63
outsourcing found in the study were consistent to those in the literature. However, in the
literature cost was identified as the key driver for outsourcing decisions. The first hypothesis
states: Cost is the primary driver of the decision to outsource. The study fails to reject this
hypothesis.
Cost is one of the main drivers for outsourcing decisions but it is not so for every company.
Hypothesis 2
Outsourcing is a tool used to improve company performance. The study analyzed the
financial effects of outsourcing on selected firms.
The second hypothesis sates: Company performance improves as a result of outsourcing
64.52% of the companies showed an improvement in return of assets three years after
outsourcing and 61.29% showed an increase in profitability ratio. However, only 45.16% of
the companies revealed an improvement in return of equity ratio. Improvement in firm
performance as a result of outsourcing is not statistically significant.
Hypothesis 3
There is a positive association between the value of the outsourcing deal and the growth in
the profitability ratio. Approximately 14.2% of the variation in the profitability growth rate is
explained by the value of the outsourcing deal. About 22.84% of the variation in the
profitability growth rate is explained by the value of the outsourcing deal and about 32.01%
of the variation of the ROE growth rate is explained by the value of the outsourcing deal. It is
to be noted that not all variation can be explained by the fitted model.
The third hypothesis was stated as follows: The extent to which firm’s performance
improves as a result of outsourcing increases as the value of the outsourcing deal
increases. The hypothesis is therefore satisfied as noted by the above statements.
It is fairly reasonable to determine the relationship between improvement in financial
performance and the value of the outsourcing deal. However it will be prudent to use a
larger sample size.
Page 69
64
Hypothesis 4
There are many reasons that lead to the failure of an outsourcing contract. The study
revealed that these reasons are linked to the outsourcing process. A commitment to and
investment in the outsourcing relationship is statistically positively associated with achieving
greater quality (r= 0.656, p= 0.015). The critical activities conducted during the transition
phase are positively associated with improvement in quality (r= 0.661, p=0.014) with 43.69%
variability. These results were supported by the findings from the case studies. The major
cause of failure for outsourcing relationship was the lack of investment in the outsourcing
relationship. This is closely followed by; the failure to meet transition targets due to a poor
transition plan; a poorly negotiated contract and failure to meet service level agreements.
From the analysis, commitment to the relationship and a well structured transition plan are
vital to the success of any outsourcing initiative.
The fourth hypothesis was stated as follows: success of an outsourcing project is related to
the critical activities that must be performed during the different outsourcing phases.
Findings from the correlation and the cases defend the above hypothesis. The outsourcing
process therefore does matter.
6.2 REVISED SCORECARD
The purpose of the scorecard is to ensure that the activities critical to the outsourcing
process have been performed. The revised score card has been attached to Appendix D.
6.3 OUTSOURCING FRAMEWORK
From the above results and a thorough analysis of the outsourcing process and its effects
an outsourcing framework to assist managers in making the correct outsourcing decisions
has been devised. The framework has been attached to Appendix E.
The framework has been divided into three sections.
The first section is the outsourcing life-cycle. At the different phases, the critical activities
have been identified.
At the centre of the outsourcing project is the outsourcing team with top management
directing the project. This highlights the need for a strong governance structure to guide
both the project and the outsourcing relationship.
Page 70
65
The third section is the expected outcome to be received from a successful outsourcing
project. Improvement the following areas; cost, innovation, flexibility and quality is to be
expected if outsourcing to done correctly.
The framework has the following advantages:
The framework list activities critical to the success of an outsourcing project
The framework list techniques applicable to each phase to assist management in
process evaluation
The framework puts an emphasis on the importance of management
commitment and relationship management
The framework highlights the importance of business strategy to drive and lead
the outsourcing strategy
The outcomes provide a set of performance measure to which the effectiveness
of the outsourcing project can be measured against.
The ability for the framework to produce positive results has been validated from the
analysis in chapter four.
6.4 CONCLUSION
Outsourcing is a tool that if used correctly by management can help the firm improve its
performance. However, the question that states: will outsourcing improve the firm
performance now and in the future is not a definite yes.
Many factors affect the outcome of any outsourcing initiative. It is therefore important to
ensure that a correct structured procedure is performed. Key factors that influence the
success of an outsourcing project include; the understanding of business objectives, the
development of an effective sourcing strategy, commitment to and investment in the
relationship, a well negotiated and completed contract, well defined and realistic service
levels, a well thought out transition plan, a good governance structure, well established
performance metrics, communication and trust. Many South African companies do not have
structured outsourcing procedures in place. In most of these companies the outsourcing
decision rests on the shoulders of the individual project leaders who would normally be
empowered to make all decisions to ensure a successful (read profitable) conclusion of the
project. The managers of these companies believe that to have to pay somebody full time to
manage the process and have endless meetings and investigations on the reasons for
Page 71
66
outsourcing are counterproductive and reduce the potential gains. It is therefore important to
highlight to these firms the importance of the outsourcing process to the success of the
project.
6.5 MEETINGRESEARCH OBJECTIVES
Outsourcing in practice differs from outsourcing in theory. There are however generic
processes and activities that that are vital to the success of outsourcing. The study
confirmed the need for an outsourcing framework. Many South African companies do not
have structured outsourcing procedures in place and do not take the modern approach to
making outsourcing decisions. The framework was developed from a comprehensive
literature study to address the problem. The framework is based both on research findings
and the literature survey. The framework addresses all areas of the outsourcing process and
the critical activities.
The scorecard was successfully developed according to research findings. The framework
when used along with the self-assessment scorecard should provide management with a
powerful tool to which successful outsourcing decisions can be made.
The report achieves its purpose of serving as an enabling tool for IMPERIAL Logistics to
educate its current customers and future customers on the effects of outsourcing and the
importance of the outsourcing process. This has been achieved by proving the hypothesis
derived in chapter three and the comprehensive literature review on the outsourcing process
and the impact of outsourcing on firm performance. The study achieved its aim of proving
that outsourcing is a powerful tool that can be used to achieve greater business
performance.
6.6 RECOMMENDATIONS FOR FUTUER RESEARCH
Factors that influence the outcome of outsourcing performance are highly debatable. Many
authors have failed to find direct relationships between performance measure and
outsourcing. Outsourcing in theory and in practice is very different. Performing a study on a
successful profitable business and learning what they are doing to be profitable is a way in
which one can find out if some processes that the firm follow flies in the face of the
theoretically proposed actions.
Page 72
67
BIBLIOGRAPHY
1. Adkins, S. 2005. Outsourcing Performance Management. Media Tec Publishing.
2. Anonymous. 2010. Six key success factors of outsourcing. IT Business Edge and Allied
Digital
Services.[Online].Available:<www.ukrcham.ch.docs/Six_Key_Sucess_Factors_for_Outsourc
ing.pdf>
3. Anonymous. 2004. Outsourcing performance management. Business week. [Online].
Available: <www.Businessweek.com> [Accessed 21August 2011]
4. Anonymous. 1998. The Outsourcing Institute’s annual survey of outsourcing end users.
[Online].Available:<www.outsourcing.com/content.asp?page=01b/articles/intellegence/oi_to
p_ten_survey.html> [Accessed 1 June 2011].
5. Anonymous. 1996. Structural cybernetics: how to build healthy organizations. [Online].
Available: <www.ndma.com/products/out.html> [Accessed 1 June 2011].
6. Aron, R., & Singh, J.V. 2005. Getting off-shoring right. Harvard Business Review, 135-144
7. Barry, J. & White, R. 1996. The outsourcing manual. Gower Publishing Limited, Hampshire.
8. Barthelemy, J. 2003. The seven Deadly Sins of Outsourcing. The Academy of Management
Executive, 17(2): 87-100.
9. Bilderbeek, P. 2011. Operational development models: From in-house to BPO. [Online],
Available: <www.bilderbeekconsulting.com/2011/09/operational-development-models-from-
in-house-t0-bpo/> [Accessed 3 June 2011].
10. Benbasat, L., Goldstein, K.D., & Mead, M. 1987. The case study research strategy in
studies of information systems. MIS Quarterly, 369-384.
11. Bergmann, F. 2005. Translation Workflow, Make or Buy? [Online]. Available:
<http://www.project-open.com> [Accesses 21 August 2011].
12. Brown, D. & Wilson, S. 2005. The Black Book Of Outsourcing. John Wiley & Sons, Inc: New
Jersey.
13. Bozarth, C., McDermott, C. 1998. Configurations in manufacturing strategy: A review and
directions for future research. Journal of Operations Management, 16(4), 427-439
14. Bustinza, O.F., Arias-Aranda, D., Gutierreez. 2010. Outsourcing, competitive capabilities
and performance: an empirical study in service firms. International Journal of Production
Economics, 126(2): 276-288.
15. Casale, F. 2004. The sixth annual outsourcing index: buyers ready to spend. Outsourcing
essentials, 1(4).
Page 73
68
16. Chronis, T.2004 . A structured approach to vendor selection initiative. LiquidHub.
17. Corbett, M.F. 2004. The outsourcing revolution: Why it makes sense and how to do it right.
Dearborn Trade Publishing, Chicago
18. Cullen, S., Seddon, P., & Willcocks. 2005. Managing Outsourcing: The life Cycle Imperative.
MIS Quarterly Executive, 229-246
19. Diaz-Mora, C. 2008. What factors determine the outsourcing intensity? A dynamic panel
data approach for manufacturing industries. Applied Economics, 40(19): 2509-2521.
20. Duening, N. 2005. Essentials Of Business Process Outsourcing. John Wiley & Sons:
Hoboken N.J
21. Embleton, R., & Wright. 1998. A practical guide to successful outsourcing. Empowerment in
Organizations, 6(3): 94-106.
22. Eriksson, T., & Hatonen, J. 2009. 30+ years of research and practice of outsourcing-
Exploring the past and anticipating the future. Journal of International Management, 15:
142:155.
23. Everett, J., & Dixson, J. 2006. Determining competencies and managing vendors [Online].
Available: <http://www.think180.com> [Accessed 12 August 2011].
24. Gamble, R. 2003. Buyers ready to spend. Outsourcing essentials, 1(4).
25. Gilley, K., & Rasheed, A. 2000. Making more by doing less: An analysis of outsourcing and
its effects on firm performance. Journal of Management, 26(4): 763:790.
26. Griessel, D.L. 1998. Critical success factors for outsourcing. University of Witwatersrand.
27. Goolsby, K. 2009. Best practices for risk mitigation in outsourcing transitions [Online].
Available: <http://www.outsourcing-center.com> [Accessed 21 August 2011].
28. Gottfredson, M., Puryear, R., Phillips. 2005. Strategic sourcing: from periphery to the core.
Harvard Business Review, 83(2), 132-139.
29. Halvery, J., & Melby, B. 1996. Information technology outsourcing: Process, strategies and
contracts. John Wiley & Sons, New York.
30. Handfield, R. 2006. A brief history of outsourcing. [Online]. Available:
<www.scm.ncsu.edu/scm-articles/article/a-brief-history-of-outsourcing> [Accesses 3 June
2011].
31. Handley, S.M., & Benton W.C. 2009. Unlocking the business outsourcing process model.
Journal of operations Management, 27(5): 344-361.
32. Hays, D.C., Hunton, J.E., Reck, J.L. 2000. Information systems outsourcing
announcements: Investigating the impact on the market value of contract-granting firms.
Journal of Information Systems, 14(2): 109-125.
Page 74
69
33. Hewat, A. 2010. Outsourcing: What is it and what are the options. Lodestar.[Online].
Available: <lodestar.net.au> [Accesses 27 July 2011]
34. Hill, S. 1994. Logistics takes a new road. Manufacturing Systems: 28-32
35. Hindle, T. 2008. Core Competence. The Economic Guide to Management Ideas and Gurus
[Online]. Available: <http://www.economist.com> [Accessed 26 July 2011].
36. Hogwood, B., & Gunn, L. 1984. Policy analysis for the real world. Oxford: Oxford University
Press.
37. Hook, L.2003.Strategic outsourcing for competitive advantage. Kairos Group International.
[Online]. Available: <www.kairosgroup.com/webnew.htm>
38. Jennings, D. 1997. Strategic guidelines for outsourcing decisions. The Journal of Strategic
Change, 6: 85-96.
39. Jiang, B., Frazier, G., & Prater, E. 2006. Outsourcing effects on firms’ performance.
International Journal of Operations & Production Management, 26(12): 1280-1300.
40. Jiang, B., & Qureshi, A. 2005. Research on outsourcing results: Current literature and future
opportunities. Management Decision, 44(1): 44-55.
41. Jones, D., 1993. Costs are as well as benefits from outsourcing. Financial Technology
International Bulletin, 10(10), 5-6.
42. Kern, Y., & Willcocks, L.P (2001). The relationship advantage: Informantion technologies,
sourcing, and management. Oxford, Oxford University Press.
43. Khalfan, A. 2003. A case study analysis of business process outsourcing projecy failure
profilr and implementation problem in a large organization of a developing nation. Business
Process Management, 9(6): 745-759.
44. Kroes, R. & Ghosh, S. 2010. Outsourcing congruence with competitive priorities: Impact on
supply chain and firm performance. Journal of Operations Management, 28: 124-143.
45. Lackow, H.M. 2001. IT outsourcing trends. New York: The conference Board.
46. Leidner, D.E., & Jarvenpaa, S.L. 1993. The information age confronts education: case
studies on electronic classrooms. Information Systems Research, 4(1): 24-54.
47. Leinfuss, E. 2004. Why management, management, and more management are the key to
successful outsourcing partnerships. Outsourcing essentials, 2(2).
48. Leonard-Barton, D. 1992. Core capabilities and core rigidities: a paradox in managing new
product development. Strategic Management Journal, 13(8): 11-125.
49. Lieb, R.C. 1992. The use of third-party logistics services by large American manufactures.
Journal of Business Logistics, 13(2): 29:42.
50. Linda, R. 2006. The Mangers Step-By-Step Guide to Outsourcing. McGraw Hill: New York
Page 75
70
51. Loh, L., Venkatraman, N. 1992. Determinants of information technology outsourcingL A
cross-sectional analysis. Journal of Management Information Systems, 9(1), 7-24.
52. Marshall, D., Lamming, R., Fynes, B., & Burca, S. 2005. The development of an outsourcing
process model. International Journal of Logistics Research and Applications, 8(4): 347-359.
53. Mehrban, M. 2009. Outsourcing arrangements in the current market. [Online]. Available:
<www.financerworldeide.com/article.php?id=3824> [Accessed 21 August 2011].
54. Mclvor, R., Humpherys, K., Wall, P. & MCKIHRICK, A. 2009. A study of performance
measurement in the outsourcing decision. Research executive summaries series, 4(3):1-13.
55. Mclvor, R. 2008. What is the right outsourcing strategy for your process?. European
Management Journal, 26: 25-35.
56. Mclvor, R. 2000. A practical framework for understanding the outsourcing process. Supply
Chain Management: An International Journal, 5(1): 22-36.
57. Menard, S. 2010. Logistic Regression: From Introductory to Advance Concepts and
Applications. SAGE Publications: USA.
58. Micheal, J. 2007. Outsourcing: Design, Process and Performance. Cambridge press::
Cambridge Uk
59. Miles, J., & Shevlin, M.2001. Applying Regression and Correlation. Athenaeum Press:
Gateshead UK
60. Narasimhan, R., Das, A. 1999. An empirical investigation of the contribution of strategic
sourcing to manufacturing flexibilities and performance. Decision Sciences, 30(3): 683.
61. Patel, A. B. 2005. Outsourcing Success The Management Imperative. PALGRAVE
MACMILLIAN: New York.
62. Porter, M.E. 1985. Competitive advantage. Free Press, New York.
63. Quinn, J.B., & Hilmer, F.G. 1994. Strategic outsourcing. Sloan Management Review, 43-55.
64. Rottman, J., & Lacity, M. 2004. Proven Practices of IT Offshore Outsourcing. Cutter
Consortium, 5(12): 1-27.
65. Rutherford, A. 2001. Introducing ANOVA and ANCOVA a GLM Approach. Athenaeum
Press: Gateshead UK.
66. Sampath, N., & Mavle, A. 2010. Transition best practices [Online]. Available:
<http://www.Infosys.com> [Accessed 24 August 2011]
67. Santos, A., & Reynaldo, J. 1999. Cronhach’s Alpha: A tool for assessing the reliability of
scales. Journal of Extension, 37(2)
Page 76
71
68. Sung, K., & Young, S.C. 2003. Critical success factors for IS outsourcing: Implementation
from an inter-organizational relationship perspective. Proceedings of the 11th European
Conference on Information Systems, Naples, Italy, 16-21
69. Thakur, P., & Farok. 2008. Impact of offshoring and outsourcing of core activities on
performance: An examination of clinical trials. Rutgers University.
70. Yalaho, A., Narhar, N., Kakola, T., & Wu, C. 2002. A conceptual process famework for IT-
supported international outsourcing of software production. Proceedings of the IEEE EEE05
International Workshop on Business Services Networks BSN’05, Hong Kong, 3-13.
71. Yasin, O, et al. 2009. Impacts of information technology (IT) outsourcing on organizational
performance: A firm level empirical analysis. Fairfield University.
Page 77
72
APPENDIX A: Example of A outsourcing Decision-Making Scorecard
Institutional Setting
1. Is this a functional part of our core competence? Yes No
2. Does this service need to be provided on a continual basis? Yes No
3. Do we have in-house expertise to provide this service? Yes No
4. Do we have available staff to provide this service? Yes No
5. Can we legally outsource this service? Yes No
Risk
1. Would loss of content of this service harm the organization? Yes No
2. Would loss of expertise have a negative impact? Yes No
3. Is the quality of service delivery a concern? Yes No
4. Would the response time to situational problems be reduced? Yes No
5. Would current contract performance be negatively impacted? Yes No
Goals and Objectives
1. Can the goals of the service be clearly defined? Yes No
2. Are the goals for this service long-term? Yes No
3. Can the achievements of these goals be objectively measured? Yes No
4. Are the objectives measures currently in place for the service? Yes No
5. If the goals and objectives are not achieved, will this have a
Negative impact upon the company Yes No
Provider evaluation
1. Are there known external providers for this service? Yes No
2. Do the missions and strategic goals of the providers align with Yes No
our company’s mission and strategic goals? Yes No
3. Are the providers known to have the capacity to provide this service? Yes No
4. Has the company had previous relationships with providers of the service? Yes No
5. Are the providers known to deliver high quality services? Yes No
Source: Brown and Wilson. 2005. The Black Book of Outsourcing
Page 78
73
APPENDIX B
QUESTIONNAIRE
PURPOSE
The purpose of the questionnaire is to determine what factors drive the outsourcing process and
if there is a link between the management practices of the outsourcing process and the
performance of the firm. The questionnaire may need to be filled in by more than one person in
the industry as it contains different aspects of the outsourcing process.
INTERVIEWEE DETAILS
ROLE IN COMPANY:
YEARS OF EXPERIENCE:
LEVEL:
COMPANY DETAILS
SIZE (NUMBER OF EMPLOYEES):
POSITION IN INDUSTRY:
INDUSTRY TYPE:
SECTOR IN INDUSTRY:
Page 79
74
STATISTICAL ANALYSIS
What function/s does your company outsource?
Weight the following factors according to the influence it has on the outsourcing
decision relative to the other factors (1=low, 9=high) (removed from study as many
companies did not answer the question correctly).
FACTOR 1 2 3 4 5 6 7
Uncertainty 1
Loss of control 2
Loss of core competencies 3
Employee unhappiness 4
Difficulty in reversing 5
Risk of failure 6
Fear of losing control 7
Weight the factors that encourage your decision to outsource? (1=low, 5=high)
FACTOR RANK
Accelerate reengineering benefits
Access to world class capabilities
Reduce cost
Improve performance
Focus on core competencies
Function too difficult to manage or out of control
Reduce risk
Make capital funds available
Page 80
75
SELF-ASSESSMENT SCORECARD
THE OUTSOURCING PROCESS
Strategy: establishing goals and objective YES NO
The current approach to outsourcing is strategic
Is there a structured process for indentifying outsourcing opportunities
Objectives and goals were determined to drive the strategy
Care was taken to ensure that the strategy was in line with corporate objectives
The strategy was developed around the core competency
Techniques on how to measure the achievement of these goals were established
Benchmarks/models were used to establish goals
Present and future requirements of customer needs were understood
Core competencies YES NO
All core and non-core activities were identified by the evaluation team
All core competences were assessed for potential improvement of performance
The team understood the capabilities of the core activities
Care was taken to consider capabilities that might be important in the future
there suppliers that could perform some core function better but we still did not outsource
Contributions to the competitive advantage of each core activity was understood
The functions outsourced are not considered critical to the success of the business
The company only outsources non-core functions
Care was taken to ensure that the outsourcing decision was consistent to the overall corporations competitive and operations strategy.
The extent to which the outsourcing decision will impact the future strategic options and or alternatives was fully evaluated
Page 81
76
RISK YES NO
There a structured risk management process
All risk of outsourcing were identified
The impact the risk will have on our customers was evaluated
The potential negative consequence of losing our internally capabilities to perform and hollowing out was considered
The evaluation team evaluated the risk to our intellectual property
The risk for opportunism from vendors was considered
The risk of external supplier shrinking in their responsibilities was considered
A mitigation strategy for each risk established
CRAFTING THE DEAL (design of the contract) YES NO
A systematic approach to identifying and selecting the right vendor for the project was conducted
A vendor selection and contractual team were established
All customer service requirements were determined
The long-term strategic interest of the buyer and vendor were taken under consideration
Service and performance levels were clearly stated in the contact
The contract contains a well defined penalty clause and performance rewards and benefits
The contract included clauses intended to make switching or re-internalizing the activity easier should the relationship fail.
The contract clearly defined a dispute resolution process
Page 82
77
RELATIONSHIP YES NO
We have a long-term commitment to the relationship
The supplier provides superior performance and cannot be replaced
The relationship with our supplier is viewed as a partnership
Senior management seeks to develop a relationship with the provider and their management team
There is a sharing of risk and benefits
We make investments that are unique to our relationship with the provider
We share detailed and valued information with our provider to enable them to improve their planning and operations
There is frequent communication
Joint continuous and collaborative improvement efforts are conducted
The provider is heavily involved in new product and service development
We involve the supplier in our strategic planning process
Dispute resolution is open and constructive
TRANSITION YES NO
Employees and personnel were informed about the outsourcing decision in advance
The project had full support from the employees affected
A transition/implementation team was established to conduct the process
A timeline for all outsourcing activities was developed (meetings, deadlines, employee transition)
The timeline was distributed to all employees involved
A detailed transition plan with details of all functions that must be performed to accomplish successful transition was constructed
A step-by-step procedure on how to handle every task associated with the outsourcing process was included in the transition plan document
Employees transition and separation plan was taken into consideration
The impact on non-outsourced functions was taken into consideration
A transition check list was developed that included all items in the transition plan
MANAGEMENT YES NO
A post-outsourcing review was constructed
A review of pre and post outsourcing cost was measured
An Evaluation of supplier performance was conducted
Performance measurement techniques of the impact of the outsourcing decision were established
Page 83
78
OUTSOURCING EXPECTATIONS AND PERFORMANCE
OUTSOURCING PERFORMANCE YES NO
Has exceed or met expectations of total annual cost
Has exceeded of met expectations of quality performance
Has exceeded of met expectations of flexibility
Has exceeded of met expectations of reliability
Listed below are several dimensions that companies use to assess competitive advantage.
Please rate each item according to the effect that outsourcing has had on the item during the
past three years. (1- Great negative impact, 2- partial negative impact, 3- unchanged, 4- partial
improvement, 5- great improvement)
MEASURE EXTENT OF EFFECT
Cost
Labour productivity
Inventory cost
Capacity utilization
Production/manufacturing costs
Innovation
Number of innovations
Differentiation from competitors’ product technology
Expenditure on research and development
Flexibility
Ability to adjust capacity and/or volume
Ability to customize products/services to meet customer specifications
Number of product/service features or options
Quality
Product/service performance
Reliability of product/service
Resolution of customer complaints
Product durability
Other
Market share
Access to people with experience
Freed up resources for other purposes
Focus on core business activities
Skills acquired from other companies
Page 84
79
APPENDIX C Sample data of outsourcing deals
Savvis Easyjet Airline 300m 2006 5
HP, IBM, Wipro, EDS and Convisnt
General Motors Automobile 7bn 2006 5
EDS Rolls Royce Automotive 1.7bn 2000 10
IBM Deutsche Bank Banking $2.5bn 2002 10
Accenture Barclays Banking 648m 2004 6
IBM Lloyds Banking Group Banking 810m 2004 7
HP Bank or Ireland Banking 600m 2003 5
TCS Nielsen consulting 1.2bn 2007 10
IBM Unilever Consumer products
1.6bn 2005 10
Xerox SBS BBC Technologies Entertainment and leisure
3.7bn 2004 10
IBM West Pac Banking Finance 2.3bn 2000 10
CSC Old Mutual Financial services
275m 2005 7
IBM TD Banking Group Financial services
720m 2003 7
EDS Bank of America Financial services
700m 2006 6
Vendor Company Industry Amount US$
Year Period
CSC Newport Mining Co. Mining 180m 2006 7
IBM Hess Operations Oil company 7.3m 2007 5.5
Accenture Sainsbury Retail 1.9bn 2000 10
Computacenter Marks and Spenser Retail 19m 2007 3
Cable & Wireless Morrisons Retail 110m 2007 3
Xansa Tesco Retail 18m 2007 3
Xansa Boots Retail 90m 2002 7
TCS, Wipro Target Retail 400m 2008
IBM American express Service $4bn 2002 7
BT Unisys Technology 190m 2007 6
IBM Vodafone Telcom 600m 2007 5
IBM Nokia Telcom 360m 2004 5
IBM Telstra Telcom 1.1bn 2006 6
Nokia (NSN) Bharti Airtel Telcom 400m 2006 3
CSC Motorola Telcom 1.6bn 2003 10
Xerox Siemens Telcom 78m 2001 5
Accenture British Telcom Telcom 548m 2005 10
CSC Nortel Networks Telcom 3bn 2000 10
IBM Ericsson Telcom 78m 2003 5
Page 85
80
APPENDIX D
THE SCORECARD
STRATEGY EVALUATION Yes No
The outsourcing team structure has been developed with executive management driving the process
Corporate objectives have been understood
The sourcing strategy is in line with the overall corporate strategy
Techniques on how to measure the achievement of the outsourcing goals have been established
Sufficient time had been allocated to the benchmarking of goals and objectives
CORE COMPETENCIES EVALUATION Yes No
All core and non-core activities have been identified
All core and value adding activities have been assessed for potential improvement
Contribution to the competitive advantage of each core activity has been understood
Benchmarks/models were used to establish goals
Care was taken to ensure that the outsourcing decision was consistent with the overall corporation’s competitive and operations strategy
CRAFTING THE DEAL Yes No
All customer service requirements have been determined
The long-term strategic interest of the buyer and vendor were taken under consideration
Service and performance levels have been clearly stated in the contact
The contract contains a well defined penalty clause, flexibility clause, benchmarking clause, termination clause and performance rewards and benefits
The contract clearly defines a dispute resolution process
RELATIONSHIP EVALUATION Yes No
Investments made are unique to the relationship with the provider
Detailed and valued information is shared with the provider to enable them to improve their planning and operations
There is regular communication and meetings
Joint continuous and collaborative improvement efforts are conducted
Dispute resolution is open and constructive
Page 86
81
TRANSISITION Yes No
The project had full support from the employees affected
A timeline for all outsourcing activities was developed (meetings, deadlines, employee transition) and has been met
A detailed transition plan with details of all task that must be performed to accomplish successful transition has been constructed
Impact on non-outsourced functions has been taken into consideration
Management support, Change management and Resource allocation have been considered and care taken to ensure all factors have been performed effectively
MANAGEMENT Yes No
Performance measurement techniques to assess the impact of outsourcing decisions were established
Constructive post outsourcing review has been established
A risk management plan that includes; risk identification, planning, mitigation, risk tracking and control has been drawn
Allowance for sufficient benchmarking of supplier performance and pricing
Detailed documentation and administration
Page 87
82
APPENDIX E
THE OUTSOURCING FRAMEWORK
Strategic Leader Ship
Steering Team
Analysis teamVendor selection
team
Implementation
team
Relationship
Management
Transition
and change
Development of
evaluation method and
performance criteria
Gather information/
request for proposal
Short listing and
evaluation
Selection
Contract development
Negotiation
TECHNIQUES
Scorecard
Decision making matrix/AHP
Benchmarking
SUCCESS FACTORS
Contract completeness
Quality of performance criteria
Internal analysis
Identification and
evaluation of core
competencies
Capability analysis
Understanding
competitive advantage
Evaluation of value chain
Vendor survey and
relationship analysis
Risk analysis
TECHNIQUES
Scorecard
Decision making Matrix/AHP
Multi decision making criteria
Benchmarking
SUCCESS FACTORS
Effective strategy
Through internal analysis
Development of transition
plan
Transition checklist
Communication plan
Addressing of all internal
issues
Transition methodology
Implementation
TECHNIQUES
SMART transition methodology
SUCCESS FACTORS
Smoothness of transition
Completeness of transition
checklist
Adherence to transition plan
Employee support
Level of organization and control
DECISION MAKING
PHASE
SELETION AND
NEGOTIATIONTRANSITION PHASE
MANAGEMENT
PHASE
Business Stragtegy Sourcing Strategy
Outcomes
Measure and monitor
performance
Manage relationship
Evaluate relationship
Manage risk
Manage performance
TECHNIQUES
Performance management
matrix
Benchmarking
SUCCESS FACTORS
Investment in relationship
Level of collaboration/
partnership
Frequency of communication
Construction of Post-
outsourcing reviews
Cost Flexibility QualityInnovation
Reduced inventory cost
Increase in labour productivity
Increase capacity utilization
Reduced production/
manufacturing cost
Increase in ROE
Increase in ROA
Increase in profitability
Increase in number of
innovations
Improvement in product
differentiation
Increase in expenditure on
research and development
Improved ability to adjust
capacity/or volume
Improved ability to customize
products/service to meet
customer specification
Improvement in number of
product/service features or
options
Improved focus on core activites
Improvement in product/service
performance
Improved product reliability
Reduction in customer
complaints
Improved product durability
The outsourcing Life cycle Activities
Co
ntin
uo
us im
pro
ve
me
nt
Initia
tio
n, p
lan
nin
g,
co
ntr
ol a
nd
ma
na
ge
me
nt o
f a
ctivite
s


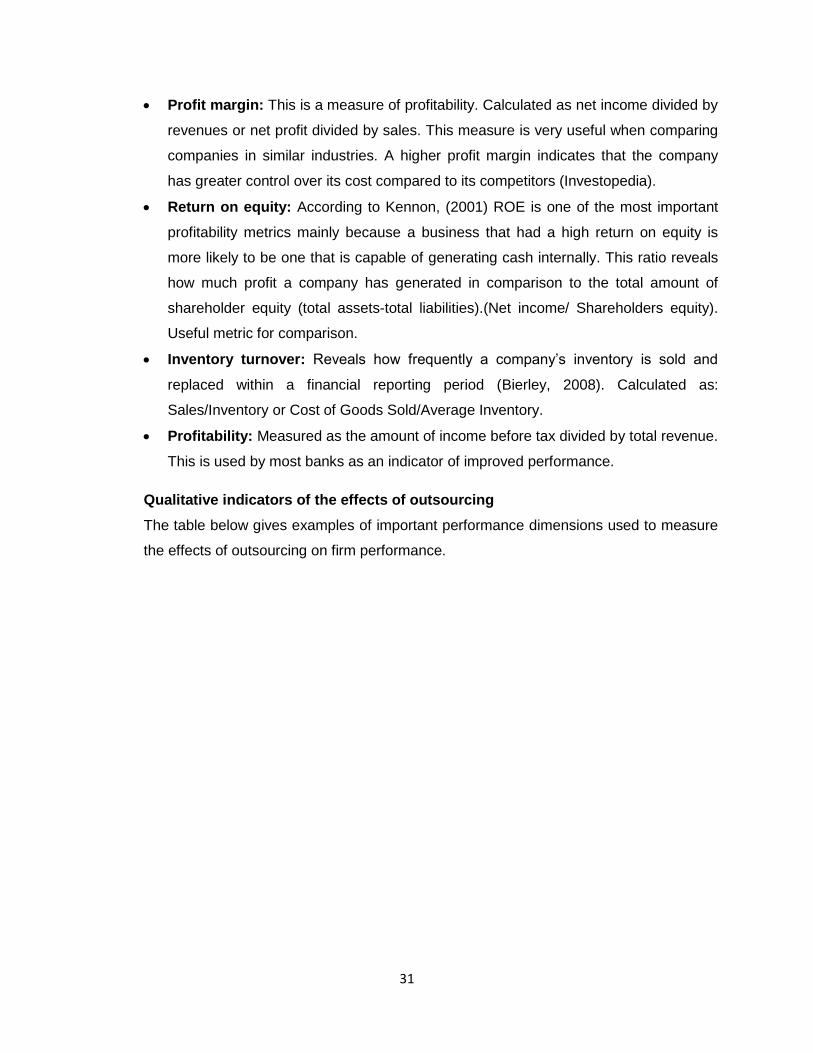


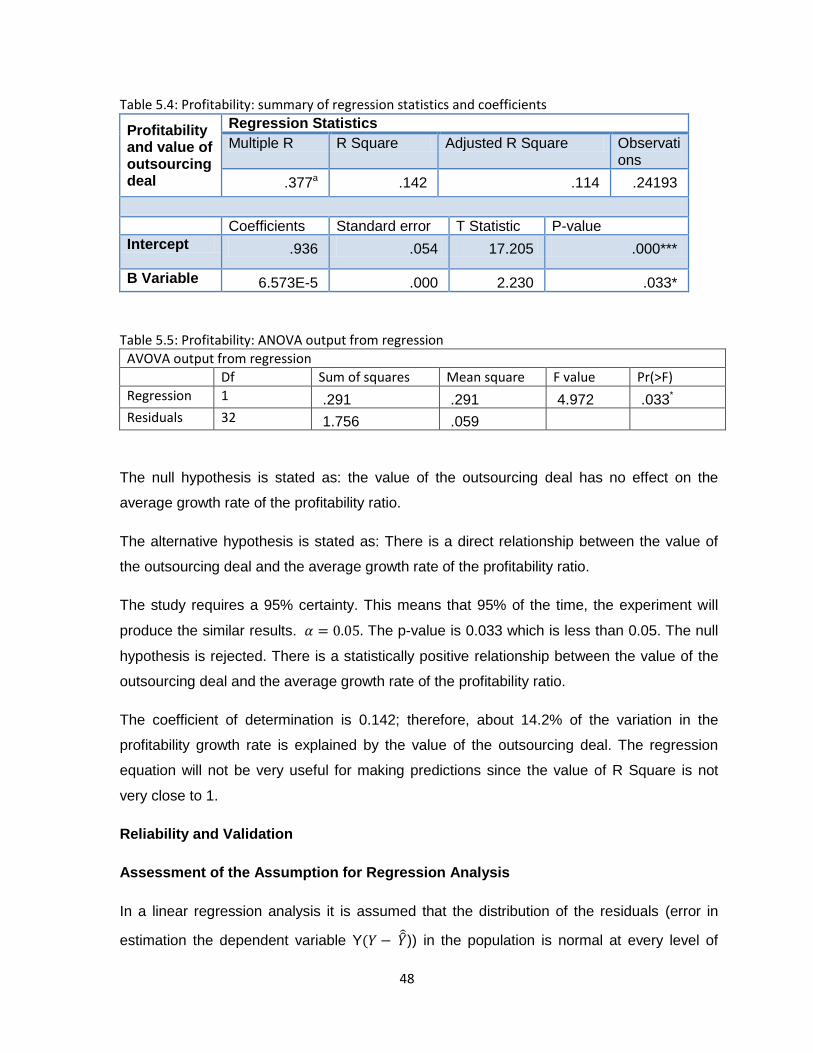


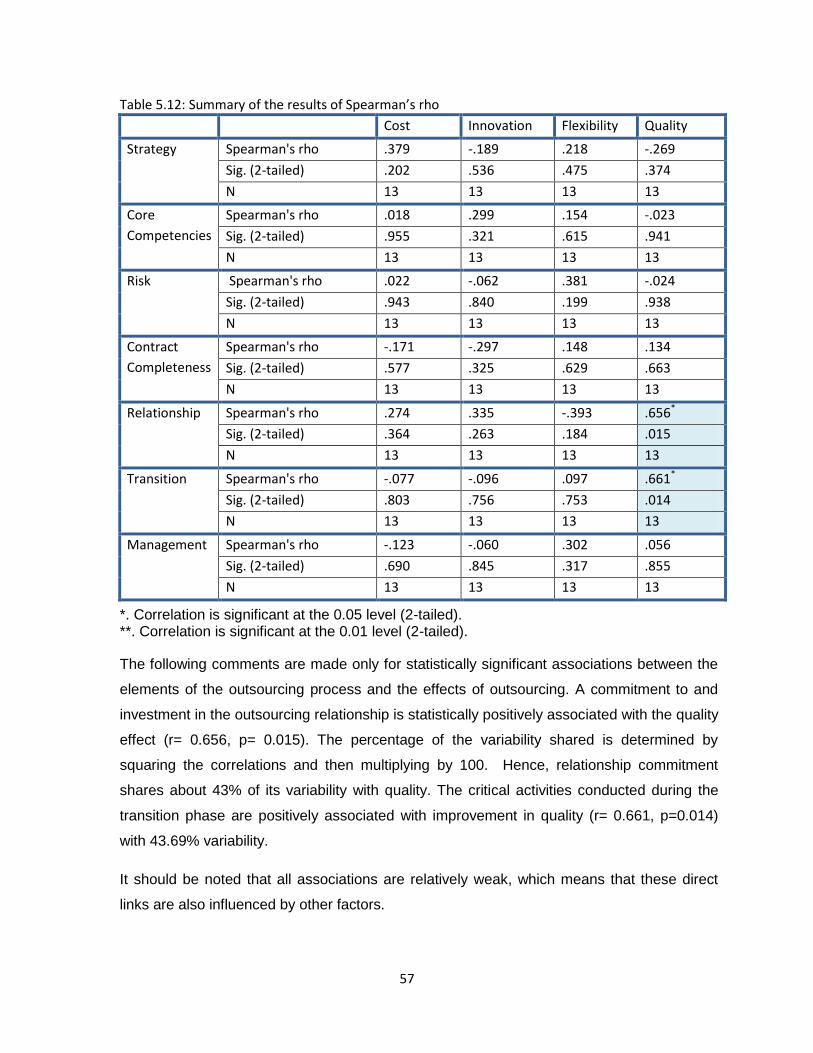


![A Path to Successful IT Outsourcing: Interaction Between ...Goo et al. 2008].pdf · A Path to Successful IT Outsourcing: Interaction Between ... 1988; Mingay & Govekar, 2002; Yadav,](https://static.documents.pub/doc/80x56/5b04f41f7f8b9a8c688e6bb9/a-path-to-successful-it-outsourcing-interaction-between-goo-et-al-2008pdfa.jpg)