FINAL REPORT to the NATIONAL COOPERATIVE HIGHWAY RESEARCH PROGRAM (NCHRP) Project NCHRP 20-07/Task 406 Development of a Framework for Balanced Mix Design Randy West Carolina Rodezno Fabricio Leiva Fan Yin National Center for Asphalt Technology at Auburn University Auburn, AL August 30, 2018 LIMITED USE DOCUMENT This document is furnished only for review by members of the NCHRP project panel and is regarded as fully privileged. Dissemination of information included herein must be approved by the NCHRP
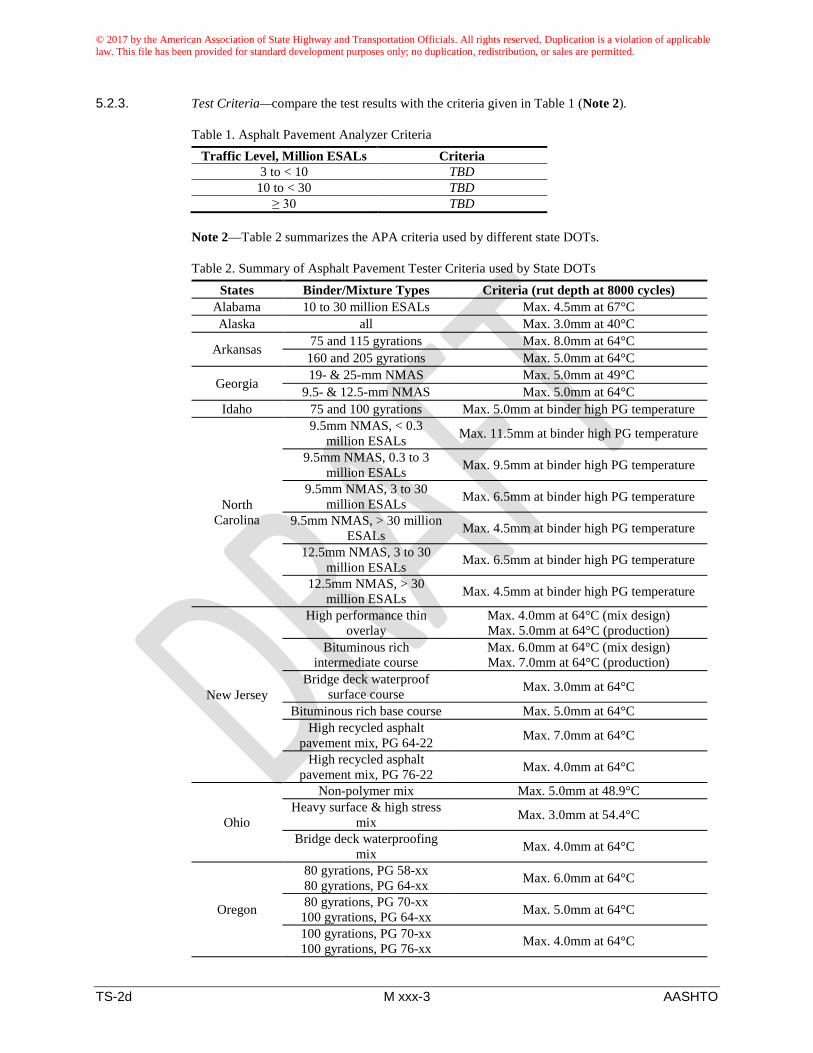
Transcript
FINAL REPORT to the
NATIONAL COOPERATIVE HIGHWAY RESEARCH PROGRAM
(NCHRP)
Project NCHRP 20-07/Task 406
Development of a Framework for Balanced Mix Design
Randy West Carolina Rodezno
Fabricio Leiva Fan Yin
National Center for Asphalt Technology at Auburn University
Auburn, AL
August 30, 2018
LIMITED USE DOCUMENT This document is furnished only for review by members of the NCHRP project panel and is regarded as fully privileged. Dissemination of information included herein must be approved
by the NCHRP
i
Table of Contents Table of Contents ............................................................................................................................. i
List of Figures ................................................................................................................................. iv
List of Tables ................................................................................................................................... v
Survey of State DOTs and Asphalt Contractors ............................................................................................. 4
Introduction .................................................................................................................................................................... 4 Current Practice on Mix Design ...................................................................................................................................... 5 Mixture Performance Testing ......................................................................................................................................... 7
BMD Definition and Approaches .................................................................................................................................. 24 State-of-the-Practice for BMD ................................................................................................................................. 26
California ........................................................................................................................................................... 26 Florida ............................................................................................................................................................... 26 Georgia .............................................................................................................................................................. 27
ii
Illinois ................................................................................................................................................................ 27 Iowa .................................................................................................................................................................. 27 Louisiana ........................................................................................................................................................... 28 Minnesota ......................................................................................................................................................... 28 New Jersey ........................................................................................................................................................ 29 New Mexico ...................................................................................................................................................... 30 Ohio................................................................................................................................................................... 30 Oklahoma .......................................................................................................................................................... 30 South Dakota .................................................................................................................................................... 31 Texas ................................................................................................................................................................. 31 Utah .................................................................................................................................................................. 32 Wisconsin .......................................................................................................................................................... 33
Case Studies .................................................................................................................................................................. 33 Louisiana .................................................................................................................................................................. 33 New Jersey ............................................................................................................................................................... 37 California .................................................................................................................................................................. 37 Texas ........................................................................................................................................................................ 39
Preliminary Draft of AASHTO Standard Practice and Specification for Balanced Mix Design ........................ 60
Preliminary Draft AASHTO Standard Practice ............................................................................................................... 60 Preliminary Draft AASHTO Standard Specification ....................................................................................................... 60
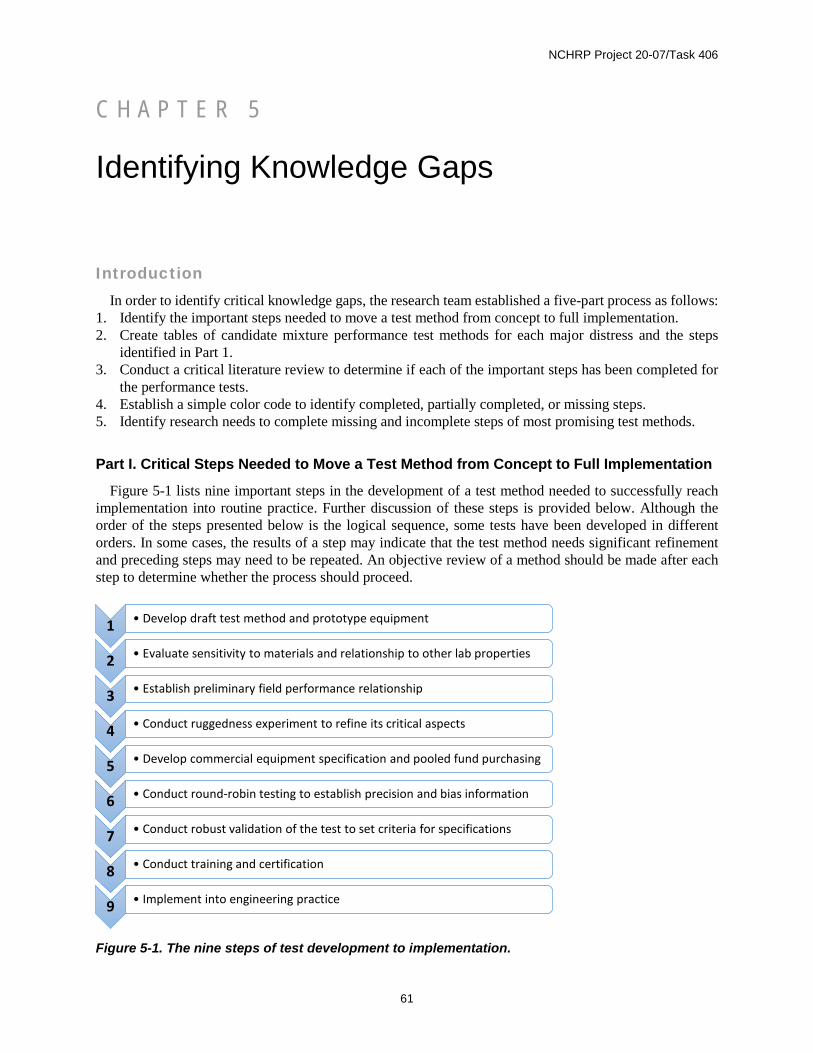
Identifying Knowledge Gaps and Developing Research Needs .................................................................... 61
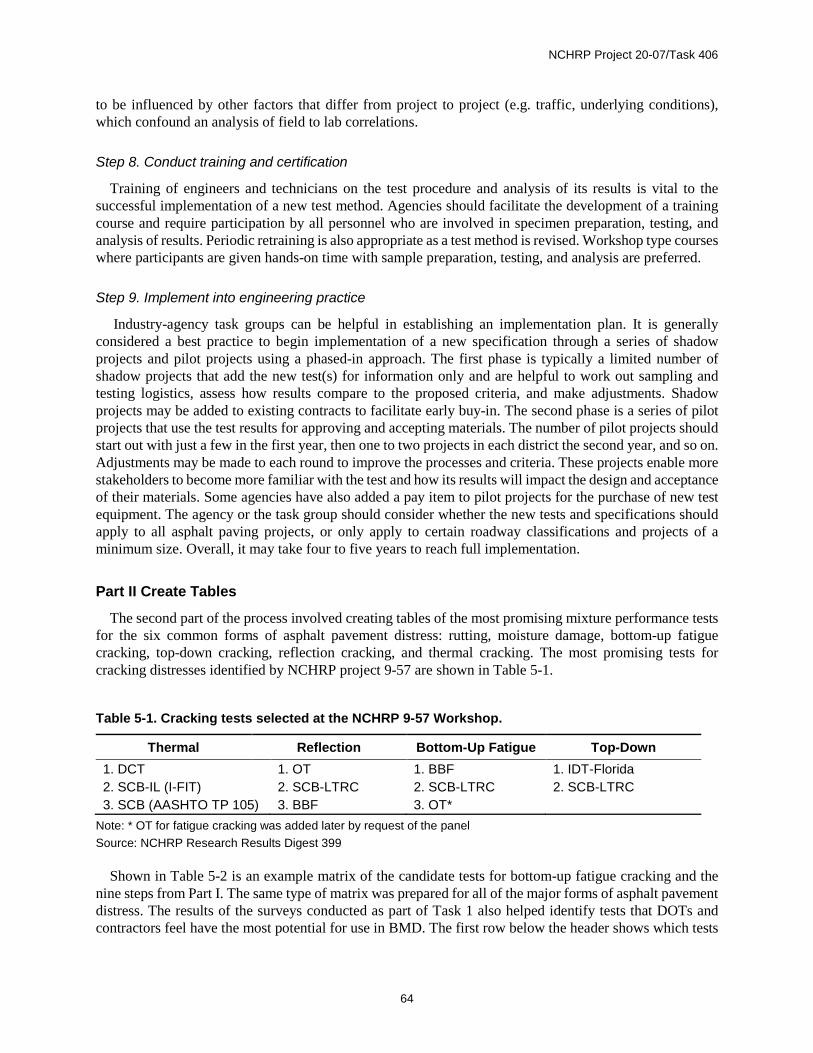
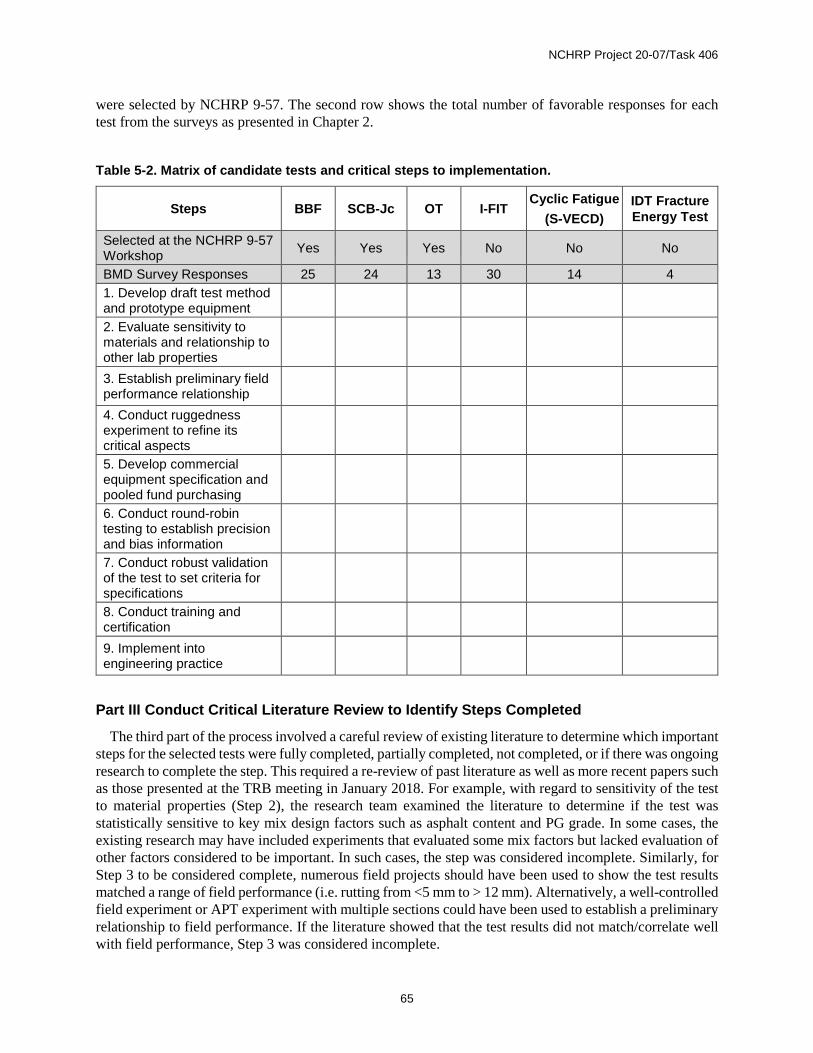
Introduction .................................................................................................................................................................. 61 Part I. Critical Steps Needed to Move a Test Method from Concept to Full Implementation ................................. 61 Part II Create Tables ................................................................................................................................................. 64 Part III Conduct Critical Literature Review to Identify Steps Completed ................................................................. 65 Part IV Establish a Color Code for the Part II Tables to Visually Identify Gaps ......................................................... 66 Part V Identify Research Needs for Incomplete Steps and Steps Yet to Be Addressed ........................................... 66
Appendix A Draft AASHTO Standards for Balanced Mix Design ............................................................................... A-1
Appendix B Proposed Research Statements ........................................................................................................... B-1
Appendix C Summaries of Asphalt Mixture Performance Tests Currently Being Used or Considered for Implementation in the U.S.A. .............................................................................................................. C-1
iv
List of Figures Figure 2-1. U.S. map of state DOTs survey responses. .......................................................... 4 Figure 2-2. State DOT’s specification changes........................................................................ 5 Figure 2-3. U.S. map of current use of BMD approaches. ....................................................... 6 Figure 2-4. Pavement distresses that state DOTs intend to address with performance tests. . 7 Figure 2-5. Pavement distresses that asphalt contractors experienced in their mixes. ........... 8 Figure 2-6. U.S. map of current use of rutting tests. ................................................................ 8 Figure 2-7. Selection of potential rutting tests.......................................................................... 9 Figure 2-8. Selection of potential thermal cracking tests. ...................................................... 10 Figure 2-9. Selection of potential reflection cracking tests. .................................................... 10 Figure 2-10. Selection of potential bottom-up fatigue cracking tests. .................................... 11 Figure 2-11. Selection of potential top-down cracking tests. ................................................. 12 Figure 2-12. U.S. map of current use of moisture damage tests. .......................................... 13 Figure 2-13. Selection of potential moisture damage tests. ................................................... 13 Figure 2-14. U.S. map of current use of performance tests for quality assurance. ................ 14 Figure 2-15. Concerns regarding BMD implementation. ........................................................ 15 Figure 2-16. Practical amount of time to complete a BMD. ................................................... 15 Figure 2-17. Appropriate criteria for deciding the use of BMD. .............................................. 16 Figure 2-18. Levels of importance for BMD related research topics. ..................................... 17 Figure 2-19. U.S. map of state DOTs interested in constructing BMD trial projects. ............. 17 Figure 3-1. Schematic of stability–durability relationship of hot-mix asphalt, illustrating philosophy of selecting design asphalt content. .................................................................. ..24 Figure 3-2. Schematic illustration of three BMD approaches. ................................................ 25 Figure 3-3. Example of performance space diagram (PSD). ................................................. 26 Figure 3-4. Balancing rutting and cracking requirements. ..................................................... 32 Figure 3-5. HWTT test results. ............................................................................................... 34 Figure 3-6. SCB results. ........................................................................................................ 35 Figure 3-7. Balanced mix design analysis for Louisiana mixes.............................................. 35 Figure 3-8. Preliminary guidelines of laboratory performance indicators: (a) rutting, (b) random cracking. ................................................................................................................... 36 Figure 3-9. Illustration of TxDOT’s BMD approach. ............................................................... 40 Figure 3-10. Selection of project-specific OT requirements. .................................................. 41 Figure 5-1. The nine steps of test development to implementation ....................................... 61 Figure 5-2. Color coding scheme for progress of steps to implement a test method ............. 66
v
List of Tables Table 1-1. Commonly used asphalt mixture performance tests. .............................................. 2 Table 2-1. State DOT responses on existing mix design criteria. ............................................ 6 Table 2-2. Asphalt contractor responses on existing mix design criteria. ................................ 7 Table 2-3. Selections of most promising mixture performance tests by state DOTs and asphalt contractors. ............................................................................................................... 18 Table 3-1. Illinois DOT performance test requirements. ........................................................ 27 Table 3-2. Louisiana performance test criteria....................................................................... 28 Table 3-3. DCT fracture energy (Gf) criteria. ......................................................................... 29 Table 3-4. NJDOT performance test requirements. ............................................................... 29 Table 3-5. OKDOT performance test requirements. .............................................................. 30 Table 3-6. SDDOT performance test requirements. .............................................................. 31 Table 3-7. TxDOT performance test requirements. ............................................................... 32 Table 3-8. Performance test requirements for WisDOT pilot projects. ................................... 33 Table 3-9. LADOTD volumetric specifications. ...................................................................... 34 Table 3-10. Pavement rehabilitation structural sections. ....................................................... 38 Table 3-11. Asphalt mix PBSs for Red Bluff project. ............................................................. 39 Table 3-12. Commonly used asphalt mixture performance tests. .......................................... 45 Table 3-13. Summary of advantages and disadvantages of mixture cracking and rutting tests. .............................................................................................................................................. 46 Table 3-14 Popular polymers for asphalt binder modification ................................................ 48 Table 3-15. Studies on the field performance of field test sections with PMA. ...................... 49 Table 5-1. Cracking tests selected at the NCHRP 9-57 Workshop. ....................................... 64 Table 5-2. Matrix of candidate tests and critical steps to implementation. ............................. 65 Table 5-3. Thermal cracking tests and critical steps to implementation.. ............................... 67 Table 5-4. Reflection cracking tests and critical steps to implementation. ............................. 71 Table 5-5. Bottom-up fatigue cracking tests and critical steps to implementation.................. 76 Table 5-6. Top-down cracking tests and critical steps to implementation. ............................. 81 Table 5-7. Rutting tests and critical steps to implementation. ................................................ 86 Table 5-8. Moisture damage tests and critical steps to implementation. ............................... 89 Table 6-1. Estimated costs and suggested schedule for recommended research. ................ 93
1
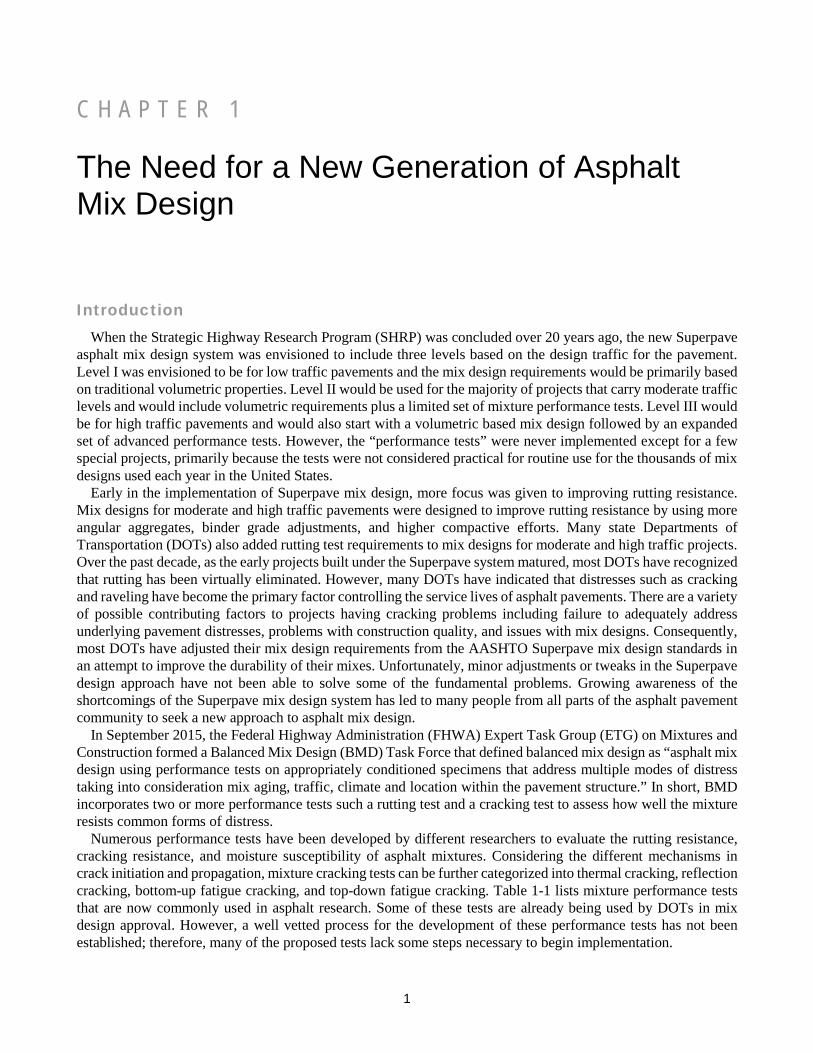
C H A P T E R 1
The Need for a New Generation of Asphalt Mix Design
Introduction When the Strategic Highway Research Program (SHRP) was concluded over 20 years ago, the new Superpave
asphalt mix design system was envisioned to include three levels based on the design traffic for the pavement. Level I was envisioned to be for low traffic pavements and the mix design requirements would be primarily based on traditional volumetric properties. Level II would be used for the majority of projects that carry moderate traffic levels and would include volumetric requirements plus a limited set of mixture performance tests. Level III would be for high traffic pavements and would also start with a volumetric based mix design followed by an expanded set of advanced performance tests. However, the “performance tests” were never implemented except for a few special projects, primarily because the tests were not considered practical for routine use for the thousands of mix designs used each year in the United States.
Early in the implementation of Superpave mix design, more focus was given to improving rutting resistance. Mix designs for moderate and high traffic pavements were designed to improve rutting resistance by using more angular aggregates, binder grade adjustments, and higher compactive efforts. Many state Departments of Transportation (DOTs) also added rutting test requirements to mix designs for moderate and high traffic projects. Over the past decade, as the early projects built under the Superpave system matured, most DOTs have recognized that rutting has been virtually eliminated. However, many DOTs have indicated that distresses such as cracking and raveling have become the primary factor controlling the service lives of asphalt pavements. There are a variety of possible contributing factors to projects having cracking problems including failure to adequately address underlying pavement distresses, problems with construction quality, and issues with mix designs. Consequently, most DOTs have adjusted their mix design requirements from the AASHTO Superpave mix design standards in an attempt to improve the durability of their mixes. Unfortunately, minor adjustments or tweaks in the Superpave design approach have not been able to solve some of the fundamental problems. Growing awareness of the shortcomings of the Superpave mix design system has led to many people from all parts of the asphalt pavement community to seek a new approach to asphalt mix design.
In September 2015, the Federal Highway Administration (FHWA) Expert Task Group (ETG) on Mixtures and Construction formed a Balanced Mix Design (BMD) Task Force that defined balanced mix design as “asphalt mix design using performance tests on appropriately conditioned specimens that address multiple modes of distress taking into consideration mix aging, traffic, climate and location within the pavement structure.” In short, BMD incorporates two or more performance tests such a rutting test and a cracking test to assess how well the mixture resists common forms of distress.
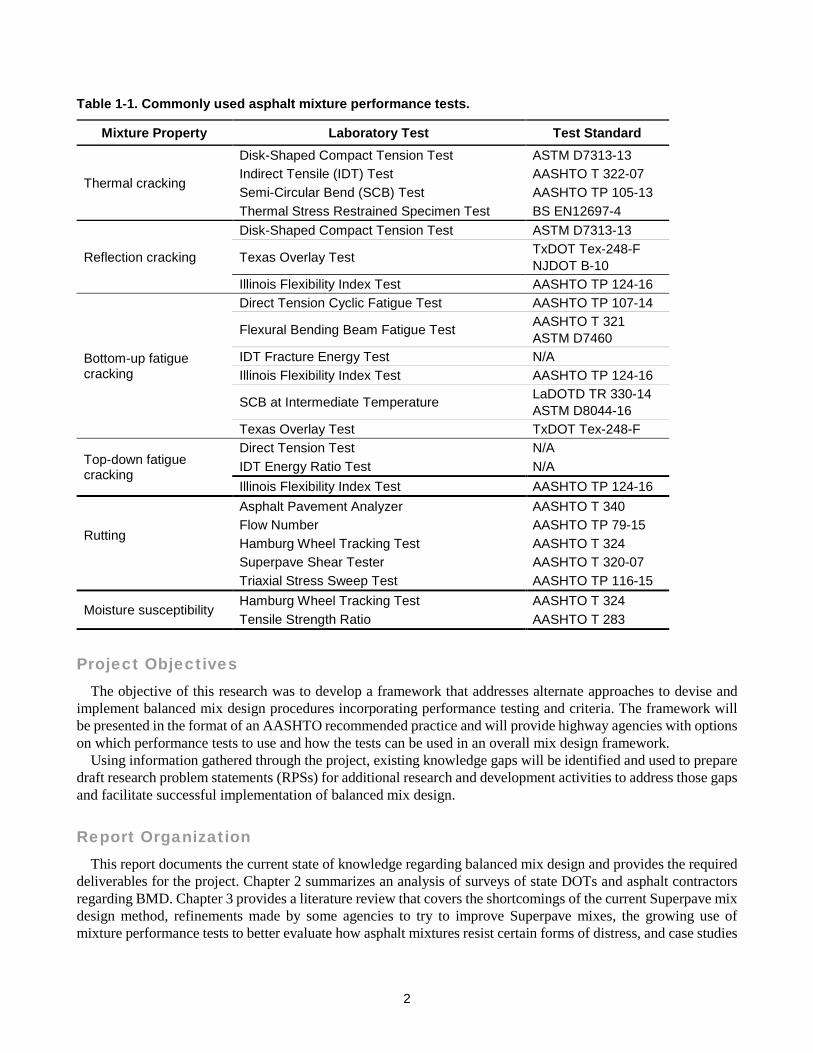
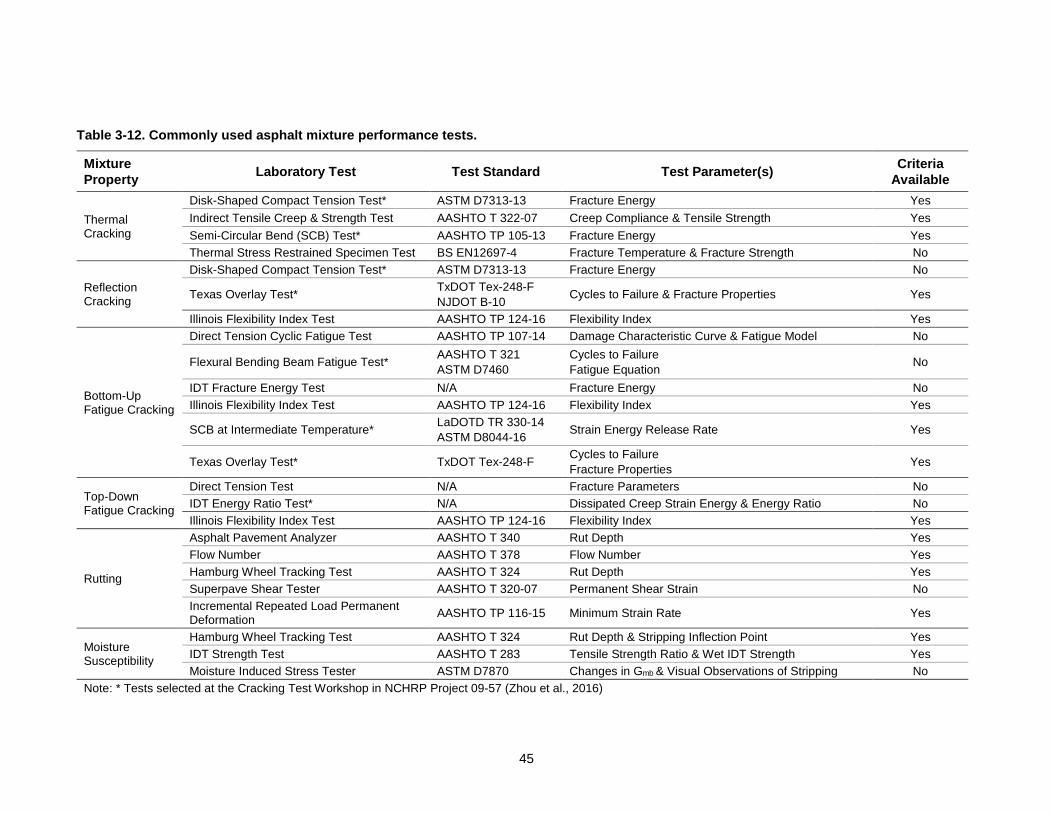
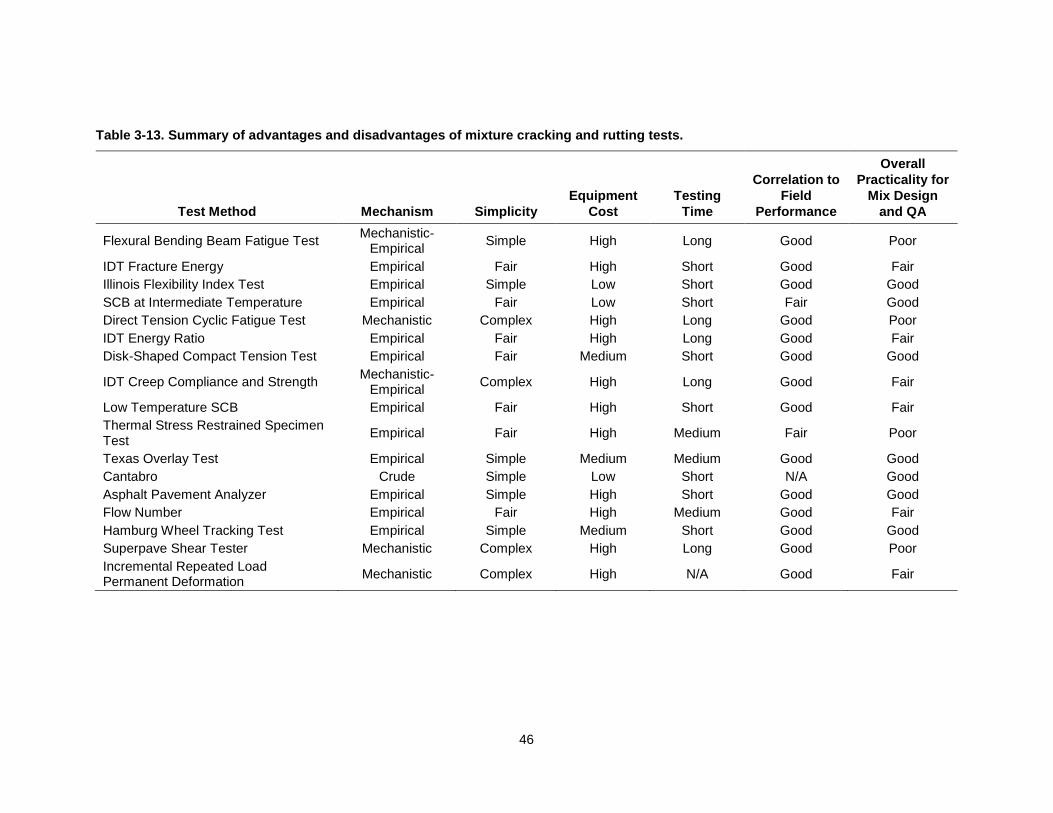
Numerous performance tests have been developed by different researchers to evaluate the rutting resistance, cracking resistance, and moisture susceptibility of asphalt mixtures. Considering the different mechanisms in crack initiation and propagation, mixture cracking tests can be further categorized into thermal cracking, reflection cracking, bottom-up fatigue cracking, and top-down fatigue cracking. Table 1-1 lists mixture performance tests that are now commonly used in asphalt research. Some of these tests are already being used by DOTs in mix design approval. However, a well vetted process for the development of these performance tests has not been established; therefore, many of the proposed tests lack some steps necessary to begin implementation.
2
Table 1-1. Commonly used asphalt mixture performance tests.
Mixture Property Laboratory Test Test Standard
Thermal cracking
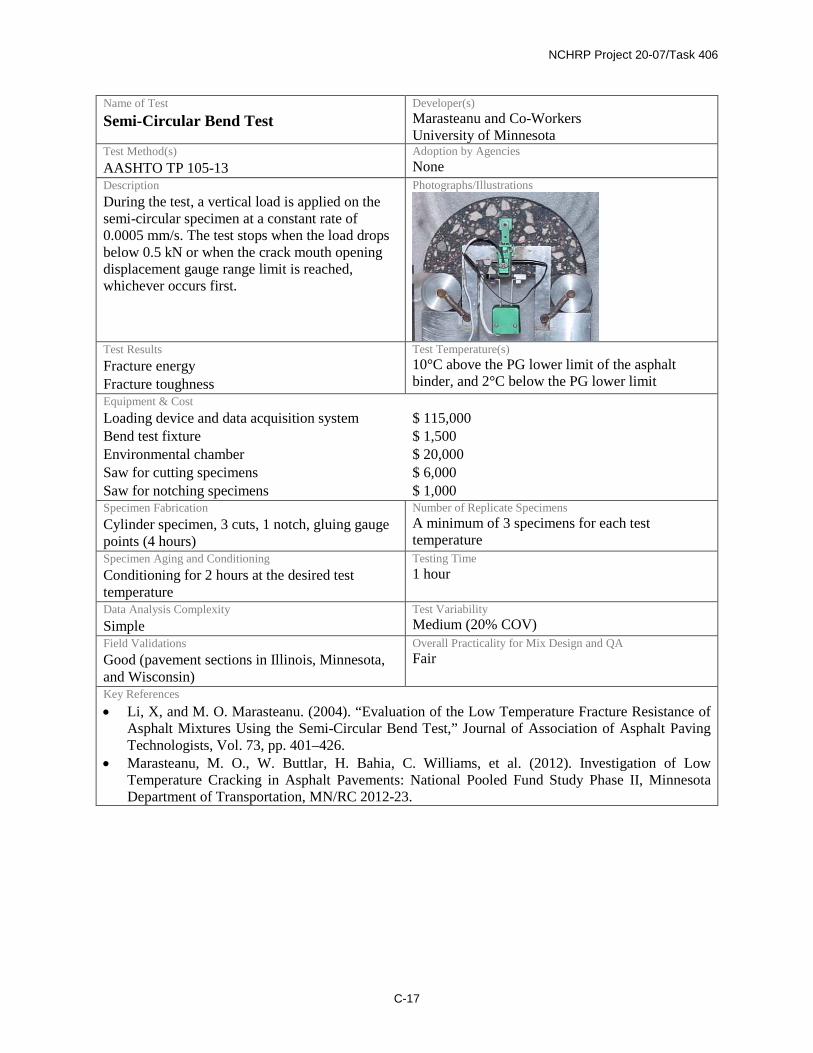
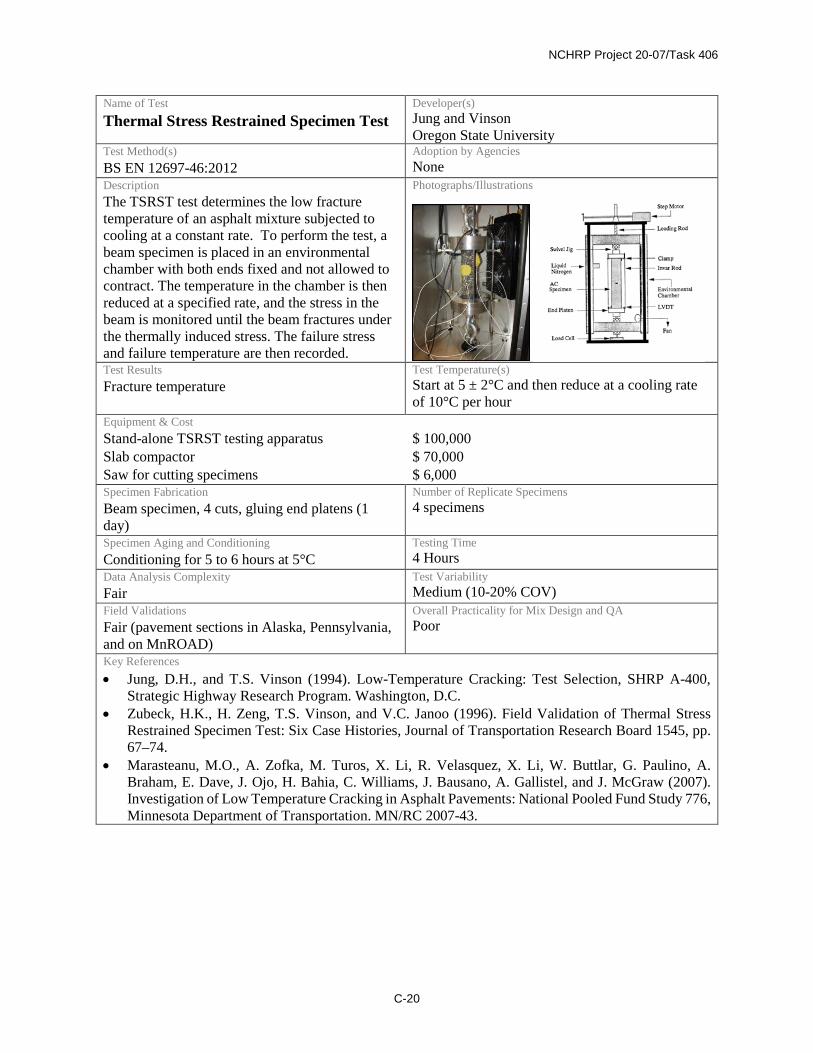
Disk-Shaped Compact Tension Test ASTM D7313-13 Indirect Tensile (IDT) Test AASHTO T 322-07 Semi-Circular Bend (SCB) Test AASHTO TP 105-13 Thermal Stress Restrained Specimen Test BS EN12697-4
Reflection cracking
Disk-Shaped Compact Tension Test ASTM D7313-13
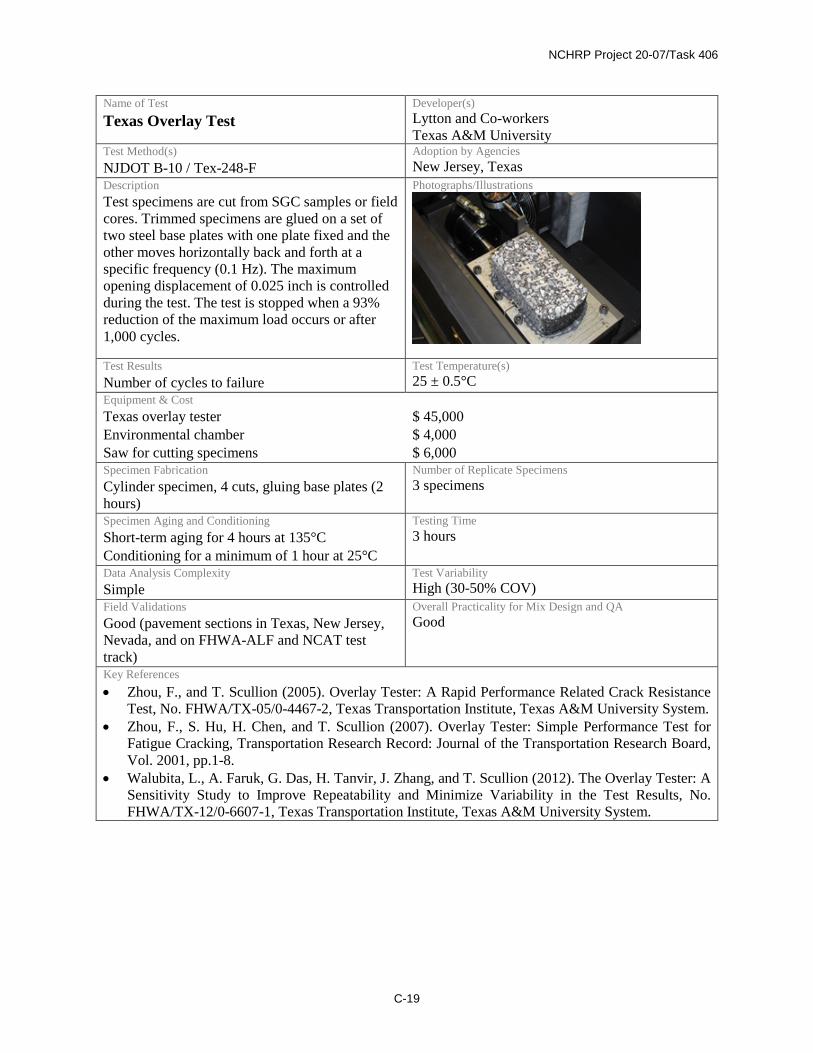
Texas Overlay Test TxDOT Tex-248-F NJDOT B-10
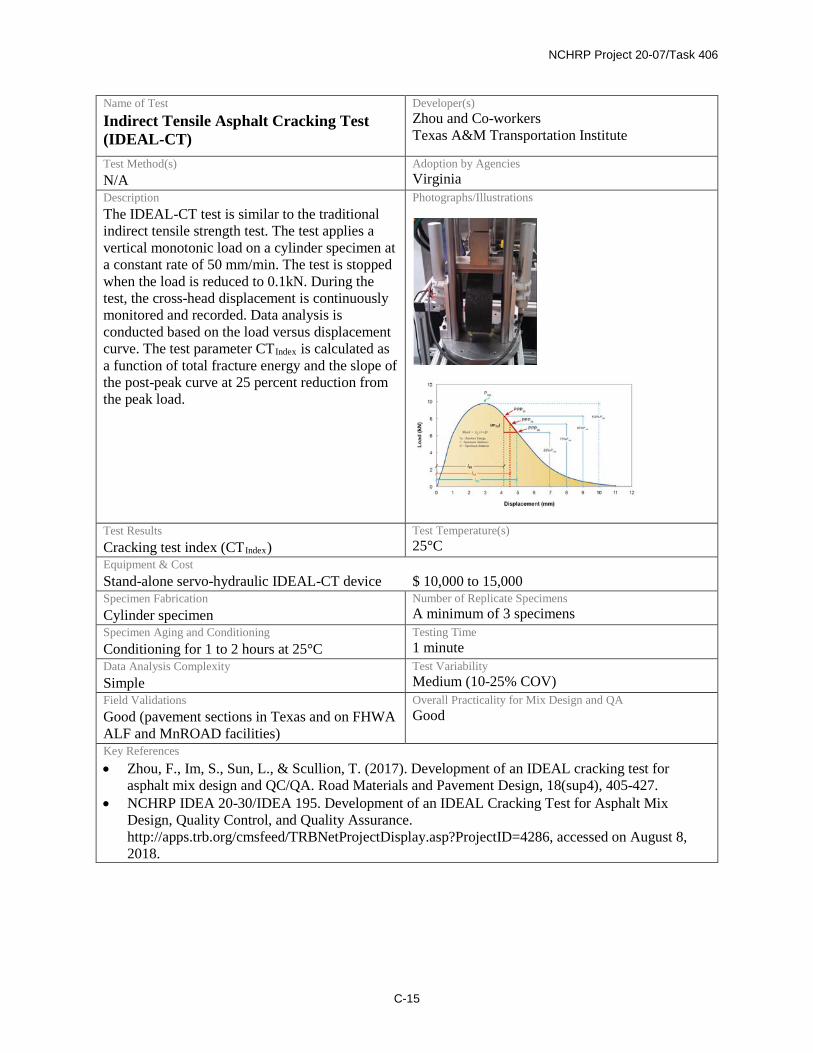
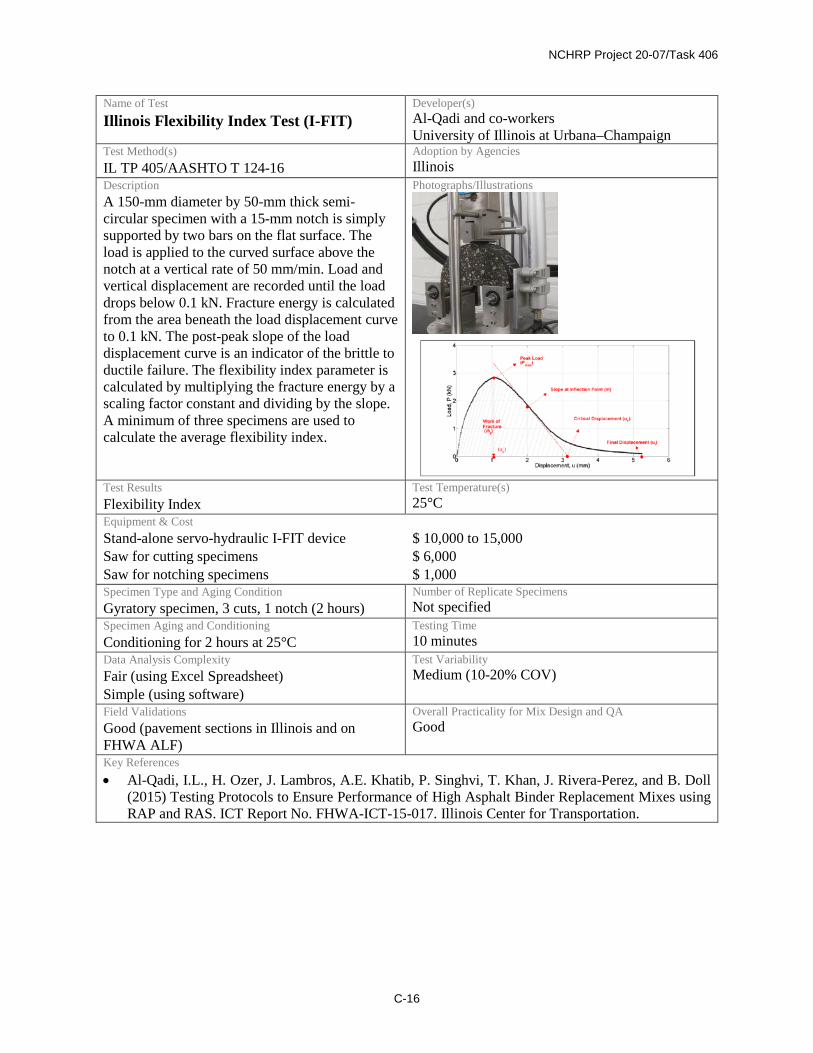
Illinois Flexibility Index Test AASHTO TP 124-16
Bottom-up fatigue cracking
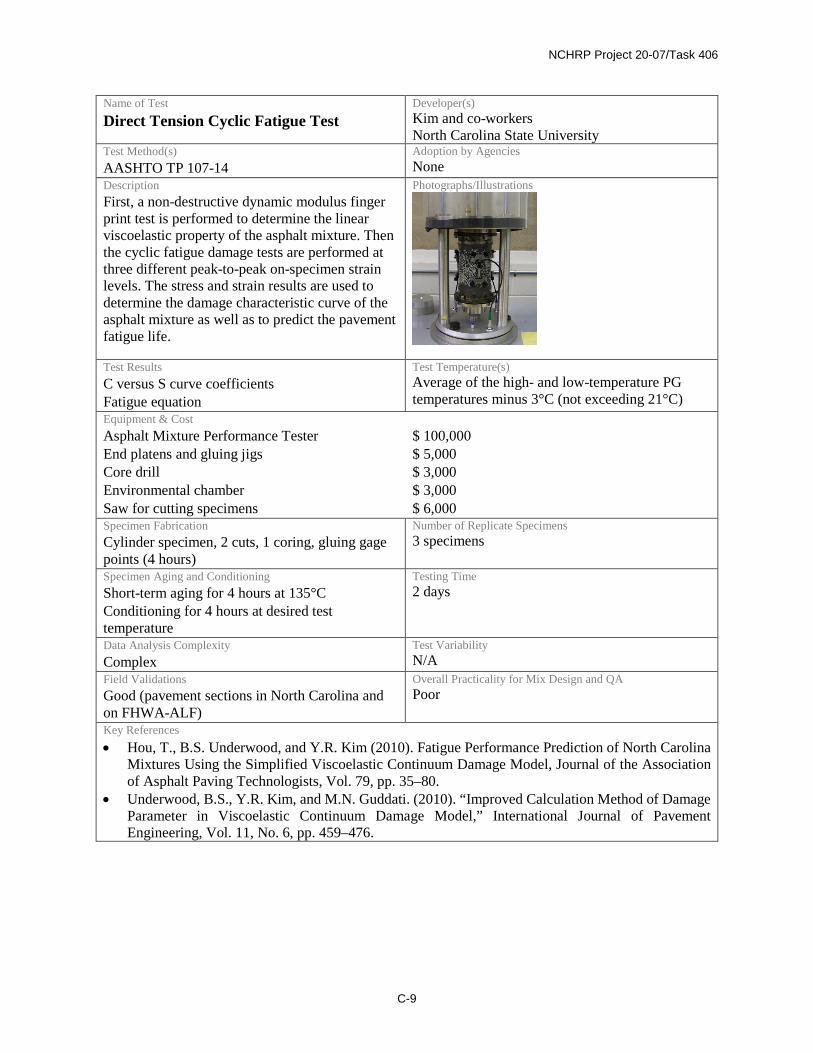
Direct Tension Cyclic Fatigue Test AASHTO TP 107-14
Flexural Bending Beam Fatigue Test AASHTO T 321 ASTM D7460
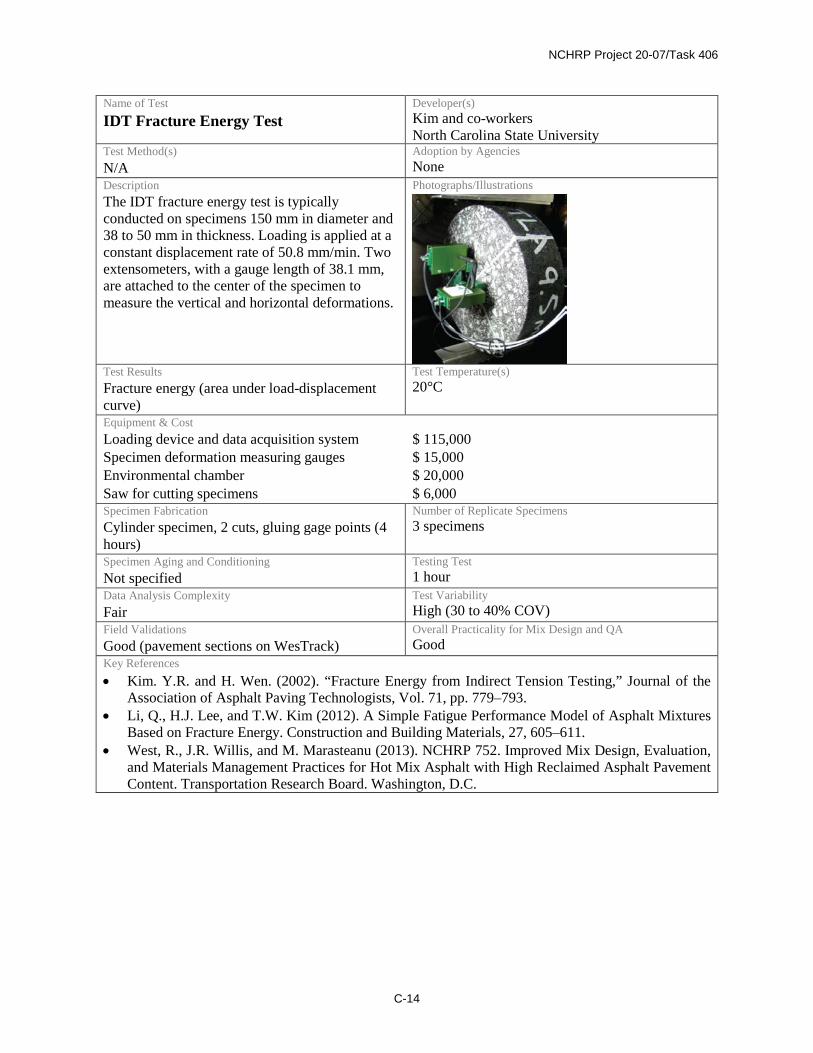
IDT Fracture Energy Test N/A Illinois Flexibility Index Test AASHTO TP 124-16
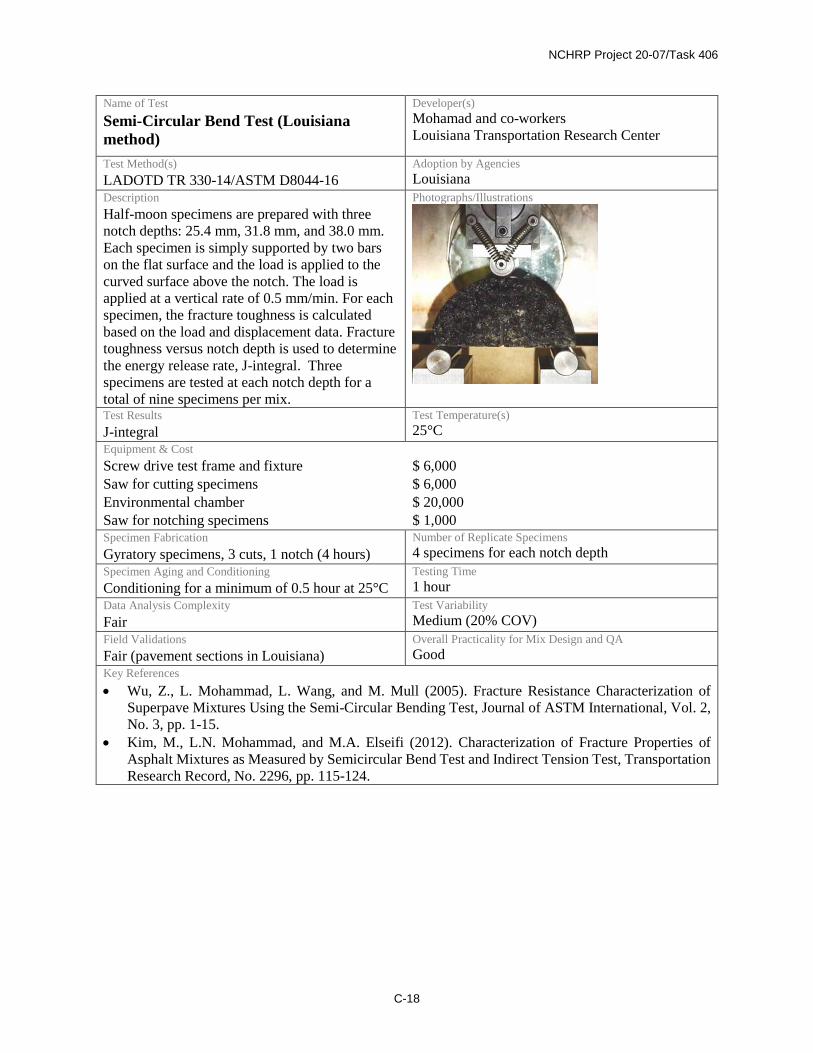
SCB at Intermediate Temperature LaDOTD TR 330-14 ASTM D8044-16
Texas Overlay Test TxDOT Tex-248-F
Top-down fatigue cracking
Direct Tension Test N/A IDT Energy Ratio Test N/A Illinois Flexibility Index Test AASHTO TP 124-16
Rutting
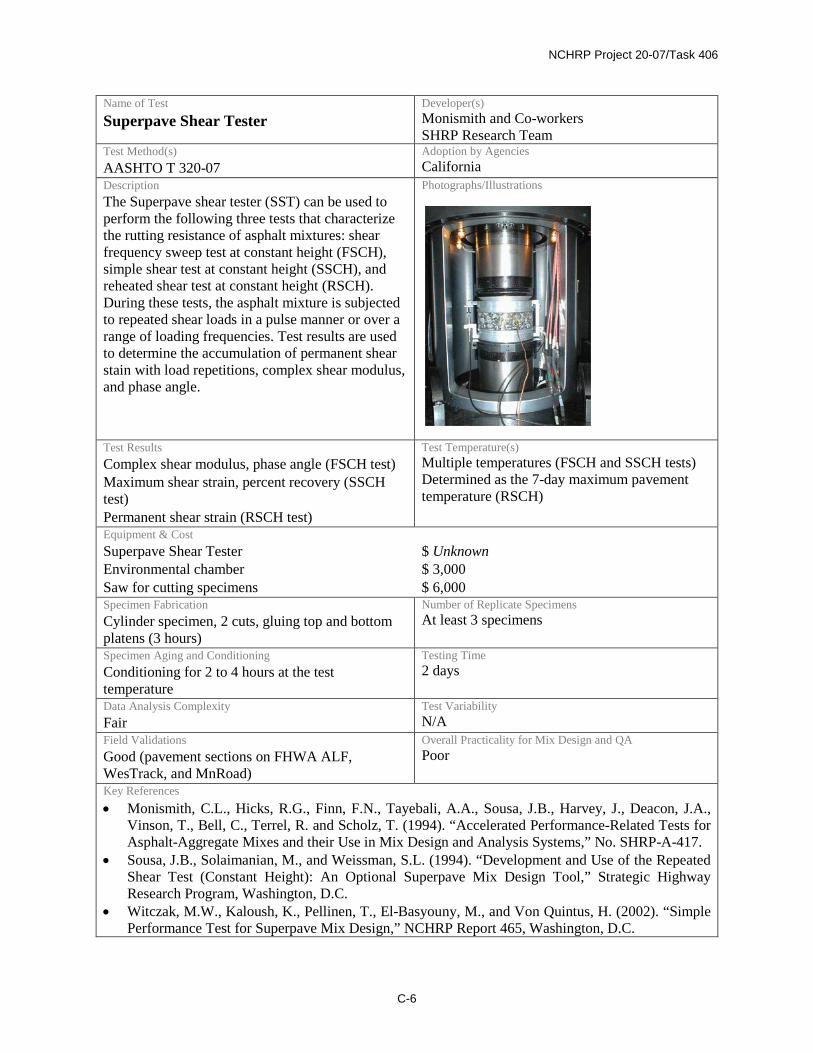
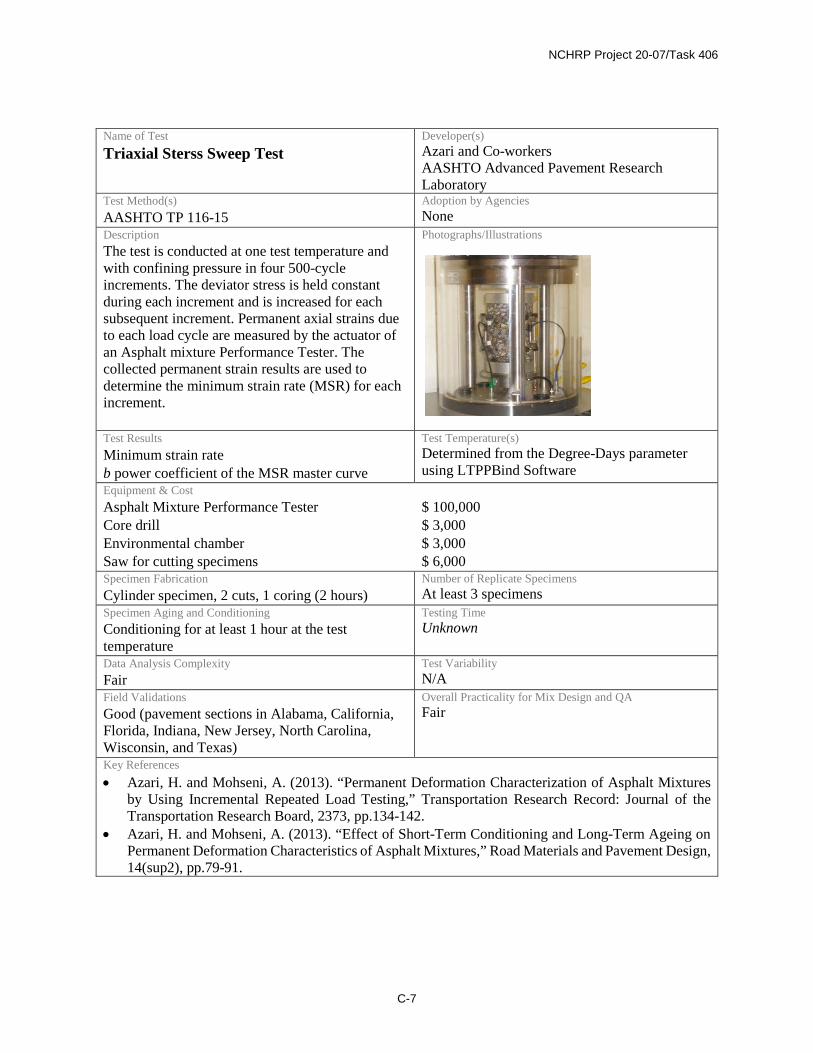
Asphalt Pavement Analyzer AASHTO T 340 Flow Number AASHTO TP 79-15 Hamburg Wheel Tracking Test AASHTO T 324 Superpave Shear Tester AASHTO T 320-07 Triaxial Stress Sweep Test AASHTO TP 116-15
Moisture susceptibility Hamburg Wheel Tracking Test AASHTO T 324 Tensile Strength Ratio AASHTO T 283
Project Objectives The objective of this research was to develop a framework that addresses alternate approaches to devise and
implement balanced mix design procedures incorporating performance testing and criteria. The framework will be presented in the format of an AASHTO recommended practice and will provide highway agencies with options on which performance tests to use and how the tests can be used in an overall mix design framework.
Using information gathered through the project, existing knowledge gaps will be identified and used to prepare draft research problem statements (RPSs) for additional research and development activities to address those gaps and facilitate successful implementation of balanced mix design.
Report Organization This report documents the current state of knowledge regarding balanced mix design and provides the required
deliverables for the project. Chapter 2 summarizes an analysis of surveys of state DOTs and asphalt contractors regarding BMD. Chapter 3 provides a literature review that covers the shortcomings of the current Superpave mix design method, refinements made by some agencies to try to improve Superpave mixes, the growing use of mixture performance tests to better evaluate how asphalt mixtures resist certain forms of distress, and case studies
3
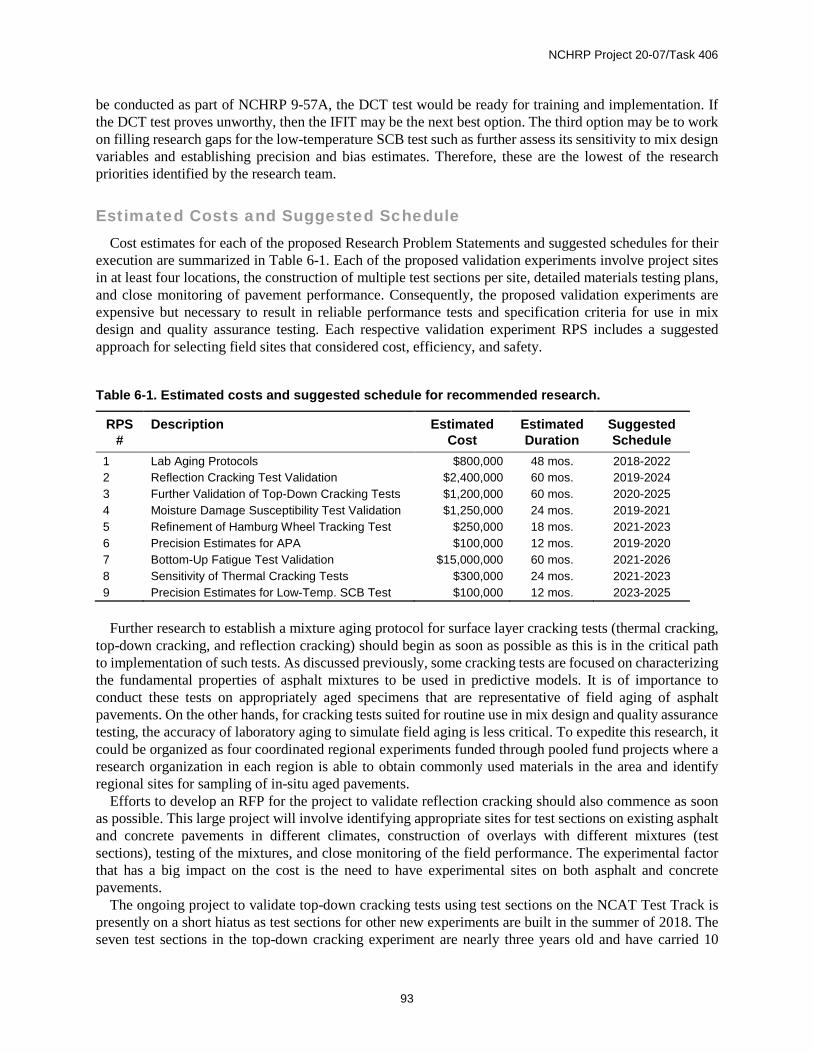
of the BMD concept. Chapter 4 presents a proposed BMD framework in the format of an AASHTO Standard Practice (i.e., R designation) and an AASHTO Standard Specification (i.e., M designation). Chapter 5 identifies the gaps in the current body of knowledge needed to implement BMD. Chapter 6 presents research problem statements to address the knowledge gaps with estimates of the research costs and a recommended schedule for issuing the research projects.
4
C H A P T E R 2
Survey of State DOTs and Asphalt Contractors
Introduction An online survey was conducted to gather information from state DOTs that have begun or are preparing to
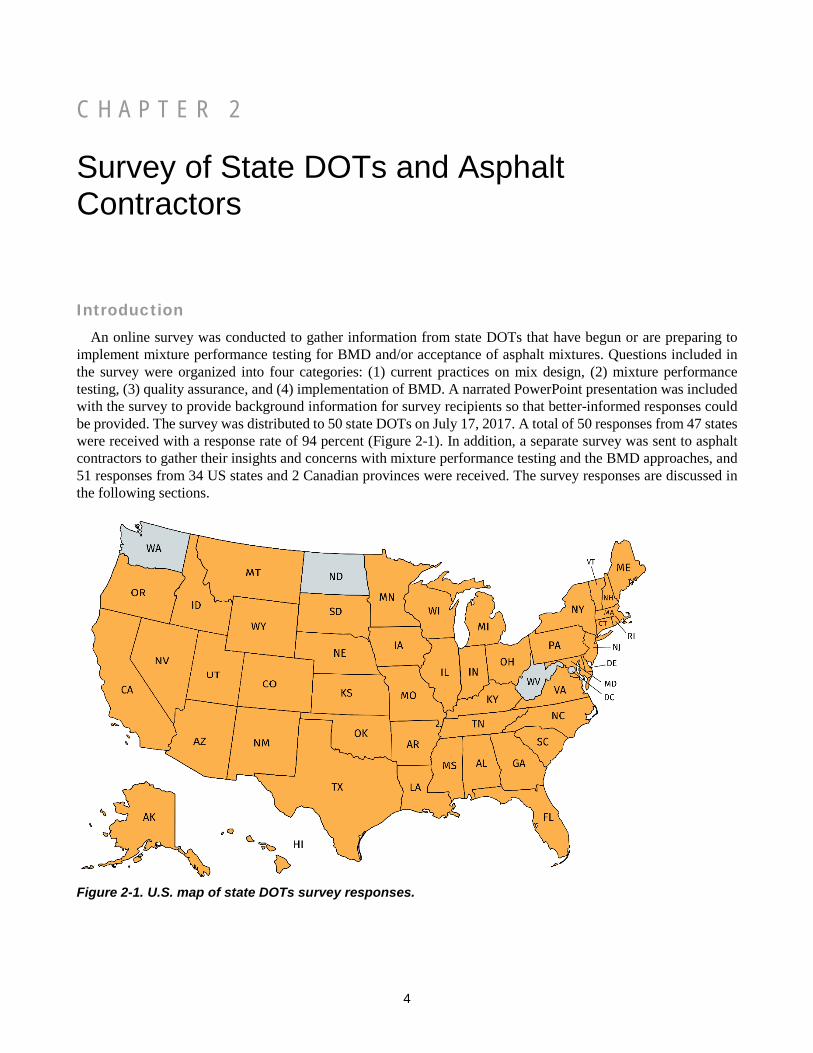
implement mixture performance testing for BMD and/or acceptance of asphalt mixtures. Questions included in the survey were organized into four categories: (1) current practices on mix design, (2) mixture performance testing, (3) quality assurance, and (4) implementation of BMD. A narrated PowerPoint presentation was included with the survey to provide background information for survey recipients so that better-informed responses could be provided. The survey was distributed to 50 state DOTs on July 17, 2017. A total of 50 responses from 47 states were received with a response rate of 94 percent (Figure 2-1). In addition, a separate survey was sent to asphalt contractors to gather their insights and concerns with mixture performance testing and the BMD approaches, and 51 responses from 34 US states and 2 Canadian provinces were received. The survey responses are discussed in the following sections.
Figure 2-1. U.S. map of state DOTs survey responses.
5
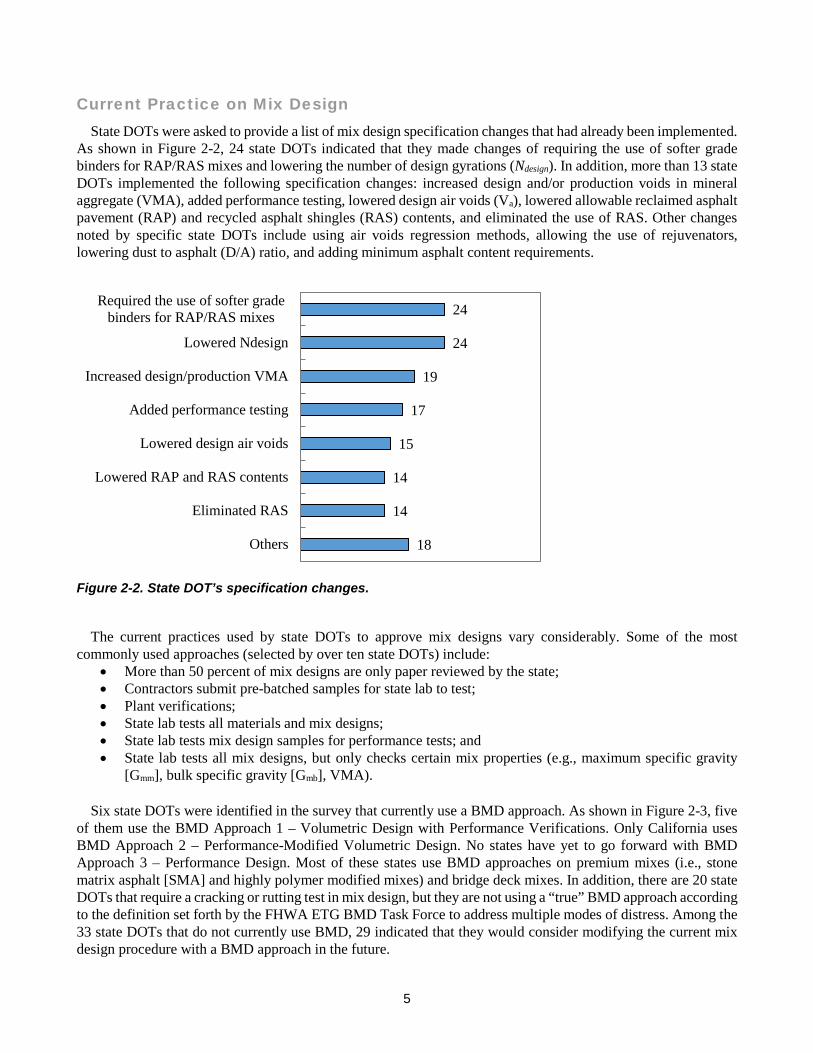
Current Practice on Mix Design State DOTs were asked to provide a list of mix design specification changes that had already been implemented.
As shown in Figure 2-2, 24 state DOTs indicated that they made changes of requiring the use of softer grade binders for RAP/RAS mixes and lowering the number of design gyrations (Ndesign). In addition, more than 13 state DOTs implemented the following specification changes: increased design and/or production voids in mineral aggregate (VMA), added performance testing, lowered design air voids (Va), lowered allowable reclaimed asphalt pavement (RAP) and recycled asphalt shingles (RAS) contents, and eliminated the use of RAS. Other changes noted by specific state DOTs include using air voids regression methods, allowing the use of rejuvenators, lowering dust to asphalt (D/A) ratio, and adding minimum asphalt content requirements.
Figure 2-2. State DOT’s specification changes.
The current practices used by state DOTs to approve mix designs vary considerably. Some of the most commonly used approaches (selected by over ten state DOTs) include:
• More than 50 percent of mix designs are only paper reviewed by the state; • Contractors submit pre-batched samples for state lab to test; • Plant verifications; • State lab tests all materials and mix designs; • State lab tests mix design samples for performance tests; and • State lab tests all mix designs, but only checks certain mix properties (e.g., maximum specific gravity
[Gmm], bulk specific gravity [Gmb], VMA).
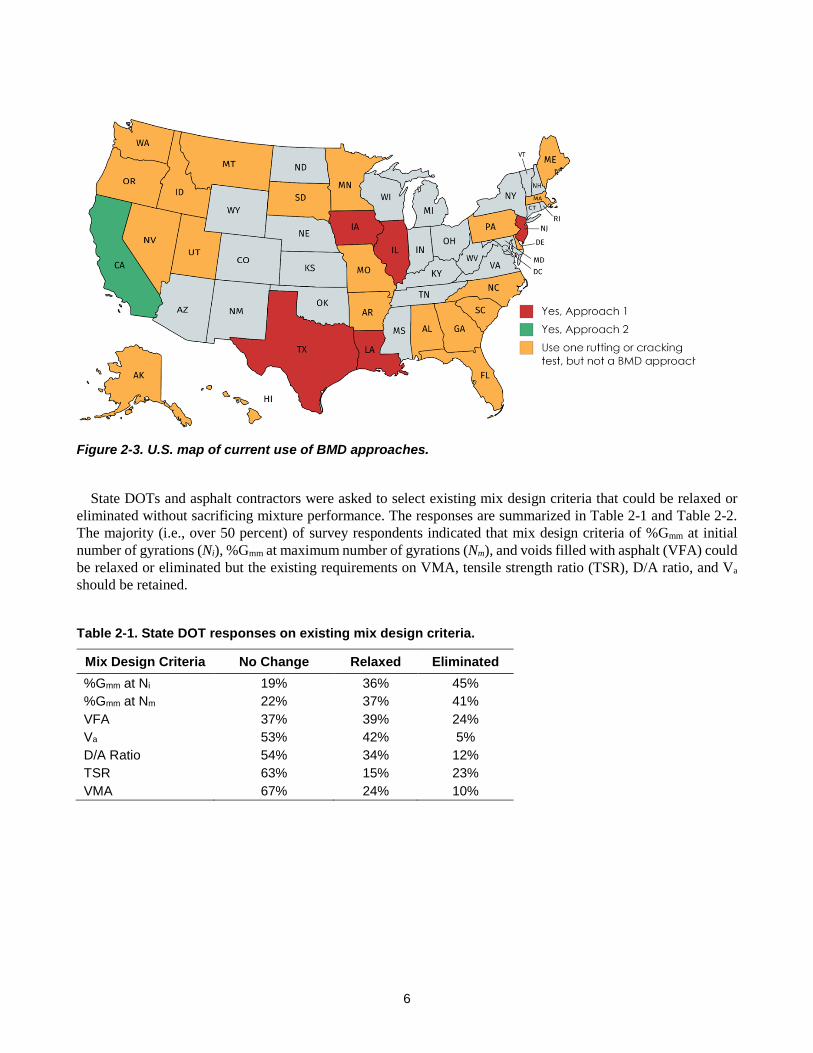
Six state DOTs were identified in the survey that currently use a BMD approach. As shown in Figure 2-3, five of them use the BMD Approach 1 – Volumetric Design with Performance Verifications. Only California uses BMD Approach 2 – Performance-Modified Volumetric Design. No states have yet to go forward with BMD Approach 3 – Performance Design. Most of these states use BMD approaches on premium mixes (i.e., stone matrix asphalt [SMA] and highly polymer modified mixes) and bridge deck mixes. In addition, there are 20 state DOTs that require a cracking or rutting test in mix design, but they are not using a “true” BMD approach according to the definition set forth by the FHWA ETG BMD Task Force to address multiple modes of distress. Among the 33 state DOTs that do not currently use BMD, 29 indicated that they would consider modifying the current mix design procedure with a BMD approach in the future.
24
24
19
17
15
14
14
18
Required the use of softer gradebinders for RAP/RAS mixes
Lowered Ndesign
Increased design/production VMA
Added performance testing
Lowered design air voids
Lowered RAP and RAS contents
Eliminated RAS
Others
6
Figure 2-3. U.S. map of current use of BMD approaches.
State DOTs and asphalt contractors were asked to select existing mix design criteria that could be relaxed or eliminated without sacrificing mixture performance. The responses are summarized in Table 2-1 and Table 2-2. The majority (i.e., over 50 percent) of survey respondents indicated that mix design criteria of %Gmm at initial number of gyrations (Ni), %Gmm at maximum number of gyrations (Nm), and voids filled with asphalt (VFA) could be relaxed or eliminated but the existing requirements on VMA, tensile strength ratio (TSR), D/A ratio, and Va should be retained.
Table 2-1. State DOT responses on existing mix design criteria.
Mix Design Criteria No Change Relaxed Eliminated %Gmm at Ni 19% 36% 45% %Gmm at Nm 22% 37% 41% VFA 37% 39% 24% Va 53% 42% 5% D/A Ratio 54% 34% 12% TSR 63% 15% 23% VMA 67% 24% 10%
7
Table 2-2. Asphalt contractor responses on existing mix design criteria.
Mix Design Criteria No Change Relaxed Eliminated %Gmm at Ni 13% 28% 59% %Gmm at Nm 19% 27% 54% VFA 31% 43% 26% Va 47% 53% 0% D/A Ratio 33% 49% 18% TSR 51% 23% 26% VMA 36% 53% 11%
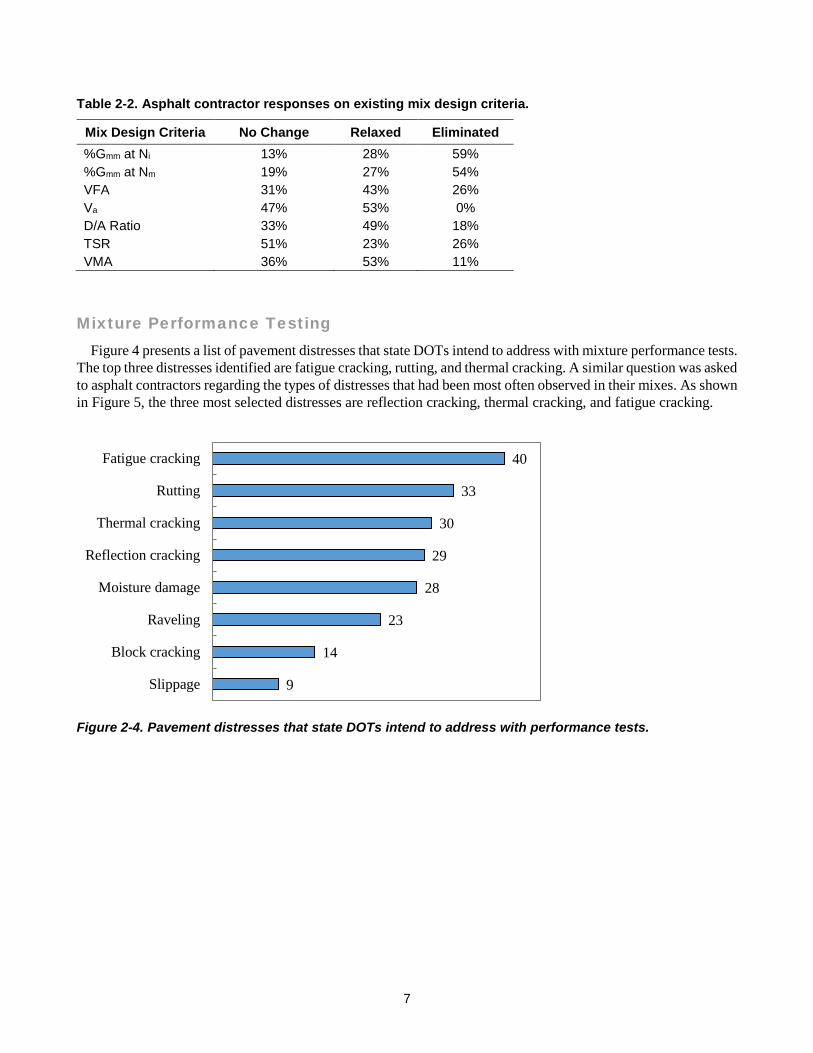
Mixture Performance Testing Figure 4 presents a list of pavement distresses that state DOTs intend to address with mixture performance tests.
The top three distresses identified are fatigue cracking, rutting, and thermal cracking. A similar question was asked to asphalt contractors regarding the types of distresses that had been most often observed in their mixes. As shown in Figure 5, the three most selected distresses are reflection cracking, thermal cracking, and fatigue cracking.
Figure 2-4. Pavement distresses that state DOTs intend to address with performance tests.
40
33
30
29
28
23
14
9
Fatigue cracking
Rutting
Thermal cracking
Reflection cracking
Moisture damage
Raveling
Block cracking
Slippage
8
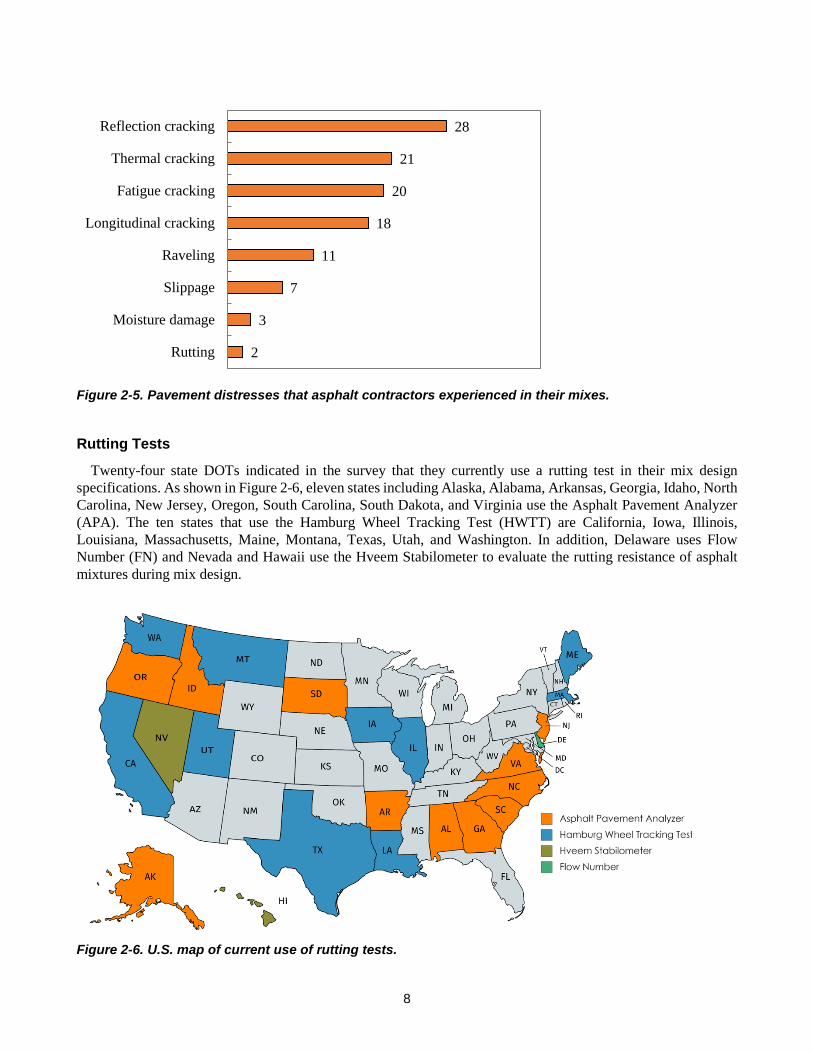
Figure 2-5. Pavement distresses that asphalt contractors experienced in their mixes.
Rutting Tests
Twenty-four state DOTs indicated in the survey that they currently use a rutting test in their mix design specifications. As shown in Figure 2-6, eleven states including Alaska, Alabama, Arkansas, Georgia, Idaho, North Carolina, New Jersey, Oregon, South Carolina, South Dakota, and Virginia use the Asphalt Pavement Analyzer (APA). The ten states that use the Hamburg Wheel Tracking Test (HWTT) are California, Iowa, Illinois, Louisiana, Massachusetts, Maine, Montana, Texas, Utah, and Washington. In addition, Delaware uses Flow Number (FN) and Nevada and Hawaii use the Hveem Stabilometer to evaluate the rutting resistance of asphalt mixtures during mix design.
Figure 2-6. U.S. map of current use of rutting tests.
28
21
20
18
11
7
3
2
Reflection cracking
Thermal cracking
Fatigue cracking
Longitudinal cracking
Raveling
Slippage
Moisture damage
Rutting
9
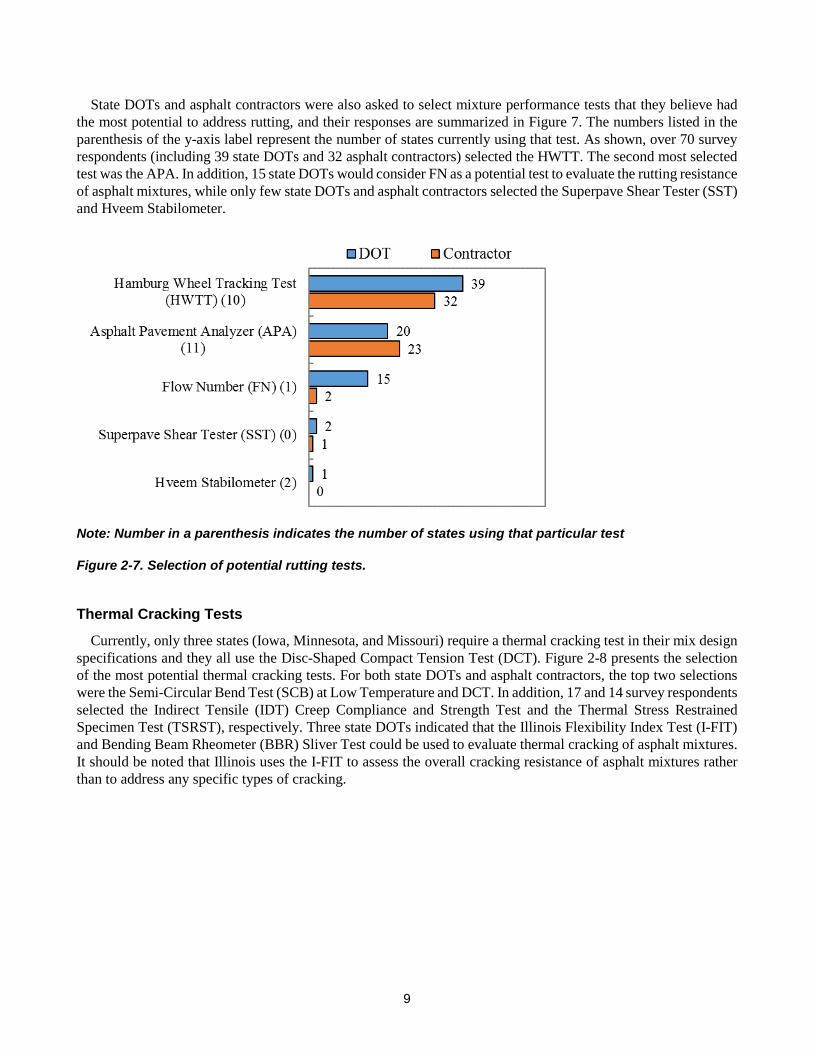
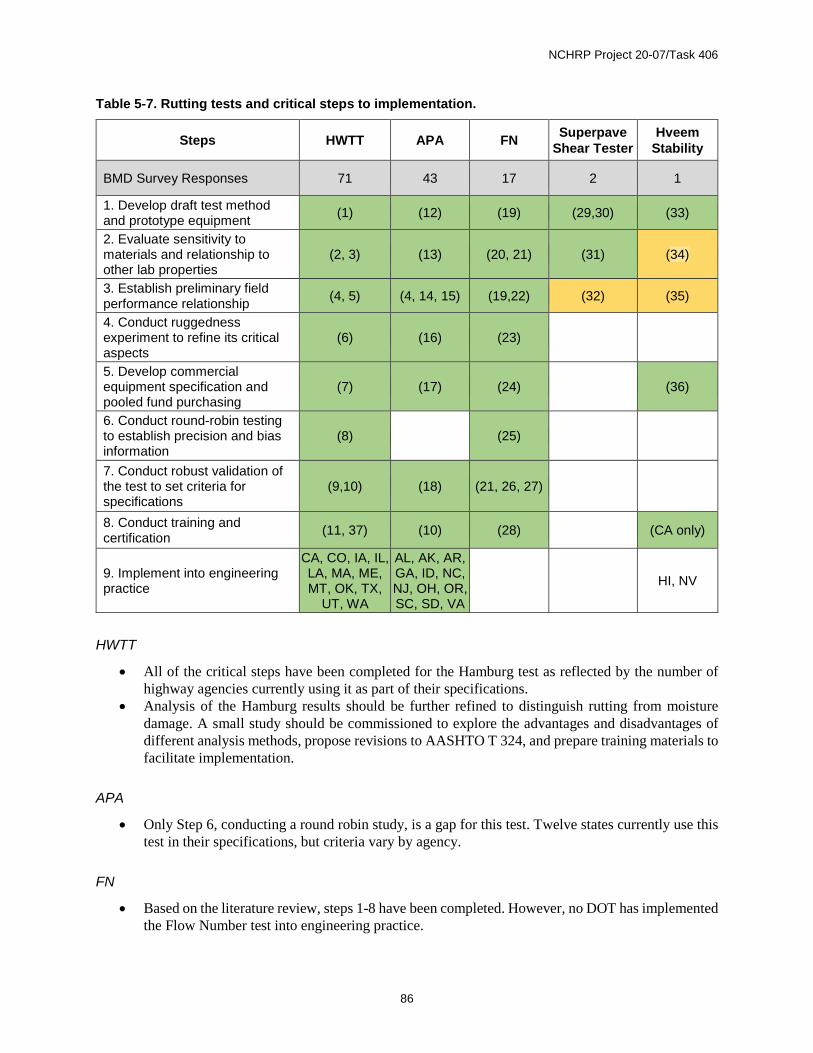
State DOTs and asphalt contractors were also asked to select mixture performance tests that they believe had the most potential to address rutting, and their responses are summarized in Figure 7. The numbers listed in the parenthesis of the y-axis label represent the number of states currently using that test. As shown, over 70 survey respondents (including 39 state DOTs and 32 asphalt contractors) selected the HWTT. The second most selected test was the APA. In addition, 15 state DOTs would consider FN as a potential test to evaluate the rutting resistance of asphalt mixtures, while only few state DOTs and asphalt contractors selected the Superpave Shear Tester (SST) and Hveem Stabilometer.
Note: Number in a parenthesis indicates the number of states using that particular test
Figure 2-7. Selection of potential rutting tests.
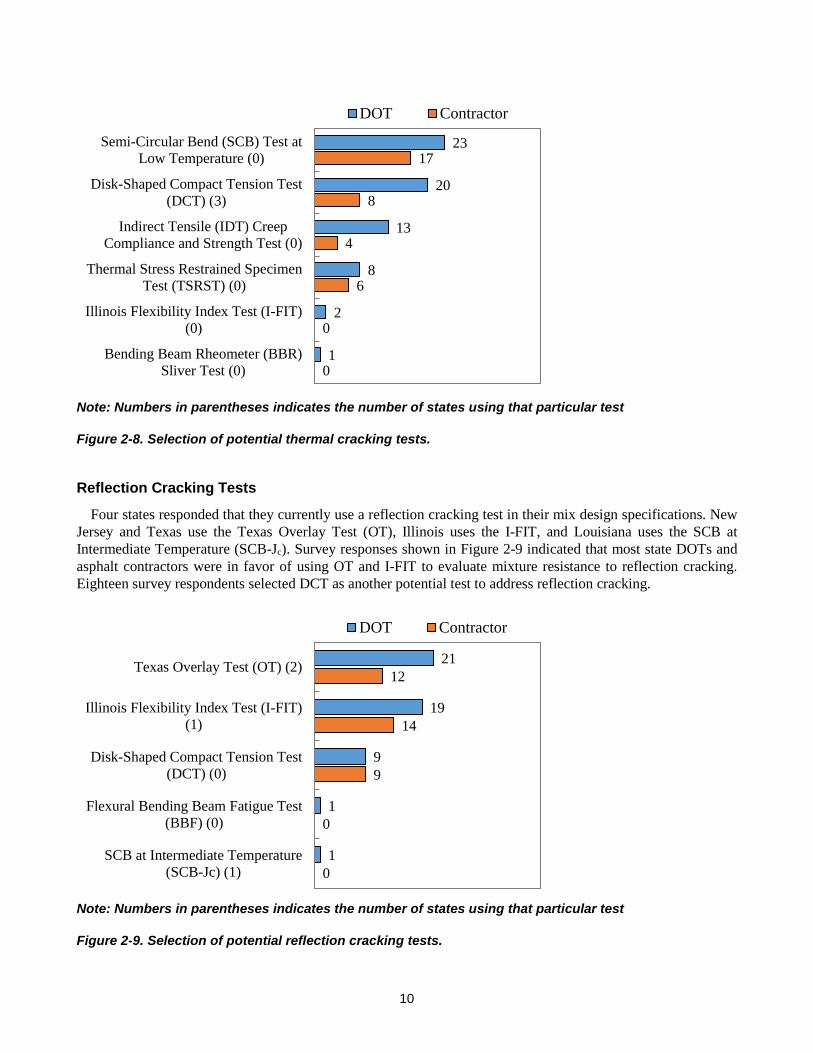
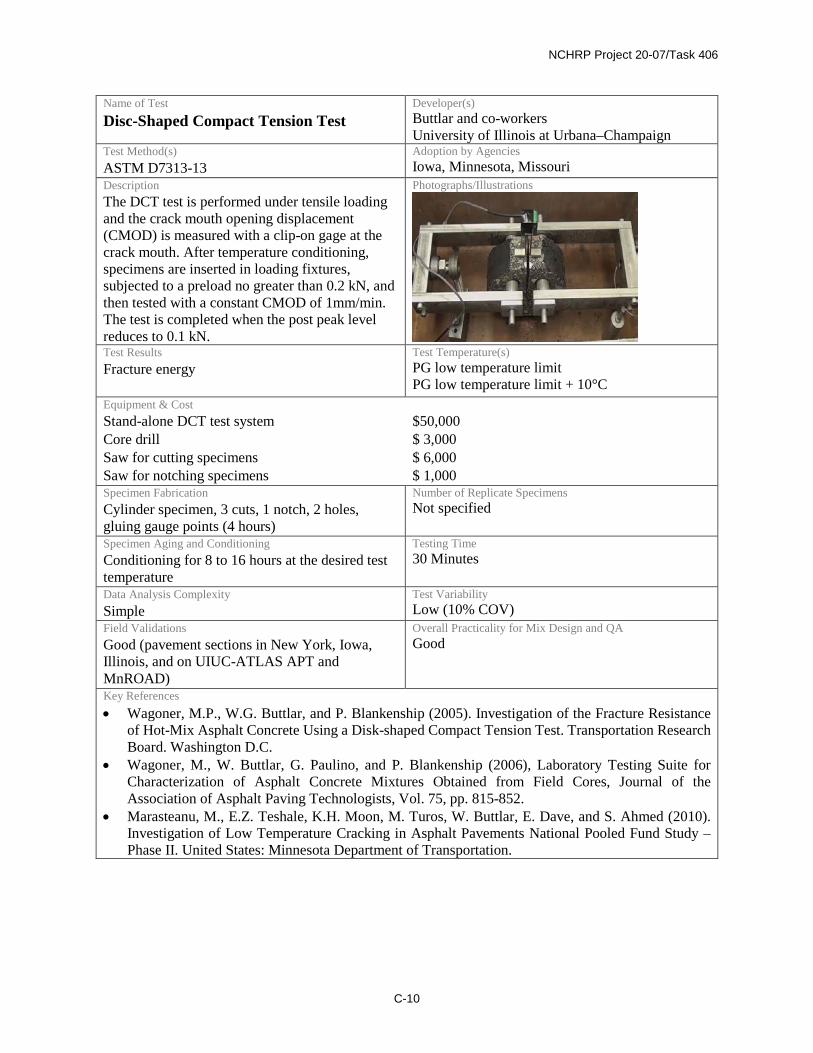
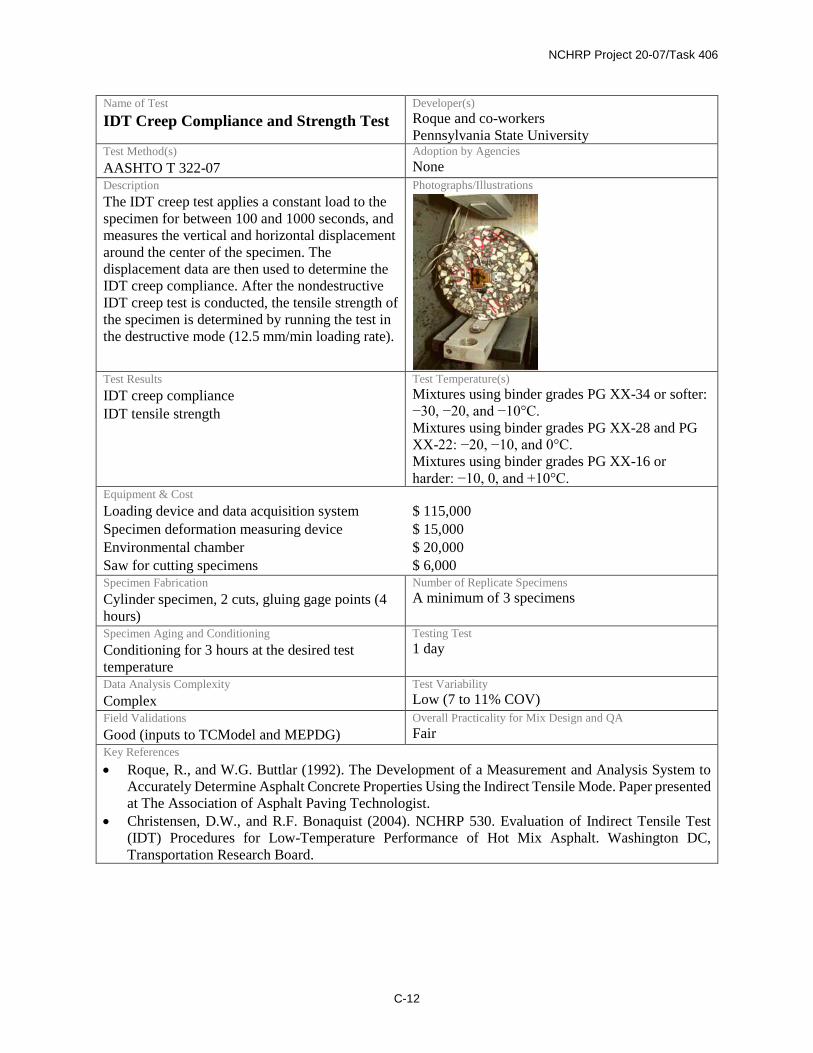
Thermal Cracking Tests
Currently, only three states (Iowa, Minnesota, and Missouri) require a thermal cracking test in their mix design specifications and they all use the Disc-Shaped Compact Tension Test (DCT). Figure 2-8 presents the selection of the most potential thermal cracking tests. For both state DOTs and asphalt contractors, the top two selections were the Semi-Circular Bend Test (SCB) at Low Temperature and DCT. In addition, 17 and 14 survey respondents selected the Indirect Tensile (IDT) Creep Compliance and Strength Test and the Thermal Stress Restrained Specimen Test (TSRST), respectively. Three state DOTs indicated that the Illinois Flexibility Index Test (I-FIT) and Bending Beam Rheometer (BBR) Sliver Test could be used to evaluate thermal cracking of asphalt mixtures. It should be noted that Illinois uses the I-FIT to assess the overall cracking resistance of asphalt mixtures rather than to address any specific types of cracking.
10
Note: Numbers in parentheses indicates the number of states using that particular test
Figure 2-8. Selection of potential thermal cracking tests.
Reflection Cracking Tests
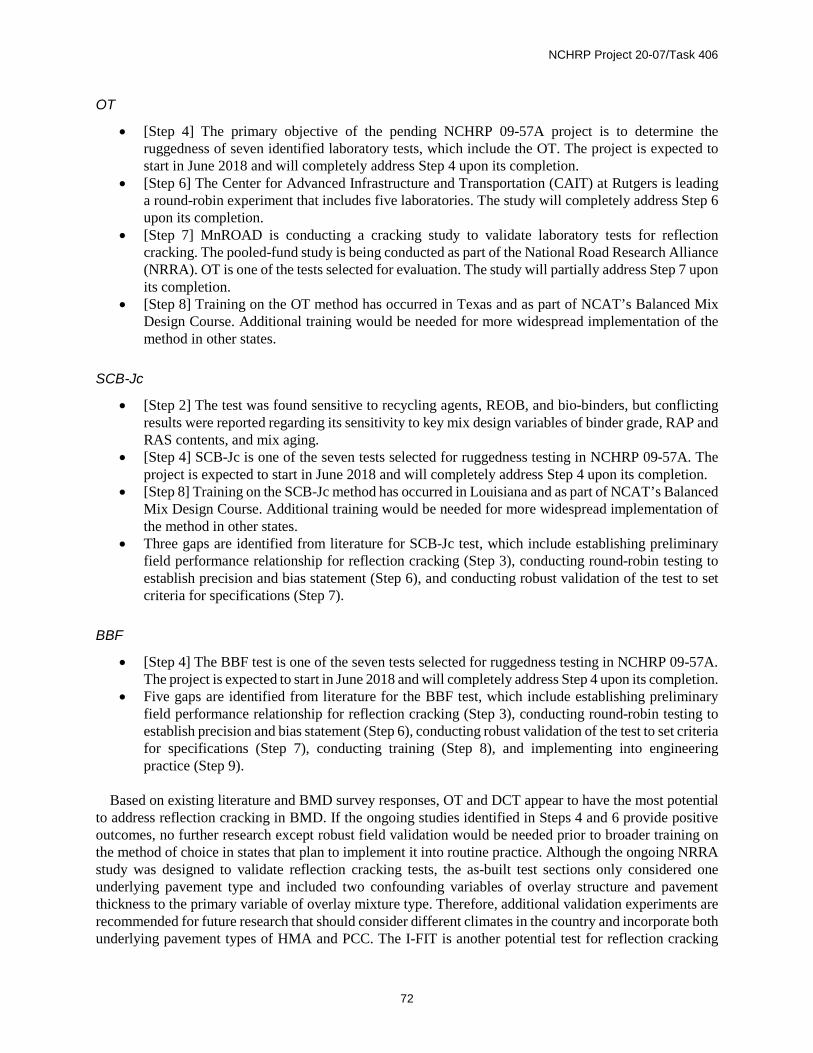
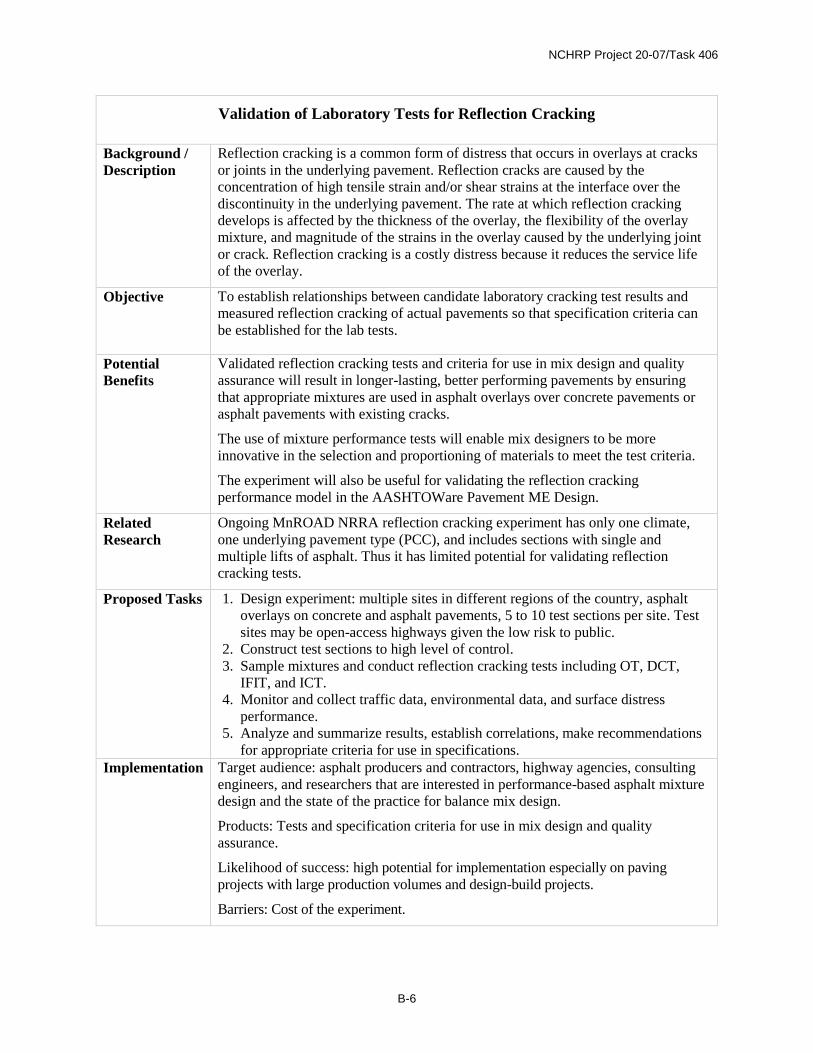
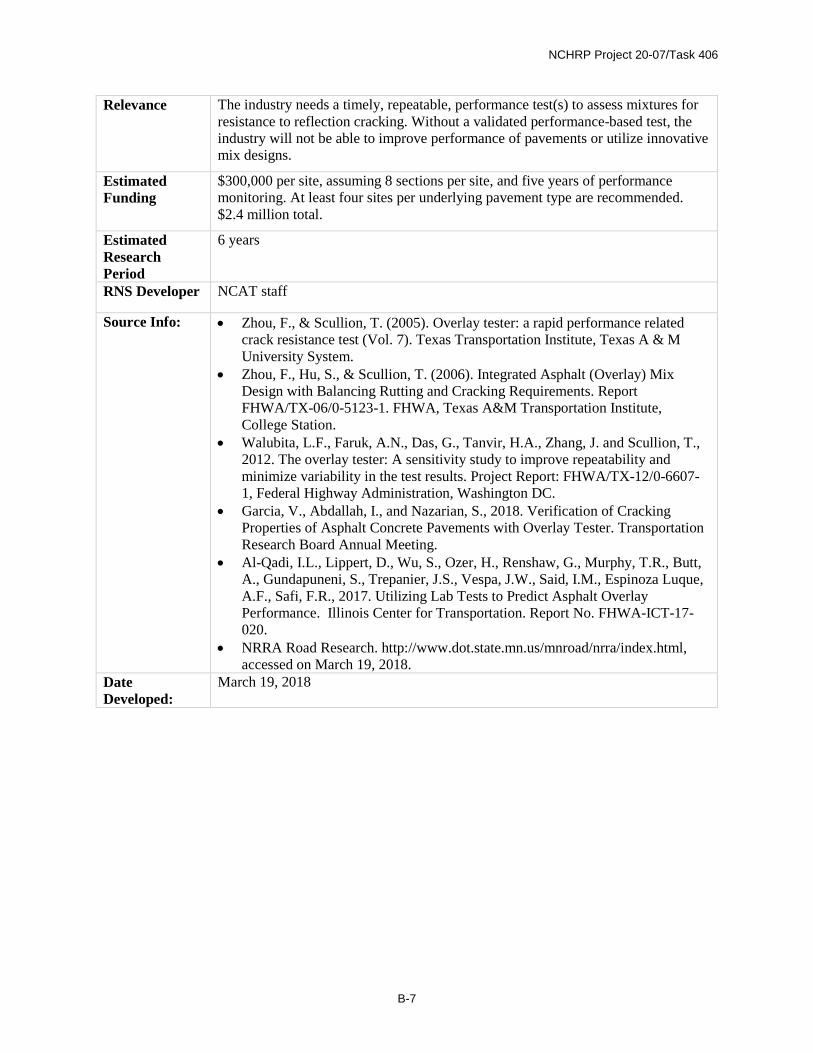
Four states responded that they currently use a reflection cracking test in their mix design specifications. New Jersey and Texas use the Texas Overlay Test (OT), Illinois uses the I-FIT, and Louisiana uses the SCB at Intermediate Temperature (SCB-Jc). Survey responses shown in Figure 2-9 indicated that most state DOTs and asphalt contractors were in favor of using OT and I-FIT to evaluate mixture resistance to reflection cracking. Eighteen survey respondents selected DCT as another potential test to address reflection cracking.
Note: Numbers in parentheses indicates the number of states using that particular test
Figure 2-9. Selection of potential reflection cracking tests.
23
20
13
8
2
1
17
8
4
6
0
0
Semi-Circular Bend (SCB) Test atLow Temperature (0)
Disk-Shaped Compact Tension Test(DCT) (3)
Indirect Tensile (IDT) CreepCompliance and Strength Test (0)
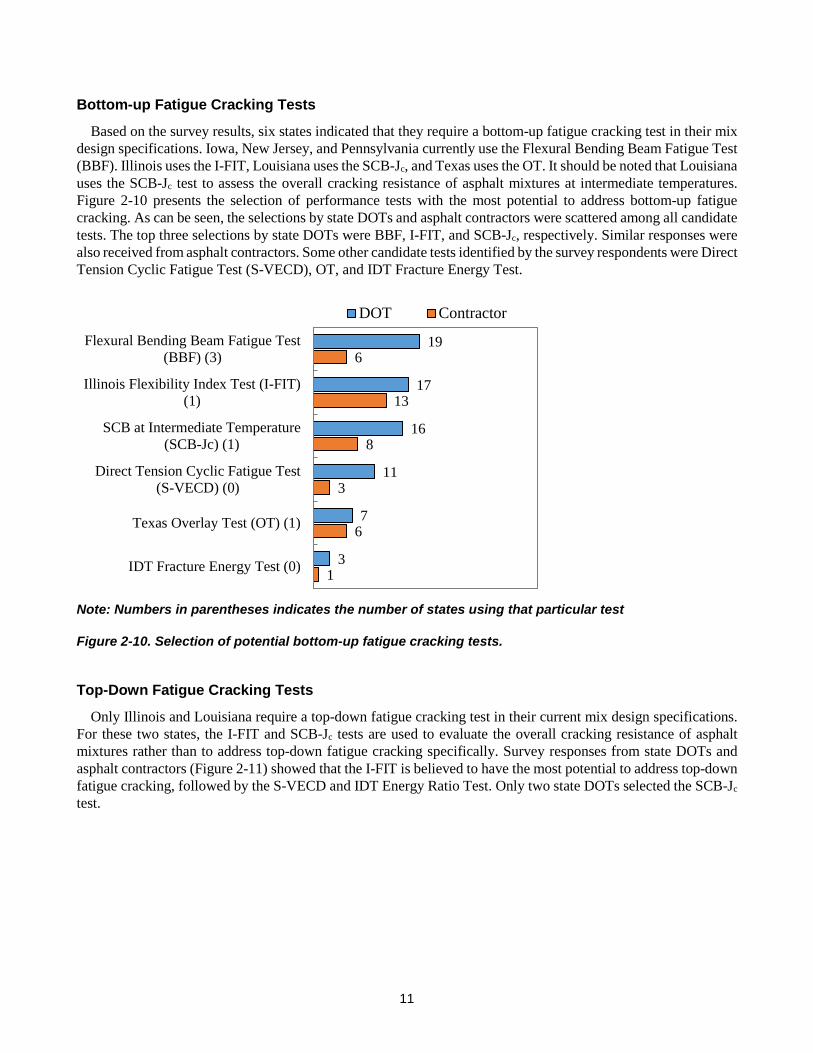
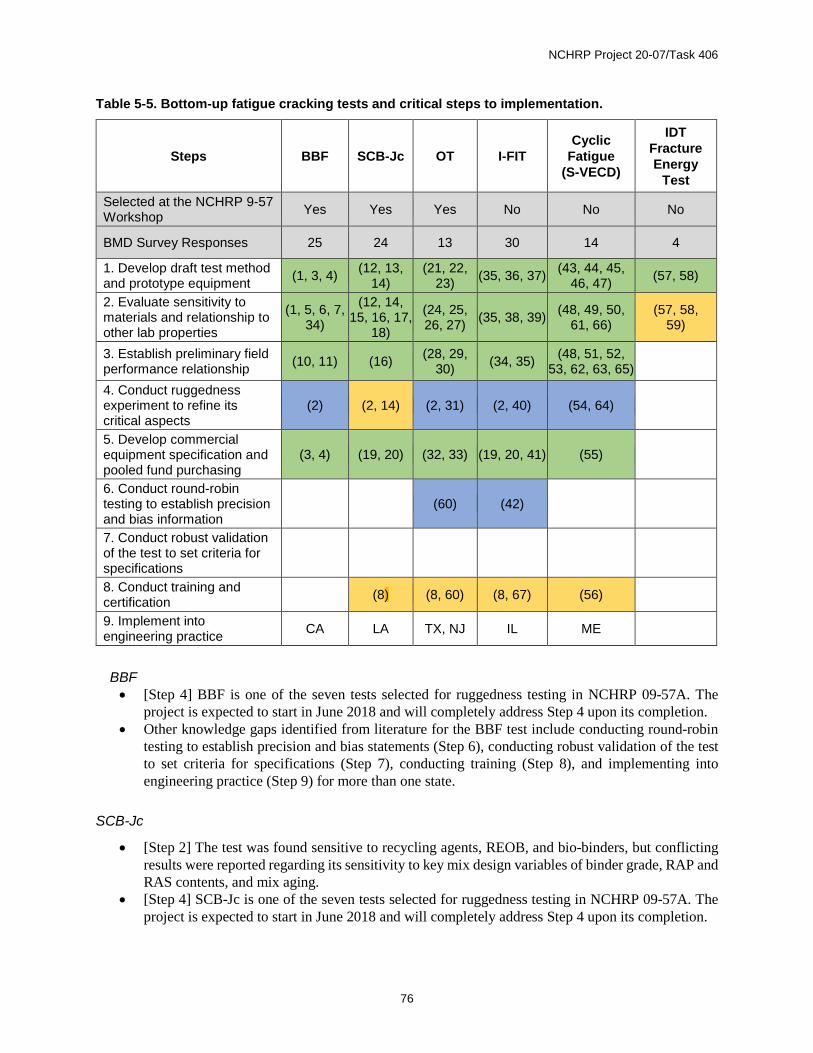
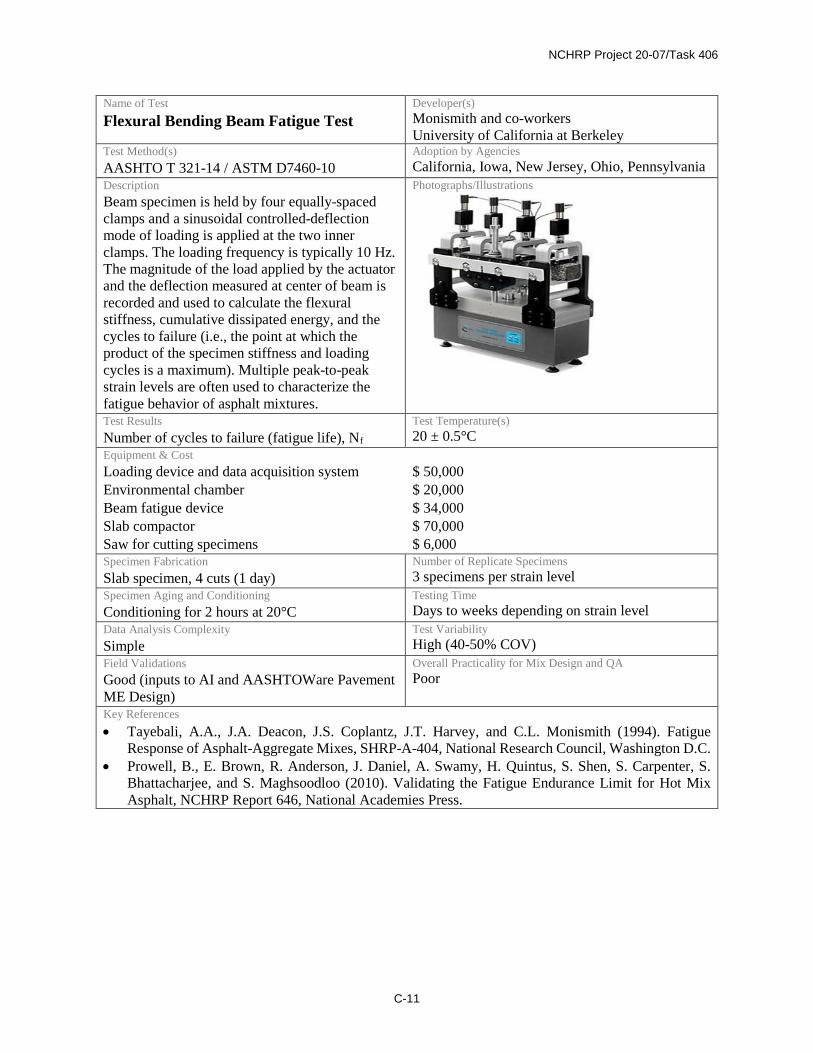
Based on the survey results, six states indicated that they require a bottom-up fatigue cracking test in their mix design specifications. Iowa, New Jersey, and Pennsylvania currently use the Flexural Bending Beam Fatigue Test (BBF). Illinois uses the I-FIT, Louisiana uses the SCB-Jc, and Texas uses the OT. It should be noted that Louisiana uses the SCB-Jc test to assess the overall cracking resistance of asphalt mixtures at intermediate temperatures. Figure 2-10 presents the selection of performance tests with the most potential to address bottom-up fatigue cracking. As can be seen, the selections by state DOTs and asphalt contractors were scattered among all candidate tests. The top three selections by state DOTs were BBF, I-FIT, and SCB-Jc, respectively. Similar responses were also received from asphalt contractors. Some other candidate tests identified by the survey respondents were Direct Tension Cyclic Fatigue Test (S-VECD), OT, and IDT Fracture Energy Test.
Note: Numbers in parentheses indicates the number of states using that particular test
Figure 2-10. Selection of potential bottom-up fatigue cracking tests.
Top-Down Fatigue Cracking Tests
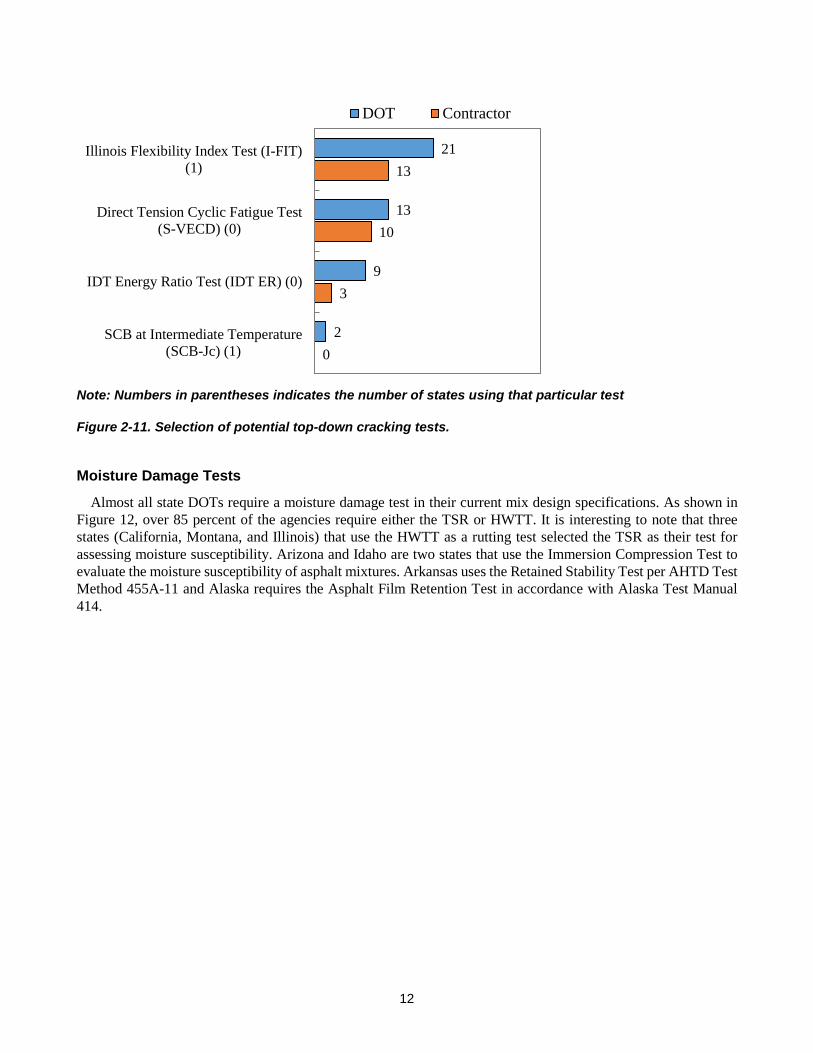
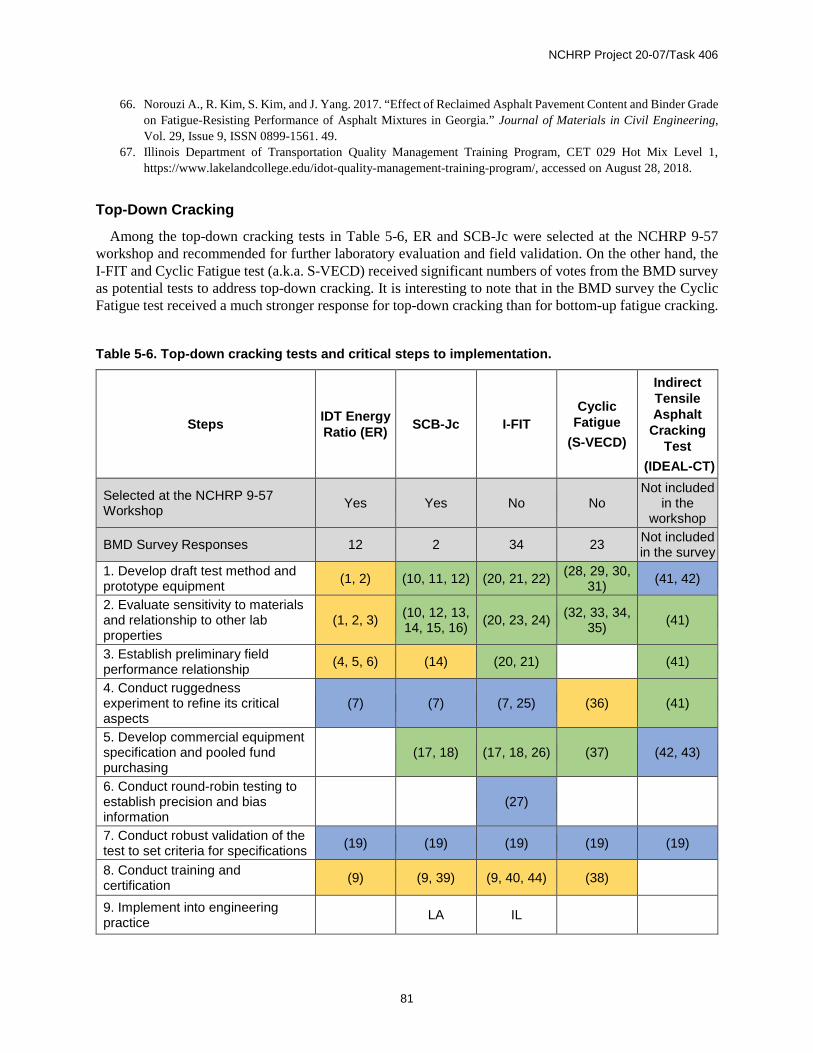
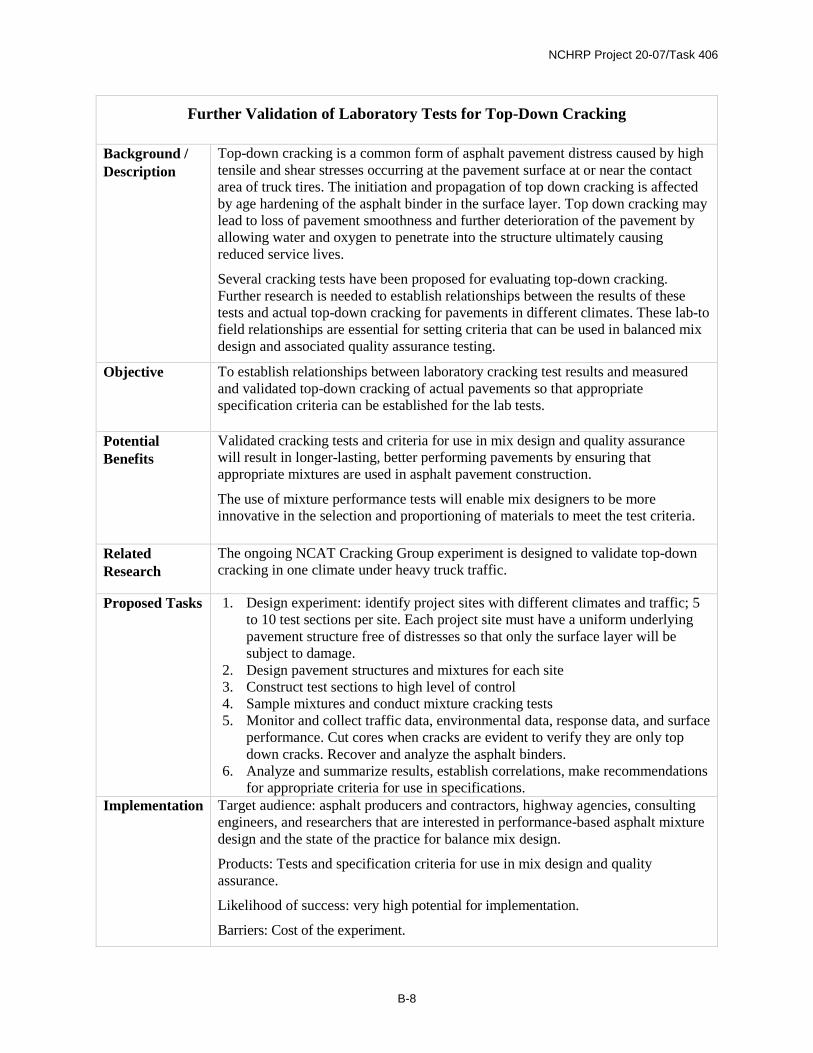
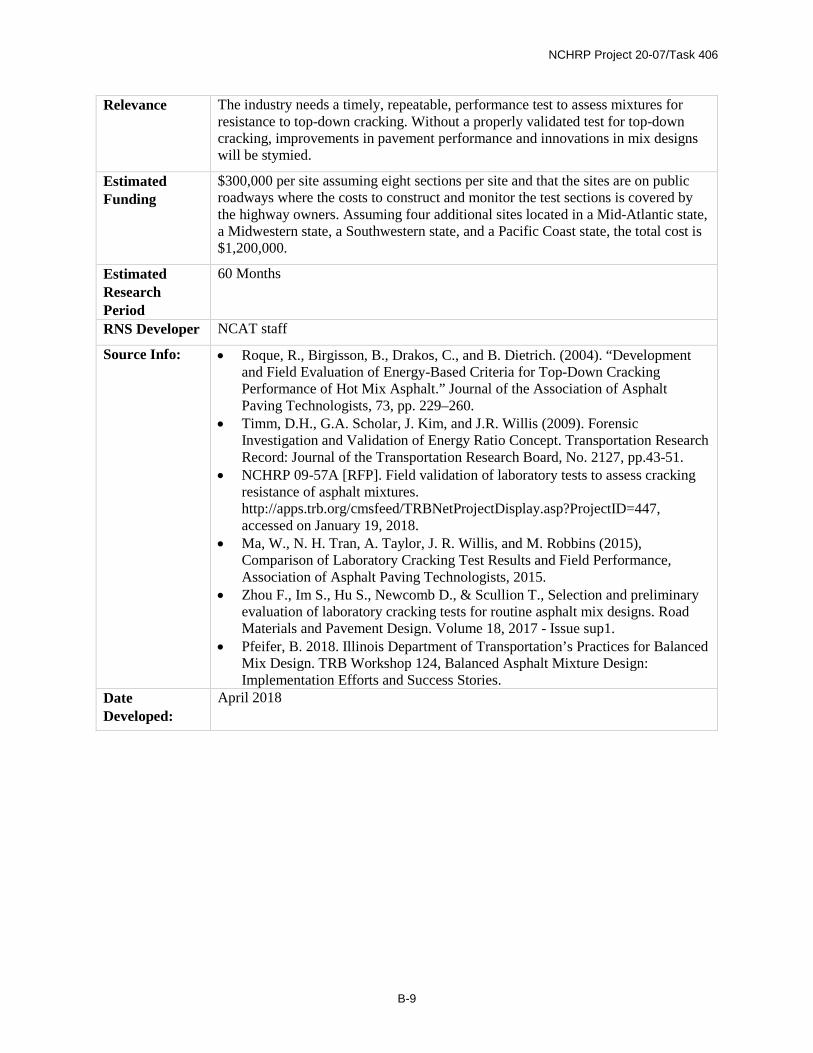
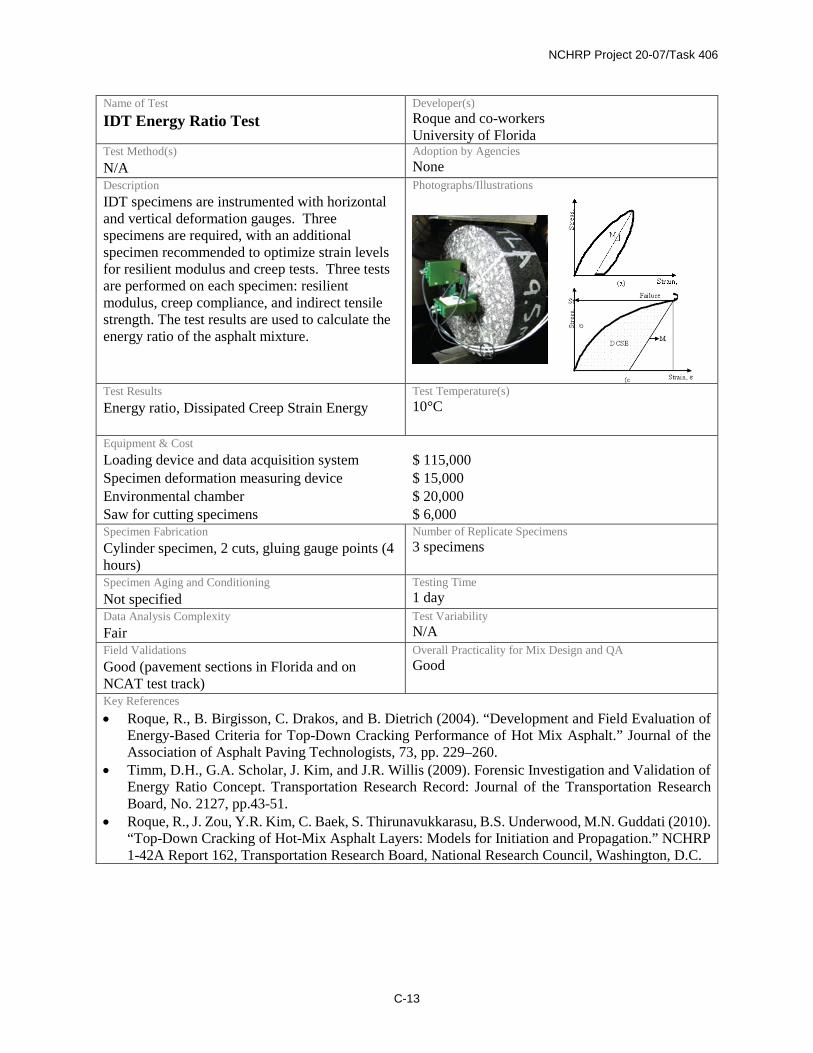
Only Illinois and Louisiana require a top-down fatigue cracking test in their current mix design specifications. For these two states, the I-FIT and SCB-Jc tests are used to evaluate the overall cracking resistance of asphalt mixtures rather than to address top-down fatigue cracking specifically. Survey responses from state DOTs and asphalt contractors (Figure 2-11) showed that the I-FIT is believed to have the most potential to address top-down fatigue cracking, followed by the S-VECD and IDT Energy Ratio Test. Only two state DOTs selected the SCB-Jc test.
19
17
16
11
7
3
6
13
8
3
6
1
Flexural Bending Beam Fatigue Test(BBF) (3)
Illinois Flexibility Index Test (I-FIT)(1)
SCB at Intermediate Temperature(SCB-Jc) (1)
Direct Tension Cyclic Fatigue Test(S-VECD) (0)
Texas Overlay Test (OT) (1)
IDT Fracture Energy Test (0)
DOT Contractor
12
Note: Numbers in parentheses indicates the number of states using that particular test
Figure 2-11. Selection of potential top-down cracking tests.
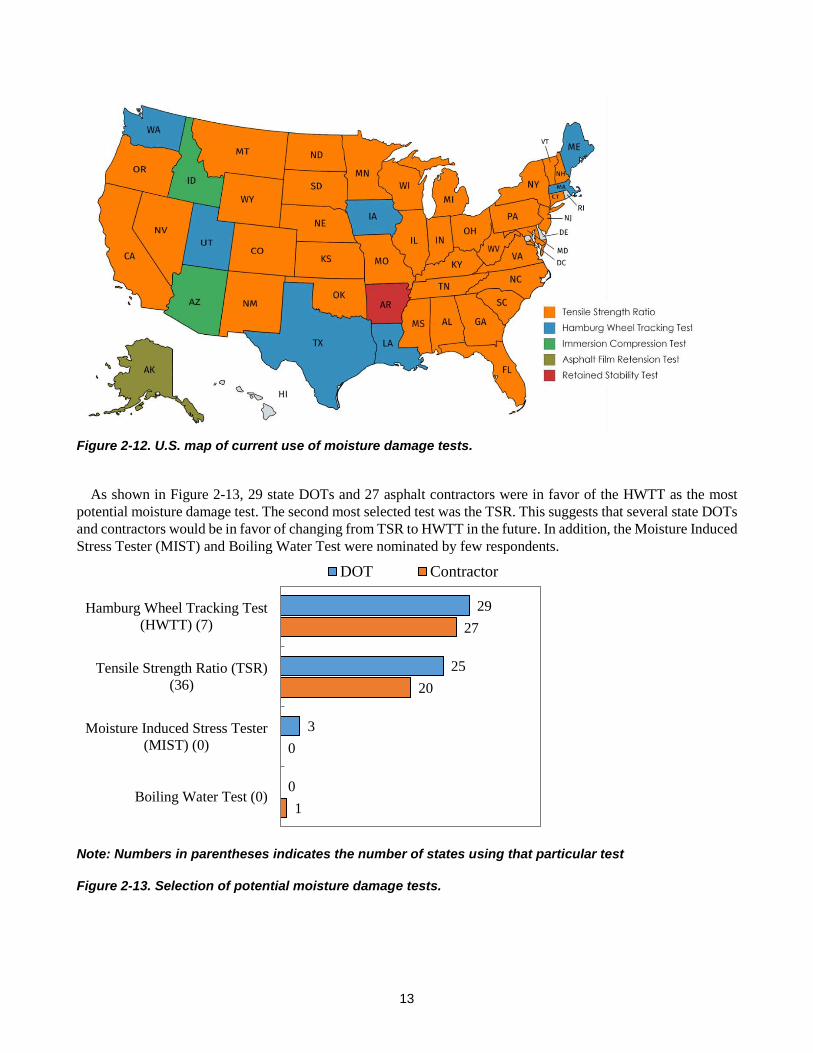
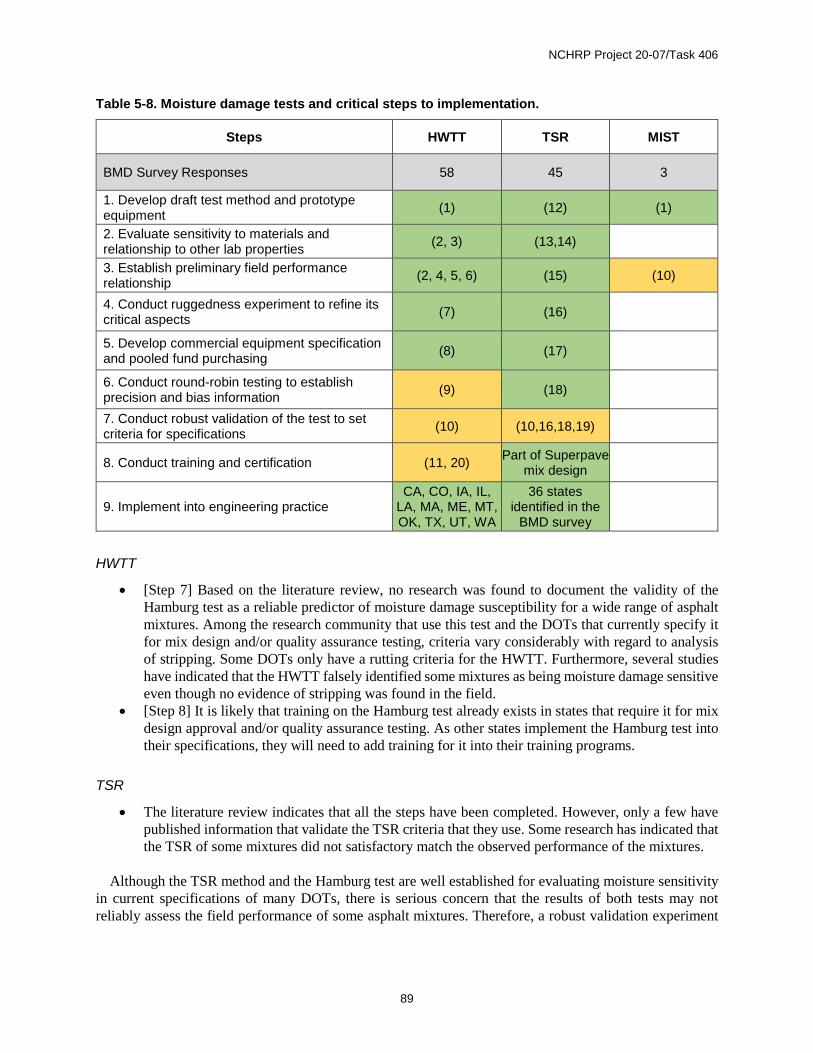
Moisture Damage Tests
Almost all state DOTs require a moisture damage test in their current mix design specifications. As shown in Figure 12, over 85 percent of the agencies require either the TSR or HWTT. It is interesting to note that three states (California, Montana, and Illinois) that use the HWTT as a rutting test selected the TSR as their test for assessing moisture susceptibility. Arizona and Idaho are two states that use the Immersion Compression Test to evaluate the moisture susceptibility of asphalt mixtures. Arkansas uses the Retained Stability Test per AHTD Test Method 455A-11 and Alaska requires the Asphalt Film Retention Test in accordance with Alaska Test Manual 414.
21
13
9
2
13
10
3
0
Illinois Flexibility Index Test (I-FIT)(1)
Direct Tension Cyclic Fatigue Test(S-VECD) (0)
IDT Energy Ratio Test (IDT ER) (0)
SCB at Intermediate Temperature(SCB-Jc) (1)
DOT Contractor
13
Figure 2-12. U.S. map of current use of moisture damage tests.
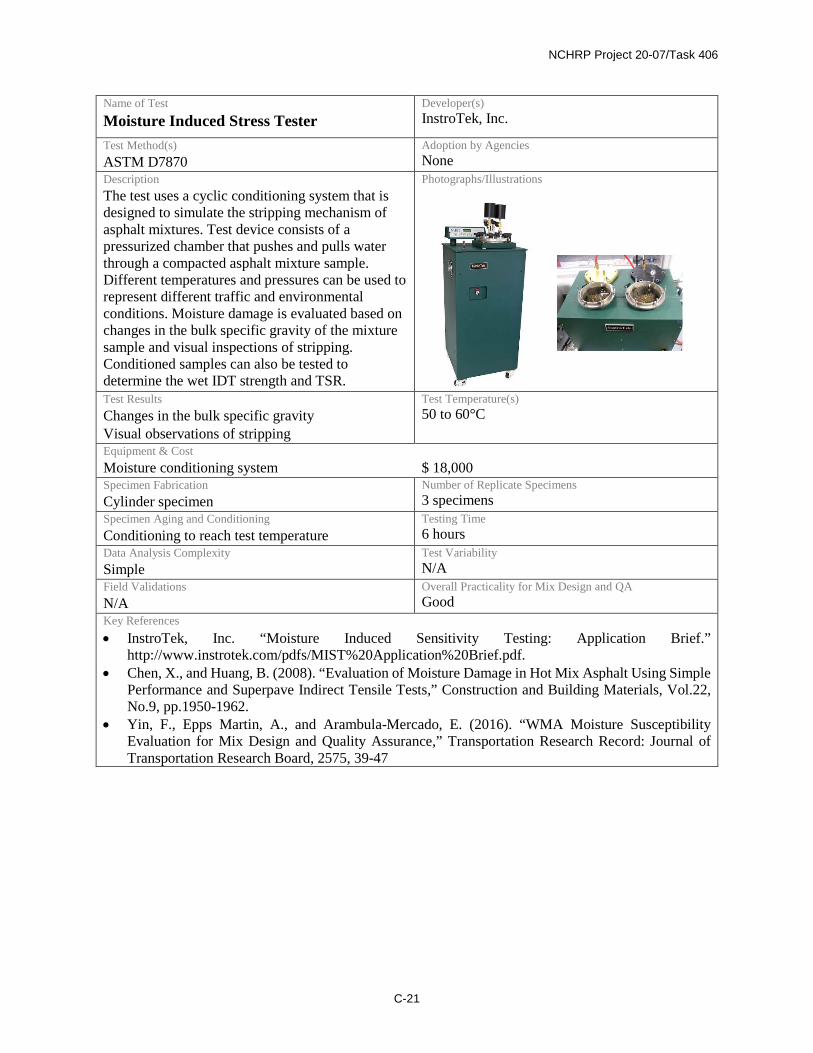
As shown in Figure 2-13, 29 state DOTs and 27 asphalt contractors were in favor of the HWTT as the most potential moisture damage test. The second most selected test was the TSR. This suggests that several state DOTs and contractors would be in favor of changing from TSR to HWTT in the future. In addition, the Moisture Induced Stress Tester (MIST) and Boiling Water Test were nominated by few respondents.
Note: Numbers in parentheses indicates the number of states using that particular test
Figure 2-13. Selection of potential moisture damage tests.
29
25
3
0
27
20
0
1
Hamburg Wheel Tracking Test(HWTT) (7)
Tensile Strength Ratio (TSR)(36)
Moisture Induced Stress Tester(MIST) (0)
Boiling Water Test (0)
DOT Contractor
14
Use of Recycled Materials
A question was asked to state DOTs to determine if they required different performance tests or pass/fail thresholds when recycled materials were included in asphalt mixtures. Among the 44 state DOTs that provided a response, 42 indicated that they use the same tests and same criteria, while the other two indicated that the same tests but different thresholds were required for mixtures with recycled materials.
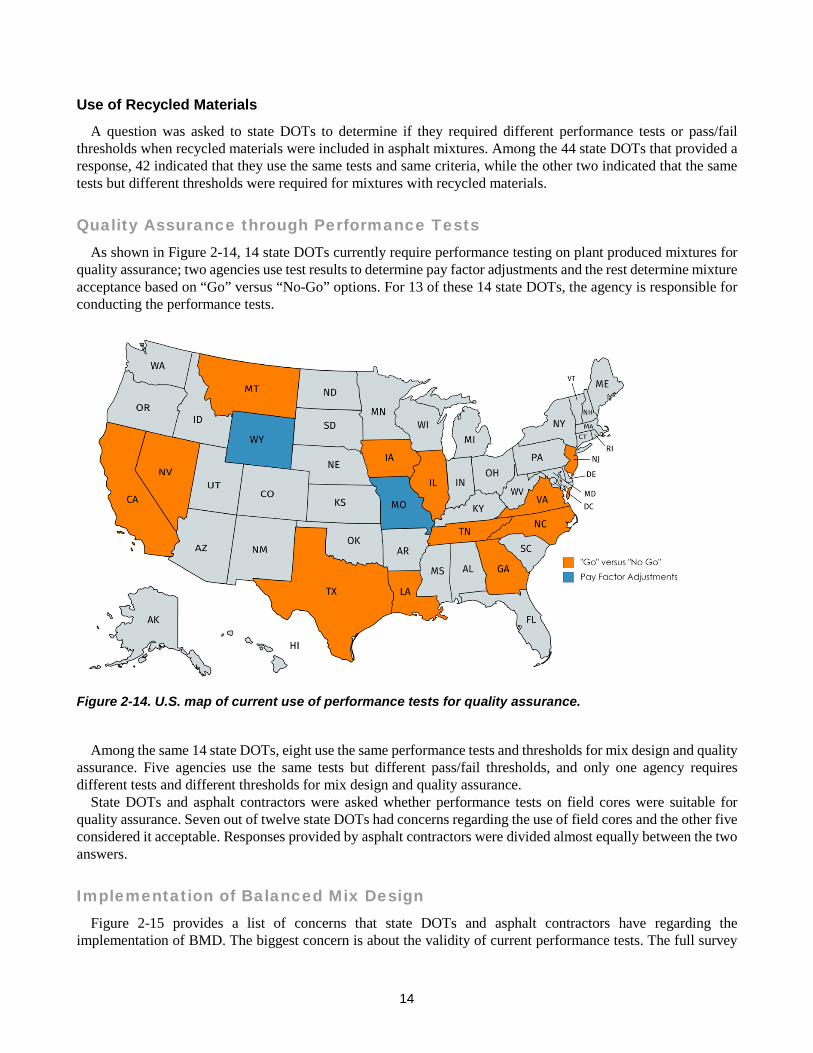
Quality Assurance through Performance Tests As shown in Figure 2-14, 14 state DOTs currently require performance testing on plant produced mixtures for
quality assurance; two agencies use test results to determine pay factor adjustments and the rest determine mixture acceptance based on “Go” versus “No-Go” options. For 13 of these 14 state DOTs, the agency is responsible for conducting the performance tests.
Figure 2-14. U.S. map of current use of performance tests for quality assurance.
Among the same 14 state DOTs, eight use the same performance tests and thresholds for mix design and quality assurance. Five agencies use the same tests but different pass/fail thresholds, and only one agency requires different tests and different thresholds for mix design and quality assurance.
State DOTs and asphalt contractors were asked whether performance tests on field cores were suitable for quality assurance. Seven out of twelve state DOTs had concerns regarding the use of field cores and the other five considered it acceptable. Responses provided by asphalt contractors were divided almost equally between the two answers.
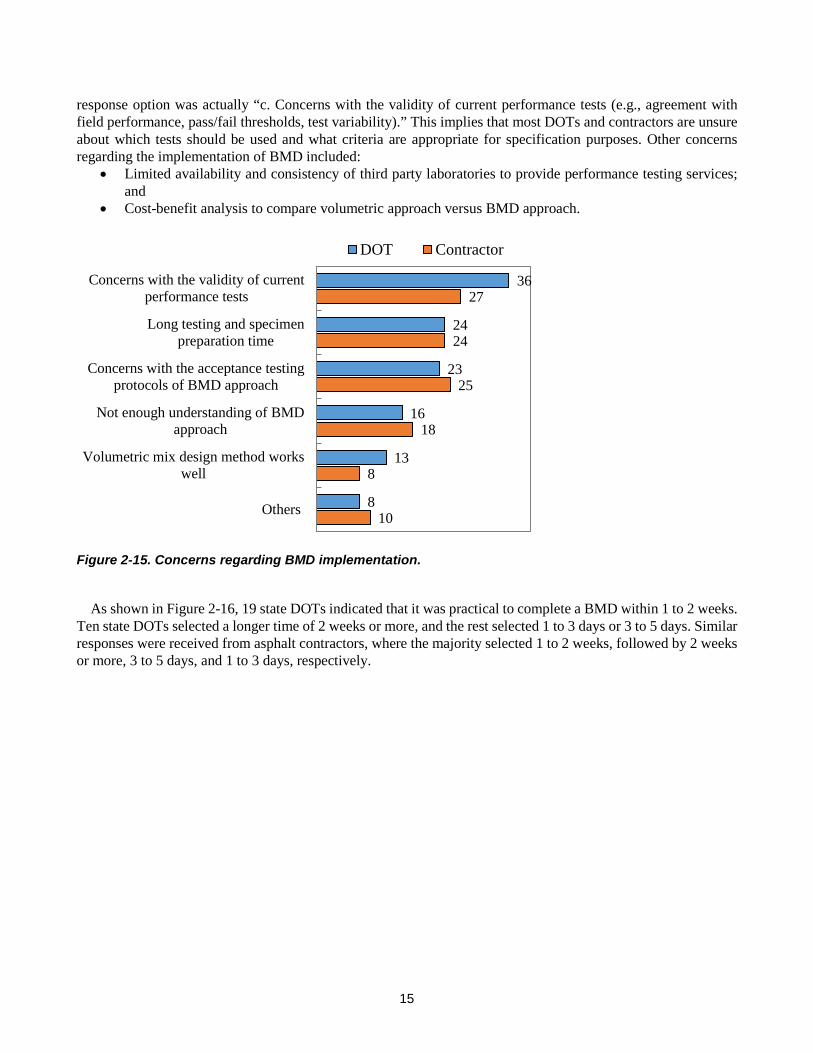
Implementation of Balanced Mix Design Figure 2-15 provides a list of concerns that state DOTs and asphalt contractors have regarding the
implementation of BMD. The biggest concern is about the validity of current performance tests. The full survey
15
response option was actually “c. Concerns with the validity of current performance tests (e.g., agreement with field performance, pass/fail thresholds, test variability).” This implies that most DOTs and contractors are unsure about which tests should be used and what criteria are appropriate for specification purposes. Other concerns regarding the implementation of BMD included:
• Limited availability and consistency of third party laboratories to provide performance testing services; and
• Cost-benefit analysis to compare volumetric approach versus BMD approach.
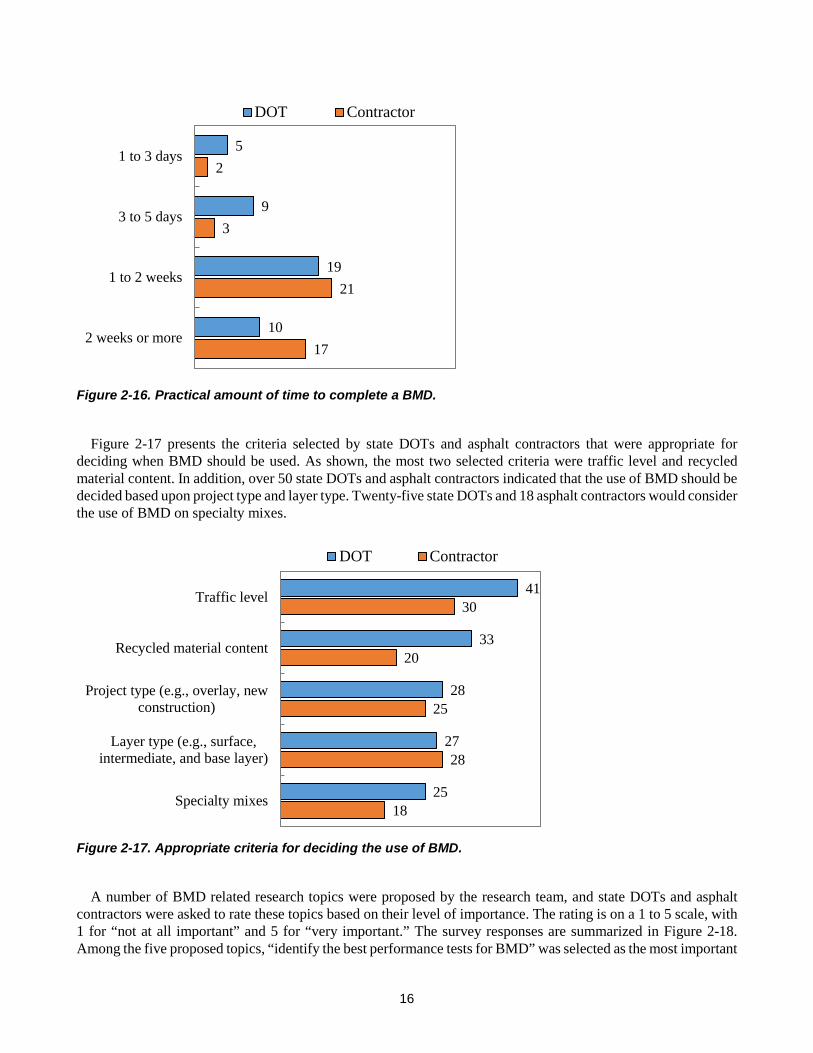
As shown in Figure 2-16, 19 state DOTs indicated that it was practical to complete a BMD within 1 to 2 weeks. Ten state DOTs selected a longer time of 2 weeks or more, and the rest selected 1 to 3 days or 3 to 5 days. Similar responses were received from asphalt contractors, where the majority selected 1 to 2 weeks, followed by 2 weeks or more, 3 to 5 days, and 1 to 3 days, respectively.
36
24
23
16
13
8
27
24
25
18
8
10
Concerns with the validity of currentperformance tests
Long testing and specimenpreparation time
Concerns with the acceptance testingprotocols of BMD approach
Not enough understanding of BMDapproach
Volumetric mix design method workswell
Others
DOT Contractor
16
Figure 2-16. Practical amount of time to complete a BMD.
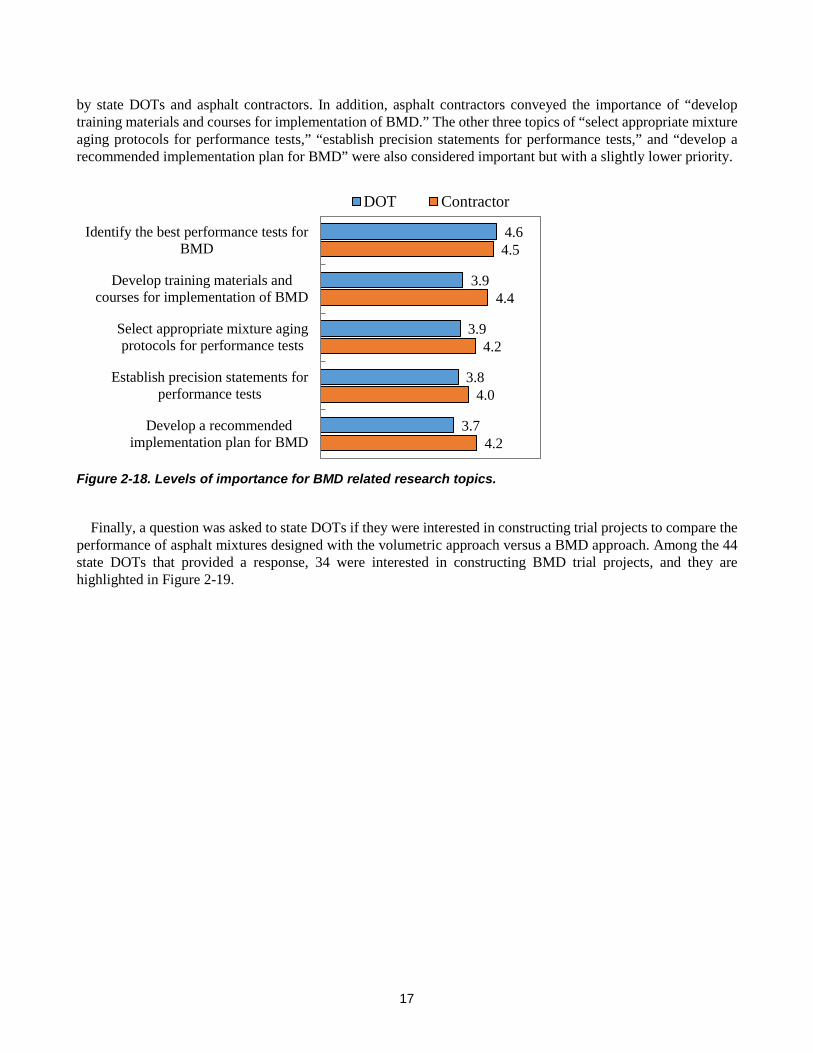
Figure 2-17 presents the criteria selected by state DOTs and asphalt contractors that were appropriate for deciding when BMD should be used. As shown, the most two selected criteria were traffic level and recycled material content. In addition, over 50 state DOTs and asphalt contractors indicated that the use of BMD should be decided based upon project type and layer type. Twenty-five state DOTs and 18 asphalt contractors would consider the use of BMD on specialty mixes.
Figure 2-17. Appropriate criteria for deciding the use of BMD.
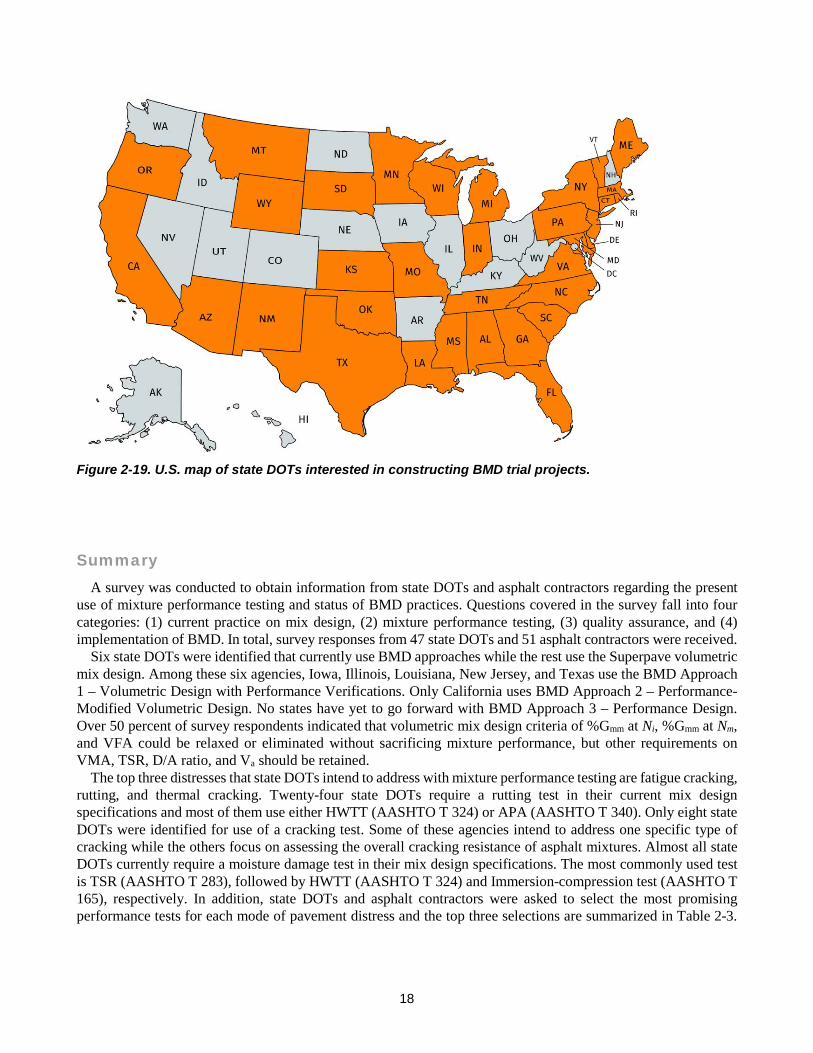
A number of BMD related research topics were proposed by the research team, and state DOTs and asphalt contractors were asked to rate these topics based on their level of importance. The rating is on a 1 to 5 scale, with 1 for “not at all important” and 5 for “very important.” The survey responses are summarized in Figure 2-18. Among the five proposed topics, “identify the best performance tests for BMD” was selected as the most important
5
9
19
10
2
3
21
17
1 to 3 days
3 to 5 days
1 to 2 weeks
2 weeks or more
DOT Contractor
41
33
28
27
25
30
20
25
28
18
Traffic level
Recycled material content
Project type (e.g., overlay, newconstruction)
Layer type (e.g., surface,intermediate, and base layer)
Specialty mixes
DOT Contractor
17
by state DOTs and asphalt contractors. In addition, asphalt contractors conveyed the importance of “develop training materials and courses for implementation of BMD.” The other three topics of “select appropriate mixture aging protocols for performance tests,” “establish precision statements for performance tests,” and “develop a recommended implementation plan for BMD” were also considered important but with a slightly lower priority.
Figure 2-18. Levels of importance for BMD related research topics.
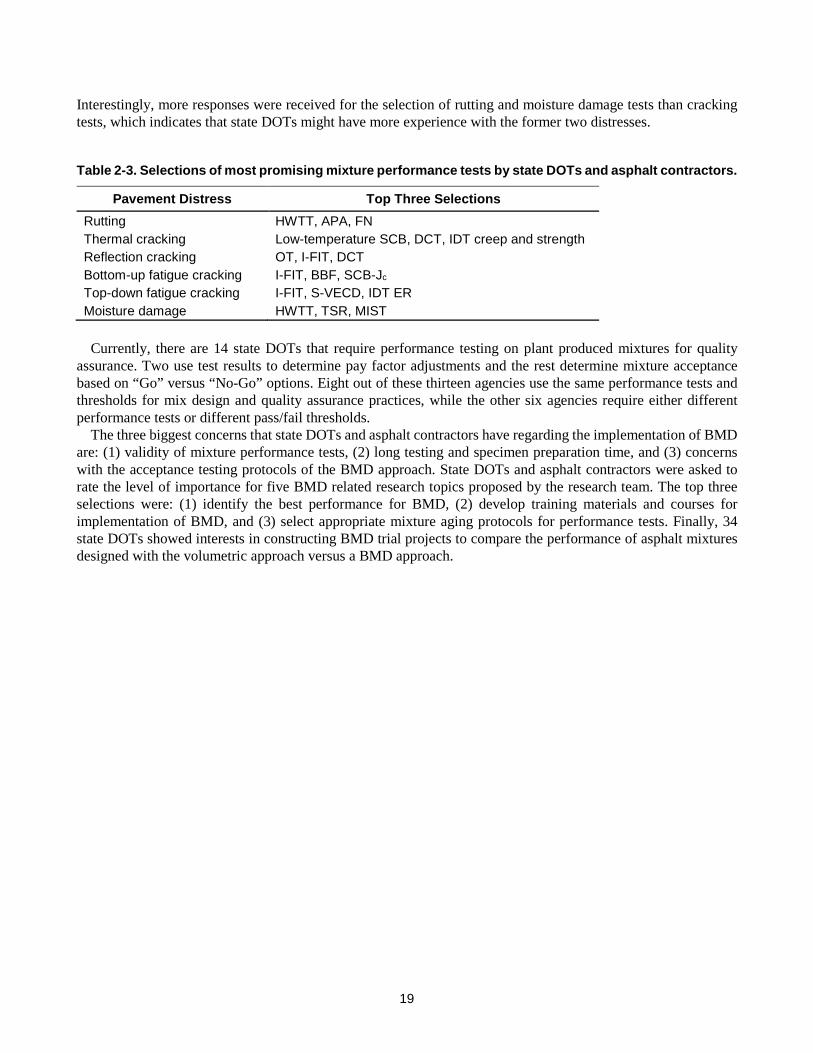
Finally, a question was asked to state DOTs if they were interested in constructing trial projects to compare the performance of asphalt mixtures designed with the volumetric approach versus a BMD approach. Among the 44 state DOTs that provided a response, 34 were interested in constructing BMD trial projects, and they are highlighted in Figure 2-19.
4.6
3.9
3.9
3.8
3.7
4.5
4.4
4.2
4.0
4.2
Identify the best performance tests forBMD
Develop training materials andcourses for implementation of BMD
Select appropriate mixture agingprotocols for performance tests
Figure 2-19. U.S. map of state DOTs interested in constructing BMD trial projects.
Summary A survey was conducted to obtain information from state DOTs and asphalt contractors regarding the present
use of mixture performance testing and status of BMD practices. Questions covered in the survey fall into four categories: (1) current practice on mix design, (2) mixture performance testing, (3) quality assurance, and (4) implementation of BMD. In total, survey responses from 47 state DOTs and 51 asphalt contractors were received.
Six state DOTs were identified that currently use BMD approaches while the rest use the Superpave volumetric mix design. Among these six agencies, Iowa, Illinois, Louisiana, New Jersey, and Texas use the BMD Approach 1 – Volumetric Design with Performance Verifications. Only California uses BMD Approach 2 – Performance-Modified Volumetric Design. No states have yet to go forward with BMD Approach 3 – Performance Design. Over 50 percent of survey respondents indicated that volumetric mix design criteria of %Gmm at Ni, %Gmm at Nm, and VFA could be relaxed or eliminated without sacrificing mixture performance, but other requirements on VMA, TSR, D/A ratio, and Va should be retained.
The top three distresses that state DOTs intend to address with mixture performance testing are fatigue cracking, rutting, and thermal cracking. Twenty-four state DOTs require a rutting test in their current mix design specifications and most of them use either HWTT (AASHTO T 324) or APA (AASHTO T 340). Only eight state DOTs were identified for use of a cracking test. Some of these agencies intend to address one specific type of cracking while the others focus on assessing the overall cracking resistance of asphalt mixtures. Almost all state DOTs currently require a moisture damage test in their mix design specifications. The most commonly used test is TSR (AASHTO T 283), followed by HWTT (AASHTO T 324) and Immersion-compression test (AASHTO T 165), respectively. In addition, state DOTs and asphalt contractors were asked to select the most promising performance tests for each mode of pavement distress and the top three selections are summarized in Table 2-3.
19
Interestingly, more responses were received for the selection of rutting and moisture damage tests than cracking tests, which indicates that state DOTs might have more experience with the former two distresses.
Table 2-3. Selections of most promising mixture performance tests by state DOTs and asphalt contractors.
Currently, there are 14 state DOTs that require performance testing on plant produced mixtures for quality
assurance. Two use test results to determine pay factor adjustments and the rest determine mixture acceptance based on “Go” versus “No-Go” options. Eight out of these thirteen agencies use the same performance tests and thresholds for mix design and quality assurance practices, while the other six agencies require either different performance tests or different pass/fail thresholds.
The three biggest concerns that state DOTs and asphalt contractors have regarding the implementation of BMD are: (1) validity of mixture performance tests, (2) long testing and specimen preparation time, and (3) concerns with the acceptance testing protocols of the BMD approach. State DOTs and asphalt contractors were asked to rate the level of importance for five BMD related research topics proposed by the research team. The top three selections were: (1) identify the best performance for BMD, (2) develop training materials and courses for implementation of BMD, and (3) select appropriate mixture aging protocols for performance tests. Finally, 34 state DOTs showed interests in constructing BMD trial projects to compare the performance of asphalt mixtures designed with the volumetric approach versus a BMD approach.
20
C H A P T E R 3
Literature Review on the Development and State of the Practice of Asphalt Mixture Performance Testing
Background The original vision of the Superpave mix design system was to include three levels. Level I was envisioned to
be for low traffic pavements and the mix design requirements would be primarily based on traditional volumetric properties. Level II would be used for the majority of projects that carry moderate traffic levels and would include volumetric requirements plus a limited set of mixture performance tests. Level III would be for high traffic pavements and would also start with a volumetric based mix design followed by an expanded set of advanced performance tests. However, the proposed performance tests were never implemented, primarily because they were not practical for routine use for the thousands of mix designs used each year in the United States.
In the early years of Superpave implementation, the primary focus was on rutting resistance. Mix designs for moderate and high traffic pavements were designed for improved rutting resistance by specifying a higher grade of asphalt binder and higher quality aggregates. Many states also added a rutting test requirement (e.g., the APA) for mix designs for moderate and high traffic projects. Twenty years later, most highway agencies now report that rutting problems have been virtually eliminated. However, as the early Superpave projects have matured, many agencies have indicated that the primary form of distress for asphalt pavements is now cracking of some form or another. There are several possible contributing factors to increased occurrence of pavement cracking, including issues with the mix designs, increased use of many different recycled materials and byproducts, problems with the quality of construction, and failure to adequately address underlying pavement distresses during pavement rehabilitation. It is now well recognized that the current mix design system has some shortcomings. Many highway agencies and the asphalt paving industry are revisiting the possibility of using mixture performance tests in the mix design process to extend the service life of asphalt pavements.
Limitations of Volumetric Mix Design Method In the Superpave system, proportioning of the aggregates and the asphalt binder relies primarily on volumetric
properties. In essence, the difference between two volumetric properties, air voids (Va) and VMA, establish the minimum volume of effective binder (Vbe) for the mixture. However, calculation of a mixture’s VMA is highly dependent on an accurate determination of the total aggregate bulk specific gravity (Gsb). Unfortunately, there are considerable issues of accuracy and variability associated with determinations of aggregate bulk specific gravity, causing significant concern about whether or not the correct amount of asphalt is in the mix design. The amount of asphalt binder in the mixture has a major impact on the performance of an asphalt pavement. Mixtures with excessive asphalt binder are susceptible to permanent deformation (i.e., rutting), while those with inadequate asphalt binder content are prone to cracking, raveling, and other durability related pavement distresses.
In addition to the quantity used in a mixture, the quality of asphalt binder also plays a critical role. The Superpave system for performance grading (PG) of binders is designed to provide the appropriate properties (i.e. quality) of virgin binder for specific climate and traffic conditions. In many cases, polymer modified binders are
21
necessary to meet those requirements. However, in the last few decades, asphalt binder production processes have changed and other additives have been used to help meet PG specifications. For example, polyphosphoric acid (PPA) and re-refined engine oil bottoms (REOB) have been incorporated in asphalt binders in some regions of the U.S. in order to achieve desirable high-temperature and low-temperature PG grades, respectively. Whether or not those additives improve or diminish the performance of asphalt mixes is not evident with the volumetric mix design method.
Compounding concerns about the quality of some virgin asphalt binders, the increased use of RAP and RAS raises more questions about the interactions (or lack thereof) of recycled binders with virgin binders, ultimately, a concern about how these materials affect field performance. Furthermore, the use of warm-mix asphalt (WMA) additives, polymers, and fibers have raised additional questions. Asphalt mixtures containing those additives are likely to have different engineering properties that cannot be assessed in the current volumetric mix design practice. Therefore, many asphalt technologists now believe that performance tests need to be included as part of the mix design procedure to help ensure desirable pavement performance in the field.
Refinements to the Superpave Mix Design Procedure A number of highway agencies have started to either explore or adopt modifications aimed at refining the mix
design procedure to improve performance, especially the cracking resistance of asphalt mixtures. Most of these modifications are intended to increase the optimum asphalt content during mix design. The following subsections provide a brief discussion on these modifications.
Lowering Gyration Levels (Ndesign)
Lowering the Ndesign by itself is not likely to result in an increase in the optimum asphalt content unless the aggregate gradation is fixed. However, when gradations are not fixed, the aggregate blend can be adjusted to obtain the same effective asphalt content as the higher gyration mix design. The aggregate blend adjustments can help improve mixes by enabling finer gradations that are generally easier to compact than coarse graded mixes in the laboratory and in the field. Research conducted as part of NCHRP Project 9-9(1) indicated that the compactive efforts specified in AASHTO R 35 were too high. Data from several projects across the United States showed that pavements were not densified under traffic to the same levels as achieved in the Superpave Gyratory Compactor (SGC). The recommendation was to reduce the Ndesign level by 20-25% depending on the design traffic (Prowell and Brown, 2007). Many agencies have decreased the Ndesign with successful field performance.
Lowering Design Air Voids
Lowering the target air void content during mix design will increase the optimum asphalt content only if VMA criteria are kept unchanged. However, mix design VMA results are challenging to validate because of the poor reproducibility of the aggregate bulk specific gravity. If air void content is also a quality assurance criteria for asphalt mix production, the as-produced air void target must also be changed.
Increasing Minimum VMA
VMA represents the total volume of intergranular space between aggregate particles of a compacted mixture. For a given air void content, increasing the VMA will yield a higher optimum asphalt content. For a given compactive effort (Ndesign), VMA can only be changed by changing the aggregate blend. However, as noted above, VMA criteria are quite challenging to validate and enforce because of the poor reproducibility of the aggregate bulk specific gravity.
22
Air Voids Regression Approach
In this approach, a mix is designed using standard volumetric procedure and criteria including a target air void content of 4.0%. The asphalt content is then increased to achieve a “regressed” target of 3.5% or 3.0% air voids. Once the job mix formula (JMF) and aggregate proportions are locked in, the added binder content typically increases up to 0.4%. Potential risks associated with this approach include: (1) even with the increased asphalt content, the mixture may still not have adequate cracking resistance, or (2) the added binder could make the mixture susceptible to rutting.
A survey for the AASHTO Subcommittee on Materials conducted in 2014 gathered information regarding modifications to the Superpave mix design standard, AASHTO R 35, by state DOTs related to design air voids, design gyrations, and minimum VMA (Aschenbrener, 2014). Among the 26 DOTs that responded to this survey, seven states have decreased target air voids, sixteen states reported lower design gyrations, and eight states increased minimum VMA requirement. It should be noted that some states adopted a combination of the above-mentioned approaches in their current mix design practices.
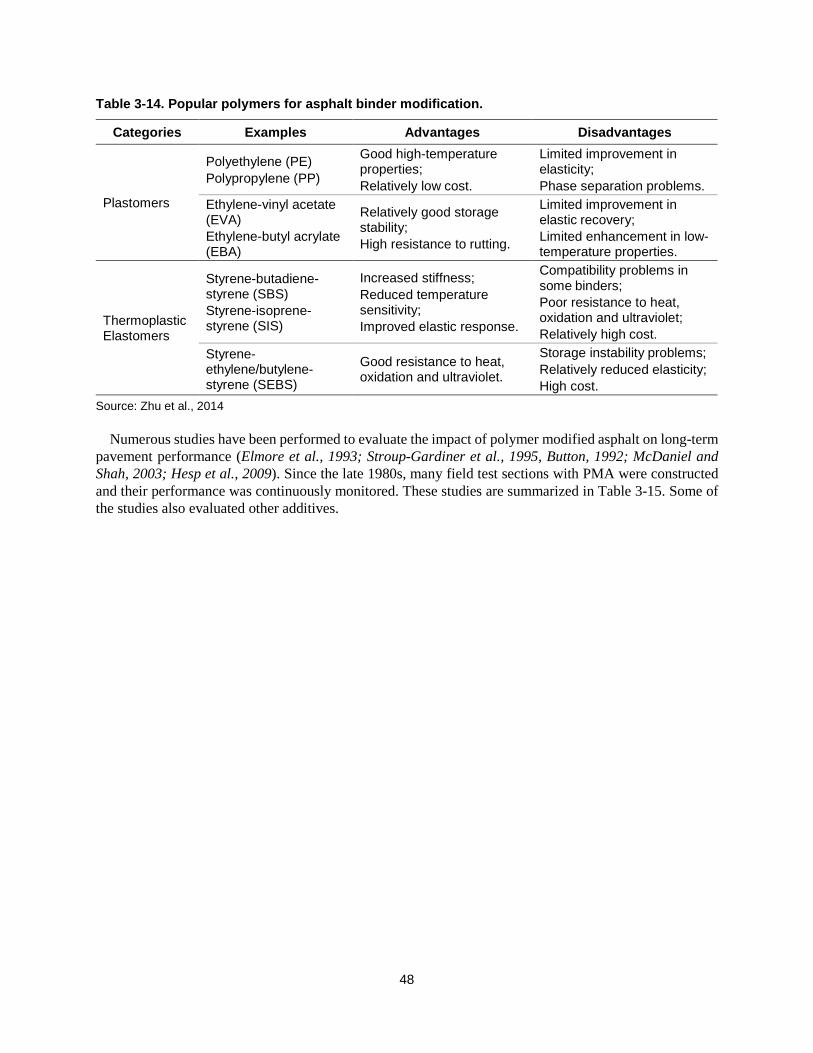
Polymer Modification
It is common practice to specify polymer-modified binders in mixtures subjected to high traffic volumes primarily to improve rutting resistance. Some agencies such as Nevada and Louisiana DOTs specify polymer modified binders in all surface course mixtures (Hajj et al., 2009). Overall, polymer modification has been shown to reduce all forms of pavement distress, increasing the life of asphalt pavements (Isacsson and Lu, 1995; Bahia et al., 2001; Bulatović et al., 2013; Alataş and Yilmaz, 2013).
NCHRP Project 9-10 introduced Superpave protocols for modified asphalt binders (Bahia et al., 2001). Revisions to the binder grading system were suggested in this project to include a three-level grading scheme depending on which factors are considered in the binder selection. For Level I grading, only climate is considered; for Level II, traffic conditions are added; and for Level III, climate, traffic, and pavement structure are all considered. The most recent effort to refine mixture design with polymer-modified mixtures includes the development of the AASHTO M 332-14 Standard Specification for Performance-Graded Asphalt Binder Using Multiple Stress Creep Recovery (MSCR) Test. Under this standard specification, grading designations are related to the average seven-day maximum pavement design temperature, minimum pavement design temperature, and traffic loading.
Recycled Materials and Blending Charts
RAP and RAS are the two recycled materials that receive the most importance as they offer a partial substitute for virgin aggregates and asphalt binder. Mixtures incorporating higher amounts of RAP and/or RAS will have higher stiffness due to blending of aged and virgin binders. This results in the mixture being more susceptible to cracking and durability issues, which limits the amount of recycled materials that can be added to asphalt mixtures. A blending chart is often used to determine the minimum and maximum amounts of the virgin asphalt binder (and conversely the maximum and minimum amounts of RAP and RAS in the recycled mix) so that the recycled asphalt blend conforms to a specific PG grade. Several changes were made to AASHTO R 35 and the standard specification M323 based on results and findings of NCHRP projects D9-12 and 9-46 (McDaniel and Anderson, 2001; West et al., 2013).
Warm-Mix Asphalt
One of the benefits that is often cited for WMA is improved asphalt mixture durability due to reduced aging of the binder during plant production (FHWA, 2012). Willis et al. (2012) found that RAP mixtures produced with WMA technologies had improved cracking resistance as measured by the IDT Energy Ratio test. NCHRP Project 9-43 recommended refinements to the Superpave mix design procedure to design WMA mixtures (Bonaquist,
23
2011). To facilitate the implementation of the recommendations by NCHRP Project 9-43, an appendix was added to the Superpave mix design procedure, AASHTO R 35.
Balanced Mixture Design
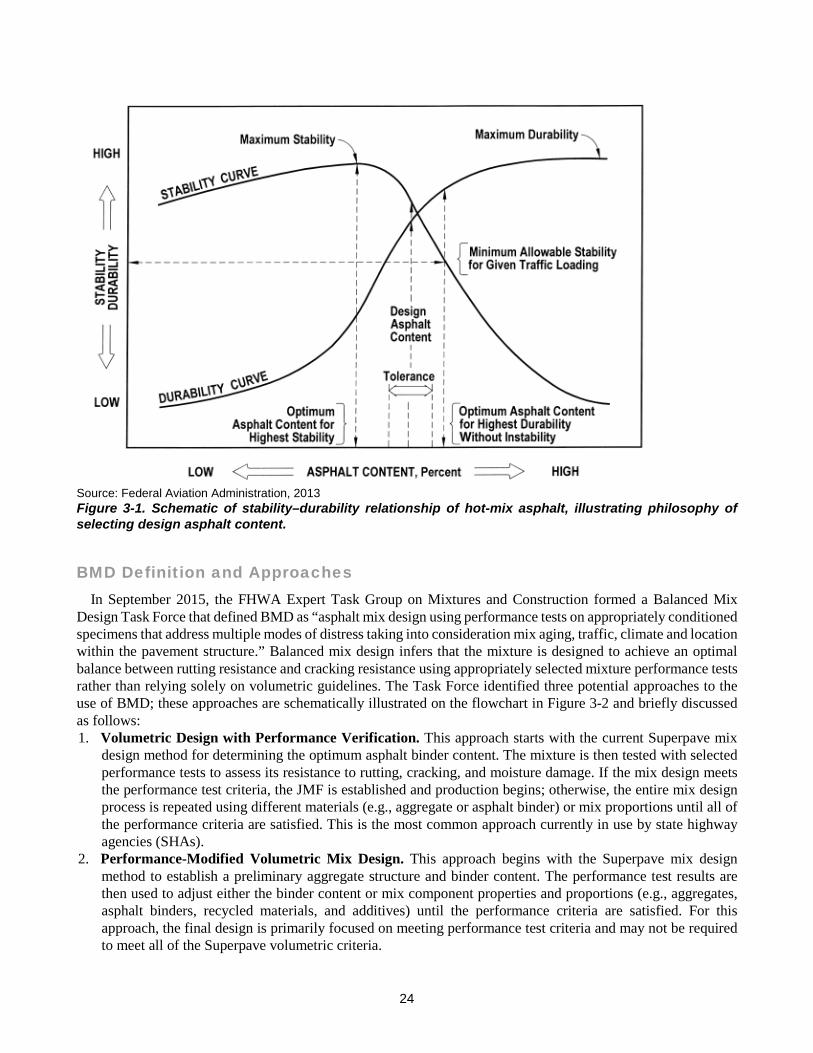
The concept of balancing mix designs for stability and durability dates back to Marshall and Hveem mixture design concepts, as depicted in Figure 3-1. This figure illustrates that the optimum asphalt content is not merely a function of the air voids at a designated compaction effort, but essentially optimizes the asphalt content to achieve desired rutting and fatigue performance. Obviously, from a construction standpoint, considerations are needed regarding the workability to achieve desired in-place density of the pavement layer. Hveem’s mix design philosophy was that a sufficient asphalt content was needed to satisfy aggregate absorption and to provide a minimum film thickness on the surface of the aggregates (Roberts et al., 1996). Mixtures were required to provide a minimum shear resistance (measured by the Hveem stabilometer) and a minimum tensile strength to resist cracking (measured by the cohesiometer). Stability and cohesion were influenced by the aggregate properties and the amount of asphalt binder. For durability, Hveem developed the swell test and moisture vapor sensitivity test to measure the reaction of the mix to water. The swell test used water and the vapor sensitivity test used moisture vapor.
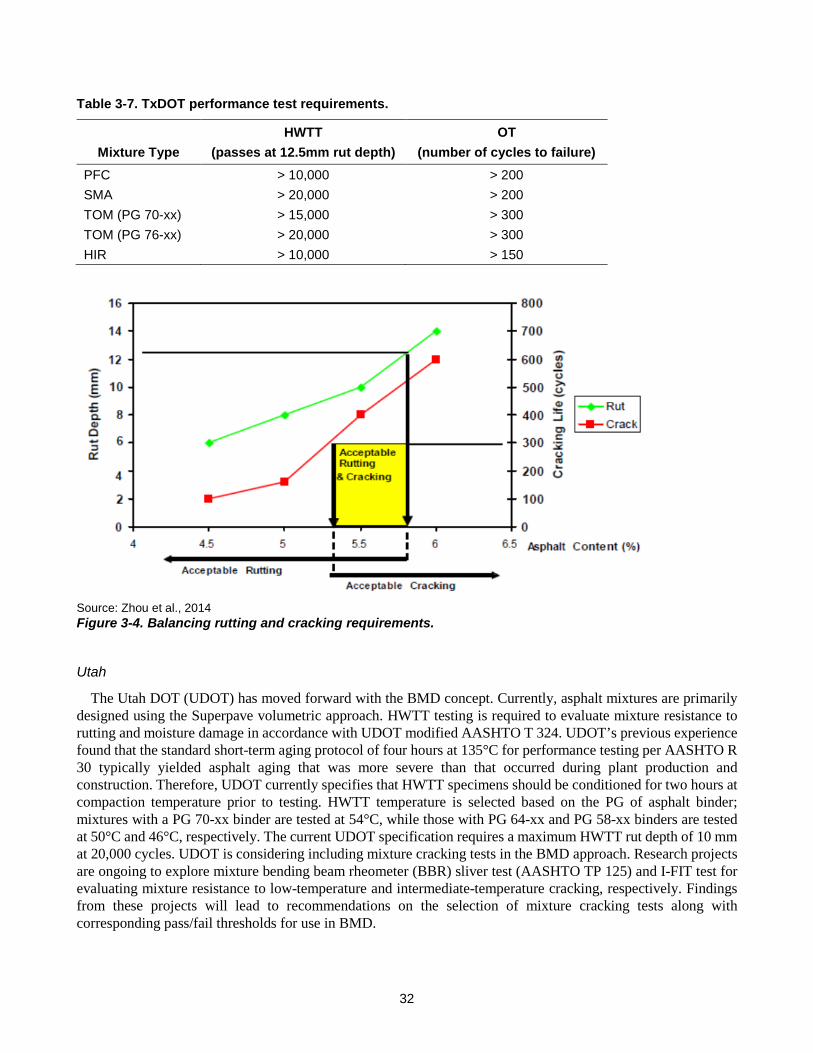
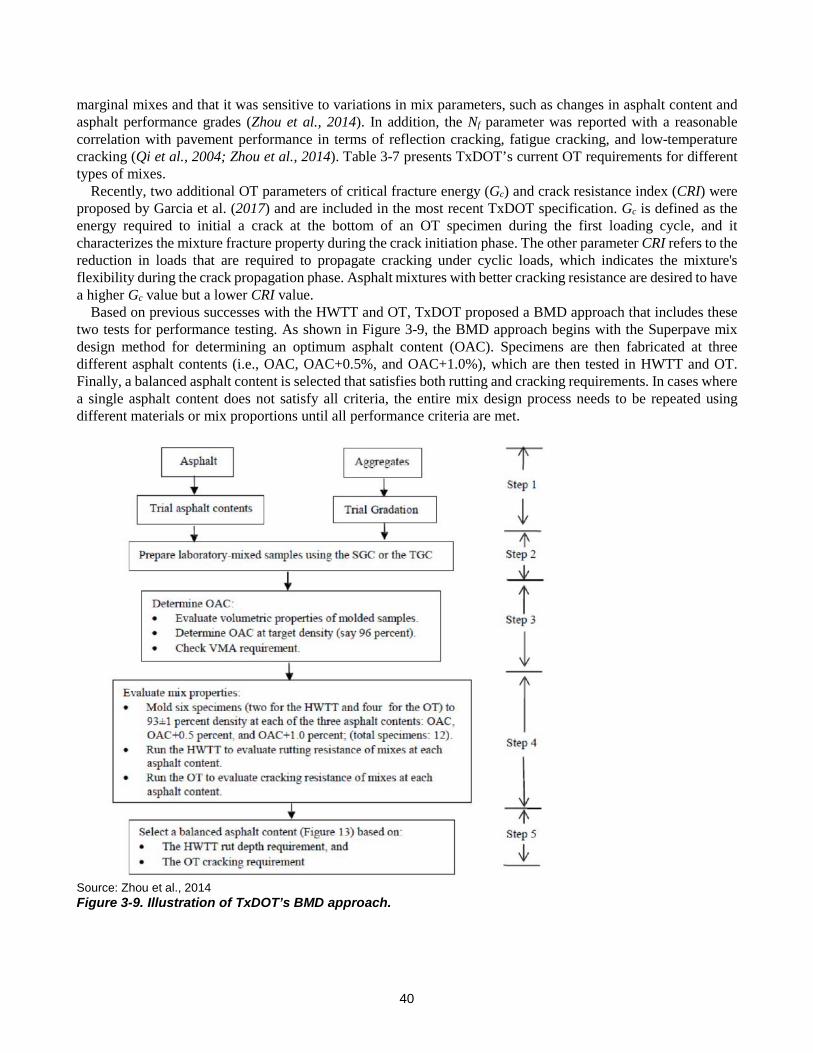
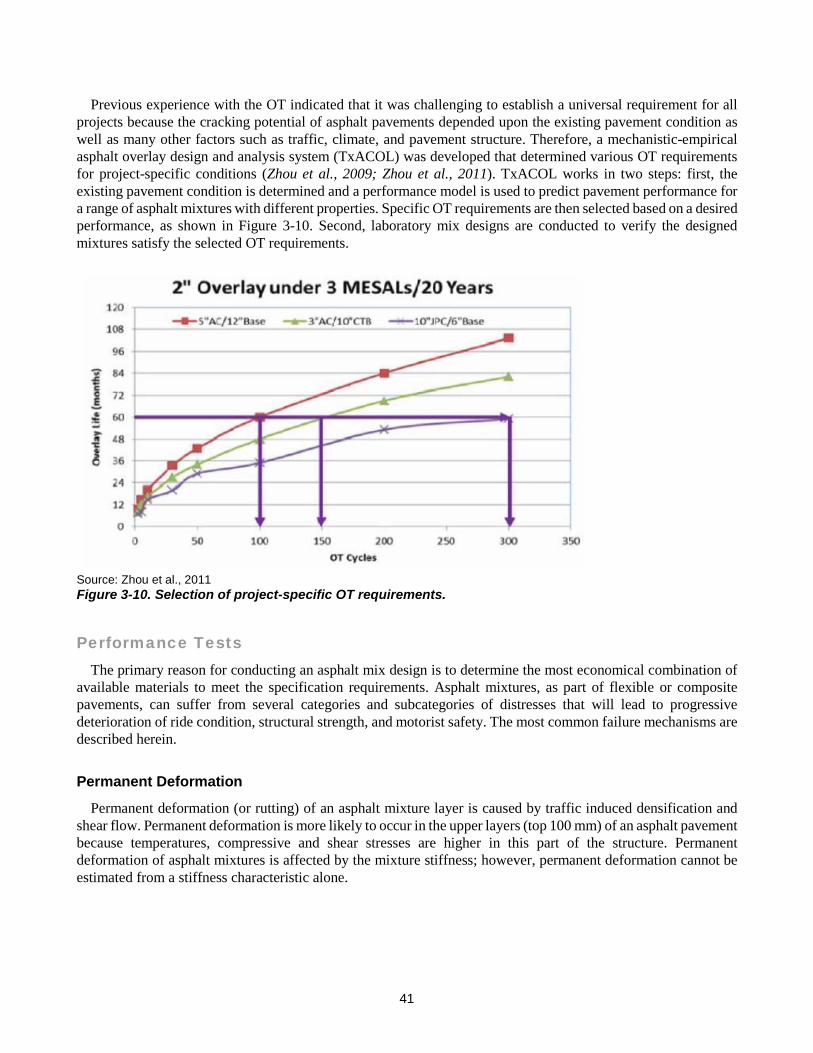
The original intent of the Superpave mix design procedure was to incorporate performance testing to verify the rutting, fatigue cracking, and thermal cracking performance of asphalt mixtures. However, due to the complexity of the test procedures and devices that were ultimately recommended, performance testing was deemed impractical and never implemented on a national level. The balanced mix design concept was initially developed by researchers at the Texas A&M Transportation Institute (TTI) using the HWTT to evaluate rutting resistance and the OT to evaluate cracking resistance (Zhou et al., 2006). This approach used performance tests to determine binder content and grade that provided adequate resistance to rutting and load associated cracking. In a recent evaluation of field sections using the balanced mix design approach, TTI researchers concluded that it is necessary to vary the performance criteria depending on the climate at the project location (Zhou et al., 2014). Other state agencies have followed the same concept and their experiences are discussed in the following section.
24
Source: Federal Aviation Administration, 2013 Figure 3-1. Schematic of stability–durability relationship of hot-mix asphalt, illustrating philosophy of selecting design asphalt content.
BMD Definition and Approaches In September 2015, the FHWA Expert Task Group on Mixtures and Construction formed a Balanced Mix
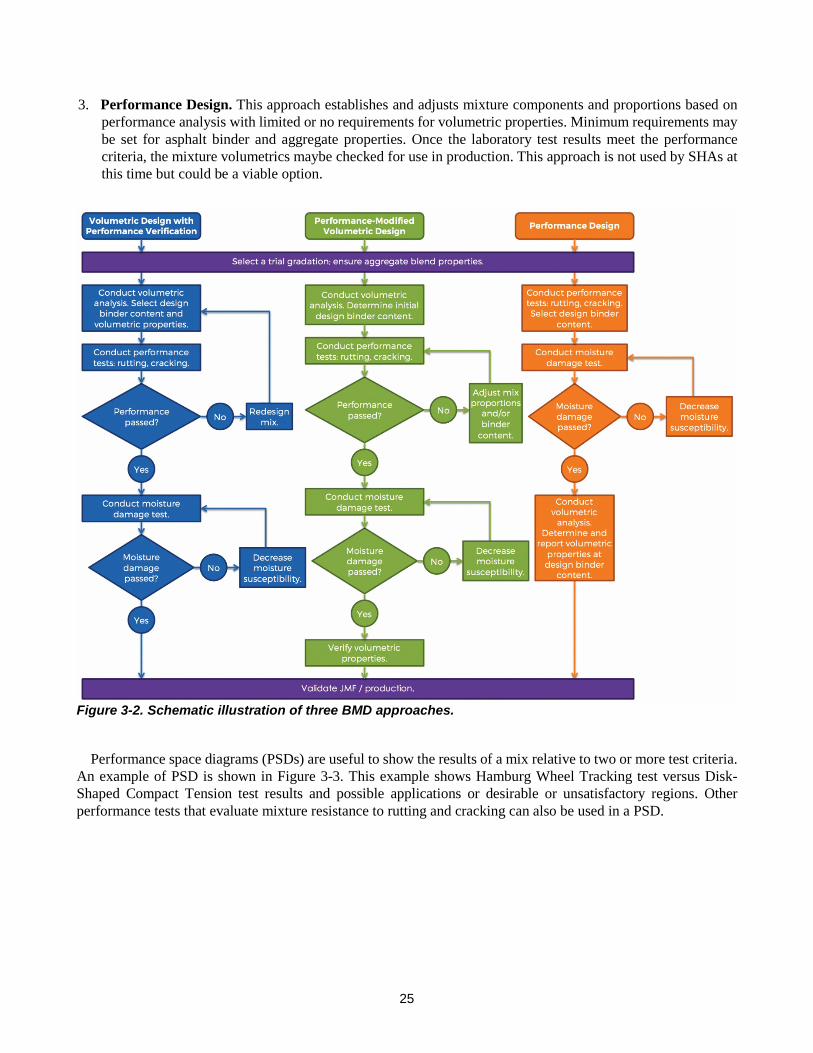
Design Task Force that defined BMD as “asphalt mix design using performance tests on appropriately conditioned specimens that address multiple modes of distress taking into consideration mix aging, traffic, climate and location within the pavement structure.” Balanced mix design infers that the mixture is designed to achieve an optimal balance between rutting resistance and cracking resistance using appropriately selected mixture performance tests rather than relying solely on volumetric guidelines. The Task Force identified three potential approaches to the use of BMD; these approaches are schematically illustrated on the flowchart in Figure 3-2 and briefly discussed as follows: 1. Volumetric Design with Performance Verification. This approach starts with the current Superpave mix
design method for determining the optimum asphalt binder content. The mixture is then tested with selected performance tests to assess its resistance to rutting, cracking, and moisture damage. If the mix design meets the performance test criteria, the JMF is established and production begins; otherwise, the entire mix design process is repeated using different materials (e.g., aggregate or asphalt binder) or mix proportions until all of the performance criteria are satisfied. This is the most common approach currently in use by state highway agencies (SHAs).
2. Performance-Modified Volumetric Mix Design. This approach begins with the Superpave mix design method to establish a preliminary aggregate structure and binder content. The performance test results are then used to adjust either the binder content or mix component properties and proportions (e.g., aggregates, asphalt binders, recycled materials, and additives) until the performance criteria are satisfied. For this approach, the final design is primarily focused on meeting performance test criteria and may not be required to meet all of the Superpave volumetric criteria.
25
3. Performance Design. This approach establishes and adjusts mixture components and proportions based on performance analysis with limited or no requirements for volumetric properties. Minimum requirements may be set for asphalt binder and aggregate properties. Once the laboratory test results meet the performance criteria, the mixture volumetrics maybe checked for use in production. This approach is not used by SHAs at this time but could be a viable option.
Figure 3-2. Schematic illustration of three BMD approaches.
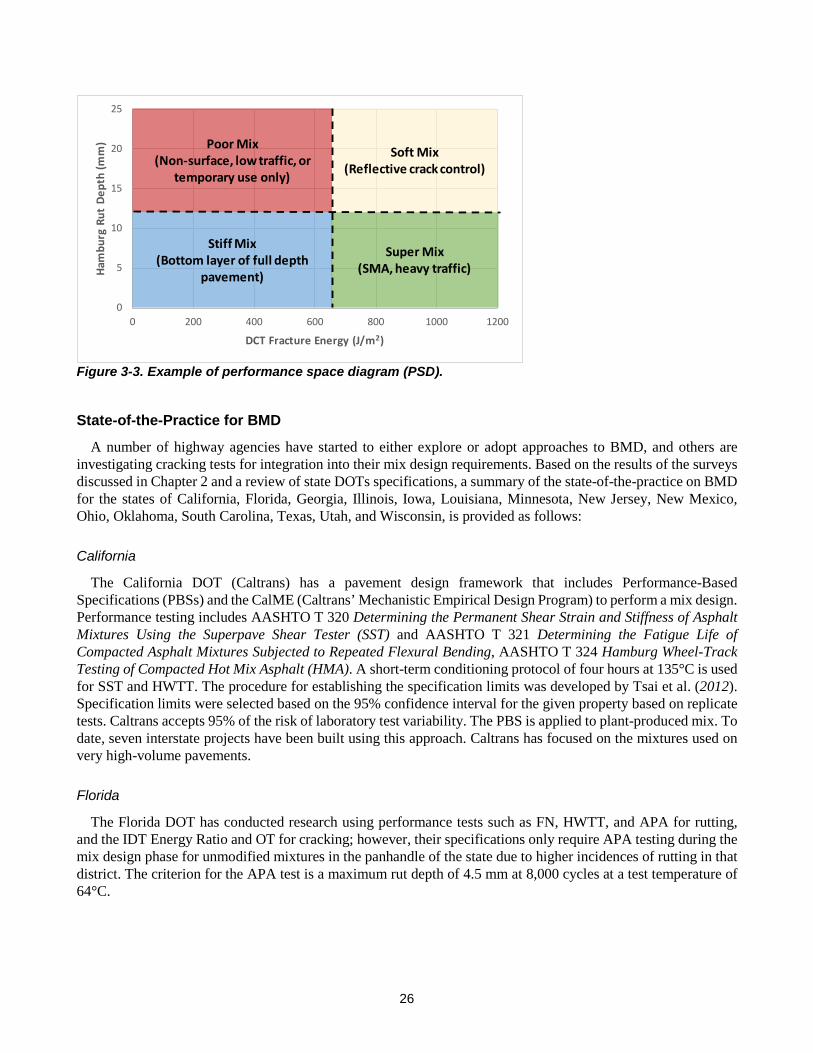
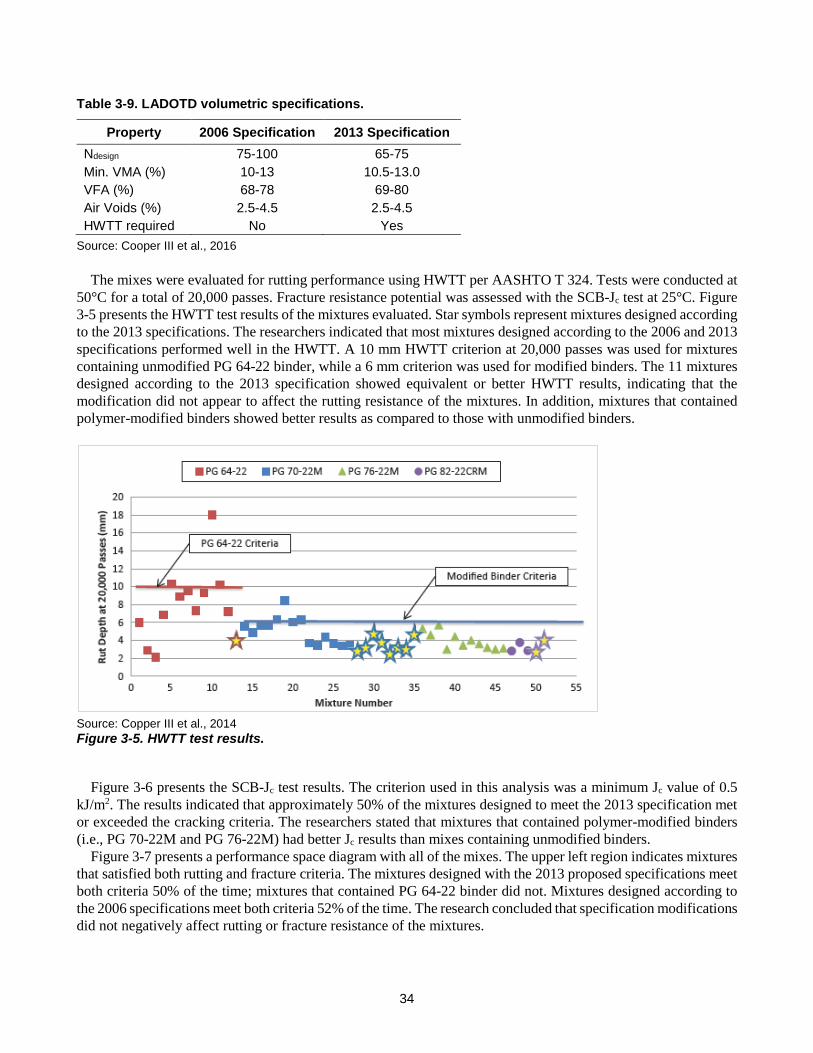
Performance space diagrams (PSDs) are useful to show the results of a mix relative to two or more test criteria. An example of PSD is shown in Figure 3-3. This example shows Hamburg Wheel Tracking test versus Disk-Shaped Compact Tension test results and possible applications or desirable or unsatisfactory regions. Other performance tests that evaluate mixture resistance to rutting and cracking can also be used in a PSD.
26
Figure 3-3. Example of performance space diagram (PSD).
State-of-the-Practice for BMD
A number of highway agencies have started to either explore or adopt approaches to BMD, and others are investigating cracking tests for integration into their mix design requirements. Based on the results of the surveys discussed in Chapter 2 and a review of state DOTs specifications, a summary of the state-of-the-practice on BMD for the states of California, Florida, Georgia, Illinois, Iowa, Louisiana, Minnesota, New Jersey, New Mexico, Ohio, Oklahoma, South Carolina, Texas, Utah, and Wisconsin, is provided as follows:
California
The California DOT (Caltrans) has a pavement design framework that includes Performance-Based Specifications (PBSs) and the CalME (Caltrans’ Mechanistic Empirical Design Program) to perform a mix design. Performance testing includes AASHTO T 320 Determining the Permanent Shear Strain and Stiffness of Asphalt Mixtures Using the Superpave Shear Tester (SST) and AASHTO T 321 Determining the Fatigue Life of Compacted Asphalt Mixtures Subjected to Repeated Flexural Bending, AASHTO T 324 Hamburg Wheel-Track Testing of Compacted Hot Mix Asphalt (HMA). A short-term conditioning protocol of four hours at 135°C is used for SST and HWTT. The procedure for establishing the specification limits was developed by Tsai et al. (2012). Specification limits were selected based on the 95% confidence interval for the given property based on replicate tests. Caltrans accepts 95% of the risk of laboratory test variability. The PBS is applied to plant-produced mix. To date, seven interstate projects have been built using this approach. Caltrans has focused on the mixtures used on very high-volume pavements.
Florida
The Florida DOT has conducted research using performance tests such as FN, HWTT, and APA for rutting, and the IDT Energy Ratio and OT for cracking; however, their specifications only require APA testing during the mix design phase for unmodified mixtures in the panhandle of the state due to higher incidences of rutting in that district. The criterion for the APA test is a maximum rut depth of 4.5 mm at 8,000 cycles at a test temperature of 64°C.
0
5
10
15
20
25
0 200 400 600 800 1000 1200
Ham
burg
Rut
Dep
th (m
m)
DCT Fracture Energy (J/m2)
Stiff Mix(Bottom layer of full depth
pavement)
Super Mix(SMA, heavy traffic)
Poor Mix(Non-surface, low traffic, or
temporary use only)
Soft Mix(Reflective crack control)
27
Georgia
The Georgia DOT has been using APA and a moisture susceptibility test for many years as a standard part of the mix design approval and field verification of all asphalt mixtures. Georgia Development Test (GDT)-115 is the procedure for APA testing. Field mixture acceptance includes evaluating rutting potential, asphalt content, gradation, and in-place density. The APA criteria presented in Georgia’s Standard Operating Procedure 2 from 2014 allow an additional ± 2-mm tolerance for field-produced mix verification. The agency requires different APA test temperatures based on the mixture location in the pavement’s structure. The 19-mm and 25-mm Superpave mixes are tested at 49°C, and 9.5-mm and 12.5-mm Superpave mixes are tested at 64°C. Moisture susceptibility testing is of importance in Georgia because of the stripping potential of numerous aggregates routinely used in asphalt mixtures. The test method, GDT-66, is a modified TSR procedure that uses a much slower loading rate than AASHTO T 283. Specimen fabrication targets 7.0 ± 1.0% air voids for all dense-graded mixtures and 6.0 ± 1.0% air voids for SMA mixtures. Stripping of particles is rated according to the degree of stripping (categorized as none, slight, moderate, and severe). The HWTT may also be conducted for special testing following AASHTO T 324.
Illinois
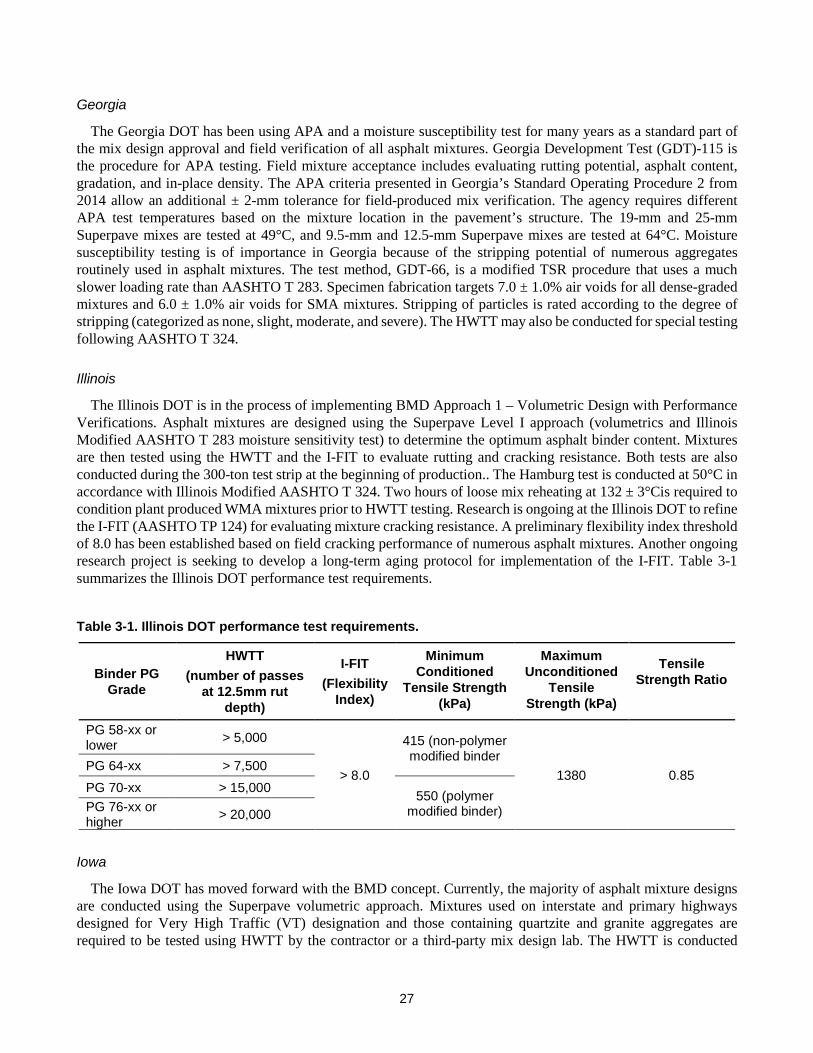
The Illinois DOT is in the process of implementing BMD Approach 1 – Volumetric Design with Performance Verifications. Asphalt mixtures are designed using the Superpave Level I approach (volumetrics and Illinois Modified AASHTO T 283 moisture sensitivity test) to determine the optimum asphalt binder content. Mixtures are then tested using the HWTT and the I-FIT to evaluate rutting and cracking resistance. Both tests are also conducted during the 300-ton test strip at the beginning of production.. The Hamburg test is conducted at 50°C in accordance with Illinois Modified AASHTO T 324. Two hours of loose mix reheating at 132 ± 3°Cis required to condition plant produced WMA mixtures prior to HWTT testing. Research is ongoing at the Illinois DOT to refine the I-FIT (AASHTO TP 124) for evaluating mixture cracking resistance. A preliminary flexibility index threshold of 8.0 has been established based on field cracking performance of numerous asphalt mixtures. Another ongoing research project is seeking to develop a long-term aging protocol for implementation of the I-FIT. Table 3-1 summarizes the Illinois DOT performance test requirements.
Table 3-1. Illinois DOT performance test requirements.
The Iowa DOT has moved forward with the BMD concept. Currently, the majority of asphalt mixture designs are conducted using the Superpave volumetric approach. Mixtures used on interstate and primary highways designed for Very High Traffic (VT) designation and those containing quartzite and granite aggregates are required to be tested using HWTT by the contractor or a third-party mix design lab. The HWTT is conducted
28
largely in accordance with AASHTO T 324 along with modifications specified in Iowa DOT test procedure Matls IM 319, Moisture Sensitivity Testing of Asphalt Mixtures. The HWTT temperature is 40°C for PG 58-xx asphalt binders and 50°C for all other binder grades. Mix design specimens prepared for HWTT are short-term aged for two hours at 135°C for HMA and 116°C for WMA. HMA production samples are compacted with minimum reheating while WMA production samples need to be reheated for two hours at 135°C prior to compaction. The current specification requires a minimum HWTT stripping inflection point (SIP) of 10,000 for plant produced mixtures with traffic designation Standard (S), and 14,000 for mixtures with traffic designations High (H) and Very High (V). The Iowa DOT also requires additional performance testing and criteria for certain types of asphalt mixtures. For example, high-performance thin overlay (HPTO) mixtures are required to satisfy the HWTT rutting criterion of no more than 8 mm rut depth at 8,000 passes. Mixtures used for asphalt interlayers should also be tested in the BBF test to verify their resistance to bottom-up fatigue cracking. These mixtures are required to meet the minimum threshold of 100,000 cycles to failure at 2,000 microstrain. In addition, the Iowa DOT considers implementing the DCT test in BMD to evaluate mixture resistance to thermal cracking.
Louisiana
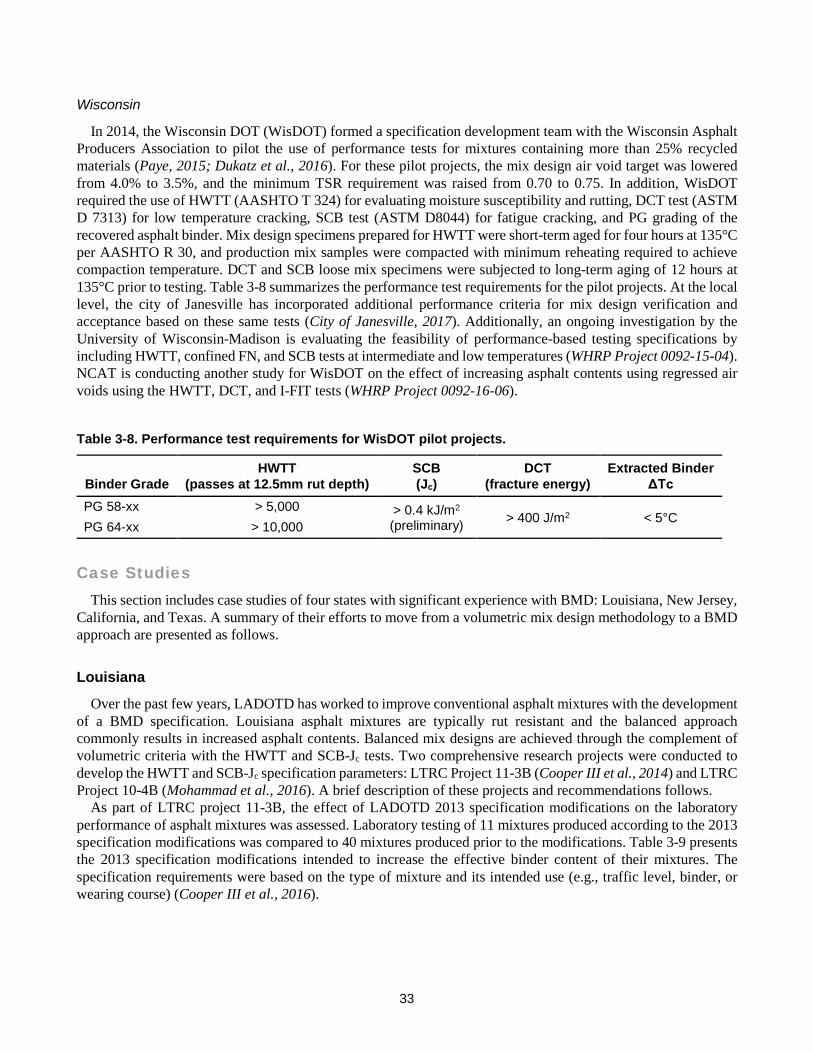
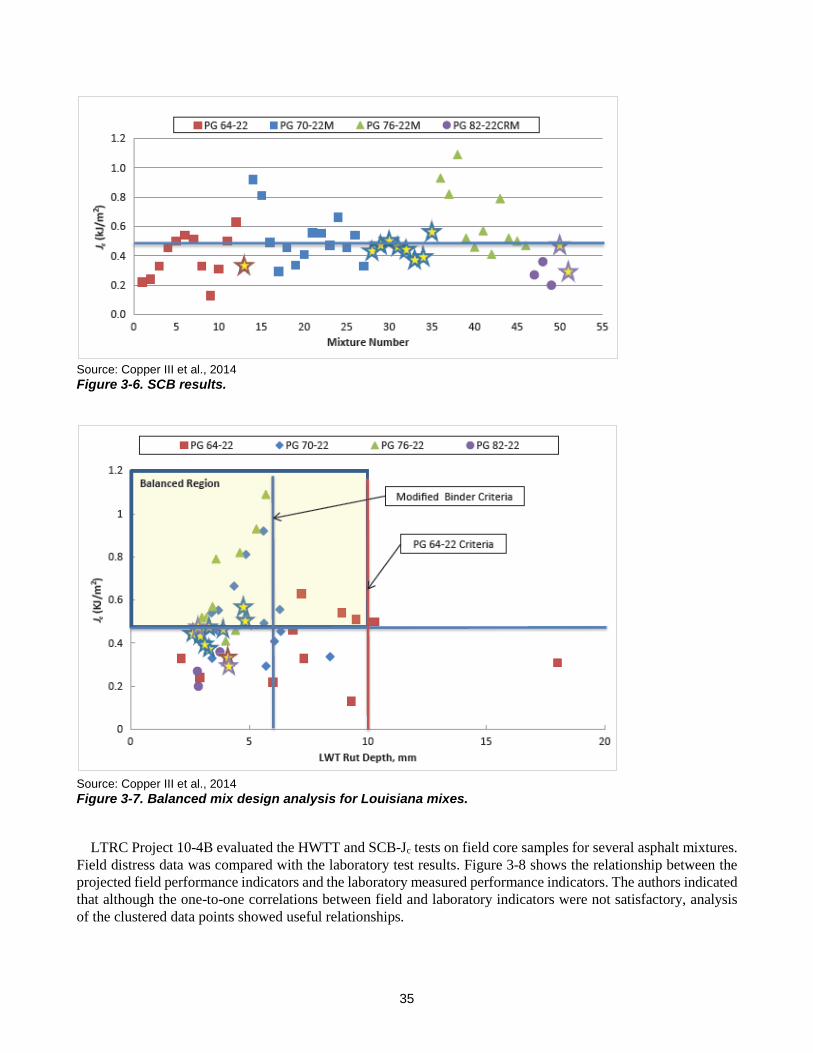
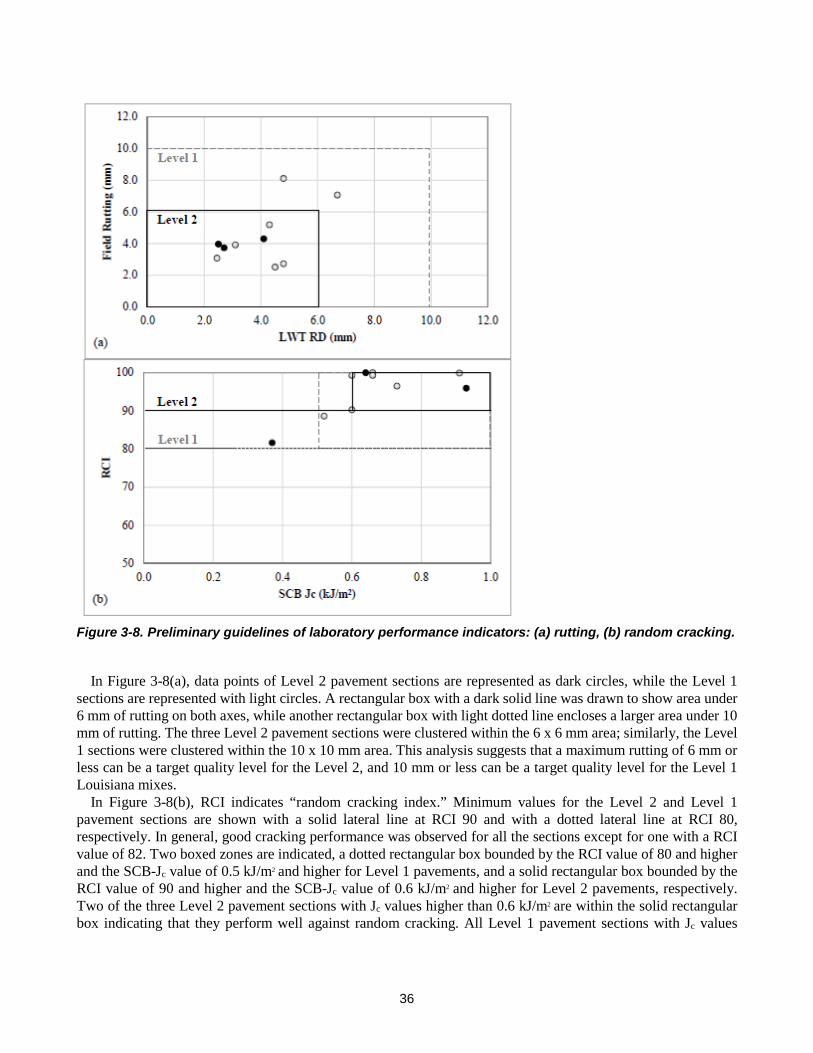
The Louisiana Department of Transportation and Development (LADOTD) has implemented the use of conventional volumetric criteria along with the HWTT to evaluate rutting resistance and the semi-circular bend (SCB-Jc) test to evaluate intermediate temperature cracking. HWTT is conducted on short-term conditioned specimens and SCB test is conducted on long-term aged specimens. Historically, Louisiana mixtures had good rutting resistance, so the balanced mixtures design generally results in increased asphalt contents. LADOTD proposed new specification requirements in 2013 to reduce the number of gyrations at Ndesign and to increase the minimum VMA and VFA requirements (Cooper et al., 2014). LADOTD 2016 specifications include this BMD approach for high- and low-volume roads for wearing and binder courses (Table 3-2).
Table 3-2. Louisiana performance test criteria.
Performance Based Tests Level 1 Traffic Level 2 Traffic HWTT RD @50°C, mm ≤10.0 ≤6.0 SCB-Jc @25°C, kJ/m2 ≥0.5 ≥0.6
Source: Mohammad et al., 2016
Minnesota
The Minnesota Department of Transportation (MnDOT) is in the process of implementing a low-temperature cracking performance specification for asphalt mixtures. The specification utilizes DCT (ASTM D7313) fracture energy (Gf) as the cracking performance parameter. A pilot implementation in 2013 included five construction projects in Minnesota (Johanneck et al., 2015). The pilot projects required DCT testing on both mix design and production mix samples. The pilot study identified several challenges to full-scale implementation and identified certain deviations in the DCT fracture energy measurements between laboratory-prepared mix design samples and plant-produced production mix. Based on the lessons learned through the pilot implementation, research is underway to modify and finalize the DCT performance specification. The pilot project also reaffirmed traditional strategies of mix design such as increasing binder content and/or using a lower temperature graded binder to increase the fracture energy of asphalt mixtures. Research continues to better evaluate the impact of these individual mix design parameters, along with other relevant parameters (VMA, VFA, PG range, percent of recycled materials, etc.) on the DCT fracture energy. Furthermore, the pavement sections constructed during the pilot implementation (both with and without adjusted mixes) are being continually observed for cracking performance. Table 3-3 summarizes the recommended DCT criteria for low, medium, and high traffic pavements.
29
These criteria were based on the national pooled fund study on low temperature cracking in asphalt pavements (Marasteanu et al., 2012).
Note: ESALs = equivalent single axle loads Source: Marasteanu et al., 2012
New Jersey
The New Jersey DOT (NJDOT) currently uses BMD Approach 1 on five types of asphalt mixtures including high-performance thin overlay (HPTO), binder-rich intermediate course (BRIC), bridge deck waterproofing surface course (BDWSC), bottom-rich base course (BRBC), and high RAP (HRAP) mixtures. These mixtures accounted for approximately ten percent of total asphalt mixture tonnage in 2016. For NJDOT’s BMD approach, contractors first perform a volumetric mix design using traditional mix design specifications. Materials are then submitted to NJDOT to prepare specimens for performance testing with APA (AASHTO T 340), OT (NJDOT B-10), BBF (AASHTO T 321), and TSR (AASHTO T 283) tests. Specimens prepared for these tests are short-term aged for two hours at compaction temperature prior to compaction. APA test is conducted at 64°C, TSR and OT tests at 25°C, and BBF test at 15°C. Table 3-4 summarizes NJDOT’s performance test requirements. If test results meet the specified criteria, the contractor is allowed to produce the mixture; otherwise, the mixture must be redesigned. Possible mix design adjustments include the incorporation of warm mix asphalt technology, rejuvenators, and polymers. During project construction, mixtures are also sampled for performance testing to ensure that their properties satisfy the performance requirements.
Table 3-4. NJDOT performance test requirements.
Mixture Type
APA (rut depth at 8,000
passes)
OT (number of
cycles to failure)
BBF (number of
cycles to failure) TSR (%)
HPTO < 4 mm (mix design) < 5 mm (production) > 600 -
> 80
BRIC < 6 mm (mix design) < 7 mm (production)
> 700 (mix design) > 650 (production) -
BDWSC < 3 mm - > 100,000
BRBC < 5 mm - -
HRAP (surface layer, PG 64-22) < 7 mm > 150 - HRAP (surface layer, PG 76-22) < 4 mm > 175 - HRAP (intermediate or base layer, PG 64-22) < 7 mm > 100 -
HRAP (intermediate or base layer, PG 64-22) < 4 mm > 125 -
30
New Mexico
The New Mexico DOT (NMDOT) recently submitted a research proposal for developing a BMD specification for SP-III and SP-IV mixes. NMDOT plans to first construct test sections on existing projects by using asphalt mixes that are designed with a BMD approach. If the mixes show satisfactory performance, NMDOT will then consider the implementation of BMD on regular construction projects. In addition, an ongoing research project is evaluating the rutting and stripping potentials of asphalt mixtures using HWTT. A total of 14 asphalt mixes with different aggregate types, gradations, binder types, anti-stripping agents, RAP contents, and WMA additives are being tested. Three test temperatures of 40°C, 50°C, and 60°C are being evaluated. Upon the completion of the project, a HWTT specification will be developed for NMDOT to determine the passing and failure criteria for specific mix types. It is anticipated that different rut depth criteria will be established for mixes with different binder grades.
Ohio
The Ohio Department of Transportation currently uses the Superpave volumetric mix design approach and requires APA testing for mixtures containing more than 15% fine aggregates that do not meet the fine aggregate angularity criteria. The APA test is conducted in accordance with Supplement Specification 1057. Test temperature is 48.9°C for non-polymer binder mixes and 54.4°C for all heavy surface and high stress area mixes. Mix design specimens prepared for APA testing are short-term aged for two hours at the compaction temperature per AASHTO R 30. The maximum APA rut depth is 5.0 mm at 8,000 cycles for most mixes, and 3.0 mm for high stress mixes. The agency also requires APA and BBF tests for bridge deck waterproofing mixes in Supplement Specification 856. The APA test temperature is 64°C and the maximum rut depth is 4.0 mm at 8,000 cycles for the bridge deck mixes. The BBF test is conducted in accordance with AASHTO T 321 at 1500 microstrain and 10 Hz. Bridge deck mixes are required to have a minimum 100,000 number of cycles to failure.
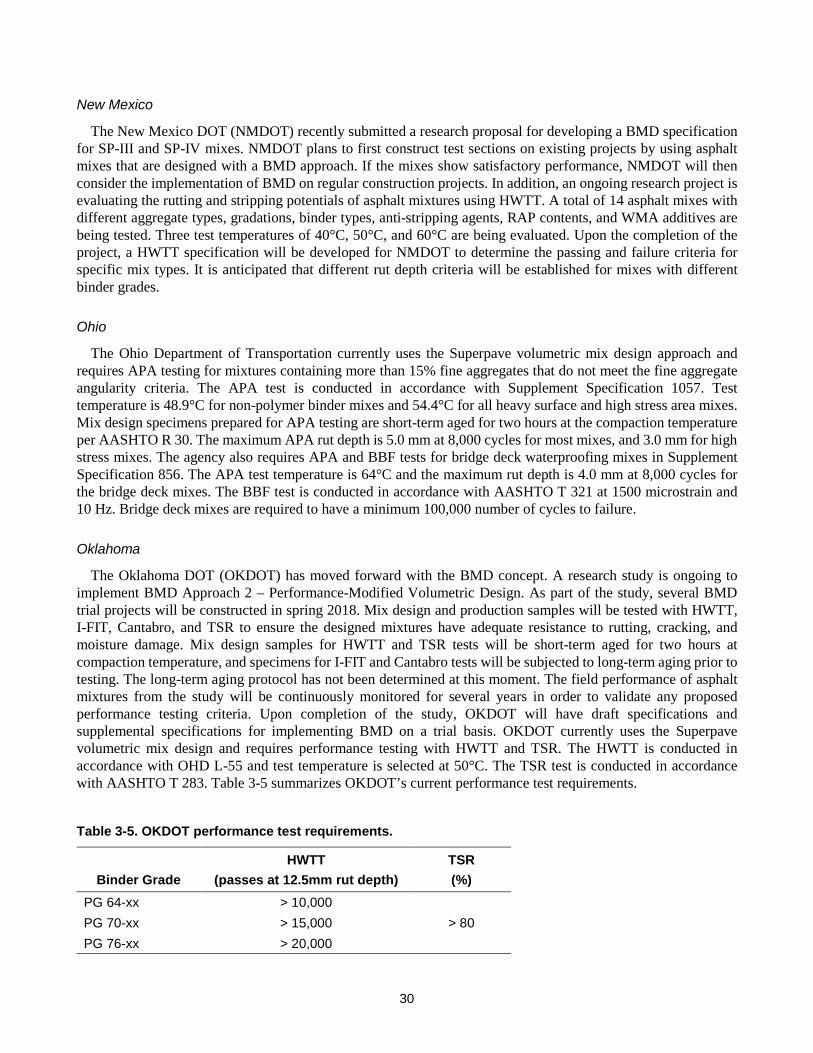
Oklahoma
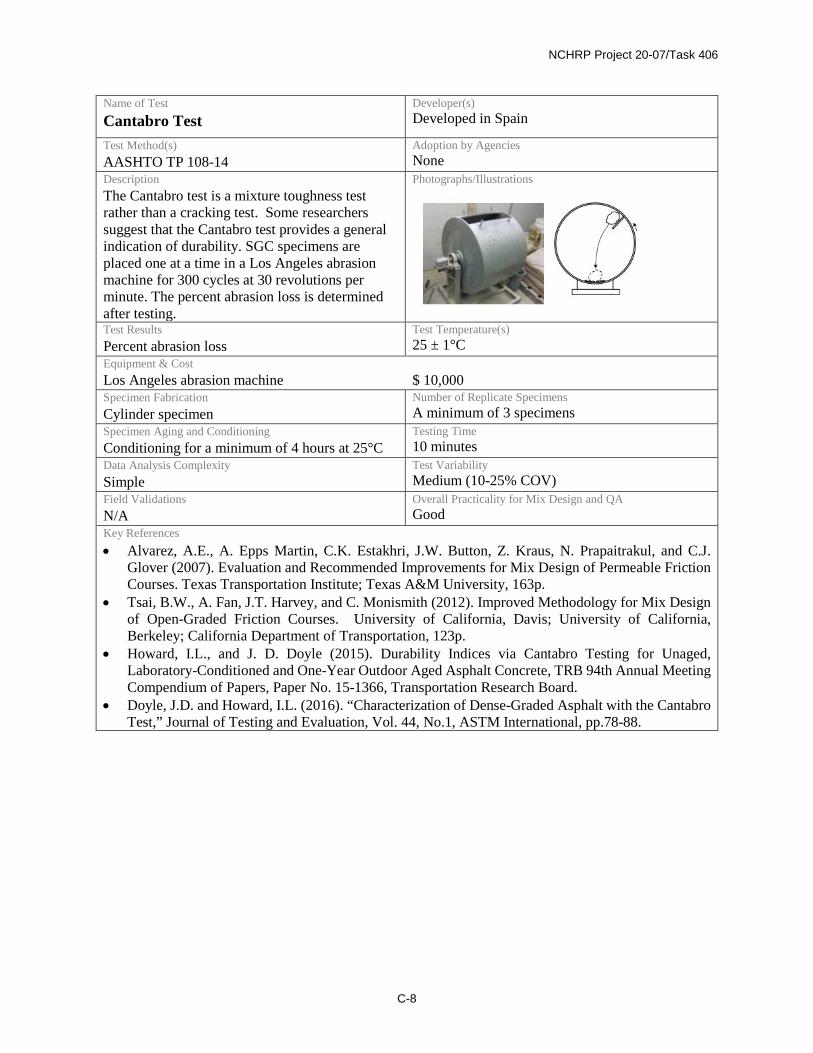
The Oklahoma DOT (OKDOT) has moved forward with the BMD concept. A research study is ongoing to implement BMD Approach 2 – Performance-Modified Volumetric Design. As part of the study, several BMD trial projects will be constructed in spring 2018. Mix design and production samples will be tested with HWTT, I-FIT, Cantabro, and TSR to ensure the designed mixtures have adequate resistance to rutting, cracking, and moisture damage. Mix design samples for HWTT and TSR tests will be short-term aged for two hours at compaction temperature, and specimens for I-FIT and Cantabro tests will be subjected to long-term aging prior to testing. The long-term aging protocol has not been determined at this moment. The field performance of asphalt mixtures from the study will be continuously monitored for several years in order to validate any proposed performance testing criteria. Upon completion of the study, OKDOT will have draft specifications and supplemental specifications for implementing BMD on a trial basis. OKDOT currently uses the Superpave volumetric mix design and requires performance testing with HWTT and TSR. The HWTT is conducted in accordance with OHD L-55 and test temperature is selected at 50°C. The TSR test is conducted in accordance with AASHTO T 283. Table 3-5 summarizes OKDOT’s current performance test requirements.
Table 3-5. OKDOT performance test requirements.
Binder Grade HWTT
(passes at 12.5mm rut depth) TSR (%)
PG 64-xx > 10,000 > 80 PG 70-xx > 15,000
PG 76-xx > 20,000
31
South Dakota
The South Dakota DOT (SDDOT) currently follows the Superpave volumetric mix design and requires APA and TSR tests to evaluate mixture resistance to rutting and moisture damage, respectively. The volumetric mix design is typically performed by asphalt contractors and verified by the agency. Performance test specimens are conditioned for two hours at the compaction temperature and then compacted at the Ndesign gyration level. The APA test is performed in accordance with AASHTO T 340. Test temperature is selected as the binder’s high temperature PG. As shown in Table 3-6, SDDOT has a maximum APA rut depth requirement of 5 to 8 mm for mixes with different design traffic levels. The TSR test is conducted per AASHTO T 283 and a minimum TSR of 80% is required for all Class Q mixes. Research is ongoing within SDDOT to develop a low-temperature cracking resistance specification using the DCT and low-temperature SCB tests.
Table 3-6. SDDOT performance test requirements.
Mix Class Truck ADT APA
(rut depth at 8,000 cycles) TSR (%)
Class Q1 < 75 < 8 mm
> 80 Class Q2 76 – 250 < 7 mm Class Q3 251 – 650 < 6 mm Class Q4 651 – 1200 < 5 mm Class Q5 > 1200 < 5 mm
Texas
The Texas DOT (TxDOT) currently uses BMD Approach 1 – Volumetric Design with Performance Verification on premium asphalt mixes such as porous friction course (PFC), SMA, thin overlay mixtures (TOM), and hot in-place recycling of asphalt concrete surfaces (HIR). For performance verification, TxDOT uses the HWTT to evaluate mixture resistance to rutting and moisture damage and the OT to assess resistance to reflection cracking and bottom-up fatigue cracking. HWTT and OT are conducted in accordance with Tex-242-F and Tex-248-F, respectively. Specimens prepared for both tests should be short-term aged for two hours at compaction temperature for HMA and four hours at 135°C for WMA prior to testing. The HWTT is conducted at 50°C regardless of the performance grade of asphalt binders used in the mixes. The OT temperature is selected at 25°C. TxDOT is responsible for conducting HWTT and OT for both mix design and quality acceptance practices. TxDOT’s BMD approach starts with the Superpave volumetric mix design for determining an estimated optimum asphalt content. Specimens at three asphalt contents (estimated optimum, estimated optimum + 0.5%, and estimated optimum + 1.0%) are then fabricated and tested with HWTT and OT to evaluate their resistance to rutting, moisture damage, and cracking. Finally, the optimum asphalt content is selected within a range of asphalt contents where both HWTT and OT requirements (Table 3-7) are satisfied, as shown in Figure 23. If the mix design fails the performance testing criteria, a new volumetric design is required.
32
Table 3-7. TxDOT performance test requirements.
Mixture Type HWTT
(passes at 12.5mm rut depth) OT
(number of cycles to failure) PFC > 10,000 > 200 SMA > 20,000 > 200 TOM (PG 70-xx) > 15,000 > 300 TOM (PG 76-xx) > 20,000 > 300 HIR > 10,000 > 150
Source: Zhou et al., 2014 Figure 3-4. Balancing rutting and cracking requirements.
Utah
The Utah DOT (UDOT) has moved forward with the BMD concept. Currently, asphalt mixtures are primarily designed using the Superpave volumetric approach. HWTT testing is required to evaluate mixture resistance to rutting and moisture damage in accordance with UDOT modified AASHTO T 324. UDOT’s previous experience found that the standard short-term aging protocol of four hours at 135°C for performance testing per AASHTO R 30 typically yielded asphalt aging that was more severe than that occurred during plant production and construction. Therefore, UDOT currently specifies that HWTT specimens should be conditioned for two hours at compaction temperature prior to testing. HWTT temperature is selected based on the PG of asphalt binder; mixtures with a PG 70-xx binder are tested at 54°C, while those with PG 64-xx and PG 58-xx binders are tested at 50°C and 46°C, respectively. The current UDOT specification requires a maximum HWTT rut depth of 10 mm at 20,000 cycles. UDOT is considering including mixture cracking tests in the BMD approach. Research projects are ongoing to explore mixture bending beam rheometer (BBR) sliver test (AASHTO TP 125) and I-FIT test for evaluating mixture resistance to low-temperature and intermediate-temperature cracking, respectively. Findings from these projects will lead to recommendations on the selection of mixture cracking tests along with corresponding pass/fail thresholds for use in BMD.
33
Wisconsin
In 2014, the Wisconsin DOT (WisDOT) formed a specification development team with the Wisconsin Asphalt Producers Association to pilot the use of performance tests for mixtures containing more than 25% recycled materials (Paye, 2015; Dukatz et al., 2016). For these pilot projects, the mix design air void target was lowered from 4.0% to 3.5%, and the minimum TSR requirement was raised from 0.70 to 0.75. In addition, WisDOT required the use of HWTT (AASHTO T 324) for evaluating moisture susceptibility and rutting, DCT test (ASTM D 7313) for low temperature cracking, SCB test (ASTM D8044) for fatigue cracking, and PG grading of the recovered asphalt binder. Mix design specimens prepared for HWTT were short-term aged for four hours at 135°C per AASHTO R 30, and production mix samples were compacted with minimum reheating required to achieve compaction temperature. DCT and SCB loose mix specimens were subjected to long-term aging of 12 hours at 135°C prior to testing. Table 3-8 summarizes the performance test requirements for the pilot projects. At the local level, the city of Janesville has incorporated additional performance criteria for mix design verification and acceptance based on these same tests (City of Janesville, 2017). Additionally, an ongoing investigation by the University of Wisconsin-Madison is evaluating the feasibility of performance-based testing specifications by including HWTT, confined FN, and SCB tests at intermediate and low temperatures (WHRP Project 0092-15-04). NCAT is conducting another study for WisDOT on the effect of increasing asphalt contents using regressed air voids using the HWTT, DCT, and I-FIT tests (WHRP Project 0092-16-06).
Table 3-8. Performance test requirements for WisDOT pilot projects.
Case Studies This section includes case studies of four states with significant experience with BMD: Louisiana, New Jersey,
California, and Texas. A summary of their efforts to move from a volumetric mix design methodology to a BMD approach are presented as follows.
Louisiana
Over the past few years, LADOTD has worked to improve conventional asphalt mixtures with the development of a BMD specification. Louisiana asphalt mixtures are typically rut resistant and the balanced approach commonly results in increased asphalt contents. Balanced mix designs are achieved through the complement of volumetric criteria with the HWTT and SCB-Jc tests. Two comprehensive research projects were conducted to develop the HWTT and SCB-Jc specification parameters: LTRC Project 11-3B (Cooper III et al., 2014) and LTRC Project 10-4B (Mohammad et al., 2016). A brief description of these projects and recommendations follows.
As part of LTRC project 11-3B, the effect of LADOTD 2013 specification modifications on the laboratory performance of asphalt mixtures was assessed. Laboratory testing of 11 mixtures produced according to the 2013 specification modifications was compared to 40 mixtures produced prior to the modifications. Table 3-9 presents the 2013 specification modifications intended to increase the effective binder content of their mixtures. The specification requirements were based on the type of mixture and its intended use (e.g., traffic level, binder, or wearing course) (Cooper III et al., 2016).
34
Table 3-9. LADOTD volumetric specifications.
Property 2006 Specification 2013 Specification Ndesign 75-100 65-75 Min. VMA (%) 10-13 10.5-13.0 VFA (%) 68-78 69-80 Air Voids (%) 2.5-4.5 2.5-4.5 HWTT required No Yes
Source: Cooper III et al., 2016
The mixes were evaluated for rutting performance using HWTT per AASHTO T 324. Tests were conducted at 50°C for a total of 20,000 passes. Fracture resistance potential was assessed with the SCB-Jc test at 25°C. Figure 3-5 presents the HWTT test results of the mixtures evaluated. Star symbols represent mixtures designed according to the 2013 specifications. The researchers indicated that most mixtures designed according to the 2006 and 2013 specifications performed well in the HWTT. A 10 mm HWTT criterion at 20,000 passes was used for mixtures containing unmodified PG 64-22 binder, while a 6 mm criterion was used for modified binders. The 11 mixtures designed according to the 2013 specification showed equivalent or better HWTT results, indicating that the modification did not appear to affect the rutting resistance of the mixtures. In addition, mixtures that contained polymer-modified binders showed better results as compared to those with unmodified binders.
Source: Copper III et al., 2014 Figure 3-5. HWTT test results.
Figure 3-6 presents the SCB-Jc test results. The criterion used in this analysis was a minimum Jc value of 0.5 kJ/m2. The results indicated that approximately 50% of the mixtures designed to meet the 2013 specification met or exceeded the cracking criteria. The researchers stated that mixtures that contained polymer-modified binders (i.e., PG 70-22M and PG 76-22M) had better Jc results than mixes containing unmodified binders.
Figure 3-7 presents a performance space diagram with all of the mixes. The upper left region indicates mixtures that satisfied both rutting and fracture criteria. The mixtures designed with the 2013 proposed specifications meet both criteria 50% of the time; mixtures that contained PG 64-22 binder did not. Mixtures designed according to the 2006 specifications meet both criteria 52% of the time. The research concluded that specification modifications did not negatively affect rutting or fracture resistance of the mixtures.
35
Source: Copper III et al., 2014 Figure 3-6. SCB results.
Source: Copper III et al., 2014 Figure 3-7. Balanced mix design analysis for Louisiana mixes.
LTRC Project 10-4B evaluated the HWTT and SCB-Jc tests on field core samples for several asphalt mixtures. Field distress data was compared with the laboratory test results. Figure 3-8 shows the relationship between the projected field performance indicators and the laboratory measured performance indicators. The authors indicated that although the one-to-one correlations between field and laboratory indicators were not satisfactory, analysis of the clustered data points showed useful relationships.
36
Figure 3-8. Preliminary guidelines of laboratory performance indicators: (a) rutting, (b) random cracking.
In Figure 3-8(a), data points of Level 2 pavement sections are represented as dark circles, while the Level 1 sections are represented with light circles. A rectangular box with a dark solid line was drawn to show area under 6 mm of rutting on both axes, while another rectangular box with light dotted line encloses a larger area under 10 mm of rutting. The three Level 2 pavement sections were clustered within the 6 x 6 mm area; similarly, the Level 1 sections were clustered within the 10 x 10 mm area. This analysis suggests that a maximum rutting of 6 mm or less can be a target quality level for the Level 2, and 10 mm or less can be a target quality level for the Level 1 Louisiana mixes.
In Figure 3-8(b), RCI indicates “random cracking index.” Minimum values for the Level 2 and Level 1 pavement sections are shown with a solid lateral line at RCI 90 and with a dotted lateral line at RCI 80, respectively. In general, good cracking performance was observed for all the sections except for one with a RCI value of 82. Two boxed zones are indicated, a dotted rectangular box bounded by the RCI value of 80 and higher and the SCB-Jc value of 0.5 kJ/m2 and higher for Level 1 pavements, and a solid rectangular box bounded by the RCI value of 90 and higher and the SCB-Jc value of 0.6 kJ/m2 and higher for Level 2 pavements, respectively. Two of the three Level 2 pavement sections with Jc values higher than 0.6 kJ/m2 are within the solid rectangular box indicating that they perform well against random cracking. All Level 1 pavement sections with Jc values
37
higher than 0.5 kJ/m2 are within the dotted rectangular box indicating good cracking resistance. Based on these results it was concluded that the Jc values of 0.5 and 0.6 kJ/m2 could be used as tentative criteria for cracking.
The findings from research projects LTRC 11-3B and LTRC 10-4B provide the basis of the current specification parameters for HWTT and SCB tests previously presented in Table 3-2. In addition, LADOTD has conducted training workshops for contractors, LADOTD staff, and consultants on the use of the SCB. By the end of 2016, it was reported that three districts had implemented the BMD specification.
New Jersey
In 2006, with a deteriorating transportation infrastructure, decreasing transportation funding, and increasing traffic conditions, the New Jersey Department of Transportation (NJDOT) began to implement a performance-based asphalt mixture design system for their “special asphalt mixtures” (Bennert, 2011). These mixtures, comprising of approximately 10% of the total asphalt tonnage placed in the state, are selected based on the extreme needs of specific pavement structures (i.e. composite pavements, bridge deck overlays, etc.). Each of these performance-based mixtures is required to undergo performance testing during mix design, test strip, and project construction phase to ensure the produced mixture achieves the desired performance for the specific pavement structure.
Field performance data since 2006 indicated that all mixtures performed exceptionally well, and in some cases (i.e. ACROW bridge on Rt. 80), performed better than conventional NJDOT asphalt mixtures. As the performance-based mixtures have become more widely accepted and the methodology of design and production becomes more efficient, NJDOT plans to implement some form of performance-based specifications for all asphalt mixtures.
Three asphalt mixture performance test methods are utilized to test the New Jersey performance-based specification:
• Asphalt Pavement Analyzer, AASHTO T 340: Determining Rutting Susceptibility of Hot-Mix Asphalt Using the Asphalt Pavement Analyzer;
• Flexural Beam Fatigue, AASHTO T 321: Determining the Fatigue Life of Compacted Hot-Mix Asphalt Subjected to Repeated Flexural Bending; and
• Overlay Tester, Tex-248-F: Test Method for the Overlay Test.
The type of fatigue test utilized depends on whether the cracking will be caused by flexural properties of the pavement or the expansion–contraction of the underlying structure. The NJDOT has had a long history of using the APA as a test to evaluate rutting potential, and therefore, it is utilized in the NJDOT’s specification. The Overlay Tester was also selected due to its ability to indicate field cracking performance, especially when RAP materials were used (Bennert and Pezeshki, 2015).
The performance criteria for the NJDOT BMD specification were discussed earlier in Table 3-4. Initial performance criteria included a minimum of 175 cycles in the Overlay Tester, regardless of the asphalt binder PG. Meanwhile, the APA rutting criteria depends on the design traffic level. For lower volume roads (< 10 million ESALs) where a PG 64-22 asphalt binder would be specified, the maximum APA rutting allowed is 7.0 mm at 8,000 cycles. For moderate to higher volume roads (> 10 million ESALs) where a PG 76-22 asphalt binder would be specified, the maximum APA rutting allowed is 4.0 mm.
California
California’s initial efforts to use mix performance tests as part of mix design were founded on performance based specifications (PBS) used with their mechanistic-empirical (ME) pavement design methodology. This process began in the late 1990s when the asphalt industry was faced with the challenge of building long-life asphalt pavements. The initial project was for the long-life rehabilitation of I-710 in Long Beach in southern California,
38
designed to handle more than 200 million ESALs over a design period of 30 years, including overlays of existing concrete pavements and full-depth asphalt pavement sections beneath overpasses (Monismith at al., 2001).
A number of concepts that became the foundation of "perpetual pavements" were put into practice with the PBS: (a) increased compaction, (b) use of stiffer binders in thick sections and use of polymer-modified binders in the surface layer, (c) rich bottom layers with slightly more binder to facilitate better compaction for bottom-up fatigue cracking and moisture sensitivity, and (d) flexural beam fatigue and repeated simple shear test (RSST) testing were implemented in mix design specifications from previous research (Harvey et al., 1997). The specification criteria were based on a 50% loss of stiffness in the flexural fatigue test, repetitions to 5% permanent shear strain in the RSST, and flexural stiffness at 20°C, 10 Hz (Monismith et al., 2001).
Beginning in 2000, the University of California Pavement Research Center (UCPRC), Dynatest Consulting, Inc., and Caltrans developed the CalME flexible pavement design software, which was based on incremental-recursive damage models and materials parameters from repeated load tests for fatigue and rutting (currently flexural beam and RSST, respectively) and frequency sweeps for stiffness (currently flexural beam). CalME was calibrated using accelerated pavement testing from a number of studies and some field sections. Reliability was incorporated in the design process using Monte Carlo analysis and statistical variability of existing layers was quantified using the back-calculated stiffness measurements (Ullidtz et al., 2010).
Caltrans decided to implement the ME design methods using CalME and PBS on three northern California Interstate highway rehabilitation projects with heavy truck traffic but less ESALs per year than I-710. However, the design goal was to achieve a minimum 40-year service life based on pavement cracking and rutting performance. These projects were also the first Caltrans projects to use 25% RAP in the intermediate layers below the surface layer, which was a significant increase over the previous maximum of 15%. The CalME design approach provided a tool for considering non-traditional materials properties in the design. Pavement cross-sections for the three northern California projects designed using CalME are shown in Table 3-10. Each project included milling off of thick layers of existing cracked and moisture damaged asphalt pavements to provide RAP. The thickness of the intermediate layer with 25% RAP was the main variable changed in the structural design.
90 mm dense-graded PG 64-28PM 15% RAP 60 mm PG 64-28PM 15% RAP 60 mm PG 64-28PM 15% RAP
60–200 mm dense-graded PG 64-10 25% RAP 110–180 mm PG 64-16 25% RAP 75–180 mm dense-graded
PG 64-10 25% RAP 60 mm PG 64-10
rich bottom 15% RAP 60 mm PG 64-16
rich bottom 15% RAP 30 mm PG 64-10 25% RAP with
asphalt impregnated fabric on top
110 mm existing CTB 150–230 mm varying CTB, aggregate base, CSJPC 213 mm CSJPC
The RSST (AASHTO T 320, ASTM D7312) was used to select the design binder content for each of the mixes
except the rich bottom asphalt concrete mixes, where 0.7% was added to the binder content from RSST testing to facilitate better compaction. To determine mix fatigue response at the selected design binder content, the flexural fatigue test (AASHTO T 321) and rutting was evaluated using the HWTT (AASHTO T 324). All performance test specimens were prepared using rolling wheel compaction (RWC) because the aggregate structure prepared by this method was similar to that obtained in the field. RWC was developed during the SHRP study (AASHTO PP3-94.4). In developing the test data used to define the performance requirements, the AASHTO procedures were subsequently modified and published in the Caltrans Flexible Pavement Test Method LLP-AC1. Specification limits were selected based on the 95% confidence interval for the given property based on replicate tests. Caltrans
39
accepts 95% of the risk of laboratory test variability. The procedure for establishing the specification limits was developed by Tsai et al. (2012). An example of the PBSs is shown in Table 3-11. The Red Bluff and Weed projects were successfully completed in 2012. The Dixon project was completed in 2014. Different challenges have been identified during this process but the end result was the implementation and inclusion of PBSs in the ME pavement design methodology for California.
Table 3-11. Asphalt mix PBSs for Red Bluff project.
Mixture Type Test Method Minimum Requirement
PG 64-28PM (with lime) AASHTO T 320 modified
360,000 stress repetitions
PG 64-10 (with RAP and lime) 360,000 stress repetitions
PG 64-10 (with RAP and lime) AASHTO T 324 modified 20,000 cycles at 12.5mm rut depth
Texas
Asphalt overlays are the most common rehabilitation method for asphalt and concrete pavements by the Texas DOT (TxDOT). The selection of asphalt mixtures for asphalt overlays is a balancing process because these mixtures are desired to have adequate resistance to both rutting and cracking; however, mixtures with improved rutting resistance typically have reduced cracking resistance and vice versa. In the last few decades, TxDOT sponsored a number of research projects related to the development of BMD for asphalt mixtures. Currently, TxDOT uses BMD Approach 1 on PFC, SMA, TOM, and HIR mixes. Performance tests included in the BMD are HWTT (Tex-242-F) and OT (Tex-248-F).
TxDOT uses the HWTT to evaluate mixture resistance to rutting and moisture damage. Laboratory-molded specimens for HWTT are short-term conditioned for two hours at compaction temperature for HMA and four hours at 135°C for WMA, where WMA is defined as an asphalt mixture that is produced within a target temperature range of 102°C and 135°C using WMA additives or asphalt foaming process. HWTT test is conducted 50°C for all mixes. During the test, rut depth measurements at 11 locations along the wheel path are recorded for each pass, but only the average deformation of the three center locations is reported for analysis. The failure criteria is defined as the number of passes to reach 12.5 mm rut depth. Table 3-7 summarizes the HWTT requirements for different types of mixes.
TxDOT uses the OT to evaluate mixture resistance to reflection and bottom-up fatigue cracking. The first OT was developed by Germann and Lytton (1979) and required a long beam specimen for testing. Although early studies showed that OT was able to discriminate asphalt mixtures with good versus poor cracking resistance, the test was not widely implemented because the beam specimen was difficult to fabricate and the test was not applicable to field cores. To overcome these shortcomings, an upgraded OT was developed by Zhou et al. (2005), which uses specimens that can be easily fabricated from gyratory compacted samples or field cores. OT specimens are short-term aged for two hours at compaction temperature for HMA and four hours at 135°C for WMA. During the test, the specimen is subjected to a cyclic load with 0.1 Hz and a constant maximum opening displacement of 0.635 mm. The number of cycles required to achieve a 93% reduction of the initial peak load (Nf) was historically used as a cracking parameter. Previous studies showed that Nf had adequate discrimination between good and
40
marginal mixes and that it was sensitive to variations in mix parameters, such as changes in asphalt content and asphalt performance grades (Zhou et al., 2014). In addition, the Nf parameter was reported with a reasonable correlation with pavement performance in terms of reflection cracking, fatigue cracking, and low-temperature cracking (Qi et al., 2004; Zhou et al., 2014). Table 3-7 presents TxDOT’s current OT requirements for different types of mixes.
Recently, two additional OT parameters of critical fracture energy (Gc) and crack resistance index (CRI) were proposed by Garcia et al. (2017) and are included in the most recent TxDOT specification. Gc is defined as the energy required to initial a crack at the bottom of an OT specimen during the first loading cycle, and it characterizes the mixture fracture property during the crack initiation phase. The other parameter CRI refers to the reduction in loads that are required to propagate cracking under cyclic loads, which indicates the mixture's flexibility during the crack propagation phase. Asphalt mixtures with better cracking resistance are desired to have a higher Gc value but a lower CRI value.
Based on previous successes with the HWTT and OT, TxDOT proposed a BMD approach that includes these two tests for performance testing. As shown in Figure 3-9, the BMD approach begins with the Superpave mix design method for determining an optimum asphalt content (OAC). Specimens are then fabricated at three different asphalt contents (i.e., OAC, OAC+0.5%, and OAC+1.0%), which are then tested in HWTT and OT. Finally, a balanced asphalt content is selected that satisfies both rutting and cracking requirements. In cases where a single asphalt content does not satisfy all criteria, the entire mix design process needs to be repeated using different materials or mix proportions until all performance criteria are met.
Source: Zhou et al., 2014 Figure 3-9. Illustration of TxDOT’s BMD approach.
41
Previous experience with the OT indicated that it was challenging to establish a universal requirement for all projects because the cracking potential of asphalt pavements depended upon the existing pavement condition as well as many other factors such as traffic, climate, and pavement structure. Therefore, a mechanistic-empirical asphalt overlay design and analysis system (TxACOL) was developed that determined various OT requirements for project-specific conditions (Zhou et al., 2009; Zhou et al., 2011). TxACOL works in two steps: first, the existing pavement condition is determined and a performance model is used to predict pavement performance for a range of asphalt mixtures with different properties. Specific OT requirements are then selected based on a desired performance, as shown in Figure 3-10. Second, laboratory mix designs are conducted to verify the designed mixtures satisfy the selected OT requirements.
Source: Zhou et al., 2011 Figure 3-10. Selection of project-specific OT requirements.
Performance Tests The primary reason for conducting an asphalt mix design is to determine the most economical combination of
available materials to meet the specification requirements. Asphalt mixtures, as part of flexible or composite pavements, can suffer from several categories and subcategories of distresses that will lead to progressive deterioration of ride condition, structural strength, and motorist safety. The most common failure mechanisms are described herein.
Permanent Deformation
Permanent deformation (or rutting) of an asphalt mixture layer is caused by traffic induced densification and shear flow. Permanent deformation is more likely to occur in the upper layers (top 100 mm) of an asphalt pavement because temperatures, compressive and shear stresses are higher in this part of the structure. Permanent deformation of asphalt mixtures is affected by the mixture stiffness; however, permanent deformation cannot be estimated from a stiffness characteristic alone.
42
Fatigue Cracking
Fatigue cracking results from repetitive traffic-induced tensile strains. The traditional concept of fatigue cracking in asphalt mixture layers is based on the fact that the pavement bends and experiences the largest tensile strains at the bottom of the asphalt layer where a crack typically initiates. The crack then propagates upward as the loadings continue, eventually appearing on the surface. This type of crack is called bottom-up cracking. It is now well accepted that load-related top-down fatigue cracking also commonly occurs in asphalt pavements. Cracking in asphalt pavements is controlled by both mixture properties and pavement structural factors. Top-down fatigue cracking is also strongly affected by aging and the associated embrittlement of the asphalt binder, which advances much faster in surface layers. In-situ aging rates of asphalt binders is influenced by climate factors (e.g. high ambient temperatures, ultraviolet radiation) and air permeability of the layers, which is dependent on mixture gradations and in-place relative densities.
Low Temperature Cracking
This distress is important in cold regions with low ambient temperatures and in areas subjected to rapid reductions in pavement temperatures. Low temperature cracking is caused by contraction of the pavement and is primarily influenced by the low temperature properties of the asphalt binder. Therefore, proper selection of the low temperature binder grade will minimize this problem. Low temperature cracking typically initiates at the pavement surface where temperature reduction is more significant and the asphalt binder is more aged.
Moisture Induced Damage
Some asphalt mixtures are prone to damage by the intrusion of water into the asphalt-aggregate interface. The strength of the bond between aggregates and the asphalt coating are largely controlled by mineralogical and chemical properties of the aggregates as well as chemistry of the asphalt binder and additives. The sand equivalent test for fine aggregates is used as part of Superpave mix design to check for the presence of harmful clay minerals. However, evaluation of the overall mix design for resistance to moisture damage is considered a necessary performance check. Permeability of the asphalt layers, through either interconnected voids or cracks, also influences resistance to moisture damage.
Evolution of Performance Tests
A satisfactory mixture design and structural design for asphalt pavements require an understanding of both the load-deformation characteristics and the strength properties of the materials to be used for the range of loading conditions. The ability to estimate mixture performance characteristics in the laboratory is one of the most important criteria to be considered when selecting a test for the mechanistic design. For a test to be useful, any errors that are caused by variations in test equipment and technician performance must be minimal so that the true variations in mixture properties are measured by the test and not just the variations in the test method. Tests with high testing errors are not useful for measuring material properties, because the true properties cannot be determined with confidence (Zhou et al., 2016).
Ease of testing is one of the more important criteria to be applied to any proposed test method. A test that can be readily and easily conducted is highly desirable. Often, an empirical test method is favored solely because of its simplicity and the possibility of conducting the test without costly equipment, excessive time, or extensive personnel training. Simplicity and low cost should not, however, be the primary basis for selecting a given test or testing program. Compared to the total cost of designing, constructing, and maintaining an asphalt pavement, the cost of the testing program is usually minimal. It is also important to use laboratory tests that are related to pavement performance so that the service life of an asphalt mixture under various traffic and climatic conditions can be estimated.
43
In 1996, work sponsored by FHWA began at the University of Maryland to identify and validate simple performance tests for permanent deformation, fatigue cracking, and low-temperature cracking. In 1999, this effort was transferred to Task C of NCHRP Project 9-19, “Superpave Support and Performance Models Management.” The research team was directed to evaluate, as potential simple performance tests, only existing test methods that measure HMA response characteristics. The principal evaluation criteria were accuracy, reliability, ease of use, and reasonable equipment cost (Witczak, 2005).
The NCHRP Project 9-19 research team conducted a comprehensive laboratory testing program to statistically correlate the actual performance of asphalt mixtures from three field test sites in North America, with the laboratory measured responses for 33 promising test method-test parameter combinations. Based on the results of this testing program, the research team recommended three test parameter combinations for further field validation as simple performance tests for permanent deformation: the dynamic modulus, the flow number (FN) determined from the triaxial repeated load test, and the flow time (Ft) determined from the triaxial static creep test. Although the results from the project looked promising, it was obvious that the tests and the equipment designed to carry them out must be capable of producing consistent results over the broadest range of suitable materials and areas of application. According to the NCHRP Project 9-19, the equipment developed for the Superpave system should more closely resemble commercial test equipment. In addition, it should also be rugged, easy to use, and based on a set of specifications.
In 2001, a research project sponsored under NCHRP Project 9-29 was performed for procuring and evaluating a suitable testing machine(s). The objective of this project was to design, procure and evaluate Simple Performance Test (SPT) systems for use in Superpave mix design and in HMA materials characterization for pavement structure design and possibly in field quality control. The project includes four major tasks: equipment development, equipment evaluation, ruggedness evaluation, and final procedure verification. The end product of this project was the development of the Simple Performance Tester, later renamed the Asphalt Mixture Performance Tester (AMPT). To complete the Superpave evolutionary process, AASHTO released standard test method AASHTO TP 79-09, Determining the Dynamic Modulus and Flow Number for Hot Mix Asphalt (HMA) Using the Asphalt Mixture Performance Tester (AMPT).
Over the past few decades, numerous mixture performance tests have been developed by different researchers to evaluate the rutting resistance, cracking resistance, and moisture susceptibility of asphalt mixtures. Considering the different mechanisms involved in crack initiation and propagation, mixture cracking tests can be further categorized into tests for thermal cracking, reflection cracking, bottom-up fatigue cracking, and top-down fatigue cracking. Table 3-12 provides a list of mixture performance tests that are commonly used in asphalt research and are being considered by highway agencies. Some of these performance tests are better suited for routine use in mix design and quality assurance testing, while others are more focused on characterizing the fundamental properties of asphalt mixtures and predicting pavement response. In order to include these mixture performance tests in the BMD procedure, criteria should first be established with good correlations to the corresponding pavement performance in the field. Considerations must also be given to practical issues such as testing time, data analysis complexity, test variability, equipment availability and cost, and sensitivity to mix design parameters. Table 3-13 provides a summary of advantages and disadvantages of mixture cracking and rutting tests. The purpose of this table is to exhibit the spectrum of different performance tests in terms of mechanism, simplicity, equipment cost, testing time, correlation to field performance, and overall practicality for use in routine mix design and quality assurance practices.
Appendix C provides a summary of asphalt mixture performance tests that are commonly used in asphalt research and are being considered for implementation by highway agencies. For each test, a brief description of the test procedure, test results, equipment and cost, specimen fabrication, testing time, and key references are provided. In addition, subjective assessments including data analysis complexity, test variability, overall practicality for mix design and quality assurance (QA), and field validation are offered. Data analysis and complexity has three levels: simple, fair, or complex. This assessment is based on two parts. The first part is the complexity of the procedure to obtain test results considering the availability of software to automate the process. The second part considers the complexity of interpretation of the results for use in specifications. Test variability
44
has three levels depending on the typical coefficient of variation (COV); low for COVs ≤ 10%, medium for COVs between 10 and 25%, or high for COVs >25%. Overall practicality for mix design and QA also has three levels: poor, fair, or good. This subjective assessment is based on the cost and time to prepare samples and obtain results as well as the practicality of establishing specification criteria for the test. Lastly, field validation has three levels: none available, fair, or good. Fair indicates that some research to relate the lab result to field performance has been conducted, but studies are limited. Good indicates several lab to field studies have been conducted by multiple independent organizations and regions of the U.S.
45
Table 3-12. Commonly used asphalt mixture performance tests.
Mixture Property Laboratory Test Test Standard Test Parameter(s) Criteria
Available
Thermal Cracking
Disk-Shaped Compact Tension Test* ASTM D7313-13 Fracture Energy Yes Indirect Tensile Creep & Strength Test AASHTO T 322-07 Creep Compliance & Tensile Strength Yes Semi-Circular Bend (SCB) Test* AASHTO TP 105-13 Fracture Energy Yes Thermal Stress Restrained Specimen Test BS EN12697-4 Fracture Temperature & Fracture Strength No
Reflection Cracking
Disk-Shaped Compact Tension Test* ASTM D7313-13 Fracture Energy No
Direct Tension Test N/A Fracture Parameters No IDT Energy Ratio Test* N/A Dissipated Creep Strain Energy & Energy Ratio No Illinois Flexibility Index Test AASHTO TP 124-16 Flexibility Index Yes
Rutting
Asphalt Pavement Analyzer AASHTO T 340 Rut Depth Yes Flow Number AASHTO T 378 Flow Number Yes Hamburg Wheel Tracking Test AASHTO T 324 Rut Depth Yes Superpave Shear Tester AASHTO T 320-07 Permanent Shear Strain No Incremental Repeated Load Permanent Deformation AASHTO TP 116-15 Minimum Strain Rate Yes
Moisture Susceptibility
Hamburg Wheel Tracking Test AASHTO T 324 Rut Depth & Stripping Inflection Point Yes IDT Strength Test AASHTO T 283 Tensile Strength Ratio & Wet IDT Strength Yes Moisture Induced Stress Tester ASTM D7870 Changes in Gmb & Visual Observations of Stripping No
Note: * Tests selected at the Cracking Test Workshop in NCHRP Project 09-57 (Zhou et al., 2016)
46
Table 3-13. Summary of advantages and disadvantages of mixture cracking and rutting tests.
Test Method Mechanism Simplicity Equipment
Cost Testing
Time
Correlation to Field
Performance
Overall Practicality for
Mix Design and QA
Flexural Bending Beam Fatigue Test Mechanistic-Empirical Simple High Long Good Poor
IDT Fracture Energy Empirical Fair High Short Good Fair Illinois Flexibility Index Test Empirical Simple Low Short Good Good SCB at Intermediate Temperature Empirical Fair Low Short Fair Good Direct Tension Cyclic Fatigue Test Mechanistic Complex High Long Good Poor IDT Energy Ratio Empirical Fair High Long Good Fair Disk-Shaped Compact Tension Test Empirical Fair Medium Short Good Good
IDT Creep Compliance and Strength Mechanistic-Empirical Complex High Long Good Fair
Low Temperature SCB Empirical Fair High Short Good Fair Thermal Stress Restrained Specimen Test Empirical Fair High Medium Fair Poor
Texas Overlay Test Empirical Simple Medium Medium Good Good Cantabro Crude Simple Low Short N/A Good Asphalt Pavement Analyzer Empirical Simple High Short Good Good Flow Number Empirical Fair High Medium Good Fair Hamburg Wheel Tracking Test Empirical Simple Medium Short Good Good Superpave Shear Tester Mechanistic Complex High Long Good Poor Incremental Repeated Load Permanent Deformation Mechanistic Complex High N/A Good Fair
47
Relevant Research on Rutting and Cracking Performance Tests Based on the definitions of BMD used in this document, rutting and cracking performance tests are
considered the centerpiece of BMD. Therefore, the research literature was reviewed to synthesize findings for these two types of tests. In addition, the following studies were selected because they evaluated how mix variables (i.e. polymer modification, RAP, RAS, WMA, etc.) affected mixture rutting and cracking performance. The selected studies were organized in five areas: polymer modified asphalt, recycled materials, warm mix technologies, aggregates and additives, and mixture volumetric properties.
Polymer Modified Asphalt
For many years, polymers have been incorporated into asphalt binders as a way to mitigate the major forms of asphalt pavement distress such as permanent deformation and cracking at intermediate and low temperatures (Collins et al., 1991; Li et al. 1998; Chen et al. 2002; Von Quintus et al., 2001). Many studies have indicated the improvement in rheological and mechanical properties of asphalt binders with addition of polymers (Isacsson U. and Lu X., 1995; Bahia et al., 2001; Bulatović et al., 2013; Alataş and Yilmaz, 2013). In general, elastomeric modification has been found to improve the low temperature cracking resistance of asphalt binders while plastomeric modified binders tend to have better high temperature properties (Lu and Isacsson, 2000; Airey, 2003; Zhu et al., 2014). A few studies also demonstrated an increase in fatigue properties with use of plastomeric modified binders (Panda and Mazumda, 1999; Ameri et al., 2013). Specifically, the changes in asphalt binder properties are dependent on the type and amount of polymer modifiers as well as the chemical properties of the base asphalt binders.
Today, the most widely used polymers for binder modification can be classified into two categories: plastomers and thermoplastic elastomers. As Stroup-Gardiner et al. (1995) reported, plastomers have little or no elastic component, usually resulting in an early occurrence of strength under load and the subsequent brittle failure. Thermoplastic elastomers, which soften on heating and harden on cooling (Lu and Isacsson, 2000), improve asphalt mixture resistance to permanent deformation by stretching under load and elastically recovering once the load is removed (Stroup-Gardiner et al., 1995). This behavior leads to greater use of elastomers compared to plastomers for asphalt modification. Table 3-14 summarizes the most common polymers for asphalt modification along with their advantages and disadvantages. Among these polymers, styrene-butadiene-styrene (SBS) is the most widely used due to its relatively good dispersibility (or appropriate solubility) in asphalt as well as the enhanced properties and acceptable cost of SBS modified asphalt (Chen et al., 2002).
Several researchers found significant improvements in performance for polymer modified asphalt mixtures. Bahia et al. (2001) evaluated the effect of modified asphalts on the rutting and cracking behavior of mixtures using the Simple Shear Test (SST) device and the Bending Beam Fatigue device. The authors indicated a reduction in rutting potential for polymer modified mixtures. The effect of binder modification at a given performance grade of binder was comparable with the effect of aggregate gradation and aggregate angularity. On the other hand, the authors indicated that the fatigue life of the mixture was highly sensitive to the modification type of the asphalt binders. With the same source of aggregates, the elastomeric modified asphalts appeared to have a significantly longer fatigue life than other types of binders used in this study. Recently, the amount of polymer has increased significantly from typically 3% to almost 7% by weight of the asphalt binder. Timm et al. (2012) indicated that four-point bending beam fatigue testing on mixtures with these highly polymer modified binders showed well over an order of magnitude increase in fatigue life. Significant improvement in mixture resistance to permanent deformation was also observed from the APA test. The results of a follow-up study also indicated an improved fatigue performance by means of the S-VECD testing in the AMPT device. In addition, HWTT results indicated that these mixtures had the largest SIP and lowest rut depth; thus, they were expected to have the best resistance to moisture damage and permanent deformation (Timm et al., 2013).
48
Table 3-14. Popular polymers for asphalt binder modification.
Categories Examples Advantages Disadvantages
Plastomers
Polyethylene (PE) Polypropylene (PP)
Good high-temperature properties; Relatively low cost.
Limited improvement in elasticity; Phase separation problems.
Increased stiffness; Reduced temperature sensitivity; Improved elastic response.
Compatibility problems in some binders; Poor resistance to heat, oxidation and ultraviolet; Relatively high cost.
Styrene-ethylene/butylene- styrene (SEBS)
Good resistance to heat, oxidation and ultraviolet.
Storage instability problems; Relatively reduced elasticity; High cost.
Source: Zhu et al., 2014
Numerous studies have been performed to evaluate the impact of polymer modified asphalt on long-term pavement performance (Elmore et al., 1993; Stroup-Gardiner et al., 1995, Button, 1992; McDaniel and Shah, 2003; Hesp et al., 2009). Since the late 1980s, many field test sections with PMA were constructed and their performance was continuously monitored. These studies are summarized in Table 3-15. Some of the studies also evaluated other additives.
49
Table 3-15. Studies on the field performance of field test sections with PMA.
Reference Location of Sites Polymer Information In-Service Age
When Investigated Conclusions
(Button, 1992)
USA, Canada and Austria (> 30 sites)
Various polymers including PE and EVA SBR and SBS
Less than 5 years No significant difference was observed in performance between most test sections and the control sections.
(Elmore et al., 1993)
USA (6 sites)
Various polymers including EVA, SBR and SBS
Various, but no longer than 6 years
No distinctive trend was found between the performance of modified and unmodified asphalts, nor among the performance of the same modified asphalt types, when compared between different sections.
(Stroup-Gardiner et al., 1995)
USA and Canada (20 sites)
Various polymers including LDPE, some unspecified polyolefin, EVA, SBR and SBS
Various, but no longer than 9 years
EVA modification has a tendency for brittle behavior as seen by the reports of premature cracking. There were no consistent trends in rutting resistance for any of the reported modifiers.
(Albritton et al., 1999)
Mississippi (1 site)
Various polymers including SBS, SB latex, LDPE and GTR
Various, but no longer than 5 years
Initial performance test results for the pavement test sections were low roughness and low deflection readings and high skid values. Results to date indicate that all the modified binders are providing superior rutting resistance as compared to the control binder.
(McDaniel and Shah, 2003)
USA
Various polymers including LDPE, SBR and some styrene- butadiene block copolymers
11 years
For most test sections, the use of PMA improved the field cracking resistance over the unmodified asphalt. However, LDPE increased the brittleness of the asphalt and mixture, leading to extensive cracking. PMA is not necessary to control rutting. Properly designed and constructed mixture can perform under heavy traffic without rutting.
(Timm et al., 2006)
Alabama (1 site)
Various polymers including SBS and SBR
No longer than 1 month
Unmodified asphalt mixtures had a rut depth of 6.0mm. The modified sections had an average rutting of 2.7mm.
(Von Quintus et al., 2007)
USA (32 sites)
Various polymers including LDPE, SBR and some styrene- butadiene block copolymers
Various, but no longer than 5 years
The test sections with PMA mixtures evaluated in this study were found to have lower amounts of fatigue cracking, transverse cracking, and rutting. The examples used in this study show an extended service life for deep-strength HMA pavements of 5 to 10 years, based on the performance observations from the companion test sections.
(Hesp et al., 2009)
Canada (7 sites)
Various polymers including SBS, SB and RET
8 years
Asphalt modified with RET and PPA performed as desired, without cracking after eight years of service. One of the two SBS modified bitumen sections cracked at a moderate amount, with intermittent full width transverse cracks of moderate severity. The remaining sections all experienced severe and excessive distress, with numerous longitudinal and transverse cracks.
NCHRP Project 20-07/Task 406
50
Recycled Materials
In 2009, West et al. (2009) performed a laboratory and field study on moderate and high RAP content surface mixes constructed on the NCAT Test Track. Laboratory tests included APA, dynamic modulus, bending beam fatigue, and Energy Ratio. The improved rutting resistance with the APA results corresponded to an increase in stiffness of the binder in the mixes. Dynamic modulus master curves showed expected effects of the virgin binder grade on the stiffness of the mixtures. BBF tests indicated that the 45% RAP mixes had lower fatigue lives compared to the 20% RAP mixes and the authors attributed this to lower effective volumes of asphalt in these mixes. The results of a follow-up study were presented in 2016 by West et al. (2016). The direct tension cyclic fatigue test and OT were included in this study. The test sections performed very well on the NCAT Test Track but exhibited a range of low-severity cracking, mostly near the edges of the wheelpaths. Cores were extracted to confirm that the cracks were limited to the surface layer. The field cracking performance indicated that the performance grade of virgin binder affected mixture cracking resistance. The creep strain rate, measured as part of the Energy Ratio method, and the Overlay Tester results best matched the field performance of the test sections.
Mogawer and others (2011) conducted Hamburg wheel tracking tests, Overlay Tests, and the Asphalt Concrete Cracking Device (ACCD) tests on a number of mixtures, including some with RAS and WMA technology. The Overlay Test results for the mix with 5% RAS were about 70% lower than the virgin control mix. Adding WMA did not have a substantial effect on the control mix or the mix with 5% RAS. The mix with 35% RAP plus 5% RAS had lower cycles to failure than the mix with just 5% RAS. Adding WMA to the 35% RAP + 5% RAS mix improved the results, but not by a statistically significant amount given the typical variability of this test. The ACCD test uses thermal contraction of notched ring-shaped specimens compacted around an Invar ring to determine the temperature at which the specimen starts to crack. The results indicated that the cracking temperatures for the eight mixes were similar. The highest failure temperature was -37°C for the 40% RAP mixture and the 35% RAP + 5% RAS mixture. The addition of WMA improved (lowered) the cracking temperature compared to HMA.
Hajj et al. (2011) assessed the impact of RAP contents on moisture damage and thermal cracking of asphalt mixtures. The mixes were designed using three RAP contents (0, 15, and 50%). A PG 58-28 binder was used for all the mixes. An additional 50% RAP mix was included using a PG 52-34 virgin binder. All the mixes were designed to have similar gradations and binder contents. Laboratory produced test specimens were aged for four hours at 135°C prior to compaction while the plant-produced specimens were compacted without additional aging. Compacted mix specimens were subjected to 0, 1, or 3 freeze thaw cycles and then tested to determine their resistance to moisture damage using the TSR method (AASHTO T 283). Conditioned samples were also tested according to AASHTO TP 62 to assess changes in mixture dynamic modulus due to moisture conditioning. Finally, conditioned test specimens were tested using the Thermal Stress Restrained Specimen Test (TSRST) described in AASHTO TP 10. Plant-produced test specimens were found to be stiffer in most cases than the laboratory-produced specimens, although the overall moisture damage trend and ranking were similar for all tests performed. Dynamic moduli decreased with increasing freeze-thaw cycles. The TSRST results showed no further reduction in fracture stress for the conditioned specimens with increasing RAP content. The TSRST fracture temperatures for the 0 and 15% RAP content mixes were very similar to the virgin mix. The 50% RAP content mix had TSRST fracture temperatures several degrees warmer than the virgin mix, indicating decreased resistance to thermal cracking. In general, the resistance to moisture damage and thermal cracking of RAP mixtures improved with the use of a softer virgin binder.
Wilson et al. (2012) recommended specifications for thin overlays in Texas based on laboratory testing. The study included a fine dense-graded mix, a fine-graded SMA, and a fine-graded permeable friction course. HWTT and OT were used to evaluate the rutting and cracking resistance of the mixtures. All the mixtures exceeded 300 cycles to failure in the OT. Based on the results, 80% of the mixtures were successful in using the proposed specifications for material selection, design, and testing. The SMA mixture was also
NCHRP Project 20-07/Task 406
51
tested with 15% RAP included and passed the criteria for rutting and cracking tests. No significant difference in the test results was observed for SMA mixtures with and without RAP.
Willis et al. (2012) evaluated two approaches to improve the durability of moderate and high RAP content mixes. One approach was to increase the asphalt content by 0.25% and 0.5%, and the other approach was to use a softer virgin binder. The study used 9.5 mm NMAS Superpave mixes designed with 0, 25, and 50% RAP with PG 67-22 and PG 58-28 virgin binders. The Energy Ratio test was used to evaluate the mixture resistance to top-down cracking. The OT and APA were used to assess resistance to reflection cracking and rutting, respectively. Results showed that the Energy Ratio decreased for the RAP mixes for both approaches. However, fracture energy did improve for the 25% and 50% RAP mixes when a softer PG 58-28 binder was used. OT results for the 25% RAP mixes significantly improved when the softer virgin binder was used. The average OT results for the 50% RAP mixes with the PG 58-28 virgin binder improved by three times compared to those with the PG 67-22 binder, but the results were not statistically significant due to the high variability with this test. The APA results for the 25% RAP mix containing the PG 58-28 were just above the criteria established for high traffic mixes based on the NCAT Test Track. All other mixes met the NCAT’s recommended APA criteria.
Another NCAT study in 2012 (Tran et al., 2012) evaluated a rejuvenating agent, Cyclogen L, to improve mix durability. The study evaluated the effect of the rejuvenator on mixes containing 0% and 50% RAP, and another containing 20% RAP and 5% RAS. The rejuvenator dosage of 12% by mass of RAP binder was set to restore the properties to those of the PG 67-22 binder used as the virgin binder for mix design. The mix designs with and without the rejuvenator were tested for resistance to moisture damage using AASHTO T 283, rutting with the APA, dynamic modulus after short-term and long-term aging, resistance to top-down cracking using the Energy Ratio procedure, resistance to reflection cracking using the modified OT procedure, and resistance to thermal cracking using the IDT creep compliance and strength tests. The test results showed that the rejuvenator reduced the mix stiffness, improved all four fracture properties included in the Energy Ratio computation, and improved the low-temperature critical cracking temperature. OT results also improved for the mixes that included the rejuvenator, but the improvement was not statistically significant due to the poor repeatability of the test. In addition, all mixes passed the APA criteria for high traffic pavements.
Cascione et al. (2015) reported on the field and laboratory performance of RAS mixtures from seven states. The mixtures were designed to evaluate multiple properties of RAS as well as evaluate the use of RAS with ground tire rubber (GTR) and WMA technologies. Flow number and E* testing of the mixtures showed that the addition of RAS or RAS and RAP improved mixture rutting resistance, which was confirmed by the field performance data as no measureable amount of wheel path deformation was observed over multiple years of evaluation. The four-point bending beam test was used to analyze the fatigue resistance of the mixtures, and the results showed that the mixtures with RAS had similar results to the mixtures without RAS. This was also consistent with the field performance data, where most of the mixtures with RAS performed as well or better than the mixtures without RAS in terms of fatigue cracking. Low temperature cracking was evaluated using the low-temperature SCB test. For most projects, there was no significant difference in the fracture energy of mixtures with or without RAS. Results for one project showed a significant increase in the low temperature cracking resistance with the addition of RAS, but results from another project showed the opposite trend. Evaluation of the field trials in Missouri found that a mix with coarse ground RAS exhibited more transverse cracking than a similar mix with fine ground RAS after two winters. The mixtures containing RAS were observed to have slightly more cracking than the mixtures without RAS in Missouri and Colorado one winter after construction. In contrast, mixtures with RAS were observed to have similar or less cracking than the mixtures without RAS in Iowa and Indiana after two and three winters, respectively. In Minnesota, a mixture with manufacturer waste RAS displayed “slightly more cracking” than a mix with post-consumer RAS four winters after construction. The authors cautioned against drawing conclusions from results of the field evaluations since the extent of cracking prior to being overlaid was highly variable for the field projects.
NCHRP Project 20-07/Task 406
52
Wu et al. (2015) performed a study on field cores obtained from a Washington State project with four sections: two sections with 15% RAP and two sections with 3% RAS and 15% RAP. The study compared extracted binder testing for rutting, fatigue, and thermal cracking resistance to mixture test results for the same distresses. For mixture testing, the HWTT was used to evaluate rutting resistance. Results showed that the mixtures containing RAS had better rutting resistance. The low frequency (high temperature) E* and the IDT creep compliance values were higher for the mixtures containing RAS, also indicating increased rutting resistance. Fatigue and thermal cracking resistance were tested using the IDT test by measuring the fracture work density, vertical deformation, and horizontal fracture strain (Wen, 2013). This testing showed no significant difference in the mixtures with or without RAS for both fatigue and thermal cracking resistance. In general, the mixture test results and binder test results were consistent with each other (better rutting resistance and no difference in fatigue resistance), except for the thermal cracking resistance. The binder testing indicated a reduction in the thermal cracking resistance but the mixture testing showed no significant difference in the thermal cracking with the addition of RAS. The authors explained this conflict as the binder behavior being negatively affected by the shingle asphalt while the mixture thermal cracking resistance was improved by the RAS fibers (Wu et al., 2015).
Hanz et al. (2017) presented the results of a study on performance-based testing for high RAP mix designs and production mixes. In 2014, the Wisconsin DOT and industry developed a pilot program for HMA with higher recycled asphalt contents that required performance testing during mix design and production. Following the BMD concept, mixture tests were selected to address rutting resistance after short-term aging and durability after long-term aging. The tests selected were the HWTT, SCB-Jc test, and DCT test. Asphalt binder extraction and grading from aged mix was also conducted. The focus of this paper was to (1) summarize the mixture performance test results and recovered binder data gathered during the pilot project on State Highway 77 in Ashland County, WI, (2) recommend modifications to the SCB-Jc test procedure, and (3) evaluate accelerated aging protocols for use with performance testing. SCB-Jc test results were not consistent with values published in the literature and were not sensitive to changes in mix properties. An alternative analysis method of the SCB-Jc test was recommended as well as a climate-based approach for test temperature selection. Accelerated loose mix aging protocols of 12 and 24 hours at 135°C were compared to the AASHTO R30 protocol of five days at 85°C on compacted specimens using recovered binder and mixture fracture properties. Results showed that the 12-hour loose mix aging protocol produced similar recovered binder grading to AASHTO R30, but the effect of aging methods on mixture fracture properties was inconclusive. The relationship between laboratory and field aging was investigated by comparing field cores to plant-produced laboratory-aged mixes from a project constructed in southeast Minnesota. The laboratory test results for the high recycled and conventional mix designs were compared based on mixture cracking resistance and recovered asphalt binder properties after extended aging. The high recycled mix exhibited equal or better performance relative to the conventional mix across all selected performance tests. This analysis provided an example of how performance testing could be used to affect material selection and provide an indication of the overall mixture performance.
Warm Mix Technologies
The 2009 research cycle of the NCAT Test Track featured a WMA experiment that evaluated a control section using conventional production and laydown temperatures versus two sections constructed with different WMA technologies. All of the sections were designed with three lifts of asphalt mix, totaling seven inches, constructed over six inches of crushed granite aggregate base and a common subgrade. The sections were built to compare the field performance under accelerated loading, laboratory properties of mixtures, as well as structural responses to realistic traffic and environmental conditions. The HMA and WMA sections utilized the same asphalt binder (PG 67-22) and aggregate gradations during production, with the only difference being that the HMA was produced at 163 to 168°C while the foamed-asphalt WMA was produced at 135°C and the additive-based WMA at 121°C (Vargas and Timm, 2013).
NCHRP Project 20-07/Task 406
53
Field-measured rutting followed the expected trend where the HMA section had the least measured rutting, followed by the foamed-asphalt WMA, and the additive-based WMA. However, the difference in measured rut depths was less than 3 mm, which was practically insignificant. APA test results on the HMA and WMA surface mixtures were not statistically different. Although the FN results for the HMA was significantly better than the WMA mixtures, both mixtures passed their respective recommended FN criteria. No significant difference was observed for the HWTT results between HMA and the foamed-asphalt WMA, while the additive-based WMA showed a significantly higher rutting rate. Of these tests, the APA and FN tests did not correlate well to field performance while the HWTT provided the best relationship to actual rutting performance.
The sections were routinely inspected for cracking during the five-year experiment. Cracking first appeared in the additive-based WMA section at 10.5 million ESALs, followed by the foamed-asphalt WMA section at 11 million ESALs, and finally the HMA section at 11.9 million ESALs. After 17 million ESALs, the foamed-asphalt WMA section had 22% of the lane area cracked, the additive-based WMA section had 15% cracking, and the HMA section had 10% cracking. BBF test was conducted on the base mixtures from each section. Fatigue predictions based on the BBF test results and measured strain responses from each section indicated that the foamed-asphalt WMA section should perform the best, followed by the additive-based WMA section and the HMA section. However, these predictions were the opposite of the observed performance described above after 17 million ESALs.
For NCHRP Project 9-47A, over 25 WMA and the corresponding HMA sections constructed around the USA were monitored to compare their field performance (West el al, 2014). The following laboratory performance tests were also conducted: FN, TSR, HWTT, and SVECD. Statistical analyses were conducted to assess if significant differences existed in the results for WMA and HMA. Conclusions were as follows:
• FN results of plant-produced WMA mixes were statistically lower than the corresponding HMA mixes in more than two-thirds of the comparisons.
• The TSR test showed that 82% of the mixes passed the standard 0.8 minimum TSR criterion. The six mixes that failed the criterion included four WMA and two HMA mixes.
• HWTT results showed that 59% of the WMA mixes had statistically similar rut depth measurements with their corresponding HMA mixes; the other 41% of the WMA mixes showed greater rut depths.
• The SVECD test does not yield a specific test parameter, but rather a relationship between specimen strain and the number of cycles to failure. Therefore, the results only provide a relative ranking for a set of mixes based on their fatigue behavior. For all projects evaluated in the study, WMA mixes had equal or better fatigue lives than the corresponding HMA mixes.
Field performance evaluations of all pavement sections through two years indicated that WMA mixes
were comparable to HMA mixes, which was not consistent with the laboratory test results, particularly related to rutting. Cracking after two years was negligible for all sections.
In summary, findings from the NCHRP 9-47A project and 2009 NCAT Test Track experiment indicate that WMA and HMA perform similarly with respect to rutting even though HWTT and FN results indicated that WMA mixes were more susceptible to rutting. BBF tests did not provide the same ranking compared to the actual field performance. There were insufficient field performance differences between WMA and HMA sections to judge the validity of SVECD test results.
Aggregates and Additives
Aggregate properties can affect mix performance in many different ways. For example, Button et al. (1990) identified nine possible factors that could contribute to rutting, but stated that the aggregate characteristics were the primary factors influencing mixture rutting susceptibility.
NCHRP Project 20-07/Task 406
54
Haddock et al. (1999) evaluated the sensitivity of several performance tests to changes of gradations within the Superpave specifications. Tests included in the study were prototype scaled accelerated pavement tests, laboratory scale wheel-tracking tests, and triaxial tests. Mixtures components included one unmodified asphalt binder, limestone coarse aggregates, and limestone sands. Different mixture gradations were designed to be above, through, and below the restricted zone. Results from the selected tests were sensitive to changes in gradation and aggregate types. Stakston and Bahia (2003) also indicated that mixture rutting resistance was highly dependent on aggregate grading, and that mixes made with the best possible materials would fail without a proper gradation.
Buchanan (2000) evaluated the effect of flat and elongated (F&E) particles on mix design volumetric properties, rutting susceptibility, aggregate breakdown, and fatigue cracking of asphalt mixtures. Mixtures were prepared using an Alabama limestone and North Carolina granite with various F&E percentages. Rutting resistance was evaluated by the APA test and fatigue resistance by the BBF test. It was observed that higher amounts of F&E led to increased breakdown of particles. More than 30% 3:1 F&E particles significantly affected the volumetric properties of the asphalt mixtures. Finally, the author concluded that the amount of F&E did not significantly affect the rutting results of mixtures with limestone, but rut depths increased with the higher F&E percentages of the granite. However, for low F&E percentages, this difference was not observed.
Kim et al. (2003) investigated the effect of fillers and binders on the fatigue performance of asphalt mixes. The researchers used two binders (AAD-1 and AAM-1) and two fillers (hydrated lime and limestone) in three different volume fractions (5, 10, and 25% filler/asphalt ratio). They concluded that filler type affected the fatigue behavior of asphalt binders and mastics. Fillers also stiffened the binders, and hydrated lime was more effective in stiffening binders than limestone-type filler. One of the conclusions from the study was that even if fillers stiffened the binders, they acted in such a way that they provided better resistance to micro cracking and thus increased fatigue life. The researchers also concluded that the physicochemical interaction between the binder and the filler was material specific, because the improvement in fatigue life due to the inclusion of hydrated lime was much greater for the AAD-1 mix than for the AAM-1 mix.
White et al. (2006) used a full-scale pavement testing device to evaluate how aggregate properties related to HMA performance. The authors found that the content of uncompacted voids of coarse aggregate (AASHTO TP56) was the best predictor of rutting performance of coarse-graded mixtures. The resistance of asphalt mixtures to fatigue cracking was also proportional to the amount of F&E particles. The resistance to fatigue cracking also tended to increase with the higher fine aggregate uncompacted voids.
Souza et al. (2012) investigated the effect of aggregate angularity on mixture performance through laboratory testing and microstructure finite-element simulations. In the study, mixture rutting resistance was evaluated using the APA and uniaxial static creep test, and fatigue resistance was evaluated based on IDT fracture energy test. Test results showed that higher aggregate angularity improved mixture resistance to rutting due to improved aggregate interlocking. However, no definite conclusion was drawn for the effect of aggregate angularity on mixture fatigue results. The authors noted that mixtures with more angular aggregates generally required more asphalt to meet volumetric requirements, which was beneficial to mixture fatigue resistance due to increased viscoelastic energy dissipation from the binder; on the other hand, angular aggregates tended to produce increased stress concentration that accelerated the crack initiation process.
In a study by Chun et al. (2012), four aggregate characteristic parameters determined from the dominant aggregate size range (DASR)-interstitial component (IC) model were found to relate well with field performance of Superpave mixtures. Eight existing Superpave projects located across the state of Florida were evaluated. Field cores from each of the projects were tested to determine the in-place gradation and volumetric properties. In addition, field rutting and cracking performance data were collected. Based on the analysis, DASR porosity, which characterizes the coarse aggregate structure, was identified as the parameter that most affected mixture rutting performance. Mixtures with lower DASR porosity were found
NCHRP Project 20-07/Task 406
55
to have better resistance to rutting. The authors also reported that IC characteristics of effective film thickness (EFT) and the ratio of coarse portion to fine portion of fine aggregate (CFA/FFA) were able to discriminate projects with different field cracking performance. Finally, they recommended using DASR-IC criteria to improve rutting and cracking performance of Superpave mixtures.
Hydrated lime has been commonly used as an anti-stripping additive in asphalt mixtures by several highway agencies across North America. In addition to working as an anti-stripping additive, hydrated lime has also been recognized to improve properties and performance of asphalt mixtures. Bari and Witczak (2005) reported that hydrated lime increased the indirect tensile strength and resilient modulus of asphalt mixtures. Moreover, the fatigue life and rutting resistance improved with the addition of hydrated lime. Sebaaly (2006) updated previous work by Little and Epps (2005), where the effects of hydrated lime in HMA mixtures were analyzed. Their results showed that hydrated lime improved the resistance of asphalt mixtures to moisture damage, oxidative aging, fatigue, and rutting. They also analyzed field data and concluded that hydrated lime extended the average service life of asphalt pavements by approximately 38%.
Mixture Volumetric Properties
Numerous studies have been conducted to evaluate the effects of volumetric properties of asphalt mixtures on their rutting and cracking resistance. Most of these studies focused on asphalt content, while few others assessed other factors, such as air voids content, Ndesign, aggregate gradation, and aggregate properties. In general, asphalt content was consistently found as a significant factor affecting mixture performance; specifically, higher asphalt contents tended to result in improved cracking resistance but reduced rutting resistance. The opposite trend was typically observed for Ndesign because increasing Ndesign results in lower asphalt contents if the aggregate gradation is fixed. Due to the limited number of studies, no conclusive findings could be made regarding the effects of air voids, aggregate gradation, and aggregate characteristics on mixture rutting and cracking resistance. Some of the most relevant studies are briefly discussed as follows.
An early study by Harvey and Tsai (1996) evaluated the effects of asphalt content and air voids content on mixture fatigue and stiffness characteristics. Fifteen laboratory mixes were prepared using one asphalt binder and aggregate combination, five asphalt contents, and three air voids contents. Controlled-strain BBF test results indicated that mixture fatigue life increased with lower air void contents and higher asphalt contents. In addition, mixture stiffness increased with a decrease in air voids content and asphalt content.
Maupin (2003) studied the effect of asphalt content on the durability of Virginia’s Superpave surface mixtures. Nine mixes with 9.5 mm and 12.5 mm NMAS were evaluated using performance tests. Each mix was modified by adding 0.5 and 1.0 percent additional asphalt and then tested for mixture resistance to rutting and fatigue cracking using the APA and BBF tests, respectively. Specimens with no added asphalt were compacted to 8.0 percent air voids while those with additional asphalt were compacted to a reduced voids level between 3.0 and 7.0 percent. Although for most cases, specimens with additional asphalt showed slighter higher APA rut depth, none of the test results exceeded the maximum allowable rut depth requirements. On the other hand, the BBF results showed a general trend of increased fatigue life as additional asphalt was added. Finally, the author concluded that adding additional 0.5 percent asphalt would extend the life expectancy of Superpave surface mixtures by approximately 5 percent.
A study by Zhou et al. (2005) focused on the development of an intergraded HMA mix design method that balanced both rutting and cracking requirements. Eleven Texas mixtures were included in the study. For each mixture, laboratory specimens were produced at four different asphalt contents and tested with the HWTT and OT. Statistical analysis of the test results showed that asphalt content was a significant factor affecting both HWTT and OT results. In general, mixtures with a lower asphalt content were found to have better rutting resistance but were more susceptible to cracking than mixtures with a higher asphalt content. A simplified mix design procedure was proposed to determine the optimum asphalt binder content by balancing mixture rutting and cracking resistance.
NCHRP Project 20-07/Task 406
56
Willis et al. (2013) studied the effects of virgin asphalt content on high RAP asphalt mixture properties. Two high RAP mixtures were prepared at three different asphalt contents: optimum asphalt content (OAC), OAC plus 0.25 percent, and OAC plus 0.5 percent. The mixtures were tested with the IDT Energy Ratio, OT, and APA tests to evaluate their resistance to surface cracking, reflection cracking, and rutting, respectively. Test results showed that in general, adding additional asphalt binders produced mixtures with improved resistance to reflection cracking but reduced resistance to rutting. However, no consistent trend was observed for the effect of asphalt content on Energy Ratio.
Ayala et al. (2014) used a performance-test approach to determine Ndesign that optimized mixture performance with regard to rutting and cracking resistance. Six different types of surface mixes were designed using the Superpave volumetric mix design using Ndesigns of 50, 75, 100, and 125 gyrations. It was reported that increasing in Ndesign yielded mixes with lower asphalt contents. The mixes were tested for dynamic modulus and the results were entered in the DARWin-ME software to predict their fatigue and rutting performance. In general, mixes with higher Ndesign levels were predicted to have improved rutting resistance but reduced resistance to fatigue cracking. Based on these prediction results, recommendations on the optimum Ndesign values for mixes with various NMAS and binder grades were made.
In a study by Bennert et al. (2015), a balanced mixture design approach was evaluated to determine its applicability to New Jersey asphalt mixtures. The approach used the APA and OT tests to evaluate mixture resistance to rutting and cracking. Eight mixtures were evaluated. A consistent trend was observed that as asphalt content increased, the cracking resistance of asphalt mixtures improved but their rutting resistance reduced. Recommendations were made for the balanced mixture design approach to identify the optimum asphalt content as the middle point of the asphalt content range where both mixture rutting and cracking requirements were satisfied.
Lee et al. (2015) used mechanistic models to investigate the effect of VMA on the fatigue performance of asphalt mixtures. A mixture from the 2013 FHWA accelerated loading facility was selected to develop volumetric mix designs at three different VMA levels: 13%, 14%, and 15%. Results from the direct tension cyclic fatigue tests showed that the damage state at failure increased with an increase in the design VMA, indicating improved fatigue resistance. A similar trend was also observed for the prediction results from the layered viscoelastic pavement analysis for critical distresses (LVECD) program.
A study by Bahia et al. (2016) evaluated the feasibility of using performance-related properties to supplement the Superpave volumetric specifications in Wisconsin. An experiment was conducted to assess the sensitivity of I-FIT to mix variables of dust content, asphalt content, and aggregate source. Analysis results showed that asphalt content and aggregate source had significant effects on the FI results. Specifically, mixes with higher asphalt contents generally had higher FI values, which indicated better cracking resistance. However, no significant effect on the I-FIT results was found for the variable of dust content.
In a study by Hajj (2016), the performance of two thin asphalt mixtures was evaluated in terms of resistance to moisture damage, rutting, and reflection cracking. To simulate variations in the asphalt content during plant production, the asphalt content of two mixtures was varied by the corresponding tolerance allowed in the specification (i.e., 0.3 to 0.4%). For both FN and OT tests, mixtures with various asphalt contents showed comparable results, which indicated that variation in asphalt content within allowable tolerances would not significantly affect mixture rutting and cracking resistance.
A recent study by Ling et al. (2017) investigated the sensitivity of the I-FIT test to mix design factors using a statistical analysis approach. A number of mixtures with a range of RAP contents, design traffic levels, binder grades, and aging conditions were included. An experiment was performed to evaluate the effects of changes in asphalt content and filler content on the I-FIT results. Statistical analysis showed that RAP content and mixture aging condition were the two most significant factors in the FI regression model. In addition, mixtures with higher asphalt contents and filler contents had higher FI values, however, the difference was found not statistically significant by considering the variability of the test results.
NCHRP Project 20-07/Task 406
57
Zhou et al. (2017) recently developed an indirect tensile asphalt cracking test (IDEAL-CT) for mix design and QA testing. The test results were found sensitive to mix design components and volumetric properties including RAP and RAS content, asphalt grade, asphalt content, and air voids. For the evaluation of asphalt content, the control mixture was modified by varying the design asphalt content by ± 0.5 percent. Test results showed that mixtures with higher asphalt contents had higher IDEAL-CT values. IDEAL-CT results also increased with higher air voids content. The authors recommended using a correction factor when comparing the IDEAL-CT results of specimens with different air voids.
Issues, Gaps, and Needs Today, asphalt mixtures are primarily designed using the Superpave system where proportioning of the
aggregates and the asphalt binder relies primarily on volumetric properties. Calculation of these properties is highly dependent on an accurate determination of the specific gravity of the mix components. However, the variability of virgin aggregate specific gravity measurements and challenges of determining the specific gravity of recycled materials create a great deal of uncertainty regarding the accuracy of VMA results. Moreover, the increased use of RAP and RAS has raised even more questions about the interactions (or lack thereof) between virgin binders and recycled binders. Furthermore, the use of WMA additives, polymers, fibers, and rejuvenators has raised additional questions about the suitability of volumetric properties to ensure good performance. Therefore, mixture performance testing should be included as part of mix design and quality assurance.
The current asphalt mix design system has several issues that have been identified by the research team. Some of the issues include:
• Relationships between volumetric criteria and field performance have not been established; • Problems exist with accurately determining aggregate specific gravities. Consequently, key
volumetric properties used for mix design approval and quality assurance may not be accurate; • The current mix design method provides no assessment of rutting and cracking resistance; • The current mix design method provides no means to assess the benefits or detriments of recycled
materials or innovative materials; • The current mix design method provides no assessment of a mixture’s workability and
compactibility; • The current mix design system does not consider other important pavement characteristics such as
rolling resistance, skid resistance, potential for constructability problems, segregation, etc.; • The current compactive efforts are based on the assumption that mixtures will ultimately reach 96%
density following densification by traffic. However, many mixtures do not reach this point, especially modified mixtures and mixtures placed in intermediate and base layers; and
• There is no link between mix design and pavement design.
The next step toward implementing performance-based BMD procedures is to comprehensively assess the various approaches and develop AASHTO standards. This practice will define the processes required for agencies to develop and implement BMD with performance testing and criteria. Numerous states are conducting research to advance toward implementation of BMD. However, there are still gaps in the knowledge needed for implementation of BMD, including:
• Identifying the “best” performance test(s) for each mode of pavement distress; • Establishing relationships between performance test results and pavement distress from which mix
design criteria can be established; • Understanding differences between test results for mixtures fabricated in the lab and produced
through an asphalt plant; • Assessing the suitability of performance tests for use with non-traditional materials;
NCHRP Project 20-07/Task 406
58
• Conducting ruggedness experiments to reduce within and between laboratory variability of performance tests;
• Establishing precision and bias statements for the performance test results; • Evaluating the sensitivity of performance tests to changes in key mix properties; • Establishing appropriate moisture conditioning and aging protocols for mixtures prior to
performance testing; • Evaluating the possibility of conducting performance testing on field cores; • Identifying laboratory methods to assess mixture compactability and segregation potential; • Developing a recommended implementation plan for BMD; and • Developing training materials and delivering courses to aid implementation of BMD approaches.
Perhaps the most important topic is establishing good relationships between laboratory test results and
field performance. Some of the performance tests that do not correlate well to actual pavement distress should be excluded from further evaluation. Well-controlled field experiments with multiple test sections on the same pavement structure subjected to the same traffic and environment are needed so that criteria can be established for different regions and traffic categories.
Summary Today, asphalt mixtures are primarily designed and accepted based primarily on volumetric properties
of air voids, VMA, and VFA. Recognizing the deficiencies with the current mix design method and the consequences of poor field performance that results, many highway agencies have adopted mix design modifications including lowering gyration levels (Ndesign), lowering design air voids, increasing the minimum VMA, setting arbitrary limits on the use of recycled materials, and requiring polymer-modified binders in all mixes. However, the shortcomings of volumetric properties cannot be fixed with tweaks to existing procedures or criteria alone.
A number of DOTs have started to either explore or adopt approaches aimed at refining the mix design procedure to improve performance (specially cracking resistance) of asphalt mixes. The balanced mix design concept was initially developed by researchers at the Texas Transportation Institute using HWTT to evaluate rutting resistance and OT to evaluate cracking resistance. This approach used performance tests for rutting resistance and load-associated cracking resistance to establish more suitable mix designs.
The task force of the FHWA Mixtures and Construction ETG identified three potential approaches to the use of BMD. These approaches are 1) Volumetric Design with Performance Verification, 2) Performance-Modified Volumetric Mix Design, and 3) Performance Design. Some states have started to adopt these various BMD approaches. The Task Force identified Illinois, Louisiana, New Jersey, Texas, and Wisconsin as states that follow Approach 1. California is using Approach 2, and Rutgers University has proposed Approach 3 for New Jersey. The survey results show that most states are strongly considering a BMD approach.
Several DOTs are in the process of investigating cracking and rutting tests for integration into mix design requirements. Over the past few decades, numerous mixture performance tests have been developed by different researchers to evaluate cracking resistance and other distresses. Considering the different mechanisms involved in crack initiation and propagation, mixture cracking tests can be categorized into tests for thermal cracking, reflection cracking, bottom-up fatigue cracking, and top-down fatigue cracking. Mixture performance tests that are being considered by highway agencies and a summary of their advantages and disadvantages was included in this chapter. Recent studies that evaluated mixtures using the more popular performance tests were summarized. Specifically, research that focused on how key mixture variables (i.e., PMA, RAP, RAS, WMA, etc.) affected performance test results was reviewed and summarized to provide clues as to how mix designs may need to be adjusted to meet BMD approaches.
NCHRP Project 20-07/Task 406
59
The final section of this chapter presented a discussion on issues with the current asphalt mix design method, as well as gaps in understanding and research needs to move to a BMD approach. The primary issues with the current asphalt mix design system are 1) challenges with accurately determining aggregate specific gravities, 2) the inability to characterize interactions of virgin binders, recycled binders, and additives, and 3) the lack of an assessment for a mixture’s resistance to the most common forms of distress. The most critical research need is to identify the best practical cracking test (or tests) through validation of relationships between laboratory test results and measured cracking in field pavement test sections. These validation experiments are critical to both specifying agencies and asphalt producers to identify which tests are worth investing in lab equipment and to establish criteria for use in mix design and quality assurance specifications.
NCHRP Project 20-07/Task 406
60
C H A P T E R 4
Preliminary Draft of AASHTO Standard Practice and Specification for Balanced Mix Design
Based on the survey results and literature review, a framework for BMD was developed in the format of an AASHTO Standard Practice (i.e., R designation) and an AASHTO Standard Specification (i.e., M designation). The framework for the AASHTO Standard Practice includes four BMD approaches. Each of the approaches allows the specifying agency to select performance tests (e.g. rutting test, cracking test, moisture susceptibility test) of their choice. The four BMD approaches differ from each other with respect to the degree that existing Superpave criteria are utilized and the potential for using innovative materials and concepts appropriate for the layer and the application. Approach A - Volumetric Design with Performance Verification, is actually more restrictive than AASHTO R 35 because the additional mix performance test requirements are imposed on the completed R 35 mix design. Approach B - Volumetric Design with Performance Optimization would only allow some freedom in adjusting the optimum asphalt content by as much as 0.5% to meet the mixture performance test criteria. It could be presumed that all other mix criteria in AASHTO M 323 would be enforced. Approach C - Performance-Modified Volumetric Mix Design would begin with the steps in R 35 that go through the evaluation of trial blends at which point the performance tests are conducted to determine the optimum asphalt content for the design gradation. The agency may elect to relax some of the mix design criteria in M 323 as long as the performance test criteria are met. Approach D - Performance Design would rely solely on mix performance tests results to select the proportions of all mix components. This approach would be the least restrictive and allow for the highest level of innovation. Volumetric properties of the final mix design may be determined for reference information.
Preliminary Draft AASHTO Standard Practice The draft AASHTO Rxxx, Standard Practice for Balanced Design of Asphalt Mixtures, is in Appendix
A. An editable copy of the draft standard can be downloaded at this link: Draft BMD Standard Practice.
Preliminary Draft AASHTO Standard Specification The draft AASHTO Mxxx, Standard Specification for Balanced Mix Design, is in Appendix A. An
editable copy of the draft standard can be downloaded at this link: Draft BMD Specification.
Introduction In order to identify critical knowledge gaps, the research team established a five-part process as follows:
1. Identify the important steps needed to move a test method from concept to full implementation. 2. Create tables of candidate mixture performance test methods for each major distress and the steps
identified in Part 1. 3. Conduct a critical literature review to determine if each of the important steps has been completed for
the performance tests. 4. Establish a simple color code to identify completed, partially completed, or missing steps. 5. Identify research needs to complete missing and incomplete steps of most promising test methods.
Part I. Critical Steps Needed to Move a Test Method from Concept to Full Implementation
Figure 5-1 lists nine important steps in the development of a test method needed to successfully reach implementation into routine practice. Further discussion of these steps is provided below. Although the order of the steps presented below is the logical sequence, some tests have been developed in different orders. In some cases, the results of a step may indicate that the test method needs significant refinement and preceding steps may need to be repeated. An objective review of a method should be made after each step to determine whether the process should proceed.
Figure 5-1. The nine steps of test development to implementation.
1 • Develop draft test method and prototype equipment
2 • Evaluate sensitivity to materials and relationship to other lab properties
3 • Establish preliminary field performance relationship
4 • Conduct ruggedness experiment to refine its critical aspects
5 • Develop commercial equipment specification and pooled fund purchasing
6 • Conduct round-robin testing to establish precision and bias information
7 • Conduct robust validation of the test to set criteria for specifications
8 • Conduct training and certification
9 • Implement into engineering practice
NCHRP Project 20-07/Task 406
62
This is a long and expensive process to complete. However, failing to complete each step could ultimately lead to the implementation of a poor specification that is costly to the highway agency, the contracting industry, or both.
Step 1. Develop draft test method and prototype equipment
The motivation to develop a new test method is generally born from recognition of an important material characteristic (typically a material deficiency) that is not detected by existing methods or from a desire to correct flaws in an existing method. Researchers often look to the technical literature in the same or related fields for inspiration and guidance on how to measure the desired characteristic. In some cases, researchers may develop a test that attempts to simulate the critical condition at which the material deficiency occurs. Developing prototype equipment for the new test can be an arduous process with numerous iterations and refinements. Drafting of a written method often occurs when it is necessary for someone other than the original developer(s) to perform the test. Several revisions of the draft procedure are typically necessary to refine a method so that an independent technician or engineer can use it.
Step 2. Evaluate sensitivity to materials and relationship to other lab properties
Early research with a new test method often includes evaluating how the test results are affected by changing properties of the material. For example, how sensitive is the test to materials variables considered in asphalt mix design including asphalt content, grade of asphalt binder, aggregate gradation, aggregate type, recycled materials contents, air voids, and possibly other factors? Early experiments often also compare or contrast results of the new test to an existing method(s). Caution should be exercised in relying on another existing laboratory test to justify the results of a new test since the existing test may lack proper field validation.
Step 3. Establish preliminary field performance relationship
For a test method to be seriously considered for use in specifications, there must be a clear relationship between its results and field performance. However, this is a very difficult step to successfully accomplish. Challenges in this step can include obtaining materials used in field projects, confounding factors that impact field performance, and the long period of time necessary to obtain meaningful field performance data, especially for distresses that take more than just a few years to develop. Therefore, most tests have a very limited amount of data to relate results to field performance in the early stages of development. At best, these initial studies are typically based on limited data from a single state. Regardless of how well the test results match or correlate with observed field performance, those findings should still be published so that all stakeholders are aware of the outcomes and possible test limitations. If the test is subsequently improved, another lab-to-field study should be conducted. For load related distresses (i.e. rutting and fatigue cracking), an experiment using an accelerated pavement testing (APT) facility may be ideal for establishing preliminary relationships between lab tests and field performance because these facilities are able to test multiple cells/lanes/sections under the same loading, environments, and support conditions. However, since loading systems such as an accelerated loading facility (ALF) or heavy vehicle simulator (HVS) operate at much slower speed than highway traffic, such results are not applicable for setting criteria for typical pavement specifications.
Step 4. Conduct ruggedness experiment to refine its critical aspects
A ruggedness experiment is critical to refining a test procedure to establish appropriate controls/limits for factors that significantly affect the test’s results. For example, test methods typically state specific dimensions for the specimens. Some dimensions may affect the test results, so tolerances (e.g. X.X ± X.X
NCHRP Project 20-07/Task 406
63
mm) must be established to minimize such undesired sources of variability. Other examples of test controls that likely need to be evaluated in a ruggedness experiment include mixture aging temperature and time, specimen relative density, preconditioning time, test temperature, loading plate/strip geometries, loading frame compliance, loading/displacement rate, and data acquisition rate. For asphalt materials tests, ruggedness experiments should be conducted in accordance with ASTM E1169 (or ASTM C1067). Historically, few tests used in asphalt specifications have had formal ruggedness experiments conducted prior to the test’s use in routine practice.
Step 5. Develop commercial equipment specification and pooled fund purchasing
For labs to purchase equipment for preparing test specimens and conducting the test, detailed specifications are needed for that equipment. In some cases, a standardized program or worksheet should also be developed to ensure that results are calculated/analyzed in a consistent manner. A ruggedness experiment conducted prior to writing the equipment specification will help set tolerances for the equipment. When several equipment manufacturers produce the equipment, it is recommended to conduct an experiment with units from each manufacturer to verify that results from each unit are similar. When a large number of labs need to purchase the equipment, there may be significant advantages to purchasing a large number of units at the same time, such as with a pooled-fund equipment purchase.
Step 6. Conduct round-robin testing to establish precision and bias information
For tests whose results are used for materials approval and/or acceptance, it is necessary to establish the method’s precision and bias information. The standard for conducting a round-robin (a.k.a. interlaboratory) study is ASTM E691. An interlaboratory study is used to establish the acceptable range of two test results (replicates) from a single operator (i.e. within-lab) and the acceptable range of split-sample results from two different laboratories (i.e. between-lab). Knowing the within-lab and between-lab test variabilities of different candidate tests determined using ASTM E691 is useful information to help select the most preferred test option.
Step 7. Conduct robust validation of the test to set criteria for specifications
Before the test is used in a specification, an agency should have confidence that the criteria used for a material’s approval and/or acceptance are appropriately set. Criteria that are too strict will increase contractor risks and eventually increase bid prices. Criteria that are too lenient will ultimately lead to accepting poor performing materials. Robust validation of a test is a more rigorous experiment or group of experiments to make sure that the test provides results that provide a strong indicator of field performance. As with Step 3, there are numerous challenges to establishing a relationship between lab test results and pavement performance. The ideal validation experiment may include sites in different regions of the country with each site having five to ten test sections with mixtures expecting to have a range of performance from bad to good for the distress being evaluated. It is recommended for the validation experiment to include mixtures containing typical materials in the state and mixtures with known field performance. Tight controls on the construction of the tests sections is critical to avoid undesired or confounding effects. To eliminate potential bias, the laboratory testing should be completed such that the results of the field performance of the test sections are unknown and preferably by an organization other than the test’s primary developer. The desired result for each site is a strong correlation between the measured field distress and the laboratory test results from which a limit or limits can be established for specification purposes.
Another option for robust validation is to test mix designs that already have known field performance. This has been referred to as benchmarking. The challenges with this approach are (1) if the mix designs contained recycled materials, those materials may no longer be available, and (2) field performance is likely
NCHRP Project 20-07/Task 406
64
to be influenced by other factors that differ from project to project (e.g. traffic, underlying conditions), which confound an analysis of field to lab correlations.
Step 8. Conduct training and certification
Training of engineers and technicians on the test procedure and analysis of its results is vital to the successful implementation of a new test method. Agencies should facilitate the development of a training course and require participation by all personnel who are involved in specimen preparation, testing, and analysis of results. Periodic retraining is also appropriate as a test method is revised. Workshop type courses where participants are given hands-on time with sample preparation, testing, and analysis are preferred.
Step 9. Implement into engineering practice
Industry-agency task groups can be helpful in establishing an implementation plan. It is generally considered a best practice to begin implementation of a new specification through a series of shadow projects and pilot projects using a phased-in approach. The first phase is typically a limited number of shadow projects that add the new test(s) for information only and are helpful to work out sampling and testing logistics, assess how results compare to the proposed criteria, and make adjustments. Shadow projects may be added to existing contracts to facilitate early buy-in. The second phase is a series of pilot projects that use the test results for approving and accepting materials. The number of pilot projects should start out with just a few in the first year, then one to two projects in each district the second year, and so on. Adjustments may be made to each round to improve the processes and criteria. These projects enable more stakeholders to become more familiar with the test and how its results will impact the design and acceptance of their materials. Some agencies have also added a pay item to pilot projects for the purchase of new test equipment. The agency or the task group should consider whether the new tests and specifications should apply to all asphalt paving projects, or only apply to certain roadway classifications and projects of a minimum size. Overall, it may take four to five years to reach full implementation.
Part II Create Tables
The second part of the process involved creating tables of the most promising mixture performance tests for the six common forms of asphalt pavement distress: rutting, moisture damage, bottom-up fatigue cracking, top-down cracking, reflection cracking, and thermal cracking. The most promising tests for cracking distresses identified by NCHRP project 9-57 are shown in Table 5-1.
Table 5-1. Cracking tests selected at the NCHRP 9-57 Workshop.
Note: * OT for fatigue cracking was added later by request of the panel Source: NCHRP Research Results Digest 399
Shown in Table 5-2 is an example matrix of the candidate tests for bottom-up fatigue cracking and the
nine steps from Part I. The same type of matrix was prepared for all of the major forms of asphalt pavement distress. The results of the surveys conducted as part of Task 1 also helped identify tests that DOTs and contractors feel have the most potential for use in BMD. The first row below the header shows which tests
NCHRP Project 20-07/Task 406
65
were selected by NCHRP 9-57. The second row shows the total number of favorable responses for each test from the surveys as presented in Chapter 2.
Table 5-2. Matrix of candidate tests and critical steps to implementation.
Steps BBF SCB-Jc OT I-FIT Cyclic Fatigue
(S-VECD) IDT Fracture Energy Test
Selected at the NCHRP 9-57 Workshop Yes Yes Yes No No No
BMD Survey Responses 25 24 13 30 14 4 1. Develop draft test method and prototype equipment
2. Evaluate sensitivity to materials and relationship to other lab properties
3. Establish preliminary field performance relationship
4. Conduct ruggedness experiment to refine its critical aspects
5. Develop commercial equipment specification and pooled fund purchasing
6. Conduct round-robin testing to establish precision and bias information
7. Conduct robust validation of the test to set criteria for specifications
8. Conduct training and certification
9. Implement into engineering practice
Part III Conduct Critical Literature Review to Identify Steps Completed
The third part of the process involved a careful review of existing literature to determine which important steps for the selected tests were fully completed, partially completed, not completed, or if there was ongoing research to complete the step. This required a re-review of past literature as well as more recent papers such as those presented at the TRB meeting in January 2018. For example, with regard to sensitivity of the test to material properties (Step 2), the research team examined the literature to determine if the test was statistically sensitive to key mix design factors such as asphalt content and PG grade. In some cases, the existing research may have included experiments that evaluated some mix factors but lacked evaluation of other factors considered to be important. In such cases, the step was considered incomplete. Similarly, for Step 3 to be considered complete, numerous field projects should have been used to show the test results matched a range of field performance (i.e. rutting from <5 mm to > 12 mm). Alternatively, a well-controlled field experiment or APT experiment with multiple sections could have been used to establish a preliminary relationship to field performance. If the literature showed that the test results did not match/correlate well with field performance, Step 3 was considered incomplete.
NCHRP Project 20-07/Task 406
66
Important references for each test method and each step have been identified in the matrix tables for each distress. Identified references for the candidate tests are listed at the end of the section for each distress. The identified references in the tables is not an exhaustive list of all work involving the tests, but rather they are meant to indicate whether or not a particular critical step has been partially of fully completed.
Part IV Establish a Color Code for the Part II Tables to Visually Identify Gaps
Part IV of the process for identifying knowledge gaps was executed to provide an easy-to-grasp visual summary of the results of Parts I to III. The color coding scheme selected is shown below. Green cells identify steps that are considered complete. Yellow cells identify steps that are partially complete and may need additional research. Blue cells identify steps that have work that is on-going. This includes active and pending research, training, or trial projects. White cells identify steps that have yet to be addressed. The numbers shown in the cells correspond to the references applicable to that step. The reference numbers are unique to each mode of distress.
Figure 5-2. Color coding scheme for progress of the steps to implement a test method.
Part V Identify Research Needs for Incomplete Steps and Steps Yet to Be Addressed
Based on information gathered through this process, the research team identified existing gaps in the body of knowledge and test development steps that are needed to move the most promising performance tests to mainstream practice. Research problem statements (RPSs) were then drafted to address those gaps/needs.
Development Gaps for Candidate Tests This section summarizes the status of development and knowledge for each of the candidate tests
organized by the different modes of distress beginning with thermal cracking.
Thermal Cracking
Among the thermal cracking tests included in Table 5-3, the low-temperature SCB, DCT, and I-FIT were selected at the NCHRP 9-57 workshop and recommended for further laboratory evaluation and field validation. The selection of these tests was primarily based on considerations of test variability, interpretation of test results, correlations to field performance, test simplicity, and sensitivity to mix design parameters. The low-temperature SCB and DCT were also identified as the tests with the most potential to address thermal cracking in the BMD surveys that were conducted in Task 1 of the study. Based on a critical review of existing literature, the DCT has completed the most critical steps (six steps) necessary for successful implementation into routine practice. Highlights of the three thermal cracking tests selected at the NCHRP 9-57 workshop are presented below.
Completed step
Incomplete step
On-going work
Not addressed
NCHRP Project 20-07/Task 406
67
Table 5-3. Thermal cracking tests and critical steps to implementation.
Steps Low-
temperature SCB
DCT I-FIT IDT Creep
and Strength
TSRST and
UTSST
BBR Mixture
Selected at the NCHRP 9-57 Workshop Yes Yes Yes No No No
BMD Survey Responses* 40 28 2 17 14 1
1. Develop draft test method and prototype equipment (1) (8) (16, 17,
18) (25, 26) (32, 33) (38, 39)
2. Evaluate sensitivity to materials and relationship to other lab properties
4. Conduct ruggedness experiment to refine its critical aspects
(5) (5) (5, 20) (31) (40)
5. Develop commercial equipment specification and pooled fund purchasing
(6, 7) (6) (7, 21, 22) (36, 37) (41, 42,
43, 44)
6. Conduct round-robin testing to establish precision and bias information
(14) (23) (31)
7. Conduct robust validation of the test to set criteria for specifications
(3) (3, 15) (15) (3, 15)
8. Conduct training and certification (14) (24, 45)
9. Implement into engineering practice IA, MN,
MO IL
Note: * Total number of responses (DOT and agency) that identified the test as having potential to address this distress
Low-temperature SCB
• [Step 2] The test was found sensitive to mix design variables of binder grade, aggregate type, and air voids, but was not sensitive to changes in RAP content.
• [Step 4] The primary objective of NCHRP 09-57A is to determine the ruggedness of seven identified laboratory tests in NCHRP 9-57, which include the low-temperature SCB. The project is expected to start in June 2018 and will completely address Step 4 upon its completion.
• [Step 7] Both low-temperature SCB test parameters of fracture energy and fracture toughness had good correlations with field transverse cracking data for field projects in IL, MN, and WI.
• Three gaps are identified from literature for low-temperature SCB test, which include conducting round-robin testing to establish precision and bias statement (Step 6), conducting training (Step 8), and implementing into engineering practice (Step 9).
NCHRP Project 20-07/Task 406
68
DCT
• [Step 2] The test was found sensitive to key mix design variables of binder grade, aggregate type, RAP and RAS contents, and WMA technology, but conflicting results were reported regarding its sensitivity to binder content and air voids.
• [Step 4] DCT is one of the seven tests selected for ruggedness testing in NCHRP 09-57A. The project is expected to start in June 2018 and will completely address Step 4 upon its completion.
• [Step 7] The fracture energy parameter had a good correlation with field transverse cracking data for field projects in three states (i.e., IL, MN, and NY). In addition, MnROAD and NCAT are conducting a national cracking study to validate laboratory tests for thermal cracking and top-down cracking. DCT is being evaluated as one candidate test for thermal cracking. The study will partially address Step 7 upon its completion.
• [Step 8] Training on the DCT test has occurred in Minnesota. Additional training would be needed for more widespread implementation of the method in other states.
I-FIT
• [Step 2] The test was found to be sensitive to binder grade, RAP and RAS contents, air voids, and mix aging, but conflicting results have been reported regarding its sensitivity to binder content.
• [Step 4] I-FIT is one of the seven tests selected for ruggedness testing in NCHRP 09-57A. The project is expected to start in June 2018 and will completely address Step 4 upon its completion.
• [Step 6] Illinois DOT is conducting annual Round Robin Studies with 10 IDOT labs, the Illinois Center for Transportation, various private labs, and labs from other state agencies. These studies have been completed for 2017 and 2018 with 30 labs participating in 2017 and 34 labs participating in 2018.. These studies will completely address Step 6 upon their completion.
• [Step 7] I-FIT is being evaluated as one candidate test for thermal cracking as part of the ongoing MnROAD/NCAT cracking study. The study will partially address Step 3 and Step 7 upon its completion.
• [Step 8] Training on the I-FIT method has occurred in Illinois and as part of NCAT’s Balanced Mix Design Course. Additional training would be needed for more widespread implementation of the method in other states
In summary, four out of six thermal cracking tests included in Table 5-3 have Step 2 highlighted in
yellow, indicating that existing research only partially addressed the tests’ sensitivity to materials and relationship to other laboratory properties. Therefore, a comprehensive sensitivity study is needed for future research to evaluate the top three or four candidate tests. Key mix design variables recommended for investigation include asphalt content, binder grade, recycled materials, aggregate type, air voids, and mix aging conditions. Based on existing literature and BMD survey responses, DCT seems to be the most preferred thermal cracking test. If the two ongoing studies identified in Steps 4 and 7 provide positive outcomes, no further research will be needed to advance the implementation of DCT into routine practice. Of course, training will be needed for other states that plan to implement the DCT. In addition, a lower priority research need is to conduct round-robin testing and industry training for the low-temperature SCB test. The IDT Creep and Strength and TSRST/UTSST tests, in the opinion of the research team, are not practical for implementation into routine practice for BMD. The BBR Mixture test is a relatively new test worthy for further research, but this should be considered a low priority. Finally, two draft research problem statements (RPSs) are proposed to evaluate the sensitivity of some thermal cracking tests to mix design variables and to estimate precision estimates for the low-temperature SCB test (AASHTO TP 105). These two RPSs are discussed in Chapter 6.
NCHRP Project 20-07/Task 406
69
Key References for Thermal Cracking
1. Li, X., and M. Marasteanu. 2004. “Evaluation of the Low Temperature Fracture Resistance of Asphalt Mixtures Using the Semi-Circular Bend Test (with Discussion).” Journal of the Association of Asphalt Paving Technologists, 73.
2. Li, X. and M.O. Marasteanu. 2010. “Using Semi-Circular Bending Test to Evaluate Low Temperature Fracture Resistance for Asphalt Concrete.” Experimental Mechanics, 50(7), pp. 867–876.
3. Marasteanu, M., W. Buttlar, H. Bahia, C. Williams, K.H. Moon, E.Z. Teshale, A.C. Falchetto, M. Turos, E. Dave, G. Paulino, and S. Ahmed. 2012. “Investigation of Low Temperature Cracking in Asphalt Pavements National Pooled Fund Study–Phase II.”
4. West, R.C., J.R. Willis, and M.O. Marasteanu. 2013. NCHRP Report 752: Improved Mix Design, Evaluation, and Materials Management Practices for Hot Mix Asphalt with High Reclaimed Asphalt Pavement Content, Transportation Research Board, Washington, DC.
5. NCHRP 09-57A [RFP]. Field Validation of Laboratory Tests to Assess Cracking Resistance of Asphalt Mixtures. http://apps.trb.org/cmsfeed/TRBNetProjectDisplay.asp?ProjectID=447, accessed on January 19, 2018.
6. Testquip LLC. Disk-Shaped Compact Tension Machine. http://www.testquip.com/docs/DCT_Brochure.pdf, accessed on January 19, 2018.
7. Humboldt. Semi-circular Bending (SCB) Head. https://www.humboldtmfg.com/datasheets/H-1351-SCB_datasheet_0117.pdf, accessed on January 19, 2018.
8. Wagoner, M., W. Buttlar, G. Paulino, and P. Blankenship. 2005. “Investigation of the Fracture Resistance of Hot-Mix Asphalt Concrete Using a Disk-Shaped Compact Tension Test.” Transportation Research Record: Journal of the Transportation Research Board, No. 1929, Washington, DC, pp. 183–192.
9. Braham, A., W. Buttlar, and M. Marasteanu. 2007. “Effect of Binder Type, Aggregate, and Mixture Composition on Fracture Energy of Hot-Mix Asphalt in Cold Climates.” Transportation Research Record: Journal of the Transportation Research Board, No. 2001, Washington, DC, pp. 102–109.
10. Dave, E.V., B. Behnia, S. Ahmed, W. G. Buttlar, and H. Reis. 2011. “Low Temperature Fracture Evaluation of Asphalt Mixtures Using Mechanical Testing and Acoustic Emissions Techniques.” Journal of the Association of Asphalt Paving Technologists, 80.
11. Hill, B., B. Behnia, W. G. Buttlar, and H. Reis. 2012. “Evaluation of Warm Mix Asphalt Mixtures Containing Reclaimed Asphalt Pavement Through Mechanical Performance Tests and An Acoustic Emission Approach.” Journal of Materials in Civil Engineering, 25(12), pp. 1887–1897.
12. Arnold, J. W., B. Behnia, M.E. McGovern, B. Hill, W.G. Buttlar, and H. Reis. 2014. “Quantitative Evaluation of Low-Temperature Performance of Sustainable Asphalt Pavements Containing Recycled Asphalt Shingles (RAS).” Construction and Building Materials, Vol. 58, pp. 1–8.
13. Zhou, F., S. Im, S. Hu, D. Newcomb, and T. Scullion. 2017. “Selection and Preliminary Evaluation of Laboratory Cracking Tests for Routine Asphalt Mix Designs.” Road Materials and Pavement Design, 18(sup1), pp. 62–86.
14. Dave, E.V. 2017. “Asphalt Performance Testing and Specification Development.” 57th Annual Pennsylvania Asphalt Paving Association Conference, Hershey, PA.
15. Van Deusen, D. 2017. “NCAT/MnROAD Cracking Group Update.” Test Track Sponsor Meeting, St. Paul, MN. 16. Al-Qadi, I.L., H. Ozer, J. Lambros, A. El Khatib, P. Singhvi, T. Khan, J. Rivera-Perez, and B. Doll. 2015. “Testing
Protocols to Ensure Performance of High Asphalt Binder Replacement Mixes Using RAP and RAS.” Illinois Center for Transportation Series No. 15-017, Illinois Center for Transportation/University of Illinois at Urbana-Champaign.
17. Ozer, H., I.L. Al-Qadi, E. Barber, E. Okte, Z. Zhu, and S. Wu. 2017. “Evaluation of I-FIT Results and Machine Variability using MnRoad Test Track Mixtures.” Illinois Center for Transportation/Illinois Department of Transportation.
18. Edoardo, B., O. Hasan, L. Imad, O. Egemen, Z. Zehui, and W. Shenghua. 2018. “Effect of I-FIT Configuration on Test Results of Asphalt Mixtures.” Transportation Research Board 97th Annual Meeting, Washington, DC.
19. Chen, X. and M. Solaimanian. 2018. “The Effect of Mix Parameters on the Semicircular Bend Fatigue Test.” Transportation Research Board 97th Annual Meeting, Washington, DC.
20. Rivera-Perez, J., H. Ozer, and I.L. Al-Qadi. 2018. “Impact of Specimen Configuration and Characteristics on Illinois Flexibility Index.” Paper No. 18-03186. Transportation Research Board 97th Annual Meeting, Washington, DC.
21. InstroTek Inc. Auto_SCB. https://www.instrotek.com/products/auto_scb, accessed on January 19, 2018.
22. Testquip LLC. Illinois – flexibility index tester (I-FIT) by Testquip. http://www.testquip.com/docs/SCB_IFIT_Brochure.pdf, accessed on January 19, 2018.
23. Pfeifer, B. 2018. “Illinois Department of Transportation’s Practices for Balanced Mix Design.” TRB Workshop 124, Balanced Asphalt Mixture Design: Implementation Efforts and Success Stories.
24. National Center for Asphalt Technology (NCAT) at Auburn University. Balanced Mix Design Training Course. http://ncat.us/education/training/industry/balanced-mix.html, accessed on January 19, 2018.
25. Roque, R., and W.G. Buttlar. 1992. “The Development of a Measurement and Analysis System to Accurately Determine Asphalt Concrete Properties Using the Indirect Tensile Mode (with Discussion).” Journal of the Association of Asphalt Paving Technologists, 61.
26. Buttlar, W.G., and R. Roque. 1994. “Development and Evaluation of The Strategic Highway Research Program Measurement and Analysis System for Indirect Tensile Testing at Low Temperatures. Transportation Research Record, Journal of the Transportation Research Board, No. 1454, Washington, DC, pp. 163–171.
27. Zhou, F., D. Newcomb, C. Gurganus, S. Banihashemrad, E. S. Park, M. Sakhaeifar, and R. L. Lytton. 2016. “Experimental Design for Field Validation of Laboratory Tests to Assess Cracking Resistance of Asphalt Mixtures.” National Cooperative Highway Research Program, Transportation Research Board of the National Academies, 9-57.
28. Tran, N.H., A. Taylor, and R. Willis. 2012. “Effect of Rejuvenator on Performance Properties of HMA Mixtures with High RAP and RAS Contents.” NCAT Report 12-05, National Center for Asphalt Technology at Auburn University.
29. Johnson, E., M. Watson, R. Olson, K.H. Moon, M. Turos, and M. Marasteanu. 2013. “Recycled Asphalt Pavement: Study of High-RAP Asphalt Mixtures on Minnesota County Roads.” Report MN/RC 15.
30. West, R., C. Rodezno, G. Julian, B. Prowell, B. Frank, L.V. Osborn, and T. Kriech. 2014. NCHRP Report 779: Field Performance of Warm Mix Asphalt Technologies. Transportation Research Board of the National Academies, Washington, DC.
31. Christensen, D.W. and R.F. Bonaquist. 2004. NCHRP Report 530: Evaluation of Indirect Tensile Test (IDT) Procedures for Low-Temperature Performance of Hot Mix Asphalt. Transportation Research Board of the National Academies, Washington, DC.
32. Jung, D.H. and T.S. Vinson. 1994. “Low-Temperature Cracking: Test Selection.” No. SHRP-A-400, Strategic Highway Research Program, Washington, DC.
33. Hajj, E., P. Sebaaly, J. Porras, and J. Azofeifa. 2010. “Reflection Cracking of Flexible Pavements Phase III: Field Verification.” Research Report No. 13KJ-1, Nevada Department of Transportation, Research Division, University of Nevada, Reno.
34. Marasteanu, M., A. Zofka, M. Turos, X. Li, R. Velasquez, X. Li, W. Buttlar, G. Paulino, A. Braham, E. Dave, and J. Ojo. 2007. “Investigation of Low Temperature Cracking in Asphalt Pavements.” National Pooled Fund Study 776.
35. Zubeck, H., H. Zeng, T. Vinson, and V. Janoo. 1996. “Field Validation of Thermal Stress Restrained Specimen Test: Six Case Histories.” Transportation Research Record: Journal of the Transportation Research Board, No. 1545, Washington DC, pp. 67–74.
36. Pavetest. B282 KIT TSRST. http://www.pavetest.com/en/Products/no-sector/no-macrocat/no-cat/B230-dynamic-testing-system-dts-30/TSRST---Thermal-Stress-Restrained-Specimen-Test-, accessed on January 19, 2018.
37. James Cox & Sons, Inc. Asphalt Pavement Thermal Testing. https://jamescoxandsons.com/asphalt-pavement-thermal-testing-system/, accessed on January 19, 2018.
38. Romero, P. 2016. “Using the Bending Beam Rheometer for Low Temperature Testing of Asphalt Mixtures.” No. UT-16.09.
39. Mohammed, A., P. Romero, and F. Safazadeh. 2018. “Number of Replicate Beams Required for Valid Test of Asphalt Mixtures Using the Bending Beam Rheometer Test Based on AASHTO TP125.” Presented at Transportation Research Board Annual Meeting Poster Session 718.
40. Romero, P. 2016. “AASHTO TP-125: Bending Beam Rheometer for Low Temperature Performance of Asphalt Mixtures.” FHWA Expert Step Group Meeting.
41. Humboldt. Bending Beam Rheometer. https://www.humboldtmfg.com/bending-beam-rheometer-2.html, accessed on January 19, 2018.
42. James Cox & Sons, Inc. Bending Beam Rheometer. https://jamescoxandsons.com/bending-beam-rheometer/, accessed on January 19, 2018.
43. Cannon Instrument Company. TE-BBR Thermoelectric Bending Beam Rheometer. https://www.cannoninstrument.com/en/uproduct/te-bbr-thermoelectric-bending-beam-rheometer?id=CANNON%20TE-BBR, accessed on January 19, 2018.
44. Applied Test Systems. Bending Beam Rheometer 3. http://www.atspa.com/products/materials-testing/asphalt-testing/bbr3/, accessed on January 19, 2018.
45. Illinois Department of Transportation Quality Management Training Program, CET 029 Hot Mix Level 1, https://www.lakelandcollege.edu/idot-quality-management-training-program/, accessed on August 28, 2018.
Reflection Cracking
Among the reflection cracking tests included in Table 5-4, OT, SCB-Jc, and BBF were selected at the NCHRP 9-57 workshop and recommended for further laboratory evaluation and field validation. The selection of these tests was primarily based on considerations of test variability, interpretation of test results, correlations to field performance, test simplicity, and sensitivity to mix design parameters. Based on a review of existing literature, the OT and DCT have completed more of the critical steps required for implementation into routine practice than the other three tests. In the BMD survey, OT and I-FIT were identified as the tests with the most potential to address reflection cracking, while SCB-Jc and BBF were only selected by one survey respondent. In addition, 18 survey respondents considered the DCT to have potential as a reflection cracking test. Highlights of the three candidate reflection cracking tests selected at the NCHRP 9-57 workshop are provided below.
Table 5-4. Reflection cracking tests and critical steps to implementation.
Steps OT SCB-Jc BBF I-FIT DCT
Selected at the NCHRP 9-57 Workshop Yes Yes Yes No No
BMD Survey Responses 33 1 1 33 18
1. Develop draft test method and prototype equipment (1, 2, 3) (16, 17) (30) (33, 34, 35) (41)
2. Evaluate sensitivity to materials and relationship to other lab properties
(4, 5, 6, 7, 8)
(16, 18, 19, 20, 21, 22, 23,
24, 25, 26) (30) (33, 35, 36) (36, 42, 43,
44, 45)
3. Establish preliminary field performance relationship
(4, 5, 8, 9) (37) (43, 46)
4. Conduct ruggedness experiment to refine its critical aspects
(10) (10) (10) (10, 38) (10)
5. Develop commercial equipment specification and pooled fund purchasing
(11, 12) (27, 28) (31, 32) (27, 28, 39) (47)
6. Conduct round-robin testing to establish precision and bias information
(13) (40) (48)
7. Conduct robust validation of the test to set criteria for specifications (14) (14) (14)
8. Conduct training and certification (15) (29) (15, 49) (48)
9. Implement into engineering practice TX, NJ LA IL
• [Step 4] The primary objective of the pending NCHRP 09-57A project is to determine the ruggedness of seven identified laboratory tests, which include the OT. The project is expected to start in June 2018 and will completely address Step 4 upon its completion.
• [Step 6] The Center for Advanced Infrastructure and Transportation (CAIT) at Rutgers is leading a round-robin experiment that includes five laboratories. The study will completely address Step 6 upon its completion.
• [Step 7] MnROAD is conducting a cracking study to validate laboratory tests for reflection cracking. The pooled-fund study is being conducted as part of the National Road Research Alliance (NRRA). OT is one of the tests selected for evaluation. The study will partially address Step 7 upon its completion.
• [Step 8] Training on the OT method has occurred in Texas and as part of NCAT’s Balanced Mix Design Course. Additional training would be needed for more widespread implementation of the method in other states.
SCB-Jc
• [Step 2] The test was found sensitive to recycling agents, REOB, and bio-binders, but conflicting results were reported regarding its sensitivity to key mix design variables of binder grade, RAP and RAS contents, and mix aging.
• [Step 4] SCB-Jc is one of the seven tests selected for ruggedness testing in NCHRP 09-57A. The project is expected to start in June 2018 and will completely address Step 4 upon its completion.
• [Step 8] Training on the SCB-Jc method has occurred in Louisiana and as part of NCAT’s Balanced Mix Design Course. Additional training would be needed for more widespread implementation of the method in other states.
• Three gaps are identified from literature for SCB-Jc test, which include establishing preliminary field performance relationship for reflection cracking (Step 3), conducting round-robin testing to establish precision and bias statement (Step 6), and conducting robust validation of the test to set criteria for specifications (Step 7).
BBF
• [Step 4] The BBF test is one of the seven tests selected for ruggedness testing in NCHRP 09-57A. The project is expected to start in June 2018 and will completely address Step 4 upon its completion.
• Five gaps are identified from literature for the BBF test, which include establishing preliminary field performance relationship for reflection cracking (Step 3), conducting round-robin testing to establish precision and bias statement (Step 6), conducting robust validation of the test to set criteria for specifications (Step 7), conducting training (Step 8), and implementing into engineering practice (Step 9).
Based on existing literature and BMD survey responses, OT and DCT appear to have the most potential
to address reflection cracking in BMD. If the ongoing studies identified in Steps 4 and 6 provide positive outcomes, no further research except robust field validation would be needed prior to broader training on the method of choice in states that plan to implement it into routine practice. Although the ongoing NRRA study was designed to validate reflection cracking tests, the as-built test sections only considered one underlying pavement type and included two confounding variables of overlay structure and pavement thickness to the primary variable of overlay mixture type. Therefore, additional validation experiments are recommended for future research that should consider different climates in the country and incorporate both underlying pavement types of HMA and PCC. The I-FIT is another potential test for reflection cracking
NCHRP Project 20-07/Task 406
73
because it has been found to correlate well with OT but has an advantage of lower variability. The SCB-Jc and BBF tests are not recommended for implementation into BMD for reflection cracking because both tests have at least three critical incomplete steps. Furthermore, the BBF test is not deemed practical for use in BMD due to the time and cost of specimen preparation, testing, and data analysis. Finally, one draft RPS related to the validation of laboratory tests for reflection cracking is proposed and discussed in Chapter 6.
Key References for Reflection Cracking
1. German, F.P., and R.L. Lytton. 1979. “Methodology for Predicting the Reflection Cracking Life of Asphalt Concrete Overlays.” Vol. 5. Report No. TTI-2-8-75-207.
2. Zhou, F., and T. Scullion. 2003. “Upgraded Overlay Tester and Its Application to Characterize Reflection Cracking Resistance of Asphalt Mixtures.” No. FHWA/TX-04/0-4467-1. Texas Transportation Institute, Texas A&M University System.
3. Garcia, V.M., A. Miramontes, J. Garibay, I. Abdallah, G. Carrasco, R. Lee, and S. Nazarian. 2017. “Alternative Methodology for Assessing Cracking Resistance of Hot Mix Asphalt Mixtures with Overlay Tester.” Road Materials and Pavement Design, pp. 1–17.
4. Zhou, F., and T. Scullion. 2005. “Overlay Tester: A Rapid Performance Related Crack Resistance Test.” Vol. 7. Texas Transportation Institute, Texas A & M University System.
5. Zhou, F., S. Hu, and T. Scullion. 2006. “Integrated Asphalt (Overlay) Mix Design with Balancing Rutting and Cracking Requirements.” Report FHWA/TX-06/0-5123-1. FHWA, Texas A&M Transportation Institute, College Station.
6. Zhou, F., S. Hu, G. Das, and T. Scullion. 2011. “High RAP Mixes Design Methodology with Balanced Performance.” Texas Transportation Institute, FHWA/TX-11/0-6092-2.
7. Zhou, F., H. Li, S. Hu, J.W. Button, and J.A. Epps. 2012. “Characterization and Best Use of Recycled Asphalt Shingles in Hot-Mix Asphalt.” Texas Transportation Institute, Texas A&M University System.
8. Walubita, L.F., A.N. Faruk, G. Das, H.A. Tanvir, J. Zhang, and T. Scullion. 2012. “The Overlay Tester: A Sensitivity Study to Improve Repeatability and Minimize Variability in the Test Results.” Project Report: FHWA/TX-12/0-6607-1, Federal Highway Administration, Washington, DC.
9. Garcia, V., I. Abdallah, and S. Nazarian. 2018. “Verification of Cracking Properties of Asphalt Concrete Pavements with Overlay Tester.” Transportation Research Board Annual Meeting.
10. NCHRP 09-57A [RFP]. Field Validation of Laboratory Tests to Assess Cracking Resistance of Asphalt Mixtures. http://apps.trb.org/cmsfeed/TRBNetProjectDisplay.asp?ProjectID=447, accessed on January 19, 2018.
11. Advanced Asphalt Technologies. Overlay Tester. http://advancedasphalt.com/overlay-tester/, accessed on January 19, 2018.
12. James Cox & Sons, Inc. Texas Overlay Tester. https://jamescoxandsons.com/texas-overlay-tester/, accessed on January 19, 2018.
13. Bennert, T., E. Hass, and E. Wass. 2017. “Round Robin Testing Program for the Overlay Tester.” NJDOT B-10. Center for Advanced Infrastructure and Transportation (CAIT) Rutgers, the State University of New Jersey.
14. NRRA Road Research. http://www.dot.state.mn.us/mnroad/nrra/index.html, accessed on March 19, 2018. 15. National Center for Asphalt Technology at Auburn University. Balanced Mix Design Training Course.
http://ncat.us/education/training/industry/balanced-mix.html, accessed on January 19, 2018. 16. Wu, Z., L. Mohammad, L. Wang, and M. Mull. 2005. “Fracture Resistance Characterization of Superpave Mixtures
Using the Semi-Circular Bending Test.” Journal of ASTM International, Vol. 2, No. 3, pp. 1–15. 17. Elseifi, M.A., L.N. Mohammad, H. Ying, and S. Cooper III. 2012. “Modeling and Evaluation of the Cracking Resistance
of Asphalt Mixtures Using The Semi-Circular Bending Test at Intermediate Temperatures.” Road Materials and Pavement Design, 13(sup1), pp. 124–139.
18. Kim, M., L.N. Mohammad, and M.A. Elseifi. 2012. “Characterization of Fracture Properties of Asphalt Mixtures as Measured by Semicircular Bend Test and Indirect Tension Test.” Transportation Research Record, Journal of The Transportation Research Board, No. 2296, Washington, DC, pp. 115–124.
19. Bonaquist, R. 2016. “Critical Factors Affecting Asphalt Concrete Durability.” WisDOT ID no. 0092-14-06, Wisconsin DOT.
20. Arshadi, A., R. Ghabchi, S.A. Ali, M. Barman, M. Zaman, and S. Cummuir. 2018. “Semi-Circular Bending (SCB) Test on Lab-Produced, Plant-Produced, and Field Warm Mix Asphalts.” Transportation Research Board 97th Annual Meeting, Washington, DC.
21. Mandal, T., C. Ling, P. Chaturabong, and H.U. Bahia. 2017. “Effects of Mixture Design Factors on Results of Semicircular Bending Test.” Transportation Research Board 96th Annual Meeting, Washington, DC.
22. You, T., Y. Shi, L.N. Mohammad, and S. Cooper III. 2018. “Laboratory Performance of Asphalt Mixtures Containing Re-Refined Engine Oil Bottoms (REOB) Modified Asphalt Binders.” Transportation Research Board 97th Annual Meeting, Washington, DC.
23. You, T., S.S. Balamuruganb, M. Nazzal, L.N. Mohammad, I. Negulescua, and W.H. Daly. 2018. “Rheological, Chemical, Micro-Mechanical, and Mechanical Properties of Re-refined Engine Oil Bottoms (REOB) Modified Binders.” Transportation Research Board 97th Annual Meeting, Washington, DC.
24. Cao, W., L.N. Mohammad, P. Barghabany, S. Cooper III, and S. Salari. 2018. “Comparison of Asphalt Mixture Crack Resistance at Intermediate Temperatures Using Advanced Test Methods and Theories.” Transportation Research Board 97th Annual Meeting, Washington, DC.
25. Mohammad, L.N., M. Elseifi, S. Cooper III, and P. Naidoo. 2018. “Laboratory Evaluation of Asphalt Mixtures Containing Bio-Binder Technologies.” Submitted for publication to the Transportation Research Board.
26. Amir, A., G. Rouzbeh, A. Syed, B. Manik, Z. Musharraf, and C. Sesh. 2018. “Semicircular Bending (SCB) Test on Lab-Produced, Plant-Produced, and Field Warm-Mix Asphalts.” Transportation Research Board 97th Annual Meeting, Washington, DC.
27. InstroTek Inc. Auto_SCB. https://www.instrotek.com/products/auto_scb, accessed on January 19, 2018. 28. Humboldt. Semi-circular Bending (SCB) Head. https://www.humboldtmfg.com/datasheets/H-1351-
SCB_datasheet_0117.pdf, accessed on January 19, 2018. 29. Cooper, S. 2018. “Development and Implementation of Louisiana’s Balanced Asphalt Mixture Design.” Transportation
Research Board 97th Annual Meeting, Washington, DC. 30. Tayebali, A. A., J. A. Deacon, and C. L. Monismith et al. 1994. “Fatigue Response of Asphalt-Aggregate Mixes.”
SHRP-A-404, National Research Council, Washington, D.C. 31. James Cox & Sons, Inc. Stand Alone Four Point Bending Beam. https://jamescoxandsons.com/stand-alone-four-point-
bending-beam-machine/, accessed on January 19, 2018. 32. GCTS Testing Systems. Beam Fatigue Test. https://www.gcts.com/?s=prod_ver&p=products&ID=217, accessed on
January 19, 2018. 33. Al-Qadi, I.L., H. Ozer, J. Lambros, A. El Khatib, P. Singhvi, T. Khan, J. Rivera-Perez, and B. Doll. 2015. “Testing
Protocols to Ensure Performance of High Asphalt Binder Replacement Mixes Using RAP and RAS.” Illinois Center for Transportation Series No. 15-017, Illinois Center for Transportation/University of Illinois at Urbana-Champaign.
34. Ozer, H., I.L. Al-Qadi, E. Barber, E. Okte, Z. Zhu, and S. Wu. 2017. “Evaluation of I-FIT Results and Machine Variability using MnRoad Test Track Mixtures.” Illinois Center for Transportation/Illinois Department of Transportation.
35. Edoardo, B., O. Hasan, L. Imad, O. Egemen, Z. Zehui, and W. Shenghua. 2018. “Effect of I-FIT Configuration on Test Results of Asphalt Mixtures.” Transportation Research Board 97th Annual Meeting, Washington, DC.
36. Zhou, F., S. Im, S. Hu, D. Newcomb, and T. Scullion. 2017. “Selection and Preliminary Evaluation of Laboratory Cracking Tests for Routine Asphalt Mix Designs.” Road Materials and Pavement Design, 18(sup1), pp. 62–86.
37. Al-Qadi, I.L., D. Lippert, S. Wu, H. Ozer, G. Renshaw, T.R Murphy, A. Butt, S. Gundapuneni, J.S. Trepanier, J.W Vespa, I.M. Said, A.F. Espinoza Luque, and F.R. Safi. 2017. “Utilizing Lab Tests to Predict Asphalt Overlay Performance.” Illinois Center for Transportation. Report No. FHWA-ICT-17-020.
38. Rivera-Perez, J., H. Ozer, and I.L. Al-Qadi. 2018. “Impact of Specimen Configuration and Characteristics on Illinois Flexibility Index.” Paper No. 18-03186. Transportation Research Board 97th Annual Meeting, Washington, DC.
39. Testquip LLC. Illinois – Flexibility Index Tester (I-FIT) by Testquip. http://www.testquip.com/docs/SCB_IFIT_Brochure.pdf, accessed on January 19, 2018.
40. Pfeifer, B. 2018. “Illinois Department of Transportation’s Practices for Balanced Mix Design.” TRB Workshop 124, Balanced Asphalt Mixture Design: Implementation Efforts and Success Stories.
41. Wagoner, M., W. Buttlar, G. Paulino, and P. Blankenship. 2005. “Investigation of the Fracture Resistance of Hot-Mix Asphalt Concrete Using a Disk-Shaped Compact Tension Test.” Transportation Research Record: Journal of the Transportation Research Board, 1929, Washington, DC, pp. 183–192.
42. Braham, A., W. Buttlar, and M. Marasteanu. 2007. “Effect of Binder Type, Aggregate, and Mixture Composition on Fracture Energy of Hot-Mix Asphalt in Cold Climates.” Transportation Research Record: Journal of the Transportation Research Board, 2001, Washington, DC, pp. 102–109.
43. Dave, E.V., B. Behnia, S. Ahmed, W. G. Buttlar, and H. Reis. 2011. “Low Temperature Fracture Evaluation of Asphalt Mixtures Using Mechanical Testing and Acoustic Emissions Techniques.” Journal of the Association of Asphalt Paving Technologists, 80.
44. Hill, B., B. Behnia, W. G. Buttlar, and H. Reis. 2012. “Evaluation of Warm Mix Asphalt Mixtures Containing Reclaimed Asphalt Pavement Through Mechanical Performance Tests and an Acoustic Emission Approach.” Journal of Materials in Civil Engineering, 25(12), pp. 1887–1897.
45. Arnold, J. W., B. Behnia, M.E. McGovern, B. Hill, W.G. Buttlar, and H. Reis. 2014. “Quantitative Evaluation of Low-Temperature Performance of Sustainable Asphalt Pavements Containing Recycled Asphalt Shingles (RAS).” Construction and Building Materials, Vol. 58, pp.1–8.
46. Wagoner, M.P., W. G. Buttlar, G. H. Paulino, and P. Blankenship. 2006. “Laboratory Testing Suite for Characterization of Asphalt Concrete Mixtures Obtained from Field Cores (with Discussion).” Journal of the Association of Asphalt Paving Technologists, 75.
47. Testquip LLC. Disk-Shaped Compact Tension Machine. http://www.testquip.com/docs/DCT_Brochure.pdf, accessed on January 19, 2018.
48. Dave, E.V. 2017. “Asphalt Performance Testing and Specification Development.” 57th Annual Pennsylvania Asphalt Paving Association Conference, Hershey, PA.
49. Illinois Department of Transportation Quality Management Training Program, CET 029 Hot Mix Level 1, https://www.lakelandcollege.edu/idot-quality-management-training-program/, accessed on August 28, 2018.
Bottom-Up Fatigue Cracking
Among the bottom-up cracking tests in Table 5-5, the BBF, SCB-Jc and OT were selected at the NCHRP 9-57 workshop and recommended for further laboratory evaluation and field validation. The BBF and SCB-Jc also received a significant number of votes from the BMD survey as having potential to address bottom-up fatigue cracking; however, the I-FIT received the most votes from DOTs and contractors for having the greatest potential for evaluating bottom-up fatigue cracking.
4. Conduct ruggedness experiment to refine its critical aspects
(2) (2, 14) (2, 31) (2, 40) (54, 64)
5. Develop commercial equipment specification and pooled fund purchasing
(3, 4) (19, 20) (32, 33) (19, 20, 41) (55)
6. Conduct round-robin testing to establish precision and bias information
(60) (42)
7. Conduct robust validation of the test to set criteria for specifications
8. Conduct training and certification (8) (8, 60) (8, 67) (56)
9. Implement into engineering practice CA LA TX, NJ IL ME
BBF • [Step 4] BBF is one of the seven tests selected for ruggedness testing in NCHRP 09-57A. The
project is expected to start in June 2018 and will completely address Step 4 upon its completion. • Other knowledge gaps identified from literature for the BBF test include conducting round-robin
testing to establish precision and bias statements (Step 6), conducting robust validation of the test to set criteria for specifications (Step 7), conducting training (Step 8), and implementing into engineering practice (Step 9) for more than one state.
SCB-Jc
• [Step 2] The test was found sensitive to recycling agents, REOB, and bio-binders, but conflicting results were reported regarding its sensitivity to key mix design variables of binder grade, RAP and RAS contents, and mix aging.
• [Step 4] SCB-Jc is one of the seven tests selected for ruggedness testing in NCHRP 09-57A. The project is expected to start in June 2018 and will completely address Step 4 upon its completion.
NCHRP Project 20-07/Task 406
77
• Three additional gaps identified from literature for SCB-Jc test include conducting round-robin testing to establish precision and bias statements (Step 6), conducting robust validation of the test to set criteria for specifications (Step 7), and implementing into engineering practice (Step 9) for more than one state.
OT
• [Step 4] The main objective of the pending NCHRP 09-57A project is to determine the ruggedness of seven identified laboratory tests, which include the OT. The project is expected to start in June 2018 and will completely address Step 4 upon its completion.
• [Step 6] The Center for Advanced Infrastructure and Transportation at Rutgers is leading a round-robin experiment for OT that includes five laboratories. The study will completely address Step 6 upon its completion.
• Two gaps are identified from literature for OT test, which include conducting robust validation of the test to set criteria for establishing specification criteria (Step 7), and implementing into engineering practice (Step 9) for more states and/or climatic regions.
Cyclic Fatigue
• [Step 3] The literature shows that the SVECD analysis has evolved over time. • [Step 4] FHWA is currently funding a ruggedness experiment for the Cyclic Fatigue test. This
project is scheduled to conclude in 2020. • [Step 6] An interlaboratory study to establish precision and bias information for the Cyclic Fatigue
test will need to be conducted after the ruggedness study in Step 4 is complete. • [Step 7] A robust validation of the Cyclic Fatigue test and associated performance prediction
models has not been planned. • The results of Cyclic Fatigue tests are analyzed with project specific pavement structure inputs,
loading inputs, and environmental inputs through the FlexPAVE™ software to predict pavement performance. As such, the test does not provide results that may be used as mix design criteria for traditional low bid specifications. However, once the knowledge gaps are addressed for this and other complementary performance prediction tests, this approach may be ideal for value-engineering alternate-design projects.
Based on a review of existing literature, four tests have completed five of the critical steps: SCB-Jc, OT,
I-FIT, and Cyclic Fatigue. However, the SCB-Jc has been shown to be insensitive to some materials (i.e. RAP/RAS). In the opinion of the research team, the Cyclic Fatigue and the BBF are not practical for routine use in mix design at this time. Therefore, the OT and the I-FIT appear to be the leading candidates for use in BMD for fatigue cracking. These two tests were highlighted in the reflective and thermal cracking test sections. The largest knowledge gap for the OT and I-FIT for fatigue cracking is Step 7, robust validation of the tests for setting test criteria. Although experiments are underway to validate these tests for other modes of cracking, no experiment is planned for validating the tests for bottom-up fatigue cracking. In the opinion of the research team, there are several reasons why such an experiment is a lower priority than other research needs. First, the vast majority of asphalt mix being produced in recent years is for rehabilitation of existing pavements, with a very small percentage of mix produced for new construction or reconstruction where bottom-up fatigue cracking may be a primary design consideration. Second, bottom-up fatigue cracking could be eliminated as a mode of pavement distress/failure if a valid perpetual pavement design strategy is utilized in the structural design of new asphalt pavements. Therefore, in the opinion of the research team, a field validation study for bottom-up fatigue cracking is a somewhat lower priority than completing all of the steps for surface layer cracking distresses.
NCHRP Project 20-07/Task 406
78
Key References for Bottom-up Fatigue Cracking
1. Tayebali, A. A., J. A. Deacon, and C. L. Monismith et al. 1994. “Fatigue Response of Asphalt-Aggregate Mixes.” SHRP-A-404, National Research Council, Washington, D.C.
2. NCHRP 09-57A [RFP]. Field Validation of Laboratory Tests to Assess Cracking Resistance of Asphalt Mixtures. http://apps.trb.org/cmsfeed/TRBNetProjectDisplay.asp?ProjectID=447, accessed on January 19, 2018.
3. James Cox & Sons, Inc. Stand Alone Four Point Bending Beam. https://jamescoxandsons.com/stand-alone-four-point-bending-beam-machine/, accessed on January 19, 2018.
4. GCTS Testing Systems. Beam Fatigue Test. https://www.gcts.com/?s=prod_ver&p=products&ID=217, accessed on January 19, 2018.
5. Mogawer W., A. Austerman, J. Daniel, F. Zhou, and T. Bennert. 2011. “Evaluation of The Effects of Hot Mix Asphalt Density on Mixture Fatigue Performance, Rutting Performance and MEPDG Distress Predictions.” International Journal of Pavement Engineering, Vol. 12, Iss. 2, pp. 161–175.
6. Rodrigues L., M. Muniz, and K. Kaloush. 2018. “Effect of Temperature on Fatigue Tests Parameters for Conventional and Asphalt Rubber Mixes.” Road Materials and Pavement Design, Vol. 19, Issue 2, pp. 417–430.
7. Fakhri, M., K. Hassani, and A.R. Ghanizadeh. 2013. “Impact of Loading Frequency on the Fatigue Behavior of SBS Modified Asphalt Mixtures.” Procedia – Social and Behavioral Sciences, Vol. 104, pp. 69–78.
8. National Center for Asphalt Technology (NCAT) at Auburn University. Balanced Mix Design Training Course. http://ncat.us/education/training/industry/balanced-mix.html, accessed on January 19, 2018.
9. Pronk, A.C. 1997. “Comparison of 2 and 4 Point Fatigue Tests and Healing in 4 Point Dynamic Bending Test Based on the Dissipated Energy Concept.” Eighth International Conference on Asphalt Pavements, Seattle, WA, pp. 987–994.
10. Romero, P., K.D. Stuart, and W. Mogawer. 2005. “Fatigue Response of Asphalt Mixtures Tested by the Federal Highway Administration’s Accelerated Loading Facility.” Journal of the Association of Asphalt Paving Technologists, Vol. 69, pp. 212–235.
11. Willis, J.R., D. Timm, A. Taylor, N. Tran, and A. Kvasnak. 2010. “Correlating Laboratory Fatigue Endurance Limits to Field-Measured Strains.” Journal of the Association of Asphalt Paving Technologists, Vol. 80, pp. 135–160.
12. Wu, Z., L. Mohammad, L. Wang, and M. Mull. 2005. “Fracture Resistance Characterization of Superpave Mixtures Using the Semi-Circular Bending Test.” Journal of ASTM International, Vol. 2, No. 3, pp. 1–15.
13. Huang, B., X. Shu, and G. Zuo. 2013. "Using Notched Semi-Circular Bending Fatigue Test to Characterize Fracture Resistance of Asphalt Mixtures." Engineering Fracture Mechanics, Vol. 109, pp. 78–88.
14. Kim, M., L.N. Mohammad, and M.A. Elseifi. 2012. “Characterization of Fracture Properties of Asphalt Mixtures as Measured by Semicircular Bend Test and Indirect Tension Test.” Transportation Research Record, Journal of The Transportation Research Board, No. 2296, Washington, DC, pp. 115–124.
15. Elseifi, M.A., L.N. Mohammad, H. Ying, and S. Cooper III. 2012. “Modeling and Evaluation of the Cracking Resistance of Asphalt Mixtures Using the Semi-Circular Bending Test at Intermediate Temperatures.” Road Materials and Pavement Design, 13(sup1), pp. 124–139.
16. Cooper, S. 2018. “Development and Implementation of Louisiana’s Balanced Asphalt Mixture Design.” Transportation Research Board 97th Annual Meeting, Washington, DC.
17. Cooper, S.B., W. King, and S. Kabir. 2016. “Testing and Analysis of LWT and SCB Properties of Asphalt Concrete Mixtures.” Final Report 536. Louisiana Department of Transportation and Development; Louisiana Transportation Research Center.
18. Saadeh, S., H. Hakimelahi, and J. Harvey. 2014. “Correlation of Semi-circular Bending and Beam Fatigue Fracture Properties of Asphalt Concrete Using Non-Contact Camera and Crosshead Movement.” Second Transportation and Development Congress 2014, Planes, Trains, and Automobiles, ASCE.
19. InstroTek Inc. Auto_SCB. https://www.instrotek.com/products/auto_scb, accessed on January 19, 2018. 20. Humboldt. Semi-circular Bending (SCB) Head. https://www.humboldtmfg.com/datasheets/H-1351-
SCB_datasheet_0117.pdf, accessed on January 19, 2018. 21. German, F.P., and R.L. Lytton. 1979. “Methodology for Predicting the Reflection Cracking Life of Asphalt Concrete
Overlays.” Vol. 5. Report No. TTI-2-8-75-207. 22. Zhou, F., and T. Scullion. 2003. “Upgraded Overlay Tester and Its Application to Characterize Reflection Cracking
Resistance of Asphalt Mixtures.” No. FHWA/TX-04/0-4467-1. Texas Transportation Institute, Texas A&M University System.
23. Garcia, V.M., A. Miramontes, J. Garibay, I. Abdallah, G. Carrasco, R. Lee, and S. Nazarian. 2017. “Alternative Methodology for Assessing Cracking Resistance of Hot Mix Asphalt Mixtures with Overlay Tester.” Road Materials and Pavement Design, pp. 1–17.
24. Zhou, F., and T. Scullion. 2005. “Overlay Tester: A Rapid Performance Related Crack Resistance Test.” Vol. 7. Texas Transportation Institute, Texas A & M University System.
25. Zhou, F., S. Hu, and T. Scullion. 2006. “Integrated Asphalt (Overlay) Mix Design with Balancing Rutting and Cracking Requirements.” Report FHWA/TX-06/0-5123-1. FHWA, Texas A&M Transportation Institute, College Station.
26. Zhou, F., S. Hu, G. Das, and T. Scullion. 2011. “High RAP Mixes Design Methodology with Balanced Performance.” Texas Transportation Institute, FHWA/TX-11/0-6092-2.
27. Zhou, F., H. Li, S. Hu, J.W. Button, and J.A. Epps. 2012. “Characterization and Best Use of Recycled Asphalt Shingles in Hot-Mix Asphalt.” Texas Transportation Institute, Texas A&M University System.
28. Hu, S., F. Zhou, T. Scullion, and J. Leidy. 2012, “Calibrating and Validating Overlay Tester-based Fatigue Cracking Model with Data from National Center for Asphalt Technology.” Transportation Research Record: Journal of the Transportation Research Board, No. 2296, Washington, DC, pp. 57–68.
29. Zhou, F., S. Hu, T. Scullion, et al. 2007. “Development and Verification of the Overlay Tester Based Fatigue Cracking Prediction Approach.” Journal of the Association of Asphalt Paving Technologists, Vol. 76, pp. 627–662.
30. Ma, W., N.H. Tran, A. Taylor, J.R. Willis, and M. Robbins. 2015. “Comparison of Laboratory Cracking Test Results and Field Performance.” Journal of the Association of Asphalt Paving Technologists, No. 84.
31. Walubita, L.F., A.N. Faruk, G. Das, H.A. Tanvir, J. Zhang, and T. Scullion. 2012. “The Overlay Tester: A Sensitivity Study to Improve Repeatability and Minimize Variability in the Test Results.” Project Report: FHWA/TX-12/0-6607-1, Federal Highway Administration, Washington, DC.
32. Advanced Asphalt Technologies. Overlay Tester. http://advancedasphalt.com/overlay-tester/, accessed on January 19, 2018.
33. James Cox & Sons, Inc. Texas Overlay Tester. https://jamescoxandsons.com/texas-overlay-tester/, accessed on January 19, 2018.
34. Prowell, B.D., E.R. Brown, R.M. Anderson, S. Shen, and S.H. Carpenter. 2010. “Endurance Limit of Hot Mix Asphalt Mixtures to Prevent Bottom Up Fatigue Cracking.” Journal of the Association of Asphalt Pavement Technologists, Vol. 79, pp. 519–560.
35. Al-Qadi, I.L., H. Ozer, J. Lambros, A. El Khatib, P. Singhvi, T. Khan, J. Rivera-Perez, and B. Doll. 2015. “Testing Protocols to Ensure Performance of High Asphalt Binder Replacement Mixes Using RAP and RAS.” Illinois Center for Transportation Series No. 15-017, Illinois Center for Transportation/University of Illinois at Urbana-Champaign.
36. Edoardo, B., O. Hasan, L. Imad, O. Egemen, Z. Zehui, and W. Shenghua. 2018. “Effect of I-FIT Configuration on Test Results of Asphalt Mixtures.” Transportation Research Board 97th Annual Meeting, Washington, DC.
37. Ozer, H., I.L. Al-Qadi, E. Barber, E. Okte, Z. Zhu, and S. Wu. 2017. “Evaluation of I-FIT Results and Machine Variability using MnRoad Test Track Mixtures.” Illinois Center for Transportation/Illinois Department of Transportation.
38. Zhou, F., S. Im, S. Hu, D. Newcomb, and T. Scullion. 2017. “Selection and Preliminary Evaluation of Laboratory Cracking Tests for Routine Asphalt Mix Designs.” Road Materials and Pavement Design, 18(sup1), pp. 62–86.
39. Chen, X. and M. Solaimanian. 2018. “The Effect of Mix Parameters on the Semicircular Bend Fatigue Test.” Transportation Research Board 97th Annual Meeting, Washington, DC.
40. Rivera-Perez, J., H. Ozer, and I.L. Al-Qadi. 2018. “Impact of Specimen Configuration and Characteristics on Illinois Flexibility Index.” Paper No. 18-03186. Transportation Research Board 97th Annual Meeting, Washington, DC.
41. Testquip LLC. Illinois – Flexibility Index Tester (I-FIT) by Testquip. http://www.testquip.com/docs/SCB_IFIT_Brochure.pdf, accessed on January 19, 2018.
42. Pfeifer, B. 2018. “Illinois Department of Transportation’s Practices for Balanced Mix Design.” TRB Workshop 124, Balanced Asphalt Mixture Design: Implementation Efforts and Success Stories.
43. Witczak, M.W., K. Kaloush, T. Pellinen, M. El-Basyouny, and H. Von Quintus. 2002. NCHRP Report 465: Simple Performance Test for Superpave Mix Design. National Cooperative Highway Research Program, National Research Council, Washington, DC.
44. Bonaquist, R. 2008. NCHRP Report 614: Refining the Simple Performance Tester for Use in Routine Practice. National Cooperative Highway Research Program, National Research Council, Washington, DC.
45. Withee, J., N. Gibson, and T. Harman. 2013. “TechBrief: Asphalt Mixture Performance Tester.” Publication HIF-13-005, Federal Highway Administration, Washington, DC.
46. Kim R., B.S. Underwood, and M. Guddati. 2009. “Development of a Multiaxial Viscoelastoplastic Continuum Damage Model for Asphalt Mixtures.” Report No. FHWA-HRT-08-073.
47. Daniel, J.S., and Y.R. Kim. 2002. “Development of a Simplified Fatigue Test and Analysis Procedure Using a Viscoelastic, Continuum Damage Model.” Journal of the Association of Asphalt Paving Technologists.
48. Hou, T., B.S. Underwood, and Y.R. Kim. 2010. “Fatigue Performance Prediction of North Carolina Mixtures Using the Simplified Viscoelastic Continuum Damage Model.” Journal of the Association of Asphalt Paving Technologists, Vol. 79, pp. 35–80.
49. Underwood, B.S., Y.R. Kim, and M.N. Guddati. 2010. “Improved Calculation Method of Damage Parameter in Viscoelastic Continuum Damage Model.” International Journal of Pavement Engineering, Vol. 11, No. 6, pp. 459–476.
50. Norouzi, A., M. Sabouri, and Y.R. Kim. 2014. “Evaluation of the Fatigue Performance of Asphalt Mixtures with High RAP Content.” Proceedings of the 12th International Conference on Asphalt Pavements, Raleigh, NC, pp. 1069–1077.
51. Underwood, B.S., Y.R. Kim, and M. Guddati. 2006. “Characterization and Performance Prediction of ALF Mixtures Using a Viscoelastoplastic Continuum Damage Model.” Journal of the Association of Asphalt Paving Technologists.
52. Park, H.J. and Y.R. Kim. 2014. “Primary Causes of Cracking of Asphalt Pavement in North Carolina: Field Study.” International Journal of Pavement Engineering, Vol. 16(8), pp. 684–698.
53. Li, X. and G. Nelson. 2011. “Comparison of Asphalt Mixture Performance Tester Fatigue Characteristics with Full Scale Pavement Cracking for Recycled and Warm Mix Asphalts.” Transportation Research Record: Journal of the Transportation Research Board, No. 2576, Washington, DC.
54. Bonaquist, R. 2008. NCHRP Report 629: Ruggedness Testing of the Dynamic Modulus and Flow Number Tests with the Simple Performance Tester. National Cooperative Highway Research Program, National Research Council, Washington, DC.
56. Kim, R. 2012. “S-VECD Fatigue Testing on AMPT.” Presentation of the National Pooled Fund Workshop on Asphalt Mixture Performance Tester, Atlanta, GA.
57. Roque, R., B. Birgisson, C. Drakos, and B. Dietrich. 2004. “Development and Field Evaluation of Energy-Based Criteria for Top-Down Cracking Performance of Hot Mix Asphalt.” Journal of the Association of Asphalt Paving Technologists, Vol. 73, pp. 229–260.
58. Roque, R., B. Birgisson, Z. Zhang, B. Sangpetngam, and T. Grant. 2002. “Implementation of SHRP Indirect Tension Tester to Mitigate Cracking in Asphalt Pavements and Overlays.” Report No. UF# 4910450457912, Florida Department of Transportation, Tallahassee, FL.
59. Roque, R., J. Zou, Y. R. Kim, C. Baek, S. Thirunavukkarasu, B.S. Underwood, and M.N. Guddati. 2010. “Top-Down Cracking of Hot-Mix Asphalt Layers: Models for Initiation and Propagation.” NCHRP 1-42A Report 162, Transportation Research Board, National Research Council, Washington, DC.
60. Bennert, T., E. Hass, and E. Wass. 2017. “Round Robin Testing Program for the Overlay Tester.” NJDOT B-10. Center for Advanced Infrastructure and Transportation (CAIT) Rutgers, the State University of New Jersey.
61. Mensching, D., R. Rahbar-Rastegar, B. Underwood, and J. Daniel. 2016. “Identifying Indicators for Fatigue Cracking in Hot-Mix Asphalt Pavements Using Viscoelastic Continuum Damage Principles.” Transportation Research Record: Journal of the Transportation Research Board, No. 2576, Washington, DC.
62. Gibson N., and X. Li. 2015. “Characterizing Cracking of Asphalt Mixtures with Fiber Reinforcement: Use of Cyclic Fatigue and Direct Tension Strength Tests.” Transportation Research Record: Journal of the Transportation Research Board, No. 2507, Washington, DC.
63. Wang Y., B. Keshavarzi, and R. Kim. 2018. “Fatigue Performance Prediction of Asphalt Pavements with FlexPAVETM, the S-VECD Model, and DR Failure Criterion.” Transportation Research Record, Journal of the Transportation Research Board, No. 1-11, DOI: 10.1177/0361198118756873.
64. Kim, R. 2017 – 2020. “Ruggedness and Interlaboratory Studies for Asphalt Mixture Performance Tester (AMPT) Cyclic Fatigue Test.” Federal Highway Administration (FHWA) DTFH6117R00048. North Carolina State University – NCAT.
65. Caoa W., A. Norouzib, and R. Kim. 2016. “Application of Viscoelastic Continuum Damage Approach to Predict Fatigue Performance of Binzhou Perpetual Pavements.” Journal of Traffic and Transportation Engineering, Vol. 3, No. 2, pp. 104–115.
66. Norouzi A., R. Kim, S. Kim, and J. Yang. 2017. “Effect of Reclaimed Asphalt Pavement Content and Binder Grade on Fatigue-Resisting Performance of Asphalt Mixtures in Georgia.” Journal of Materials in Civil Engineering, Vol. 29, Issue 9, ISSN 0899-1561. 49.
67. Illinois Department of Transportation Quality Management Training Program, CET 029 Hot Mix Level 1, https://www.lakelandcollege.edu/idot-quality-management-training-program/, accessed on August 28, 2018.
Top-Down Cracking
Among the top-down cracking tests in Table 5-6, ER and SCB-Jc were selected at the NCHRP 9-57 workshop and recommended for further laboratory evaluation and field validation. On the other hand, the I-FIT and Cyclic Fatigue test (a.k.a. S-VECD) received significant numbers of votes from the BMD survey as potential tests to address top-down cracking. It is interesting to note that in the BMD survey the Cyclic Fatigue test received a much stronger response for top-down cracking than for bottom-up fatigue cracking.
Table 5-6. Top-down cracking tests and critical steps to implementation.
Steps IDT Energy Ratio (ER) SCB-Jc I-FIT
Cyclic Fatigue
(S-VECD)
Indirect Tensile Asphalt
Cracking Test
(IDEAL-CT)
Selected at the NCHRP 9-57 Workshop Yes Yes No No
Not included in the
workshop
BMD Survey Responses 12 2 34 23 Not included in the survey
1. Develop draft test method and prototype equipment (1, 2) (10, 11, 12) (20, 21, 22) (28, 29, 30,
31) (41, 42)
2. Evaluate sensitivity to materials and relationship to other lab properties
4. Conduct ruggedness experiment to refine its critical aspects
(7) (7) (7, 25) (36) (41)
5. Develop commercial equipment specification and pooled fund purchasing
(17, 18) (17, 18, 26) (37) (42, 43)
6. Conduct round-robin testing to establish precision and bias information
(27)
7. Conduct robust validation of the test to set criteria for specifications (19) (19) (19) (19) (19)
8. Conduct training and certification (9) (9, 39) (9, 40, 44) (38)
9. Implement into engineering practice LA IL
NCHRP Project 20-07/Task 406
82
Energy Ratio
• [Step 1] A standard procedure has not been established for the Energy Ratio method. • [Step 3] The ER has preliminary criteria based on an extensive field study in Florida. However,
more recent results at NCAT seem to contradict the validity of the Florida criteria. • [Step 4] The ER is one of the seven tests selected for ruggedness testing in NCHRP 09-57A. The
project is expected to start in June 2018 and will completely address Step 4 upon its completion. • [Step 5] The Energy Ratio method consists of three tests: Creep Compliance, Resilient Modulus,
and Tensile Strength. The equipment needed to conduct the test includes a servo-hydraulic testing frame with an environmental chamber capable of maintaining 10°C.
• [Step 7] ER is one of the tests being evaluated for top-down cracking as part of the ongoing NCAT cracking group study. This study will partially address Step 7 upon its completion. Further validation may be needed in other climates.
• Due to the complexity of the ER method, the cost of the equipment, some contradictory field performance results, and other significant gaps, the research team does not consider it worthwhile to continue pursuing this method for the purposes of BMD.
SCB-Jc
• [Step 2] The SCB-Jc has been shown to be insensitive to some materials (i.e. RAP/RAS). Material sources have been primarily limited to few locations in the U.S. (i.e. Louisiana).
• [Step 3] In the Louisiana study to develop the relationship to performance, the mode of cracking for the field sections was not clearly identified as top-down cracking. Thus, this step is not considered complete.
• [Step 4] The SCB-Jc is one of the seven tests selected for ruggedness testing in NCHRP 09-57A. The project is expected to start in June 2018 and will completely address Step 4 upon its completion.
• [Step 6] Precision and bias information has not been established for the SCB-Jc test. • [Step 7] The SCB-Jc is one of the tests being evaluated for top-down cracking as part of the ongoing
NCAT cracking group study. This study will partially address Step 7 upon its completion. Further validation may be needed in other climates.
I-FIT
• [Step 2] The test was found sensitive to binder grade, RAP and RAS contents, and mix aging. Conflicting results have been reported regarding its sensitivity to binder content. Also, the effect of specimen air voids has been shown to be counterintuitive when specimen air voids are outside of the range of 7.0 ± 1.0 percent; for any given mix, as air voids decrease, the FI decreases.
• [Step 3] The Illinois DOT has established preliminary criteria for FI based on field performance and the 2012 FHWA ALF experiment; however, the mode of cracking for many of the field projects was not well documented as top-down cracking.
• [Step 4] The I-FIT is one of the seven tests selected for ruggedness testing in NCHRP 09-57A. The project is expected to start in June 2018 and will completely address Step 4 upon its completion.
• [Step 6] The Illinois DOT is leading a round-robin experiment that includes 30 I-FIT machines from three state agency labs, 15 private labs, and the Illinois Center for Transportation. The study will completely address Step 6 upon its completion.
• [Step 7] I-FIT is one of the tests being evaluated for top-down cracking as part of the ongoing NCAT cracking group study. This study will partially address Step 7 upon its completion. Further validation may be needed in other climates.
NCHRP Project 20-07/Task 406
83
Cyclic Fatigue
• [Step 3] Although researchers from North Carolina State University have published several papers relating predicted performance from viscoelastic continuum damage modelling to observed bottom-up fatigue cracking, none of the published work has been shown to relate to top-down cracking.
• [Step 4] FHWA is currently funding a ruggedness experiment for the Cyclic Fatigue test. • [Step 7] The Cyclic Fatigue test was recently added to the NCAT cracking group experiment for
validating top-down cracking. This research may partially address Step 7 upon its completion. Further validation may be needed in other climates.
• The Cyclic Fatigue test results are analyzed with project specific pavement structure inputs, loading inputs, and environmental inputs through the FLEXPAVE™ software to predict pavement performance. As such, the test does not provide results that may be used as mix design criteria that are used in traditional low bid specifications.
• The complexity of the Cyclic Fatigue test and the associated equipment cost will likely make it unsuitable for BMD purposes.
IDEAL-CT
• [Steps 1 and 5] A draft ASTM test procedure for the IDEAL-CT has been developed and is being balloted under ASTM Committee D04 on Road and Paving Materials.
• [Step 6] Precision and bias information has not been established for IDEAL-CT. • [Step 7] The IDEAL-CT is one of the tests being evaluated for top-down cracking as part of the
ongoing NCAT cracking group study. This study will partially address Step 7 upon its completion. Further validation may be needed in other climates.
• [Step 8] No training and verification efforts have been identified for IDEAL-CT. • [Step 9] No states have been identified as having implemented the IDEAL-CT into engineering
practice. However, Virginia DOT is currently evaluating the IDEAL-CT as a potential cracking test for mix design and production testing.
Based on the currently available information, the I-FIT appears to have the most potential to be used in
BMD since all nine steps are completed or are in the process of being completed. However, another relatively new test that should also be considered for further research is the IDEAL-CT developed by Zhou et al (2017) at the Texas A&M Transportation Institute. Initial studies indicate that IDEAL-CT results correlate very well with results from the OT and I-FIT. The primary advantage of the ICT is that no specimen cutting is needed, making it a much faster test than all of the other cracking tests. It also has similar test variability as the I-FIT which is considerably better than that of the SCB-Jc and OT. The IDEAL-CT was added to the NCAT cracking group experiment for validating top-down cracking. A draft ASTM test procedure has been developed and being balloted under ASTM Committee D04. Gaps that should be addressed for the IDEAL-CT include establishing precision and bias information (Step 6), training and certification (Step 8), and pilot studies for implementation (Step 9).
Key References for Top-Down Fatigue Cracking
1. Roque, R., B. Birgisson, C. Drakos, and B. Dietrich. 2004. “Development and Field Evaluation of Energy-Based Criteria for Top-Down Cracking Performance of Hot Mix Asphalt.” Journal of the Association of Asphalt Paving Technologists, Vol. 73, pp. 229–260.
2. Roque, R., B. Birgisson, Z. Zhang, B. Sangpetngam, and T. Grant. 2002. “Implementation of SHRP Indirect Tension Tester to Mitigate Cracking in Asphalt Pavements and Overlays.” Report No. UF# 4910450457912, Florida Department of Transportation, Tallahassee, FL.
NCHRP Project 20-07/Task 406
84
3. Roque, R., J. Zou, Y. R. Kim, C. Baek, S. Thirunavukkarasu, B.S. Underwood, and M.N. Guddati. 2010. “Top-Down Cracking of Hot-Mix Asphalt Layers: Models for Initiation and Propagation.” NCHRP 1-42A Report 162, Transportation Research Board, National Research Council, Washington, DC.
4. Timm, D.H., G.A. Scholar, J. Kim, and J.R. Willis. 2009. “Forensic Investigation and Validation of Energy Ratio Concept.” Transportation Research Record: Journal of the Transportation Research Board, No. 2127, Washington, DC, pp.43–51.
5. Greene J., S. Chun, T. Nash, and B. Choubane. 2014. “Evaluation and Implementation of PG 76-22 Asphalt Rubber Binder in Florida.” FDOT State Materials Office. Research Report Number FL/DOT/SMO/14-569.
6. Greene J., and B. Choubane. 2016. “Thickness and Binder Type Evaluation of a 4.75mm Asphalt Mixture using Accelerated Pavement Testing.” FDOT State Materials Office. Research Report Number FL/DOT/SMO/16-578.
7. NCHRP 09-57A [RFP]. Field Validation of Laboratory Tests to Assess Cracking Resistance of Asphalt Mixtures. http://apps.trb.org/cmsfeed/TRBNetProjectDisplay.asp?ProjectID=447, accessed on January 19, 2018.
8. Christensen, D.W. and R.F. Bonaquist. 2004. NCHRP Report 530: Evaluation of Indirect Tensile Test (IDT) Procedures for Low-Temperature Performance of Hot Mix Asphalt. Transportation Research Board of the National Academies, Washington, DC.
9. National Center for Asphalt Technology (NCAT) at Auburn University. Balanced Mix Design Training Course. http://ncat.us/education/training/industry/balanced-mix.html, accessed on January 19, 2018.
10. Wu, Z., L. Mohammad, L. Wang, and M. Mull. 2005. “Fracture Resistance Characterization of Superpave Mixtures Using the Semi-Circular Bending Test.” Journal of ASTM International, Vol. 2, No. 3, pp. 1–15.
11. Huang, B., X. Shu, and G. Zuo. 2013. "Using Notched Semi-Circular Bending Fatigue Test to Characterize Fracture Resistance of Asphalt Mixtures." Engineering Fracture Mechanics, Vol. 109, pp. 78–88.
12. Kim, M., L.N. Mohammad, and M.A. Elseifi. 2012. “Characterization of Fracture Properties of Asphalt Mixtures as Measured by Semicircular Bend Test and Indirect Tension Test.” Transportation Research Record, Journal of The Transportation Research Board, No. 2296, Washington, DC, pp. 115–124.
13. Elseifi, M.A., L.N. Mohammad, H. Ying, and S. Cooper III. 2012. “Modeling and Evaluation of the Cracking Resistance of Asphalt Mixtures Using the Semi-Circular Bending Test at Intermediate Temperatures.” Road Materials and Pavement Design, 13(sup1), pp. 124–139.
14. Cooper, S. 2018. “Development and Implementation of Louisiana’s Balanced Asphalt Mixture Design.” Transportation Research Board 97th Annual Meeting, Washington, DC.
15. Cooper, S.B., W. King, and S. Kabir. 2016. “Testing and Analysis of LWT and SCB Properties of Asphalt Concrete Mixtures.” Final Report 536. Louisiana Department of Transportation and Development; Louisiana Transportation Research Center.
16. Saadeh, S., H. Hakimelahi, and J. Harvey. 2014. “Correlation of Semi-circular Bending and Beam Fatigue Fracture Properties of Asphalt Concrete Using Non-Contact Camera and Crosshead Movement.” Second Transportation and Development Congress 2014, Planes, Trains, and Automobiles, ASCE.
17. InstroTek Inc. Auto_SCB. https://www.instrotek.com/products/auto_scb, accessed on January 19, 2018. 18. Humboldt. Semi-circular Bending (SCB) Head. https://www.humboldtmfg.com/datasheets/H-1351-
SCB_datasheet_0117.pdf, accessed on January 19, 2018. 19. Van Deusen, D. 2017. “NCAT/MnROAD Cracking Group Update.” Test Track Sponsor Meeting, St. Paul, MN. 20. Al-Qadi, I.L., H. Ozer, J. Lambros, A. El Khatib, P. Singhvi, T. Khan, J. Rivera-Perez, and B. Doll. 2015. “Testing
Protocols to Ensure Performance of High Asphalt Binder Replacement Mixes Using RAP and RAS.” Illinois Center for Transportation Series No. 15-017, Illinois Center for Transportation/University of Illinois at Urbana-Champaign.
21. Edoardo, B., O. Hasan, L. Imad, O. Egemen, Z. Zehui, and W. Shenghua. 2018. “Effect of I-FIT Configuration on Test Results of Asphalt Mixtures.” Transportation Research Board 97th Annual Meeting, Washington, DC.
22. Ozer, H., I.L. Al-Qadi, E. Barber, E. Okte, Z. Zhu, and S. Wu. 2017. “Evaluation of I-FIT Results and Machine Variability using MnRoad Test Track Mixtures.” Illinois Center for Transportation/Illinois Department of Transportation.
23. Zhou, F., S. Im, S. Hu, D. Newcomb, and T. Scullion. 2017. “Selection and Preliminary Evaluation of Laboratory Cracking Tests for Routine Asphalt Mix Designs.” Road Materials and Pavement Design, 18(sup1), pp. 62–86.
24. Chen, X. and M. Solaimanian. 2018. “The Effect of Mix Parameters on the Semicircular Bend Fatigue Test.” Transportation Research Board 97th Annual Meeting, Washington, DC.
25. Rivera-Perez, J., H. Ozer, and I.L. Al-Qadi. 2018. “Impact of Specimen Configuration and Characteristics on Illinois Flexibility Index.” Paper No. 18-03186. Transportation Research Board 97th Annual Meeting, Washington, DC.
26. Testquip LLC. Illinois – Flexibility Index Tester (I-FIT) by Testquip. http://www.testquip.com/docs/SCB_IFIT_Brochure.pdf, accessed on January 19, 2018.
27. Pfeifer, B. 2018. “Illinois Department of Transportation’s Practices for Balanced Mix Design.” TRB Workshop 124, Balanced Asphalt Mixture Design: Implementation Efforts and Success Stories.
28. Witczak, M.W., K. Kaloush, T. Pellinen, M. El-Basyouny, and H. Von Quintus. 2002. NCHRP Report 465: Simple Performance Test for Superpave Mix Design. National Cooperative Highway Research Program, National Research Council, Washington, DC.
29. Bonaquist, R. 2008. NCHRP Report 614: Refining the Simple Performance Tester for Use in Routine Practice. National Cooperative Highway Research Program, National Research Council, Washington, DC.
30. Withee, J., N. Gibson, and T. Harman. 2013. “TechBrief: Asphalt Mixture Performance Tester.” Publication HIF-13-005, Federal Highway Administration, Washington, DC.
31. Kim R., B.S. Underwood, and M. Guddati. 2009. “Development of a Multiaxial Viscoelastoplastic Continuum Damage Model for Asphalt Mixtures.” Report No. FHWA-HRT-08-073.
32. Daniel, J.S., and Y.R. Kim,. 2002. “Development of a Simplified Fatigue Test and Analysis Procedure Using a Viscoelastic, Continuum Damage Model.” Journal of the Association of Asphalt Paving Technologists.
33. Hou, T., B.S. Underwood, and Y.R. Kim. 2010. “Fatigue Performance Prediction of North Carolina Mixtures Using the Simplified Viscoelastic Continuum Damage Model.” Journal of the Association of Asphalt Paving Technologists, Vol. 79, pp. 35–80.
34. Underwood, B.S., Y.R. Kim, and M.N. Guddati. 2010. “Improved Calculation Method of Damage Parameter in Viscoelastic Continuum Damage Model.” International Journal of Pavement Engineering, Vol. 11, No. 6, pp. 459–476.
35. Norouzi, A., M. Sabouri, and Y.R. Kim. 2014. “Evaluation of the Fatigue Performance of Asphalt Mixtures with High RAP Content.” Proceedings of the 12th International Conference on Asphalt Pavements, Raleigh, NC, pp. 1069–1077.
36. Bonaquist, R. 2008. NCHRP Report 629: Ruggedness Testing of the Dynamic Modulus and Flow Number Tests with the Simple Performance Tester. National Cooperative Highway Research Program, National Research Council, Washington, DC.
38. Kim, R. 2012. “S-VECD Fatigue Testing on AMPT.” Presentation of the National Pooled Fund Workshop on Asphalt Mixture Performance Tester, Atlanta, GA.
39. Cooper, S. 2018. Development and Implementation of Louisiana’s Balanced Asphalt Mixture Design. Transportation Research Board Annual Meeting, Washington, D.C.
40. Semi-Circular Bend Test: an Industry Initiative Towards Performance Based Testing, Plant Certification Program, Update/Refresher Course, Northeast Center of Excellence for Pavement Technology, January 2018 https://www.superpave.psu.edu/Training/Bituminous/NECEPT%20Plant%20UR%20Materials.aspx
41. Zhou, F., S. Im, L. Sun, and T. Scullion. 2017. “Development of an IDEAL cracking test for asphalt mix design and QC/QA.” Road Materials and Pavement Design, 18(sup4), 405-427.
42. Zhou, F. personal communication on August 22, 2018. 43. Testquip LLC. I-FIT PLUS Fixture. https://www.testquip.com/docs/IFIT_Plus.pdf, accessed on August 8, 2018. 49. 44. Illinois Department of Transportation Quality Management Training Program, CET 029 Hot Mix Level 1,
https://www.lakelandcollege.edu/idot-quality-management-training-program/, accessed on August 28, 2018.
Rutting
Table 5-7 summarizes the current status of rutting tests for implementation into routine practice. The order of the tests in this table is based on the responses from the survey conducted as Task 1 of this project. From the survey responses, the HWTT and the APA test received the most responses and have already been implemented into practice by 12 states.
4. Conduct ruggedness experiment to refine its critical aspects
(6) (16) (23)
5. Develop commercial equipment specification and pooled fund purchasing
(7) (17) (24) (36)
6. Conduct round-robin testing to establish precision and bias information
(8) (25)
7. Conduct robust validation of the test to set criteria for specifications
(9,10) (18) (21, 26, 27)
8. Conduct training and certification (11, 37) (10) (28) (CA only)
9. Implement into engineering practice
CA, CO, IA, IL, LA, MA, ME, MT, OK, TX,
UT, WA
AL, AK, AR, GA, ID, NC, NJ, OH, OR, SC, SD, VA
HI, NV
HWTT
• All of the critical steps have been completed for the Hamburg test as reflected by the number of highway agencies currently using it as part of their specifications.
• Analysis of the Hamburg results should be further refined to distinguish rutting from moisture damage. A small study should be commissioned to explore the advantages and disadvantages of different analysis methods, propose revisions to AASHTO T 324, and prepare training materials to facilitate implementation.
APA
• Only Step 6, conducting a round robin study, is a gap for this test. Twelve states currently use this test in their specifications, but criteria vary by agency.
FN
• Based on the literature review, steps 1-8 have been completed. However, no DOT has implemented the Flow Number test into engineering practice.
NCHRP Project 20-07/Task 406
87
SST and Hveem Tests
• Only a few of the critical steps have been completed for these two tests. To be incorporated in BMD, several steps would have to be completed. It seems to be more practical to focus on refining the other rutting tests that are already being used, so it is recommended not to spend any additional effort on these two tests.
Key References for Rutting Tests
1. Aschenbrener, T. 1995. “Evaluation of Hamburg Wheel-Tracking Device to Predict Moisture Damage in Hot Mix Asphalt.” Transportation Research Record: Journal of the Transportation Research Board, No. 1392, Washington, DC, pp. 193–201.
2. Aschenbrener, T., and G. Currier. 1993. “Influence of Testing Variables on the Results from the Hamburg Wheel-Tracking Device.” CDOT-DTD-R-93-22. Colorado Department of Transportation, Denver.
3. Swiertz, D., C. Ling, P. Teymourpour, and H. Bahia. 2017. “Use of Hamburg Wheel-Tracking Test to Characterize Asphalt Mixtures in Cool Weather Regions.” Transportation Research Record: Journal of the Transportation Research Board, No. 2633, Washington, DC, pp. 9–15.
4. Williams, R.C., and B.D. Prowell. 1999. “Comparison of Laboratory Wheel-Tracking Test Results with WesTrack Performance.” Transportation Research Record: Journal of the Transportation Research Board, No. 1681, Washington, DC, pp. 121–128.
5. Brown, E.R., L.A. Cooley Jr, D. Hanson, C. Lynn, B. Powell, B.D. Prowell, and D. Watson. 2002. “NCAT Test Track Design, Construction, and Performance.” NCAT Report 02-12, National Center for Asphalt Technology at Auburn University.
6. Mohammad, L, M. Elseifi, W. Cao, A. Raghavendra, and M. Ye. 2017. “Evaluation of Various Hamburg Wheel-Tracking Devices and AASTHO T 324 Specification for Rutting Testing of Asphalt Mixtures.” Road Materials and Pavement Design, Vol. 18, Iss. Sup 4, pp. 128–143.
7. James Cox & Sons, Inc. Hamburg Wheel Tracker. https://jamescoxandsons.com/hamburg-wheel-tracker/ 8. Azari, H. 2014. “Precision Estimates of AASHTO T 324 Hamburg Wheel-Track Testing of Compacted Hot Mix
Asphalt (HMA).” Research Results Digest 390. National Cooperative Highway Research Program. 9. Zhou, F., T. Scullion, L. Walubita, and B. Wilson. 2014. “Implementation of a Performance-Based Mix Design System
in Texas.” Circular Number E-C189, Transportation Research Board of the National Academies, Washington, DC. 10. Cooper, S., L. Mohammad, S. Kabir, and W. King. 2014. “Balanced Asphalt Mixture Design Through Specification
Modification: Louisiana’s Experience.” Circular Number E-C189, Transportation Research Board of the National Academies, Washington, DC.
11. National Center for Asphalt Technology at Auburn University. Balanced Mix Design Training Course. http://ncat.us/education/training/industry/balanced-mix.html, accessed on January 19, 2018.
12. Lai, J.S. 1986. “Development of a Simplified Test Method to Predict Rutting Characteristics of Asphalt Mixes.” Final Report, Research Project No. 8503, Georgia DOT.
13. Kandhal, P.S., and R.B. Mallick, 1999. “Evaluation of Pavement Analyzer for HMA Mix Design.” NCAT Report 99-4, National Center for Asphalt Technology at Auburn University.
14. Kandhal, P.S., and L.A. Cooley, Jr. 2003. NCHRP Report 508: Accelerated Laboratory Rutting Tests: Evaluation of the Asphalt Pavement Analyzer. National Cooperative Highway Research Program, National Research Council, Washington, DC.
15. Buchanan, S., T. White and B. J. Smith. 2004. “Use of Asphalt Pavement Analyzer to Study In-Service Asphalt Mixture Performance.” FHWA/MS-DOT-RD-04-155, Mississippi State University.
16. West, R.C. 1999. “A Ruggedness Study of the Asphalt Pavement Analyzer Rutting Test.” Memorandum to the Asphalt Pavement Analyzer User Group and New APA Owners.
17. Pavement Technology Inc. Asphalt Pavement Analyzer: User’s Guide. http://www.pavementtechnology.com/ 18. Bennert, T., A. Maher, and I. Marukic. 2003. “Characterization of NH HMA-Part I.” Final Report Part I. FHWA-NJ-
2002-027. 19. Witczak, M.W. 2007. NCHRP Report 580: Specification Criteria for Simple Performance Tests for Rutting. National
Cooperative Highway Research Program, National Research Council, Washington, DC.
20. Rodezno, M.C., K.E. Kaloush, and M. Corrigan. 2010. “Development and Validation of a Rutting Model for Asphalt Mixtures Based on the Flow Number Test.” Transportation Research Record: Journal of the Transportation Research Board, No. 2181, pp.79–87.
21. Bonaquist, R. 2012. “Evaluation of Flow Number as a Discriminating HMA Mixture Property.” Report WHRP 12-01, Wisconsin Highway Research Program.
22. Willis, J.R., D.H. Timm, R.C. West, R. Powell, M.A. Robbins, A.J. Taylor, A.D.F. Smit, N.H. Tran, M.A. Heitzman, and A. Bianchini. 2009. “Phase III NCAT Test Track Findings.” NCAT Report 09-08, National Center for Asphalt Technology at Auburn University.
23. Bonaquist, R. 2008. NCHRP Report 629: Ruggedness Testing of the Dynamic Modulus and Flow Number Tests with the Simple Performance Tester. National Cooperative Highway Research Program, National Research Council, Washington, DC.
24. Withee, J., N. Gibson, and T. Harman. 2013. “TechBrief: Asphalt Mixture Performance Tester.” Publication HIF-13-005, Federal Highway Administration, Washington, DC.
25. Bonaquist, R., 2011. NCHRP Report 702: Precision of the Dynamic Modulus and Flow Number Tests Conducted with the Asphalt Mixture Performance Tester. National Cooperative Highway Research Program, National Research Council, Washington, DC.
26. Advanced Asphalt Technologies, LLC. 2011. NCHRP Report 673: A Manual for Design of Hot Mix Asphalt with Commentary. Transportation Research Board, Washington, DC.
27. Bonaquist, R. 2011. NCHRP Report 691: Mix Design Practices for Warm Mix Asphalt. National Cooperative Highway Research Program, National Research Council, Washington, DC.
28. National Center for Asphalt Technology at Auburn University. AMPT Training Workshops. 29. Chowdhury, A., and J. Button. 2002. “Evaluation of Superpave Shear Test Protocols.” FHWA/TX-02/1819-1, Texas
Transportation Institute, Texas A&M University System. 30. Sousa, J.B., M. Solaimanian, and S.L. Weissman. 1994. “Development and Use of the Repeated Shear Test (Constant
Height): An Optional Superpave Mix Design Tool.” Strategic Highway Research Program, National Research Council, Washington, DC.
31. Anderson, R.M., J.R. Bukowski, and P.A. Turner. 1999. “Using Superpave Performance Tests to Evaluate Asphalt Mixture.” Transportation Research Record: Journal of the Transportation Research Board, No. 1681, Washington, DC.
32. Tayebali, A.A., N.P. Khosla, G.A. Malpass, and H.F. Waller. 1999. “Evaluation of Superpave Repeated Shear at Constant Height Test to Predict Rutting Potential of Mixes: Performance of Three Pavement Sections in North Carolina.” Transportation Research Record: Journal of the Transportation Research Board, No. 1681, Washington, DC.
33. Monismith, C.L., J.A. Epps, and F.N. Finn. 1985. “Improved Asphalt Mix Design.” Proc., Association of Asphalt Paving Technologists, Vol. 54.
34. Finn, F. N., C. L. Monismith, and N. J. Markevich. 1983. “Pavement Performance and Asphalt Concrete Mix Design.” Proc., Association of Asphalt Paving Technologists, Vol. 52.
35. Sebaaly, P.A., J.T. Hand, D. Hanna, and F. Mehanna. 2003. “Performance of Superpave and Hveem Sections in Nevada-Volume III.” Research Report No.1393-5, University of Nevada, Reno.
36. James Cox & Sons, Inc. Kneading Compactor. https://jamescoxandsons.com/kneading-compactor/ 37. Illinois Department of Transportation Quality Management Training Program, CET 029 Hot Mix Level 1,
https://www.lakelandcollege.edu/idot-quality-management-training-program/, accessed on August 28, 2018.
Moisture Damage
Table 5-8 summarizes the current status of moisture susceptibility tests based on the nine critical steps to implementation. The order of the tests on this table is based on the responses from the BMD survey to identify the tests that have the most potential to address moisture damage. The HWTT and TSR test received the most responses. The MIST test received a few responses, but this test is considered a conditioning method rather than a performance test.
4. Conduct ruggedness experiment to refine its critical aspects (7) (16)
5. Develop commercial equipment specification and pooled fund purchasing (8) (17)
6. Conduct round-robin testing to establish precision and bias information (9) (18)
7. Conduct robust validation of the test to set criteria for specifications (10) (10,16,18,19)
8. Conduct training and certification (11, 20) Part of Superpave mix design
9. Implement into engineering practice CA, CO, IA, IL,
LA, MA, ME, MT, OK, TX, UT, WA
36 states identified in the
BMD survey
HWTT
• [Step 7] Based on the literature review, no research was found to document the validity of the Hamburg test as a reliable predictor of moisture damage susceptibility for a wide range of asphalt mixtures. Among the research community that use this test and the DOTs that currently specify it for mix design and/or quality assurance testing, criteria vary considerably with regard to analysis of stripping. Some DOTs only have a rutting criteria for the HWTT. Furthermore, several studies have indicated that the HWTT falsely identified some mixtures as being moisture damage sensitive even though no evidence of stripping was found in the field.
• [Step 8] It is likely that training on the Hamburg test already exists in states that require it for mix design approval and/or quality assurance testing. As other states implement the Hamburg test into their specifications, they will need to add training for it into their training programs.
TSR
• The literature review indicates that all the steps have been completed. However, only a few have published information that validate the TSR criteria that they use. Some research has indicated that the TSR of some mixtures did not satisfactory match the observed performance of the mixtures.
Although the TSR method and the Hamburg test are well established for evaluating moisture sensitivity
in current specifications of many DOTs, there is serious concern that the results of both tests may not reliably assess the field performance of some asphalt mixtures. Therefore, a robust validation experiment
NCHRP Project 20-07/Task 406
90
is needed to assess the reliability of the test methods as indicators of moisture susceptibility of asphalt mixtures. A draft research problem statement for this experiment is discussed in Chapter 6.
Key References for Moisture Damage Tests
1. Lai, J.S. 1986. “Development of a Simplified Test Method to Predict Rutting Characteristics of Asphalt Mixes.” Final Report, Research Project No. 8503, Georgia DOT.
2. Izzo, R.P., and M. Tahmoressi. 1999. “Use of the Hamburg Wheel-Tracking Device for Evaluating Moisture Susceptibility of Hot-Mix Asphalt.” Transportation Research Record: Journal of the Transportation Research Board, No. 1681, Washington, DC, pp. 76–85.
3. Aschenbrener, T., and G. Currier. 1993. “Influence of Testing Variables on the Results from the Hamburg Wheel-Tracking Device.” CDOT-DTD-R-93-22. Colorado Department of Transportation, Denver.
4. West, R., J. Zhang, and A. Cooley, Jr. 2004. “Evaluation of the Asphalt Pavement Analyzer for Moisture Sensitivity Testing.” NCAT Report 04-04, National Center for Asphalt Technology at Auburn University.
5. Aschenbrener, T. 1995. “Evaluation of Hamburg Wheel-Tracking Device to Predict Moisture Damage in Hot Mix Asphalt.” Transportation Research Record: Journal of the Transportation Research Board, No. 1492, Washington, DC, pp. 193–201.
6. Aschenbrener, T., R.L. Terrel, and R.A. Zamora. 1994. “Comparison of the Hamburg Wheel Tracking Device and Environmental Conditioning System to Pavements of Known Stripping Performance.” CDOTDTD-R-94-1. Colorado Department of Transportation, Denver.
7. Mohammad, L., M. Elseifi, W. Cao, A. Raghavendra, and M. Ye. 2017. “Evaluation of Various Hamburg Wheel-Tracking Devices and AASTHO T 324 Specification for Rutting Testing of Asphalt Mixtures.” Road Materials and Pavement Design, Vol. 18, Iss. Sup 4, pp. 128–143.
8. James Cox & Sons, Inc. Hamburg Wheel Tracker. https://jamescoxandsons.com/hamburg-wheel-tracker/ 9. Azari, H. 2014. “Precision Estimates of AASHTO T 324 Hamburg Wheel-Track Testing of Compacted Hot Mix
Asphalt (HMA).” Research Results Digest 390. National Cooperative Highway Research Program. 10. Schram, S., and C.R. Williams. 2012. “Ranking of HMA Moisture Sensitivity Tests in Iowa.” Report RB00-012, Iowa
Department of Transportation. 11. National Center for Asphalt Technology at Auburn University. Balanced Mix Design Training Course.
http://ncat.us/education/training/industry/balanced-mix.html, accessed on January 19, 2018. 12. Lottman, R.P. 1978. NCHRP 192: Predicting Moisture‐Inducted Damage to Asphaltic Concrete. Transportation
Research Board, National Highway Research Council, Washington, DC. 13. Hicks, R.G. 1991. NCHRP Synthesis of Highway Practice 175: Moisture Damage in Asphalt Concrete. Transportation
Research Board, Washington, DC. 14. Kennedy, T., F.L. Roberts, and J.N. Anagnos. 1983. "Texas Boiling Test for Evaluating Moisture Susceptibility of
Asphalt Mixtures." Research Report 253-5, Center for Transportation Research, Bureau of Engineering Research, The University of Texas at Austin.
15. Aschenbrener, T. 1993. “Investigation of the Modified Lottman Test to Predict the Stripping Performance of Pavements in Colorado.” CDOT-DTD-R-93-2. Colorado Department of Transportation, Denver.
16. Epps, J.A., P.E. Sebaaly, J. Penaranda, M.R. Maher, M.B. McCann, and A.J. Hand. 2000. NCHRP Report 444: Compatibility of a Test for Moisture‐Induced Damage with Superpave Volumetric Mix Design. Transportation Research Board, Washington, DC.
17. Humboldt. Marshall and TSR Loader. https://www.humboldtmfg.com/marshall-and-tsr-loader-2.html 18. National Cooperative Highway Research Program. 2011. “Project 9-26A, Precision Statements for AASHTO Standard
Methods of Test T 148, T 265, T 267 and T 283.” NCHRP Research Results Digest 351. 19. Kiggundu, B.M., and F.L. Roberts. 1988. “Stripping in HMA Mixtures: State of the Art and Critical Review of Test
Methods.” NCAT Report 88‐02, National Center for Asphalt Technology at Auburn University. 20. Illinois Department of Transportation Quality Management Training Program, CET 029 Hot Mix Level 1,
https://www.lakelandcollege.edu/idot-quality-management-training-program/, accessed on August 28, 2018.
Introduction Based on survey of state DOTs and asphalt contractors, literature review, and analysis of knowledge gaps
in the preceding chapter, nine research problem statements (RPSs) were prepared to aid continued advancement toward implementation of BMD. In general, these RPSs are in line with the level of importance for BMD related research topics rated by state DOTs and asphalt contractors in the survey (Figure 2-18).
1. Laboratory aging protocols for asphalt mixture cracking tests 2. Validation of laboratory tests for reflection cracking 3. Further validation of laboratory tests for top-down cracking 4. Validation of moisture damage susceptibility tests 5. Refinement of AASHTO T324, the Hamburg wheel tracking test 6. Establishing precision estimates for AASHTO T 340, Asphalt Pavement Analyzer 7. Validation of laboratory tests for bottom-up fatigue cracking 8. Sensitivity of thermal cracking tests to mix design variables 9. Establishing precision estimates for AASHTO TP 105, Low-Temperature Semi-Circular Bending
(SCB) test The nine draft RPSs are provided in Appendix B.
Rationale for Priorities To establish priorities for the needed research, the research team considered several factors including the
responses from state DOTs regarding the types of distress that were most important, the types of asphalt mixtures most often produced, ongoing research, and the expected time to complete research to address the more critical gaps.
Figure 2-4 on page 7 showed that the top distress for which a performance test is desired is fatigue cracking. Unfortunately, the survey did not provide separate options for top-down and bottom-up fatigue cracking. Since the vast majority of asphalt paving in recent years has been overlays of existing pavements rather than new construction or complete reconstruction, it is reasonable to prioritize tests for distresses that occur in the surface and/or near surface layers including top-down cracking, thermal cracking, and reflection cracking. As shown in Figure 2-5, contractors identified reflection cracking as the top distress. A critical gap in the development of tests for these distresses has been how to address the influence of in-service aging and how to simulate that aging in the preparation of test specimens for these cracking tests. Several studies have shown that the existing long-term aging protocol in AASHTO R30 does not adequately simulate critical in-service aging. Recent research from NCHRP 9-54 is a step in the right direction, but their current recommendations for oven aging are not practical for quality assurance testing and the number
NCHRP Project 20-07/Task 406
92
of binders used to set the oven temperature is much too limited to establish a national standard. Therefore, the first priority is to establish an appropriate laboratory aging protocol for preparation of specimens for mixture cracking tests on surface or near surface mixtures.
Although rutting was identified as the second highest distress priority for BMD by the state DOTs, many of them already have mix design criteria for either the APA or the Hamburg test. The only research gap for the APA test is a precision and bias study. For the Hamburg test, further research is needed to refine AASHTO T 324 to provide better guidance for selecting the test temperature, to improve the method of analysis of raw Hamburg data in to better distinguish rutting from moisture damage, and to verify the existing precision estimates. It is important to be able to distinguish rutting from moisture damage in the Hamburg test because the remedies to the two distresses are very different. These research needs were given slightly lower priorities since rutting has become much less of a problem since the implementation of Superpave.
Thermal cracking was identified as the third leading distress concern followed closely by reflection cracking and moisture damage. If the ongoing research for the DCT test is successful, then only additional training would be needed prior to implementation of this test for regions where thermal cracking is a common distress. If the DCT test is not validated as a good indicator of thermal cracking, then the research to address gaps for other candidate tests should be conducted.
Reflection cracking is another very common distress for asphalt overlays on both asphalt and concrete pavements. Although several tests have been promoted as reflection cracking tests, the studies relating results to field performance typically provide very little documentation of the underlying pavement structures and actual modes of cracking. The ongoing NRRA experiment on rehabilitation of concrete pavements with asphalt overlays study started in 2017. However, this experiment was not specifically designed to validate cracking tests and has only four sections with common cross-sections but different surface mix designs. Therefore, additional experiments are recommended for validation of reflection cracking tests that would consider different climates and overlays on both asphalt and concrete pavements. This RPS was given a high priority since reflection cracking is believed to be a more prevalent distress than many people assume.
The two tests currently used to assess moisture susceptibility of asphalt mixtures, AASHTO T 283 (TSR test) and AASHTO T 324 (Hamburg), have not been properly validated. Several studies have reported that both tests may not reliably predict the moisture susceptibility of some asphalt mixtures. Many highway agencies do not know which test is the best to protect against the risk of pavement failure due to moisture damage or what criteria to use for their selected method. A robust validation experiment is needed to assess the reliability of the test methods as indicators of moisture susceptibility of asphalt mixtures. This is a moderate priority research need.
For bottom-up fatigue cracking tests, the obvious missing step is an experiment to validate the candidate tests and setting mix design criteria that are appropriate for different traffic ranges and supporting conditions. However, there are several reasons why such an experiment is a lower priority than other research needs. First, a very small percentage of asphalt mix produced today is for new pavements where bottom-up fatigue cracking initiated in the lowest asphalt layer is a primary design consideration. For those relatively few cases where new pavements are to be built, a valid perpetual pavement design can eliminate bottom-up fatigue as a mode of failure. From a sustainability point of view, we should never design a pavement that fails from the bottom up and it makes no sense to try to predict when fatigue cracking will occur when we can avoid it altogether. Therefore, a very expensive field validation study for bottom-up fatigue cracking is a much lower priority than completing all of the steps for tests to address surface layer cracking distresses.
As noted in Figure 2-8, the low-temperature SCB test (AASHTO TP 105) was the preferred thermal cracking test based on the survey of the state DOTs. However, the DCT test has completed more of the critical steps to implementation and has already been put into specifications in three states. Pending successful outcomes of the ongoing validation experiment at MnROAD and the ruggedness experiment to
NCHRP Project 20-07/Task 406
93
be conducted as part of NCHRP 9-57A, the DCT test would be ready for training and implementation. If the DCT test proves unworthy, then the IFIT may be the next best option. The third option may be to work on filling research gaps for the low-temperature SCB test such as further assess its sensitivity to mix design variables and establishing precision and bias estimates. Therefore, these are the lowest of the research priorities identified by the research team.
Estimated Costs and Suggested Schedule Cost estimates for each of the proposed Research Problem Statements and suggested schedules for their
execution are summarized in Table 6-1. Each of the proposed validation experiments involve project sites in at least four locations, the construction of multiple test sections per site, detailed materials testing plans, and close monitoring of pavement performance. Consequently, the proposed validation experiments are expensive but necessary to result in reliable performance tests and specification criteria for use in mix design and quality assurance testing. Each respective validation experiment RPS includes a suggested approach for selecting field sites that considered cost, efficiency, and safety.
Table 6-1. Estimated costs and suggested schedule for recommended research.
RPS#
Description Estimated Cost
Estimated Duration
Suggested Schedule
1 Lab Aging Protocols $800,000 48 mos. 2018-2022 2 Reflection Cracking Test Validation $2,400,000 60 mos. 2019-2024 3 Further Validation of Top-Down Cracking Tests $1,200,000 60 mos. 2020-2025 4 Moisture Damage Susceptibility Test Validation $1,250,000 24 mos. 2019-2021 5 Refinement of Hamburg Wheel Tracking Test $250,000 18 mos. 2021-2023 6 Precision Estimates for APA $100,000 12 mos. 2019-2020 7 Bottom-Up Fatigue Test Validation $15,000,000 60 mos. 2021-2026 8 Sensitivity of Thermal Cracking Tests $300,000 24 mos. 2021-2023 9 Precision Estimates for Low-Temp. SCB Test $100,000 12 mos. 2023-2025 Further research to establish a mixture aging protocol for surface layer cracking tests (thermal cracking,
top-down cracking, and reflection cracking) should begin as soon as possible as this is in the critical path to implementation of such tests. As discussed previously, some cracking tests are focused on characterizing the fundamental properties of asphalt mixtures to be used in predictive models. It is of importance to conduct these tests on appropriately aged specimens that are representative of field aging of asphalt pavements. On the other hands, for cracking tests suited for routine use in mix design and quality assurance testing, the accuracy of laboratory aging to simulate field aging is less critical. To expedite this research, it could be organized as four coordinated regional experiments funded through pooled fund projects where a research organization in each region is able to obtain commonly used materials in the area and identify regional sites for sampling of in-situ aged pavements.
Efforts to develop an RFP for the project to validate reflection cracking should also commence as soon as possible. This large project will involve identifying appropriate sites for test sections on existing asphalt and concrete pavements in different climates, construction of overlays with different mixtures (test sections), testing of the mixtures, and close monitoring of the field performance. The experimental factor that has a big impact on the cost is the need to have experimental sites on both asphalt and concrete pavements.
The ongoing project to validate top-down cracking tests using test sections on the NCAT Test Track is presently on a short hiatus as test sections for other new experiments are built in the summer of 2018. The seven test sections in the top-down cracking experiment are nearly three years old and have carried 10
NCHRP Project 20-07/Task 406
94
million ESALs. One test section has well developed top-down cracks and three others have very minor superficial cracking. All of the laboratory testing in the original work plan has been completed. It is expected that this experiment will be completed by the summer of 2020 and will provide recommendations for the best test(s) for top-down cracking and preliminary criteria. Additional validation research is recommended for this test to include test sections in other climates with different pavement structures and a wider range of mixtures. This additional validation research should utilize public highways for field test sites to minimize the experiment costs since the risks to the traveling public due to pavement failure are low and forensic testing would be minimally invasive.
Validation of moisture susceptibility tests is an important need even without the motivation to implement other performance tests for mix design and quality assurance. The basis of commonly used TSR criteria of 0.80 is not well founded and there is little agreement among users of the Hamburg test for criteria for the Stripping Inflection Point. Furthermore, both tests have been criticized as providing false indications of stripping potential for some asphalt mixtures. For this experiment, utilization of multiple accelerated pavement testing (APT) facilities to test pavement sections is recommended. Accelerated Loading Facilities (ALFs), Heavy Vehicle Simulators (HVSs), and similar facilities can be used to apply loads to test sections with a range of moisture susceptibilities in controlled environments, including wet/semi-saturated conditions, in a relatively short period of time. Such facilities allow for “testing to failure” and enable forensic investigations without risking or inconveniencing the public. The use of multiple APT facilities would enable simultaneous testing of mixtures common to different areas of the U.S. and other countries. Five APT facilities have expressed interest in cooperating in this research.
Research to establish precision estimates for the Asphalt Pavement Analyzer rutting test could also be funded as a pooled-fund project supported by the twelve DOTs that currently use the test in their specifications. Although this research is not among the highest priorities, it would be an easy project complete in the near future and move those DOTs closer to BMD implementation.
Research to validate bottom-up fatigue cracking is a lower priority for several reasons previously mentioned. However, if such research is conducted, it is recommended that the test sections be built on full-scale pavement testing facilities such as the NCAT Test Track or MnROAD where pavement sections are built with high levels of materials and grade control, sections are fully instrumented, traffic is applied at normal highway speeds, non-destructive testing is conducted frequently, pavement failures can be tolerated, and detailed forensic investigations are a routine practice. Experiments at a minimum of three facilities is considered necessary to include a range of climates and materials.
Further research may also be needed on the thermal cracking tests. Some previous studies have indicated that each of the leading candidates for assessing the resistance of asphalt mixtures to thermal cracking are insensitive to certain mix design variables such as asphalt content or RAP content. This lack of sensitivity should be understood if the tests are to be used in balanced mix design. The low temperature SCB test also does not have a precision statement, so if this test is selected by a DOT, then that gap needs to addressed with a round robin study.
NCHRP Project 20-07/Task 406
95
References
Airey, G.D. 2003. “Rheological Properties of Styrene Butadiene Styrene Polymer Modified Road Bitumens.” Fuel, Vol. 82, No. 14, pp. 1709–1719.
Alabama Department of Transportation. 2012. “Standard Specifications for Highway Construction.” Alataş, T., and M. Yilmaz. 2013. “Effects of Different Polymers on Mechanical Properties of Bituminous Binders and Hot
Mixtures.” Construction and Building Materials, Vol. 42, pp. 161–167. Albritton, G., W. Barstis, and A. Crawley. 1999. “Polymer Modified Hot Mix Asphalt Field Trial.” Mississippi Department
of Transportation, Research Division, Report MS-DOT-RD-99-111. Al-Qadi, I.L., H. Ozer, J. Lambros, A. El Khatib, P. Singhvi, T. Khan, J. Rivera-Perez, and B. Doll. 2015. “Testing Protocols
to Ensure Performance of High Asphalt Binder Replacement Mixes Using RAP and RAS.” Illinois Center for Transportation Series No. 15-017, Illinois Center for Transportation/University of Illinois at Urbana-Champaign.
Ameri, M., A. Mansourian, and A.H. Sheikhmotevali. 2013. “Laboratory Evaluation of Ethylene Vinyl Acetate Modified Bitumens and Mixtures Based Upon Performance Related Parameters.” Construction and Building Materials, Vol. 40, pp. 438–447.
Aschenbrener, T. 2014. “Selecting Optimum Asphalt Content with Superpave.” Survey of AASHTO Subcommittee on Material, conducted by Idaho Transportation Department.
Bahia, H.U., D.I. Hanson, M. Zeng, H. Zhai, M.A. Khatri, and R.M. Anderson. 2001. NCHRP Report 459: Characterization of Modified Asphalt Binders in Superpave Mix Design. Transportation Research Board, Washington, DC.
Bari, J., and M.W. Witczak. 2005. “Evaluation of the Effect of Lime Modification on the Dynamic Modulus Stiffness of Hot-Mix Asphalt.” Transportation Research Record: Journal of the Transportation Research Board, No. 1929, Washington, DC, pp. 10–19.
Bennert, T., and D. Pezeshki. 2015. “Performance Testing for HMA Quality Assurance.” NJDOT Research Report FHWA-NJ-2015-010.
Bennert, T. 2011. “Implementation of Performance-Based HMA Specialty Mixtures in New Jersey.” Journal of the Association of Asphalt Paving Technologists, Vol. 80, pp. 719–740.
Brown, E.R., and S.A. Cross. 1989. “A Study of In-place Rutting of Asphalt Pavements.” Journal of the Association of Asphalt Paving Technologists, Vol. 58, pp. 1–39.
Brown, E.R., and S.A. Cross 1992. “A National Study of Rutting in Hot Mix Asphalt (HMA) Pavements.” NCAT Report 92-5, National Center for Asphalt Technology at Auburn University.
Brown, E.R., J. McRae, and A. Crawley. 1989. “Effect of Aggregates on Performance of Bituminous Concrete.” ASTM International.
Buchanan, M.S. 2000. “Evaluation of the Effect of Flat and Elongated Particles on the Performance of Hot Mix Asphalt Mixtures.” NCAT Report 00-03, National Center for Asphalt Technology at Auburn University.
Bulatović, V.O., V. Rek, and K.J. Marković. 2013. “Rheological Properties and Stability of Ethylene Vinyl Acetate Polymer-Modified Bitumen.” Polymer Engineering and Science, Vol. 53, No. 11, pp. 2276–2283.
Button, J.W. 1992. “Summary of Asphalt Additive Performance at Selected Sites.” Transportation Research Record: Journal of the Transportation Research Board, No. 1342, Washington, DC, pp. 67–75.
Button, J.W., D. Perdomo, and R.L. Lytton. 1990. “Influence of Aggregate on Rutting in Asphalt Concrete Pavements.” Transportation Research Record: Journal of the Transportation Research Board, No. 1259, Washington, DC, pp. 141–152.
California Department of Transportation. 2015. “Standard Specifications.” Cascione, A., C. William, and J. Yu. 2015. "Performance Testing of Asphalt Pavements with Recycled Asphalt Shingles
from Multiple Field Trials." Construction and Building Materials, Vol. 101: pp. 628–642. Chen, J.S., M.C. Liao, and M.S. Shiah. 2002. “Asphalt Modified by Styrene-Butadiene-Styrene Triblock Copolymer:
Morphology and Model.” Journal of Materials in Civil Engineering, 14(3), pp. 224–229. Christensen, D.W., R. Bonaquist, and A. Cooley. 2005. “A Mix Design Manual for Hot-Mix Asphalt.” NCHRP Project 9-
33, Draft Interim Report.
NCHRP Project 20-07/Task 406
96
Collins, J.H., M.G. Bouldin, R. Gelles, and A. Berker. 1991. “Improved Performance of Paving Asphalts by Polymer Modification (with Discussion).” Journal of the Association of Asphalt Paving Technologists, No. 60, pp. 43–79.
Cooper, S.B., L.N. Mohammad, S. Kabir, and W. King. 2014. “Balanced Asphalt Mixture Design through Speciation Modification: Louisiana’s Experience.” Transportation Research Record: Journal of the Transportation Research Board, No. 2447, Washington, DC, pp. 92–100.
Cooper, S.B., W. King, and S. Kabir. 2016. “Testing and Analysis of LWT and SCB Properties of Asphalt Concrete Mixtures.” Final Report 536. Louisiana Department of Transportation and Development; Louisiana Transportation Research Center.
Davis, R.L. 1988. “Large Stone Mixes: A Historical Insight.” NAPA Report IS 103/88, National Asphalt Pavement Association, Lanham, Maryland.
Elmore, W.E., T.W. Kennedy, M. Solaimanian, and P. Bolzan. 1993. “Long-Term Performance Evaluation of Polymer-Modified Asphalt Concrete Pavements.” Report FHWA-TX-94+1306-1F. Federal Highway Administration, Washington, DC.
Federal Aviation Administration. 2013. “Hot Mix Asphalt Paving Handbook.” Advisory Circular 150/5370-14B. FHWA. 2012. “Mix Design, Construction, and Performance of Warm Mix Asphalt Pavements.” Instructor Guide, Warm-
Mix Asphalt Training Course. U.S. Department of Transportation, Washington, DC. FHWA. 1999. “Performance of Coarse-Graded Mixes at WesTrack-Premature Rutting.” FHWA Report RD-99134. U.S.
Department of Transportation, Washington, DC. FHWA. 2016. “Balanced Mixture Design Approaches for Asphalt Pavement Construction.” Tech Brief, Preliminary Draft,
U.S. Department of Transportation, Washington, DC. Garcia, V.M., A. Miramontes, J. Garibay, I. Abdallah, G. Carrasco, R. Lee, and S. Nazarian. 2017. “Alternative Methodology
for Assessing Cracking Resistance of Hot Mix Asphalt Mixtures with Overlay Tester.” Road Materials and Pavement Design, pp. 1–17.
Garrity, J. February 2017. MnDOT Bituminous Engineer, Minnesota Department of Transportation. Personal communication.
Georgia Department of Transportation. 2011. “GDT-66, Tensile Splitting Ratio after Freeze-Thaw Cycle.” GDOT, Atlanta. Georgia Department of Transportation. 2014a. “Section 400-Hot Mix Asphaltic Concrete Construction.” Supplemental
Specification, Section 400.3.02-B-9, GDOT, Atlanta. Georgia Department of Transportation. 2013. “Section 828-Hot Mix Asphaltic Concrete Mixtures.” Special Provision,
Section 828.2.B, GDOT, Atlanta. Germann, F.P., and R.L. Lytton. 1979. “Methodology for Predicting the Reflective Cracking Life of Asphalt Concrete
Overlays.” Research Report FHWA/TX-79/09+207-5. Hajj, E.Y., P.E. Sebaalyand, and R. Shresta. 2009. “Laboratory Evaluation of Mixes Containing Recycled Asphalt Pavement
(RAP).” International Journal of Road Materials and Pavements Design, Vol. 10, No. 3. Hajj, E.Y., P.E. Sebaaly, L. Loria, S. Kass, and T. Liske. “Impact of High RAP Content on the Performance Characteristics
of Asphalt Mixtures in Manitoba.” Paper presented at The Innovative Developments in Sustainable Pavements Session of the 2011 Annual Conference of the Transportation Association of Canada.
Hanz, A. E. Dukatz, and G.Reinke. 2017. “Use of Performance-Based Testing for High RAP Mix Design and Production Monitoring.” Road Materials and Pavement Design, Vol. 18, Iss. sup1, pp. 284–310.
Harvey, J., R. Wu, J. Signore, I. Basheer, S. Holikatti, P. Vacura, and J. Holland. 2014. “Performance-Based Specifications: California Experience to Date.” Transportation Research E-Circular E-C189.
Harvey, J., F. Long, J.A. and Prozzi. 1999. “Application of CAL/APT Results to Long Life Flexible Pavement Reconstruction.” Proceedings of the Accelerated Pavement Testing Conference, Reno, Nevada.
Harvey, J., J. Deacon, A. Tayebali, R. Leahy, and C. Monismith. 1997. “A Reliability-Based Mix Design and Analysis System for Mitigating Fatigue Distress.” Proc., 8th International Conference on Asphalt Pavements, pp. 301–324.
Harvey, T.H., and B.W. Tsai. 1996. “Effects of Asphalt Content and Air Void Content on Mix Fatigue and Stiffness.” Transportation Research Record: Journal of the Transportation Research Board, No. 1543, Washington DC, pp. 38–45.
Hesp, S.A.M., S.N. Genin, D. Scafe, H.F. Shurvell, and S. Subramani. 2009. “Five Year Performance Review of a Northern Ontario Pavement Trial: Validation of Ontario’s Double-Edge-Notched Tension (DENT) and Extended Bending Beam Rheometer (BBR) Test Methods.” Proceedings of the Fifty-fourth Annual Conference of the Canadian Technical Asphalt Association, Polyscience Publications, pp. 99–126.
Huber, G.A., and G.H. Herman. 1987. “Effect of Asphalt Concrete Parameters on Rutting Performance.” Journal of the Association of Asphalt Paving Technologists, Vol. 56, pp. 33–61.
NCHRP Project 20-07/Task 406
97
Isacsson, U., and X. Lu. 1999. “Characterization of Bitumens Modified With SEBS, EVA and EBA Polymers.” Journal of Materials Science, Vol. 34, No. 15, pp. 3737–3745.
Johanneck, L., J. Geib, D. Van Deusen, J. Garrity, C. Hanson, and E. Dave. 2015. “DCT Low Temperature Fracture Testing Pilot Project.” Minnesota Department of Transportation Research Services, St. Paul.
Kim, Y.R., D.N. Little, and I. Song. 2003. “Effect of Mineral Fillers on Fatigue Resistance and Fundamental Material Characteristics: Mechanistic Evaluation.” Transportation Research Record: Journal of the Transportation Research Board, No. 1832, Washington, DC, pp. 1–8.
Leibrock, C. 2016. “Reduced Design Air Voids.” North Central Asphalt User/Producer Group Meeting. Indianapolis, IN. Little, D.N., and J.C. Petersen. 2005. “Unique Effects of Hydrated Lime Filler on the Performance-Related Properties of
Asphalt Cements: Physical and Chemical Interactions Revisited.” Journal of Materials in Civil Engineering, 17(2), pp. 207–218.
Lu, X., and U. Isacsson. 2000. “Modification of Road Bitumens With Thermoplastic Polymers.” Polymer Testing, Vol. 20, No. 1, pp. 77–86.
Mansour, T.N., and B.J. Putman. 2013. “Influence of Aggregate Gradation on the Performance Properties of Porous Asphalt Mixtures.” Journal of Materials in Civil Engineering, Vol. 25, No. 2, pp. 281–288.
Maupin, G.W. 2003. “Additional Asphalt to Increase the Durability of Virginia’s Superpave Surface Mixes,” Report No. FHWA/VTRC 03-R15, Virginia Transportation Research Council, Virginia Department of Transportation, Richmond.
McDaniel, R., and A. Shah. 2003. “Asphalt Additives to Control Rutting and Cracking.” Report No. FHWA/IN/JTRP-2002/29, Federal Highway Administration, Washington, DC.
Michigan Department of Transportation. 2016. “Special Provision for Acceptance of Hot Mix Asphalt Mixture on Local Agency Projects.” 12SP-501J-05.
Mogawer, W.S., A.J. Austerman, R. Bonaquist, and M. Roussel. 2011. “Performance Characteristics of Thin-Lift Overlay Mixtures: High Reclaimed Asphalt Pavement Content, Recycled Asphalt Shingles, and Warm-Mix Asphalt Technology.” Transportation Research Record: Journal of the Transportation Research Board, No. 2208, Washington, DC, pp. 17–25.
Monismith, C.L., F. Long, and J.T. Harvey. 2001. “California’s Interstate-710 Rehabilitation: Mix and Structural Section Designs, Construction Specifications.” Journal of the Association of Asphalt Paving Technologists, Vol. 70, pp. 762–799.
Montana Department of Transportation. 2014. “Standard Specifications for Road and Bridge Construction.” New Jersey Department of Transportation. 2007. “Standard Specifications for Road and Bridge Construction.” Ohio Department of Transportation. 2013. “Bridge Deck Waterproofing, Hot Mix Asphalt Surface Course.” ODOT
Supplement Specification 856. Panda, M., and M. Mazumdar. 1999. “Engineering Properties of EVA-Modified Bitumen Binder for Paving Mixes.” Journal
of Materials in Civil Engineering, 11(2), pp. 131–137. Powers, D. February 2017. Ohio Department of Transportation. Personal communication. Prowell, B., and E.R. Brown. 2007. NCHRP Report 573: Superpave Mix Design: Verifying Gyration Levels in the Ndesign
Table.” National Cooperative Highway Research Program, National Research Council, Washington, DC. Qi, X., T. Mitchell, K. Stuart, J. Youtcheff, K. Petros, T. Harman, and G. Al-Khateeb. 2004. “Strain Responses in ALF
Modified-Binder Pavement Study.” Proc., 2nd International Conference on Accelerated Pavement Testing, Minneapolis, MN.
Scullion, T. 2006. “Perpetual Pavement Design in Texas: State of the Practice.” Publication FHWA/TX-06/0-4822-1. Texas Transportation Institute, Texas A&M University System.
Sebaaly, P.E., D.N. Little, and J.A. Epps. “The Benefits of Hydrated Lime in Hot Mix Asphalt.” Report for the National Lime Association (updated version).
Stakston, A.D., and H. Bahia. 2003. “The Effect of Fine Aggregate Angularity, Asphalt Content and Performance Graded Asphalts on Hot Mix Asphalt Performance.” WisDOT Highway Research Study 0092-45-98, University of Wisconsin-Madison, Wisconsin Department of Transportation, Division of Transportation Infrastructure Development, Research Coordination Section.
Stroup-Gardiner, M., and D.E. Newcomb. 1995. “Polymer Literature Review.” Report MN/RC- 95/27, Minnesota Department of Transportation, St. Paul.
Timm, D., R. West, A. Priest, I. Selvaraj, J. Zhang, and R. Brown. 2006. “Phase II NCAT Test Track Results.” NCAT Report 06-05, National Center for Asphalt Technology at Auburn University.
Timm, D.H., M.M. Robbins, J.R. Willis, N. Tran, and A.J. Taylor. 2013. “Field and Laboratory Study of High-Polymer Mixtures at the NCAT Test Track.” NCAT Report 13-03, National Center for Asphalt Technology at Auburn University.
NCHRP Project 20-07/Task 406
98
Tran, N., A. Taylor, and J.R. Willis. 2012. “Effect of Rejuvenator on Performance Properties of HMA Mixtures with High RAP and RAS Contents.” NCAT Report 12-05, National Center for Asphalt Technology at Auburn University.
Tsai, B.W., R. Wu, J. Harvey, and C. Monismith. 2012. “Development of Fatigue Performance Specification and Its Relation to Mechanistic–Empirical Pavement Design Using Four-Point Bending Beam Test Results.” Presented at 4-Point Bending, CRC/Balkema, Leiden, Netherlands.
Ullidtz, P., J. Harvey, I. Basheer, D. Jones, R. Wu, J. Lea, and Q. Lu. 2010. “CalME: A New Mechanistic– Empirical Design Program to Analyze and Design Flexible Pavement Rehabilitation.” Transportation Research Record: Journal of the Transportation Research Board, No. 2153, Washington, DC, pp. 143–152.
Utah Department of Transportation. 2013. “Superpave Design Manual.” UDOT-TTQP. Vargas-Nordcbeck, A., and D. Timm. 2013. “Physical and Structural Characterization of Sustainable Asphalt Pavement
Sections at the NCAT Test Track.” NCAT Report 13-02, National Center for Asphalt Technology at Auburn University. Vazquez, C.G., J.P. Aguiar-Moya, A.F. Smit, and J.A. Prozzi. 2010. “Laboratory Evaluation of Influence of Operational
Tolerance (Acceptance Criteria) on Performance of Hot-mix Asphalt Concrete.” Report No. FHWA/TX-11/0-6045-1, Federal Highway Administration.
Von Quintus, H.L., J. Mallela, and M. Buncher. 2001. “Quantification of Effect of Polymer Modified Asphalt on Flexible Pavement Performance.” Transportation Research Record: Journal of the Transportation Research Board, No. 2007, Washington DC, pp. 141–154.
Wen, H., and B. Sushanta. 2013. "Toward Development of a New Thermal Cracking Test Using the Dynamic Shear Rheometer." Journal of Testing and Evaluation, 41(3), pp. 425–432.
Wen, H. 2013. "Use of Fracture Work Density Obtained from Indirect Tensile Testing for the Mix Design and Development of a Fatigue Model." International Journal of Pavement Engineering, 14(6), pp. 561–568.
West, R., C. Rodezno, G. Julian, B. Prowell, B. Frank, L.V. Osborn, and T. Kriech. 2014. NCHRP Report 779: Field Performance of Warm Mix Asphalt Technologies. Transportation Research Board of the National Academies, Washington, DC.
West, R., A. Kvasnak, N. Tran, R. Powell, and P. Turner. 2009. “Testing of Moderate and High RAP Content Mixes: Laboratory and Accelerated Field Performance at the National Center for Asphalt Technology Test Track.” Transportation Research Record: Journal of the Transportation Research Board, No. 2126, Washington, DC, pp.100–108.
West, R., N. Tran, A. Taylor, and R. Willis. 2016. “Comparison of Laboratory Cracking Test Results with Field Performance of Moderate and High RAP Content Surface Mixtures on the NCAT Test Track.” 8th RILEM International Conference on Mechanisms of Cracking and Debonding in Pavements.
West, R. 2015. “A Peer Review of Michigan DOT Asphalt Specifications and Practices.” Draft Report. National Center for Asphalt Technology at Auburn University.
White, T.D., J.E. Haddock, and E. Rismantojo. 2006. NCHRP Report 557: Aggregate Tests for Hot Mix Asphalt Mixtures Used in Pavements. National Cooperative Highway Research Program, National Research Council, Washington, DC.
Williams, C. 2004. “Development of Laboratory Performance Test Procedures and Trial Specifications for Hot Mix Asphalt,” Final Report, Volume I RC-1410, Michigan Tech, Houghton.
Willis, J.R., P. Turner, G. Julian, N. Tran, and F. Padula. 2012. “Effects of Changing Virgin Binder Grade and Content on RAP Mixture Properties.” NCAT Report 12-03, National Center for Asphalt Technology at Auburn University.
Willis, J.R., and D.H. Timm. 2006. “Forensic Investigation of a Rich Bottom Pavement.” NCAT Report 06-04, National Center for Asphalt Technology at Auburn University.
Willis, J.R., D.H. Timm, R. West, B. Powell, M. Robbins, A. Taylor, A. Smit, N. Tran, M. Heitzman, and A. Bianchini. 2009. “Phase III NCAT Test Track Findings.” NCAT Report 09-08, National Center for Asphalt Technology at Auburn University.
Wilson, B., T. Scullion, and C. Estakhri. 2012. “Design and Construction Recommendation for Thin Overlays in Texas.” FHWA Report 0-6615, Federal Highway Administration.
Woo, W.J., E. Ofori-Abebresse, A. Chowdhury, J. Hilbrich, Z. Kraus, A.E. Martin, and C.J. Glover. 2007. “Polymer Modified Asphalt Durability in Pavements.” Report No. FHWA/TX-07/0-4688-1. Texas Transportation Institute, Texas A&M University System.
Wu, S., K. Zhang, H. Wen, J. DeVol, and K. Kelsey. 2015. "Performance Evaluation of Hot Mix Asphalt Containing Recycled Asphalt Shingles in Washington State." Journal of Materials in Civil Engineering, 28(1).
Zhou, F., T. Scullion, L. Walubita, and B. Wilson. 2014. “Implementation of a Performance-Based Mix Design System in Texas.” Circular Number E-C189, Transportation Research Board of the National Academies, Washington, DC.
NCHRP Project 20-07/Task 406
99
Zhou, F., and T. Scullion. 2005. “Overlay Tester: A Rapid Performance Related Crack Resistance Test.” Vol. 7. Texas Transportation Institute, Texas A & M University System.
Zhou, F., D. Newcomb, C. Gurganus, S. Banihashemrad, E. S. Park, M. Sakhaeifar, and R. L. Lytton. 2016. “Experimental Design for Field Validation of Laboratory Tests to Assess Cracking Resistance of Asphalt Mixtures.” National Cooperative Highway Research Program, Transportation Research Board of the National Academies, 9-57.
Zhou, F., S. Hu, and T. Scullion. 2006. “Integrated Asphalt (Overlay) Mix Design with Balancing Rutting and Cracking Requirements.” Report FHWA/TX-06/0-5123-1. FHWA, Texas A&M Transportation Institute, College Station.
Zhou, F., S. Hu, G. Das, and T. Scullion. 2011. “High RAP Mixes Design Methodology with Balanced Performance.” Texas Transportation Institute, FHWA/TX-11/0-6092-2.
Zhou, F., S. Hu, T. Scullion, and R. Lee. 2014. “Balanced RAP/RAS Mix Design System for Project-Specific Service Conditions.” Presented at 2014 Annual Meeting of the Association of Asphalt Paving Technologists.
Zhou, F., Hu, S., Hu, X., and Scullion, T. “Mechanistic–Empirical Asphalt Overlay Thickness Design and Analysis System.” Research Report FHWA/TX-09/0-5123-3. Texas Transportation Institute, College Station, October 2009.
Zhu, J., B. Birgisson, and N. Kringos. 2014. “Polymer Modification of Bitumen: Advances and Challenges.” European Polymer Journal, Vol. 54, No. 1, pp. 18–38.
A-1
A P P E N D I X A
Draft AASHTO Standards for Balanced Mix Design
[see separate files: Draft AASHTO Rxxx BMD.docx and Draft AASHTO Mxxx BMD.docx]
AASHTO Designation: M XXX-XX Technical Section: 2d, Proportioning of Asphalt–Aggregate Mixtures
1. SCOPE
1.1. This specification for balanced mix design uses volumetric and/or performance-based test results to produce job-mix formulas for asphalt mixtures.
1.2. This standard specifies minimum performance testing requirements for balanced design of asphalt mixtures.
1.3. This standard may involve hazardous materials, operations, and equipment. This standard does not purport to address all of the safety concerns associated with its use. It is the responsibility of the user of this procedure to establish appropriate safety and health practices and determine the applicability of regulatory limitations prior to use.
2. REFERENCED DOCUMENTS
2.1. AASHTO Standards: R XXX, Balanced Design of Asphalt Mixtures T 246, Resistance to Deformation and Cohesion of Hot Mix Asphalt (HMA) by Means of
Hveem Apparatus T 283, Resistance of Compacted Asphalt Mixtures to Moisture-Induced Damage T 320, Determining the Permanent Shear Strain and Stiffness of Asphalt Mixtures Using the
Superpave Shear Tester T 321, Determining the Fatigue Life of Compacted Asphalt mixtures Subjected to Repeated
Flexural Bending T 322, Determining the Creep Compliance and Strength of Hot Mix Asphalt Using the
Indirect Tensile Test Device T 324, Hamburg Wheel-Tracking Testing of Compacted Asphalt Mixtures T 340, Determining Rutting Susceptibility of Hot Mix Asphalt (HMA) Using the Asphalt
Pavement Analyzer (APA) T 378, Determining the Dynamic Modulus and Flow Number for Asphalt mixtures Using the
Asphalt Mixture Performance Tester (AMPT) TP 105, Determining the Fracture Energy of Asphalt Mixtures Using the Semicircular Bend
Geometry (SCB) TP 107, Determining the Damage Characteristic Curve from Direct Tension Cyclic Fatigue
Tests TP 124, Determining the Fracture Potential of Asphalt Mixtures Using Semicircular Bend
4.1. This standard may be used to select and evaluate materials for balanced design of asphalt paving mixtures. This approach is only applicable to pavements with design traffic greater than 3 million ESALs or high stress non-highway applications.
5. RUTTING TESTS
5.1. Highway agencies should select one of the tests in this section.
5.2. Asphalt Pavement Analyzer (AASHTO T 340)
5.2.1. Specimen Conditioning and Aging—condition loose mix test samples for 4 hours at 135°C prior to compaction.
5.2.2. Test Temperature—set the test temperature to the high temperature of the standard Superpave performance-graded (PG) binder identified by the specifying agency for the project for which the asphalt paving mixture is intended (Note 1).
Note 1—different test temperatures with a range of 40 to 67°C are currently being used by state DOTs.
PG 76-22 Max. 3.0mm at 64°C PG 64-22 Max. 5.0mm at 64°C
South Dakota
Truck ADT < 75 Max. 8.0mm at binder high PG temperature Truck ADT 76 to 250 Max. 7.0mm at binder high PG temperature Truck ADT 251 to 650 Max. 6.0mm at binder high PG temperature
Truck ADT > 651 Max. 5.0mm at binder high PG temperature
5.3. Flow Number Test (AASHTO T 378)
5.3.1. Specimen Conditioning and Aging—condition loose mix test samples for 4 hours at 135°C for hot mix asphalt (HMA) and 2 hours at field compaction temperature for warm mix asphalt (WMA) prior to compaction.
5.3.2. Test Temperature—select a test temperature as the high-adjusted PG temperature determined using the LTPP Bind software.
5.3.3. Test Criteria—compare the test results with the criteria given in Table 3.
Table 3. Flow Number Test Criteria Traffic Level, million
ESALs HMA Minimum Average
Flow Number* WMA Minimum Average
Flow Number# 3 to < 10 50 30
10 to < 30 190 105 ≥30 740 415
*recommended criteria from NCHRP report 673, page 142 (AAT, 2011); #recommended criteria from NCHRP report 691, page 80 (Bonaquist, 2011).
5.4. Hamburg Wheel-Tracking Test (AASHTO T 324)
5.4.1. Specimen Conditioning and Aging—condition loose mix test samples for 4 hours at 135°C prior to compaction.
5.4.2. Test Temperature—select a test temperature based on the applicable specifications (Note 3).
Note 3—different test temperatures with a range of 40 to 56°C are currently being used by state DOTs. As shown in Table 4, some agencies use a temperature of 50°C for all mixtures, while others require the adjustment of test temperature based on the binder high temperature PG. Future research should consider setting the test temperature based on the predicted design pavement temperature from the LTPP Bind software.
Table 4. Summary of Hamburg Wheel-Tracking Test Temperature used by State DOTs States Binder Grades Test Temperatures
5.4.3. Test Criteria—compare the test results with the criteria given in Table 5 (Note 4).
Table 5. Hamburg Wheel-Tracking Test Criteria Traffic Level, Million ESALs Criteria
3 to < 10 TBD 10 to < 30 TBD
≥ 30 TBD
Note 4—Table 6 summarizes the HWTT criteria used by different state DOTs. Many agencies require a maximum rut depth at a certain number of passes or a minimum number of passes at a certain rut depth. In addition, several agencies have a minimum requirement for the moisture susceptibility parameter of stripping inflection point (SIP). Future research should consider establishing nationally accepted criteria that account for different design traffic levels.
Table 6. Summary of HWTT Criteria used by State DOTs States Binder/Mixture Types Criteria
California
PG 58-xx Min. 10,000 passes at 12.5mm rut depth PG 64-xx Min. 15,000 passes at 12.5mm rut depth PG 70-xx Min. 20,000 passes at 12.5mm rut depth PG 76-xx Min. 25,000 passes at 12.5mm rut depth
Colorado all Max. 4.0mm rut depth at 10,000 passes
Iowa all Max. 8.0mm rut depth at 8,000 passes Min. 10,000 or 14,000 passes with no SIP
Illinois
PG 58-xx (or lower) Max. 12.5mm rut depth at 5,000 passes PG 64-xx Max. 12.5mm rut depth at 7,500 passes PG 70-xx Max. 12.5mm rut depth at 15,000 passes
Louisiana Level 1 high traffic Max. 6.0mm rut depth at 20,000 passes Level 2 medium/low traffic Max. 10.0mm rut depth at 20,000 passes
Maine all Max. 12.5mm rut depth at 20,000 passes Min. 15,000 passes with no SIP
Massachusetts all Max. 12.5mm rut depth at 20,000 passes Min. 15,000 passes with no SIP
Montana all Max. 13.0mm rut depth at 15,000 passes
Oklahoma PG 64-xx Min. 10,000 passes at 12.5mm rut depth PG 70-xx Min. 15,000 passes at 12.5mm rut depth PG 76-xx Min. 20,000 passes at 12.5mm rut depth
Texas PG 64-xx Min. 10,000 passes at 12.5mm rut depth PG 70-xx Min. 15,000 passes at 12.5mm rut depth PG 76-xx Min. 20,000 passes at 12.5mm rut depth
5.5.1. Specimen Conditioning and Aging—Condition loose mix test samples for 4 hours at 135°C prior to compaction.
5.5.2. Test Temperature—60 ± 3°C.
5.5.3. Test Criteria—compare the test results with the criteria given in Table 7 (Note 5).
Table 7. Hveem Stability Test Criteria Traffic Level, Million ESALs Criteria
3 to < 10 TBD 10 to < 30 TBD
≥ 30 TBD
Note 5—Table 8 summarizes the Hveem Stability Test criteria used by different state DOTs.
Table 8. Summary of Hveem Stability Test Criteria used by State DOTs States Binder/Mixture Types Minimum Criteria
California*
Type A No. 4 and 3/8" gradings 30 Type A 1/2" and 3/4" gradings 37 Type B No. 4 and 3/8" gradings 30 Type B 1/2" and 3/4" gradings 35
Type RHMA-G 23
Nevada Type 2 35
Type 2C 37 Type 3 30
* Caltrans 2010 Specification
5.6. Superpave Shear Tester (AASHTO T 320)
5.6.1. Specimen Conditioning and Aging—Condition loose mix test samples for 4 hours at 135 ± 5°C prior to compaction.
5.6.2. Test Temperature—the following test temperatures are recommended: • For simple shear test at constant height: specimens may be tested at multiple test
temperatures no greater than 40°C; • For repeated shear test at constant height: select the 7-day maximum pavement
temperature (at a depth of 50mm) for the project location determined using the LTPP Binder software.
5.6.3. Test Criteria—compare the test results with the criteria given in Table 9.
Table 9. Superpave Shear Tester Criteria
Traffic Level, Million ESALs Max. Permanent Shear Strain (%)*
3 to < 10 3.4 10 to < 30 2.1
≥ 30 0.8 *recommended criteria for the repeated shear at constant height test from NCHRP report 673, page 144 (AAT, 2011).
6.1. Highway agencies should select one of the tests in this section.
6.2. BBR Mixture Bending Test (AASHTO TP 125)
6.2.1. Specimen Conditioning and Aging—no specimen conditioning and aging procedure has been recommended at this time.
6.2.2. Test Temperature—for quality control, select the temperature 10°C above the specified binder low-temperature grade used in the mixture. For performance prediction, select at least three temperatures at 6°C intervals. The test temperatures of 4°C, 10°C, and 16°C above the specified binder grade used in the mixtures have been successfully used. Other temperatures can also be used depending on the project requirements.
6.2.3. Test Criteria—compare the test results with the criteria given in Table 10 (Note 6).
Table 10. BBR Mixture Bending Test Criteria Traffic Level, Million ESALs Criteria
3 to < 10 TBD 10 to < 30 TBD
≥ 30 TBD
Note 6—researchers at the University of Utah proposed a preliminary failure envelope on the creep modulus versus m-value Black Space diagram that was able to identify asphalt mixtures susceptible to thermal cracking (Romero, 2016).
6.3. Direct Tension Cyclic Fatigue Test (AASHTO TP 107)
6.3.1. Specimen Conditioning and Aging—condition loose mix test samples for 4 hours at 135°C prior to compaction.
6.3.2. Test Temperature—select the test temperature as the 98 percent reliability climatic PG determined based on LTPP Bind software at the location of interest, but not exceeding 21°C.
6.3.3. Test Criteria—compare the test results with the criteria given in Table 11 (Note 7).
Table 11. Direct Tension Cyclic Fatigue Test Criteria Traffic Level, Million ESALs Criteria
3 to < 10 TBD 10 to < 30 TBD
≥ 30 TBD
Note 7—no criteria has been established at this time.
6.4. Disc-Shaped Compact Tension Test (ASTM D7313)
6.4.1. Specimen Conditioning and Aging—no specimen conditioning and aging procedure has been recommended.
6.4.2. Test Temperature—select the test temperature of 10°C greater than the low temperature PG of the asphalt binder.
6.4.3. Test Criteria—compare the test results with the criteria given in Table 12 (Note 8).
Table 12. Disc-Shaped Compact Tension Test Criteria Traffic Level, Million ESALs Criteria
3 to < 10 TBD 10 to < 30 TBD
≥ 30 TBD
Note 8—Table 13 summarizes the DCT test criteria used by different state DOTs.
Table 13. Summary of Disc-Shaped Compact Tension Test Criteria used by State DOTs States Mixture Types Min. Fracture Energy Criteria Iowa All 400 J/m2
Minnesota Design traffic: < 3 million ESALs 400 J/m2 Design traffic: 3 to 30 million ESALs 450 J/m2
6.5. Flexural Bending Beam Fatigue Test (AASHTO T 321)
6.5.1. Specimen Conditioning and Aging—no specimen conditioning and aging procedure has been recommended.
6.5.2. Test Temperature—a test temperature of 20°C is suggested, but other temperatures can be used as indicated in AASHTO T 321.
6.5.3. Test Criteria—compare the test results with the criteria in Table 14.
Table 14. Flexural Bending Beam Fatigue Test Criteria Traffic Level, Million ESALs Criteria
3 to < 10 TBD 10 to < 30 TBD
≥ 30 TBD
6.6. Illinois Flexibility Index Test (AASHTO TP 124)
6.6.1. Specimen Conditioning and Aging—no specimen conditioning and aging procedure has been recommended.
6.6.2. Test Temperature—select a test temperature of 25 ± 0.5°C.
6.6.3. Test Criteria—compare the test results with the criteria given in Table 15 (Note 9).
Table 15. Flexibility Index (FI) Criteria Traffic Level, Million ESALs Criteria
3 to < 10 TBD 10 to < 30 TBD
≥ 30 TBD
Note 9—the Illinois Department of Transportation currently uses a preliminary minimum FI threshold of 8.0 for acceptance of asphalt mixtures (Illinois Department of Transportation, 2015).
6.7. Indirect Tensile Creep Compliance and Strength Test (AASHTO T 322)
6.7.1. Specimen Conditioning and Aging—no specimen conditioning and aging procedure has been recommended.
6.7.2. Test Temperature—select three temperatures at 10°C intervals. The following test temperatures are recommended:
• For mixtures made using binder grades PG XX-34 or softer: –30, –20, and –10°C; • For mixtures made using binder grades PG XX-28 and PG XX-22, or mixtures for which
binder grade is unknown: –20, –10, and 0°C; • For mixtures made using binder grades PG XX-16 or harder: –10, 0, and +10°C; and • For mixtures subjected to severe age hardening, the test temperatures should be increased
by 10°C. The test temperatures of 4°C, 10°C, and 16°C above the specified binder grade used in the mixtures have been successfully used. Other temperatures can also be used depending on the project requirements.
6.7.3. Test Criteria—no criteria has yet been established for the creep compliance, tensile strength, and Poisson’s ratio results. However, the test data can be used to determine master relaxation modulus curve and fracture parameters to predict the critical thermal cracking temperature based on a given cooling rate. The critical thermal cracking temperature can be compared to the expected low pavement temperature for the project location using LTPP Bind at given levels of reliability.
6.8. Indirect Tensile Energy Ratio Test
6.8.1. Specimen Conditioning and Aging—condition loose mix test samples for 4 hours at 135°C prior to compaction.
6.8.2. Test Temperature—10 ± 1°C
6.8.3. Test Criteria—compare the test results with the criteria given in Table 16 (Note 10).
Table 16. Indirect Tensile Energy Ratio Test Criteria Traffic Level, Million ESALs Criteria
3 to < 10 TBD 10 to < 30 TBD
≥ 30 TBD
Note 10—Table 17 summarizes the Energy Ratio Test criteria recommended by the University of Florida.
Table 17. Summary of Indirect Tensile Energy Ratio Test Criteria States Traffic ESALs Criteria
Florida
<250,000 1.0 Min <500,000 1.3 Min
<1000,000 1.95 Min DSCEHMA 0.75 KJ/m3 Min
6.9. Indirect Tensile Fracture Energy Test (AASHTO Draft Procedure, NCHRP Research Report 843)
6.9.1. Specimen Conditioning and Aging—condition loose mix test samples for 4 hours at 135°C prior to compaction.
6.9.2. Test Temperature—select a test temperature of 20°C.
6.9.3. Test Criteria—compare the test results with the criteria given in Table 18 (Note 11).
Table 18. Indirect Tensile Fracture Energy Test Criteria Traffic Level, Million ESALs Criteria
3 to < 10 TBD 10 to < 30 TBD
≥ 30 TBD
Note 11—no test criteria has yet been established.
6.10. Overlay Test (Tex-248-F and NJDOT B-10)
6.10.1. Specimen Conditioning and Aging—condition loose mix test samples for 2 hours at compaction temperature for HMA and 4 hours at 135°C for WMA prior to compaction.
6.10.2. Test Temperature—select a test temperature of 25°C.
6.10.3. Test Criteria—compare the test results with the criteria given in Table 19 (Note 11).
Table 19. Overlay Test Criteria Traffic Level, Million ESALs Criteria
3 to < 10 TBD 10 to < 30 TBD
≥ 30 TBD
Note 12—Table 20 summarizes the OT criteria used by Texas DOT and New Jersey DOT.
Table 20. Summary of Overlay Test Criteria used by State DOTs States Binder/Mixture Types Criteria (cycles to failure)
New Jersey
High performance thin overlay Min. 600 cycles
Bituminous rich intermediate course Min. 700 cycles (mix design) Min. 650 cycles (production)
High recycled asphalt pavement surface mix, PG 64-22 Min. 150 cycles
High recycled asphalt pavement surface mix, PG 76-22 Min. 175 cycles
High cycled asphalt pavement intermediate and base mix, PG 64-22 Min. 100 cycles
High cycled asphalt pavement intermediate and base mix, PG 76-22 Min. 125 cycles
Texas
Porous friction course Min. 200 cycles Stone matrix asphalt Min. 200 cycles
Thin overlay mix Min. 300 cycles Hot in-place recycled mix Min. 150 cycles
6.11. Semi-Circular Bend Test at Intermediate Temperature (ASTM D8044)
6.11.1. Specimen Conditioning and Aging—age the compacted test specimens for 5 days at 85°C.
6.11.2. Test Temperature—25°C.
6.11.3. Test Criteria—compare the test results with the criteria given in Table 21 (Note 13).
Table 21. Semi-Circular Bend Intermediate Temperature Test Criteria
Traffic Level, Million ESALs Criteria 3 to < 10 TBD
10 to < 30 TBD ≥ 30 TBD
Note 13—The Louisiana Transportation Research Center currently requires a minimum SCB Jc value of 0.6 and 0.5 kJ/m2 for high traffic mix and medium/low traffic mix, respectively.
6.12. Semi-Circular Bend Test at Low Temperature (AASHTO TP 105)
6.12.1. Specimen Conditioning and Aging—condition loose mix test samples for 4 hours at 135°C prior to compaction.
6.12.2. Test Temperature—two test temperatures are recommended: 10°C above the PG lower limit of the asphalt binder used in the asphalt mixture, and 2°C below the PG lower limit.
6.12.3. Test Criteria—compare the test results with the criteria given in Table 22 (Note 14).
Table 22. SCB Low Temperature Test Criteria Traffic Level, Million ESALs Criteria
3 to < 10 TBD 10 to < 30 TBD
≥ 30 TBD
Note 14—no criteria has yet been established.
6.13. Uniaxial Thermal Stress and Strain Test (ASTM WK60626)
6.13.1. Specimen Conditioning and Aging—no specimen conditioning and aging procedure has been recommended.
6.13.2. Test Temperature—start at 20°C and then apply thermal loading at 10°C per hour through - 40°C.
6.13.3. Test Criteria—no criteria has yet been established for the coefficient of thermal contraction, fracture strength, fracture temperature, crack initiation stress, and UTSST resistance index results. However, the test data can be used to characterize the thermos-viscoelastic and thermal-volumetric properties of asphalt mixtures at various thermal transition zones, which are required to model thermal cracking in asphalt pavements and design thermal cracking resistance mixtures.
7. MOISTURE DAMAGE TESTS
7.1. Highway agencies should select one of the tests in this section.
7.2. Hamburg Wheel-Tracking Test (AASHTO T 324)—refer to section 5.4.
7.3. Indirect Tensile Strength Test (AASHTO T 283)
7.3.1. Specimen Conditioning and Aging—condition loose mix test samples for 2 hours at room temperature, followed by 16 hours at 60°C and then 2 hours at the compaction temperature prior to compaction.
7.3.2. Test Temperature—compare the test results with a minimum TSR criterion of 80% (Note 15).
Note 15—several highway agencies also require a minimum threshold of dry and/or wet IDT strength values in addition to TSR.
7.4. Moisture Induced Stress Tester (ASTM D7870)
7.4.1. Specimen Conditioning and Aging—no specimen conditioning and aging procedure has been recommended.
1.1.1. Test Temperature—select a test temperature of 60°C for mixtures containing binder high-temperature grades higher than 60. Select a temperature of 50°C for mixtures containing binder high-temperature grades lower than 60 and all WMA mixtures.
7.4.2. Test Criteria—no criteria has yet been established (Note 16).
Note 16—the test is commonly used as a moisture conditioning procedure for compacted asphalt mixture specimens that are subject to mechanical and tensile strength tests. The changes in the test results before and after the conditioning are then used to assess the mixture’s resistance to moisture damage.
9.1. Advanced Asphalt Technologies, LLC. NCHRP Report 673, A Manual for Design of Hot Mix Asphalt with Commentary. National Cooperative Highway Research Program Project 9-33, TRB, National Research Council, Washington, DC, 2011.
9.2. Bonaquist, R. NCHRP Report 691: Mix Design Practices for Warm Mix Asphalt. National Cooperative Highway Research Program Project 9-43, TRB, National Research Council, Washington, DC, 2011.
9.3. Illinois Department of Transportation. Illinois Flexibility Index Test - Pilot Projects. Springfield, Illinois: IDOT. Retrieved from http://www.idot.illinois.gov/Assets/uploads/files/Transportation-System/Bulletins-&-Circulars/Bureau-of-Local-Roads-and-Streets/Circular-Letters/Informational/CL2015-19.pdf (2015).
9.4. Washington State University, Pennsylvania State University-Altoona, and Louisiana Transportation Research Center. NCHRP Report 843: Long-Term Field Performance of Warm Mix Asphalt Technologies. National Cooperative Highway Research Program Project 9-49A, TRB, National Research Council, Washington, DC, 2017.
9.5. Romero, P. Using the Bending Beam Rheometer for Low Temperature Testing of Asphalt Mixtures. Utah Department of Transportation, Report No. UT-16.09, 2016.
AASHTO Designation: R xx-xx Technical Section: 2d, Proportioning of Asphalt–Aggregate Mixtures
1. SCOPE
1.1. This standard practice for mix design uses mixture properties to develop an asphalt mixture job mix formula. The mix design is based on mixture's volumetric properties and/or performance-based test results.
1.2. This standard practice may also be used to provide a preliminary selection of mix parameters as a starting point for performance prediction analyses.
1.3. This standard practice may involve hazardous materials, operations, and equipment. This standard practice does not purport to address all of the safety concerns, if any, associated with its use. It is the responsibility of the user of this procedure to establish appropriate safety and health practices and determine the applicability of regulatory limitations prior to use.
2. REFERENCED DOCUMENTS
2.1. AASHTO Standards: M 323, Superpave Volumetric Mix Design M XXX, Standard Specification for Balanced Mix Design R 35, Standard Practice for Superpave Volumetric Design for Asphalt Mixtures
2.2. Asphalt Institute Standard: SP-2, Superpave Mix Design
2.3. Other References: LTPP Seasonal Asphalt Concrete Pavement Temperature Models, LTPP Bind software,
http://www.ltppbind.com
3. TERMINOLOGY
3.1. air voids (Va)—the total volume of the small pockets of air between the coated aggregate particles throughout a compacted paving mixture, expressed as a percent of the bulk volume of the compacted paving mixture (Note 1). Note 1—Term defined in Asphalt Institute Manual SP-2, Superpave Mix Design.
3.2. balanced mix design (BMD)—asphalt mix design using performance tests on appropriately conditioned specimens that address multiple modes of distress taking into consideration mix aging, traffic, climate and location within the pavement structure (Note 2). Note 2—Term defined by the FHWA Expert Task Group on Mixtures and Construction in 2015.
3.3. binder content (Pb)—the percent by mass of binder in the total mixture, including binder and aggregate.
3.4. voids in the mineral aggregate (VMA)—the volume of the intergranular void space between the aggregate particles of a compacted paving mixture that includes the air voids and the effective binder content, expressed as a percent of the total volume of the specimen (Note 1).
4. SUMMARY OF THE PRACTICE
4.1. Optimal Balanced Mix Design Approaches
4.1.1. Approach A - Volumetric Design with Performance Verification. This approach starts with the current Superpave mix design method for determining an optimum asphalt binder content. The mixture is then tested with selected performance tests to assess its resistance to rutting, cracking, and moisture damage at the optimum binder content. If the mix design meets the performance test criteria, the JMF is established and production begins; otherwise, the entire mix design process is repeated using different materials (e.g., aggregates, asphalt binders, recycled materials, and additives) or mix proportions until all of the performance criteria are satisfied.
4.1.2. Approach B - Volumetric Design with Performance Optimization. This approach is an expanded version of Approach A. It also starts with the current Superpave mix design method for determining a preliminary asphalt binder content. Mixture performance tests are then conducted on the mix design at the preliminary binder content and two or more additional contents. The asphalt binder content that satisfies all of the cracking, rutting, and moisture damage criteria is finally identified as the optimum. In cases where a single binder content does not exist, the entire mix design process needs to be repeated using different materials (e.g., aggregates, asphalt binders, recycled materials, and additives) or mix proportions until all of the performance criteria are satisfied.
4.1.3. Approach C - Performance-Modified Volumetric Mix Design. This approach begins with the Superpave mix design method to establish a preliminary aggregate structure and binder content. The performance test results are then used to adjust either the preliminary binder content or mix component properties or proportions (e.g., aggregates, asphalt binders, recycled materials, and additives) until the performance criteria are satisfied. For this approach, the final design is primarily focused on meeting performance test criteria and may not be required to meet all of the Superpave volumetric criteria.
4.1.4. Approach D - Performance Design. This approach establishes and adjusts mixture components and proportions based on performance analysis with limited or no requirements for volumetric properties. Minimum requirements may be set for asphalt binder and aggregate properties. Once the laboratory test results meet the performance criteria, the mixture volumetrics maybe checked for use in production.
5. SIGNIFICANCE AND USE
5.1. The procedure described in this standard practice is used to produce asphalt mixtures that satisfy balanced mix design requirements.
6. VOLUMETRIC DESIGN WITH PERFORMANCE VERIFICATION
6.1. Select the optimum asphalt binder content and volumetric properties in accordance to AASHTO R35, Section 6 to Section 10, or use an existing approved mix design.
6.2. Select one rutting test and one cracking test from AASHTO Mxxx, Section 5 and Section 6, respectively.
6.3. Check the mix design at the optimum binder content for rutting and cracking resistance.
6.4. If the rutting and cracking test results satisfy the corresponding performance criteria in AASHTO Mxxx, Section 5 and Section 6, proceed to Section 6.5; otherwise, return to Section 6.1 and repeat the mix design process using different materials (e.g., aggregates, asphalt binders, recycled materials, and additives) or mix proportions.
6.5. Select one moisture damage test from AASHTO Mxxx, Section 7, and evaluate the mix design for moisture susceptibility.
6.6. If the moisture damage test results satisfy the corresponding performance criteria in AASHTO Mxxx, Section 7, establish the job mix formula; otherwise, take remedial action such as the use of antistrip agents to improve the moisture susceptibility of the mix and retest the mix to assure compliance with the same performance criteria.
7. VOLUMETRIC DESIGN WITH PERFORMANCE OPTIMIZATION
7.1. Select a preliminary optimum asphalt binder content and volumetric properties in accordance to AASHTO R35, Section 6 to Section 10, or use an existing approved mix design.
7.2. Select one rutting test and one cracking test from AASHTO Mxxx, Section 5 and Section 6, respectively.
7.3. Conduct the rutting and cracking tests at the preliminary optimum binder content determined in Section 7.1 and two or more additional contents at intervals of 0.25 to 0.5% that bracket the preliminary optimum binder content.
7.4. Determine the optimum asphalt binder content that satisfies both the rutting and cracking criteria in AASHTO Mxxx, Section 5 and Section 6. In cases where a single binder content does not satisfy all criteria, return to Section 7.1 and repeat the mix design process using different materials (e.g., aggregates, asphalt binders, recycled materials, and additives) or mix proportions.
7.5. Select one moisture damage test from AASHTO Mxxx, Section 7, and evaluate the mix design for moisture susceptibility.
7.6. If the moisture damage test results satisfy the corresponding performance criteria in AASHTO Mxxx, Section 7, establish the job mix formula; otherwise, take remedial action such as the use of antistrip agents to improve the moisture susceptibility of the mix and retest the mix to assure compliance with the same performance criteria.
8.1. Determine a preliminary aggregate structure and binder content in accordance to AASHTO R35, Section 6 to Section 9.
8.2. Select one rutting test and one cracking test from AASHTO Mxxx, Section 5 and Section 6, respectively.
8.3. Check the mix design at the preliminary aggregate structure and binder content for rutting and cracking resistance.
8.4. If the mix design satisfies the performance criteria in AASHTO Mxxx, Section 5 and Section 6, proceed to Section 8.5; otherwise, adjust the preliminary binder content or use different mix component properties or proportions (e.g., aggregates, asphalt binders, recycled materials, and additives) and then repeat Section 8.3 until the performance criteria are satisfied.
8.5. Select one moisture damage test from AASHTO Mxxx, Section 7, and evaluate the mix design for moisture susceptibility.
8.6. If the moisture damage test results satisfy the corresponding performance criteria in AASHTO Mxxx, Section 7, proceed to Section 8.7; otherwise, take remedial action such as the use of antistrip agents to improve the moisture susceptibility of the mix and retest the mix to assure compliance with the same performance criteria.
8.7. Check and report the volumetric properties of the mix design at the optimum binder content (Note 3). Note 3—highway agencies should decide which existing volumetric criteria could be relaxed or eliminated without sacrificing mixture performance.
9.1. Consider using LTPP Bind software to select the appropriate asphalt binder grade for the mixture.
9.2. Consider using an aggregate gradation conforming to Table 4 in AASHTO M323.
9.3. Select three or more design binder contents at intervals of 0.25 to 0.5%.
9.4. Select one rutting test and one cracking test from AASHTO Mxxx, Section 5 and Section 6, respectively.
9.5. Conduct the rutting and cracking tests at the selected aggregate structure and binder contents.
9.6. Determine the optimum asphalt binder content that satisfies both the rutting and cracking criteria in AASHTO Mxxx, Section 5 and Section 6. In cases where a single binder content does not
satisfy all criteria, repeat Section 9.5 using different mix component properties or proportions (e.g., aggregates, asphalt binders, recycled materials, and additives).
9.7. Select one moisture damage test from AASHTO Mxxx, Section 7, and evaluate the mix design for moisture susceptibility.
9.8. If the moisture damage test results satisfy the corresponding performance criteria in AASHTO Mxxx, Section 7, proceed to Section 9.9; otherwise, take remedial action such as the use of antistrip agents to improve the moisture susceptibility of the mix and retest the mix to assure compliance with the same performance criteria.
9.9. Check and report the volumetric properties of the mix design at the optimum binder content (Note 3).
10. REPORT
10.1. The report shall include the identification of the project number, traffic level, and mix design number.
10.2. The report shall include information on the design aggregate structure including the source of aggregate, kind of aggregate, required quality characteristics, and gradation.
10.3. The report shall contain information about the design binder including the source of binder and the performance grade.
10.4. The report shall contain information about the design asphalt mixture including selected laboratory performance tests, optimum asphalt binder content, volumetric properties with specifications, and performance test results and criteria.
Laboratory Aging Protocols for Assessing the Cracking Resistance of Asphalt Mixtures....................... B-3
Validation of Laboratory Tests for Reflection Cracking .......................................................................... B-6
Further Validation of Laboratory Tests for Top-Down Cracking ............................................................. B-8
Validation of Moisture Damage Susceptibility Tests ............................................................................. B-10
Refinement of AASHTO T324, the Hamburg Wheel Tracking Test ..................................................... B-12
Establishing Precision Estimates for AASHTO T 340, Asphalt Pavement Analyzer ............................ B-14
Validation of Laboratory Tests for Fatigue Cracking ............................................................................. B-15
Sensitivity of Thermal Cracking Tests to Mix Design Variables ........................................................... B-17
Establishing Precision Estimates for AASHTO TP 105, Low-Temperature Semi-Circular Bending (SCB) Test .......................................................................................................................................................... B-20
NCHRP Project 20-07/Task 406
B-3
Laboratory Aging Protocols for Assessing the Cracking Resistance of Asphalt Mixtures
Background / Description
Cracking is a primary form of asphalt pavement distress often controlling the service lives of highway projects. Cracking of surface layers is significantly affected by aging of the asphalt binder over time. However, asphalt binders age at different rates depending on their chemical composition, climate, and depth in the pavement structure. Several research studies have been critical of the current long-term aging protocol in AASHTO R30 that recommends aging compacted specimens for 5 days at 85°C prior to mixture performance testing.
The ongoing NCHRP 9-54 project has recommended loose mix aging at 95°C for a period of time based on climate, depth, and years of service. For surface layers with four years of service, aging time using this protocol ranges from 72 to 120 hours for most of the continental U.S. Although the loose mix aging protocol seems to be a better approach to simulate the long-term aging of asphalt mixtures, the recommended times are not practical for use in routine projects. The selection of 95°C for oven aging was based on laboratory test results showing that aging at 135°C reduces the dynamic modulus and fatigue resistance of asphalt mixtures, and literature that indicates chemical changes occurring in some binders at temperatures above 100°C due to disruption of polar molecular associations and sulfoxide decomposition. However, it is important to mention that the sensitivity of sulfoxides to thermal decomposition is not identical for all asphalt binders. Furthermore, existing literature recognizes the importance of asphalt component compatibility (i.e., dispersion of micellar components) on its oxidative age hardening behavior. Certain asphalt binders are more chemically reactive and less susceptible to aging due to a greater extent of solubilization and/or dispersion of the oxidation products. These findings are of major importance to asphalt oxidative age hardening and highlight the risk of using loose mix aging at 95°C to simulate field aging because asphalt binders have different chemical compositions and physicochemical states (i.e., degree of molecular association and immobilization). In addition, the NCHRP 9-54 project only evaluated three asphalt binders with different chemistries (i.e., one binder with low sulfur content, one binder with high sulfur content, and one polymer modified binder) in the experiment to select the laboratory aging temperature, which is not sufficient to reach a comprehensive conclusion considering the wide variety of aging behaviors of asphalt binders from different crude sources and refining processes. It is worth noting that some asphalt binders may not exhibit significantly different aging behavior over a fairly wide temperature range, while others exhibit significant differences.
For assessing the cracking resistance of asphalt mixtures as part of mix design and during mixture production, the goal of the laboratory aging should be to simulate properties that exist in-situ when cracking begins to develop. Therefore, accelerated oxidative aging in laboratory always involves a tradeoff when considering the potential adverse effects caused by the selected testing conditions. Moreover, it is important to consider that the oxidation process can only explain part of the changes observed in the rheological properties of asphalts, since it is the interactions of some oxidation products with each other and with other polar groups in asphalt that lead to large changes in physical properties and affect the overall pavement service life. In this situation, the binder oxidation kinetics may not be fully simulated at either lower or higher aging temperatures and some
NCHRP Project 20-07/Task 406
B-4
sacrifice of precision may be acceptable in the interest of expediency. In addition, for cracking tests conducted for mix design and production testing, it is more desirable to use laboratory aging protocols that are faster to execute due to the limited time window.
Objective To develop practical protocols for laboratory aging of asphalt mixtures to prepare specimens for cracking tests used for mix design and quality assurance testing that considers the location of asphalt mixtures in the pavement structure and the amount of time in service at which cracking is likely to initiate.
Potential Benefits
Improved methods are needed to properly assess the cracking resistance of asphalt mixtures as their component materials become more complex and innovative modifiers are introduced. A critical step toward implementation of better methods for the design and field acceptance of asphalt mixtures is the preparation of specimens to represent the conditions at which distresses begin to develop.
Related Research
NCHRP Report 815 confirmed that two hours of loose mixture conditioning at the anticipated compaction temperature was appropriate for simulating the effects of plant mixing and storage to the point of loading in haul trucks. The study also concluded that the long-term aging protocol per AASHTO R30 was only able to simulate two or three years of field aging.
Research studies by the University of New Mexico and Mississippi State University concluded that the long-term aging protocol per AASHTO R30 was representative of no more than one year of field aging.
NCHRP Report 871 recommended loose mix aging at 95°C and developed a series of laboratory aging duration maps to match 4, 8, and 16 years of field aging at various depths below the pavement surface.
Proposed Tasks 1. Review literature and survey industry and state highway agencies to identify specific asphalts and additives with a range of aging susceptibilities. Identify existing pavements with appropriate service life from a wide range of geographic areas. Pavements must have as-produced material available and pavement distress data at regular intervals. Candidate project sites may include the LTPP program, MnROAD, NCAT test track, and other field sections documented in published research studies.
2. Leverage existing research to propose alternative mixture aging protocols, appropriate asphalt binder tests to assess changes in both chemical and rheological properties with in-situ and accelerated laboratory aging, and practical mixture tests to assess the potential for all modes of cracking. Potential aging protocols for evaluation include: (a) loose mix aging over a wide range of temperatures from 100 to 130°C, and (b) accelerated pavement weathering systems that simulates cyclic actions of thermal oxidation, ultraviolet radiation, and moisture infiltration and diffusion.
3. Develop and execute an experimental plan to develop or validate relationships between in-situ aging and laboratory aging protocols.
4. Develop appropriate mixture aging protocols in the format of an AASHTO standard practice for mixtures used in different layers of a pavement structure.
5. Assess risks associated with the use of the proposed accelerated aging protocols as part of mix design approval and quality assurance.
Implementation The anticipated product from this research is a draft mixture aging protocol following an AASHTO standard practice format. The users of this product will be
NCHRP Project 20-07/Task 406
B-5
highway agencies who specify performance tests for mix design and quality assurance and contractors engaged in the design and construction of asphalt pavements. The likelihood of successful implementation will depend on the practicality of how well the protocol can be used in routine testing.
Relevance Aging is a primary factor in the cracking resistance of asphalt pavements. As asphalt binder markets continue to change, more recycled products are incorporated into mixtures, and new additives are introduced, it becomes more critical to consider aging within mix design and quality assurance testing. Therefore, a practical aging protocol is needed for preparing mixture samples for routine testing and analysis.
Estimated Funding
$800,000
Estimated Research Period
48 Months
RNS Developer NCAT staff
Source Info: • Kim, Y.R., S. Underwood, and M.J. Farrar (2017) NCHRP Report 871 Pre-Publication Draft, Long-Term Aging of Asphalt Mixtures for Performance Testing and Prediction, The National Academies of Science, Engineering, and Medicine.
• Newcomb, D. et al (2016) NCHRP Report 815 Short-Term Laboratory Conditioning of Asphalt Mixtures, The National Academies of Science, Engineering, and Medicine.
• Chen, C. et al (2018) Selecting a Laboratory Loose Mix Aging Protocol for the NCAT Top-Down Cracking Experiment, accepted for publication in Transportation Research Record.
• Islam, M. R., Hossain, M. I., & Tarefder, R. A. (2015). A study of asphalt aging using Indirect Tensile Strength test. Construction and Building Materials, 95, 218-223.
• Howard, I. L., & Doyle, J. D. (2015). Durability Indexes via Cantabro Testing for Unaged, Laboratory-Conditioned, and One-Year Outdoor-Aged Asphalt Concrete. In Transportation Research Board 94th Annual Meeting (No. 15-1366).
Date Developed: March 9, 2018
NCHRP Project 20-07/Task 406
B-6
Validation of Laboratory Tests for Reflection Cracking
Background / Description
Reflection cracking is a common form of distress that occurs in overlays at cracks or joints in the underlying pavement. Reflection cracks are caused by the concentration of high tensile strain and/or shear strains at the interface over the discontinuity in the underlying pavement. The rate at which reflection cracking develops is affected by the thickness of the overlay, the flexibility of the overlay mixture, and magnitude of the strains in the overlay caused by the underlying joint or crack. Reflection cracking is a costly distress because it reduces the service life of the overlay.
Objective To establish relationships between candidate laboratory cracking test results and measured reflection cracking of actual pavements so that specification criteria can be established for the lab tests.
Potential Benefits
Validated reflection cracking tests and criteria for use in mix design and quality assurance will result in longer-lasting, better performing pavements by ensuring that appropriate mixtures are used in asphalt overlays over concrete pavements or asphalt pavements with existing cracks.
The use of mixture performance tests will enable mix designers to be more innovative in the selection and proportioning of materials to meet the test criteria.
The experiment will also be useful for validating the reflection cracking performance model in the AASHTOWare Pavement ME Design.
Related Research
Ongoing MnROAD NRRA reflection cracking experiment has only one climate, one underlying pavement type (PCC), and includes sections with single and multiple lifts of asphalt. Thus it has limited potential for validating reflection cracking tests.
Proposed Tasks 1. Design experiment: multiple sites in different regions of the country, asphalt overlays on concrete and asphalt pavements, 5 to 10 test sections per site. Test sites may be open-access highways given the low risk to public.
2. Construct test sections to high level of control. 3. Sample mixtures and conduct reflection cracking tests including OT, DCT,
IFIT, and ICT. 4. Monitor and collect traffic data, environmental data, and surface distress
performance. 5. Analyze and summarize results, establish correlations, make recommendations
for appropriate criteria for use in specifications. Implementation Target audience: asphalt producers and contractors, highway agencies, consulting
engineers, and researchers that are interested in performance-based asphalt mixture design and the state of the practice for balance mix design.
Products: Tests and specification criteria for use in mix design and quality assurance.
Likelihood of success: high potential for implementation especially on paving projects with large production volumes and design-build projects.
Barriers: Cost of the experiment.
NCHRP Project 20-07/Task 406
B-7
Relevance The industry needs a timely, repeatable, performance test(s) to assess mixtures for resistance to reflection cracking. Without a validated performance-based test, the industry will not be able to improve performance of pavements or utilize innovative mix designs.
Estimated Funding
$300,000 per site, assuming 8 sections per site, and five years of performance monitoring. At least four sites per underlying pavement type are recommended. $2.4 million total.
Estimated Research Period
6 years
RNS Developer NCAT staff
Source Info: • Zhou, F., & Scullion, T. (2005). Overlay tester: a rapid performance related crack resistance test (Vol. 7). Texas Transportation Institute, Texas A & M University System.
• Zhou, F., Hu, S., & Scullion, T. (2006). Integrated Asphalt (Overlay) Mix Design with Balancing Rutting and Cracking Requirements. Report FHWA/TX-06/0-5123-1. FHWA, Texas A&M Transportation Institute, College Station.
• Walubita, L.F., Faruk, A.N., Das, G., Tanvir, H.A., Zhang, J. and Scullion, T., 2012. The overlay tester: A sensitivity study to improve repeatability and minimize variability in the test results. Project Report: FHWA/TX-12/0-6607-1, Federal Highway Administration, Washington DC.
• Garcia, V., Abdallah, I., and Nazarian, S., 2018. Verification of Cracking Properties of Asphalt Concrete Pavements with Overlay Tester. Transportation Research Board Annual Meeting.
• Al-Qadi, I.L., Lippert, D., Wu, S., Ozer, H., Renshaw, G., Murphy, T.R., Butt, A., Gundapuneni, S., Trepanier, J.S., Vespa, J.W., Said, I.M., Espinoza Luque, A.F., Safi, F.R., 2017. Utilizing Lab Tests to Predict Asphalt Overlay Performance. Illinois Center for Transportation. Report No. FHWA-ICT-17-020.
• NRRA Road Research. http://www.dot.state.mn.us/mnroad/nrra/index.html, accessed on March 19, 2018.
Date Developed:
March 19, 2018
NCHRP Project 20-07/Task 406
B-8
Further Validation of Laboratory Tests for Top-Down Cracking
Background / Description
Top-down cracking is a common form of asphalt pavement distress caused by high tensile and shear stresses occurring at the pavement surface at or near the contact area of truck tires. The initiation and propagation of top down cracking is affected by age hardening of the asphalt binder in the surface layer. Top down cracking may lead to loss of pavement smoothness and further deterioration of the pavement by allowing water and oxygen to penetrate into the structure ultimately causing reduced service lives.
Several cracking tests have been proposed for evaluating top-down cracking. Further research is needed to establish relationships between the results of these tests and actual top-down cracking for pavements in different climates. These lab-to field relationships are essential for setting criteria that can be used in balanced mix design and associated quality assurance testing.
Objective To establish relationships between laboratory cracking test results and measured and validated top-down cracking of actual pavements so that appropriate specification criteria can be established for the lab tests.
Potential Benefits
Validated cracking tests and criteria for use in mix design and quality assurance will result in longer-lasting, better performing pavements by ensuring that appropriate mixtures are used in asphalt pavement construction.
The use of mixture performance tests will enable mix designers to be more innovative in the selection and proportioning of materials to meet the test criteria.
Related Research
The ongoing NCAT Cracking Group experiment is designed to validate top-down cracking in one climate under heavy truck traffic.
Proposed Tasks 1. Design experiment: identify project sites with different climates and traffic; 5 to 10 test sections per site. Each project site must have a uniform underlying pavement structure free of distresses so that only the surface layer will be subject to damage.
2. Design pavement structures and mixtures for each site 3. Construct test sections to high level of control 4. Sample mixtures and conduct mixture cracking tests 5. Monitor and collect traffic data, environmental data, response data, and surface
performance. Cut cores when cracks are evident to verify they are only top down cracks. Recover and analyze the asphalt binders.
6. Analyze and summarize results, establish correlations, make recommendations for appropriate criteria for use in specifications.
Implementation Target audience: asphalt producers and contractors, highway agencies, consulting engineers, and researchers that are interested in performance-based asphalt mixture design and the state of the practice for balance mix design.
Products: Tests and specification criteria for use in mix design and quality assurance.
Likelihood of success: very high potential for implementation.
Barriers: Cost of the experiment.
NCHRP Project 20-07/Task 406
B-9
Relevance The industry needs a timely, repeatable, performance test to assess mixtures for resistance to top-down cracking. Without a properly validated test for top-down cracking, improvements in pavement performance and innovations in mix designs will be stymied.
Estimated Funding
$300,000 per site assuming eight sections per site and that the sites are on public roadways where the costs to construct and monitor the test sections is covered by the highway owners. Assuming four additional sites located in a Mid-Atlantic state, a Midwestern state, a Southwestern state, and a Pacific Coast state, the total cost is $1,200,000.
Estimated Research Period
60 Months
RNS Developer NCAT staff
Source Info: • Roque, R., Birgisson, B., Drakos, C., and B. Dietrich. (2004). “Development and Field Evaluation of Energy-Based Criteria for Top-Down Cracking Performance of Hot Mix Asphalt.” Journal of the Association of Asphalt Paving Technologists, 73, pp. 229–260.
• Timm, D.H., G.A. Scholar, J. Kim, and J.R. Willis (2009). Forensic Investigation and Validation of Energy Ratio Concept. Transportation Research Record: Journal of the Transportation Research Board, No. 2127, pp.43-51.
• NCHRP 09-57A [RFP]. Field validation of laboratory tests to assess cracking resistance of asphalt mixtures. http://apps.trb.org/cmsfeed/TRBNetProjectDisplay.asp?ProjectID=447, accessed on January 19, 2018.
• Ma, W., N. H. Tran, A. Taylor, J. R. Willis, and M. Robbins (2015), Comparison of Laboratory Cracking Test Results and Field Performance, Association of Asphalt Paving Technologists, 2015.
• Zhou F., Im S., Hu S., Newcomb D., & Scullion T., Selection and preliminary evaluation of laboratory cracking tests for routine asphalt mix designs. Road Materials and Pavement Design. Volume 18, 2017 - Issue sup1.
• Pfeifer, B. 2018. Illinois Department of Transportation’s Practices for Balanced Mix Design. TRB Workshop 124, Balanced Asphalt Mixture Design: Implementation Efforts and Success Stories.
Date Developed:
April 2018
NCHRP Project 20-07/Task 406
B-10
Validation of Moisture Damage Susceptibility Tests
Background / Description
Moisture damage is a major form of distress for asphalt pavements caused by the loss of adhesion between the asphalt and aggregate (stripping) and the loss of cohesion within the asphalt binder in the presence of water. There are a number of factors that influence the moisture susceptibility of asphalt mixtures, including asphalt binder and aggregate characteristics, additives, mixture permeability and environmental factors.
The two tests currently used to assess the moisture susceptibility of asphalt mixtures, AASHTO T 283, commonly known as the Tensile Strength Ratio (TSR) test, and AASHTO T 324, commonly known as the Hamburg wheel tracking test, have not been properly validated. Several studies have reported that both tests may not reliably predict the moisture susceptibility of some asphalt mixtures. Many highway agencies do not know which test is the best to protect against the risk of pavement failure due to moisture damage or what criteria to use for their selected method.
Objective To build and monitor a series of test sections with a range of predicted moisture susceptibilities so that relationships can be established between moisture damage tests results and actual moisture susceptibility of asphalt pavements. The results will indicate which of the tests methods is most reliable and help establish appropriate specification criteria for the lab tests.
Potential Benefits
Validated moisture tests and criteria to refine current mix design and quality assurance will result better performing pavements.
Related Research
Moisture Damage to Hot-Mix Asphalt Mixtures, Synopsis of a Workshop, Transportation Research Circular Number E-C198, January 2012.
Moisture Sensitivity of Asphalt Pavements, A National Seminar, Transportation Research Board, 2003. (see gaps identified on p. 336)
Proposed Tasks 1. Design experiments including multiple sites to encompass a range of materials and environments. The use of accelerated pavement testing facilities would allow for controlled testing conditions, utilize a variety of mixtures, avoid risks to the public due to expected failures of test sections, and facilitate detailed forensic analyses.
2. Select mixtures for each site with a range of moisture susceptibilities. 3. Construct test sections with regionally selected asphalt mixtures having a range
of predicted moisture susceptibilities. 4. Sample mixtures and conduct mixture performance tests (TSR and Hamburg) 5. Monitor and collect traffic/load data, environmental data, and performance data
using destructive and nondestructive testing. 6. Analyze and summarize results, establish correlations, and make
recommendations for appropriate criteria for use in specifications. Implementation Target audience: Asphalt producers and contractors, highway agencies, consulting
engineers, and researchers that are interested in performance-based asphalt mixture design.
Products: Specification criteria for use in mix design and quality assurance.
NCHRP Project 20-07/Task 406
B-11
Likelihood of success: high potential for implementation especially on paving projects with large production volumes and design-build projects.
Barriers: Cost of the experiments.
Relevance Validated moisture susceptibility tests will reduce the risk of accepting mixtures that fail due to moisture damage causing costly pavement reconstruction. Validated performance-based tests will enable the use of innovative materials and mix designs.
Estimated Funding
Preliminary estimates were obtained from ALF and HVS facilities in Louisiana, Texas, California, and Costa Rica. Estimates to build and test four test sections for a moisture damage experiment ranged from $200,000 to $360,000. Assuming four facilities were used in the project, the total estimate is $1.25 million.
Estimated Research Period
24 Months
RNS Developer NCAT staff
Source Info: • Jones, D., R. Wu, B. Tsai, and J. Harvey, Warm-Mix Asphalt Study: First Level Analysis of Phase 2 HVS and Laboratory Testing, and Phase 1 and Phase 2 Forensic Assessments, Research Report UVPRC-RR-2009-02, University of California pavement Research Center, 2009.
• Kandhal, Moisture Susceptibility of HMA Mixes: Identification of Problem and Recommended Solutions NCAT Report 92-01, 1992.
• Kiggundu, B. M., and F. L. Roberts. 1988. Stripping in HMA Mixtures: State of the Art and Critical Review of Test Methods. NCAT Report 88‐02.
• Kiggundu, B. M., and F. L. Roberts. 1988. The Success/Failure of Methods Used to Predict the Stripping Potential in the Performance of Bituminous Pavement Mixtures. NCAT Report 88‐03.
Date Developed:
April 2018
NCHRP Project 20-07/Task 406
B-12
Refinement of AASHTO T324, the Hamburg Wheel Tracking Test
Background / Description
The Hamburg Wheel Tracking Test (HWTT) is widely used to evaluate the resistance of asphalt mixtures to rutting and moisture damage. As of 2017, ten state Departments of Transportation (DOTs) have implemented HWTT as a mixture performance test in their mix design specifications. However, the HWTT procedure described in AASHTO T 324 has several limitations. For example, the procedure does not provide an explicit instruction on the selection of test temperature. As a result, some tests may not be performed at an appropriate temperature for the climate where the mixture is to be used. In addition, the method could be improved to more objectively establish test parameters for rutting and stripping so that these two distress mechanisms can be assessed independently. The validity of the rutting parameter (i.e., maximum rut depth) has been questioned due to the lack of separation of rut depth caused by stripping. A standardized method to determine test parameters of creep slope, stripping slope, and stripping inflection point (SIP) has not been established. Currently, there are six different methods available and they do not always yield comparable results. Finally, the HWTT precision estimates developed in NCHRP Project 10-87 only considered the device from one vendor; thus, additional research is needed to review the applicability of these estimates to devices from additional vendors and, if necessary, make changes.
Objectives 1. Establish a guideline for selecting test temperature based on the predicted design pavement temperature from the LTPP Binder software;
2. Review and, if necessary, revise the precision statements; 3. Establish a standardized analysis method to determine creep slope, stripping
slope, and SIP or alternative parameters; and 4. Evaluate the validity of the existing precision estimates and if necessary conduct
an experiment to establish new precision information. Potential Benefits
Refining the HWTT procedure will help advance its implementation into routine practice for balanced mix design and quality assurance testing.
Related Research
Texas Transportation Institute conducted a study that established and analyzed TxDOT’s HWTT database.
Iowa DOT conducted a study that evaluated bias in the HWTT results.
Texas Transportation Institute conducted NCHRP Project 09-49 that developed a novel HWTT analysis method for moisture susceptibility and rutting evaluation.
Louisiana Transportation Research Center conducted NCHRP Project 20-07/Task 361 that documented HWTT equipment requirements and improvements to AASHTO T 324.
Tasks Establish a comprehensive HWTT database by aggregating available test results from state and local highway agencies, asphalt contractors, and research organizations;
Perform database analysis to review, and if necessary, revise the precision estimates of HWTT results,
Establish a standardized analysis method to objectively determine creep slope, stripping slope, and SIP, or alternate test parameters;
NCHRP Project 20-07/Task 406
B-13
Conduct a laboratory experiment to identify the effect of test temperature on HWTT results and establish a guideline for the selection of test temperature; and
Document proposed revisions and improvements to AASHTO T 324.
Implementation Target audience: highway agencies, asphalt contractors, and researchers that are interested in the use of HWTT in balanced mix design and performance-based specifications of asphalt mixtures.
Products: a guideline for the selection of test temperature, precision and bias statements, alternate analysis methodology and potential test parameters.
Likelihood of success: high potential to success.
Barriers: limited availability of field projects with rutting and moisture damage issues to validate HWTT test parameters.
Relevance HWTT is a performance-based test procedure with the potential of evaluating the rutting resistance and moisture susceptibility of asphalt mixtures. Without a robust and validated HWTT test procedure, mix designers will not be able to reply on the test to improve the performance of asphalt pavements or utilize innovative materials and technologies in mix designs.
Estimated Funding
$250,000
Estimated Research Period
18 months
RNS Developer NCAT staff
Source Info: • Yildirim, Y., Jayawickrama, P. W., Hossain, M. S., Alhabshi, A., Yildirim, C., Smit, A. D. F., & Little, D. (2007). Hamburg wheel-tracking database analysis. Texas Department of Transportation and Federal Highway Administration, FHWA/TX-05/0-1707-7.
• Schram, S., & Williams, R. C. (2012). Evaluation of Bias in the Hamburg Wheel Tracking Device. Iowa Department of Transportation.
• Azari, H. (2014). Precision Estimates of AASHTO T324, “Hamburg Wheel-Track Testing of Compacted Hot Mix Asphalt (HMA)” (No. NCHRP Project 10-87, Task Order# 2B).
• Yin, F., Arambula, E., Lytton, R., Martin, A., & Cucalon, L. (2014). Novel method for moisture susceptibility and rutting evaluation using Hamburg wheel tracking test. Transportation Research Record: Journal of the Transportation Research Board, (2446), 1-7.
• Mohammad, L. N., Elseifi, M. A., Raghavendra, A., & Ye, M. (2015). Hamburg Wheel-Track Test Equipment Requirements and Improvements to AASHTO T 324 (No. NCHRP Project 20-07/Task 361).
Date Developed:
May 2018
NCHRP Project 20-07/Task 406
B-14
Establishing Precision Estimates for AASHTO T 340, Asphalt Pavement Analyzer
Background / Description
The Asphalt Pavement Analyzer (APA) has been used extensively by state departments of transportation and industry to assess rutting susceptibility of asphalt mixtures. Although AASHTO T 340 describes the procedure for testing, there is no information on the precision and bias of the test method. There is a need to develop precision estimates based on a comprehensive experimental design.
Objective Conduct an inter-laboratory studies to develop precision and bias statement for APA test. The experimental plan must include a range of materials/mixtures that take into consideration differences in climates and current mix design practices (i.e. range of NMAS, recycled materials, and additives).
Potential Benefits
In order to use APA results for balance mix design and approval and/or acceptance, it is necessary to establish the method’s precision and bias information. Precision and bias estimates based on a well prepared and executed experimental plan will facilitate further acceptance and implementation.
Related Research
In 2014, the AASHTO Advanced Pavement Research Laboratory completed a study to develop precision statements for AASHTO T 324.
Tasks Identify materials and mixtures for interlaboratory study (ILS);
Design and conduct the ILS per ASTM E 691; and
Develop precision estimates of AASHTO T 340.
Implementation Target Audience: State agencies and contractors currently using APA or in the process of implementation of Balance Mix Design.
Relevance Agencies currently using APA or considering its implementation need to understand the variability associated with the test procedure before the test is used in a specification for mix design or acceptance.
Estimated Funding
$100,000
Estimated Research Period
12 months
RNS Developer NCAT staff
Source Info: • Kandhal, P.S., and Rajib B. Mallick, “Evaluation of Pavement Analyzer for HMA Mix Design”, NCAT Report No. 99-4, Auburn, Alabama, June, 1999.
• Kandhal, P. S and L.A Cooley, Jr, NCHRP Report 508: Accelerated Laboratory Rutting Tests: Evaluation of the Asphalt Pavement Analyzer. Transportation Research Board, 2003.
• Buchanan, S., T. White and B. J. Smith, Use of Asphalt Pavement Analyzer to Study In-Service Asphalt Mixture Performance. FHWA/MS-DOT-RD-04-155, 2004.
• West, R.C. “A Ruggedness Study of the Asphalt Pavement Analyzer Rutting Test.” Memorandum to the Asphalt Pavement Analyzer User Group and New APA Owners, May 14, 1999.
Date Developed:
March 2018
NCHRP Project 20-07/Task 406
B-15
Validation of Laboratory Tests for Fatigue Cracking
Background / Description
Fatigue cracking is a common form of distress caused by accumulated damage from high tensile strains that occur at the bottom of an asphalt pavement. Fatigue cracking is a costly distress to remedy because the damage occurs deep in the pavement structure. Consequently, highway agencies frequently are unable to feasibly address the problem and utilize rehabilitation methods that only temporarily cover the distress, leading to reduced service lives.
Objective To establish relationships between candidate laboratory fatigue test results and measured fatigue cracking of actual pavements so that specification criteria can be established for the lab test(s).
Potential Benefits
Validated cracking tests and criteria for use in mix design and quality assurance will result in longer-lasting, better performing pavements by ensuring that appropriate mixtures are used in asphalt pavement construction.
The use of mixture performance tests will enable mix designers to be more innovative in the selection and proportioning of materials to meet the test criteria.
The experiment will also be useful for validating mechanistic-based pavement design programs (e.g. MEPDG, Flexpave, PerRoad)
Related Research
Pending NCHRP 09 - 57A is intended to establish precision statistics for selected mixture performance tests.
Ongoing NCAT Cracking Group experiment is designed to validate top-down cracking.
Ongoing MnROAD Cracking Group experiment is designed to validate thermal cracking.
Ongoing MnROAD NRRA experiment is designed to validate reflection cracking.
Proposed Tasks 1. Design experiment: multiple sites, 5 to 10 test sections per site 2. Design pavement structures and mixtures for each site 3. Instrument and construct test sections to high level of control 4. Sample mixtures and conduct mixture performance tests (specifically fatigue
tests) 5. Monitor and collect traffic data, environmental data, response data, and surface
performance 6. Analyze and summarize results, establish correlations, make recommendations
for appropriate criteria for use in specifications. Implementation Target audience: asphalt producers and contractors, highway agencies, consulting
engineers, and researchers that are interested in performance-based asphalt mixture design and the state of the practice for balance mix design.
Products: Tests and specification criteria for use in mix design and quality assurance.
Likelihood of success: high potential for implementation especially on paving projects with large production volumes and design-build projects.
Barriers: Cost of the experiment.
NCHRP Project 20-07/Task 406
B-16
Relevance The industry needs a timely, repeatable, performance tests to assess mixtures for resistance to bottom-up fatigue cracking. Without a validated performance-based test, we will not be able to improve performance of pavements or utilize innovative mix designs.
Estimated Funding
$ 5 million per site on high-speed, accelerated pavement testing facilities such as MnROAD or NCAT Test Track. The disadvantage of using a regular highway project is that the test sections must be allowed to “fail” to generate the needed data. Failed pavement sections are political liability on public highways.
Estimated Research Period
60 Months
RNS Developer NCAT staff
Source Info: • NCHRP 09-57A [RFP]. Field validation of laboratory tests to assess cracking resistance of asphalt mixtures. http://apps.trb.org/cmsfeed/TRBNetProjectDisplay.asp?ProjectID=447, accessed on January 19, 2018.
• Ma, W., N. H. Tran, A. Taylor, J. R. Willis, and M. Robbins (2015), Comparison of Laboratory Cracking Test Results and Field Performance, Association of Asphalt Paving Technologists, 2015.
• Zhou F., Im S., Hu S., Newcomb D., & Scullion T., Selection and preliminary evaluation of laboratory cracking tests for routine asphalt mix designs. Road Materials and Pavement Design. Volume 18, 2017 - Issue sup1.
• Pfeifer, B. 2018. Illinois Department of Transportation’s Practices for Balanced Mix Design. TRB Workshop 124, Balanced Asphalt Mixture Design: Implementation Efforts and Success Stories.
• Bennert T., Haas E., and Wass E., Round Robin Testing Program for the Overlay Tester, NJDOT B-10. Center for Advanced Infrastructure and Transportation (CAIT) Rutgers, the State University of New Jersey. December 2017.
Date Developed:
April 2018
NCHRP Project 20-07/Task 406
B-17
Sensitivity of Thermal Cracking Tests to Mix Design Variables
Background / Description
Thermal cracking is a common form of distress for asphalt pavements, which is mainly caused by the contraction of asphalt mixtures during either a single falling temperature event or a repetition of significant temperature fluctuations. It generally takes the form of a series of cracks that are somewhat evenly spaced and predominantly perpendicular to the pavement centerline. Thermal cracking is a costly distress to remedy because the damage, once initiated at the surface, can progress downward through the pavement.
Disc-shaped compact tension (DCT) test, low-temperature semi-circular bending (SCB) test, and Illinois Flexibility Index test (I-FIT) are three potential tests to address thermal cracking of asphalt mixtures. Existing research on these tests, however, failed to completely address their sensitivity to materials variables considered in the asphalt mix designs. Therefore, to implement these tests into balanced mix design, a comprehensive evaluation regarding their sensitivity to key mix design variables is needed.
Objective To evaluate the sensitivity of candidate laboratory thermal cracking tests to key mix design variables, including but not limited to asphalt content, binder grade, recycled materials, aggregate type, air voids, and aging conditions.
Potential Benefits
A sensitivity evaluation will provide mix designers with an inclusive understanding of how the results of candidate thermal cracking test(s) are affected by changing the selection and proportioning of materials, which could ultimately lead to design of better quality and longer-lasting asphalt mixtures. Laboratory thermal cracking tests that are not sensitive to key mix design variables should not be considered for use in balanced mix design.
Related Research
N/A
Tasks 1. Design experiment based on fractional factorial designs
2. Sample materials and conduct thermal cracking tests
3. Analyze and summarize results, establish sensitivity relationships between test results and mix design variables, recommend test method(s) for implementation into balanced mix design
Implementation Target audience: asphalt producers and contractors, highway agencies, consulting engineers, and researchers that are interested in performance-based asphalt mixture design and the state of the practice for balance mix design.
Products: sensitivity relationships between candidate thermal cracking test results and mix design variables; recommended test method(s) for implementation into balanced mix design.
Likelihood of success: high potential to identify thermal cracking tests that are sensitive to key mix design variables and appropriate for use in BMD.
Barriers: not yet identified.
NCHRP Project 20-07/Task 406
B-18
Relevance The industry needs timely, repeatable, performance test(s) to assess the thermal cracking resistance of asphalt mixtures. Without a robust performance-based test, mix designers will not be able to improve the performance of asphalt pavements or utilize innovative materials and technologies in mix designs.
Estimated Funding
$ 300,000
Estimated Research Period
24 Months
RNS Developer NCAT staff
Source Info: • Li, X. and Marasteanu, M., 2004. Evaluation of the low temperature fracture resistance of asphalt mixtures using the semi circular bend test (with discussion). Journal of the Association of Asphalt Paving Technologists, 73.
• Li, X. and Marasteanu, M.O., 2010. Using semi circular bending test to evaluate low temperature fracture resistance for asphalt concrete. Experimental mechanics, 50(7), pp.867-876.
• Marasteanu, M., Buttlar, W., Bahia, H., Williams, C., Moon, K.H., Teshale, E.Z., Falchetto, A.C., Turos, M., Dave, E., Paulino, G. and Ahmed, S., 2012. Investigation of low temperature cracking in asphalt pavements national pooled fund study–phase II.
• West, R. C., Willis, J. R., & Marasteanu, M. O. (2013). Improved mix design, evaluation, and materials management practices for hot mix asphalt with high reclaimed asphalt pavement content (Vol. 752). Transportation Research Board.
• Braham, A., Buttlar, W., & Marasteanu, M. (2007). Effect of binder type, aggregate, and mixture composition on fracture energy of hot-mix asphalt in cold climates. Transportation Research Record: Journal of the Transportation Research Board, (2001), 102-109.
• Dave, E. V., Behnia, B., Ahmed, S., Buttlar, W. G., & Reis, H. (2011). Low temperature fracture evaluation of asphalt mixtures using mechanical testing and acoustic emissions techniques. Journal of the Association of Asphalt Paving Technologists, 80.
• Hill, B., Behnia, B., Buttlar, W. G., & Reis, H. (2012). Evaluation of warm mix asphalt mixtures containing reclaimed asphalt pavement through mechanical performance tests and an acoustic emission approach. Journal of Materials in Civil Engineering, 25(12), 1887-1897.
• Arnold, J. W., B. Behnia, M. E. McGovern, B. Hill, W. G. Buttlar, and H. Reis (2014). Quantitative Evaluation of Low-Temperature Performance of Sustainable Asphalt Pavements Containing Recycled Asphalt Shingles (RAS), Construction and Building Materials, Vol. 58, pp.1–8.
• Zhou, F., Im, S., Hu, S., Newcomb, D., & Scullion, T. (2017). Selection and preliminary evaluation of laboratory cracking tests for routine asphalt mix designs. Road Materials and Pavement Design, 18(sup1), 62-86.
• Al-Qadi, I.L., Ozer, H., Lambros, J., El Khatib, A., Singhvi, P., Khan, T., Rivera-Perez, J. and Doll, B., 2015. Testing protocols to ensure performance of high asphalt binder replacement mixes using RAP and RAS. Illinois Center for Transportation/Illinois Department of Transportation.
• Chen, X. and M. Solaimanian, 2018. The effect of mix parameters on the semicircular bend fatigue test. Transportation Research Record: Journal of the Transportation Research Board.
NCHRP Project 20-07/Task 406
B-19
Date Developed:
March 8, 2018
NCHRP Project 20-07/Task 406
B-20
Establishing Precision Estimates for AASHTO TP 105, Low-Temperature Semi-Circular Bending (SCB) Test
Background / Description
Thermal cracking is a common form of distress for asphalt pavements caused by the contraction of asphalt pavements during either a single falling temperature event or a repetition of significant temperature fluctuations. It generally takes the form of a series of cracks that are somewhat evenly spaced and predominantly perpendicular to the pavement centerline.
The low-temperature semi-circular bending (SCB) test is one potential test to assess the resistance of asphalt mixtures to thermal cracking. Although the test has demonstrated a reasonable correlation with field cracking data, a precision statement in terms of repeatability and reproducibility has not yet been established. This raises potential issues about the acceptable differences among replicates within a laboratory for comparing test results from different within-lab replicates or between-lab sources.
Objective To evaluate the variability and establish a precision statement for the low-temperature SCB test.
Potential Benefits
Establishing a precision and bias statement will help advance the test to get to its implementation into routine practice for balanced mix design.
Related Research
Proposed Tasks 1. Design inter-laboratory study experiment in accordance with ASTM E691: eight or more participating laboratories, 2 to 3 mixes, 5 specimen replicates
2. Sample materials, fabricate specimens, and conduct low-temperature SCB test 3. Analyze and summarize results in accordance with ASTM E691, establish a
precision and bias statement in terms of within-lab and between-lab variabilities.
Implementation Target audience: asphalt producers and contractors, highway agencies, consulting engineers, and researchers that are interested in performance-based asphalt mixture design and the state of the practice for balance mix design.
Products: A precision and bias statement for the low-temperature SCB test.
Likelihood of success: high potential to establish the test method’s precision and bias information.
Barriers: A large number of laboratories required to participate in the experiment.
Relevance The industry needs timely, repeatable, performance test(s) to assess the thermal cracking resistance of asphalt mixtures. Without a robust performance-based test, mix designers will not be able to improve the performance of asphalt pavements or utilize innovative materials and technologies in mix designs.
Estimated Funding
$ 100,000
Estimated Research Period
12 Months
NCHRP Project 20-07/Task 406
B-21
RNS Developer NCAT staff
Source Info: • Li, X. and Marasteanu, M., 2004. Evaluation of the low temperature fracture resistance of asphalt mixtures using the semi circular bend test (with discussion). Journal of the Association of Asphalt Paving Technologists, 73.
• Marasteanu, M., Buttlar, W., Bahia, H., Williams, C., Moon, K.H., Teshale, E.Z., Falchetto, A.C., Turos, M., Dave, E., Paulino, G. and Ahmed, S., 2012. Investigation of low temperature cracking in asphalt pavements national pooled fund study–phase II.
• Pfeifer, B. 2018. Illinois Department of Transportation’s Practices for Balanced Mix Design. TRB Workshop 124, Balanced Asphalt Mixture Design: Implementation Efforts and Success Stories.
• Bennert, T., Haas, E., and Wass, E., 2017. Round Robin Testing Program for the Overlay Tester, NJDOT B-10, Center for Advanced Infrastructure and Transportation (CAIT), Piscataway, NJ.
Date Developed:
March, 2018
NCHRP Project 20-07/Task 406
C-1
A P P E N D I X C
Summaries of Asphalt Mixture Performance Tests Currently Being Used or Considered for Implementation in the U.S.A.
NCHRP Project 20-07/Task 406
C-2
Appendix C provides an overview of asphalt mixture performance tests that are commonly used in asphalt research and are being considered for implementation by state highway agencies. The tests are organized in three categories: rutting tests, cracking tests, and moisture damage tests. With each category, the tests are presented in an alphabetic order. Each test is summarized in a one-page table format that includes a brief description of the test procedure, test results, equipment and cost, specimen fabrication, testing time, data analysis complexity, test variability, field validation, and overall practicality for mix design and quality assurance (QA). In addition, key references are provided for each test for readers who seek further information. Categories that include subjective assessments are data analysis complexity, test variability, overall practicality for mix design and QA, and field validation. Data analysis and complexity has three levels: simple, fair, or complex. This assessment is based on two parts; the first part is the complexity of the procedure to obtain test results considering the availability of software to automate the process. The second part considers the complexity of interpretation of the results for use in specifications. Test variability has three levels depending on the typical coefficient of variation (COV); low for COVs ≤ 10%, medium for COVs between 10 and 25%, or high for COVs >25%. Overall practicality for mix design and QA also has three levels: poor, fair, or good. This subjective assessment is based on the cost and time to prepare samples and obtain results as well as the practicality of establishing specification criteria for the test. Lastly, field validation has three levels: none available, fair, or good. Fair indicates that some research to relate the lab result to field performance has been conducted, but studies are limited. Good indicates several lab-to-field studies have been conducted by multiple independent organizations and regions of the U.S.
Table of Contents
Rutting Tests Asphalt Pavement Analyzer ...................................................................................................................... C-3 Flow Number Test .................................................................................................................................... C-4 Hamburg Wheel-Tracking Test ................................................................................................................ C-5 Superpave Shear Tester ............................................................................................................................. C-6 Triaxial Sterss Sweep Test ........................................................................................................................ C-7 Cracking Tests Cantabro Test ............................................................................................................................................ C-8 Direct Tension Cyclic Fatigue Test .......................................................................................................... C-9 Disc-Shaped Compact Tension Test ....................................................................................................... C-10 Flexural Bending Beam Fatigue Test...................................................................................................... C-11 IDT Creep Compliance and Strength Test .............................................................................................. C-12 IDT Energy Ratio Test ............................................................................................................................ C-13 IDT Fracture Energy Test ....................................................................................................................... C-14 Indirect Tensile Asphalt Cracking Test (IDEAL-CT) ............................................................................ C-15 Illinois Flexibility Index Test (I-FIT) ..................................................................................................... C-16 Semi-Circular Bend Test ......................................................................................................................... C-17 Semi-Circular Bend Test (Louisiana method) ........................................................................................ C-18 Texas Overlay Test ................................................................................................................................. C-19 Thermal Stress Restrained Specimen Test .............................................................................................. C-20 Moisture Damage Tests Moisture Induced Stress Tester ............................................................................................................... C-21 Tensile Strength Ratio ............................................................................................................................. C-22
NCHRP Project 20-07/Task 406
C-3
Name of Test Asphalt Pavement Analyzer
Developer(s) Lai and Co-workers Georgia DOT
Test Method(s) AASHTO T 340-10
Adoption by Agencies Alaska, Alabama, Arkansas, Georgia, Idaho, North Carolina, New Jersey, Oregon, South Carolina, South Dakota
Description The asphalt pavement analyzer (APA) is a second-generation device that was originally developed as the Georgia Loaded Wheel Tester. The APA tracks a loaded wheel back and forth across a pressurized linear hose over an asphalt mixture sample. A temperature chamber is used to control the test temperature. Rut depths along the wheel path are measured for each wheel pass. The sample is typically loaded for 8,000 wheel passes.
Photographs/Illustrations
Test Results Rut depths
Test Temperature(s) Selected based on the high temperature binder grade
Specimen Aging and Conditioning Conditioning for 6 to 24 hours at the test temperature
Testing Time 2.25 hours
Data Analysis Complexity Simple
Test Variability Medium (20% COV)
Field Validations Good (pavement sections on FHWA ALF, WesTrack, NCAT Test Track, MnRoad, and in Georgia and Nevada)
Overall Practicality for Mix Design and QA Good
Key References • Lai, J.S. (1986). “Development of a Simplified Test Method to Predict Rutting Characteristics of
Asphalt Mixes,” Final Report, Research Project No. 8503, Georgia DOT. • Cooley, L.A., Kandhal, P.S., Buchanan, M.S., Fee, F., and Epps, A. (2000). “Loaded Wheel Testers
in the United States: State of the Practice,” NCAT Report No. 2000-4, Auburn, AL. • Kandhal, P.S., and Cooley, L.A. (2003). “Accelerated Laboratory Rutting Tests: Evaluation of the
Asphalt Pavement Analyzer,” NCHRP Report 508, Washington, D.C. • West, R., Timm, D., Willis, R., Powell, B., Tran, N., Watson, D., Sakhaeifar, M., Brown, R.,
Robbins, M., Nordcbeck, A.V. and Villacorta, F.L. (2012). “Phase IV NCAT Pavement Test Track Findings,” NCAT Report 12-10, Auburn, AL.
NCHRP Project 20-07/Task 406
C-4
Name of Test Flow Number Test
Developer(s) Witczak and Co-workers University of Maryland
Test Method(s) AASHTO TP 79-15
Adoption by Agencies Delaware
Description The test is conducted by applying repeated haversine axial compressive loads to a cylinder specimen at a specific test temperature. The test may be conducted with or without confining pressure. For each load cycle, the recoverable strain and permanent strain are recorded. The flow number is determined as the number of load cycles corresponding to the minimum rate of change of permanent strain (i.e., onset of tertiary flow).
Photographs/Illustrations
Test Results Flow Number
Test Temperature(s) LTPPBind v3.1 98% Reliability High Temperature of the paving location adjusted for a depth of 20 mm from the surface (surface mixes)
Number of Replicate Specimens At least 3 specimens
Specimen Aging and Conditioning Until a thermocouple in the center of a dummy specimen reaches the target test temperature
Testing Time Varies between 30 minutes and 4 hours
Data Analysis Complexity Fair
Test Variability High (> 30% COV)
Field Validations Good (pavement sections on FHWA ALF, WesTrack, NCAT Test Track, MnRoad)
Overall Practicality for Mix Design and QA Fair
Key References • Bonaquist, R.F., Christensen, D.W., and Stump, W. (2003). “Simple Performance Tester for
Superpave Mix Design: First Article Development and Evaluation,” NCHRP Report 513, Transportation Research Board, Washington, D.C.
• Witczak, M.W. (2007). “Specification Criteria for Simple Performance Tests for Rutting,” NCHRP report 580, Washington, D.C.
• Willis, J.R., Taylor, A., Tran, N., N., Kvasnak, A., and Copeland, A. (2010) “Correlations Between Flow Number Test Results and Field Performance at the NCAT Pavement Test Track,” Paper Submitted to the Transportation Research Board 89th Annual Meeting, Washington, D.C.
• Bonaquist, R. (2011) “Precision of the Dynamic Modulus and Flow Number Tests Conducted with the Asphalt Mixture Performance Tester,” NCHRP Report 702, Washington, D.C.
NCHRP Project 20-07/Task 406
C-5
Name of Test Hamburg Wheel-Tracking Test
Developer(s) Developed in Germany
Test Method(s) AASHTO T 324-14
Adoption by Agencies California, Iowa, Illinois, Louisiana, Massachusetts, Maine, Montana, Texas, Utah, Washington
Description During the test, two sets of cylinder or slab specimens are placed side by side, submerged in water, and subjected to repetitive applications of wheel loads. Rut depths at different positions along the specimens are recorded for each wheel pass. The specimens are loaded for a maximum of 20,000 wheel passes or until the specimens deforms by a pre-determined rut depth (typically 12.5mm). Typical result curves consist of post-compaction phase, creep phase, and striping phase.
Photographs/Illustrations
Test Results Rut depths, stripping inflection point, creep slope, stripping slope, stripping number, stripping life, rutting resistance parameter
Test Temperature(s) 40 to 70°C
Equipment & Cost Hamburg Wheel-Tracking Device Saw for cutting specimens
Specimen Aging and Conditioning Conditioning for 30 minutes at the test temperature under water
Testing Time 10 hours
Data Analysis Complexity Simple
Test Variability Medium (10-30% COV)
Field Validations Good (pavement sections in Colorado, Texas)
Overall Practicality for Mix Design and QA Good
Key References • Aschenbrener, T., Terrel, R. and Zamora, R. (1994). “Comparison of The Hamburg Wheel-Tracking
Device And The Environmental Conditioning System To Pavements Of Known Stripping Performance,” Final Report (No. CDOT-DTD-R-94-1).
• Izzo, R. and Tahmoressi, M. (1999). “Use of the Hamburg wheel-tracking device for evaluating moisture susceptibility of hot-mix asphalt,” Transportation Research Record: Journal of the Transportation Research Board, (1681), pp.76-85.
• Solaimanian, M., Bonaquist, R.F. and Tandon, V. (2007). “Improved conditioning and testing for HMA moisture susceptibility,” NCHRP Report 589, Washington, D.C.
• Mohammad, L.N., Elseifi, M.A., Raghavendra, A. and Ye, M. (2015). “Hamburg Wheel-Track Test Equipment Requirements and Improvements to AASHTO T 324.” NCHRP Web-Only Document 219, Washington, D.C.
NCHRP Project 20-07/Task 406
C-6
Name of Test Superpave Shear Tester
Developer(s) Monismith and Co-workers SHRP Research Team
Test Method(s) AASHTO T 320-07
Adoption by Agencies California
Description The Superpave shear tester (SST) can be used to perform the following three tests that characterize the rutting resistance of asphalt mixtures: shear frequency sweep test at constant height (FSCH), simple shear test at constant height (SSCH), and reheated shear test at constant height (RSCH). During these tests, the asphalt mixture is subjected to repeated shear loads in a pulse manner or over a range of loading frequencies. Test results are used to determine the accumulation of permanent shear stain with load repetitions, complex shear modulus, and phase angle.
Vinson, T., Bell, C., Terrel, R. and Scholz, T. (1994). “Accelerated Performance-Related Tests for Asphalt-Aggregate Mixes and their Use in Mix Design and Analysis Systems,” No. SHRP-A-417.
• Sousa, J.B., Solaimanian, M., and Weissman, S.L. (1994). “Development and Use of the Repeated Shear Test (Constant Height): An Optional Superpave Mix Design Tool,” Strategic Highway Research Program, Washington, D.C.
• Witczak, M.W., Kaloush, K., Pellinen, T., El-Basyouny, M., and Von Quintus, H. (2002). “Simple Performance Test for Superpave Mix Design,” NCHRP Report 465, Washington, D.C.
NCHRP Project 20-07/Task 406
C-7
Name of Test Triaxial Sterss Sweep Test
Developer(s) Azari and Co-workers AASHTO Advanced Pavement Research Laboratory
Test Method(s) AASHTO TP 116-15
Adoption by Agencies None
Description The test is conducted at one test temperature and with confining pressure in four 500-cycle increments. The deviator stress is held constant during each increment and is increased for each subsequent increment. Permanent axial strains due to each load cycle are measured by the actuator of an Asphalt mixture Performance Tester. The collected permanent strain results are used to determine the minimum strain rate (MSR) for each increment.
Photographs/Illustrations
Test Results Minimum strain rate b power coefficient of the MSR master curve
Test Temperature(s) Determined from the Degree-Days parameter using LTPPBind Software
Number of Replicate Specimens At least 3 specimens
Specimen Aging and Conditioning Conditioning for at least 1 hour at the test temperature
Testing Time Unknown
Data Analysis Complexity Fair
Test Variability N/A
Field Validations Good (pavement sections in Alabama, California, Florida, Indiana, New Jersey, North Carolina, Wisconsin, and Texas)
Overall Practicality for Mix Design and QA Fair
Key References • Azari, H. and Mohseni, A. (2013). “Permanent Deformation Characterization of Asphalt Mixtures
by Using Incremental Repeated Load Testing,” Transportation Research Record: Journal of the Transportation Research Board, 2373, pp.134-142.
• Azari, H. and Mohseni, A. (2013). “Effect of Short-Term Conditioning and Long-Term Ageing on Permanent Deformation Characteristics of Asphalt Mixtures,” Road Materials and Pavement Design, 14(sup2), pp.79-91.
NCHRP Project 20-07/Task 406
C-8
Name of Test Cantabro Test
Developer(s) Developed in Spain
Test Method(s) AASHTO TP 108-14
Adoption by Agencies None
Description The Cantabro test is a mixture toughness test rather than a cracking test. Some researchers suggest that the Cantabro test provides a general indication of durability. SGC specimens are placed one at a time in a Los Angeles abrasion machine for 300 cycles at 30 revolutions per minute. The percent abrasion loss is determined after testing.
Photographs/Illustrations
Test Results Percent abrasion loss
Test Temperature(s) 25 ± 1°C
Equipment & Cost Los Angeles abrasion machine
$ 10,000
Specimen Fabrication Cylinder specimen
Number of Replicate Specimens A minimum of 3 specimens
Specimen Aging and Conditioning Conditioning for a minimum of 4 hours at 25°C
Testing Time 10 minutes
Data Analysis Complexity Simple
Test Variability Medium (10-25% COV)
Field Validations N/A
Overall Practicality for Mix Design and QA Good
Key References • Alvarez, A.E., A. Epps Martin, C.K. Estakhri, J.W. Button, Z. Kraus, N. Prapaitrakul, and C.J.
Glover (2007). Evaluation and Recommended Improvements for Mix Design of Permeable Friction Courses. Texas Transportation Institute; Texas A&M University, 163p.
• Tsai, B.W., A. Fan, J.T. Harvey, and C. Monismith (2012). Improved Methodology for Mix Design of Open-Graded Friction Courses. University of California, Davis; University of California, Berkeley; California Department of Transportation, 123p.
• Howard, I.L., and J. D. Doyle (2015). Durability Indices via Cantabro Testing for Unaged, Laboratory-Conditioned and One-Year Outdoor Aged Asphalt Concrete, TRB 94th Annual Meeting Compendium of Papers, Paper No. 15-1366, Transportation Research Board.
• Doyle, J.D. and Howard, I.L. (2016). “Characterization of Dense-Graded Asphalt with the Cantabro Test,” Journal of Testing and Evaluation, Vol. 44, No.1, ASTM International, pp.78-88.
NCHRP Project 20-07/Task 406
C-9
Name of Test Direct Tension Cyclic Fatigue Test
Developer(s) Kim and co-workers North Carolina State University
Test Method(s) AASHTO TP 107-14
Adoption by Agencies None
Description First, a non-destructive dynamic modulus finger print test is performed to determine the linear viscoelastic property of the asphalt mixture. Then the cyclic fatigue damage tests are performed at three different peak-to-peak on-specimen strain levels. The stress and strain results are used to determine the damage characteristic curve of the asphalt mixture as well as to predict the pavement fatigue life.
Photographs/Illustrations
Test Results C versus S curve coefficients Fatigue equation
Test Temperature(s) Average of the high- and low-temperature PG temperatures minus 3°C (not exceeding 21°C)
Equipment & Cost Asphalt Mixture Performance Tester End platens and gluing jigs Core drill Environmental chamber Saw for cutting specimens
Specimen Aging and Conditioning Short-term aging for 4 hours at 135°C Conditioning for 4 hours at desired test temperature
Testing Time 2 days
Data Analysis Complexity Complex
Test Variability N/A
Field Validations Good (pavement sections in North Carolina and on FHWA-ALF)
Overall Practicality for Mix Design and QA Poor
Key References • Hou, T., B.S. Underwood, and Y.R. Kim (2010). Fatigue Performance Prediction of North Carolina
Mixtures Using the Simplified Viscoelastic Continuum Damage Model, Journal of the Association of Asphalt Paving Technologists, Vol. 79, pp. 35–80.
• Underwood, B.S., Y.R. Kim, and M.N. Guddati. (2010). “Improved Calculation Method of Damage Parameter in Viscoelastic Continuum Damage Model,” International Journal of Pavement Engineering, Vol. 11, No. 6, pp. 459–476.
NCHRP Project 20-07/Task 406
C-10
Name of Test Disc-Shaped Compact Tension Test
Developer(s) Buttlar and co-workers University of Illinois at Urbana–Champaign
Test Method(s) ASTM D7313-13
Adoption by Agencies Iowa, Minnesota, Missouri
Description The DCT test is performed under tensile loading and the crack mouth opening displacement (CMOD) is measured with a clip-on gage at the crack mouth. After temperature conditioning, specimens are inserted in loading fixtures, subjected to a preload no greater than 0.2 kN, and then tested with a constant CMOD of 1mm/min. The test is completed when the post peak level reduces to 0.1 kN.
Photographs/Illustrations
Test Results Fracture energy
Test Temperature(s) PG low temperature limit PG low temperature limit + 10°C
Equipment & Cost Stand-alone DCT test system Core drill Saw for cutting specimens Saw for notching specimens
Specimen Aging and Conditioning Conditioning for 8 to 16 hours at the desired test temperature
Testing Time 30 Minutes
Data Analysis Complexity Simple
Test Variability Low (10% COV)
Field Validations Good (pavement sections in New York, Iowa, Illinois, and on UIUC-ATLAS APT and MnROAD)
Overall Practicality for Mix Design and QA Good
Key References • Wagoner, M.P., W.G. Buttlar, and P. Blankenship (2005). Investigation of the Fracture Resistance
of Hot-Mix Asphalt Concrete Using a Disk-shaped Compact Tension Test. Transportation Research Board. Washington D.C.
• Wagoner, M., W. Buttlar, G. Paulino, and P. Blankenship (2006), Laboratory Testing Suite for Characterization of Asphalt Concrete Mixtures Obtained from Field Cores, Journal of the Association of Asphalt Paving Technologists, Vol. 75, pp. 815-852.
• Marasteanu, M., E.Z. Teshale, K.H. Moon, M. Turos, W. Buttlar, E. Dave, and S. Ahmed (2010). Investigation of Low Temperature Cracking in Asphalt Pavements National Pooled Fund Study – Phase II. United States: Minnesota Department of Transportation.
NCHRP Project 20-07/Task 406
C-11
Name of Test Flexural Bending Beam Fatigue Test
Developer(s) Monismith and co-workers University of California at Berkeley
Test Method(s) AASHTO T 321-14 / ASTM D7460-10
Adoption by Agencies California, Iowa, New Jersey, Ohio, Pennsylvania
Description Beam specimen is held by four equally-spaced clamps and a sinusoidal controlled-deflection mode of loading is applied at the two inner clamps. The loading frequency is typically 10 Hz. The magnitude of the load applied by the actuator and the deflection measured at center of beam is recorded and used to calculate the flexural stiffness, cumulative dissipated energy, and the cycles to failure (i.e., the point at which the product of the specimen stiffness and loading cycles is a maximum). Multiple peak-to-peak strain levels are often used to characterize the fatigue behavior of asphalt mixtures.
Photographs/Illustrations
Test Results Number of cycles to failure (fatigue life), Nf
Test Temperature(s) 20 ± 0.5°C
Equipment & Cost Loading device and data acquisition system Environmental chamber Beam fatigue device Slab compactor Saw for cutting specimens
Number of Replicate Specimens 3 specimens per strain level
Specimen Aging and Conditioning Conditioning for 2 hours at 20°C
Testing Time Days to weeks depending on strain level
Data Analysis Complexity Simple
Test Variability High (40-50% COV)
Field Validations Good (inputs to AI and AASHTOWare Pavement ME Design)
Overall Practicality for Mix Design and QA Poor
Key References • Tayebali, A.A., J.A. Deacon, J.S. Coplantz, J.T. Harvey, and C.L. Monismith (1994). Fatigue
Response of Asphalt-Aggregate Mixes, SHRP-A-404, National Research Council, Washington D.C. • Prowell, B., E. Brown, R. Anderson, J. Daniel, A. Swamy, H. Quintus, S. Shen, S. Carpenter, S.
Bhattacharjee, and S. Maghsoodloo (2010). Validating the Fatigue Endurance Limit for Hot Mix Asphalt, NCHRP Report 646, National Academies Press.
NCHRP Project 20-07/Task 406
C-12
Name of Test IDT Creep Compliance and Strength Test
Developer(s) Roque and co-workers Pennsylvania State University
Test Method(s) AASHTO T 322-07
Adoption by Agencies None
Description The IDT creep test applies a constant load to the specimen for between 100 and 1000 seconds, and measures the vertical and horizontal displacement around the center of the specimen. The displacement data are then used to determine the IDT creep compliance. After the nondestructive IDT creep test is conducted, the tensile strength of the specimen is determined by running the test in the destructive mode (12.5 mm/min loading rate).
Photographs/Illustrations
Test Results IDT creep compliance IDT tensile strength
Test Temperature(s) Mixtures using binder grades PG XX-34 or softer: −30, −20, and −10°C. Mixtures using binder grades PG XX-28 and PG XX-22: −20, −10, and 0°C. Mixtures using binder grades PG XX-16 or harder: −10, 0, and +10°C.
Equipment & Cost Loading device and data acquisition system Specimen deformation measuring device Environmental chamber Saw for cutting specimens
Number of Replicate Specimens A minimum of 3 specimens
Specimen Aging and Conditioning Conditioning for 3 hours at the desired test temperature
Testing Test 1 day
Data Analysis Complexity Complex
Test Variability Low (7 to 11% COV)
Field Validations Good (inputs to TCModel and MEPDG)
Overall Practicality for Mix Design and QA Fair
Key References • Roque, R., and W.G. Buttlar (1992). The Development of a Measurement and Analysis System to
Accurately Determine Asphalt Concrete Properties Using the Indirect Tensile Mode. Paper presented at The Association of Asphalt Paving Technologist.
• Christensen, D.W., and R.F. Bonaquist (2004). NCHRP 530. Evaluation of Indirect Tensile Test (IDT) Procedures for Low-Temperature Performance of Hot Mix Asphalt. Washington DC, Transportation Research Board.
NCHRP Project 20-07/Task 406
C-13
Name of Test IDT Energy Ratio Test
Developer(s) Roque and co-workers University of Florida
Test Method(s) N/A
Adoption by Agencies None
Description IDT specimens are instrumented with horizontal and vertical deformation gauges. Three specimens are required, with an additional specimen recommended to optimize strain levels for resilient modulus and creep tests. Three tests are performed on each specimen: resilient modulus, creep compliance, and indirect tensile strength. The test results are used to calculate the energy ratio of the asphalt mixture.
Photographs/Illustrations
Test Results Energy ratio, Dissipated Creep Strain Energy
Test Temperature(s) 10°C
Equipment & Cost Loading device and data acquisition system Specimen deformation measuring device Environmental chamber Saw for cutting specimens
Field Validations Good (pavement sections in Florida and on NCAT test track)
Overall Practicality for Mix Design and QA Good
Key References • Roque, R., B. Birgisson, C. Drakos, and B. Dietrich (2004). “Development and Field Evaluation of
Energy-Based Criteria for Top-Down Cracking Performance of Hot Mix Asphalt.” Journal of the Association of Asphalt Paving Technologists, 73, pp. 229–260.
• Timm, D.H., G.A. Scholar, J. Kim, and J.R. Willis (2009). Forensic Investigation and Validation of Energy Ratio Concept. Transportation Research Record: Journal of the Transportation Research Board, No. 2127, pp.43-51.
• Roque, R., J. Zou, Y.R. Kim, C. Baek, S. Thirunavukkarasu, B.S. Underwood, M.N. Guddati (2010). “Top-Down Cracking of Hot-Mix Asphalt Layers: Models for Initiation and Propagation.” NCHRP 1-42A Report 162, Transportation Research Board, National Research Council, Washington, D.C.
NCHRP Project 20-07/Task 406
C-14
Name of Test IDT Fracture Energy Test
Developer(s) Kim and co-workers North Carolina State University
Test Method(s) N/A
Adoption by Agencies None
Description The IDT fracture energy test is typically conducted on specimens 150 mm in diameter and 38 to 50 mm in thickness. Loading is applied at a constant displacement rate of 50.8 mm/min. Two extensometers, with a gauge length of 38.1 mm, are attached to the center of the specimen to measure the vertical and horizontal deformations.
Photographs/Illustrations
Test Results Fracture energy (area under load-displacement curve)
Test Temperature(s) 20°C
Equipment & Cost Loading device and data acquisition system Specimen deformation measuring gauges Environmental chamber Saw for cutting specimens
Field Validations Good (pavement sections on WesTrack)
Overall Practicality for Mix Design and QA Good
Key References • Kim. Y.R. and H. Wen. (2002). “Fracture Energy from Indirect Tension Testing,” Journal of the
Association of Asphalt Paving Technologists, Vol. 71, pp. 779–793. • Li, Q., H.J. Lee, and T.W. Kim (2012). A Simple Fatigue Performance Model of Asphalt Mixtures
Based on Fracture Energy. Construction and Building Materials, 27, 605–611. • West, R., J.R. Willis, and M. Marasteanu (2013). NCHRP 752. Improved Mix Design, Evaluation,
and Materials Management Practices for Hot Mix Asphalt with High Reclaimed Asphalt Pavement Content. Transportation Research Board. Washington, D.C.
NCHRP Project 20-07/Task 406
C-15
Name of Test Indirect Tensile Asphalt Cracking Test (IDEAL-CT)
Developer(s) Zhou and Co-workers Texas A&M Transportation Institute
Test Method(s) N/A
Adoption by Agencies Virginia
Description The IDEAL-CT test is similar to the traditional indirect tensile strength test. The test applies a vertical monotonic load on a cylinder specimen at a constant rate of 50 mm/min. The test is stopped when the load is reduced to 0.1kN. During the test, the cross-head displacement is continuously monitored and recorded. Data analysis is conducted based on the load versus displacement curve. The test parameter CTIndex is calculated as a function of total fracture energy and the slope of the post-peak curve at 25 percent reduction from the peak load.
Number of Replicate Specimens A minimum of 3 specimens
Specimen Aging and Conditioning Conditioning for 1 to 2 hours at 25°C
Testing Time 1 minute
Data Analysis Complexity Simple
Test Variability Medium (10-25% COV)
Field Validations Good (pavement sections in Texas and on FHWA ALF and MnROAD facilities)
Overall Practicality for Mix Design and QA Good
Key References • Zhou, F., Im, S., Sun, L., & Scullion, T. (2017). Development of an IDEAL cracking test for
asphalt mix design and QC/QA. Road Materials and Pavement Design, 18(sup4), 405-427. • NCHRP IDEA 20-30/IDEA 195. Development of an IDEAL Cracking Test for Asphalt Mix
Design, Quality Control, and Quality Assurance. http://apps.trb.org/cmsfeed/TRBNetProjectDisplay.asp?ProjectID=4286, accessed on August 8, 2018.
Name of Test Illinois Flexibility Index Test (I-FIT)
Developer(s) Al-Qadi and co-workers University of Illinois at Urbana–Champaign
Test Method(s) IL TP 405/AASHTO T 124-16
Adoption by Agencies Illinois
Description A 150-mm diameter by 50-mm thick semi-circular specimen with a 15-mm notch is simply supported by two bars on the flat surface. The load is applied to the curved surface above the notch at a vertical rate of 50 mm/min. Load and vertical displacement are recorded until the load drops below 0.1 kN. Fracture energy is calculated from the area beneath the load displacement curve to 0.1 kN. The post-peak slope of the load displacement curve is an indicator of the brittle to ductile failure. The flexibility index parameter is calculated by multiplying the fracture energy by a scaling factor constant and dividing by the slope. A minimum of three specimens are used to calculate the average flexibility index.
Photographs/Illustrations
Test Results Flexibility Index
Test Temperature(s) 25°C
Equipment & Cost Stand-alone servo-hydraulic I-FIT device Saw for cutting specimens Saw for notching specimens
$ 10,000 to 15,000 $ 6,000 $ 1,000
Specimen Type and Aging Condition Gyratory specimen, 3 cuts, 1 notch (2 hours)
Number of Replicate Specimens Not specified
Specimen Aging and Conditioning Conditioning for 2 hours at 25°C
Testing Time 10 minutes
Data Analysis Complexity Fair (using Excel Spreadsheet) Simple (using software)
Test Variability Medium (10-20% COV)
Field Validations Good (pavement sections in Illinois and on FHWA ALF)
Overall Practicality for Mix Design and QA Good
Key References • Al-Qadi, I.L., H. Ozer, J. Lambros, A.E. Khatib, P. Singhvi, T. Khan, J. Rivera-Perez, and B. Doll
(2015) Testing Protocols to Ensure Performance of High Asphalt Binder Replacement Mixes using RAP and RAS. ICT Report No. FHWA-ICT-15-017. Illinois Center for Transportation.
NCHRP Project 20-07/Task 406
C-17
Name of Test Semi-Circular Bend Test
Developer(s) Marasteanu and Co-Workers University of Minnesota
Test Method(s) AASHTO TP 105-13
Adoption by Agencies None
Description During the test, a vertical load is applied on the semi-circular specimen at a constant rate of 0.0005 mm/s. The test stops when the load drops below 0.5 kN or when the crack mouth opening displacement gauge range limit is reached, whichever occurs first.
Photographs/Illustrations
Test Results Fracture energy Fracture toughness
Test Temperature(s) 10°C above the PG lower limit of the asphalt binder, and 2°C below the PG lower limit
Equipment & Cost Loading device and data acquisition system Bend test fixture Environmental chamber Saw for cutting specimens Saw for notching specimens
Number of Replicate Specimens A minimum of 3 specimens for each test temperature
Specimen Aging and Conditioning Conditioning for 2 hours at the desired test temperature
Testing Time 1 hour
Data Analysis Complexity Simple
Test Variability Medium (20% COV)
Field Validations Good (pavement sections in Illinois, Minnesota, and Wisconsin)
Overall Practicality for Mix Design and QA Fair
Key References • Li, X, and M. O. Marasteanu. (2004). “Evaluation of the Low Temperature Fracture Resistance of
Asphalt Mixtures Using the Semi-Circular Bend Test,” Journal of Association of Asphalt Paving Technologists, Vol. 73, pp. 401–426.
• Marasteanu, M. O., W. Buttlar, H. Bahia, C. Williams, et al. (2012). Investigation of Low Temperature Cracking in Asphalt Pavements: National Pooled Fund Study Phase II, Minnesota Department of Transportation, MN/RC 2012-23.
NCHRP Project 20-07/Task 406
C-18
Name of Test Semi-Circular Bend Test (Louisiana method)
Developer(s) Mohamad and co-workers Louisiana Transportation Research Center
Test Method(s) LADOTD TR 330-14/ASTM D8044-16
Adoption by Agencies Louisiana
Description Half-moon specimens are prepared with three notch depths: 25.4 mm, 31.8 mm, and 38.0 mm. Each specimen is simply supported by two bars on the flat surface and the load is applied to the curved surface above the notch. The load is applied at a vertical rate of 0.5 mm/min. For each specimen, the fracture toughness is calculated based on the load and displacement data. Fracture toughness versus notch depth is used to determine the energy release rate, J-integral. Three specimens are tested at each notch depth for a total of nine specimens per mix.
Photographs/Illustrations
Test Results J-integral
Test Temperature(s) 25°C
Equipment & Cost Screw drive test frame and fixture Saw for cutting specimens Environmental chamber Saw for notching specimens
Number of Replicate Specimens 4 specimens for each notch depth
Specimen Aging and Conditioning Conditioning for a minimum of 0.5 hour at 25°C
Testing Time 1 hour
Data Analysis Complexity Fair
Test Variability Medium (20% COV)
Field Validations Fair (pavement sections in Louisiana)
Overall Practicality for Mix Design and QA Good
Key References • Wu, Z., L. Mohammad, L. Wang, and M. Mull (2005). Fracture Resistance Characterization of
Superpave Mixtures Using the Semi-Circular Bending Test, Journal of ASTM International, Vol. 2, No. 3, pp. 1-15.
• Kim, M., L.N. Mohammad, and M.A. Elseifi (2012). Characterization of Fracture Properties of Asphalt Mixtures as Measured by Semicircular Bend Test and Indirect Tension Test, Transportation Research Record, No. 2296, pp. 115-124.
NCHRP Project 20-07/Task 406
C-19
Name of Test Texas Overlay Test
Developer(s) Lytton and Co-workers Texas A&M University
Test Method(s) NJDOT B-10 / Tex-248-F
Adoption by Agencies New Jersey, Texas
Description Test specimens are cut from SGC samples or field cores. Trimmed specimens are glued on a set of two steel base plates with one plate fixed and the other moves horizontally back and forth at a specific frequency (0.1 Hz). The maximum opening displacement of 0.025 inch is controlled during the test. The test is stopped when a 93% reduction of the maximum load occurs or after 1,000 cycles.
Specimen Aging and Conditioning Short-term aging for 4 hours at 135°C Conditioning for a minimum of 1 hour at 25°C
Testing Time 3 hours
Data Analysis Complexity Simple
Test Variability High (30-50% COV)
Field Validations Good (pavement sections in Texas, New Jersey, Nevada, and on FHWA-ALF and NCAT test track)
Overall Practicality for Mix Design and QA Good
Key References • Zhou, F., and T. Scullion (2005). Overlay Tester: A Rapid Performance Related Crack Resistance
Test, No. FHWA/TX-05/0-4467-2, Texas Transportation Institute, Texas A&M University System. • Zhou, F., S. Hu, H. Chen, and T. Scullion (2007). Overlay Tester: Simple Performance Test for
Fatigue Cracking, Transportation Research Record: Journal of the Transportation Research Board, Vol. 2001, pp.1-8.
• Walubita, L., A. Faruk, G. Das, H. Tanvir, J. Zhang, and T. Scullion (2012). The Overlay Tester: A Sensitivity Study to Improve Repeatability and Minimize Variability in the Test Results, No. FHWA/TX-12/0-6607-1, Texas Transportation Institute, Texas A&M University System.
NCHRP Project 20-07/Task 406
C-20
Name of Test Thermal Stress Restrained Specimen Test
Developer(s) Jung and Vinson Oregon State University
Test Method(s) BS EN 12697-46:2012
Adoption by Agencies None
Description The TSRST test determines the low fracture temperature of an asphalt mixture subjected to cooling at a constant rate. To perform the test, a beam specimen is placed in an environmental chamber with both ends fixed and not allowed to contract. The temperature in the chamber is then reduced at a specified rate, and the stress in the beam is monitored until the beam fractures under the thermally induced stress. The failure stress and failure temperature are then recorded.
Photographs/Illustrations
Test Results Fracture temperature
Test Temperature(s) Start at 5 ± 2°C and then reduce at a cooling rate of 10°C per hour
Specimen Aging and Conditioning Conditioning for 5 to 6 hours at 5°C
Testing Time 4 Hours
Data Analysis Complexity Fair
Test Variability Medium (10-20% COV)
Field Validations Fair (pavement sections in Alaska, Pennsylvania, and on MnROAD)
Overall Practicality for Mix Design and QA Poor
Key References • Jung, D.H., and T.S. Vinson (1994). Low-Temperature Cracking: Test Selection, SHRP A-400,
Strategic Highway Research Program. Washington, D.C. • Zubeck, H.K., H. Zeng, T.S. Vinson, and V.C. Janoo (1996). Field Validation of Thermal Stress
Restrained Specimen Test: Six Case Histories, Journal of Transportation Research Board 1545, pp. 67–74.
• Marasteanu, M.O., A. Zofka, M. Turos, X. Li, R. Velasquez, X. Li, W. Buttlar, G. Paulino, A. Braham, E. Dave, J. Ojo, H. Bahia, C. Williams, J. Bausano, A. Gallistel, and J. McGraw (2007). Investigation of Low Temperature Cracking in Asphalt Pavements: National Pooled Fund Study 776, Minnesota Department of Transportation. MN/RC 2007-43.
NCHRP Project 20-07/Task 406
C-21
Name of Test Moisture Induced Stress Tester
Developer(s) InstroTek, Inc.
Test Method(s) ASTM D7870
Adoption by Agencies None
Description The test uses a cyclic conditioning system that is designed to simulate the stripping mechanism of asphalt mixtures. Test device consists of a pressurized chamber that pushes and pulls water through a compacted asphalt mixture sample. Different temperatures and pressures can be used to represent different traffic and environmental conditions. Moisture damage is evaluated based on changes in the bulk specific gravity of the mixture sample and visual inspections of stripping. Conditioned samples can also be tested to determine the wet IDT strength and TSR.
Photographs/Illustrations
Test Results Changes in the bulk specific gravity Visual observations of stripping
Test Temperature(s) 50 to 60°C
Equipment & Cost Moisture conditioning system
$ 18,000
Specimen Fabrication Cylinder specimen
Number of Replicate Specimens 3 specimens
Specimen Aging and Conditioning Conditioning to reach test temperature
http://www.instrotek.com/pdfs/MIST%20Application%20Brief.pdf. • Chen, X., and Huang, B. (2008). “Evaluation of Moisture Damage in Hot Mix Asphalt Using Simple
Performance and Superpave Indirect Tensile Tests,” Construction and Building Materials, Vol.22, No.9, pp.1950-1962.
• Yin, F., Epps Martin, A., and Arambula-Mercado, E. (2016). “WMA Moisture Susceptibility Evaluation for Mix Design and Quality Assurance,” Transportation Research Record: Journal of Transportation Research Board, 2575, 39-47
Developer(s) Developed by Lottman Modified by Tunnicliff and Root
Test Method(s) AASHTO T 283-14
Adoption by Agencies Alabama, California, Colorado, Connecticut, Florida, Georgia, Illinois, Indiana, Kansas, Kentucky, Maryland, Michigan, Minnesota, Mississippi, Missouri, Montana, Nebraska, Nevada, New Hampshire, New Jersey, New Mexico, New York, North Carolina, North Dakota, Ohio, Oklahoma, Oregon, Pennsylvania, South Carolina, South Dakota, Tennessee, Virginia, Vermont, Wisconsin, Wyoming
Description The indirect tensile (IDT) strength is determined for one set of dry specimens and another set of wet specimens conditioned according to the modified Lottman procedure. The procedure consists of partial vacuum saturation, one freeze/thaw cycle, and soaking in warm water. Tensile strength ratio (TSR) is then determined as the ratio of the average wet IDT strength over the average dry IDT strength. Several modifications to the moisture conditioning procedure have been adopted by state highway agencies.
Photographs/Illustrations
Test Results IDT strength, TSR
Test Temperature(s) 25 ± 0.5°C
Equipment & Cost Vacuum container Water bath Freezer Mechanical testing machine Lottman breaking head
$ 3,000 $ 650 $ 300 $ 4,000 $ 500
Specimen Fabrication Cylinder specimen
Number of Replicate Specimens 6 specimens
Specimen Aging and Conditioning Conditioning for 2 hours at 25°C in water bath
Key References • Lottman, R.P. (1982). “Predicting Moisture-Induced Damage to Asphalt Concrete Field Evaluation,”
NCHRP Report 246, Transportation Research Board, Washington, D.C. • Tunnicliff, D.G. and Root. R.E. (1984) “Use of Antistripping Additives in Asphaltic Concrete
Mixture Laboratory Phase,” NCHRP Report 274, Transportation Research Board, Washington, D.C. • Azari, H. (2010). “Precision Estimates of AASHTO T283: Resistance of Compacted Hot Mix
Asphalt to Moisture-Induced Damage,” NCHRP Web-Only Document 166, Washington, D.C.