Article history:Received 10 October 2012Received in revised form 11 January 2013Accepted 17 January 2013Available online 24 January 2013
Keywords:Normal contact force modelCoefficient of restitutionCollision timeDiscrete element methodNon-Newtonian fluid
Normal contact force models often suffer from a weak prediction of collisions between particles. They regularlyfail to predict an adequate energy restitution behaviorwith increasing normal impact velocity. In particular,mostnon-linear models predict a net attraction force between two impacting particles near the end of a collision,which is unrealistic according to reported results. Such limitations have provided the impetus for the develop-ment of a normal contact force model that better predicts the unfolding of a collision between two particles.This model comprises a Hertz elastic force and a dissipative force that is evaluated by the motion of anon-Newtonian liquid in a dashpot. The model parameters are set using experimental restitution data forparticle/particle and particle/wall contacts. In the current work, the measurement of energy restitution forparticle/wall collision was carried out using several materials over a wide range of impact velocities, whereasparticle/particle collision data were obtained from the literature. Model predictions for microscopic (e.g. particlevelocity) and macroscopic (e.g. collision time) quantities are presented and compared with those from othernon-linear models and experimental data. Themodel is observed to adequately predict the coefficient of restitu-tion and to decrease the attraction force at the end of a collision.
Due to the importance of processes involving solids, a high percent-age of recent research activities has focused on the flow of particles [1],which in many cases is governed by the collisions among them. A betterunderstanding of particle impact in the granular bed facilitates the de-sign of more efficient unit operations, thus improving the throughputand the quality of the final product [2]. A typical example of this can beseen in the pharmaceutical industry, with for instance mixing systemssuch as tumbling blenders, where improved knowledge of the particlebehavior as these particles collide with their neighbors and the blenderwall is known to help design systems that have greater throughput,consume less power and have smaller failure rate. Beside experimentalefforts to investigate particulate material beds (e.g., [3,4]), numerical in-vestigations have progressed due to advances in high performance com-puting [5]. In these studies, both continuum and discrete models havebeen developed. The first is a Eulerian approach that considers powderas a fluid (e.g. [6–8]), and the second is a Lagrangian approach that treatsparticles as discrete entities. Among the discrete models, the discreteelement method (DEM), initially introduced by Cundall and Strack [9],has been widely applied to investigate solids motion (e.g. [5,10–13]). It
ertrand),
rights reserved.
has been shown to provide valuable insight into phenomena occurringin the granular bed by modeling each particle and its interaction withthe neighboring particles and the solid parts of the equipment.
In the DEM, the motion of each particle is subjected to Newton's sec-ond law of motion. It is a time-driven soft-particle method that allowsany two colliding particles to interpenetrate so as to mimic their defor-mation upon impact. The total applied force may take into accountgravity, drag, buoyancy, particle/particle and particle/wall contact, andcohesive terms such as the electrostatic, Van der Waals and capillaryforces. Given the particle size in DEM simulations (generally in theorder of one millimeter), the non-contact cohesive forces are oftenneglected so that only gravity and contact forces are considered. Particlecontacts can be described via contact mechanics and modeled by the fi-nite element method (FEM) [14–16]. Considering there can be millionsand possibly billions of particles in a small rig, the FEMapproach remainstoo computationally intensive. To overcome this problem, several simpli-fied force models have been proposed, some of which will be describedin Section 2.
Although these simplified force models decrease the simulationtime, they are nonetheless subject to limitations. For instance, most ofthe current models require input parameters that can hardly be mea-sured directly (e.g. spring and damping coefficients) [17]. In addition,some normal contact force models cannot yield accurate values of thenormal coefficient of restitution (CoR) when the particle impact veloc-ity changes. The CoR is defined as the ratio of the relative velocities afterand before collision. The models that are able to predict the correct be-havior of the CoR fails to approximate it accurately in comparison with
203E. Alizadeh et al. / Powder Technology 237 (2013) 202–212
experimental data. Furthermore, many of thesemodels predict a net at-traction force at the end of a collision, which is unrealistic. The details ofsuch drawbacks will be described and further discussed in Section 2.
The aim of this work is to develop a normal contact force model thatalleviates the stated shortcomings. The model parameters are adjustedto accurately predict particle/particle as well as particle/wall interac-tions. Awide range of experimentswere carried out tomeasure the nor-mal impact on a flatmetal plate of spherical particles made from awidevariety of materials. These experiments enabled the estimation of theparameters inherent to the proposed model. Experimental data fromthe literature [17–19] were also used to assess the quality of themodel in the case of two particles collisions.
The paper is organized as follows. In Section 2, the most commoncontact force models are reviewed and their limitations are discussed.In Section 3, the experimental procedure and materials used for theparticle/wall contact experiments are described. In Section 4, the pro-posed collisionmodel is introduced andmodel parameters are obtainedfor several materials in the case of particle/particle and particle/wallcollisions. In Section 5, the model is assessed bymeans of experimentaldata and results obtained with other non-linear models. Finally,Section 6 provides concluding remarks.
2. Contact forces
The way particle collisions are taken into account in the DEM isrecalled. Next, the most common contact force models are presentedand their limitations are discussed.
2.1. Collision of particles
Most DEM simulations involve spheres. A collision between twospheres with this model is schematized in Fig. 1. The contact forceacting between them can be decomposed into normal and tangentialcomponents. In this study, we focus on normal contact forces.
In the DEM, the particle deformation during contact is characterizedby a small particle overlap δ:
δ ¼ max 0; Ri þ Rj
� �− xi
→− xj→
� �: n→
n o; ð1Þ
where Ri and Rj are the radii of contacting particles i and j, xi→
and xj→
aretheir positions, and n
→is the normal unit vector, which is perpendicular
Fig. 1. Collision of two spheres.
to the tangent unit vector t→. The relative velocity, vij
→, is related to the
displacement rate of the particles:
vij→¼ _δ ¼ vj
→− vi→
� �; ð2Þ
in which vi→
and vj→
are the velocities of particles i and j, respectively. InFig. 1, ωi
→and ωj
→are the angular velocities of these particles, although
particle rotation is not relevant in this work. Note that vij→
will be subse-quently denoted by vij.
2.2. Normal contact force models
Normal force schemes can be divided into several groups dependingon theway the impact of the normal force on the particle overlap and therelative particle velocities is modeled. Four main groups are defined: thecontinuous potential models [20,21], the linear viscoelastic models [22], thenon-linear viscoelastic models [23–26] and the hysteretic models [27–30].Further details on force models can be found in Kruggel-Emden et al.[18]. Note that contact force models based on FEM simulation resultshave also been developed [31]. However, due to their relative complex-ity, their potential utilization within DEM has been limited [17]. Becauseof their widespread use in DEM simulations and the relatively good pre-dictions they can generally provide, we focus here on the viscoelasticmodels that are found in the literature. The continuous potential modelsare known to be inefficient for DEM simulations, whereas the accuracy ofhysteric models have been observed to depend on the material[17,18,32]. In the viscoelastic models, the contact force between two col-liding particles includes two parts, one for the elastic repulsion modeledby a spring and the other for the viscous dissipation via a dashpot [33]:
Fn ¼ Fnel þ Fndiss ¼ −Knδα−Cnδ
βvγij ; ð3Þ
where Kn is the constant of a Hookean spring and Cn is the damping co-efficient.Whenα=1,β=0andγ=1, themodel is referred to as the lin-ear spring dashpot (LSD) model. In a linear contact force model, thedamping coefficient is given by:
Note that this equation is inappropriate for DEM simulations since it as-sumes that the contact ends when the displacement first returns tozero, at which point the normal force is attractive [34,36]. The use of alinear contact model in Newton's second law of motion leads to adifferential equation that has an analytical solution with constant CoRand collision time (independent of the initial impact velocity) [37],whereas experimental and theoretical studies have shown that theCoR and the contact duration depend sensitively on the impact velocity[17,23,38–40]. In the case of LSD, the damping force is independent ofthe overlap and depends linearly on the particle relative velocities. Insuch amodel, the initial force is not zero despite the absence of the par-ticle overlap δ, which is non-physical [41]. To overcome this limitationof LSD, particle overlap δ can be added to the dissipative term, whichis the case for most of the non-linear viscoelastic models that have
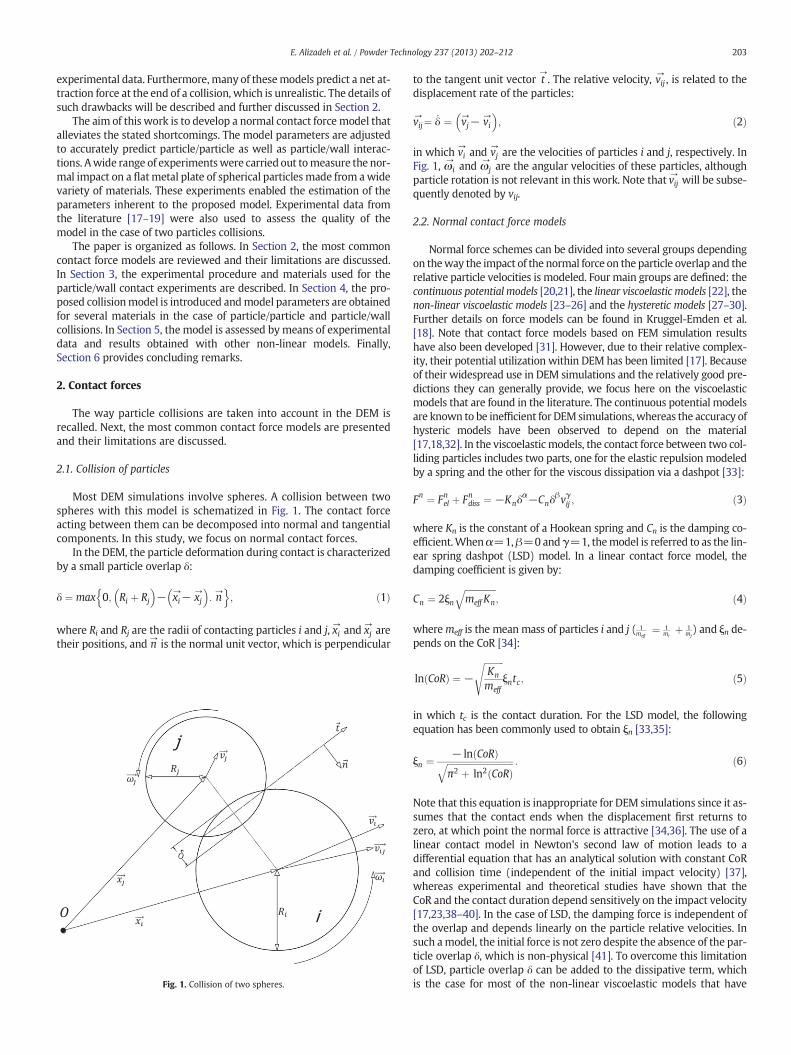
Fig. 2. Nonlinear contact force model predictions for normal impact with differentcoefficients of restitution: (a) Kuwabara and Kono (KK) model, (b) Tsuji (TS) modeland (c) normalized experimental results [41].
204 E. Alizadeh et al. / Powder Technology 237 (2013) 202–212
been developed based on the Hertz theory. Hertzian contacts are pureelastic (Cn=0 in Eq. (3)) and the spring constant (Kn) with thismodel (α=3/2) is a function of the particle geometry and its me-chanical properties:
Kn ¼ 43E�
ffiffiffiffiffiR�p; ð7Þ
where R∗ is the reduced radius ( 1R� ¼ 1
Riþ 1
Rj) and E∗ is the effective
Young's modulus ( 1E� ¼ 1−ν2
iEi
þ 1−ν2j
Ej). νi and νj are the Poisson's ratios
and Ei and Ej the Young's modulus of particles i and j, respectively. Thedrawback of such model is that it cannot resolve adequately inelasticcollisions because of the absence of a damping term. Lee and Herrmann[26] (LH) proposed a non-linear viscoelastic model (α=3/2, β=0 andγ=1) in which the elastic term in based on the Hertz theory and thedamping term depends linearly on the particle velocities. However,due to the absence of the overlap δ in the dissipative term, this modelyields a non zero force at the beginning of the contact between two par-ticles. Kuwabara and Kono [23] (KK) proposed a non-linear viscoelasticmodel with α=3/2, β=1/2 and γ=1. This model was also indepen-dently derived by Brilliantov et al. [25]. In the KKmodel, Cn is an adjust-able parameter. Results have shown that it leads to a decrease of theCoR and collision time when there is an increase in the impact velocity.Another non-linear model was derived heuristically by Tsuji et al. [24](TS) (α=3/2, β=1/4 and γ=1). This model gives a constant CoRand a velocity-dependent collision time. It appears that all thesenon-linear models for normal contact forces only differ in the exponentβ in the dissipative term.Moreover, this exponent has a strong effect onthe behavior of the model. Ramirez et al. [38] proved that the depen-dency of the terminal velocity on the initial velocity vanishes if
2 β−αð Þ þ γ 1þ αð Þ ¼ 0: ð8Þ
This is the case for the LSD and the TSmodels. In practice, it appears thatthis dependency of the terminal velocity on the initial velocity has oftenbeen overlooked or ignored.
Another drawback of the non-linear viscoelastic models is encoun-tered when there is an inelastic impact between two particles. Fig. 2shows the variation of the normal contact force versus the contact dura-tion both numerically (Fig. 2a and b) and experimentally (Fig. 2c). Thenumerical data are typical results that have been obtained for stainlesssteel spheres using aMATLAB implementation of the KK and TSmodels.Onemay notice that the repulsive contact force decreases from zero to aminimum, then increases back to zero. For nearly elastic collisions(CoR=1), the contact force profile is symmetric, whereas for inelasticcollisions it is not (CoRb1). In this latter case, the numerical modelsfail to predict accurately the contact force at the end of the collision.This can be seen in Fig. 2a and bwhere the force switches from repulsiveto attractive, whereby pulling the particles back towards each other in-stead of forcing them to split. Indeed, this attractive force at the end ofthe collision is unrealistic as shown in Fig. 2c [41] and discussed in theliterature [17,33,36]. To overcome this limitation, some researchershave suggested that particles should be forced to separate when theforce goes to zero, even though this corresponds to a non-zero overlap[33,37,42].
The limitations of the non-linear models have provided the impetusfor this work. A new non-linear contact force model is introduced; it isbased on CoR experimental data for the calibration of its parameters.This model is based on the Hertz theory (α=3/2) and uses β=1 anda variable value of γ for the damping term.
3. Experimental setup and materials
In this study,we have chosen to investigate the fall of single particleswhen they are launched from specific heights toward ametal plate, thusproviding adequate control over the experiments. The use of a similarprocedure has been reported in the literature [43]. In particular, the
effect on the CoR of the material type [44] and plate thickness [45] hasbeen investigated.
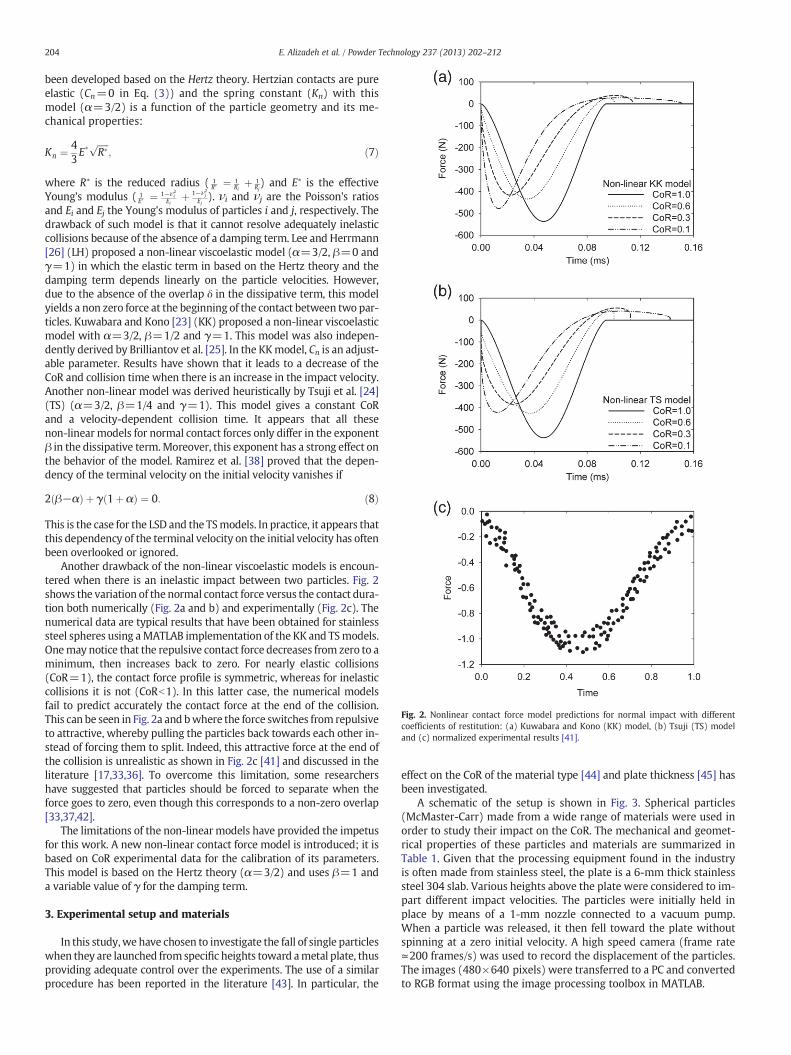
A schematic of the setup is shown in Fig. 3. Spherical particles(McMaster-Carr) made from a wide range of materials were used inorder to study their impact on the CoR. The mechanical and geomet-rical properties of these particles and materials are summarized inTable 1. Given that the processing equipment found in the industryis often made from stainless steel, the plate is a 6-mm thick stainlesssteel 304 slab. Various heights above the plate were considered to im-part different impact velocities. The particles were initially held inplace by means of a 1-mm nozzle connected to a vacuum pump.When a particle was released, it then fell toward the plate withoutspinning at a zero initial velocity. A high speed camera (frame rate≃200 frames/s) was used to record the displacement of the particles.The images (480×640 pixels) were transferred to a PC and convertedto RGB format using the image processing toolbox in MATLAB.
High speedcamera
Vacuum nozzle
Spherical particle
Stainless Steel 304 bed with level adjusment
Level adjusting screw
Vertical bench
To vacuumpump
Fig. 3. The main components of the experimental setup.
205E. Alizadeh et al. / Powder Technology 237 (2013) 202–212
Particles were dropped from six different heights, covering a ve-locity range of 0.8 to 2.6 m/s. The values for the impact velocitywere derived from the initial position of these particles and the con-servation of mechanical energy. Each test was repeated five timesunder the same conditions and the results were averaged out.
Note that no experiments were carried out in this work for the cal-ibration of the particle/particle collision parameters. Instead, we usedparticle/particle impact data from the literature to calibrate these pa-rameters [17–19]. Different approaches have been used to investigatethe impact of two particles. For instance, Stevens and Hrenya [17]used a pendulum-based experiment for the simultaneous measure-ments of the CoR and collision duration of two identical spheres un-dergoing a normal contact. Details of the impact between twospheres have also been analyzed with a high speed video camera[46–48].
4. Model development
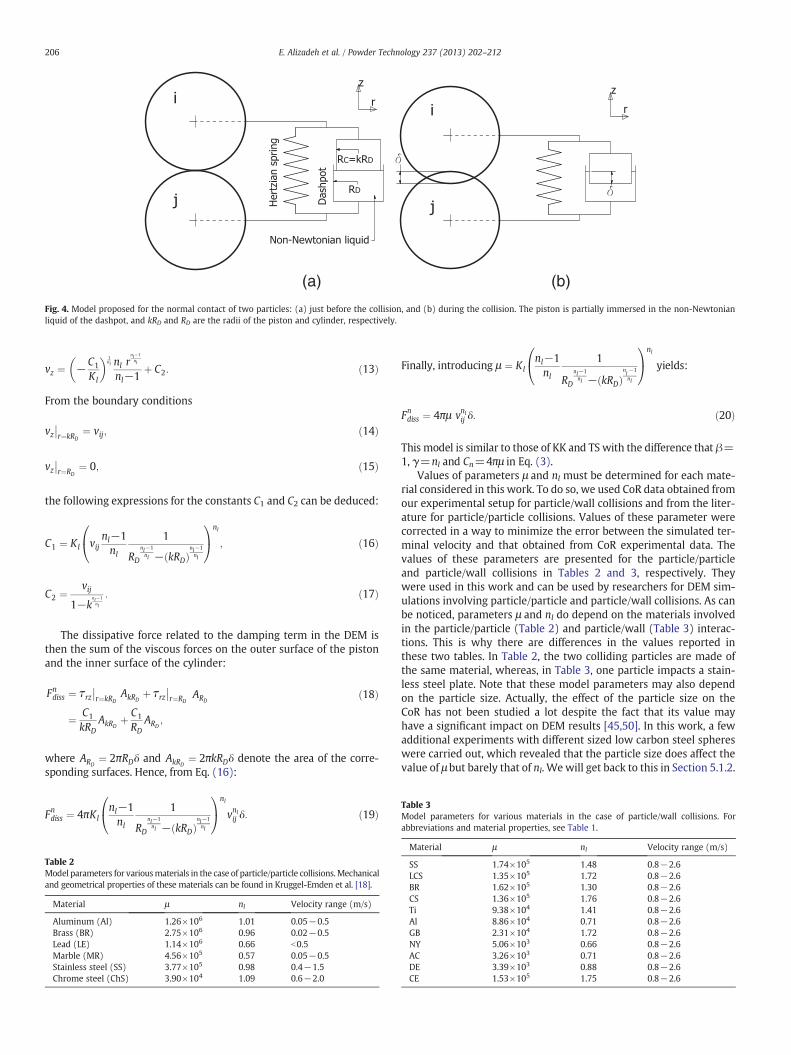
The relative velocity of two colliding particles at the contact pointin the normal direction is given by Eq. (2). We recall that, in the DEM,the particles are allowed to overlap. We propose here to predict theextent of the related normal force by means of an elastic spring anda viscous dashpot. This method of modeling the dynamic responseof a viscoelastic material is known as the Kelvin–Voigt model. Theelastic force is predicted using the non-linear Hertz law as describedin the previous section. The dashpot contains of a cylinder filled
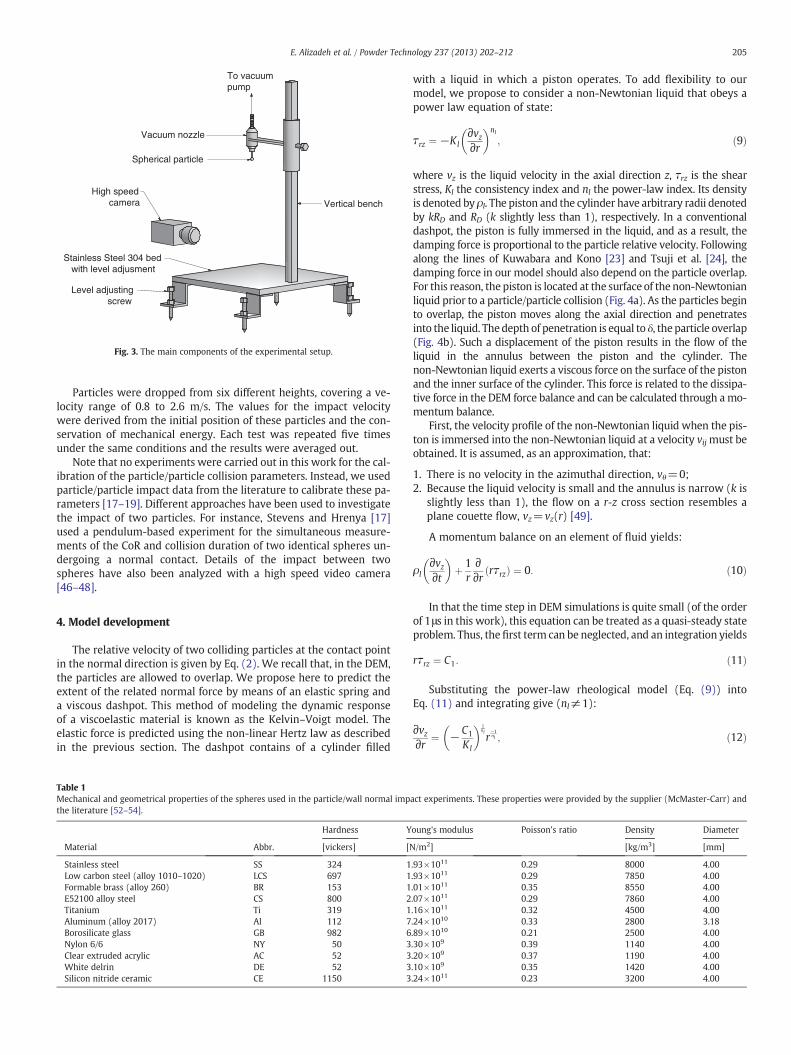
Table 1Mechanical and geometrical properties of the spheres used in the particle/wall normal impthe literature [52–54].
Hardness Y
Material Abbr. [vickers] [N
Stainless steel SS 324 1Low carbon steel (alloy 1010–1020) LCS 697 1Formable brass (alloy 260) BR 153 1E52100 alloy steel CS 800 2Titanium Ti 319 1Aluminum (alloy 2017) Al 112 7Borosilicate glass GB 982 6Nylon 6/6 NY 50 3Clear extruded acrylic AC 52 3White delrin DE 52 3Silicon nitride ceramic CE 1150 3
with a liquid in which a piston operates. To add flexibility to ourmodel, we propose to consider a non-Newtonian liquid that obeys apower law equation of state:
τrz ¼ −Kl∂vz∂r
� �nl; ð9Þ
where vz is the liquid velocity in the axial direction z, τrz is the shearstress, Kl the consistency index and nl the power-law index. Its densityis denoted by ρl. The piston and the cylinder have arbitrary radii denotedby kRD and RD (k slightly less than 1), respectively. In a conventionaldashpot, the piston is fully immersed in the liquid, and as a result, thedamping force is proportional to the particle relative velocity. Followingalong the lines of Kuwabara and Kono [23] and Tsuji et al. [24], thedamping force in our model should also depend on the particle overlap.For this reason, the piston is located at the surface of the non-Newtonianliquid prior to a particle/particle collision (Fig. 4a). As the particles beginto overlap, the piston moves along the axial direction and penetratesinto the liquid. Thedepth of penetration is equal to δ, the particle overlap(Fig. 4b). Such a displacement of the piston results in the flow of theliquid in the annulus between the piston and the cylinder. Thenon-Newtonian liquid exerts a viscous force on the surface of the pistonand the inner surface of the cylinder. This force is related to the dissipa-tive force in the DEM force balance and can be calculated through amo-mentum balance.
First, the velocity profile of the non-Newtonian liquid when the pis-ton is immersed into the non-Newtonian liquid at a velocity vijmust beobtained. It is assumed, as an approximation, that:
1. There is no velocity in the azimuthal direction, vθ=0;2. Because the liquid velocity is small and the annulus is narrow (k is
slightly less than 1), the flow on a r-z cross section resembles aplane couette flow, vz=vz(r) [49].
A momentum balance on an element of fluid yields:
ρl∂vz∂t
� �þ 1
r∂∂r rτrzð Þ ¼ 0: ð10Þ
In that the time step in DEM simulations is quite small (of the orderof 1μs in this work), this equation can be treated as a quasi-steady stateproblem. Thus, the first term can be neglected, and an integration yields
rτrz ¼ C1: ð11Þ
Substituting the power-law rheological model (Eq. (9)) intoEq. (11) and integrating give (nl≠1):
∂vz∂r ¼ −C1
Kl
� � 1nl
r−1nl ; ð12Þ
act experiments. These properties were provided by the supplier (McMaster-Carr) and
oung's modulus Poisson's ratio Density Diameter
/m2] [kg/m3] [mm]
.93×1011 0.29 8000 4.00
.93×1011 0.29 7850 4.00
.01×1011 0.35 8550 4.00
.07×1011 0.29 7860 4.00
.16×1011 0.32 4500 4.00
.24×1010 0.33 2800 3.18
.89×1010 0.21 2500 4.00
.30×109 0.39 1140 4.00
.20×109 0.37 1190 4.00
.10×109 0.35 1420 4.00
.24×1011 0.23 3200 4.00
(a) (b)
Fig. 4. Model proposed for the normal contact of two particles: (a) just before the collision, and (b) during the collision. The piston is partially immersed in the non-Newtonianliquid of the dashpot, and kRD and RD are the radii of the piston and cylinder, respectively.
Table 3Model parameters for various materials in the case of particle/wall collisions. Forabbreviations and material properties, see Table 1.
206 E. Alizadeh et al. / Powder Technology 237 (2013) 202–212
vz ¼ −C1
Kl
� � 1nl nl r
nl−1nl
nl−1þ C2: ð13Þ
From the boundary conditions
vz��r¼kRD
¼ vij; ð14Þ
vz��r¼RD
¼ 0; ð15Þ
the following expressions for the constants C1 and C2 can be deduced:
C1 ¼ Kl vijnl−1nl
1
RD
nl−1nl − kRDð Þ
nl−1nl
0@
1Anl
; ð16Þ
C2 ¼ vij
1−knl−1nl
: ð17Þ
The dissipative force related to the damping term in the DEM isthen the sum of the viscous forces on the outer surface of the pistonand the inner surface of the cylinder:
Fndiss ¼ τrz��r¼kRD
AkRDþ τrz
��r¼RD
ARD
¼ C1
kRDAkRD
þ C1
RDARD
;
ð18Þ
where ARD¼ 2πRDδ and AkRD
¼ 2πkRDδ denote the area of the corre-sponding surfaces. Hence, from Eq. (16):
Fndiss ¼ 4πKlnl−1nl
1
RD
nl−1nl − kRDð Þ
nl−1nl
0@
1Anl
vnlij δ: ð19Þ
Table 2Model parameters for variousmaterials in the case of particle/particle collisions.Mechanicaland geometrical properties of these materials can be found in Kruggel-Emden et al. [18].
This model is similar to those of KK and TS with the difference that β=1, γ=nl and Cn=4πμ in Eq. (3).
Values of parameters μ and nl must be determined for each mate-rial considered in this work. To do so, we used CoR data obtained fromour experimental setup for particle/wall collisions and from the liter-ature for particle/particle collisions. Values of these parameter werecorrected in a way to minimize the error between the simulated ter-minal velocity and that obtained from CoR experimental data. Thevalues of these parameters are presented for the particle/particleand particle/wall collisions in Tables 2 and 3, respectively. Theywere used in this work and can be used by researchers for DEM sim-ulations involving particle/particle and particle/wall collisions. As canbe noticed, parameters μ and nl do depend on the materials involvedin the particle/particle (Table 2) and particle/wall (Table 3) interac-tions. This is why there are differences in the values reported inthese two tables. In Table 2, the two colliding particles are made ofthe same material, whereas, in Table 3, one particle impacts a stain-less steel plate. Note that these model parameters may also dependon the particle size. Actually, the effect of the particle size on theCoR has not been studied a lot despite the fact that its value mayhave a significant impact on DEM results [45,50]. In this work, a fewadditional experiments with different sized low carbon steel sphereswere carried out, which revealed that the particle size does affect thevalue of μ but barely that of nl. We will get back to this in Section 5.1.2.
207E. Alizadeh et al. / Powder Technology 237 (2013) 202–212
Note that the model parameters could also be set so that the collisiontime is well predicted. However, collision times are much harder tomeasure in practice.
5. Results and discussion
During the collision of two particles, both microscopic (local) andmacroscopic (global) quantities can be measured. Microscopic quanti-ties such as force, overlap, and particle velocity, require a detailedrecord of the contact between the two colliding particles. This explainswhy only a few such experimental studies can be found in the literature(e.g. [17,19]). Macroscopic quantities such as the CoR are generally eas-ier to evaluate.
From the viewpoint ofmacroscopic quantities, the numerical resultsobtained with the proposed model are compared to the particle/wallexperimental data. An analysis is done on model parameters nl and μ.For particle/particle collisions, values of the CoR and collision time are
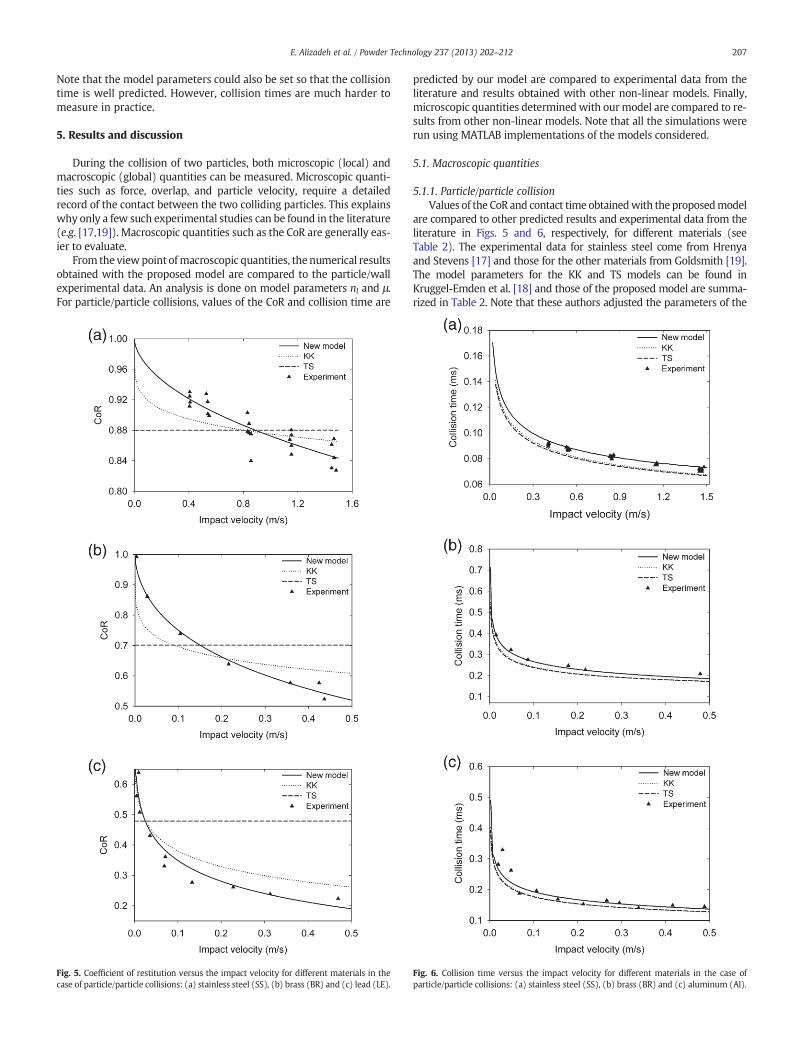
Fig. 5. Coefficient of restitution versus the impact velocity for different materials in thecase of particle/particle collisions: (a) stainless steel (SS), (b) brass (BR) and (c) lead (LE).
predicted by our model are compared to experimental data from theliterature and results obtained with other non-linear models. Finally,microscopic quantities determinedwith ourmodel are compared to re-sults from other non-linear models. Note that all the simulations wererun using MATLAB implementations of the models considered.
5.1. Macroscopic quantities
5.1.1. Particle/particle collisionValues of the CoR and contact time obtainedwith the proposedmodel
are compared to other predicted results and experimental data from theliterature in Figs. 5 and 6, respectively, for different materials (seeTable 2). The experimental data for stainless steel come from Hrenyaand Stevens [17] and those for the other materials from Goldsmith [19].The model parameters for the KK and TS models can be found inKruggel-Emden et al. [18] and those of the proposed model are summa-rized in Table 2. Note that these authors adjusted the parameters of the
Fig. 6. Collision time versus the impact velocity for different materials in the case ofparticle/particle collisions: (a) stainless steel (SS), (b) brass (BR) and (c) aluminum (Al).
208 E. Alizadeh et al. / Powder Technology 237 (2013) 202–212
KK and TS models by means of CoR experimental data. This was donecarefully by resorting to least-square fitting to minimize the discrepancybetween numerical results obtainedwith thesemodels and experimentaldata. From a qualitative point of view, the TS model fails to predict theCoR trend and the KK model does not fit well with the experimentaldata, whereas there is very good agreement between the experimentaldata and the values predicted with our model. As expected, the collisiontime decreases with the impact velocity [17,19]. It takes up infinite timewhen this velocity goes to zero, whereas it goes to zero for high collisionvelocities.
The contact time in Fig. 6 is defined as the time during which thecontact force is repulsive. As can be seen, there is good agreement be-tween the experimental data and the predictions of the currentmodel, while the KK and TSmodels underpredict the collision durationsfor these three materials. Such underpredictions are due to the largefractions of time for which an attractive force is predicted by thesetwo models. As will be further discussed in Section 5.2, such fractionof time is smaller with the proposed model. Note that in the casewhere the contact time also includes the time during which there isan attractive force, as done by Kruggel-Emden et al. [18], the perfor-mance of all three models is very good.
5.1.2. Particle/wall collisionValues of the CoR predicted with the proposed model in the case
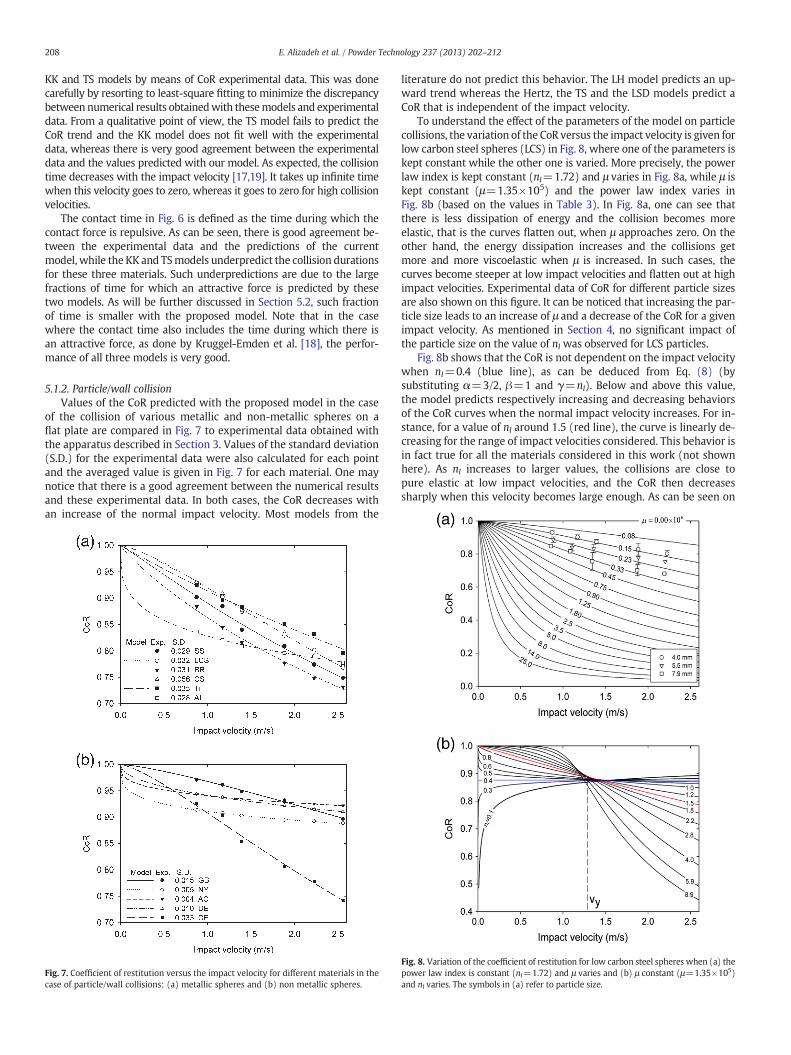
of the collision of various metallic and non-metallic spheres on aflat plate are compared in Fig. 7 to experimental data obtained withthe apparatus described in Section 3. Values of the standard deviation(S.D.) for the experimental data were also calculated for each pointand the averaged value is given in Fig. 7 for each material. One maynotice that there is a good agreement between the numerical resultsand these experimental data. In both cases, the CoR decreases withan increase of the normal impact velocity. Most models from the
Fig. 7. Coefficient of restitution versus the impact velocity for different materials in thecase of particle/wall collisions: (a) metallic spheres and (b) non metallic spheres.
literature do not predict this behavior. The LH model predicts an up-ward trend whereas the Hertz, the TS and the LSD models predict aCoR that is independent of the impact velocity.
To understand the effect of the parameters of the model on particlecollisions, the variation of the CoR versus the impact velocity is given forlow carbon steel spheres (LCS) in Fig. 8, where one of the parameters iskept constant while the other one is varied. More precisely, the powerlaw index is kept constant (nl=1.72) and μ varies in Fig. 8a, while μ iskept constant (μ=1.35×10⁵) and the power law index varies inFig. 8b (based on the values in Table 3). In Fig. 8a, one can see thatthere is less dissipation of energy and the collision becomes moreelastic, that is the curves flatten out, when μ approaches zero. On theother hand, the energy dissipation increases and the collisions getmore and more viscoelastic when μ is increased. In such cases, thecurves become steeper at low impact velocities and flatten out at highimpact velocities. Experimental data of CoR for different particle sizesare also shown on this figure. It can be noticed that increasing the par-ticle size leads to an increase of μ and a decrease of the CoR for a givenimpact velocity. As mentioned in Section 4, no significant impact ofthe particle size on the value of nl was observed for LCS particles.
Fig. 8b shows that the CoR is not dependent on the impact velocitywhen nl=0.4 (blue line), as can be deduced from Eq. (8) (bysubstituting α=3/2, β=1 and γ=nl). Below and above this value,the model predicts respectively increasing and decreasing behaviorsof the CoR curves when the normal impact velocity increases. For in-stance, for a value of nl around 1.5 (red line), the curve is linearly de-creasing for the range of impact velocities considered. This behavior isin fact true for all the materials considered in this work (not shownhere). As nl increases to larger values, the collisions are close topure elastic at low impact velocities, and the CoR then decreasessharply when this velocity becomes large enough. As can be seen on
Fig. 8. Variation of the coefficient of restitution for low carbon steel spheres when (a) thepower law index is constant (nl=1.72) and μ varies and (b) μ constant (μ=1.35×10⁵)and nl varies. The symbols in (a) refer to particle size.
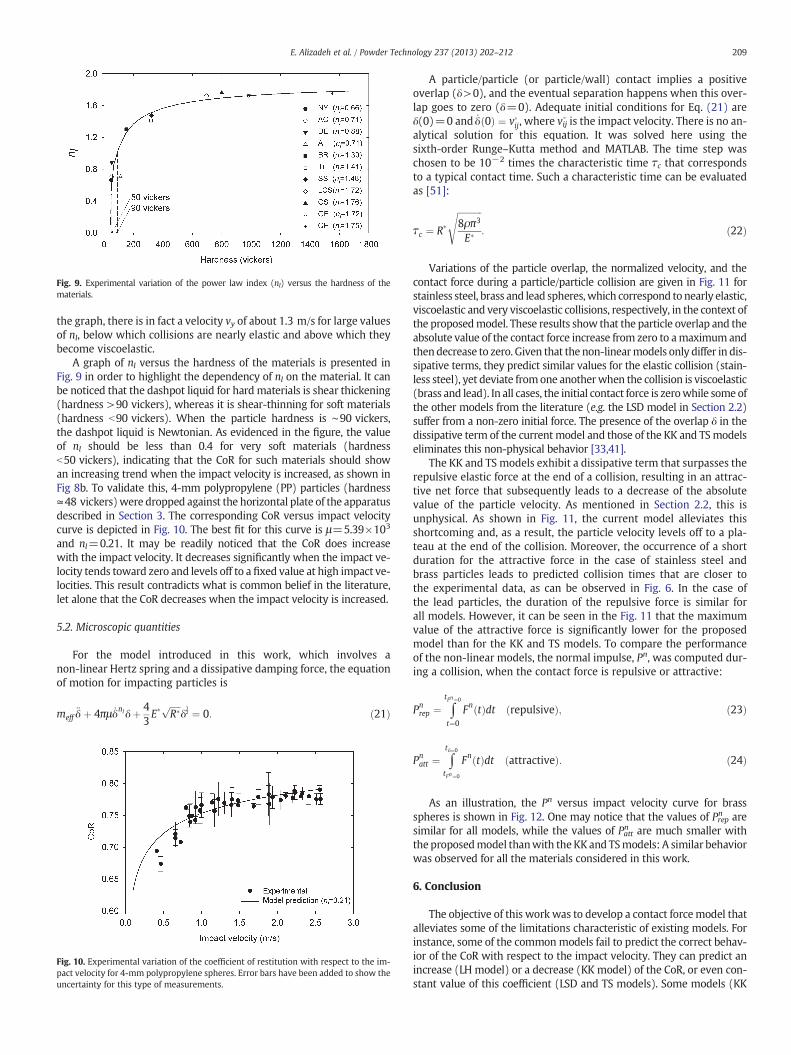
Fig. 9. Experimental variation of the power law index (nl) versus the hardness of thematerials.
209E. Alizadeh et al. / Powder Technology 237 (2013) 202–212
the graph, there is in fact a velocity vy of about 1.3 m/s for large valuesof nl, below which collisions are nearly elastic and above which theybecome viscoelastic.
A graph of nl versus the hardness of the materials is presented inFig. 9 in order to highlight the dependency of nl on the material. It canbe noticed that the dashpot liquid for hard materials is shear thickening(hardness >90 vickers), whereas it is shear-thinning for soft materials(hardness b90 vickers). When the particle hardness is ∼90 vickers,the dashpot liquid is Newtonian. As evidenced in the figure, the valueof nl should be less than 0.4 for very soft materials (hardnessb50 vickers), indicating that the CoR for such materials should showan increasing trend when the impact velocity is increased, as shown inFig 8b. To validate this, 4-mm polypropylene (PP) particles (hardness≃48 vickers)were dropped against the horizontal plate of the apparatusdescribed in Section 3. The corresponding CoR versus impact velocitycurve is depicted in Fig. 10. The best fit for this curve is μ=5.39×10³
and nl=0.21. It may be readily noticed that the CoR does increasewith the impact velocity. It decreases significantly when the impact ve-locity tends toward zero and levels off to a fixed value at high impact ve-locities. This result contradicts what is common belief in the literature,let alone that the CoR decreases when the impact velocity is increased.
5.2. Microscopic quantities
For the model introduced in this work, which involves anon-linear Hertz spring and a dissipative damping force, the equationof motion for impacting particles is
meff€δ þ 4πμ _δnlδþ 4
3E�
ffiffiffiffiffiR�pδ
32 ¼ 0: ð21Þ
Fig. 10. Experimental variation of the coefficient of restitution with respect to the im-pact velocity for 4-mm polypropylene spheres. Error bars have been added to show theuncertainty for this type of measurements.
A particle/particle (or particle/wall) contact implies a positiveoverlap (δ>0), and the eventual separation happens when this over-lap goes to zero (δ=0). Adequate initial conditions for Eq. (21) areδ(0)=0 and _δ 0ð Þ ¼ v∘ij, where vij∘ is the impact velocity. There is no an-alytical solution for this equation. It was solved here using thesixth-order Runge–Kutta method and MATLAB. The time step waschosen to be 10−2 times the characteristic time τc that correspondsto a typical contact time. Such a characteristic time can be evaluatedas [51]:
τc ¼ R�ffiffiffiffiffiffiffiffiffiffiffi8ρπ3
E�
s: ð22Þ
Variations of the particle overlap, the normalized velocity, and thecontact force during a particle/particle collision are given in Fig. 11 forstainless steel, brass and lead spheres,which correspond to nearly elastic,viscoelastic and very viscoelastic collisions, respectively, in the context ofthe proposedmodel. These results show that the particle overlap and theabsolute value of the contact force increase from zero to amaximum andthendecrease to zero. Given that the non-linearmodels only differ in dis-sipative terms, they predict similar values for the elastic collision (stain-less steel), yet deviate fromone anotherwhen the collision is viscoelastic(brass and lead). In all cases, the initial contact force is zerowhile some ofthe other models from the literature (e.g. the LSD model in Section 2.2)suffer from a non-zero initial force. The presence of the overlap δ in thedissipative term of the current model and those of the KK and TSmodelseliminates this non-physical behavior [33,41].
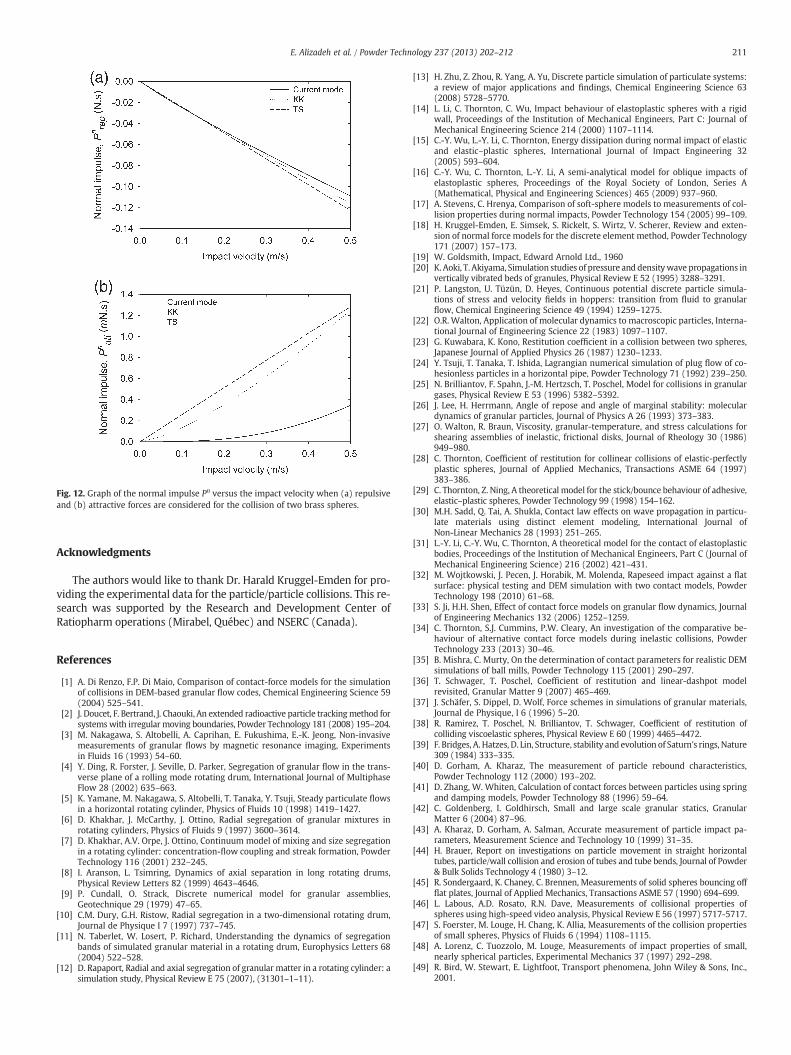
The KK and TS models exhibit a dissipative term that surpasses therepulsive elastic force at the end of a collision, resulting in an attrac-tive net force that subsequently leads to a decrease of the absolutevalue of the particle velocity. As mentioned in Section 2.2, this isunphysical. As shown in Fig. 11, the current model alleviates thisshortcoming and, as a result, the particle velocity levels off to a pla-teau at the end of the collision. Moreover, the occurrence of a shortduration for the attractive force in the case of stainless steel andbrass particles leads to predicted collision times that are closer tothe experimental data, as can be observed in Fig. 6. In the case ofthe lead particles, the duration of the repulsive force is similar forall models. However, it can be seen in the Fig. 11 that the maximumvalue of the attractive force is significantly lower for the proposedmodel than for the KK and TS models. To compare the performanceof the non-linear models, the normal impulse, Pn, was computed dur-ing a collision, when the contact force is repulsive or attractive:
Pnrep ¼ ∫
tFn¼0
t¼0
Fn tð Þdt repulsiveð Þ; ð23Þ
Pnatt ¼ ∫
tδ¼0
tFn¼0
Fn tð Þdt attractiveð Þ: ð24Þ
As an illustration, the Pn versus impact velocity curve for brassspheres is shown in Fig. 12. One may notice that the values of Prepn aresimilar for all models, while the values of Pattn are much smaller withthe proposedmodel thanwith theKKand TSmodels: A similar behaviorwas observed for all the materials considered in this work.
6. Conclusion
The objective of this work was to develop a contact forcemodel thatalleviates some of the limitations characteristic of existing models. Forinstance, some of the commonmodels fail to predict the correct behav-ior of the CoR with respect to the impact velocity. They can predict anincrease (LH model) or a decrease (KK model) of the CoR, or even con-stant value of this coefficient (LSD and TS models). Some models (KK
Fig. 11. Comparison of non-linear models in the case of a particle/particle collision: (a) nearly elastic collision (stainless steel), (b) viscoelastic collision (brass) and (c) very viscoelasticcollision (lead).
210 E. Alizadeh et al. / Powder Technology 237 (2013) 202–212
model) do predict a correct trend yet they are not sufficiently accurate.Another drawback of most existing models is the occurrence of an at-tractive force at the end of a particle collision, which reduces the abso-lute value of the particle velocity.
The model proposed in this work uses the Hertz theory to evaluatethe elastic force and a dashpot filled with a non-Newtonian liquid todissipate energy. More precisely, when two particles collide, the extentof the overlap is predicted by the depth of penetration of a piston in thisnon-Newtonian liquid that obeys a 2-parameter power lawmodel. Thevalues of these two parameters were evaluated for variousmaterials bymeans of experimental CoR data obtained from an apparatus that webuilt for particle/wall collisions and from the literature for particle/particle collisions. It was observed that the power-law index of the
non-Newtonian liquid depends on the hardness of the impacting parti-cles, and that this liquid is shear-thickening and shear-thinning for hardand soft materials, respectively. For very soft materials, the model pre-dicts an increase of the CoR with an increase of the impact velocity,which was confirmed by experimental measurements involving poly-propylene spheres. Overall, it was shown that the results obtainedwith the new model agree well with experimental data. In particular,it was observed that, contrary to existing models, this model predictsa smaller attractive force at the end of a collision.
Finally, although the proposed model is simple to calibrate, its useis restricted to the normal impact between two particles. Future workwill focus on the extension and use of this model in the more generalcase of collisions involving multiple particles.
Fig. 12. Graph of the normal impulse Pn versus the impact velocity when (a) repulsiveand (b) attractive forces are considered for the collision of two brass spheres.
211E. Alizadeh et al. / Powder Technology 237 (2013) 202–212
Acknowledgments
The authors would like to thank Dr. Harald Kruggel-Emden for pro-viding the experimental data for the particle/particle collisions. This re-search was supported by the Research and Development Center ofRatiopharm operations (Mirabel, Québec) and NSERC (Canada).
References
[1] A. Di Renzo, F.P. Di Maio, Comparison of contact-force models for the simulationof collisions in DEM-based granular flow codes, Chemical Engineering Science 59(2004) 525–541.
[2] J. Doucet, F. Bertrand, J. Chaouki, An extended radioactive particle trackingmethod forsystemswith irregular moving boundaries, Powder Technology 181 (2008) 195–204.
[3] M. Nakagawa, S. Altobelli, A. Caprihan, E. Fukushima, E.-K. Jeong, Non-invasivemeasurements of granular flows by magnetic resonance imaging, Experimentsin Fluids 16 (1993) 54–60.
[4] Y. Ding, R. Forster, J. Seville, D. Parker, Segregation of granular flow in the trans-verse plane of a rolling mode rotating drum, International Journal of MultiphaseFlow 28 (2002) 635–663.
[5] K. Yamane, M. Nakagawa, S. Altobelli, T. Tanaka, Y. Tsuji, Steady particulate flowsin a horizontal rotating cylinder, Physics of Fluids 10 (1998) 1419–1427.
[6] D. Khakhar, J. McCarthy, J. Ottino, Radial segregation of granular mixtures inrotating cylinders, Physics of Fluids 9 (1997) 3600–3614.
[7] D. Khakhar, A.V. Orpe, J. Ottino, Continuum model of mixing and size segregationin a rotating cylinder: concentration-flow coupling and streak formation, PowderTechnology 116 (2001) 232–245.
[8] I. Aranson, L. Tsimring, Dynamics of axial separation in long rotating drums,Physical Review Letters 82 (1999) 4643–4646.
[9] P. Cundall, O. Strack, Discrete numerical model for granular assemblies,Geotechnique 29 (1979) 47–65.
[10] C.M. Dury, G.H. Ristow, Radial segregation in a two-dimensional rotating drum,Journal de Physique I 7 (1997) 737–745.
[11] N. Taberlet, W. Losert, P. Richard, Understanding the dynamics of segregationbands of simulated granular material in a rotating drum, Europhysics Letters 68(2004) 522–528.
[12] D. Rapaport, Radial and axial segregation of granular matter in a rotating cylinder: asimulation study, Physical Review E 75 (2007), (31301–1–11).
[13] H. Zhu, Z. Zhou, R. Yang, A. Yu, Discrete particle simulation of particulate systems:a review of major applications and findings, Chemical Engineering Science 63(2008) 5728–5770.
[14] L. Li, C. Thornton, C. Wu, Impact behaviour of elastoplastic spheres with a rigidwall, Proceedings of the Institution of Mechanical Engineers, Part C: Journal ofMechanical Engineering Science 214 (2000) 1107–1114.
[15] C.-Y. Wu, L.-Y. Li, C. Thornton, Energy dissipation during normal impact of elasticand elastic–plastic spheres, International Journal of Impact Engineering 32(2005) 593–604.
[16] C.-Y. Wu, C. Thornton, L.-Y. Li, A semi-analytical model for oblique impacts ofelastoplastic spheres, Proceedings of the Royal Society of London, Series A(Mathematical, Physical and Engineering Sciences) 465 (2009) 937–960.
[17] A. Stevens, C. Hrenya, Comparison of soft-sphere models to measurements of col-lision properties during normal impacts, Powder Technology 154 (2005) 99–109.
[18] H. Kruggel-Emden, E. Simsek, S. Rickelt, S. Wirtz, V. Scherer, Review and exten-sion of normal force models for the discrete element method, Powder Technology171 (2007) 157–173.
[19] W. Goldsmith, Impact, Edward Arnold Ltd., 1960[20] K. Aoki, T. Akiyama, Simulation studies of pressure and densitywave propagations in
vertically vibrated beds of granules, Physical Review E 52 (1995) 3288–3291.[21] P. Langston, U. Tüzün, D. Heyes, Continuous potential discrete particle simula-
tions of stress and velocity fields in hoppers: transition from fluid to granularflow, Chemical Engineering Science 49 (1994) 1259–1275.
[22] O.R. Walton, Application of molecular dynamics to macroscopic particles, Interna-tional Journal of Engineering Science 22 (1983) 1097–1107.
[23] G. Kuwabara, K. Kono, Restitution coefficient in a collision between two spheres,Japanese Journal of Applied Physics 26 (1987) 1230–1233.
[24] Y. Tsuji, T. Tanaka, T. Ishida, Lagrangian numerical simulation of plug flow of co-hesionless particles in a horizontal pipe, Powder Technology 71 (1992) 239–250.
[25] N. Brilliantov, F. Spahn, J.-M. Hertzsch, T. Poschel, Model for collisions in granulargases, Physical Review E 53 (1996) 5382–5392.
[26] J. Lee, H. Herrmann, Angle of repose and angle of marginal stability: moleculardynamics of granular particles, Journal of Physics A 26 (1993) 373–383.
[27] O. Walton, R. Braun, Viscosity, granular-temperature, and stress calculations forshearing assemblies of inelastic, frictional disks, Journal of Rheology 30 (1986)949–980.
[28] C. Thornton, Coefficient of restitution for collinear collisions of elastic-perfectlyplastic spheres, Journal of Applied Mechanics, Transactions ASME 64 (1997)383–386.
[29] C. Thornton, Z. Ning, A theoretical model for the stick/bounce behaviour of adhesive,elastic–plastic spheres, Powder Technology 99 (1998) 154–162.
[30] M.H. Sadd, Q. Tai, A. Shukla, Contact law effects on wave propagation in particu-late materials using distinct element modeling, International Journal ofNon-Linear Mechanics 28 (1993) 251–265.
[31] L.-Y. Li, C.-Y. Wu, C. Thornton, A theoretical model for the contact of elastoplasticbodies, Proceedings of the Institution of Mechanical Engineers, Part C (Journal ofMechanical Engineering Science) 216 (2002) 421–431.
[32] M. Wojtkowski, J. Pecen, J. Horabik, M. Molenda, Rapeseed impact against a flatsurface: physical testing and DEM simulation with two contact models, PowderTechnology 198 (2010) 61–68.
[33] S. Ji, H.H. Shen, Effect of contact force models on granular flow dynamics, Journalof Engineering Mechanics 132 (2006) 1252–1259.
[34] C. Thornton, S.J. Cummins, P.W. Cleary, An investigation of the comparative be-haviour of alternative contact force models during inelastic collisions, PowderTechnology 233 (2013) 30–46.
[35] B. Mishra, C. Murty, On the determination of contact parameters for realistic DEMsimulations of ball mills, Powder Technology 115 (2001) 290–297.
[36] T. Schwager, T. Poschel, Coefficient of restitution and linear-dashpot modelrevisited, Granular Matter 9 (2007) 465–469.
[37] J. Schäfer, S. Dippel, D. Wolf, Force schemes in simulations of granular materials,Journal de Physique, I 6 (1996) 5–20.
[38] R. Ramirez, T. Poschel, N. Brilliantov, T. Schwager, Coefficient of restitution ofcolliding viscoelastic spheres, Physical Review E 60 (1999) 4465–4472.
[39] F. Bridges, A. Hatzes, D. Lin, Structure, stability and evolution of Saturn's rings, Nature309 (1984) 333–335.
[40] D. Gorham, A. Kharaz, The measurement of particle rebound characteristics,Powder Technology 112 (2000) 193–202.
[41] D. Zhang, W. Whiten, Calculation of contact forces between particles using springand damping models, Powder Technology 88 (1996) 59–64.
[42] C. Goldenberg, I. Goldhirsch, Small and large scale granular statics, GranularMatter 6 (2004) 87–96.
[43] A. Kharaz, D. Gorham, A. Salman, Accurate measurement of particle impact pa-rameters, Measurement Science and Technology 10 (1999) 31–35.
[44] H. Brauer, Report on investigations on particle movement in straight horizontaltubes, particle/wall collision and erosion of tubes and tube bends, Journal of Powder& Bulk Solids Technology 4 (1980) 3–12.
[45] R. Sondergaard, K. Chaney, C. Brennen, Measurements of solid spheres bouncing offflat plates, Journal of Applied Mechanics, Transactions ASME 57 (1990) 694–699.
[46] L. Labous, A.D. Rosato, R.N. Dave, Measurements of collisional properties ofspheres using high-speed video analysis, Physical Review E 56 (1997) 5717-5717.
[47] S. Foerster, M. Louge, H. Chang, K. Allia, Measurements of the collision propertiesof small spheres, Physics of Fluids 6 (1994) 1108–1115.
[48] A. Lorenz, C. Tuozzolo, M. Louge, Measurements of impact properties of small,nearly spherical particles, Experimental Mechanics 37 (1997) 292–298.
[49] R. Bird, W. Stewart, E. Lightfoot, Transport phenomena, John Wiley & Sons, Inc.,2001.
212 E. Alizadeh et al. / Powder Technology 237 (2013) 202–212
[50] D. Antypov, J.A. Elliott, B.C. Hancock, Effect of particle size on energy dissipation inviscoelastic granular collisions, Physical Review E 84 (2011) 021303.
[51] M. Lemieux, G. Leonard, J. Doucet, L.-A. Leclaire, F. Viens, J. Chaouki, F. Bertrand,Large-scale numerical investigation of solids mixing in a V-blender using thediscrete element method, Powder Technology 181 (2008) 205–216.
[52] R. Bolz, G. Tuve, CRC handbook of tables for applied engineering science, CRCPress, Boca Raton, 1970.
[53] T. Gale, W.F. Totemeier, Smithells Metals Reference Book, 8th ed. Elsevier, 2004.[54] B. Kschinka, S. Perrella, H. Nguyen, R. Bradt, Strengths of glass spheres in com-
pression, Journal of the American Ceramic Society 69 (1986) 467–472.