This thesis is dedicated to my grandmother, Dr. Beatrice Bonnick, who found herself widowed
and jobless at age 38 with 3 children. Through sheer determination she put herself through
school to become Dr. Bonnick. She was strong willed, resourceful, proper and kind. It is
because of her that I came to respect the title of Dr. and the responsibility that comes with it. I
will always strive to live up to that title.
iii
Table of Contents
List of Tables ............................................................................................................................................... ix
List of Figures ............................................................................................................................................... x
Abstract ....................................................................................................................................................... xv
List of Abbreviations Used ................................................................................................................... xvi
Acknowledgements ............................................................................................................................... xvii
Figure 2-12: Effects of cell orientation, Ti and separators on cell behaviour. .................................... 73
Figure 2-13: Extended cycling to cycle 50 of the best cell designs. ........................................................ 75
Figure 2-14: Example stack pressure distributions from the two shapes of spacers tested in
this work. ........................................................................................................................................... 78
Figure 2-15: Ballooning of a sealed Ni-Zn coin cell during cycling. ......................................................... 79
Figure 2-16: PowerGenix AA cell tested in the same manner as the coin cells (also shown). ....... 82
Figure 2-17: Cycling behaviour of PowerGenix AA cells using various charging regimes. .............. 83
Figure 2-18: Comparison between the best PowerGenix AA cell and the best coin cells
produced in this work. .................................................................................................................. 85
Figure 2-19: Comparison between PKCell AA cells cycled in two different ways and the best
coin cell produced in this work. ................................................................................................. 86
Figure 3-1: A schematic of a 3-electrode Ni-Zn coin cell. ........................................................................ 93
Figure 3-2: The typical charge and discharge curves of well-behaved Ni and Zn electrodes
as well as the total cell potential (VNi – VZn) in a 3-electrode Ni-Zn coin cell. ............. 95
iH2 Parasitic H2 Evolution Current Density (or Rate/cm2)
iSD Self-Discharge Current Density (or Rate/cm2)
O1 Octahedral Structure, Repeats Every 1 Layer
OCV Open Circuit Voltage (i.e. the cell is disconnected)
P3 Prismatic Structure, Repeats Every 3 Layers
PTFE Polytetrafluoroethylene (Teflon)
rds Rate Determining Step (i.e. the slowest step)
SEM Scanning Electron Microscopy
SHE Standard Hydrogen Electrode
SS Stainless Steel
Zn(OH)4−2 Zincate Ion
xvii
Acknowledgements
First and foremost, this work would not have been possible without the support of my
supervisor, Jeff Dahn, who never lost faith in me.
Much of the equipment I used was built and designed with the help of Simon Trussler. His
jovial nature was always appreciated and I will miss our talks.
The lab was sometimes a chaotic and confusing place, and navigating it was made all the
more easier by Robbie Sanderson and David Stevens who maintained equipment, located
missing things and provided general technical advice (usually paired with a joke).
Similarly, Dalhousie’s bureaucracy was sometimes difficult to navigate and so I extend my
sincere thanks to Tanya Timmins, Krista Cullymore, Barbara Gauvin and Anne Murphy for
smoothing over the many bumps along the way.
I wish to heartily thank my good friend and colleague, Aaron Rowe, for his support and
loyalty throughout this degree. I could not have done it without him.
Several of my friends provided invaluable moral support along the way: Kathryn Duffy,
Chantalle Briggs, Dorian Lang, Mathew Tufts, Ted Campbell and Gray O’Byrne. I owe you all
a great debt of gratitude.
But above all, I must express my deepest thanks to my family, Teresa, Phil, Silver and Elaine
Bonnick, and my beloved partner, Eszter Horvath, whose patience and compassion kept me
going through the toughest of times.
1
Chapter 1: Introduction
As both electric vehicles and grid scale energy storage become more popular, the
demand for cheap, high energy density and long lasting batteries will continue to increase.1
Figure 1-1 shows the average volumetric energy densities of a few of the potential cell
chemistry alternatives to the ubiquitous sealed Li-ion cells that dominate the cell phone and
laptop markets today. The details of these volumetric energy density calculations are
covered in Appendix A. The success of each of these technologies will depend in part on the
number of people researching them.2
Central in Figure 1-1 is the LiCoO2-Carbon cell, which is the most common positive
and negative electrode combination used in Li-ion batteries. Li-ion batteries are currently
the most universally favoured rechargeable battery technology due to their combination of
relatively high energy densities (about 240 Wh/kg and 640 Wh/L) and a long cycle life of
Figure 1-1: Modeled volumetric energy densities of various promising cell chemistries. All cells in this figure are listed in the “Positive electrode active material – Negative electrode active material” format.
The LiCoO2-Carbon cell is the most commonly encountered Li-ion battery. The calculation method is discussed in Appendix A, where the values shown here are the averages of the range presented in the
leftmost column of Table A-1.
LiM
n2O
4 -
Zn
Ni -
Zn
LiC
oO
2 -
C
Air
- Z
n
Air
- L
i0
200
400
600
800
1000
1200
Mod
ele
d V
olu
me
tric
Ene
rgy
Den
sity (
Wh
/L)
2
3,000+ cycles, but they are also toxic, flammable and relatively expensive.2-6 Since the
introduction of Sony’s Li-ion cell to the market in 1991, research efforts into this technology
have increased dramatically worldwide, which has in turn increased our understanding of
Li-ion systems, and improved the technology.6 A search for “lithium ion battery” as the
topic on the Web of Science website yielded 39,236 papers, 7,928 of which were in 2014
alone.
Figure 1-1 shows that the Li-air cell has the highest theoretical energy density but
unfortunately it is also plagued with monumental technical challenges that are unlikely to
be solved within the next decade, and might never be solved.7-9 Additionally, Appendix A
demonstrates that fantastically high theoretical volumetric energy density of Li-air (> 5,000
Wh/L) is unattainable in a realistic system. Instead, the calculations in Appendix A suggest
that the high volumetric energy density of non-aqueous Li-air batteries is likely to be close
to that of Zn-air batteries, which face far fewer challenges to reach commercialization.9
Regardless, the promise of an energy density rivaling gasoline has driven many research
labs to devote significant amounts of effort to researching Li-air.10 A search for “lithium air
battery” as the topic on the Web of Science website yielded 2,574 papers, 574 of which were
from 2014.
The electrically rechargeable Zn-air battery (as opposed to the so-called
mechanically rechargeable or flow cell designs) is non-toxic, non-flammable, inexpensive,
and has large attainable gravimetric and volumetric energy densities.11-15 For example, a
Duracell 675 primary (non-rechargeable) Zn-air cell designed for a hearing aid was
discharged and measured to contain 440 Wh/kg and 1,800 Wh/L. Furthermore, recycling
zinc electrodes is neither as difficult nor as energy intensive as Li-ion positive electrode
materials.16, 17 The drawbacks to Zn-air batteries appear to be their approximately 60%
energy efficiency,9 low cycle life of less than 500 cycles18 and high self-discharge rate.19
3
These issues are a subset of those that Li-air batteries face, and the cycle life of Zn-air cells
in the mid 1990’s was already superior to that of current-day Li-air. For instance, Muller et
al. created a Zn-air cell in 1995 that cycled nearly 500 times before the air electrode failed,
and Cairns et al. created a Ni-Zn cell in 1993 that cycled over 800 times before the Zn
electrode failed.18, 20 As a rough guideline for comparison, about 1,000 cycles are required
for commercialization. In order to extend the cycle life of their Zn-air cell design, the EDF
(Electricité de France) research group has sacrificed energy density, as modeled in
Appendix A.2, by adding space between the air electrode and zinc electrode to prevent the
O2 bubbles evolved during charging from affecting the Zn electrode.21, 22 The fact that the
low energy efficiency, low cycle life and high self-discharge issues are the only barriers to a
commercial Zn-air cell9 suggest that a concentrated research effort to bring rechargeable
Zn-air cells to the market is more sensible than the efforts currently being focused on Li-air.
However, the research community is not investing nearly as much effort into Zn-air as it is
Li-air. A search for “zinc air battery” as the topic on the Web of Science website yielded only
544 papers, 55 from 2014. The low publication rate is not due to Zn-air being a new
technology: several papers published in 1968 specifically discuss using Zn-air batteries to
power electric vehicles, suggesting that the topic of Zn-air batteries has been relevant for
the past 47 years.23-26 So why are so few researchers working on Zn-air systems in
comparison to Li-air? Likely, the answer will contain political, financial, personal and
technological reasons. Although the political, personal and financial reasons are beyond the
scope of this thesis, there appear to be no technological barriers that would favour Li-air
over Zn-air.
Perhaps a better question is: What might help inspire more researchers to study Zn-
air systems? Many existing battery research labs focus on non-aqueous cells like Li-ion and
Li-air, and might lack the knowledge and/or experience to feel confident beginning work on
4
an alkaline, aqueous battery system. So how then would a lab begin to do quality research
on Zn-air cells without previous expertise? A logical first step is to create a cell to conduct
reliable experiments with. Countless cell designs exist, but two, in particular, seem to be the
most prominent in the Li-ion community: Swagelok cells and coin cells. If a means of
adapting coin cells to work with alkaline electrolyte were developed, it would help more
researchers begin their own research on Zn-air.
Due to the fact that this lab (the Dahn lab at Dalhousie University) uses coin cells for
Li-ion research, this project set out to convert the typical coin cell design to work with
aqueous, alkaline electrolyte. This task would both build expertise within the lab with
alkaline systems and create a needed test vehicle for future Zn-air electrode research. Since
this lab also did not have any previous experience making battery air electrodes, and since
the air electrode appeared to be the component limiting cycle life, it was decided that the
Ni(OH)2 electrode, commonly used in Ni-Cd and Ni-MH batteries, would be used as the
positive electrode opposite the rechargeable zinc (Zn) electrode intended to be studied.
Using a Ni(OH)2 electrode (referred to from here onwards as simply a Ni electrode) made
sense for three main reasons. First, a pasted Ni electrode can be made in the same manner
as the Li-ion electrodes that the lab already had experience making. Second, as already
mentioned Cairns et al. demonstrated that Ni electrodes had a longer cycle life than Zn
electrodes. Third, a rechargeable Ni-Zn cell uses the same electrolyte (2 to 8 M KOH) as a
Zn-air cell, which means the reactions at the Zn electrode are identical in both systems.
Hopefully, this thesis will serve as a starting point for academic, government and industrial
researchers who want to expand their research to include Zn-air or other aqueous battery
systems. To this end, Chapter 1 explains the reactions that occur in both Ni-Zn and Zn-air
systems. Chapter 2 explores the adaptation of coin cells for use with alkaline electrolyte
5
systems, namely Ni-Zn, and Chapter 3 demonstrates that the design can be adapted for use
with a reference electrode, an air electrode and a different aqueous electrolyte.
As will be discussed in Chapter 4, the self-discharge rate of rechargeable Zn
electrodes are currently studied in either difficult or possibly inaccurate ways. Chapter 4
covers a novel cycling procedure to directly measure Zn self-discharge rates that can be
used in a variety of experimental set-ups. Chapter 5 demonstrates how to measure the self-
discharge rate of an intercalation electrode such as Ni. Then, a method of measuring the
self-discharge rate of a plating/stripping electrode, such as Zn, is described in situations
where the opposing electrode is likely to finish discharging first. Finally, the results of using
Ni-Zn coin cells to test the effectiveness of additives on Zn electrode self-discharge rates are
presented.
1.1 Zinc Air (Zn-air) Cells
Zinc air (Zn-air) cells are half battery (the zinc electrode) and half fuel cell (the air
electrode). The Zn electrode is the negative electrode while the air electrode is the positive
electrode. These two electrodes are usually separated by one or more polyolefin separators
to prevent electrical contact. The separators and Zn electrode are soaked with electrolyte,
which is an aqueous KOH solution with concentrations typically ranging from 3 – 8 M (15
weight percent (wt%) to 34 wt%). Pictures of Zn-air cells are shown later in Figure 1-6 (pg.
36) and Figure 3-6 (pg. 105).
1.1.1 Benefits of Zn-Air Cells
According to Appendix A, rechargeable Zn-air cells could have a volumetric energy
density of up to 1,400 Wh/L, or nearly double that of Li-ion cells today, and a gravimetric
energy density that could also be up to double that of Li-ion, which would allow cell phones
6
to last longer and electric vehicles to drive further without increasing the size of the battery
pack. They are safe since they contain no lead (Pb), mercury (Hg) or cadmium (Cd),3 are
non-flammable because Zn and water do not burn, and are non-explosive because the cell is
open to the atmosphere. Since they can be overcharged (described in Section 1.5) without
the risks of starting a fire, battery pack designers have the option to leave out volume-
consuming cell monitoring circuitry, which would increase the volumetric energy density of
a Zn-air battery pack in comparison to Li-ion battery packs that require such circuitry. Zn-
air also has a nearly flat discharge potential curve, which eases electronic circuit design.27, 28
Additionally, the active material is easily recyclable if Zn supplies become a concern.17 Zn
can be recovered from alkaline batteries by dissolving Zn in flowing alkaline electrolyte,
which is less energy intensive than melting down cells, as in the case of Li-ion cells being
recycled to recover Co and Ni.16, 17
1.1.2 Introduction to Zinc Electrodes
Zinc electrodes can be created in either the charged or discharged state. All zinc
electrodes in this thesis were created in the discharged state and began their first cycle by
being charged, which involved the dissolution of ZnO,29
𝑍𝑛𝑂 + 𝐻2𝑂 + 2𝑂𝐻− 𝑍𝑛(𝑂𝐻)42−, (1-1)
followed by the electrochemical reduction of zincate (Zn(OH)42−):
The most likely mechanism for electroplating Zn (Reaction (1-2)) was proposed by Bockris
et al. and consists of the following 4 steps:
𝑍𝑛(𝑂𝐻)4(𝑎𝑞)2− 𝑍𝑛(𝑂𝐻)3(𝑎𝑞)
− + 𝑂𝐻(𝑎𝑞)− , (1-3)
𝑍𝑛(𝑂𝐻)3(𝑎𝑞)− + 𝑒− 𝑍𝑛(𝑂𝐻)2(𝑎𝑑)
− + 𝑂𝐻(𝑎𝑞)− (rds), (1-4)
𝑍𝑛(𝑂𝐻)2(𝑎𝑑)− 𝑍𝑛(𝑂𝐻)(𝑎𝑑) + 𝑂𝐻(𝑎𝑞)
− , and (1-5)
7
𝑍𝑛(𝑂𝐻)(𝑎𝑑) + 𝑒− 𝑍𝑛(𝑠) + 𝑂𝐻(𝑎𝑞)− , (1-6)
where Reaction (1-4) is the rate determining step (rds).29 The first step, Reaction (1-3),
likely occurs in the bulk electrolyte while Reactions (1-4), (1-5) and (1-6) occur at the
surface. As charging (plating) continues, the hydroxide ion (OH−) concentration increases
and the Zn(OH)42− concentration decreases, making ZnO dissolution favourable locally.
Discharge, or “stripping”, follows the same mechanism as charging, except backward. In
this direction the overall reaction is referred to as a dissolution/precipitation reaction since
Zn is temporarily present in the electrolyte as Zn(OH)42− before precipitating out as ZnO.
1.1.3 Introduction to Air Electrodes
Air electrodes are created in many different ways, but generally consist of some
form of carbon, binder and catalyst being pressed onto a Ni mesh.30 In primary cells (non-
rechargeable) the catalyst is usually MnO2 because it is cheap and supports a respectable O2
reduction rate of about 10 mA/cm2 at a potential of 1.35 V vs Zn.27, 30 Over the years, many
different catalyst materials have been used as bi-functional (rechargeable) catalysts that
have respectable O2 evolution and reduction rates, 31 but a comprehensive review of those
catalysts is beyond the scope of this thesis. The side facing the electrolyte wicks a thin layer
of the electrolyte over the high surface area of the electrode, thereby creating a 3-phase
region on the surface consisting of gaseous O2, liquid electrolyte and solid carbon, which is
the electron conductor. During discharge, O2 drifts into the electrode and reacts at the 3-
phase region via
𝑂2 + 2𝐻2𝑂 + 4𝑒− 4𝑂𝐻− 𝐸0 = 0.401 𝑉 𝑣𝑠 𝑆𝐻𝐸 (1-7)
to produce hydroxide ions (OH−) that flow through the liquid to the bulk electrolyte. The
mechanism of this process is complex and the reader is directed to the Encyclopedia of
Electrochemical Power Sources for an in depth discussion of the possible reaction
8
mechanisms.32 A short explanation is that O2 is reduced through one of two pathways
depending on the surface on which it is being reduced. The pathway favoured on MnO2, a
common catalyst used in air electrodes, first creates peroxide,
𝑂2 + 𝐻2𝑂 + 2𝑒− 𝑂2𝐻− + 𝑂𝐻−, (1-8)
which is then chemically decomposed by the catalyst:
𝑂2𝐻− 𝑂𝐻− +1
2𝑂2.32 (1-9)
The decomposition of peroxide is the rate determining step (rds),27 and is slow since
breaking the oxygen-oxygen bond has a high activation energy. Evolving O2 (Reaction (1-7)
backward) follows a different pathway than reduction as described by Jöerissen.32 In this
direction, the rds is the initial adsorption of OH− onto the surface.32
1.1.4 Introduction to KOH Electrolyte
The preferred electrolyte for Zn-air, Ni-Zn, and other cells is KOH dissolved in water
and then saturated with ZnO, which dissolves in solutions with a pH > 14.33 This is because
KOH is cheap and has a higher conductivity and lower freezing point than NaOH above a
concentration of about 12 weight percent (wt%) (2.4 M KOH).34 The conductivity of KOH
reaches a maximum of about 53 Ω-1cm-1 at a concentration of about 27 wt% (6.0 M KOH),
which has a freezing point of -44°C.34 The diffusion constant of OH− is extremely high for its
charge density and size due to its ability to accept a proton from an adjacent water molecule
thereby recreating itself in a new position. The diffusion constant is about 5.27 × 10⁻⁵ cm2/s
for OH− as compared with 1.96 × 10⁻⁵ cm2/s for K+ or 1.33 × 10⁻⁵ cm2/s for Na+.35
Unlike with some battery technologies, the electrolyte in alkaline cells is intimately
involved in the electrode reactions since these reactions produce and consume OH− and
H2O. Zinc electrodes operate via electrochemical dissolution and deposition and are thus
dependent on the Zn(OH)42− concentration in the electrolyte, which itself is dependent on
9
OH− concentration.36-39 Typical KOH concentrations vary from about 3.2 M to 8 M (16 wt%
to 34 wt%). High KOH concentrations are detrimental to the long cycle life of Zn electrodes
since the solubility of ZnO increases approximately with the square of the KOH
concentration14 and greater amounts of Zn dissolved in the electrolyte speeds up the rate of
“shape change” (described in Section 1.8.3 on page 29), which decreases cycle life.
Unfortunately, most positive electrodes operate more efficiently in high KOH
concentrations, and as a result the best concentration to use is the lowest that the positive
electrode will tolerate for the rates desired, with a supporting electrolyte salt to keep the
conductivity at a maximum.15 The KOH concentration used in this thesis is usually 3.2 M
(16 wt%) since that was the lowest concentration proven to work well in Ni-Zn cells at the
time this research began.20, 40
ZnO dissolves in alkaline electrolytes according to Reaction (1-1). Zn(OH)42− ions
have a tetrahedral structure and have been shown to be the dominant Zn+2 complex in KOH
solutions with a concentration greater than 1 M, although Zn(OH)42− might begin to
aggregate at high concentrations.15, 41 The dissolution rate of ZnO is slow, requiring days or
weeks to reach saturation levels if ZnO is left to sit in KOH at room temperature.36 Heating
and stirring speeds up dissolution significantly; the quickest way to saturate KOH
electrolyte with ZnO seems to be to add an excess of ZnO to the solution, greater than twice
the amount needed to reach saturation, and then shake the solution at room temperature
for at least 1 minute.36 Finally, centrifuge the solution to remove the excess ZnO.36
Interestingly, Zn discharged off the electrode into solution in alkaline electrolytes
can reach Zn(OH)42− concentrations of two to three times the ZnO saturation value
attainable by mixing ZnO powder with a KOH solution. For instance, Liu et al. prepared a
7.3 M KOH (32 wt%) electrolyte that was saturated with ZnO at a concentration of 0.64 M
Zn(OH)42−.37 They then discharged Zn into solution and measured the conductivity, finding
10
that it dropped from 0.54 Ω-1cm-1 at 0.64 M Zn(OH)42− to 0.39 Ω-1cm-1 at 1.52 M Zn(OH)4
2−.
This corresponds to a slope of about -0.16 Ω-1cm-1M-1.36, 37 Precipitating ZnO was evident
above 1.3 M Zn(OH)42−, but the maximum observed concentration was 1.52 M. This means
that the conductivity of the electrolyte close to a discharging electrode drops when
Zn(OH)42− concentrations in the Nernst layer reach more than twice the equilibrium
saturation concentration.
1.1.5 Zn-air Total Cell Reaction
By combining Zn electrodissolution and ZnO precipitation (Reactions (1-2) and
(1-1) backward) with oxygen reduction (Reaction (1-7)), the result,
2𝑍𝑛 + 𝑂2 2𝑍𝑛𝑂, (1-10)
is the total cell reaction for Zn-air. Figure 1-2 shows a schematic of the flow of ions and
molecules in a Zn-air cell during operation. It is evident that the electrolyte is intimately
involved in the reactions of this cell chemistry since the solvent itself reacts at the air
electrode during discharge and Zn electrode during charge. During cell operation an OH−
ion concentration gradient is set up, which in turn causes the electrolyte to slowly flow
Figure 1-2: Schematic of the reactions inside a Zn-air cell. The reactions proceed in a clockwise direction during charging and counter clockwise during discharging. The oxygen atoms that drift into the cell are
not the ones that end up in ZnO; rather, the ZnO oxygen atom is pulled from the closest OH− atom.
= Charge
= Discharge
4OH-
2Zn
2ZnO
2H2O
4OH-
4e-
O2
Zn-Air
11
around the cell.42 This is the basis of the ‘shape change’ phenomenon discussed in Section
1.8.3 (pg. 29).43
1.2 Nickel Zinc (Ni-Zn) Cells
Unlike Zn-air cells, sealed, rechargeable nickel zinc (Ni-Zn) cells are produced
commercially with some success, namely for high power applications like portable power
tools. Ni-Zn batteries are capable of discharge rates of about 900 W/kg and have energy
densities similar to that of Ni-MH batteries (about 170 Wh/L and 65 Wh/kg).44 Ni-Zn cells
charge at around 1.9 V and have an average discharge potential of about 1.65 V, which is
higher than other alkaline cells and is the source of their superior power capabilities in
comparison to Ni-MH and Ni-Cd cells.44
1.2.1 Purpose of Researching Ni-Zn Cells
The purpose of this thesis is to develop a test vehicle for further aqueous, alkaline
research and to highlight the trials and tribulations of developing such a system for the
benefit of other researchers who also wish to work on these systems. Given that consumer
sized, electrically rechargeable Zn-air cells are currently relegated to labs, while Ni-Zn cells
are commercially successful, and that the Zn electrode reactions are identical in the Ni-Zn
and Zn-air systems, the logical first step towards designing a test vehicle for rechargeable
Zn electrodes seemed to be the development of a Ni-Zn system. It was assumed that the Ni-
Zn system would be easier than Zn-air to get working properly since durable Ni electrodes
were prevalent and external environment issues could be avoided by using a sealed system.
12
1.2.2 Introduction to Nickel Electrodes
So called ‘pasted’ nickel electrodes are usually created in the discharged state,
Ni(OH)2, by mixing the active material (Ni(OH)2 in this case) with acetylene black or cobalt
to improve conductivity, and binder (PTFE) to hold the electrode together. More advanced
Ni active material is coprecipitated with about 3 wt% Co(OH)2 and 1 wt% Zn(OH)2 to
improve conductivity, increase the O2 evolution reaction potential (Reaction (1-7)
backward) and enhance the reversibility of Reaction (1-11), below.45-47 It is also beneficial
to coat the Ni(OH)2 active material in Co(OH)2, which is converted to CoOOH during the first
charge half-cycle. Co(OH)2 is used in lieu of carbon to boost conductivity since the carbon
promotes O2 evolution and slowly corrodes at high potentials.48 During charging, the
In practice, β-Ni(OH)2 with an O1 oxygen stacking sequence is converted to β-
NiOOH, likely with a P3 oxygen stacking sequence,50 during the first several charge cycles
through a mixed-phase charging process known as “formation” (discussed in Section 2.3.2,
pg. 54). Subsequently during discharge, any β-NiOOH present maintains its structure until
it has accepted about 80% of the H+ ions and electrons that it could theoretically hold,
depending on crystallinity and dopants.51 This reaction is a single-phase reaction described
by
𝑁𝑖3+𝑂𝑂𝐻 + 𝑥𝐻+ + 𝑥𝑒− 𝐻(1+𝑥)𝑁𝑖𝑥2+𝑁𝑖(1−𝑥)
3+ 𝑂2, (1-12)
where 0 ≤ x ≲ 0.8. As long as x remains below about 0.8, the H(1+x)NiO2 active material can
cycle as a single-phase reaction without significantly changing in size. Forcing more H
atoms into the P3 structure beyond this approximate limit (i.e. 0.8 ≲ x ≤ 1) requires more
energy (i.e. a higher overpotential) and triggers a structural change back to the O1 oxygen
stacking sequence of β-Ni(OH)2.50, 51 If the β-Ni(OH)2 is reformed like this, the next charge
Figure 1-3: A diagram illustrating the different polymorphs of Ni(OH)2 and NiOOH, and the possible phase transitions between them. The prefix “β” refers to the layered hydroxide structure that has no H2O or K intercalated within it, while the “(II)” and “(III)” refer to the oxidation state of the Ni atom (i.e. Ni
+2 and
Ni+3
). The α and γ forms of nickel hydroxide have crystal planes that are shifted and tilted due to the incorporation of H2O and K within the crystal structure. Reproduced with permission from JES.50
Decay
Charge
Discharge
Discharge
Charge
14
half-cycle must once again progress through a mixed-phase process.51 Thankfully, avoiding
the structural change and associated increase in volume is easy. A discharging Ni electrode
has two potential plateaus: The first has an average discharge potential of about 0.4 V vs
Hg/HgO that contains about 80% of the theoretical capacity of the electrode.51 The second
has an average discharge potential about 0.5 V lower than the upper plateau and contains
about 20% of the theoretical capacity.51 To avoid the structural transition, Ni electrodes are
usually only discharged to about 0.1 V vs Hg/HgO, which also means that practical Ni
electrodes can only deliver about 80% of their theoretical capacity unless active material
additives are used, like Co(OH)2 and Zn(OH)2.51, 52
γ-NiOOH is formed during overcharge, since the Ni atom can theoretically attain an
oxidation state of about +3.66 when K+ and H2O are intercalated into the structure.50
Discharging γ-NiOOH usually produces β-Ni(OH)2, but under the right conditions it can
instead discharge to α-Ni(OH)2.53 α-Ni(OH)2 is relatively unstable in highly alkaline
electrolyte though and rapidly converts to β-Ni(OH)2, so it rarely gets a chance to be
recharged into γ-NiOOH.54 Consequently, stability issues prevent an α/γ Ni electrode from
being realized. Furthermore, the large volume expansion that accompanies γ-NiOOH and α-
Ni(OH)2 formation detaches the active material from the current collector and absorbs a
significant amount of water, which dries out the separator.49 Both of these effects are
deleterious to cycle life and as such most researchers avoid γ and α polymorphs, but some
have pursued stable versions nevertheless.53, 55-58
Prior to 1984, the surface of the active material was suspected to be a hydrogel
when exposed to water since Ni(OH)2 likely has water absorbed into and onto itself.59, 60 α-
Ni(OH)2 and γ-NiOOH are known to absorb water, and other electrolyte constituents,
suggesting that this hydrogel would be made of α-Ni(OH)2 and γ-NiOOH. This gel was
theorized to grow and crack with cycling, thereby increasing the electrode resistance over
15
time.60 It should be noted that the idea of a hydrogel surface did not arise in the literature
again after 1984, although it was not disproved either.
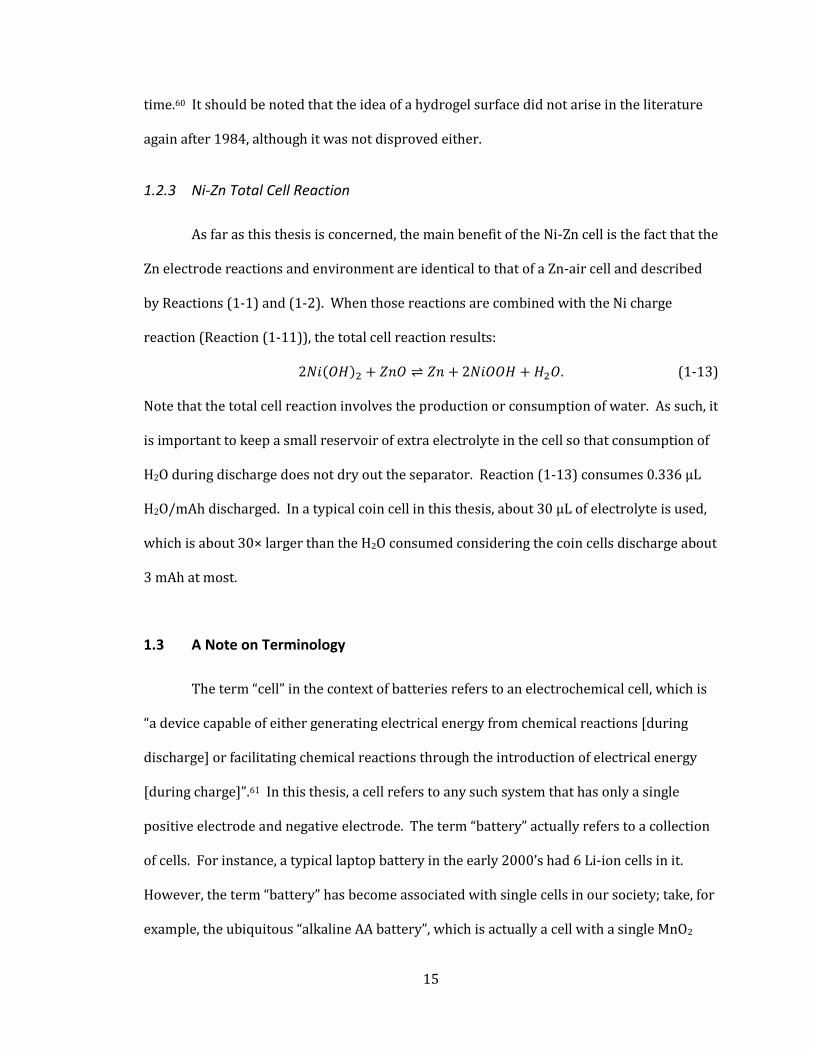
1.2.3 Ni-Zn Total Cell Reaction
As far as this thesis is concerned, the main benefit of the Ni-Zn cell is the fact that the
Zn electrode reactions and environment are identical to that of a Zn-air cell and described
by Reactions (1-1) and (1-2). When those reactions are combined with the Ni charge
reaction (Reaction (1-11)), the total cell reaction results:
2𝑁𝑖(𝑂𝐻)2 + 𝑍𝑛𝑂 𝑍𝑛 + 2𝑁𝑖𝑂𝑂𝐻 + 𝐻2𝑂. (1-13)
Note that the total cell reaction involves the production or consumption of water. As such, it
is important to keep a small reservoir of extra electrolyte in the cell so that consumption of
H2O during discharge does not dry out the separator. Reaction (1-13) consumes 0.336 µL
H2O/mAh discharged. In a typical coin cell in this thesis, about 30 µL of electrolyte is used,
which is about 30× larger than the H2O consumed considering the coin cells discharge about
3 mAh at most.
1.3 A Note on Terminology
The term “cell” in the context of batteries refers to an electrochemical cell, which is
“a device capable of either generating electrical energy from chemical reactions [during
discharge] or facilitating chemical reactions through the introduction of electrical energy
[during charge]”.61 In this thesis, a cell refers to any such system that has only a single
positive electrode and negative electrode. The term “battery” actually refers to a collection
of cells. For instance, a typical laptop battery in the early 2000’s had 6 Li-ion cells in it.
However, the term “battery” has become associated with single cells in our society; take, for
example, the ubiquitous “alkaline AA battery”, which is actually a cell with a single MnO2
16
positive electrode and a Zn negative electrode. In this thesis, the term “cell” is primarily
used, but the term “battery” is used interchangeably with “cell” when the context calls for it,
like when referring to the “battery research community”.
Also used in this thesis is the term “battery-like cell”, which is meant to conjure an
image of a commercial cell, like an AA battery. A “battery-like cell” means the cell has stack
pressure (i.e. the electrodes are being squished), a current collector and only enough
electrolyte to fill the pores in the electrodes and separators.
The definition of “electrolyte” is a substance that dissolves as ions, or a solute.
However, in the battery research community, the term electrolyte is instead used to refer to
the entire solution or other substance that conducts ions between the two electrodes. For
example, the entire solution of 3.2 M KOH, 1.8 M KF, 1.8 M K2CO3 and 0.2 M ZnO (in water) is
the electrolyte.
The “cycle life” of a cell is generally the number of times a rechargeable cell can be
recharged and discharged. A charge followed by a discharge is one cycle, while the charge
or discharge portions alone are sometimes referred to as half-cycles. Cycle life
measurements are typically graphs of discharge capacity vs cycle number, but other forms
such as average potential vs cycle number are sometimes employed.18, 20 One aspect that is
not often specifically addressed is the criterion for when a cell is considered to be at the end
of its cycle life.18 For instance, the arbitrarily chosen end of cycle life criterion within this
thesis was chosen to be 50% of the discharge capacity of the first cycle. So a hypothetical
cell that delivered 100 mAh during the first discharge has reached the end of its cycle life
when it delivers less than 50 mAh during a subsequent discharge. If that happens during
cycle 123, for example, then that cell will have had a cycle life of 123 cycles.
The “State of Charge” (SoC) of an electrode is the ratio of the charge currently stored
in it to the maximum amount of charge that the electrode could store: QPresent/QPossible.
17
Therefore, as an electrode is charged, the SoC increases until it reaches 1 when the
electrode is fully charged. Likewise, the SoC decreases during discharge until it reaches 0.
1.4 Introduction to Butler-Volmer
So far, there has been no mention of reaction rates and so a brief description of the
Butler-Volmer equation, without derivation, will be described here to aid the understanding
of concepts throughout the thesis. If the following effects are not important to a reaction:
diffusion, layer growth that slows diffusion or layer growth that changes the rate of electron
transfer from the surface to the reactants, then the Butler-Volmer equation describes the
relationship between the current and potential for a given electrochemical reaction.
𝑖𝑇𝑜𝑡𝑎𝑙 = 𝑖0 (𝑒(1−𝛽)(
𝑛𝐹𝑅𝑇
)𝜂−𝑒
−𝛽(𝑛𝐹𝑅𝑇
)𝜂) (1-14)
where iTotal is the current and i0 is called the “exchange current density” (mA/cm2) and is a
property of the reaction and the surface on which the reaction is happening. β is a
“symmetry” factor that is dependent on the mechanism of the reaction and lies between 0
and 1; β is commonly assumed to equal 0.5, as has been done for Zn.29 n is the number of
Figure 1-4: Example of Butler-Volmer curves. The brown, purple and blue curves in panel A use Eeq,H2 in 3.2 M KOH while the red curve uses Eeq,Zn. The dashed black line is the sum of the blue and red lines.
0 100 200 300 400 500
Potential vs Zn in 3.2 M KOH (mV)
-4
-2
0
2
4
Cu
rre
nt
De
nsity (
mA
/cm
2)
i0,H2 = 110-1 mA/cm2
-20 0 20
-0.8
-0.4
0
0.4
0.8
Cu
rre
nt
De
nsity (
mA
/cm
2)
i0,H2 = 510-8 mA/cm2 i0,H2 = 110-4 mA/cm2
i0,Zn = 1100 mA/cm2
Sum of
i0,Zn = 1100 and
i0,H2 = 510-8
Sum of
i0,Zn = 1100 and
i0,H2 = 510-8
Scope ofPanel B
A B
(Fast)
(Slow)
18
moles of electrons that are passed per mole of reaction, F is Faraday’s constant (96,485
C/mol ), R is the gas constant (8.31415 J/(K×mol reaction)) and T is the temperature (K).
The η is the “overpotential”, named as such because it is the difference between the
potential of the electrode and the equilibrium potential for the reaction of interest:
𝜂 = 𝐸 − 𝐸𝑒𝑞 . The first exponent in the brackets represents the rate of oxidation, while the
second exponent is the rate of reduction.
Figure 1-4 shows some example Butler-Volmer curves with different exchange
current densities and two different equilibrium potentials: one at 410 mV vs Zn, which is Eeq
for H2 evolution, and one at 0 mV vs Zn, which is Eeq for Zn. In this example, the equilibrium
potentials are realistic, but the exchange current densities are not. Panel A shows three H2
curves that use Eeq,H2 and decreasing values of i0,H2, and one curve (red) for Zn with its own
Eeq,Zn and i0,Zn. If -2 mA/cm2 were applied to the Zn electrode in this example, only H2 would
be evolved unless i0,Zn ≲ 1×10⁻⁷ mA/cm2 since H2 evolution will provide all of the required
current unless the potential of the electrode happens to be negative of Eeq,Zn. The smaller
the i0, the greater the η required to produce a specified current, and vice versa. Catalysts
have high i0’s while systems that want slow processes, like gas evolution in a battery, have
low i0’s.
The dashed, black line in panel A represents the current response of a hypothetical
Zn electrode in a system where i0,H2 = 5×10⁻⁸ mA/cm2 and i0,Zn = 1 mA/cm2 (i.e. the sum of
the red and blue curves):
𝑖𝑇𝑜𝑡𝑎𝑙 = 𝑖0,𝑍𝑛 (𝑒(1−𝛽)(
𝑛𝐹𝑅𝑇
)𝜂𝑍𝑛−𝑒−𝛽(
𝑛𝐹𝑅𝑇
)𝜂𝑍𝑛) − 𝑖0,𝐻2𝑒−𝛽(
𝑛𝐹𝑅𝑇
)𝜂𝐻2 . (1-15)
Note that some H2 will always be produced while plating Zn in this system since some of the
current is due to H2 evolution (the blue line). Panel B shows a close up of the region where
these lines cross to demonstrate that if the Zn in solution were depleted (i.e. the red line
disappeared) then the potential under a “slow” current of -0.6 mA/cm2 would not fall as far
19
as it would if a “fast” current of -0.8 mA/cm2 were used. This concept is important later and
will be referenced throughout this thesis.
1.5 Overcharging Ni-Zn and Zn-air Cells
Unless the two electrodes in a cell have exactly the same capacity, one of those
electrodes will reach the fully charged state before the other. If this happens and charging
continues, that full electrode is said to be ‘overcharging’. Overcharging is generally bad for
the cell, but why that is depends on the cell chemistry and design.
1.5.1 Electrolysis of the Electrolyte due to Overcharging
When a negative electrode is overcharged, the potential of that electrode drops until
one or more other reactions occur at high enough rates to consume the overcharge. For an
electrode submerged in water, this reaction is usually H2 evolution:62, 63
It can then diffuse to the Zn electrode where it will accept electrons and possibly precipitate
as Mn(OH)2:64, 96, 97
𝑀𝑛𝑂4(𝑎𝑞)− + 4𝐻2𝑂 + 5𝑒− 𝑀𝑛(𝑂𝐻)6(𝑎𝑞)
4− + 2𝑂𝐻−, possibly followed by (1-30)
𝑀𝑛(𝑂𝐻)6(𝑎𝑞)4− 𝑀𝑛(𝑂𝐻)2(𝑠) + 4𝑂𝐻−. (1-31)
Mn(OH)6(aq)4− that diffuses back to the air electrode can donate either one electron to
become Mn(OH)6(aq)3− ,
𝑀𝑛(𝑂𝐻)6(𝑎𝑞)4− 𝑀𝑛(𝑂𝐻)6(𝑎𝑞)
3− + 𝑒−, (1-32)
or five electrons to once again become MnO4(𝑎𝑞)− via Equation (1-30).64, 96, 97 Either way, this
process of transferring electrons through ions in the electrolyte (as opposed to through the
external circuit) is called ‘shuttling’ and steals electrons that would have otherwise gone
towards plating Zn onto the negative electrode. This shuttling process was detected in Ni-
MH cells, which also use KOH electrolyte and Mn in the metal hydride (MH) electrode, by Li
et al.98 This can be avoided by using a separate electrode to evolve O2 during charging or by
not using MnO2 as the O2 reduction catalyst.
MnO2 can also dissolve and bring about shuttling during discharge in alkaline
electrolyte if the air electrode drops below -0.1 V vs SHE (1.2 V vs Zn).96 Under these
conditions MnOOH dissolves as Mn(OH)6(aq)3− ,
𝑀𝑛𝑂𝑂𝐻(𝑠) + 𝐻2𝑂 + 𝑒− 𝑀𝑛(𝑂𝐻)6(𝑎𝑞)3− , (1-33)
diffuses to the Zn electrode, accepts an e- via Reaction (1-32) backward and finally diffuses
back to the air electrode where it drops off the electron and repeats the shuttling process.97,
98 If MnO2 is to be used, this problem can be minimized by using low alkalinity electrolytes99
(closer to 1 M KOH rather than 7 M KOH).
33
1.9.3 Carbon Corrosion
The corrosion of the carbon support during charging (discussed in Section 1.5.2) is
also a concern. If the carbon around a particle of catalyst corrodes, the particle is set adrift
in the electrolyte and no longer participates in the air electrode electrochemistry. To make
matters worse, the catalyst itself can enhance corrosion of its own carbon support.74
Carbon corrosion in general is also problematic since CO2 produced in alkaline electrolyte
can be absorbed by the electrolyte to form carbonate:30
𝐶𝑂2(𝑔) + 2𝑂𝐻− 𝐶𝑂3(𝑎𝑞)2− + 𝐻2𝑂. (1-34)
CO2 drifting in from the atmosphere in air is also absorbed in this way, eventually
precipitating out as K2CO3. This powder slowly clogs the pores of the air electrode,
eventually reducing the effective surface area of the air electrode, thereby increasing
current densities and overpotentials.30 Recently, an interpenetrated polymer network of
anionic polymer has been developed to provide OH− conductivity without allowing CO2
access to the electrolyte, extending the lifetime of an aqueous Li-air cell air electrode one
hundred-fold.100 This semi-permeable membrane can be incorporated right into the air
electrode.21
1.9.4 Water Management
Another challenge for small, electrically rechargeable Zn-air cells that do not have
resealable air holes or their own humidity-control system is the simple evaporation or
uptake of water through the holes in the canister. In commercial cells, a microporous PTFE
(Teflon) layer is sealed over the holes (inside the cell) in an attempt to slow down the
evaporation of water. As an example, a 4 cm3 prismatic, primary, Energizer Zn-air cell lost
20% of its rated capacity in 21 days (52 days to 50%) due to evaporation, although the
relative humidity was not mentioned.19 The ratio of the partial pressure of H2O from the
34
electrolyte to that of pure water compared to the relative humidity of the external
environment determines if H2O will leave or enter the cell. Figure 1-5 shows the relative
humidity that a particular concentration of KOH will be in equilibrium with.27 At relative
humidity higher than the line, water will enter the cell, while at humidity below the line
water will leave the cell. Since H2O(g) is smaller than O2(g), it is impossible to have a
membrane that would allow O2(g) through at the required rates but not let H2O(g) out. As
such, a valve to seal the Zn-air cell when not in use and/or a means of manually adding or
removing water to/from the cell are essential to extending the service-life of Zn-air cells.
1.10 Rechargeable Ni Electrode Challenges
1.10.1 Stack Pressure
Many of the early issues facing Ni electrodes have been solved in commercially
made cells, but are still a challenge for researchers making electrodes for the first time. The
first issue is maintaining contact between the active material and the conductive material or
Figure 1-5: Vapour pressure of the electrolyte (Pelectrolyte) as a function of KOH concentration at room temperature. By dividing Pelectrolyte by Pwater, the relative humidity of the environment can be compared
directly to the y-axis values to determine if water will diffuse into or out of the cell. For example, an 8 M KOH solution will lose water through evaporation if the relative humidity is < 50% and gain water if it is >
50%. This figure was created based on the data from reference 27.27
0.1
0.2
0.3
0.4
0.5
0.6
0.7
0.8
0.9
1
Re
lative
Hu
mid
ity =
Pe
lectr
oly
te /
Pw
ate
r
0 2 4 6 8 10 12 14
Concentration of KOH (M)
35
current collector. As the Ni(OH)2 is cycled, it shrinks and expands, and in the process
breaks contact with its surroundings.60, 101 The main solution to this problem is applying 50
– 100 kPa of stack pressure.101, 102
1.10.2 Conductivity
Another issue to beware of is maintaining conductivity within the Ni electrode.
Historically in the literature this was done with carbon, like acetylene black or a mixture of
acetylene black and graphite, which worked well, but corrosion prevented it from being a
perfect solution.101-103 Instead, the more permanent solution was to dope the active
material with Co(OH)2 and Zn(OH)2 to improve conductivity within the Ni(OH)2 particles
and to coat the particles in CoOOH to improve conductivity between particles.48
Conductivity of H+ within the Ni active material is also important, and improves
when the active material crystallites are smaller and less crystalline since defects in the
crystal structure aid H+ diffusion.54, 104-107 As cycling progresses, and the active material
shrinks and expands, it slowly fixes the defects and recrystallizes.51, 60, 101, 108, 109 As this
happens, the resistance of the Ni active material increases, decreasing the cell potential and
possibly the cell capacity if some H+ sites become unreachable.104, 105, 107 This issue is once
again mitigated by incorporating more permanent defects like Zn and Co into the crystal
structure.48, 109, 110 X-ray photoelectron spectroscopy (XPS) has suggested that
recrystallization of the active material also makes it pull away from the conductive material,
providing another explanation for the decrease in utilization;60 however, this issue should
be solved by applying stack pressure to the electrode.101, 102
1.10.3 Water Loss
An issue that still exists in commercial cells today is that of cell dry out.67 Ni-Zn cells
are frequently overcharged to achieve peak cell performance, but this practice slowly
36
consumes the H2O of the electrolyte. Since the Ni-Zn cell reaction (Reaction (1-13) on page
15) consumes H2O during discharge it will eventually dry out before it delivers all of its
capacity.27
1.11 Construction of Typical Ni-Zn and Zn-Air Cells
The commercial Zn-air button cell currently dominates the hearing aid battery
market due to it having the highest volumetric energy density of any cell on the market. A
size 675 Duracell Zn-air cell was discharged in the lab and had volumetric and gravimetric
energy densities of 1,800 Wh/L and 440 Wh/kg, respectively. A cut-away picture of a Zn-air
button cell is shown in Figure 1-6. The cell is made by filling most of the anode cap with
highly pure Zn mixed with 30 wt% KOH (6.8 M), leaving enough room for the Zn to expand
into as it converts into ZnO during discharge. In contact with the Zn is a microporous
separator. Pressed up against the microporous separator is the air electrode itself, which is
made of carbon and usually MnO2 as the catalyst. The carbon and catalyst mixture is
pressed onto a wire mesh or expanded metal layer that acts as the current collector.
Pressed against the opposite side of the air electrode from the Zn is one or more layers of
microporous and hydrophobic PTFE that is permeable to gases such as O2(g) and H2O(g) but
Figure 1-6: Cross section of a Zn-air button cell for a hearing aid. The Teflon film reduces water vapor exchange through the air holes. Note that there is some empty space above the zinc active material
where the ZnO can expand into as it forms.
ZnGasket
Separator Air Electrode
Teflon Film Air Flow Paper
Cap
Can
37
not to liquid water. The last layer in the stack is a gas diffusion membrane that allows O2 to
spread out over the surface of the air electrode once it has passed through the holes in the
cell canister. The gasket that seals the cell and prevents electrolyte leakage is usually
polyamide and is subjected to patented techniques to ensure electrolyte does not leak.27
1.11.2 Commercial Rechargeable Ni-Zn Cell
Commercial Ni-Zn cells are currently being produced by brands such as
PowerGenix, PKCell, UltraCell and SCPS.111, 112 Both prismatic and cylindrical designs are
available;67, 111 the cylindrical AA cells have a rated capacity of 2,500 mWh and an average
discharge potential of 1.65 V. This makes their rated capacity about 1,500 mAh and their
volumetric energy density about 325 Wh/L (a AA cell is about 1.4 cm diameter by 5 cm tall).
Figure 1-7 shows two dismantled AA cells from PowerGenix and PKCell to demonstrate
their construction and Table 1-2 lists the thicknesses of some of the components. A
cylindrical cell is made by winding the stack, consisting of the electrodes and separators,
into a cylinder (called a “jelly-roll” by the industry) and then inserting it into a cylindrical
tin-plated iron cell casing (determined using EDS).67 In the PowerGenix cell, the separator
was left open at either end of the cylindrical winding (a noted difference from the prismatic
design) so that the Zn electrode could be connected to the can through contact.67 This was
different from the PKCell design, which appeared to rely upon a metal sheath pressed up
Table 1-2: Thickness of various components in commercial, rechargeable AA Ni-Zn cells. The Zn current collector is included in the Zn electrode thickness measurement. The “Stack” is the sum of the Ni electrode, 2× non-woven separator, 2× microporous separator and Zn electrode.
Component PowerGenix AA PKCell AA
Ni Electrode 0.65 mm 0.82 mm Non-Woven Separator 0.06 mm 0.08 mm Microporous Separator 0.06 mm 0.07 mm
Zn Electrode 0.46 mm 0.43 mm Zn Current Collector 0.10 mm 0.10 mm
Stack (Zn+Ni+2×Sep.) 1.35 mm 1.55 mm
38
against the cell casing to make electrical contact between the Zn electrode and the negative
terminal. The current collector for the Zn electrode was an expanded metal foil that was
determined to be Sn-plated Cu using Energy-Dispersive X-ray Spectroscopy (EDS).113 The
Ni electrodes used a fine Ni foam as the current collector, and were connected to the cap
(below the pressure relieve valve) by a spot-welded Ni foil tab.67, 114 To clarify, the pressure
relief valve was only intended to open during abuse at 270 kPa in one case68 and at 2,000
kPa in another,67 but not under normal cell operation.
Figure 1-7: Dismantled PowerGenix and PKCell AA rechargeable Ni-Zn cells. The so-called “Jelly Roll” is the wound cylinder comprised of the Zn electrode, Ni electrode, 2× microporous separators and 2 × non-
woven separators. The difference between the cells was the method of electrically connecting the Zn electrode to the negative terminal. The PowerGenix cell relied upon the contact of the edges of the tin-plated copper current collector to the tin-plated exposed can. The PKCell relied upon a tin-plated metal
sheath that enwrapped the outer layer of the Zn electrode and pressed up against the tin-plated iron cell casing.
Jelly Roll Casing Pressure Relief Valve
Ni tabMetal Sheath
Insulated Can
PowerGenix AA PKCell AA
Exposed Can Microporous Separator
Non-woven SeparatorZn Electrode
Ni Electrode
39
The following discussion about separators is paraphrased from Cook and Kritzer,
which was a rare find in the literature in that no other author surveyed for this project had
mentioned the importance of the separators.70 The separator in an alkaline system is a key
component in the system that influences many cell properties like capacity, cycle life, power
output and charge retention. Both microporous and non-woven polyolefin or polyamide
materials are important in cells incorporating Zn electrodes. A microporous membrane,
like Celgard 3407 or 5550, is placed against the Zn electrode to prevent dendrite
penetration of the separators by retarding dendrite growth through its small and tortuous
pores. A non-woven material is placed against the positive electrode to act as an electrolyte
reservoir, which is necessary for efficient cycling since the electrolyte itself is consumed and
produced during cycling. It is worth noting that the fabrication method of the separator
(wetlaid, drylaid, spun bound or meltblown) and the post treatment both determine the
properties of the separator. Surfactant coating post treatments are the simplest and
cheapest option to grant wettability to otherwise hydrophobic polyolefins, but surfactants
leach into the electrolyte over time making this treatment unsuitable for long cycle life cells.
If the separator loses its wettability, the cell will fail despite perfectly functioning electrodes
and electrolyte. Acrylic acid grafting is the post treatment of choice for permanent and
excellent separator performance. Wetlaid fabrication, using bi-component and single-
component fibers, or meltblown fabrication is the best non-woven to use.70 In prismatic cell
designs separators are usually heat sealed tightly around the electrode, because reducing
the free volume inside the separator bag reduces shape change over many cycles.91
1.11.3 Historical Laboratory Rechargeable Ni-Zn and Zn-Air Cells
In 2009, a literature review in search of cell designs to gain insight from revealed a
variety of designs suited to specific purposes.76, 86, 87, 90, 115-117 But despite the importance of
40
measuring the effect of new discoveries on cycle life, only 18 of 84 papers read (on the topic
of Zn electrodes) reported capacity vs cycle number data. Of those 18, only 6 reported the
actual cycle life (i.e. cycled the cell to failure). Of those 6, two were from Lawrence Berkeley
Laboratory and used the same Ni-Zn cell design;20, 91 similarly, two were from the Paul
Scherrer Institut and used the same Zn-air cell design;18, 118 and the last two used
commercial cells, which are prohibitively expensive to make in an academic research lab.68,
119 The other 12 papers that showed capacity vs cycle number data stopped cycling their
cells after about 100 cycles when they felt that their point had been made.120-131 This
prevents any of the technologies being presented by these authors from being compared
with each other since the technology that lasted the longest cannot be determined.
Furthermore, the design of the cell itself is usually, and frustratingly, partially
responsible for the cycle life,20, 43, 87 which suggests that the cell design must be taken into
account when comparing results from different cell designs. Of course, this is difficult to do
and has been avoided in the lithium ion research community by the widespread adoption of
one of two standardized cell designs: the Swagelok cell and the coin cell. Having these two
cells to choose from saves countless researchers from having to re-invent a cell for every
experiment they want to run. Based on the success of choosing a standardized cell design in
the lithium ion research community, it seems like it would be beneficial to adopt a
standardized cell design in the Zn-air research community.
Ideally, every researcher would have access to commercial cells that they could
modify as they pleased during the manufacturing process, but this is untenable because
corporations are usually very secretive about their cell fabrication methods and materials,
and because the equipment is costly. Instead, researchers must make do with an imitation
of a commercial cell. These imitations usually do not reproduce the exact conditions that
the electrode would be exposed to in a real cell. For instance, some experimental cells use
41
more electrolyte than a commercial cell would use (ex: mL vs µL).20, 86, 91, 115, 132 The cycle life
of alkaline rechargeable Zn electrodes is sensitive to the amount of electrolyte in the cell
since excess electrolyte contributes to shape change.43, 87-90 Having excess electrolyte is
commonly referred to as having a “flooded” cell and means more electrolyte was used than
the amount needed to soak the separators and electrodes, which is all that is typically used
in commercial cells to keep cell weight low.20, 133, 134 Most experimental cells seem to be
flooded,20, 86, 91, 115, 122 but since about the year 2000 many authors have not reported how
much electrolyte they used.121, 123-131, 135
Many authors also do not mention stack pressure, despite the fact that the majority
of papers on alkaline Zn electrodes use Ni(OH)2 as the counter electrode, even if the
purpose of the research was for Zn electrodes to be used in Zn-air systems.131 Of the 84
papers mentioned at the beginning of this section, only two of them reported or mentioned
stack pressure.20, 91 Although, it is likely that many applied pressure to their electrodes
without measuring it since stack pressure is important to the operation of Ni electrodes as
discussed in Section 1.10.1 on page 34. As shown by the Ni electrode literature, stack
pressure is an important parameter and should thus be reported.
Regrettably, as academic research on Ni-Zn and Zn-air systems shifted groups in the
early 2000’s, many authors began omitting their cell designs from their publications.
Instead, they began to limit their experimental discussion to the electrodes (and separator,
but with no reasoning) and make no mention of stack pressure, electrolyte volumes,
electrical connection method (to the electrodes), cell casing design, or whether the cell is
sealed in the case of Ni-Zn cells.121, 123-131, 135 Of the 14 articles (of the 84) that describe their
cycle-life testing cell design in more detail, 3-electrode cell designs were the most popular
since they allowed both electrodes to be monitored independently.18, 20, 42, 68, 87, 90, 91, 115, 118-120,
122, 136-138 The 3rd electrode was usually Hg/HgO, but occasionally Zn metal was used.42
42
These cells were all greater than 5 cm in width with the earliest cells being generally larger
(11 cm × 11 cm)115 and trending towards smaller cells (5.64 cm diameter)18, 42 as time went
on. After about 2006, Zn electrodes seemed to regularly be 2 cm × 2 cm, albeit without
many cell design details mentioned.124-130 Large cells, and thus electrodes, are not ideal for
laboratory use for two main reasons. First, large cells require more material: current
collectors, separators, electrolyte and active material, any of which might be expensive or
experimental and in short supply. Second, large cells occupy more space in the lab, which is
also usually in short supply, especially when multiple cells of each design are required for
statistical purposes. This is especially true when the researcher wants to fit as many cells as
possible into a testing chamber that controls the temperature and/or humidity level at
which the cell is cycled, both of which influence the discharge capacity and cycle life.30, 121 Of
the 18 papers mentioned above that reported cycle data, only three repeated a
measurement, even once, to prove or suggest reproducibility.118, 119, 123 Reproducibility is a
vital parameter that should be reported more often in the literature.
Typical cell casings are acrylic since it is transparent and resistant to alkaline
electrolyte, but any alkaline resistant plastic is sufficient. If heat dissipation is a concern,
metal cell casings likely have higher heat dissipation rates since metal conducts heat better
than plastics, but only the researchers using commercial cells have bothered to use metal
cell casings.67, 119, 138 Borosilicate glasses (Pyrex) have been used in some fundamental
electrochemical experiments83 on Zn electrodes, but since alkaline solutions are known to
etch glass, caution should be exercised with experiments that might be sensitive to
From their introduction to the market in 1991 by Sony, Li-ion cells have grown from
an R&D interest to sales in the billions of units per year.6 One factor that contributed to
widespread R&D on Li-ion technology was the laboratory coin cell. Lab-scale coin cells
enabled researchers to more easily reproduce others’ results and compare data sets since
everyone was using the same generic hardware. No hardware that fulfils this role currently
exists for aqueous cell designs in R&D labs.
Figure 1-8 shows the lab-scale Li-ion coin cell. The casing top (a.k.a. the cap), casing
bottom (a.k.a. the can), spring and spacer are all made of stainless steel. When purchased in
lots of 100,000 parts, the caps and cans cost $0.20 each, the springs cost about $1.00 each
and the spacers cost $0.05 each.140 After use, the caps and cans are disposed of, but the
springs and spacers are recovered and infinitely reusable. The gasket is polyamide and is
Figure 1-8: A Li-ion coin cell designed for laboratory R&D. The counter/reference electrode is usually pure Li foil but it can also be a negative electrode material spread, like carbon. The separator is usually
microporous. The coin cell is constructed and crimped (sealed) in a glove box to avoid H2O and O2 exposure.
Casing Top (Negative Terminal)
Gasket
Disk Spring
Stainless Steel Spacer
Counter/Reference Electrode
Separator
Working Electrode
Casing Bottom (Positive Terminal)
Cap (SS 304)
Gasket
Cone Spring (SS 304)
Spacer (SS 304)
Li Foil Counter Electrode
Working Electrode
Can (SS 444)
Microporous Separator
44
squished between the cap and can during crimping (sealing). The counter/reference
electrode is usually pure Li foil, but it can also be a negative electrode material spread, like
carbon, on copper foil. The separator is a hydrophobic, microporous polyolefin material
that, when combined with stack pressure, prevents Li dendrites from short circuiting the
cell. The “working electrode” in Figure 1-8 is the positive electrode, which is a mixture
comprised of positive electrode active material (usually a powder), conductive additive
(carbon) and binder spread onto aluminum foil.
Coin cells have several benefits: Primarily, they are small. This means they use
small amounts of active materials, current collector, separator and electrolyte. Small cells
also occupy less space in the lab and allow multiple cells to be fit in reasonably sized boxes
that allow other factors like temperature and humidity to be controlled.141 Finally, the small
electrode size and metal casing minimizes the heat buildup in the cell, increasing confidence
that the electrodes are maintained at a constant temperature throughout the experiment.
Another general benefit is the close reproduction of the environment experienced by a Li-
ion electrode in a commercial cell. This means that with regard to a commercial Li-ion cell,
the coin cell electrodes can be made with the same thickness, the stack pressure can be
tuned to the same value and a minimal amount of electrolyte can be used.6
Super C45 carbon (TIMCAL) and 5 % CoO (Alfa Aesar). Both the carbon black and CoO are
conductive additives to improve electrode behaviour. About 2 g of the solids and about 4 g
of N-methylpyrrolidone (NMP, the liquid and binder’s solvent) were added to a 30 mL
Nalgene bottle with 2 ZrO2 pellets (9 mm diameter) and subsequently mixed in a planetary
mixer (Mazerustar) for 10 min. Note that simply shaking the bottle or vial by hand in place
of using a planetary mixer might be sufficient. The resulting slurry was spread on 25 μm
thick Ni foil (McMaster Carr) using a 152 μm notch bar and dried in air at 120 °C for 2 hours
before calendaring the spread at 100 MPa (actual pressure on spread149) with unheated
48
rollers. 1.27 cm diameter electrodes were then punched from the spread with a sacrificial,
single layer of 22 μm thick Al foil on top of the spread to prevent burrs on the disk edges.
The Zn electrode material (about 3 g) consisted of 93.5 % ZnO, 1.7 % carboxymethyl
cellulose sodium salt (Aldrich, Typical MW 90,000), 2.8 % PTFE (Dupont, as a 60.4 % PTFE
dispersion in water) and 2 % PbO (Aldrich). These were added to a stainless steel ball mill
vial (DPM Solutions) with four 12 mm diameter hardened stainless steel balls and enough
distilled water (about 6 g) to yield the desired final viscosity, which is thin enough to be
spread uniformly but viscous enough to maintain its shape after spreading. The vial was
shaken in a shaker for 20 min (at about 2 cycles/s) and then spread on 10 μm thick Cu foil
with a 216 μm notch bar before the slurry had a chance to solidify. The spread was dried in
air at 120 °C for 20 min and then left at room temperature overnight to finish drying. The
shaking time and drying time are important in getting the material to stick to the Cu foil.
The dried spread was calendared with unheated rollers under about 100 MPa and then 1.27
cm diameter electrodes were punched from it using a sacrificial layer of weigh paper to
prevent burrs on the disk edges. The electrode material mass in each electrode was
determined by weighing the electrode and subtracting the mass of the foil disk, as will be
described in Section 2.3.1.
2.2.2 ZnO Purity
Impurities within the Zn active material can act as local cathodic sites for H2
evolution and increase the Zn corrosion rate.82 Table 2-1 shows the purity of the ZnO
materials that were used in this thesis and compares them to typical battery-grade Zn used
in primary alkaline cells.82 The reagent grade ZnO acquired from Anachemia (in 1988) was
used for most of the research in this thesis (including this chapter), while the 99.999% pure
Alfa Aesar ZnO was used in the 3-electrode foil experiments of Chapter 4. Both powders
49
appear to contain acceptable levels of impurities. According to Kita, the exchange current
densities (equilibrium rate of reaction) of H2 evolution in acid of Co, Fe and Ni are the
largest of the elements in Table 2-1 and thus the quantity of those elements should be kept
as low as possible.14, 65
2.2.3 Ni-Zn Coin Cell Design
Figure 2-1 shows the components and order of their assembly into a 2325 (23 mm
diameter by 2.5 mm height) coin-type cell. The cap, can (304 and 444 stainless steel (SS)
grades, respectively, from Kaga Steel, Japan), disc spring (17-4 SS, 18 mm O.D., 6.2 mm hole,
0.4 mm thickness, 0.6 mm dish, from Key Bellevilles, USA) and spacer (304 SS, 18 mm
diameter, 0.81 mm thick, from Boker’s, USA) were stainless steel parts that had been
completely electroplated with Ni in the case of the cap, spring and spacer, or tin (Sn) in the
Table 2-1: Elemental analysis of the two ZnO powders used in this thesis and the typical concentrations found in primary alkaline battery Zn active material. All concentrations are in ppm by mass. Note that the ICP-OES machine used to analyze the ZnO powders was not capable of measuring quantities below certain limits as noted and that the error of these measurements is about 5%.
Element Anachemia
ZnO Alfa Aesar
ZnO Battery
Grade Zn
Ag 0.6 < 0.1 1.56 Al < 0.5 < 0.5 0.14 As < 5 < 5 0.01 Ca 0.7 0.9 0.20 Cd 2 4 4.20 Co < 1 < 1 0.05 Cr < 0.5 < 0.5 0.10 Cu < 0.5 < 0.5 1.50 Fe < 0.5 < 0.5 4.00 Mg 0.1 < 0.1 0.03 Mo < 1 < 1 0.04 Ni < 1 < 1 0.20 Sb < 25 < 25 0.09 Sn < 25 < 25 0.10 V < 1 < 1 0.001
50
case of the can (Toronto Aerospace Finishing, Canada). The caps had a 1 mm diameter hole
drilled through them that was covered with a piece of scotch tape to form a primitive
pressure release valve. The spacers had a slight concavity due to the punching process used
to make them and both the spring and spacer were oriented concave-side up in this figure.
The concavity in the spacer is not crucial. The non-woven separator was a wet-laid, acrylic
acid grafted polyolefin called 700/30K from Freudenberg. The microporous separator was
a tri-layer polyolefin called Celgard 3407 from Celgard. The electrolyte was a low Zn(OH)42−
solubility electrolyte optimized by Cairns’ group20 that consisted of 4 M KOH (Alfa Aesar,
85% min.), 2 M KF (Sigma-Aldrich) and 2 M K2CO3 (Aldrich) in nanopure water (> 18 MΩ)
and then saturated with ZnO. About 29 μL ± 4 μL of electrolyte were dropped onto the
Figure 2-1: Coin cell components and their order of assembly. Coatings were electroplated. The electrodes consist of a thin layer of “electrode material” on a foil current collector (CC).
Casing Top (Negative Terminal)
Gasket
Disk Spring
Stainless Steel Spacer
Counter/Reference Electrode
Separator
Working Electrode
Casing Bottom (Positive Terminal)
Cap (Ni-coated)
Gasket
Cone Spring (Ni-coated)
Spacer (Ni-coated)
Ni(OH)2 Electrode
Non-woven Separator
ZnO Electrode
Can (Sn-coated)
Microporous Separator
51
separators during cell assembly. The cells were constructed in open air and sealed with a
cell crimper (DPM Solutions).
The above procedure describes the typical cell design, referred to hereafter as the
“standard” coin cell design, to which other cell hardware options will be compared in this
chapter. Other cell parts tested include: stainless steel parts (same sources as above), Sn
electroplated caps, springs and spacers (Toronto Aerospace Finishing), Ti spacers (Boker’s,
USA), thin, flat Ni spacers (NRC, Canada), brass cans (DPM Solutions), Cu sputter-coated
and 25 μm thick Sn foil current collectors (99.9% Alfa Aesar).
Commercial AA Ni-Zn cells by PowerGenix and PKCell were acquired from
Amazon.com and eBay.ca, respectively. When asked, PowerGenix could not determine how
old the cells were.
2.2.4 Cell Cycling Procedure
Cells were charged and discharged using a Maccor series 4000 battery tester with a
time-limited charge and a lower voltage cut off of 1.4 V during discharge. The first 5 cycles
were considered ‘formation’ cycles to activate the Ni(OH)2 active material in line with
popular practices.142 These cycles were performed at a C/1 rate and charged to 100% of
their theoretical capacity (QT). The “C” in “C/1” means QT and the denominator means “in 1
hour”; hence, a cell cycled at a “C/1 rate” should reach full charge in 1 hour, and then fully
discharge in the next 1 hour. Cycles 6 – 20 were cycled at a C/2 rate and charged to 120%
QT to finish activating the material. Cycles 21 – 50 were also cycled at C/2 but only charged
to 105% QT since, according to the literature, oxygen evolution consumes about 2% of the
total charge delivered to a Ni electrode depending on the charge rate.44 Cells were cycled in
52
a temperature controlled box kept at 20.0 ± 0.5 °C in a cap-side up orientation unless stated
otherwise.
2.2.5 Cyclic Voltammogram Measurement Procedure
Cyclic voltammograms of stainless steel (SS) and Ni were measured in 3.2 M KOH
using a Bio-logic VMP3 potentiostat with a 20 mV/s sweep rate on 1 cm × 2 cm SS or Ni foils
(McMaster Carr) that were dipped 1 cm deep into the electrolyte. The reference electrode
was a Hg/HgO electrode from Koslow Scientific with a 4.5 M KOH filling solution. The
counter electrode was Ni foil with a large surface area (~ 10 cm2).
2.2.6 Cell Thickness Measurement Procedure
The cell thickness (or ballooning) measurement was done at room temperature
with a standard cell using the Bio-logic VMP3 and a Durham Instruments DC-EC 500
AccuSens LVDT to measure the cell thickness. The cell was subjected to formation cycling
for 10 cycles and then was cycled at a C/2 rate, charged to 120% QT and discharged to 1.4 V.
2.2.7 Stack Pressure Measurement Procedure
Stack pressure measurements were performed using Fujifilm Prescale ‘Super Low’
pressure film (Sensor Products, USA). Disks of the pressure film were punched using the
same precision punch used to punch the electrodes, thereby making them the same area.
During cell assembly, the pressure film was placed where the Ni electrode would be placed
in an actual cell, followed by the two separators and finally the can. No Zn electrode, Ni
electrode or electrolyte was used. The cell was crimped (sealed) and then dismantled
carefully to retrieve the pressure film without applying any more pressure to it. The colour
of the film was compared to the colour shade chart, provided with the pressure film, to give
a rough pressure measurement. Since the pressure film was about 70 µm thicker than the
53
combination of the Zn and Ni electrodes, the measured pressure was higher than what
actual electrodes would experience.
2.3 Ni-Zn Coin Cell Results and Discussion
2.3.1 Electrode Capacity Determination
An electrode consists of a foil disk with a homogeneous, uniform layer of electrode
material stuck to it. The mass of electrode material on an electrode can be calculated by
subtracting the mass of the foil disk from the mass of the whole electrode; however, doing
this assumes that the mass of every punched foil disk is the same. The theoretical capacity
(QT) of the electrode can then be calculated as follows,
QT =(𝑚𝐸𝑙𝑒𝑐𝑡𝑟𝑜𝑑𝑒−𝑚𝐹𝑜𝑖𝑙)∙𝑤𝑡%𝐴𝑀
𝑀𝑀𝐴𝑀∙
𝑛𝐹
3.6 𝐶𝑚𝐴ℎ
, (2-1)
where m = mass, AM = active material (Ni(OH)2 or ZnO in this case), MM = molar mass,
wt%AM = weight percent of the active material in the electrode material (81% or 93.5% in
the case of Ni and Zn electrodes in this chapter), n = the number of electrons transferred in
the relevant reaction (Reactions (1-2) and (1-11) in this case) and F = Faraday’s constant.
Table 2-2 shows the error in QT associated with the variation in foil disk mass. Since
the discharge capacities in this section were limited by the Ni electrode, the error in
utilization that stems from the mass error is between 2.0% and 2.5% depending on the
capacity of a given Ni electrode. QT for Ni electrodes in this work ranged from 1.2 to 1.5
Table 2-2: Error in QT associated with assuming all foil disks have equal mass. This error was calculated with 95% confidence and using either 234 mAh/g for Ni electrodes or 616 mAh/g for Zn electrodes.
Electrode Foil
Material Sample
Size Mean Mass
(mg) Standard Dev. (mg)
Capacity Error
(mAh)
Ni Ni 9 26.71 0.064 0.030 Zn Cu 52 11.13 0.038 0.047 Zn Sn 8 24.03 0.071 0.088
54
mAh, which meant C/2 currents were from 600 to 750 μA. In this chapter, cells had a Zn:Ni
capacity ratio of 3.5:1 to 4.5:1, since the formation of the Ni electrode and the behaviour of
the cell components was the focus of study.
2.3.2 Formation Cycling of Ni Electrodes
A unique feature of Ni(OH)2 electrodes is their requirement of “formation” or
“activation” cycles before the active material is fully utilized. Theoretically, these cycles
form a conductive network within the initially non-conductive active material particles,
allowing all of the active material to participate electrochemically via Reaction (1-11) (pg.
12).52, 60, 108 For cells in this study, formation cycles were considered to be the first 5 cycles;
however, it is evident from the increasing discharge capacities in the figures below that
formation continues to occur incrementally if the Ni electrode is overcharged in subsequent
cycles.
Figure 2-2 shows the formation cycles of a standard cell and a cell that is standard
except for a Sn foil Zn electrode current collector (CC) instead of Cu foil. As will be seen
later, the Sn foil CC promotes a longer cycle life than a Cu foil CC. Figure 2-2 also shows that
Sn current collectors have a lower overpotential for Zn plating than Cu, which results in a
Figure 2-2: Formation cycles of Ni-Zn coin cells. These cells were cycled at a QT/1 h rate, charged to 100% QT and discharged to 1.4 V. The flat plateaus at the top of charge are a combination of O2 evolution and
“formation” reactions in the Ni electrode.
0 2 4 6 8
Time (h)
1.4
1.6
1.8
2
2.2
Cell
Po
ten
tia
l (V
)
Standard Cell
Sn Current Collector
55
lower charge and O2 evolution plateau near the end of charge.
Figure 2-3 and Figure 2-4 show differential capacity (dQ/dV) versus cell voltage for
selected cycles of the cells described in Figure 2-2, and depict a clearer picture of the
processes occurring during the formation cycles. Note that the curves in Figure 2-3 and
Figure 2-4 most likely arise solely from the Ni electrode since plating Zn requires no
formation cycling and has a relatively flat potential profile during charge as will be shown
later in Section 3.1.2 (pg. 94).15 These Zn electrodes also had a capacity > 5× that of the Ni
electrode, ensuring that no change in the Zn electrode potential occurred as it would have if
all the available Zn had been plated.
During the long flat plateau in the first cycle in Figure 2-2, which corresponds to the
spike around 1.9 V in Figure 2-3, many reactions occur in the nickel electrode including
Figure 2-3: Differential capacity plots for the first 2 cycles of the two cells shown in Figure 2-2. For example, “Sn CC c2” means the 2
nd cycle of a cell with standard components except tin foil has been used
as the current collector instead of copper. The y-axis has been scaled to QT to allow peak intensity comparisons between the two cells.
1.4 1.5 1.6 1.7 1.8 1.9 2
Cell Potential (V)
-6
-4
-2
0
2
4
6
(dQ
/dV
) /
QT (
1/V
)
Cu CC c1
Cu CC c2
Sn CC c1
Sn CC c2
Ch
arg
eD
isch
arg
e
56
conversion of much of the active material to -NiOOH, the formation of a CoOOH conductive
layer on the active material, the formation of NiOOH layers on the Ni cell parts, and O2
evolution. Tessier et al. describe in detail the processes that occur during the formation
cycles and the later cycles of the Ni(OH)2 electrode, and interested readers are directed
there.52 Essentially, as Tessier et al. describe, the first charge converts much of the β-
Ni(OH)2 to γ-NiOOH, with no β-NiOOH being formed. This γ-NiOOH is discharged to poorly
crystalized β-Ni(OH)2 during the first discharge half-cycle (negative peak at about 1.6 V in
Figure 2-3), but not all of it; some γ-NiOOH is electrically marooned before it can be
discharged. The poorly crystalized β-Ni(OH)2 created in cycle 1 is then available to be
charged into a mixture of β and γ-NiOOH during the second cycle. In Figure 2-3 and Figure
2-4 the positive peaks close to 1.8 V are the β-Ni(OH)2 to β-NiOOH conversion, while the
negative peaks close to 1.65 V are β-NiOOH back to β-Ni(OH)2. As cycling progresses, the
Figure 2-4: Differential capacity plots for the 5th
and 30th
cycle of the two cells shown in Figure 2-2. For example, “Sn CC c5” means the 5
th cycle of a cell with standard components except tin foil has been used
as the current collector instead of Cu. The y-axis has been scaled to QT to allow peak intensity comparisons between the two cells.
1.4 1.5 1.6 1.7 1.8 1.9 2
Cell Potential (V)
-12
-8
-4
0
4
8
12
(dQ
/dV
) /
QT (
1/V
)
Cu CC c5
Cu CC c30
Sn CC c5
Sn CC c30
Ch
arg
eD
isch
arg
e
57
amount of γ-NiOOH in the active material shrinks while the amount of β-NiOOH grows until
the β form comprises most of the material, as made evident by the growth of the negative
peak close to 1.65 V in Figure 2-4.
During cycle 1, irreversible reactions also occurred since only about 40% of the
charge imparted to the electrode was retrieved during discharge. One such reaction was O2
evolution (Reaction (1-17) on page 19); however, without measuring the amount of O2
produced it is difficult to determine how much charge went to evolving O2 instead of
forming γ-NiOOH.50, 51 A few other irreversible reactions also take place during the first
charge, including CoOOH formation, which is widely regarded to be the reaction that forms
the conductive network on the surface of the Ni(OH)2 particles.48, 150 It is implied in the
literature that CoOOH does not discharge back to Co(OH)2 during regular cell operation.48,
150 Also, Ni(OH)2 layers must thicken on the Ni cell components, thereby consuming charge
in going from Ni0+ to at least Ni2+.78 Although this thin surface layer (6 – 8 Å)78 on the cell
components cycled between Ni(OH)2 and NiOOH, the capacity provided by the cell
components is negligibly small compared to that of the Ni(OH)2 within the electrode, as
determined separately by cycling blank cells (not shown).
Figure 2-4 shows the cell behaviour at the end of the initial 5 formation cycles and
during cycle 30, after formation was completed. Cycle 30 represents an ideal cycle where
the Ni active material is fully activated and negligible capacity loss has occurred. By cycle
30, the average charge potential was 1.87 V for cells with either Cu or Sn current collectors
(CC) and the average discharge potential was 1.64 V for a Cu CC and 1.63 V for a Sn CC cell.
Overall, plots of the potential curves of Ni electrodes during formation cycling are
difficult to find in the literature, and so it was demonstrative to show them here. Since the
dQ/dV plots are for the entire cell, instead of just the Ni electrode, cells with both Cu and Sn
current collectors were included to show the relatively minor effect of the negative
58
electrode (Zn) on the signal. Recall that the intended purpose of the coin cell is to measure
the discharge capacity of the Zn electrode for hundreds of cycles, which requires a counter
electrode that outlasts the Zn electrode during each of those discharge half-cycles. Clearly,
Figure 2-2 demonstrates that Ni(OH)2 cannot fulfil that role during the formation cycles.
This reduces its attractiveness as a potential counter electrode to Zn since any discharge
half-cycles that are ended prematurely by the Ni electrode build up an undischarged
reservoir of Zn on the Zn electrode. Once formed, the Ni electrode can be transplanted into
a new cell with a fresh Zn electrode, but as demonstrated in Section 3.1.4 (pg. 97) the Ni
electrode still finishes discharging first. Regardless, the Ni electrode is useful for
demonstrating the effects of several other aspects of the coin cell design that affect cycle life.
2.3.3 Reproducibility of the Coin Cells
Throughout the next several sections, at least three copies of each coin cell design
were tested. The reproducibility of the cycling behaviour generally increased with cell
performance: the better a particular design, the more reproducible it was. With some
designs, cell performance was erratic; in that one cell might behave well, while the rest
would fail catastrophically. As such, it was deemed uninformative to show every data set
due to space limitations, or to average the utilization (QDischarge) vs cycle number data since
the error bars would be ungainly large for the erratic data sets. Instead, the best cell data
from each design was displayed in the figures in the following sections, except for the
“standard” cell design described in Section 2.2.3 (pg. 49), which acted as a point of
comparison throughout all the figures and was thus displayed with error bars representing
one standard deviation. If the utilization (QDischarge/QTheory,Ni) of a particular design was less
than the standard cell design, then it was suboptimal and should be avoided in future
research efforts.
59
In Figure 2-5, panel A shows the potential curves of the most successful cell design
used in this chapter as an example of the spread in the potential curves over the first 50
cycles when an exemplary cell design is used. Panel B demonstrates potential curves from a
cell with a suboptimal cell design, which grew dissimilar to one another sooner in the cycle
life of the cell. Figure 2-6, panel A shows the utilization (i.e. normalized discharge capacity)
vs cycle of all 3 cells of the Less Stack Pressure design shown in Figure 2-5B. Clearly, cell 2
yielded discharge capacities that were much lower than cells 1 and 3. Figure 2-6B shows
the average utilization of the two designs shown in Figure 2-5 along with the “standard” Cu
CC, Sn Can cell design. These data sets are represented by lines with error bars
representing one standard deviation.151 Since the discharge capacities of the cells using the
Figure 2-5: Demonstration of reproducibility in coin cells, part 1. The Sn CC, Sn Can coin cell design was the most successful. The Less Stack Pressure design demonstrates the erratic cell behaviour that results
from poor cell designs.
0 0.5 1 1.5 2
Normalized Capacity (Q/QTheory,Ni)
1.4
1.5
1.6
1.7
1.8
1.9
2
2.1
Cell
Po
ten
tia
l (V
)
Identical CellsCell 1
Cell 2
Cell 3
1.4
1.5
1.6
1.7
1.8
1.9
2
2.1
Cell
Po
ten
tia
l (V
)
Identical CellsCell 1
Cell 2
Cell 3
A - Sn CC, Sn Can - Cycle 50
B - Less Stack Pressure - Cycle 50
60
Sn CC, Sn Can and Cu CC, Sn Can designs are clustered close together up to cycle 50,
averaging the discharge capacities and reporting one standard deviation error bars made
sense.151 In this case, the Sn CC, Sn Can design was statistically superior to the Cu CC, Sn Can
design from cycle 7 onward since the error bars did not overlap beyond that cycle.
However, the error bars of the average data from the Less Stack Pressure design also
overlapped with the Cu CC, Sn Can design even though the discharge capacities of cells 1 to
3 (see panel A) were clearly inferior to the Cu CC, Sn Can design. This occurred because the
low discharge capacity of the Less Stack Pressure cell 2 (solid blue diamonds in panel C)
artificially inflated the standard deviation of the set of three cells. As such, it did not make
sense to report error bars on all data sets since only three or four cells of each design were
tested and the spread of the data could lead to exaggerated error bars.
Figure 2-6: Demonstration of reproducibility in coin cells, part 2. The Sn CC, Sn Can coin cell design was the most successful. The Cu CC, Sn Can was the “standard” cell design. The Less Stack Pressure design
demonstrates the erratic cell behaviour that can result from a poor cell design. For this design, the thick, solid, blue line in panel D is the average of the three diamond data sets in panel C, but the error bars
include unrealistically high Utilization values due to data set 2 from panel C, which is much lower than the other two. All error bars represent one standard deviation.
0 5 10 15 20 25 30 35 40 45 50
Cycle
0.4
0.6
0.8
1
1.2
Charge
Sn CC, Sn Can
Cu CC, Sn Can
Less Stack Pressure Avg.
B
0.4
0.6
0.8
1
1.2
Utiliz
atio
n (
QD
isch
arg
e/Q
Th
eo
ry,N
i)
0 5 10 15 20 25 30 35 40 45 50
Cycle
Charge
Less Stack Pressure 1
Less Stack Pressure 2
Less Stack Pressure 3
A
61
Another means of statistically measuring the cycle life is to average the cycle
numbers at which the cells of a particular design deviated from optimal behaviour or
descended (in discharge capacity) below some chosen value. A simplification of that
method was used in this chapter where the best cell of a particular hardware-set was
reported and compared to the average of the “standard” cell design. If the best cell of a
particular design could not perform as well for as long as the “standard” cell, within error,
then it was an inferior design. In panel A of Figure 2-6, the best Less Stack Pressure cell was
Cell 1 (the fully hollow diamonds), which did not perform within error of the standard
design, in panel B, beyond cycle 31, and so the Less Stack Pressure design was considered to
be inferior.
2.3.4 Effect of Stainless Steel Coin Cell Parts on Ni-Zn Cell Performance
Academic Ni-Zn and Zn-air authors that reveal their cell designs do not use metal
cell casings that are at the potential of the electrodes, but most Li-ion laboratory cells do.
The reasons for this are not immediately apparent since commercial, rechargeable Ni-Zn
cells have metal cell casings and new researchers will want to understand how to adapt
their metal casings for alkaline cell research. The coin cell springs, spacers and caps are
made from stainless steel 304 (SS 304), while the coin cell cans were made of SS 444 and so
it was prudent to test the behaviour of cells with SS components and compare them to coin
cells using the Sn, Cu and Ni metal coatings that are found in commercial cells.
Table 2-3 defines the composition of a few SS grades. Figure 2-7A shows the cell
Table 2-3: The grades and composition of various types of stainless steel.152
The “%” refer to weight percent. SAE = Society of Automotive Engineers and UNS = Unified Numbering System, and are both designation standards. The balance of percent in all cases is iron (Fe).
potential versus time during cycle 6 for Ni-Zn coin cells using various hardware sets, while
Figure 2-7: The effect of Stainless Steel (SS) coin cell components on cycling behaviour. Cap-side SS parts are SS 304, while the SS Can is SS 444. At least 3 cells of each hardware configuration were tested and the best cell of each configuration is shown here. Cycles 1-5 were formation cycles at a QT/1 h rate (C rate) up
to 100% QT. Cycles 6-20 were cycled at C/2 and charged to 120% QT (i.e. 2.4 h), so a discharge that terminated at 4.4 h would have delivered 100% QT. Discharge ended at 1.4 V. Panel C shows the fraction of expected capacity (Utilization) versus cycle number for the same cells shown in panels A and B, except
for the standard “Ni Cap-side, Sn Can” for which the average of 3 cells is shown along with 1 standard deviation error bars.
0 5 10 15 20
Cycle
0
0.2
0.4
0.6
0.8
1
1.2
Utiliz
atio
n (
QD
ischa
rge/Q
Th
eory)
Charge
0 1 2 3 4
Time (h)
1.4
1.5
1.6
1.7
1.8
1.9
2
Cell
Po
ten
tia
l (V
)
1.4
1.5
1.6
1.7
1.8
1.9
2
2.1
Cell
Po
ten
tia
l (V
)
Ni Cap-side, Sn Can
SS Spacer, Sn Can
Ni Cap-side, SS Can
SS Cap-side, Sn Can
All SS
A - Cycle 6
B - Cycle 10
C
63
Figure 2-7B shows analogous results for the same cells, except at cycle 10. Figure 2-7C
shows the discharge capacity, normalized to the expected discharge capacity (a.k.a.
utilization) of the Ni electrode versus cycle number for the same cells shown in panels A and
B. Although only the best example cell of each hardware-set is shown, at least three cells of
each set were made and tested. Overall, Figure 2-7 demonstrates the poor behaviour of SS
components, and as a result SS components are unacceptable for use with alkaline
electrolyte when charging at the potentials of Zn and Ni.
The root cause of the poor behaviour of cells with SS components was likely due to a
combination of oxide growth and parasitic oxygen evolution on the cap-side components,
and/or hydrogen evolution on the can-side components. Consider Figure 2-8, which shows
Figure 2-8: A simple Pourbaix diagram showing the potentials of fully charged Ni and Zn electrodes in 3.2 M KOH, and fully charged LiMn2O4 and Zn electrodes in pH 4 electrolyte. The blue arrows between the electrode potentials represent the cell potentials. The dashed lines represent the stability of water. To avoid evolving either H2 or O2 gas, electrodes must have a minimum overpotential for the relevant gas
evolution reaction as represented by the short, red arrows.
0 1 2 3 4 5 6 7 8 9 10 11 12 13 14 15 16
pH
-1.5
-1
-0.5
0
0.5
1
1.5
2
Po
ten
tia
l vs t
he
Sta
nd
ard
Hyd
rog
en
Ele
ctr
od
e (
V) O2 evolution can occur above this potential
H2 evolution can occur below this potential
Zn in 3.2 M KOH
NiOOH in 3.2 M KOH
Zn in pH 4
LiMn2O4 in pH 4
Required Overpotential to Avoid H2 Evolution
Required Overpotential to Avoid O2 Evolution
Cell Potential at Full Charge
64
a simple Pourbaix diagram (potential vs pH) with the stability of water and the potentials of
several fully charged electrodes relevant to this thesis marked. At any potential below the
long dashed line, H2 evolution via Reaction (1-16) on page 19 is energetically favoured;
however, the nature of the substrate determines the kinetics of the reaction. In other
words, different materials promote slower H2 evolution rates, which is the primary topic of
Section 2.3.5. At any potential above the short dashed line, O2 evolution via Reaction (1-17)
on page 19 is energetically favoured, but once again the material on which that reaction
occurs can slow down the rate of O2 evolution. Such materials are said to have a “high”
overpotential for O2 evolution. Indeed, the minimum overpotential required for a current
collector material to be useful is the potential difference between the dashed line and the
operating potential of the relevant electrode, as shown in Figure 2-8 by the short, red
arrows. The LiMn2O4 – Zn cell chemistry is discussed in Section A.5 (pg. 198), which
highlights the fact that Zn plates and strips at a higher potential in acidic electrolytes. Some
LiMn2O4 – Zn cells are tested in Section 3.3 (pg. 109).
One of the reasons that Ni and Zn are good battery materials is their high
overpotentials for O2 and H2 evolution, respectively, within the potential ranges of typical
Ni-Zn electrode operation; this means that both produce some gas during charging, but not
an excessive amount. The current collectors and cell casing are also at risk of producing
gases during cell operation, which likely occurred in Figure 2-7. Before discussing how the
curves of Figure 2-7 come about, it is informative to see a comparison of parasitic currents
on SS and Ni in KOH.
Figure 2-9 shows the results of cyclic voltammogram (CV) potential sweep
experiments performed on SS and Ni foils, dipped in 3.2 M KOH electrolyte at room
temperature with a sweep rate of 20 mV/s. The positive peaks between 1.83 V and 1.87 V
65
in all 3 curves in Figure 2-9 are Reaction (1-11) on page 12 in the forward direction while
the negative peaks between 1.77 and 1.75 V are Reaction (1-11) in the backward direction.
These peaks are present because all three samples contain some Ni. The fact that the pure
Ni foil displays a lower capacity of cyclable Ni(OH)2 is interesting, but not investigated here.
Of more importance is the potential at which O2 evolution accelerates. Figure 2-9 shows
that the difference in the overpotential for O2 evolution between SS 304 and Ni is about 30
mV. This means that a Ni-Zn cell with SS components on the positive side that is being
charged at 1 mA/cm2, and has reached 1.93 V is likely producing nothing but O2 gas since SS
304 supports an O2 evolution current of about 1 mA/cm2 at 1.93 V. In contrast, a cell with
Ni-coated components at 1.93 V is likely still charging the active material as desired, while
Figure 2-9: Cyclic voltammograms of nickel as well as stainless steel 304 and 316 in 3.2 M KOH. The sweep rate was 20 mV/s, from 0.55 V to 2.00 V vs Zn and started in the anodic direction. The cycles
shown are the 3rd
cycle, at which point the CVs were stable. The anodic spike in the potentials above 1.9 V signals an exponential increase in O2 evolution.
1.5 1.6 1.7 1.8 1.9 2
Potential (V vs Zn)
-1
-0.5
0
0.5
1
1.5
2
Cu
rre
nt
De
nsity (
mA
/cm
2)
O2 evolution current on...
Ni
SS 304
SS 316
30 mV
66
simultaneously producing about 0.15 mA/cm2 of O2 gas. Recall that Ni electrodes charge
from about 1.75 to 1.95 V vs Zn.
Interestingly, the very first time that SS components are raised to a high potential in
KOH (such as during the first charge half-cycle), an anodic reaction occurs on them that
does not occur again unless the components are lowered to a potential below 0.55 V vs Zn.
In Figure 2-9, this reaction had already occurred before the displayed data was recorded.
Figure 2-10 demonstrates this phenomenon on SS 304 foil. The very first cycle is not
shown, but the signal was essentially identical to the “0.05 V” data set. Before this
experiment began, the electrode was exposed to potentials greater than 0.55 V vs Zn for
Figure 2-10: Cyclic voltammogram sweeps to progressively lower potentials on stainless steel 304 foil in 3.2 M KOH. The foil was held at potentials > 0.55 V for about 10 min before this experiment began. The first sweep began at 0.55 V vs Zn, swept up to 1.95 V and then descended to the next lowest potential
limit, 0.45 V, where the second sweep began. All potential sweeps had a maximum of 1.95 V and a rate of 20 mV/s. The anodic peak around 1.7 V only arises if the potential was previously lowered below 0.55 V.
0 0.4 0.8 1.2 1.6 2
Potential (V vs Zn)
-0.5
-0.4
-0.3
-0.2
-0.1
0
0.1
0.2
0.3
0.4
0.5
Cu
rre
nt
De
nsity (
mA
/cm
2)
Lower CV Potential Limit0.55 V
0.45 V
0.35 V
0.25 V
0.15 V
0.05 V
67
about 10 min. As such, when this experiment began with the “0.55 V” data set, no anodic
peak around 1.7 V existed. It is then evident as the experiment progresses that as the
electrode either spends more time below 0.55 V or reaches lower potentials the anodic peak
at 1.7 V grows. It is not clear what reaction this anodic peak reflects, but since it does not
exist on pure Ni surfaces, it must be associated with Cr, Mn, Mo or Fe, and it is likely the
formation of an oxide layer since the electrolyte is a strong base. If SS is used as the positive
side components, then this oxide layer consumes some of the first charge and might lower
the conductivity of the electrical connections within the coin cell, such as between the
current collector and spacer. Conversely, these concerns can be ignored by using Ni, which
maintains only a thin oxide layer at high potentials in alkaline electrolyte.78
It should now be evident that stainless steel components suffer larger parasitic
currents than Ni when used as positive side components. Consequently, the cells with
positive side SS components in Figure 2-7 had higher parasitic currents during charging,
which caused the Ni electrodes in those cells to reach a lower state of charge than the Ni
electrodes in cells without SS components. In fact, the more SS surface area a cell had, the
less discharge capacity it returned. This is evident since the discharge capacities of the cells
with varying positive side components descended like “Ni Cap-side, Sn Can” > “SS Spacer, Sn
and possibly other reactions compete for current on the negative electrode current collector
and cell casing. Figure 2-10 shows that SS 304 supports a few cathodic reactions (i.e.
multiple cathodic peaks) on its surface as the potential is lowered towards 0 V, where Zn
plates (charges). Also, H2 evolution increases steadily below 0.05 V vs Zn, although only the
beginning of this is visible at the beginning of the 0.05 V data set. It is unlikely that any of
these parasitic, cathodic reactions will be beneficial to the operation of the Zn electrode, and
68
all of them consume charge that would otherwise plate Zn onto the current collector. In
Figure 2-7, these higher parasitic currents that are supported on SS are likely what caused
the Zn electrodes in coin cells with a SS can to reach a smaller state of charge during charge
half-cycles, which translated into lower discharge capacities. Overall, the discharge
capacities of cells with various negative casing materials descended as more SS was
introduced into the cell: “Ni Cap-side, Sn Can” > “Ni Cap-side, SS Can” > “All SS”.
Avoiding parasitic currents, including O2 and H2 evolution, is important when
considering materials for cell containers and current collectors, but several authors in
recent years did not appear to be aware of this concern when they chose to use Ni foam as
their Zn electrode current collector.124, 126, 127, 131 Ni will act similarly to stainless steel and
waste comparatively large amounts of current on H2 evolution, as will be shown in Section
4.4.3 (pg. 133). As such, materials with low overpotentials for H2 evolution should be
avoided as a current collector material for the Zn electrode; further materials for the Zn
current collector and can are explored in the next section. From this section the reader
should note that a coating of Ni on the positive electrode components is superior to leaving
the stainless steel bare due to the reduced rate of parasitic currents, including oxide layer
growth and/or O2 evolution, on Ni within the potential range experienced by the Ni(OH)2
electrode during charge.
2.3.5 Zinc Electrode Current Collector and Cell Casing Materials
Copper (Cu),121, 128, 130, 146, 153 tin (Sn),113, 122 nickel (Ni)124, 126, 127, 131 and lead (Pb)68, 118
have all been used as current collectors or coatings on current collectors in the past. It was
prudent to determine which of these materials would be the most effective in coin cells as
both the current collector and canister material. Ni was similar to stainless steel in terms of
its low hydrogen evolution overpotential,154 which did not work out well in the previous
69
section and so it was not tested in this section, but it will be revisited as a current collector
material in Chapter 4. Pb is toxic and disfavoured in commercial alkaline cells for this
reason, so it was also not tested in this section, but will be revisited in Chapter 4. A non-
toxic and popular material for rechargeable Zn electrodes in the literature is Cu.121, 128, 130, 146,
153, 155 However, dismantling a commercial rechargeable Ni-Zn cell (see Section 1.11.2, pg.
37) revealed that a Sn coating was used to coat all of the negative cell components.113 As
such, the coin cells of this section focused on the comparison of Cu to Sn current collectors
and canisters. Brass was tested because it is an alloy of Cu and Zn, and has been used as a
current collector at least once.123
Figure 2-11A shows the cell potential versus time during cycle 10 for Ni-Zn coin
cells using various hardware sets. Figure 2-11B shows analogous results for the same cells,
except at cycle 20. Figure 2-11C shows the utilization of the Ni electrode plotted versus
cycle number for the same cells described by Figure 2-11A and B. Although only the best
example cell of each hardware-set is shown, at least three cells of each set were made and
tested.
Figure 2-11 shows the effect that current collector (CC) and canister (can) material
can have on cell behaviour. This included the situation where the coin cell parts and
electrodes were reversed: meaning the can was coated in Ni, the Ni electrode was in the can,
the separators were reversed, the Zn electrode was on the cap side and the cap side
components (cap, spring and spacer) were electroplated with Sn. This situation (“Cu CC, Sn
Cap Side” in Figure 2-11) fails sooner than the standard cell configuration presumably
because the electrolyte is drawn into the spring compartment and over all the exposed cap-
side conducting surfaces via the electrolyte wicking phenomenon described later in Section
4.3 (pg. 126). Once there, the Zn(OH)42− ions can continue to plate and strip during cycling,
but they are more likely to become isolated from the electrolyte due to water evaporation
70
and because charge balancing ions have a more arduous diffusion path through the very
Figure 2-11: Effects of different can and current collector (CC) materials on cycle behaviour. At least 3 cells of each hardware configuration were tested and the best cell of each configuration is shown here. Cycles 1-5 were formation cycles at a QT/1 h rate (C rate) up to 100% QT. Cycles 6-20 were cycled at C/2
and charged to 120% QT (i.e. 2.4 h), so a discharge that terminated at 4.4 h would have delivered 100% QT. Discharge ended at 1.4 V. Panel C shows the fraction of expected capacity (Utilization) versus cycle
number for the same cells shown in panels A and B, except for the standard “Cu CC, Sn Can” and “Sn CC, Sn Can” for which the average of their 3 cells are shown along with standard deviation error bars.
0 5 10 15 20
Cycle
0.2
0.4
0.6
0.8
1
1.2
Utiliz
atio
n (
QD
ischa
rge/Q
Th
eo
ry)
Charge
0 1 2 3 4
Time (h)
1.4
1.5
1.6
1.7
1.8
1.9
2
2.1
Cell
Po
ten
tia
l (V
)
1.4
1.5
1.6
1.7
1.8
1.9
2
2.1
Cell
Po
ten
tia
l (V
)
Cu CC, Sn Can
Sn CC, Sn Can
Cu CC, Cu Can
Cu CC, Brass Can
Cu CC, Sn Cap Side
A - Cycle 10
B - Cycle 20
C
71
thin layer of electrolyte coating the cell components between where Zn(OH)42− plated and
the bulk electrolyte. This leads to a loss of active material as Zn(OH)42− is marooned in the
spring compartment or as the cell resistance increases due to the arduous ion diffusion
path. Cycle 20 of the “Cu CC, Sn Cap Side” cell, in Figure 2-11B, exhibits a bump in the
charging curve at 1.5 h, which was likely the Zn electrode reaching a full state of charge (see
Section 3.1.3, pg. 96) and was expected if Zn active material was being marooned since less
Zn was available to be plated. The subsequent plateau signaled when the Ni electrode had
also entered into overcharge; the noisy data was attributed to either O2 or H2 bubbles
evolved during overcharge. The theory that Zn migrated to the spacer compartment was
corroborated when the cells were dismantled and ZnO deposits were observed on the
spring and top side of the spacer.
It is also evident in Figure 2-11B that Cu and Brass undergo a detrimental reaction.
Since cycle life decreases as Sn CC, Sn Can > Cu CC, Sn Can > Cu CC, Brass Can > Cu CC, Cu
Can, it can be concluded that Cu is causing the problem and should be avoided in cell
components. The reason why Cu was problematic as any of the negative electrode
components was not obvious. One possibility for the root cause is the alloying of Zn into Cu,
which has been shown to occur when Zn is electroplated onto Cu.79, 156 In contrast, Sn does
not alloy with Zn during deposition and instead likely stimulates epitaxial layer growth
perpendicular to the basal plane.157 Interestingly, both papers that discussed Cu/Zn alloy
formation did so from the perspective of a battery researcher, but neither identified the
alloying as a problem and Chu et al. even seemed to endorse Cu as a current collector due to
the “growth of an active hexagonal deposit with many kink sites and edges”.79, 156 They
might have missed the drawback of using Cu because neither paper performed cycling
experiments on cells that had alternative current collectors, the way this chapter has. In
fact, no papers were found that compared the cycling behaviour of electrodes with different
72
current collector materials, and this research was likely the first academic publication to
demonstrate that the current collector material is a critical factor in determining the cycle
life.147
2.3.6 Nickel-Side Component Materials, Cell Orientation and Separator Effects
Figure 2-12A shows the cell potential versus time during cycle 10 for Ni-Zn coin
cells using various hardware sets and with various cell orientations during cycling. Figure
2-12B shows analogous results for the same cells, except at cycle 20. Figure 2-12C shows
the utilization of the Ni electrode plotted versus cycle number for the same cells described
by Figure 2-12A and B as well as an additional cell containing only a non-woven separator.
Although only the best example cell of each hardware-set is shown, at least three cells of
each set were tested.
Figure 2-12 illustrates the crucial importance of having both a microporous and a
non-woven separator in the Ni-Zn coin cells constructed here.70 The microporous separator
prevents dendrites from shorting the cell since dendrites cannot easily penetrate the sub-
micrometer sized holes in the separator. So-called “soft” short circuits were observed in the
“Only Non-woven” data set in panel C. A “soft short” is a relatively high resistance short
circuit, where the potential of the cell remained at 1.87 V, for example, while allowing the
charging current to by-pass the electrodes. Figure 2-12 also shows the effect of omitting the
non-woven separator, as represented by the “Only Microporous” data set. The non-woven
separator acts as an electrolyte reservoir for the Ni electrode, which can dry out if
insufficient H2O is present during discharge. Omission of the non-woven separator resulted
in shortened discharge half-cycles, where the gentle descent of the potential at the end of
discharge suggests that the Zn electrode finished discharging first (see Section 3.1.2, pg. 94).
The exact cause of this is unclear, but there are three plausible possibilities. (1) The
73
Ni electrode could have dried out during discharge, which would have changed the potential
Figure 2-12: Effects of cell orientation, Ti and separators on cell behaviour. At least 3 cells of each hardware configuration were tested and the best cell of each configuration is shown here. Cycles 1-5
were formation cycles at a QT/1 h rate (C rate) up to 100% QT. Cycles 6-20 were cycled at C/2 and charged to 120% QT (i.e. 2.4 h), so a discharge that terminated at 4.4 h would have delivered 100% QT. Discharge ended at 1.4 V. Panel C shows the fraction of expected capacity (Utilization) versus cycle number for the same cells shown in panels A and B, except for the standard “Ni Cap-side, Sn Can” for which the average
of 3 cells is shown along with 1 standard deviation error bars.
0 5 10 15 20
Cycle
0
0.2
0.4
0.6
0.8
1
1.2
Utiliz
atio
n (
QD
ischa
rge/Q
Th
eory)
Charge
Only Non-woven
0 1 2 3 4
Time (h)
1.4
1.5
1.6
1.7
1.8
1.9
2
2.1
2.2
Cell
Po
ten
tia
l (V
)
1.4
1.5
1.6
1.7
1.8
1.9
2
2.1
Cell
Po
ten
tia
l (V
)
Ni Cap Side, Sn Can
On Side
Cap-side Down
Ni Cap & Spring, Ti Spacer
Only Microporous
A - Cycle 10
B - Cycle 20
C
74
curve. In this case, neither the Zn nor Ni electrode would have completely discharged by
time the low voltage limit was triggered. (2) Soft short circuits could have syphoned some
current. (3) O2 evolved at the Ni electrode during overcharge (a common occurrence during
formation cycling) could have reduced Zn to ZnO, depriving the Zn electrode of some of its
Zn deposit.
Figure 2-12 also shows the effect of using Ti, instead of Ni, as the spacer material (Ni
Cap & Spring, Ti Spacer). Although the behaviour of cells with Ti spacers may look
promising in Figure 2-12C, cells with Ti components developed a high charging potential
near the end of charge (see Figure 2-12A and Figure 2-12B) and a depressed discharge
potential, which decreased energy efficiency. The increased charging potential likely arose
from the formation of a Ti oxide layer that thickened over time and increased the contact
resistance between the Ti spacer and the Ni electrode. Upon dismantling the cells with Ti
spacers, rainbow colouration on the Ti spacers was observed, which signified oxide layer
growth. In the ”Ti Spacer” potential curve in Figure 2-12B, the depression of the discharge
potential at the beginning of charge was a feature that also arose occasionally in standard
cells with Ni positive-side components, although later in cycle life (i.e. > cycle 50) and not as
frequently as in cells with Ti parts. Hence, the discharge potential depression was not
associated with Ti specifically, but was a sign of problems developing at one of the
electrodes.
Figure 2-13A shows the cell potential versus time during cycle 30 for Ni-Zn coin
cells using the most promising hardware sets and cell orientations, in terms of cycle life.
Figure 2-13B shows analogous results for the same cells at cycle 50. Since the potential
curves shown are for the singular best cell of each hardware-set, many of the curves lie
nearly on top of one another with only a few notable features breaking away from the pack.
For instance, Figure 2-13A and Figure 2-13B show that cells with Ti spacers continue to
75
reach a higher potential during charge and, on average, a lower potential during discharge
Figure 2-13: Extended cycling to cycle 50 of the best cell designs. At least 3 cells of each hardware configuration were tested and the best cell of each configuration is shown in panels A and B. Cycles 20-50 were cycled at C/2 and charged to 105% QTheory,Ni (i.e. 2.1 h), so a discharge that terminated at 4.1 h would have delivered 100% QTheory,Ni. Discharge ended at 1.4 V. Panel C shows the average fraction of expected
capacity (Utilization) versus cycle number for the batches of cells exemplified in panels A and B. Error bars are 1 standard deviation.
20 25 30 35 40 45 50
Cycle
0.20
0.30
0.40
0.50
0.60
0.70
0.80
0.90
1.00
1.10
Utiliz
atio
n (
QD
ischa
rge/Q
Th
eory)
Charge
0 1 2 3 4
Time (h)
1.4
1.5
1.6
1.7
1.8
1.9
2
2.1
Cell
Po
ten
tia
l (V
)
1.4
1.5
1.6
1.7
1.8
1.9
2
2.1
Cell
Po
ten
tia
l (V
)Cu CC, Sn Can
Sn CC, Sn Can
Ti Spacer
On Side
Cap-side Down
Less Stack Pres.
A - Cycle 30
B - Cycle 50
1.86
1.88
1.9
1.92
1.94 1.541.561.581.61.621.641.66
C
76
up to cycle 50. Another outlier is the potential curve of the “Cap-side Down” cell, which rose
sooner during charge and dropped sooner during discharge. This is generally ascribed to
electrolyte detaching from the “bulk” electrolyte in the separators and flowing down into
the spring compartment due to gravity. Finally, the “Sn CC, Sn Can” cell consistently
delivered more discharge capacity than the cell that had a Cu current collector. The
steepness of the potential shoulder at the end of discharge also suggests that the Ni
electrode reached the filled state (finished discharging) before the Zn electrode had all the
Zn stripped from it (see Section 3.1.2, pg. 94).
In order to see the differences in behaviour between these hardware-sets, the
average discharge capacities must be examined. Figure 2-13C shows the Ni electrode
utilization versus cycle number for the average of 2 to 4 cells, depending on if any of the 4
cells made of each configuration suffered serious problems early on that would not be
related to the variable being tested. For instance, on average, 1 cell in 16 would short
circuit during assembly and 1 cell in 12 tended to short due to dendrites growing around
the separator edges in a poorly assembled cell. Regardless, these averages give a more
realistic and statistically accurate idea of coin cell behaviour.
The “Sn CC, Sn Can” data is an average of 3 cells that had nearly identical discharge
capacities out to cycle 50, as evidenced by the error bars. In comparison with the standard
hardware-set (Cu CC, Sn Can), the absence of overlap between the two data sets confirms
that Sn current collectors promote higher discharge capacities. Note that Utilizations above
100% were assumed to be due to a combination of experimental error in calculating the
theoretical capacity (see Table 2-2, pg. 53) and overcharging the β-NiOOH to form γ-NiOOH,
which has a higher capacity than the β- form but is less stable over many cycles.48
The discharge capacity of “Cap-side Down” cells faded sooner than identical cells
that were cycled cap-side up; however, cells cycled on their side (“On Side”) performed just
77
as well. This is likely because electrolyte that flowed into the spring area of the coin cell due
to gravity became disconnected from the bulk electrolyte in the cap-side down cells. In the
case of the cells on their sides, the wicking action of the non-woven and, to a lesser extent,
microporous separators likely kept electrolyte in the lowest portion of the coin cell
connected with the bulk electrolyte. Consequently, the “On Side” cell orientation was equal
within experimental error to the standard hardware-set. Therefore, researchers need not
fret about the performance of cells that are tilted up to 90°. Beyond that, error bar overlap
was not significant for any other two data sets in Figure 2-13C, meaning that cells should
not be tilted over 90°. In a commercial cell, the wicking action of the separators and tight fit
of the electrodes within the canister make cell orientation unimportant, but clearly
researchers using coin cells should be cautious.
Finally, the Ti and “Cap-Side Down” data sets had at least one cell that performed as
well as the standard cell design in Figure 2-12C (pg. 73) up to only cycle 20, but when the
data sets of all such cells were averaged up to cycle 50 and compared in Figure 2-13C there
was a statistical difference from the standard. This illustrates the importance of
reproducing one’s own work and reporting the results, which only a few authors seem to
have done with respect to cycle life.118, 119, 123 The difficulties of reporting reproducibility
with respect to cycle life were touched on in Section 2.3.3 (pg. 58), which might explain why
researchers tend to ignore reproducibility; however, they really should not continue to do
so. Without averages and some statistical treatment of the data, authors are left with quite
a bit of freedom to conclude what they want, as opposed to what is true.
2.3.7 Effect of Stack Pressure on Cell Performance
Figure 2-13C also shows that applying insufficient stack pressure to the electrodes
also reduces cycle life. “Stack pressure” is the pressure applied to the electrodes by the
78
spring and spacer. The “Less Stack Pressure” data set used flat, 0.77 mm thick spacers that
only applied about 700 kPa as opposed to the 2,200 kPa that standard 0.88 mm thick, Ni
coated spacers provided. Insufficient stack pressure might have brought about a decrease
in discharge capacity due to the loss of good electrical contact with the Ni active material on
the positive side or an increase in Zn shape change at the negative side. Note that the
pressure film was 190 µm thick, which was close to the combined thickness of the Ni and Zn
electrodes (about 120 µm) but not close enough to conclude that the absolute pressure
experienced by actual electrodes was exactly 700 kPa or 2,200 kPa. The value of these
measurements was the determination of the distribution of pressure on the electrodes.
Figure 2-14 shows the pressure distribution on the electrodes with the two
differently shaped spacers mentioned here. The thicker (0.88 mm) and slightly convex
(toward the electrode) spacer applied noticeably more pressure in the center of the
electrode than did the flat, thinner (0.77 mm) spacer. It was determined separately that the
degree of concavity (within reason) had little to no influence on utilization, only the
thickness, and thus the pressure, mattered. Note that it is likely that the Zn electrode
experienced the same pressure distribution as the Ni electrode.
Figure 2-14: Example stack pressure distributions from the two shapes of spacers tested in this work. a – concave, 0.88 mm thick stainless steel spacer coated in Ni. The convex side was towards the electrodes in
cell assembly. b – flat, 0.77 mm thick Ni 200 spacer. The two pressure distributions beside each spacer are examples. The darkest colour of red signifies > 3,000 kPa while white signifies < 250 kPa.
79
2.3.8 Effect of Gas Evolution in Coin Cells
Early in the research efforts presented in this chapter, it was discovered that the
discharge capacity of fully sealed (non-vented) coin cells faded faster than cells with
pressure-relief valves (i.e. a hole in the cap) and eventually the sealed cells burst open due
to a build-up of gas pressure inside the cell. In order to gain some insight into when during
the cycling process this gas was being created, the thickness of a cell, at the micrometer
scale, was monitored during cycling. Figure 2-15 shows the potential versus time for a
sealed Ni-Zn coin cell along with the cell thickness versus time. The cell was charged and
discharged at room temperature at a C/2 rate. The charge half-cycles were terminated at
70% QTheory, Ni for the first 4 cycles, then at 100% QTheory, Ni for the next 6 cycles and finally at
Figure 2-15: Ballooning of a sealed Ni-Zn coin cell during cycling. The cell was cycled at a C/2 rate, and was charged to 70% QT for the first 4 cycles, then 100% QT for the next 6, then 120% QT for the final 10
cycles. The cell was discharged to 1.4 V in all cycles. Panels A and B show the first 7 cycles and cycles 14 – 19, respectively, along with the corresponding increase in cell thickness from its initial value.
1.2
1.4
1.6
1.8
2
2.2
Cell
Po
ten
tia
l (V
)
0
30
60
90
120
150
Incre
ase
in
Ce
ll T
hic
kn
ess (
m)
0 2 4 6 8 10 12 14 16 18 20
Time (h)
NiZn Cell Potential
Increase in Cell Thickness
42 44 46 48 50 52 54 56 58 60 62
Time (h)
1.2
1.4
1.6
1.8
2
200
260
320
380
440
A
BZn might reach full charge here
1 2 34
5 6 7
14 15 16 191817
80
120% QTheory, Ni for the last 10 cycles. Discharge half-cycles were always terminated at 1.4 V.
Cycles 1 to 7 are shown in panel A, while cycles 14 to 19 are shown in panel B. This coin cell
“ballooned” when gas production inside increased the internal gas pressure.
Figure 2-15 shows that gas is evolved at a seemingly constant rate for the first five
cycles, although that rate changes from cycle 2 to 3; “Seemingly” because the increase in cell
thickness is not necessarily linearly related to the internal pressure in the cell. This was
surprising since, until this experiment, it was assumed that gas was only significantly
evolved on the Ni electrode (i.e. O2), during the high potential sections of the charge half-
cycle. Indeed, evidence of O2 contributing to the ballooning of the cell was observed in cycle
6 when the thickness only resumed increasing midway through charge. But O2 evolution
alone cannot describe the cell thickness increase during the formation cycles. If the
formation charging of the Ni electrode were the only source of gas during cycles 1 to 5, then
the cell thickness would be expected to stop increasing during discharge when no formation
is taking place. Additionally, if all of the gas was O2 that recombined with Zn, the way it
should ideally (see Section 1.5.1, pg. 19), then the ballooning would be expected to decrease
during discharge when no more O2 would be produced but some would be consumed.
Neither of these trends was observed.
The following discussion proposes a possible scenario to describe the observed
behaviour of the sealed cell. A clue is present in panel B, which shows that eventually gas is
only produced during the charge half-cycle and the rate of gas evolution increases as the
potential increases. However, the bumps in the charge curves in panel B appear to be due
to the Zn electrode overcharging (see Section 3.1.3, pg. 96), which would mean the gas being
produced was H2. H2 does not easily recombine at the Ni electrode, so if the majority of the
gas was H2 it could explain why the pressure in the cell never decreased.67 H2 can also be
produced through the self-discharge (corrosion) of the Zn electrode.
81
Returning to panel A, the Zn electrode was not overcharged in at least the first 10
cycles since the Zn electrode had a theoretical capacity more than 3× larger than the Ni
electrode. Therefore, the gas evolved in cycle 6 was likely O2, and so it appears that O2 did
not recombine well in this cell since the internal pressure never dropped. However, it
cannot be concluded that no recombination occurred because the rate of H2 gas evolution
from self-discharge in this cell was unknown and it might have been faster than the O2
recombination rate. As such, this experiment demonstrated that the self-discharge rate
must be better understood before further coin cell experiments exploring gas evolution
during formation cycling or O2 recombination rates can be undertaken.
In the meantime, this experiment also demonstrated that O2 recombination cannot
be relied upon to prevent coin cells from ballooning and eventually bursting. The
ballooning of the cell is detrimental because it decreases the stack pressure by releasing the
spring. In Section 2.3.7, only a 110 µm difference in the spacer thickness created a
noticeably detrimental trend in the discharge capacity of coin cells. That thickness does not
directly translate to the thickness of the coin cell measured in this section since the
thickness of the coin cell was measured at the center of the cap, whereas the spring pushes
against the interior edges of the cap. Regardless, the increase in cell thickness cannot be
good for cycle life. Consequently, researchers wanting to avoid cell ballooning or bursting
should include a pressure release valve in their cells. In this thesis, that was achieved by
drilling a 1 mm diameter hole in the cap (off-center) and applying a piece of scotch tape
over the hole to reduce the evaporation of water from the electrolyte. To the author’s
knowledge, the only published data about gas evolution rates or internal pressure during
the cycling of a Ni-Zn cell are plots disclosed from a commercial source (PowerGenix) in the
Handbook of Batteries.67 Since the plots in the Handbook of Batteries show only a single
82
charge half-cycle after the Ni electrode had been formed, the experiment shown in this
section was potentially the first of its kind to be published in a journal.147
2.3.9 Comparison of Coin Cells with Commercial Ni-Zn AA Cells
Figure 2-16 shows a photograph of a commercial Ni-Zn AA-size cell produced by
PowerGenix. To provide a comparison between the coin cells described here and
commercial cells, several Ni-Zn PowerGenix AA cells were acquired and cycled under
identical conditions to the coin cells in this study.
Figure 2-17 shows the utilization plotted versus cycle number for the PowerGenix
cells cycled under a variety of conditions and a coin cell for comparison. The results shown
are for the better cell of pairs of cells tested identically. PowerGenix AA cells are rated to
have between 1350 and 1500 mAh of capacity, and no cycle life was specified on the
manufacturer’s website.158 Only 2 of 8 cells (red and blue curves) demonstrated > 1350
mAh during the first discharge. The manufacturer’s specified charging regime was to use a
constant (2/3)C rate until the potential curve began to angle upward after the main
charging plateau and then hold the potential at 1.9 V until the current decayed to below 90
Figure 2-16: PowerGenix AA cell tested in the same manner as the coin cells (also shown). These cells are rated to provide between 1350 and 1500 mAh. No expected cycle life is reported on the PowerGenix
website.
83
mA or until 2.5 h had passed. Although there are clear differences in the results from the
different charging regimes, all of the PowerGenix cells behaved surprisingly poorly
compared to the coin cell. In the Li-ion research community, commercial cells nearly
always perform better than lab-made, battery-like cells (like coin cells); however, this may
not be the case for the commercial Ni-Zn cells tested here.
If the data in Figure 2-17 can be trusted, it shows that the coin cells used in this
study are superior to commercial Ni-Zn AA cells. Unfortunately, the fact that each pair of
commercial cells cycled under the same conditions gave dramatically different results from
one another suggests a large variation in behaviour between commercial cells within the
same batch, let alone between batches. Hence no conclusions can be drawn from this data
about the effect of temperature or cycling rate. The fact that this can occur in commercial
cells is worrisome with regards to scaling up Ni-Zn technology and demonstrates that a test
system for research that can produce reproducible results is invaluable. The coin cell
design described here is one such design that fulfills that need. Overall, the promising
behaviour of the coin cells is not completely unexpected since coin cells have thin
Figure 2-17: Cycling behaviour of PowerGenix AA cells using various charging regimes. All data sets are the best cell of a 2 cell batch. QT for PowerGenix cells was 1500 mAh. The low end of PowerGenix’s
acceptable range for capacity is 1350 mAh or a Utilization of 0.9. Only 2 cells of 8 (red and blue) achieved this minimum. All cells except the V Hold cells were charged to 105% QT at either a C/2 or C/5 rate. The V
Hold cells were cycled according to PowerGenix’s specified charging regime at a C/2 rate when under current control. The coin cell is a standard Cu CC coin cell for comparison. The cycles shown for the coin
cell are the 20 cycles after the first 20 formation cycles (i.e. cycles 21-40).
0 5 10 15 20
Cycle
0
0.2
0.4
0.6
0.8
1
Utiliz
atio
n (
QD
isch
arg
e/Q
Th
eory)
Charge
30C, C/2
30C, C/5
20C, V Hold
20C, C/2
20C, C/2 Coin Cell
84
electrodes, allowing the researcher to ignore OH− concentration gradients,42 macroscopic
pore networks118 or bulk electrode material conductivity issues within thick electrodes.
This comparison between (poor) commercial cells and coin cells highlights the difference in
cycling behaviour between thin and thick electrodes, and suggests that the thin electrodes
used in this thesis could be useful for testing new active materials,124, 127, 131 electrode
additives15, 155, 159-161 and electrolyte additives,145, 162-165 but that they are probably not useful
if the researcher is focussing on issues associated with thick electrodes.
Figure 2-18A shows the cell potential versus time, after formation, for the best Sn
and Cu current collector (CC) Ni-Zn coin cells and the best commercial PowerGenix Ni-Zn
AA cell. Figure 2-18 did not include the first 20 cycles for the two coin cell data sets, since
formation ceased when the charge capacity was dropped to 105% QTheory,Ni at cycle 21. In
effect, cycle 1 in Figure 2-18A and Figure 2-18C is in fact cycle 21 for the two coin cells.
Figure 2-18B shows analogous results for the same cells, except at cycle 81. The
PowerGenix cell was cycled at 30°C at a C/5 rate with charge up to 105% QTheory (also the
red curve in Figure 2-17). The ‘hump’ in the PowerGenix voltage-time profile in panel B is
unexplained in the literature, but it is likely the onset of O2 shuttling from the positive side
to negative side and the drop in potential after the hump is likely due to an increase in cell
temperature, which in turn speeds up the kinetics of the O2 evolution reaction.166 This
hump moves to the left with cycling, signifying that less and less Ni active material is
available for charging as cycling continues. Figure 2-18B shows that the same sort of
behaviour starts to appear in the standard “Cu CC, Sn Can” coin cell at cycle 81.
Figure 2-18C shows the utilization plotted versus cycle number for the same cells in
Figure 2-18A and B as well as the average cycle life (to 50% Utilization) of all 3 cells of each
type, although only utilizations of the best cell of each set are specifically shown. Panel C
shows that the cycle life of coin cells was superior to that of the commercial cell, and that
85
coin cells with Sn CCs lasted longer than standard Ni-Zn coin cells with Cu CCs. The Cu CC
cell was the longest lasting cell of a set of 3 identical coin cells and died abruptly at cycle
Figure 2-18: Comparison between the best PowerGenix AA cell and the best coin cells produced in this work. The PowerGenix AA cell was cycled at C/5 at 30°C, while the coin cells were cycled at C/2 at 20°C. All cells were charged galvanostatically to 105% QT each cycle. Panel C shows the cycle lives of the same
cells shown in A and B. Also shown are the average cycle lives of the Sn CC and Cu CC coin cells with 1 standard deviation error bars.
0 40 80 120 160 200 240 280 320
Cycle
0
0.2
0.4
0.6
0.8
1
Utiliz
atio
n (
QD
ischa
rge/Q
Th
eo
ry)
Charge
Sn CC Avg. Cycle Life
Cu CC Avg. Cycle Life
50% Utilization Threshold
0 1 2 3 4
Time (h)
1.4
1.5
1.6
1.7
1.8
1.9
2
2.1
Cell
Po
ten
tia
l (V
)
1.4
1.5
1.6
1.7
1.8
1.9
2
2.1
Cell
Po
ten
tia
l (V
)
Cu CC, Sn Can
Sn CC, Sn Can
PowerGenix AA
A - Cycle 1
B - Cycle 81
C
86
140 (Figure 2-18C) when a dendrite formed. Meanwhile, the Sn CC cell survived a few
Figure 2-19: Comparison between PKCell AA cells cycled in two different ways and the best coin cell produced in this work. The experimental details are explained in the text. Panels A and B show the
potential curves at cycle 120, when all 3 cells are operating well, and at cycle 290 when all 3 cells are nearing the end of their cycle life. Panel C shows every 5
th cycle of the cycle lives of the same cells shown
in A and B. The cycling current for the “V Hold” cell is shown in panels A and B to demonstrate the decay of the current when the potential is held at 1.91 V, and refers to the right side y-axis. QTheory for the
PKCells was 1,500 mAh while that for the coin cell was 1.397 mAh.
0 40 80 120 160 200 240 280 320
Cycle
0
0.2
0.4
0.6
0.8
1
Utiliz
atio
n,
QD
ischa
rge/Q
The
ory
Coin Cell
PKCell V Hold Charge
PKCell V Hold Discharge
PKCell V Limit Charge
PKCell V Limit Discharge
0 0.2 0.4 0.6 0.8 1 1.2 1.4 1.6 1.8 2
Normalized Capacity, Q/QTheory
1.4
1.5
1.6
1.7
1.8
1.9
2
2.1
0
0.1
0.2
0.3
0.4
1.4
1.5
1.6
1.7
1.8
1.9
2
2.1
Ce
ll P
ote
ntia
l (V
)
0
0.1
0.2
0.3
0.4
0.5
No
rma
lize
d C
urr
en
t, I
/QT
heo
ry (
1/h
)
Coin Cell
PKCell V Limit
PKCell V Hold
Current V Hold
A - Cycle 120
B - Cycle 290
C
87
dendrites around cycle 230 and failed (< 50% Utilization) at cycle 316.
A few years after testing the PowerGenix cells shown in Figure 2-17 and Figure
2-18, commercial Ni-Zn cells had evidently improved somewhat and so in 2014 a few AA
cells of a new brand called PKCell were acquired. Figure 2-19 shows the cycling behaviour
of these cells compared to the same Sn CC coin cell shown in Figure 2-18. To reiterate, it
was charged galvanostatically at a C/2 rate at 20°C to 105% of QT each cycle and discharged
down to 1.2 V. The PKCell AA cells were cycled at C/5 at 30°C. The “V Limit” cell was
charged up to 2.00 V for the first 27 cycles and then only to 1.95 V for the remaining cycles,
all of which were followed by a discharge down to 1.35 V. The “V Hold” cell was charged up
to 1.91 V, and then held there until the current decayed down to C/20 (0.05 on the right y-
axis) or until 103% of QT was reached. Then it was discharged down to 1.35 V.
The “V Hold” cycling procedure was the procedure favoured by Ni-Zn cell
manufacturers, while the “V Limit” cycling procedure is closer to that used to cycle coin cells
in this work. Panels A and B show example potential curves at various cycles for the
reader’s interest, but the take-home message from panel C is that the coin cells developed in
this work have cycle lives comparable to commercial Ni-Zn cells.
2.4 Coin Cell Design Conclusions
Coin cells are easily fabricated in large quantities and have small space
requirements that allow many cells to be tested simultaneously under controlled
conditions, like inside a temperature or humidity controlled box. They can have good
reproducibility once the researcher is skilled in their fabrication and if proper components
are used. Additionally, coin cells only require small amounts of material, reducing the
burden of electrode material fabrication on the researcher. If thin electrodes are used,
concerns over bulk electrode issues are alleviated, making coin cells a good research tool
88
for testing new active materials, electrode material recipes, electrolytes and separators, but
not a good system for research on features of thick electrodes, like densification or bulk
electrode conductivity issues.
For both Ni-Zn and Zn-air cells, Ni was the material of choice for the positive-side
components (cap, spring, spacer and current collector) since it supported low parasitic
currents during charge. Stainless steels and titanium should be avoided due to their high
parasitic currents within the operational potential window of the Ni electrode in alkaline
electrolyte.
Selection of the negative-side components (the can and current collector) was more
stringent due to the fact that Zn electroplates and strips repeatedly during cycling. As such,
Sn was preferred since it had a high overpotential for H2 evolution, was resistant to the
alkaline electrolyte at the potentials of the Zn electrode and provided a favourable surface
for Zn electroplating and stripping. Cu is widely used as a current collector for Zn
electrodes, but the coin cells in this work that used Cu or brass performed poorly in
comparison to Sn. The mechanism for why cells using Cu fail sooner was not determined,
but the desire to study the difference between Cu and Sn current collectors did provide
some of the motivation for the work of Chapter 4. Since no other studies have presented Zn
cycling behaviour on different current collectors in alkaline electrolyte, it was assumed that
other authors chose current collector materials due to ignorance or based on tradition. In
the future, researchers should avoid Cu as a current collector or cell casing material. All
coin cells from this point on in this thesis were constructed with Zn electrodes using Sn for
the current collector and cell casing.
The stack pressure applied to the electrodes is also important for long cycle life. If
stack pressure was too small, the discharge capacity faded noticeably sooner. This was
thought to be due to a loss of electrical contact to the active materials as they cycled. To
89
prevent this, a spring to maintain pressure, a thick enough spacer and a pressure release
valve to prevent ballooning were required.
The dual separator system evidently plays an important role in Ni-Zn cells as well.
It was reasoned that the non-woven separator ensured adequate amounts of H2O were
present next to the Ni electrode and the microporous separator prevented dendrites from
growing on the Zn surface.70 The necessity of these separators was previously known to
experts in the field but had never before been demonstrated in the literature for the benefit
of new researchers.70, 147
Reproducibility within individual bodies of work is poorly reported in the
literature.118, 119, 123 In the author’s opinion, researchers should produce at least three
identical cells and report the average and standard deviations of the discharge capacities vs
cycle number and/or the cycle life, along with the criterion they used to determine cell
failure (ex. 50% of the initial discharge capacity). Without such reporting, results can be
selectively chosen to sway the conclusion in the direction the author wishes.
The ability to compare advancements across different bodies of work is also
hindered by two factors in the current literature. First, authors have a poor habit of either
not cycling their cells until they fail or not reporting the cycle life if they do.121-123, 126-131 This
prevents one author from determining if their advancement is any better than another
without directly testing the other themselves. As demonstrated in Figure 2-18C (pg. 85),
some comparisons, like that between the Cu and Sn current collector cells, cannot be made
unless the cells are cycled to large enough cycle numbers. Second, the cell design might be a
dominant factor in determining the cycle life of a particular researcher’s experiment.
Consequently, in the author’s opinion researchers should divulge their entire cell design
when reporting their results, including electrolyte volumes, separators, stack pressure,
current collectors, methods of electrically connecting to the electrodes, cell casing materials,
90
temperature, and whether or not the cell was sealed, in addition to the details of electrode
manufacture.
If the right components are used, coin cells can match or even outperform
commercial Ni-Zn cells with regard to cycle life. Note that this benchmark was achieved
with un-optimized electrode mixtures, which could no doubt be further improved by using
more state of the art active materials and electrode material recipes.
2.5 Aspects of the Coin Cell Design to be Mindful of
The drawbacks of the coin cell design are not debilitating to most experiments
performed with coin cells, but might affect cycle life. Four aspects are presented here in
order of decreasing importance in the author’s opinion.
2.5.1 Primitive Pressure Release Valve
The recombination of Zn and O2 (Reaction (1-19)) to consume forming Zn dendrites
requires an internal cell pressure greater than atmospheric pressure,67 which the tape over
the hole in the cap likely does not provide. Hence recombination of Zn and O2 likely does
not occur at significant rates in the coin cells presented here. In sealed commercial Ni-Zn
cells the pressure release valve is tuned to allow recombination to occur before opening to
relieve any excess pressure. Also, the tape could likely be replaced with something more
effective at reducing H2O evaporation. With scotch tape over the hole, all of the cells in this
chapter were cycled at 20°C and only lost 4.0 ± 1.1 µL of water (out of 29 ± 4 µL) over the
course of their testing (about 8 days to cycle 50), so H2O evaporation was not an issue.
However, in Chapter 5 coin cells held at 30°C and a relative humidity of about 50% lost
about 1.5 µL/day out of about 36 μL. As such, researchers should be mindful of H2O
evaporation.
91
2.5.2 High Surface Area of Exposed Metal Surfaces
Due to their design, coin cells have a high ratio of exposed metal surface area to
electrode surface area. In particular, the positive side of the cell has exposed Ni surface area
from the edges and back of the spacer, the spring and the cap, while the negative side has a
Sn surface that extends beyond the edges of the negative electrode and separator. These
metal surfaces can support parasitic gas evolution via Reactions (1-16) and (1-17). For
example, at 2 V the current from these parasitic reactions in a fully charged Ni-Zn cell were
observed to be about 100 µA, although that current would be smaller at lower potentials
when the cell is in the process of charging. The increased surface area of exposed metals
reduces the coulombic efficiency (CE) of the relevant electrode due to this increased
parasitic reaction rate. This did not affect any of the analysis in this chapter, but if the CE is
an issue, then changing the cell design to reduce the amount of metal component exposure
might help. Ideally, the only conducting surfaces that would be exposed to the electrolyte
are the electrode materials themselves: active material, binder, conductive support and
additives.
2.5.3 Microporous Separator Encasement of the Zn Electrode
Several successful cells reported in the literature fully encased the Zn electrode with
microporous separator,15 with the exception of a tab for electrical contact, to prevent
dendrites from growing around the edge of the separator.91 Dendrites were witnessed to
form around the edges of the microporous separator in some coin cells to cause short
circuits, but only seldomly. Dendrites occurred in about 10% of coin cells employing large
capacity (~8 mAh) Zn electrodes. This might have occurred because the ZnO electrode
material was smeared to the edges of the separator during cell construction. Since the Sn
can extended past the edges of the separator and acted as the current collector, it is also
92
possible that Zn simply plated beyond the separator, grew toward the Ni spacer and then
short-circuited the cell. However, plating Zn beyond the edges of the separator is likely not
favoured since Zn is more likely to plate directly across the separator from the Ni electrode
where the path traversed by ions between the electrodes is shortest.
2.5.4 Alignment of Cell Components
Inexperience with cell construction can also lead to problems if the experimentalist
is not careful to keep cell components aligned. Properly aligning the cell components was
not difficult, and as long as the researcher pays attention to their work, the following issues
should not be serious. Misalignment of either the spacer or Ni electrode with the other and
with the plastic gasket can lead to an uneven, and possibly too light, stack pressure
distribution. The ductility of the cell can is supposed to help alleviate this, but the effect has
not been quantified to determine if it succeeds. Misalignment of the separators with the
plastic gasket might allow Zn dendrites to form around the edges as discussed in Section
2.5.3 as well. Finally, misalignment of the Ni and Zn electrodes with each other means there
will be overhang and thus some electrode material might be underutilized. This particular
issue might resolve itself since Zn favourably plates directly across from the Ni electrode,
which might result in the Zn electrode shifting over to re-align itself.
93
Chapter 3: Further Applications of the Coin Cell Design
3.1 3-Electrode Ni-Zn Coin Cells
In an effort to better understand coin cell behaviour, 3-electrode coin cells using Zn
foil as the reference electrode were created. A 3-electrode cell allows a researcher to
monitor the potential of both the positive and negative electrodes separately, thereby
allowing features in the potential curve of a 2-electrode cell to be unambiguously ascribed
to one electrode or the other.
3.1.1 3-Electrode Coin Cell Design
The 3-electrode coin cells were identical to standard Ni-Zn coin cells except for the
addition of the reference electrode and a second layer of wetlaid separator. Figure 3-1
shows the cell design and a picture of an assembled cell. The reference electrode was made
Figure 3-1: A schematic of a 3-electrode Ni-Zn coin cell. The reference electrode is Zn foil spot welded to Cu foil, and then heat-sealed into a plastic sheath, leaving the Zn end exposed to the electrolyte and the
Cu end exposed to connect it to the potentiostat. Two non-woven separators provide the compressibility required to spread out the stack pressure around the reference electrode.
Casing Top (Negative Terminal)
Gasket
Disk Spring
Stainless Steel Spacer
Counter/Reference Electrode
Separator
Working Electrode
Casing Bottom (Positive Terminal)
Cap (Ni-coated) with 1 mm Hole and Tape
Gasket
Cone Spring (Ni-coated)
Spacer (Ni-coated)
Ni(OH)2 Electrode
Non-woven Separator
ZnO ElectrodeCan (Sn-coated)
Microporous Separator
Reference Electrode
94
by spot welding a piece of 99.98% pure Zn foil (Alfa Aesar, 270 µm × 4 mm × 2 mm) to a
thin strip of 99.99% pure Cu foil (27 µm × 2 cm × 2 mm). This strip was then sealed within
low density polyethylene (plastic) using a TEW Impulse Sealer (heat sealer) such that only
the Zn was exposed at one end and a short length of Cu at the other end. The Zn end of the
reference electrode was inserted between the two layers of non-woven separator during
cell assembly and the Cu end was folded over the cap during cell crimping so as to not
interfere with the crimping process.
Ni electrodes were pre-formed in standard 2-electrode Ni-Zn coin cells. To
accomplish this, a typical Ni capacity-limited Ni-Zn coin cell was created and cycled to
achieve formation as discussed in Section 2.3.2 (pg. 54). Then this cell was carefully
dismantled using a cell opener (DPM Solutions) so as not to harm the Ni electrode, which
was then transplanted into a fresh 3-electrode coin cell as shown in Figure 3-1. The
intention behind transplanting the Ni electrode was to have a 3-electrode coin cell with a
previously uncycled Zn electrode that had a lower capacity than the Ni electrode.
3.1.2 Ideal Cycling of a Ni-Zn Coin Cell
Figure 3-2 shows matched cycling behaviour in a Ni-Zn coin cell, where both
electrodes finish charging and discharging at nearly the same time. Near the end of charge,
the potential of the Ni electrode arched upwards toward O2 evolution and the potential of
the Zn electrode arched downwards toward H2 evolution. This caused a steep rise in the
total cell potential that triggered the end of the charge half-cycle. Discharge then
commenced until the Ni electrode finished discharging after delivering 96% of its charged
capacity. This happened just before the Zn electrode also finished discharging as evidenced
by the upward arching of the potential curve of the Zn electrode.
95
The Zn potential curve is normally assumed to be flat, so it is illustrative to note that
the potential range of the Zn electrode during discharge is about 100 mV, which is about
half as much as the 200 mV potential range of the Ni electrode. Deiss et al. claim that this
increase in potential is due to a decrease in conductivity of the Zn active material and, at the
end of discharge, to passivation of the small amount of remaining Zn on the current
collector.42
Of use to researchers working with standard, 2-electrode coin cells are the shapes of
the potential curves of the individual electrodes. For example, the potential of the Ni
electrode declines relatively sharply when it reaches the end of discharge, whereas the
potential of the Zn electrode slopes more gradually towards the end of discharge. With a
little practice, this allows a researcher to identify which electrode finishes discharging first
by examining the total cell potential curve. If it drops off sharply, the Ni electrode filled with
H+ first; whereas, if it declined gradually it was likely the Zn electrode that finished
dissolving all of the Zn from the current collector first. Drawing similar conclusions from
the charging portion of the potential curves is more difficult on account of the dependence
Figure 3-2: The typical charge and discharge curves of well-behaved Ni and Zn electrodes as well as the total cell potential (VNi – VZn) in a 3-electrode Ni-Zn coin cell. The reference electrode was Zn foil. The right-side y-axis is used only by the red, Zn electrode curve. The x-axis was normalized to the charge
capacity of this cycle.
Cell Potential
Ni
Zn
0 0.2 0.4 0.6 0.8 1 1.2 1.4 1.6 1.8 2
Normalized Capacity (Q/QCharge)
0.8
1
1.2
1.4
1.6
1.8
2
Ce
ll a
nd
Ni P
ote
ntia
l vs Z
n (
V)
-0.2
0
0.2
0.4
0.6
0.8
1
Zn
Ele
ctr
od
e P
ote
ntia
l vs Z
n (
V)
96
of the shape of the Zn potential curve on the current, as will be shown next.
3.1.3 Overcharging a Ni-Zn Coin Cell
Although some published material shows the potential curve of a 2-electrode Ni-Zn
cell during overcharge,67 to the author’s knowledge no demonstrations of overcharge have
been shown with 3-electrodes. Figure 3-3 shows the overcharging behaviour of a 3-
electrode Ni-Zn coin cell at a low current (136 µA/cm2) and high current (634 µA/cm2).
This section draws heavily from the material covered in Section 1.4 (pg. 17). Recall that H2
and O2 evolution technically occur on the negative and positive electrodes, respectively, at
nearly all times since the Zn electrode is always below 0.41 V vs Zn (Eeq,H2) and the Ni
electrode is nearly always above 1.64 vs Zn (Eeq,O2); however, the corresponding currents
are tiny in an ideal cell to allow the electrodes to charge and discharge without significant
gas evolution. Gas evolution significantly increases when there is no more Zn to plate on
Figure 3-3: Overcharge behaviour of 3-electrode Ni-Zn coin cells. The two cycles shown come from different cells and different cycles so their history is different. The x-axis is arbitrarily scaled to the
theoretical capacity of the corresponding Ni electrode. The Zn curves correspond to the right-side y-axis, while the other curves correspond to the left-side. “High” current is 634 µA/cm
2 (CZn/4) and “low” current
is 136 µA/cm2 (CZn/6.75). The coin cell design was the standard design discussed in Section 2.2 but with a
3rd
Zn foil reference electrode.
Cell, Low Current
Cell, High Current
Ni, Low Current
Ni, High Current
Zn, Low Current
Zn, High Current
0 0.2 0.4 0.6 0.8 1 1.2 1.4 1.6 1.8
Normalized Capacity (Q/QZn)
1.5
1.6
1.7
1.8
1.9
2
2.1
Ce
ll a
nd
Ni P
ote
ntia
l vs Z
n (
V)
-0.2
-0.1
0
0.1
0.2
0.3
0.4
Zn
Ele
ctr
od
e P
ote
ntia
l vs Z
n (
V)
ESlow = EH2 - ESum = -60 mV
EFast = EH2 - ESum = -130 mV
97
the negative electrode or when no further H+ can be removed from the Ni; at that point, the
current that is being forced through the cell by the charger causes only gas evolution.
As was briefly described in Section 1.4, the potential difference between charging an
electrode and evolving gas depends on the current. At low currents, this difference is only
about 60 mV, as evidenced by the “low” current Zn potential curve in Figure 3-3. Whereas
at high currents, the potential change of the Zn electrode when the electrode goes from
plating Zn to evolving H2 is more pronounced (about 130 mV) and thus noticeably different
from the Ni electrode entering overcharge in the total cell potential curve. This means that
a researcher working with a 2-electrode coin cell will not be able to easily determine when
a cell begins overcharging the Zn electrode if they are using a low current. If knowing when
the Zn electrode is finished charging is important, the researcher should take care to use a
high enough current that they will be able to see a slight bump in the total cell potential
charge curve (for an example, see Figure 5-7 on page 159).
3.1.4 Overdischarging a Ni-Zn Coin Cell
To the author’s knowledge, overdischarge is not demonstrated anywhere in the
literature, even in 2-electrode cells. Figure 3-4 shows the first cycle of a fresh 3-electrode
coin cell in which the Ni electrode is overdischarged. The shapes of these curves are
indicative of several processes that are labelled alphabetically and described in the
following paragraphs:
(A) The difference between these two curves shows the effect of allowing the Ni
electrode to dry for about 1 minute as it was transplanted from the formation cell to the 3-
electrode cell. When dismantling the formation cell, the non-woven separator, which is
soaked in electrolyte, is normally removed and replaced with a fresh separator in the 3-
electrode cell, which is then re-soaked with new electrolyte. The top inset in Figure 3-4
98
shows the potential curves of the Ni electrode when the separator was replaced (upper,
blue) and when the old, wet separator was left attached to the Ni electrode (lower, orange).
Evidently in a new cell where the Ni electrode was allowed a moment to dry, a higher Ni
electrode potential is required at the beginning of the first charge until proper wetting has
been re-established. This might be due solely to the use of a coating-style hydrophobic
binder (PVDF binder and NMP solvent) in these Ni electrodes as opposed to the more usual
spider web style hydrophobic binder (PTFE binder and shearing forces during slurry
mixing). As a reminder, PVDF and NMP were used to make Ni electrodes in this thesis
because they make electrode manufacture more facile by sticking to the Ni foil more easily.
(B) The small potential drop in the cell potential here is almost entirely due to the
Figure 3-4: Demonstration of overdischarge of the Ni electrode in a 3-electrode Ni-Zn coin cell. These curves also demonstrate the shapes of Ni and Zn curves on the first cycle with a pre-formed Ni electrode.
The insets have the same units for their axes as the larger graph except where noted. The top inset shows the Ni potential curves when the separator is (blue) and is not (orange) replaced during cell
reconstruction. The bottom inset shows the potential curve during the first charge of a Zn electrode. Letters (A) through (G) are referred to in the text while discussing this data.
0 1 2 3 4 5 6 7 8 9
Time (h)
0
0.2
0.4
0.6
0.8
1
1.2
1.4
1.6
1.8
2
Po
ten
tia
l vs Z
n (
V)
Cell Potential
Ni
Zn
0 1 2 3 4 51.6
1.7
1.8
1.9
Dry and Wet Ni Electrodes
0 2 4 6Time (min)
-0.1
0
0.1
0.2
0.3
The First Zn Electrode Charge
(A)
(B)
(C)
(D)(E)
(F)(G)
Wet
99
Zn electrode switching from plating to stripping Zn. The Ni electrode discharges nearly
linearly until it is as filled with H+ ions, and corresponding e−, as it can be without triggering
a structural change.51 Note that the coulombic efficiency (CE) of the ‘dry’ Ni electrode is
47% in this first cycle, while the pre-wetted Ni electrode delivers 59% in the first cycle (not
shown). Evidently, dryer Ni electrodes waste more charge, but of more concern is the fact
that even pre-formed Ni electrodes have a poor CE during the first cycle.
Of, perhaps understated, importance here is the fact that the pre-formed Ni
electrode finished discharging before the Zn electrode. Further cycling was done to confirm
that this is always the case. This means that experiments intending to measure the CE of the
Zn electrode as a function of cycle number are not possible with Ni electrodes that are of a
similar capacity to the Zn electrode or fully discharged when the first charge half-cycle is
initiated.
To have the Zn electrode finish discharging first, the Ni electrode would have to
begin in a partially charged state, and would ideally have a significantly larger capacity than
the Zn electrode. The state of charge of the Ni electrode would drop each cycle, but until it
reached the bottom, the Zn electrode would finish discharging first each cycle. The limits of
the electrode construction techniques used in this thesis limited the largest possible Ni
electrode to a theoretical capacity approximately twice that of the smallest Zn electrode.
This capacity ratio was not enough to test the Zn discharge capacity for more than about 10
cycles given that the CENi was about 96% for most cycles, but notably lower in cycle 1.
Larger capacity Ni electrode spreads would not adhere well to the Ni foil current collector
and thinner Zn electrodes than a 0.0015” coating did not spread uniformly.
(C) This short plateau is the intercalation of H+ and e− into the small amount of β-
NiOOH or γ-NiOOH (H0.5K0.33(H2O)0.66NiO2)50 that normally does not participate in the
intercalation process to maintain conductivity in the Ni(OH)2 crystallites.51 The capacity
100
locked away in this in-active material was 14%, which is in line with the 20% witnessed by
Deabate et al..51
(D) This plateau is H2 evolution on the Ni surface.78 Note that Ni evolves H2 at a
potential about 400 mV higher than Zn would. Also note that Ni(OH)2 does not convert back
to Ni + 2OH− as would be suggested by Pourbaix,64 but which is in agreement with what
Hall et al. observed.78 If Ni(OH)2 has been charged to above 1.5 V, then it does not reduce to
Ni again during subsequent cathodic polarizations. This was confirmed in cycle 2 (not
shown) since no Ni + 2OH− → Ni(OH)2 + 2e− reaction occurred, which would have
appeared as a plateau around 400-500 mV vs Zn.78
(E) The shoulder here at 0.1 V is the plating of dissolved Sn in the electrolyte and/or
the underpotential deposition of a monolayer of Zn on the Sn current collector surface.79
This shoulder is present only in the first charge half-cycle of a new cell.
(F) The steeply sloped rise of the potential of the Zn electrode here is a mystery and
its exact shape varied from cell to cell.
(G) As mentioned previously, this upward slope in the potential curve of the Zn
electrode is thought to be an increase in electrode resistance as the conduction paths within
Figure 3-5: Demonstration of overdischarge of the Zn electrode in a 3-electrode Ni-Zn coin cell. The right-side y-axis is used by the Zn curve only and it has the same scale and units as the left-side. Only the end
of a discharge half-cycle is shown in order to make the flat plateau obvious. The flat plateau in the Zn curve is Sn dissolution from the current collector and/or coin cell can.
5 5.1 5.2 5.3
Time (h)
0.6
0.8
1
1.2
1.4
1.6
1.8
Po
ten
tia
l vs Z
n (
V)
0
0.2
0.4
0.6
0.8
1
1.2
Cell Potential
Ni
Zn (Right y-axis) (H)
101
the electrode become thin or disappear. The final upward spike in potential occurs when
the active Zn surface area shrinks small enough to trigger passivation.42
(H) Figure 3-5 demonstrates the overdischarge of a Zn electrode and shows the
resulting dissolution of the Sn current collector at about 0.3 V vs Zn.
3.1.5 Concerns with the 3-Electrode Coin Cell Design
Unfortunately, the reference electrodes employed here sometimes seemed to
contribute to cell failure and so should not be used in cycle life experiments intending to
cycle more than about 100 cycles. Four factors are of note in this regard although only the
last one was really suspected of causing cell failure. (1) The first is the fact that the Zn
reference electrode maintains its potential by constantly corroding, albeit at a low rate
(about 3 µA/cm2). As such, Zn is constantly entering the electrolyte from the reference
electrode, which would eventually contribute noticeably to the available capacity of the Zn
electrode. (2) Second, it is difficult to seal the coin cell when there is a tab passing through
the seal. Over time, water evaporates though the gaps on either side of the tab and the cell
dries out, but this could be solved by sealing the gaps with epoxy. (3) The third issue is that
of electrolyte wicking, discussed in detail in Section 4.3 (pg. 126). If the plastic heat seal
around the Zn foil of the reference electrode is penetrated, then the electrolyte wicks up the
copper foil until it eventually reaches the alligator clip attached to the other end. The
copper corroded when this happened, but the corrosion did not seem to affect the reference
potential since the reference potential itself is due to the corrosion of Zn. The Zn foil itself
was thick enough to withstand corrosion for some time.
(4) Since the electrodes in these coin cells are relatively small and the space
between them is thin, the relatively large size of the reference electrode can be an
obstruction. Physically, it interrupts the current lines going between the two electrodes,
102
and the non-negligible thickness of the reference electrode results in a sub-section of the
two electrodes that has a higher stack pressure. Surprisingly, this seemingly obvious
problem did not seem to cause cell failure. Sometimes dendrites grew to contact the
reference electrode, which shorted the potential measurements. However, if this was going
to happen at all it seemed to happen during the first charge half-cycle, within the first 2-3
hours; three of the eight 3-electrode cells made shorted this way in the first charge half-
cycle. One other cell shorted, but only after 85 hours of cycling (8 cycles). Two other cells
failed due to unknown problems: one after 80 hours (13 cycles) and the other after 150
hours (56 cycles). Dismantling the cells did not reveal any obvious explanations. The final
two cells did not fail, and finished their experiments: one after 160 hours (20 cycles) and
the other after 100 hours (33 cycles). The number of cycles or time to cell failure is not
specifically important since each cell was subjected to different tests; they are listed here
for the reader’s interest and to demonstrate that although some of these cells failed due to
the inclusion of the reference electrode, most easily survived long enough to perform useful
experiments with them.
3.1.6 3-Electrode Coin Cell Conclusions and Future Work
The 3-electrode coin cell allowed 3-electrode experiments under nearly the same
conditions that are experienced by commercial electrodes, which are cycled under stack
pressure with a current collector and only a small amount of electrolyte. This section
illustrated how a researcher can use a 3-electrode coin cell to explore how the electrodes
perform under regular operation and abuse, the latter of which is rarely reported in the
literature and usually has to be explored by the experimentalist. Here, it was shown that Zn
electrode discharge potential curves are not perfectly flat, that Ni electrode potential curves
drop off more steeply than Zn potential curves at the end of discharge, that Sn dissolution
103
can be identified by an additional plateau at the end of discharge of a 2-electrode cell, and
that the onset of overcharging a Zn electrode can only be identified in the potential curve of
a 2-electrode cell if the charging current is high enough (about C/2). Even if some of these
concepts have already been shown in the literature, it is often useful for an experimentalist
to reproduce them in their own lab. If they are already using coin cells, then the 3-electrode
coin cell design allows them to do so without changing their experimental test vehicle.
The most substantial realization that these 3-electrode experiments revealed was
the significance of the low CE of the Ni electrode compared to the Zn electrode. The original
purpose of creating a Ni-Zn coin cell was to create a test vehicle for testing the discharge
capacity vs cycle number and overall cycle life of new Zn electrode active materials or
additives for use in a Zn-air cell. The absence of an air electrode and, presumably,
electrolyte evaporation issues was viewed as a simplification to the system that would make
experimentation on new Zn electrodes easier. These experiments are not possible unless
the electrode opposing the Zn electrode (i.e. Ni in this case) continually outlasts the Zn
electrode during each discharge half-cycle. As an aside, in the Li-ion field, where the idea of
the coin cell originated, Li metal fulfils the role of a counter electrode that outlasts the
opposing electrode during each discharge for hundreds of cycles. As such, Ni-Zn cells are
simply not sufficient for testing Zn electrode discharge capacities unless a significantly
larger and pre-charged Ni electrode is used or a researcher inadvertently uses a poor Zn
electrode that has a lower CE than the Ni electrode.
For future work, the reference electrode can enhance the analysis of a particular
effect known to occur at one of the electrodes. For example, a 3-electrode cell could be used
to form a Ni electrode, which would allow the acquisition of dQ/dV data free of negative
electrode effects. This might provide a clearer picture than Figure 2-3 and Figure 2-4 of
what occurs in the Ni active material during formation. Alternatively, if 3-electrode coin
104
cells that survived long enough to witness the failings of the electrodes were realized, then
the origin of the potential depression at the beginning of discharge observed in cells with
titanium (Ti) parts (Figure 2-12B, pg. 73) and at high cycle numbers (Figure 2-19B, pg. 86)
could be better explored. The reference electrode itself could likely be improved by using a
ring of Zn foil with a larger diameter and thinner thickness than the Zn electrode to avoid
having the reference electrode interrupt the current lines between the electrodes or disturb
the pressure distribution.
3.2 Zn-Air Coin Cells
Since Ni electrodes were not capable of providing a sufficient counter electrode to
Zn, an alternative needed to be found. An air electrode has an effectively infinite supply of
O2 from the environment, so it would not limit the discharge capacity of the cell the way Ni
does. As such, efforts were made to obtain bi-functional air electrodes through fabrication
or purchase. The task of fabricating durable bi-functional air electrodes was left to another
graduate student. Commercial bi-functional air electrodes were hard to acquire and so only
primary (i.e. discharge only) commercial air electrodes were successfully obtained. This
section demonstrates that Zn-air coin cells can be made and how, but note that only air
electrodes that were not designed to be charged were used since those were the only air
electrodes on hand. Future research efforts can continue once true bi-functional air
electrodes are fabricated or acquired.95
3.2.1 Zn-air Coin Cell Design
Figure 3-6 shows two designs for Zn-air coin cells; Figure 3-6A is the design used in
experiments presented here, while Figure 3-6B shows an alternate coin cell design. Many
components in Figure 3-6 are the same as those in Figure 2-1 (pg. 50) and have the same
105
roles. Beginning at the cap and working downward, cell design A includes a Ni-Cr wire
mesh that acts as a simple air flow plate to promote an even distribution of oxygen over the
air electrode surface. The non-rechargeable air electrode itself was made with a non-
conductive Teflon coating, which was oriented towards the air hole, and necessitated a
means of electrically connecting the electrode to the cap. This was achieved by using a
“figure-8” shaped Ni foil cut-out that was wrapped around the air flow plate and electrode
to make contact with the conductive bottom of the air electrode. Two non-woven
separators were used to thicken the stack height and thereby increase the stack pressure to
about 1,000 kPa using pressure film as described in Section 2.2.7 (pg. 52), except by placing
the pressure film where the Zn electrode was normally located.
If a thicker coin cell canister with enough space inside is available, the alternate coin
cell design B might work better. In this design, a Teflon microporous membrane would be
sealed to the cap around the hole(s) to passively reduce the evaporation of H2O and a Ni
wave spring would provide stack pressure. It would also include a machined air flow plate
Figure 3-6: The Zn-air coin cell designs used for this thesis. The “Ni Mesh” and “Ni Foil” wrap-arounds were single pieces of material in the shape of a “figure-8”, or dumbbells, and folded to wrap around non-conductive components. The air flow plate is a plastic (PEEK) disk with 12 holes drilled in it, and 5 troughs
dug into each side, as shown, to allow air to easily pass to any point of the air electrode.
Cap (Ni-coated) with 2 mm Hole
Gasket
Ni-Cr Air Flow Mesh
Air Electrode
2x Non-Woven Separators
ZnO Electrode
Can (Sn-coated)
Microporous Separator
Ni Foil Wrap-around Figure-8
A Cap (Ni-coated) with 2 mm Hole
Gasket and Teflon Micr--oporous Membrane
Wave Spring (Ni-coated)
PEEK Air Flow Plate (Detail on Left)
Air Electrode
Non-woven Separator
ZnO Electrode
Can (Sn-coated)
Microporous Separator
Ni Mesh Wrap-around
B
106
made of PEEK plastic, which is strong, easily machinable and resistant to alkaline
electrolyte. The wrap around Ni mesh provides electrical contact to the top side of the air
electrode.
Design A was sufficient for a simple proof-of-concept demonstration and cells were
constructed as shown in Figure 3-6. During cell fabrication, about 110 µL of 6 M KOH,
saturated with ZnO, electrolyte was used to soak the two non-woven separators. The cell
was cycled at room temperature using a Bio-Logic VMP3 potentiostat.
3.2.2 Zn-air Coin Cell Cycling
Figure 3-7 shows the discharge capacity, in the form of the coulombic efficiency, as a
function of cycle number for a Zn-air coin cell. The air electrode was kindly donated by Dr.
Yi-Cheng Lee, a Taiwanese researcher, and was designed for non-rechargeable cells, but this
does not mean it cannot be charged; it means that it will likely break down faster than a bi-
functional air electrode during cycling. The catalyst was MnO2, but Dr. Lee said that the
manufacturer would not disclose the catalyst loading and current collector material. The Zn
electrode of the cell depicted in Figure 3-7 had a capacity of 2.8 mAh. Along the lines of
other researchers,118 this cell was charged to 2 mAh (about 2/3 of its theoretical capacity,
QT), and then only 1 mAh was discharged (1/3 QT), both at a rate of 1 mA (about C/3).
Discharge was also terminated at 1.0 V in case all of the Zn dissolved off of the current
collector.
Since the potential drops to 1.0 V in the 4th discharge, it seems the extra 1 mAh of
capacity that was charged in the first cycle was consumed within the first four discharge
half-cycles. This is consistent with the observed coulombic efficiency (CE) decay evident in
cycles 5 – 20 (see the linear equation in Figure 3-7). Extrapolating backwards, the CE in
cycle 1 should have been 80%, decaying linearly to 76% in cycle 4. Based on this
107
extrapolation, the difference between the sum of what was likely charged in each of cycles 1
to 4 and the sum of what was actually discharged was 0.89 mAh, which is close to the 1 mAh
of extra charge available from cycle 1. It is unlikely that the drop in potential to 1.0 V at the
end of the 4th discharge was due to the air electrode drying out since the shape of the
discharge curves match the shape of Zn electrodes approaching depletion as seen in the 3-
Figure 3-7: The cycling of a Zn-air coin cell. The constant current for both charge and discharge was 1 mA, while the theoretical capacity of the Zn electrode was 2.8 mAh. The first charge half-cycle was 2 mAh,
while all other half-cycles were limited to either 1 mAh or reaching a lower potential of 1.0 V (as was the case in cycles 4 to 20). Panels A and B are example V vs t plots to demonstrate the decay of the cell’s potential and capacity. Panel C shows the coulombic efficiency and a line of best fit to cycles 5 – 20
inclusive.
0 5 10 15 20
Cycle
0.4
0.5
0.6
0.7
0.8
0.9
1
1.1
Co
ulo
mb
ic E
ffic
ien
cy
(QD
ischa
rge/Q
Cha
rge)
0 0.5 1 1.5 2
Time (h)
1
1.2
1.4
1.6
1.8
2
Ce
ll P
ote
ntia
l (V
)
Cycle 5
Cycle 12
Cycle 20
1
1.2
1.4
1.6
1.8
2
0 3 6 9 12
Time (h)
C
B - Cycle 20
A - Cycles 1 - 5
CE = -0.0143Cycle + 0.8156
108
electrode cells of Section 3.1.4 (pg. 97).
The decay in CE of the Zn electrode is likely due to an increase in a combination of
Mn(II)/Mn(III) shuttling between the electrodes as described in Section 1.9.2 (pg. 31) or an
increase in the H2 evolution rate on the zinc electrode due to the presence of Mn(OH)2.21, 97
Increasing amounts of Mn likely dissolved off of the air electrode during each charge half-
cycle since the potential during charge rose above the critical potential for MnO2 dissolution
(1.9 V vs Zn), and so the shuttling mechanism was likely the cause of the continuing
decrease in the CE of the Zn electrode. Note that any Mn(OH)2 that precipitated on the Zn
electrode would not be further reduced to Mn because the potential of the Zn electrode did
not reach the required ~ -0.26 V vs Zn during charge.81 It is unclear how much MnO2 would
need to dissolve to significantly affect the parasitic H2 evolution rate (iH2) and self-discharge
rate (iSD) of the Zn electrode since it is unknown whether the Mn shuttling process occurs
through a one- or five-electron process (see Section 1.9.2, pg. 31). Note that the small dips
in the CE around cycles 11 and 17 were likely due to the daily temperature cycle of the lab
since these cells were not cycled in a temperature-controlled box. The temperature was
about 22 ± 4 °C.
Also of note is the small but steady increase in the cell resistance, evident by the
increasing cell potential during charge and decreasing cell potential during discharge. Since
the kinetics of the Zn electrode reactions are quite fast, this trend is likely due to a
decreasing catalytic active surface area on the air electrode, which supports the dissolving
MnO2 theory, but it could also be due to the destruction of the support structure of the air
electrode as described in Section 1.9.1 (pg. 30). Either way, to continue research on Zn-air
coin cells, researchers should focus on acquiring or fabricating durable bi-functional air
electrodes.
109
3.2.3 Zn-air Coin Cell Conclusions and Future Work
This section demonstrated how to make a functional Zn-air coin cell. The cycle life
was short, but this was likely due to the air electrode, which was not designed to be
charged. For continuing research efforts, using Zn-air cells instead of Ni-Zn cells to test Zn
electrodes would be advantageous since the coulombic efficiency of the air electrode is not
important. This is in contrast to the Ni electrodes used in this thesis that repeatedly showed
inferior coulombic efficiencies to Zn electrodes, which made measuring Zn electrode
discharge capacities difficult since the Ni electrode finished discharging before the Zn
electrode. As such, future work should concentrate on acquiring or developing a durable bi-
functional air electrode that survives many cycles (and thus does not use MnO2). For
instance, Chen et al. have recently shown that a stainless steel mesh with a non-Mn catalyst
grown directly onto the mesh, thereby avoiding corrodible binder materials, is quite
durable.95 Alternatively, future work could continue relatively quickly if a suitable air
electrode were found commercially or through collaboration with another lab.
Also of note for future research is the looming issue of water management for (non-
flooded) coin cells. The data in Figure 3-7 took about 36 hours to collect, so evaporation
was not an issue in this case since the evaporation rate was about 2 µL/day = 3 µL out of
110 µL. However, any future work with long cycle life Zn-air coin cells will have to
determine how to seal the Teflon microporous membrane to the cap and/or use a humidity-
controlled chamber to house the coin cells in order to remove water management as a
Recently, Yan et al. demonstrated a cell using lithium manganese oxide (LiMn2O4) as
the positive electrode and Zn as the negative electrode that they claimed could last 4,000
110
cycles in a Swagelok style cell.167 They did not mention the amount of metal in contact with
the electrolyte nor the volume of electrolyte they used nor the amount of stack pressure, if
any. In order to determine if the LiMn2O4 – Zn cell chemistry worked as claimed, LiMn2O4 –
Zn coin cells were fabricated and cycled. The theoretical operation of these cells and a
simple theoretical model of the volumetric energy density are presented in Appendix A,
Section A.5 (pg. 198).
3.3.1 LiMn2O4-Zn Coin Cell Design
The electrolyte was the same as that used by Yan et al.:167 3 M LiCl (Aldrich 99+%)
and 4 M ZnCl2 (Sigma 98+%) with the pH adjusted upward to 4 using LiOH (Sigma-Aldrich
98+%). Yan et al. did not reveal what they used as the positive (LiMn2O4) side component
materials, but they used graphite foil for the positive current collector, and stainless steel
(SS) 316 as the negative (Zn) side current collector. In order to determine which materials
should be used for the positive and negative side components to avoid parasitic gas
evolution, as was shown in Figure 2-8 (pg. 63), several coin cells were created with the
Figure 3-8: Current drawn by oxide layer formation and O2 evolution on coin cell components within the potential range of the LiMn2O4 – Zn system. The electrolyte was 3 M LiCl, 4 M ZnCl2, trace LiOH at pH 4. In the legend, the materials before the slash (/) are the positive side components and the material after the slash is the canister material. For example, “SS 304 – Ti / SS 444” means the cap and spring were SS
304, the spacer was Ti and the canister was SS 444.
SS 304 - Ti / SS 444
SS 304 - Ti / Sn
Ti / Sn
Ti / SS 444
1.4 1.5 1.6 1.7 1.8 1.9 2 2.1
Cell Potential (V)
0
0.05
0.1
0.15
0.2
0.25
Cu
rre
nt
(mA
)
111
electrolyte above and various materials on the positive and negative sides of the coin cell
but with no LiMn2O4 electrodes. Stainless steel (SS) 304 was tested as a positive side
component material since the coin cell caps, springs and spacers on hand were made of that
material. Ti was also tested because it is resistant to acid. The coin cell canisters were
made of SS 444, so that material was tested as a negative side component material, along
with tin (Sn) since it has a high overpotential for H2 evolution and should be stable in pH 4
electrolyte at the potential of the Zn electrode, according to Pourbaix.64 These cells were
subjected to a linear potential sweep up to 2.15 V and down to 1.4 V, several times, each at a
sweep rate of 10 mV/s.
Figure 3-8 shows the results of these potential sweeps. Any detected current at a
particular potential arose from parasitic reactions at the positive side components since Zn
plating dominated at the negative electrode (which acted as the counter electrode and
reference electrode in this situation). As such, the material combination that gave rise to
the least current signal during the first sweep was qualitatively declared to be the best
material to use. In decreasing order, the favoured material combinations were (positive
side – negative side): (Ti / SS 444) > (Ti / Sn) > (SS 304 – Ti / Sn) > (SS 304 – Ti / SS). Here,
SS is Stainless Steel, and SS 304 – Ti is a SS 304 cap and spring with a Ti spacer. As per
these results, a Ti sputter-coated cap and spring, a pure Ti spacer and a stainless steel 444
canister were used in the fabrication of the LiMn2O4 – Zn coin cells reported here.
LiMn2O4 electrodes were fabricated along the same lines as described in Section 2.2
(pg. 47). They consisted of 83 wt% LiMn2O4, 10wt% C45 carbon black conductive support,
and 7 wt% PVDF binder. Double the powder mass (2g) of NMP solvent (4g) was added to
dissolve the binder and form a slurry. The slurry was mixed in a Mazerustar planetary
mixer for 10 min, then spread onto graphite foil using a 0.006 “ notch bar and finally dried
in air in an oven at 80°C for 2 hours. 1.27 cm diameter disks were punched from the foil,
112
and used to make coin cells, along with one layer each of nonwoven (700/30K from
Freudenberg) and microporous (3407 from Celgard) separators.
3.3.2 LiMn2O4-Zn Coin Cell Cycling
LiMn2O4-Zn coin cells were cycled at a 4C rate, the same as that used by Yan et al.,
with charge ending at 2.15 V to avoid overcharging the LiMn2O4 electrode and discharge
ending at 1.4 V. Figure 3-9 shows a representative coin cell that had the same cycling
behaviour as the other 3 identical cells used in this experiment. In cycle 0, the charged
capacity is 0.445 mAh, which translates into 107 mAh/g LiMn2O4 as expected for this
material. The cell only returned 0.335 mAh during discharge though, since the Zn electrode
finished discharging first, triggering the end of discharge at 1.4 V. The reason for this 75%
CE in cycle 0 is unclear, but it does not persist in subsequent cycles when the CE of the Zn
electrode increases to a more usual 98.9%. The 98.9% CE of the Zn electrode is directly
observable in Figure 3-9C since the capacity of any given cycle was 98.9% of the previous
cycle capacity up to around cycle 100. This is also evident in panel B, where it is apparent
that as cycling continued the cell potential at the beginning of charge began higher up the
LiMn2O4 potential curve and the discharge potential curve dropped off sooner. This
behaviour is proof that the LiMn2O4 electrode was not fully discharged each cycle, and so its
state of charge kept increasing, which in turn shortened the amount of time spent charging
since the end of charge was triggered when the potential of the LiMn2O4 electrode spiked
upward to 2.15 V. In panel C, the bump around cycle 160 occurred when the initial cell
potential surpassed the bump in panel B around 9 min (see the potential curves of cycles
120 vs 200). The bump in the potential curve occurred when half of the Li sites within the
LiMn2O4 had been vacated, and the repulsive force between the Li atoms in the two Li sub-
lattices had disappeared.168 The increase in discharge capacity around cycle 160 was due to
113
discharging the Zn electrode to a lower potential, which also increased the CE. After about
cycle 180 in panel C, the CE of the Zn electrode had increased to 99.7%, but continued to
limit the cell discharge since the LiMn2O4 electrode continued to be pushed up its potential
Figure 3-9: The cycling of an example LiMn2O4 – Zn coin cell. The charge and discharge currents were 4C for all cycles where C was the theoretical Li electrode capacity for Cycle 0 (panel A) and then C was
readjusted to equal the discharge capacity of Cycle 0 (0.335 mAh) for cycles 1 - 1000. Panel B shows the potential curves of several cycles intentionally centered at the top of charge (2.15 V) to show that the
potential curves are mostly co-linear. Each cycle was shifted along the time axis so that it finished charging at the same time as Cycle 2 did (15.64 min). Panel C shows the first 500 cycles of cycling, and an
xCycle Number−1 fit to the first 100 cycles. Although the cell was cycled 1000 times, the undisclosed cycles continue to decay in the same manner as cycles 200 – 500. The crosses indicate the positions of cycles 2,
40, 120, 200 and 500.
0 100 200 300 400 500
Cycle
0
0.2
0.4
0.6
0.8
1
Fra
ctio
n o
f In
itia
l D
isch
arg
eC
ap
acity (
QD/Q
D,
Cycle
1)
0 8 16 24 32 40
Time (min)
1.4
1.6
1.8
2
2.2
Cell
Po
ten
tia
l (V
)
Cycle 2
Cycle 40
Cycle 120
Cycle 200
Cycle 500
1.4
1.6
1.8
2
2.2
0 4 8 12 16 20
Time (min)
C
B
A - Cycle 0
= 0.989(Cycle Number - 1)
Data
114
curve.
Closer inspection of Figure 2a in Yan et al.’s paper revealed that they overcharged
their cell every cycle, but since they did not explain their cycling procedure, this was not
obvious.167 Because the coin cell cycled in Figure 3-9 had a CE that hovered around 99%, it
is likely that if a cell was overcharged to 101% of its initial capacity every cycle, its
discharge capacity would remain high throughout more cycles. Indeed, this might be
exactly how Yan et al. kept their discharge capacity close to 100% for 1,000 cycles.
Figure 3-10 shows two LiMn2O4-Zn coin cells that were identical to the ones cycled
in Figure 3-9 with the following differences: A pressure release valve (hole with tape) was
added to the cap to allow excess O2 to escape, the temperature was maintained at 30.±0.1°C,
charge was limited by capacity (or time), and discharge was limited to 1.5 V. Until the cells
shorted around cycle 30, it is evident that the LiMn2O4 – Zn cell can indeed maintain its
discharge capacity as Yan et al. claim, and there is effectively no difference between
overcharging by 3% or by 10%.
However, overcharging the cell every cycle consumes the electrolyte and risks short
circuiting due to dendrite growth. Hypothetically, if the hydrolysis of water is limited to the
Figure 3-10: Discharge capacity of LiMn2O4 – Zn coin cells that are overcharged each cycle to ensure that the Zn electrode has more capacity than the LiMn2O4 electrode. These two cells had pressure release
valves, and failed after cycle 30 from short circuits due to dendrites and/or electrolyte leakage. T = 30°C.
0 5 10 15 20 25 30 35
Cycle
0
0.2
0.4
0.6
0.8
1
Fra
ctio
n o
f In
itia
l D
isch
arg
eC
ap
acity (
QD/Q
D,
Cycle
1)
10% Overcharge
3% Overcharge
115
extra 1% mentioned above, and if a coin cell has 50 µL of electrolyte but can only lose half of
that (25 µL) before failing, then given that hydrolyzing water consumes 2,980 Ah/L, a coin
cell could withstand 74 mAh of overcharge before failing. For a typical coin cell here with a
realized maximum initial capacity of about 0.35 mAh and thus an overcharge of 0.0035 mAh
per cycle, this would mean the electrolyte would not limit the cell’s performance until after
21,000 cycles. In which case, hydrolyzing the electrolyte is likely not a threat to a coin cell
or to the Swagelok-style cell used by Yan et al., but it might be of concern in a commercial
cell if the cell performance is sensitive to the concentrations of LiCl and ZnCl2 in the
electrolyte. The dendrite threat could be mitigated by using a high pressure-release valve.
This would allow the internal partial pressure of O2 to rise high enough to cause dendrite
consumption via Reaction (1-19), but it must be noted that such consumption would
eliminate capacity from the Zn electrode. If the purpose of overcharging is to increase the
capacity stored in the Zn electrode then dendrite consumption negates the purpose of
overcharging the cell in the first place.
3.3.3 LiMn2O4-Zn Coin Cell Conclusions and Future Work
This section demonstrated that LiMn2O4 – Zn cells in their current form require
overcharging every cycle to deliver maximal discharge capacities over hundreds of cycles,
which has not previously been demonstrated in the literature. This necessitates the use of a
vented cell, since excess O2 produced in the cell would eventually negate the benefit of
overcharging by consuming equal amounts of Zn. This concept of overcharging a vented cell
to get one electrode to last longer than the other could be used in Ni-Zn cells to charge a Ni
electrode more than the opposing Zn electrode, thereby allowing the Zn electrode to finish
discharging first during the subsequent discharge half-cycle (as was done in Chapter 5).
116
Any future work on LiMn2O4-Zn cells should focus on two main goals: First, the Zn
electrode coulombic efficiency must be improved or a balance must be struck with a
pressure-release valve to allow a small amount of overcharging to take place without
oxidizing too much Zn. Second, as argued in Appendix A, Section A.6 (pg. 199), the LiCl
concentration of the electrolyte limits the energy density of the cell, and so it must be
increased for the energy density to become commercially competitive. The CE of the Zn
electrode could likely be improved over the results presented here by using a negative
electrode current collector with a higher overpotential for H2 evolution than SS 444 or
possibly by using purer ZnCl2.
117
Chapter 4: Self-Discharge Experiments Using Metal Foil
4.1 Motivation
One of the critical concerns for both research and commercial cells is self-discharge,
which was described in Section 1.7 (pg. 24), but the reactions are reproduced in more detail
below. No matter which system a researcher is working with, minimizing the self-discharge
rate is important. Specifically, low self-discharge rates in commercial cells enhance
marketability.169 In research, the coulombic efficiency (QDischarge/QCharge) is a commonly used
measure of various phenomena in a cell.170 It is affected by parasitic reactions, self-
discharge and loss of active material. This means that a quantitative conclusion about the
rate of loss of active material in a cell cannot be made using the CE unless the parasitic and
self-discharge rates are known exactly, or known to be small in comparison to the
phenomenon being measured. For example, the CE of a particular cycle of a Ni-Zn cell might
be 95%, but it would be more useful to know how much of the lost 5% was due to self-
discharge, parasitic currents or a loss of active material. This knowledge would help explain
why cells fail.
Overall, the self-discharge mechanism involves
2𝐻2𝑂 + 2𝑒− 𝐻2(𝑔) + 2𝑂𝐻−, (4-1)
which occurs on either the Zn deposit or the current collector, while simultaneously
𝑍𝑛 + 4𝑂𝐻− 𝑍𝑛(𝑂𝐻)4(𝑎𝑞)2− + 2𝑒−, and then either (4-2)
𝑍𝑛(𝑂𝐻)4(𝑎𝑞)2− 𝑍𝑛(𝑂𝐻)4(𝑎𝑞)𝑏𝑢𝑙𝑘
2− or (4-3)
𝑍𝑛(𝑂𝐻)4(𝑎𝑞)2− 𝑍𝑛𝑂(𝑠) + 𝐻2𝑂 + 2𝑂𝐻− (4-4)
occur. Each of Reactions (4-1), (4-2) and (4-4) can be broken down into mechanistic steps.
Trasatti63 explained the two possible mechanisms for H2 evolution as
118
𝑆𝑢𝑟𝑓𝑎𝑐𝑒 + 𝐻2𝑂 + 𝑒− → 𝐻𝑎𝑑𝑠𝑜𝑟𝑏𝑒𝑑 + 𝑂𝐻− followed by either (4-5)
where Surface is a surface site that H can adsorb onto. Trasatti63 summarizes that the rate
determining step (rds) for H2 evolution is Reaction (4-5) on “poorly active electrodes, for
instance, lead and mercury”, while other authors have suggested that this is also the rds on
Cu,171 Ni172 and Zn.65, 173 Due to a lack of agreement in the literature (which will be
discussed throughout the chapter) the rds of the entire self-discharge mechanism was
unknown at the time this research was initiated. Throughout this chapter, the results
obtained support the idea that, within the constraints of the present experiments, the rds
for the entire self-discharge mechanism is Reaction (4-5) on the current collector (as
opposed to on Zn). For this to be the case, the self-discharge rate should vary with the
activity of water, aH2O:
𝑟𝑎𝑡𝑒 = 𝑘 ∙ 𝑎𝐻2𝑂, (4-8)
where k is the rate constant, which increases with the surface area on which the reaction is
occurring.
The self-discharge rate of Zn in alkaline electrolyte has historically been measured
using the volume of H2 evolved132, 174-176 or using linear sweep voltammetry.145, 146, 165, 177-180
Alas, measuring the volume of H2 evolved is often done with Zn powder or pure pieces of Zn
metal, which neglects the conditions in a battery-like cell (like a coin cell), in which the
volume of electrolyte is small compared to the amount of Zn, a current collector is present,
and ZnO powder might be present.14, 132, 164 Furthermore, producing enough H2 to make
reliable measurements with simple equipment requires larger amounts of active material
than the amount typically used in coin cells and other ∼1 cm2 scale experimental cells, since
only about 1 µL H2(g) / (h×cm2) is produced by a self-discharge rate of 2.5 µA/cm2 (i.e. 0.400
119
mL gas/mAh);14, 132, 164, 175, 179 for comparison the reader will see later that the self-discharge
rates reported here are around 3 µA/cm2.
With regard to linear sweep voltammetry, it seems that most authors using this
technique since 2000 are not using it properly.145, 146, 165, 179, 180 To be specific, Baugh et al.
demonstrated that careful measurements of the Tafel slope of H2 evolution and Zn
dissolution could be used to calculate the Zn corrosion current (and determined it was 5.8
µA/cm2).178 However, authors like Lee et al., Kim et al. and Dobryszycki et al. use linear
potential sweeps but do not calculate Tafel slopes.145, 146, 165, 179 Instead, they simply claim
that since the additives they are testing alter the Tafel curve at currents far higher than the
actual self-discharge current (ex. Lee used currents up to 400 mA (no area reported), Kim
up to ∼5 mA/cm2 and Dobryszycki up to 2 mA/cm2) that those additives will be equally
effective at the corrosion potential where the current is orders of magnitude lower. What
all three of those papers demonstrate is that the shape of the current vs potential curves
does change with the addition of additives, which prevented the Tafel plot from being linear
and thus likely prevented the calculation of Tafel slopes. Therefore, linear sweep
voltammetry does not seem to be an appropriate method to determine the effectiveness of
corrosion inhibiting additives.
As such, a new method was developed to measure the self-discharge rate of any
electrode as a (coarse) function of time without the need to measure H2 volume. The
method is powerful in its simplicity, in that it directly measures how much capacity has
been lost as a function of the time that the electrode has been left to sit, and is described in
the Experimental Methods section, below. This method is also better than the linear sweep
voltammetry method since effects (like additives) that apparently de-linearize the Tafel
slope do not interfere with it.
120
Many factors have been reported to affect the Zn corrosion rate, including the
temperature, presence of ZnO, amount of Zn vs electrolyte, time, KOH concentration, active
surface area, current collector and additives.14 The effect of temperature was not explored
here, but has been by others; for instance Snyder et al. found that the gassing rate increased
by a factor of 4 – 7 when the temperature was increased from 25°C to 50°C.14, 132, 174, 175
Early on in this project it was discovered that keeping undissolved ZnO(s) powder in
the electrolyte reduced the self-discharge rate significantly, presumably because it keeps
the electrolyte saturated with Zn(OH)42−, and so this practice was adopted for all of the
experiments presented here. In a battery-like cell, it is common to have some ZnO exposed
to the electrolyte, even at “full” charge.15, 18, 44
The ratio of Zn to electrolyte was found to effect the self-discharge rate, with a
higher mass ratio of Zn to electrolyte yielding a slower rate; for instance Meesus et al. noted
a 3-fold decrease in H2 evolution in going from 5 g Zn / 100 mL electrolyte to 100 g Zn / 100
mL electrolyte.176 Consequently, battery-like cells should have lower self-discharge rates
than flooded cells since battery-like cells usually have only enough electrolyte to soak the
electrodes and separators.132 Unfortunately, the low CE of the Ni electrode developed in
Chapter 2 and the absence of a Mn-free air electrode prevented the experiments in this
chapter from being performed with coin cells. So instead, a flooded cell was used to
demonstrate the method and determine how the remaining five variables affected the self-
discharge rate in that apparatus. Those five variables will be discussed in Sections 4.4.1 to
4.4.5.
121
4.2 Experimental Methods
4.2.1 3-Electrode Cell Design
A simple 3-electrode flooded cell was used, wherein metal foils were dipped into an
electrolyte solution that sometimes contained additives, charged (Zn plated) and then left to
sit for a period of time. Subsequently, the cells were discharged and the remaining capacity
was recorded, thus determining how much capacity was lost to self-discharge or parasitic
reactions.
Figure 4-1: Experimental apparatus for the foil experiments. The container is a 125 mL Nalgene bottle. The rods are brass and are soldered to Ni plated alligator clips (some with teeth, others flat). Foils of
particular widths and heights are cut and partially covered in water resistant epoxy such that 1.00 ± 0.05 cm remained uncovered from epoxy to bottom edge.
122
Figure 4-1 shows the experimental apparatus designed for these experiments. The
container is a 100 mL Nalgene bottle, with three holes drilled in the lid that tightly allow
three brass rods to be pushed through. Nickel-plated alligator clips (some with teeth,
others without) were soldered to one end of the brass rods, while female banana connectors
were soldered to the other end to allow facile connection with the VMP3 potentiostat (Bio-
Logic). A lid with no air flow to the environment was used in order to avoid evaporation,
which would increase the electrolyte concentration. Experiments were performed with air
in the Nalgene bottle. A few experiments were performed with Ar gas instead, to determine
if the reduction of Zn by O2 contributed to the self-discharge rate, and no difference in rate
was found. Foils were used as electrodes since polishing soft metals like Sn and Pb is
difficult and since real current collectors are not polished. The mid-sections of the foils
were coated in Marine Epoxy (LePage) to prevent wicking of the electrolyte
(electroosmosis) and keep the electroactive surface area constant. Electrodes were dipped
into the electrolyte far enough to submerge the exposed foil bottom, but leave the upper
exposed foil top above the surface. 40 mL of electrolyte was used in all experiments. The
reference and counter electrodes were both Zn foil (0.27 mm thick, Alfa Aesar 99.98%) and
the counter electrode had a surface area 20% larger than the working electrode. Any
increase in the working electrode surface area through Zn dissolution and re-plating after
the first charge/discharge cycle was likely matched by an increase in the counter electrode
surface area. The working electrode foils were usually Cu (99.999%) or Sn (99.9%) from
Alfa Aesar.
The electrolyte was created by making a concentrated KOH solution (usually about
5 M) using 45 wt% KOH solution from Alfa Aesar and nanopure water (18 MΩ). An aliquot
of this solution was then titrated with potassium hydrogen phthalate to determine its exact
concentration using a Mettler DL-21 (auto-)titrator. The primary batch of KOH electrolyte
123
was then diluted to the desired concentration. ZnO powder (Anachemia, reagent grade)
was then dissolved into solution using heat and stirring. Extra ZnO powder was
intentionally left at the bottom of each solution bottle and experimental vessel to maintain
the ZnO saturation concentration. If this was not done, then self-discharge rates were
significantly higher than reported here. This mimics the situation in a cell where there
would be some small amount of uncharged ZnO left in the electrode.15, 18, 44 The working
electrode was about 5 – 10 mm from either the counter electrode or ZnO reservoir and
about 2 – 5 mm from the reference electrode.
4.2.2 Cycling Method
Figure 4-2 shows an example of the “charge-wait-discharge” cycling procedure
presented here. The working electrode was first charged by plating Zn onto it from solution
at 3 mA/cm2 for 10 min (green line) and then discharged at the same rate, which stripped
the Zn off again until the potential rose to 0.25 V vs Zn (blue line). Unlike that shown in
Figure 4-2, this was repeated about 10 times until the CE converged (see Figure 4-3). Then
the electrode was charged once more and left to sit in the electrolyte for increasing amounts
Figure 4-2: Demonstration of the typical OCV self-discharge experimental method. The foil is cycled a few times to prepare the surface, and then subjected to consecutively longer open circuit (OCV) steps
between charge and discharge. Each subsequent discharge measures how much active material was left after the open circuit voltage step. The reference and counter electrodes were both Zn foil while the
working electrode was Cu foil. The current was 3 mA/cm2 and the electrolyte was 3.2 M KOH, saturated
with ZnO.
tC tOCV tD
124
of time during successive cycles at its open circuit voltage (OCV) (red line). This “OCV time”
was usually 20, 40, 60, 80 and 100 min. Upon completion of the OCV step, the electrode was
discharged; the discharge capacity (or time) is the crucial variable in this experiment. The
usual electrolyte was 3.2 M KOH that had been saturated with ZnO powder, which
corresponded to a Zn(OH)42− concentration of about 0.2 M. In the experiments that follow,
this method was changed as noted.
Figure 4-3 shows an example of a typical CE vs OCV time plot. The first 10 cycles
(numbered in the figure) show the convergence of the CE to a value around 99.6% in this
case. Cycles 10 – 15 demonstrate the remarkably linear relationship between the amount of
time the electrode is left at open circuit in the electrolyte and the capacity lost to self-
discharge, suggesting that the self-discharge current is constant in time (beyond the 1 to 2
minutes it takes for the potential to stabilize at about 0 V vs Zn).
4.2.3 Calculation of the Self-Discharge and Parasitic Reaction Currents
Given that the self-discharge current (iSD) is constant in time, the following simple
model describes the results quite succinctly: Assume that the only reactions happening
during charging are Zn plating (Reaction (1-2) on page 6) and parasitic H2 evolution
Figure 4-3: Example data extracted from OCV self-discharge experiments. The numbers next to data points are cycle numbers. The preparatory cycles ensure the system is in a form of dynamic equilibrium
before starting the experiment. The fact that the experimental data points are linear means that the self-discharge rate is constant up to 100 min.
125
(Reaction (1-16) on page 19). Then assume that only self-discharge occurs during the OCV
step (Reactions (4-1) to (4-14) on page 117) and that only Zn stripping occurs during the
discharge step (Reaction (1-2) backward). The charge balance equation equating the
charge delivered to the electrode to the charge lost to discharge, self-discharge and parasitic
H2 evolution can then be written as follows and rearranged to isolate the CE:
𝑄𝐶 = 𝑄𝐷 + 𝑄𝑆𝐷 + 𝑄𝐻2
𝐼𝐶𝑡𝐶 = 𝐼𝐷𝑡𝐷 + 𝐼𝑆𝐷𝑡𝑂𝐶𝑉 + 𝐼𝐻2𝑡𝐶
𝐼 = 𝐼 ∙ 𝐶𝐸 + 𝐼𝑆𝐷 (𝑡𝑂𝐶𝑉
𝑡𝐶) + 𝐼𝐻2
𝐶𝐸 = −𝐼𝑆𝐷
𝐼(
𝑡𝑂𝐶𝑉
𝑡𝐶) + 1 −
𝐼𝐻2
𝐼
(4-9)
where IC = ID = I and thus tD
tC=
QD
QC= CE. Here, C = “Charge”, D = “Discharge”, SD = “Self-
Discharge”, OCV = “Open Circuit Voltage” and H2 = “H2 evolution”. Note that this model
treats H2 evolved as part of the Zn corrosion reaction separately from the H2 that is evolved
during charge, which is not accompanied by Zn dissolution. The capacity consumed by
parasitic H2 evolution that only occurs during charge is QH2, which can be expressed as the
product of an average current, iH2, and the time spent charging, tC. This model is linear and
so the slope of a linear fit to the data, as shown in Figure 4-3, yields the self-discharge
current (iSD), while the y-intercept yields the parasitic H2 evolution current (iH2). Software
designed in-house was used to analyze the data sets and produce error estimates based on
the linear fit (such as the values presented later in the caption of Figure 4-6). However, the
error arising from variations between the results of identical runs proved significantly
larger (at least 10x) than the errors generated by the linear fits. As such, the standard
deviations gathered by performing at least four copies of each experiment are reported
from here onward, instead.
126
It is important to note that a constant self-discharge rate makes the data analysis
convenient, but is not necessary. The slope between any two points on the QD or CE vs tOCV
plot yields the average self-discharge current for the period of time between those two data
points. So if the self-discharge current changed over time, the researcher would simply use
the slope between adjacent points (i.e. the derivative, dQD/dtOCV) to determine iSD as a
(coarse) function of time.
4.3 Electrolyte Wicking Along Conducting Surfaces
Early in this research effort, foils were lowered into the electrolyte without any sort
of epoxy coating. It was observed that as these experiments progressed over hours, the
electrolyte was drawn up along the foil surface until it reached the alligator clips. Once
there, it initiated unwanted parasitic reactions, which polluted the CE data being collected.
Figure 4-4: Demonstration of electrolyte wicking up conducting surfaces. This is a long Zn foil electrode that was dipped in 3.2 M KOH, saturated with ZnO and cycled.
127
Furthermore as the electrolyte climbed the foil, the active surface area increased, throwing
the legitimacy of the measured current density into question. An example of electrolyte
wicking is shown in Figure 4-4 for a longer than usual Zn foil electrode. The spacing
between the Zn ‘ridges’ is 2.3 ± 0.8 mm, and each ridge was created during one cycle, which
suggests that the electrolyte only moved up the foil during either plating or stripping.
The behaviour of this wicking phenomenon when the electrode is held at anodic
potentials was explored by Baugh et al. quite well.181, 182 Figure 4-5 shows a schematic of
the basic premise that ions are drawn into the film of electrolyte rising out of the solution,
dragging their hydration shells with them and thus “transferring their momentum to the
film”.181, 182 Today, this phenomenon is better known as electroosmosis instead of
wicking.183 Regardless, Baugh et al. demonstrated that the speed of the electrolyte
propagation up the foil is
𝜐𝑒𝑙𝑒𝑐𝑡𝑟𝑜𝑙𝑦𝑡𝑒 = 𝐾𝑖𝑓𝑖𝑙𝑚𝐸𝜅𝜇+
𝜂ℓ√𝑡 (4-10)
where ifilm (A
m2) is the current passing through the film, E (V) is the potential of the
electrode, κ (A
V∙m) is the specific conductivity of the electrolyte, μ+ (
m2
V∙s) is the ionic mobility
of the positive charge carrier (K+ in this case), η (kg
s∙m) is the electrolyte viscosity, ℓ (m) is
the length of the film (distance traveled up the electrode), t (s) is time and K (V2s
52
A) is a
constant. Although their theory was consistent with all of their results, Baugh et al. noted
that this model did not account for the negative ions, namely OH− or Cl−, that would be
flowing out of the film and thus transferring water molecules the other way.181, 182 Why this
opposing flow did not affect their results remains a mystery. In the case of plating Zn
during charge, both Zn(OH)42− and K+ rush into the film, while OH− rushes/hops out, as
shown in Figure 4-5. This progression of an electrolyte film continually increases the
128
electrochemical surface area of the sample, which frustrates attempts to measure current
densities with a constant, known area.
Electrolyte wicking is dependent on current flowing through the film though, which
means encasing all of the non-experimental surfaces of a sample in an insulator will prevent
it. Many aqueous electrochemistry researchers use various forms of epoxy to provide this
coating, although it is not clear which type of epoxy, if any, is best for this purpose. Through
trial and error, it was determined that hardware store Marine Epoxy (LePage) was passable
in the current application. Unfortunately, even epoxies recommended by another alkaline
researcher and curing the epoxy under a light vacuum were not sufficient to permanently or
consistently prevent the electrolyte from detaching the epoxy from the foil surface and
migrating up the narrow space between them.78 Many experiments were repeated until at
least four runs without epoxy-failure were obtained. Notably, few epoxy coatings would
survive experiments longer than 20 hours, which limited what experiments were possible,
such as preventing the determination of the linearity of self-discharge all the way to
completion.
Figure 4-5: Schematic of the mechanism of electrolyte wicking (electroosmosis). At t = 0, Zn plates up to point A, which pushes the film up higher, exposing more area to plate onto. At t > 0, Zn plates all the way
to point B (the edge of the film) and pushes the edge ever higher.
Elec
tro
de
A
Elec
tro
de
B
t = 0 t > 0
Film
129
4.4 Results and Discussion
4.4.1 Time Dependence of Self-Discharge
Conflicting opinions of the time dependence of self-discharge exist in the literature
with some researchers observing constant self-discharge rates,176 some researchers
reporting increasing self-discharge rates179 and others reporting decreasing self-discharge
rates.132, 175 Zhang claimed in his literature review that self-discharge rates generally
decreased with time until they reached a steady state,14 while Gregory et al. explained the
initial decrease as the time required to saturate the electrolyte with H2(aq) and coat the Zn
surface in ZnO or Zn(OH)2.175
To test whether the self-discharge rate remains constant with time throughout the
Figure 4-6: Example of self-discharge at long OCV times. This particular sample has 1 mM of CTAB additive in the 3.2 M KOH electrolyte. The solid fit is applied to only the first 6 data points of the self-
discharge cycles, not including the 7th
data point at 15 h. This fit yields a self-discharge rate of 3.68 ± 0.08 µA/cm
2. The dotted fit is applied to all 7 data points and yields a self-discharge rate of 3.897 ± 0.013
µA/cm2.
0 1 2 3 4 5 6 7 8 9 10 11 12 13 14 15
Open Circuit Voltage Time (h)
0.86
0.88
0.9
0.92
0.94
0.96
0.98
1
Co
ulo
mb
ic E
ffic
ien
cy (
QD
is/Q
Ch)
Preparatory Cycles
Self Discharge Cycles
Fit without 15 h data
Fit with 15 h data
130
self-discharge process in the experiments presented here, a few experiments were
performed with a 15 hour OCV time. One such experiment is shown in Figure 4-6, which
shows that the self-discharge rate is indeed constant with time, at least for the first 15 h.
The solid, grey line represents a fit to only the first 6 data points, excluding the 15 h data
point. This line produced effectively the same self-discharge rate as the dotted, red linear fit
that incorporated all 7 data points, including the 15 h data point, which signifies that the
rate did not change within the first 15 hours that the electrode was left at OCV.
Unfortunately, longer durations could not realistically be attained due to problems with
electrolyte wicking. Dobryszycki et al. observed an increase in the H2 evolution rate after 4
days had passed, but it is shown in Chapter 5 that the self-discharge rates measured in this
thesis are likely constant.179
Note that the electrolyte in these experiments was not bubbled with H2 prior to the
experiment to pre-saturate the solution with H2 gas, but this was not an issue since the OCV
periods did not begin until after the foils had spent 3 hours in the electrolyte. The amount
of charge required to evolve enough H2 gas to saturate the electrolyte was
𝑄𝐻2 = 𝑛𝐹𝑘𝐻𝑒𝑛𝑟𝑦° 𝑥𝐻2𝑃𝑉 = 8.4 × 10⁻⁷ 𝑚𝐴ℎ, (4-11)
which was vastly smaller than the 0.02 mAh that was lost to H2 evolution in just the first
preparatory cycle in Figure 4-6. As such, it seems unlikely that the concentration of H2 gas
in the electrolyte would speed up the self-discharge rate in the initial few days of the
experiment as suggested by Gregory et al..175 In Equation (4-11), n = 2mol e−
mol H2, F =
26,801 mAh
mol e−, kHenry° = 7.8 × 10⁻⁴mol H2(aq)
L∙Atm H2 is Henry’s constant for H2 in water,184
xH2 = 5.0 × 10⁻⁷ Atm H2Atm Air
is the mole fraction of H2 in air, P = 1 Atm Air and V = 40 mL of
electrolyte.
131
4.4.2 KOH Concentration
Again, conflicting opinions on the effect of KOH concentration, in the range 3 to 7 M,
on the self-discharge rate exist with some authors claiming the rate increases with KOH
concentration,175 some claiming it decreases,132 and some claiming it does not change.174
Zhang attempted to reconcile the differences in experimental technique between the three
examples given, but failed to find a unifying explanation.14
To determine if the self-discharge current is dependent on the concentration of KOH
in the electrolyte, within the experimental apparatus being used here, electrolytes of
increasing KOH concentration were created, saturated with ZnO and then tested with Cu
foil. Figure 4-7 shows the self-discharge current (iSD) and the H2 evolution current (iH2) as a
function of KOH concentration. Since all iSD and iH2 values were equal within experimental
error, neither was strongly dependent on the KOH concentration. A constant value for both
iSD and iH2 can be calculated from the weighted average of the relevant data points: iSD was
2.94 ± 0.18 µA/cm2 and iH2 was 10.8 ± 1.1 µA/cm2. This result agrees with the constant
trend observed by Ruetschi et al., although it should be noted that their result was obtained
at 60°C and so an absolute comparison of rates was not possible.174
However, if the rate is instead dependent on the activity of water, as suggested by
Equation (4-14) (pg. 132) and which does vary with the KOH concentration, as shown by
Bro et al.,185 then both iSD and iH2 should decrease slightly with KOH concentration as the
average values in Figure 4-7 suggest. An interpolation of Bro et al.’s three data points from
3.08 M to 7.75 M KOH at 25°C yields a line:185
𝑎𝐻2𝑂 = −0.06571
𝑀 𝐾𝑂𝐻∙ [𝐾𝑂𝐻] + 1.0736. (4-12)
When combined with Equation (4-8) (pg. 118), expressions for iSD and iH2 can be derived:
𝑖𝑆𝐷 = 𝑛𝐹 ∙ 𝑅𝑎𝑡𝑒𝑆𝐷 = −0.06571
𝑀 𝐾𝑂𝐻∙ 𝑛𝐹𝑘𝑆𝐷[𝐾𝑂𝐻] + 1.0736𝑛𝐹𝑘𝑆𝐷 , and (4-13)
132
𝑖𝐻2 = 𝑛𝐹 ∙ 𝑅𝑎𝑡𝑒𝐻2 = −0.06571
𝑀 𝐾𝑂𝐻∙ 𝑛𝐹𝑘𝐻2[𝐾𝑂𝐻] + 1.0736𝑛𝐹𝑘𝐻2. (4-14)
Here, n = 1, F is Faraday’s constant and both kSD and kH2 were determined by fitting
Equations (4-13) and (4-14) to the data in Figure 4-7 using a least squates linear fit. The
actual values of kSD and kH2 are not important since the surface area is unknown, but for the
purposes of the fit kSD = 3.91×10⁻¹¹ mol·cm-2·s-1 and kH2 = 1.72×10⁻¹⁰ mol·cm-2·s-1. The blue
(long dashed) lines in Figure 4-7 represent the model described by Equations (4-13) and
(4-14) and fit the data quite well. These slight decreases in current are within experimental
error of Snyder et al.’s iSD dependence on KOH, which decreased by 25% in going from 3 to 7
M KOH.132 However, the results of this section are notably different from Gregory et al.,
Figure 4-7: Self-discharge and hydrogen evolution rates in increasing concentrations of KOH. Both iSD and iH2 seemed either independent of the KOH concentration within experimental error (weighted averages of
2) or dependent on the activity of water (aH2O). The
linear dependence on aH2O (blue, long dashed lines) was interpolated from Bro et al.’s data, which yielded iSD = -0.248 µA·cm
-2·M
-1 * [KOH] + 4.054 µA/cm
2 and iH2 = -1.088 µA·cm
-2·M
-1 * [KOH] + 17.778 µA/cm
2.185
3 4 5 6 7
KOH Concentration (mol/L)
5
10
15
20
H2 E
vo
lutio
n C
urr
en
t,
i H2 (
A/c
m2)
IH2
Weighted Average
1 Standard Deviation
Rate aH2O
0
1
2
3
4
5
Se
lf D
isch
arg
e C
urr
en
t,
i SD (
A/c
m2)
ISD
Weighted Average
1 Standard Deviation
Rate aH2O
133
whose iSD tripled in the KOH range from 3 to 7 M, suggesting a different rate determining
step was in control in their work.175
The fact that the self-discharge rate did not increase with KOH concentration
suggests that the rate determining step (rds) does not include the OH− ion as a reactant,
which elminates all 4 of the mechanistic steps for Zn dissolution proposed by Bockris et al.29
(Reactions (1-3) to (1-6) backward, pg. 6). Instead, iSD either stayed constant or decreased
slightly. A constant iSD suggests that the rds could be the diffusion of Zn(OH)42− away from
the Zn surface (Reaction (4-3), pg. 117), which has been suggested by Muralidharan et al.,
but they did not use a current collector as would be the case in a rechargeable Zn
electrode.177 Alternatively, a slight decrease in iSD with the concentration of KOH suggests
the slow step of H2 evolution (Reaction (4-5), pg. 118) is the rds for the entire self-discharge
process.
4.4.3 Foil (Current Collector) Material
The material that the current collector is made of was noted by Gregory et al. to
affect the self-discharge rate.175 Chu, McBreen and Adzic also noted that the substrate
determines the morphology of Zn deposits, which determines the surface area of the
deposits and how much substrate is left exposed to the electrolyte.156, 157 If the self-
discharge rate is limited by Zn(OH)42− diffusion, then the substrate should have no effect on
the self-discharge rate.
Foils of various materials that are commonly used in Zn electrodes were tested.
Copper (Cu),121, 128, 130, 146, 153 tin (Sn),113, 122 nickel (Ni)124, 126, 127, 131 and lead (Pb)68, 118 have all
been used as current collectors or coatings on current collectors. Indium (In) is commonly
used as an additive in non-rechargeable battery Zn active material to reduce H2 evolution
rates (along with bismuth (Bi)).186 Several authors have also used graphite as a conductive
134
additive in rechargeable Zn electrodes so graphite foil was tested here as an
approximation.123, 128, 187 The metal foils were acquired from ESPI Metals and had the
following purities: Cu (99.9%), In (99.9%), Sn (99.999%), Pb (99.9%) and Ni (99.9%).
Graphite foil (graphoil) was acquired from Graphtek.
Figure 4-8 and Figure 4-9 show the self-discharge current (iSD) and the H2 evolution
current (iH2) as a function of foil material. Clearly, the Ni and graphite foils have high self-
discharge and H2 evolution rates. The H2 evolution rate on Ni was so high, in fact, that no
amount of Zn plated at a charging current of 3 mA/cm2. At 10 mA/cm2, Zn plating occurred
faster than H2 evolution and so some Zn was plated, which subsequently reduced the H2
evolution rate on that patch of current collector as shown in Figure 4-9. The fact that the
current collector has a strong effect on the self-discharge current proves that the diffusion
of Zn(OH)42− away from the Zn surface (Reaction (4-3), pg. 117) is not the rate determining
Figure 4-8: Self-discharge and hydrogen evolution rates on various current collector materials. Plating and stripping rates were 3 mA/cm
2 for 10 min. OCV times increased in 20 min increments up to 100 min.
The electrolyte was 3.2 M KOH, saturated with ZnO. The H2 evolution rate on Ni exceeds the maximum y-axis value and is actually 3 mA/cm
2, which is the charging current. Hence, Ni has no self-discharge current
since no Zn was plated onto it.
Cu In Sn Pb Ni0
4
8
12
16
20
24
28
32
36
40
44
48
H2 E
vo
lutio
n C
urr
en
t (
A/c
m2)
0
2
4
6
8
10
12
14
Se
lf D
isch
arg
e C
urr
en
t (
A/c
m2)
ISD (Left Y-axis)
IH2 (Right Y-axis)
135
step since the current collector should not effect the diffusion rate.
An explanation for the currents seen in Figure 4-8 and Figure 4-9 can be
qualitatively provided using Figure 4-10, which shows the surfaces of these materials after
Zn has been plated on them. In, Sn and Cu exhibit small crystallite growth, with Zn covering
the majority of the surface area. Bi, Pb and C (graphite) induce larger crystallite growth that
leaves much of the surface exposed to electrolyte.156, 157 Ni has no Zn on it. If the self-
discharge rate is controlled by the surface area of non-Zn metals that are electrically
connected to the Zn active material and exposed to the electrolyte, in addition to the
overpotential for H2 evolution on that metal, then this could explain the results observed
here. The larger area of exposed surface on Pb could have led to a higher H2 evolution and
self-discharge current than the more uniformly coated Cu, even though Cu might have a
lower overpotential for H2 evolution. This would signify that the exposed surface area of
the current collector is about as important as the overpotential for H2 evolution when
Figure 4-9: Self-discharge and H2 evolution rates of Ni and graphite current collectors. The plating and stripping current for graphite was the usual 3 mA/cm
2 for 10 min while the current for Ni was 10 mA/cm
2
for 3 min to plate some Zn despite the H2 evolution reaction consuming most of the current. The electrolyte was 3.2 M KOH, saturated with ZnO.
Nickel (10 mA) Graphite (3 mA)0
100
200
300
400
500
600
700
800
900
H2 E
vo
lutio
n C
urr
en
t (
A/c
m2)
0
100
200
300
400
500
600
700
800
900
Se
lf D
isch
arg
e C
urr
en
t (
A/c
m2)
ISD (Left y-axis)
IH2 (Right y-axis)
136
selecting a current collector material for Zn. The iSD values of Cu (2.9 ± 0.2 µA/cm2), In (3.1
± 1.0 µA/cm2) and Sn (3.9 ± 0.8 µA/cm2) were equal within experimental error, and so it
was concluded that any of these three materials was suitable for further self-discharge
experiments and current collectors in general.
It was hoped that these experiments would help explain the discrepancy between
the cycle lifetimes of coin cells with Cu vs Sn current collectors, as shown in Figure 2-18 (pg.
85). The only notable difference between Cu and Sn current collectors here is the H2
evolution rate, which was 16 ± 7 μA/cm2 for Cu and 9.7 ± 0.8 μA/cm2 for Sn. Although they
are technically equal within experimental error, a lower H2 evolution rate on Sn would
favour Sn as a current collector material in a situation where the entire current collector is
not covered in and protected by Zn. These foil experiments result in complete
(macroscopic) coverage of the current collector, but the same is not true in coin cells. The
Zn in coin cells tends to plate directly across from the Ni electrode, which would leave parts
of the Zn current collector exposed to the electrolyte. Because of this, a Cu current collector
in a coin cell would provide better local cathodic sites for H2 evolution than Sn and thereby
increase the self-discharge current and reduce the coulombic efficiency in comparison to Sn.
Figure 4-10: SEM pictures of Zn deposits on various current collector materials. The scale is the same in all of the pictures, except for Ni which has a scale 10x larger. Ni has no Zn on it.
In
NiCuBi
SnPb
20mC
137
When the entire coin cell canister was coated in Sn, and the current collector was also Sn,
then the coin cell did not suffer from as high a self-discharge current since Sn has a lower H2
evolution rate than Cu.
Mechanistically, the fact that different substrates change the self-discharge rate
signifies that H2 evolution on either the Zn deposit or the substrate itself is the rate
determining step, and not the diffusion of Zn(OH)42−. This suggests that the rds for the self-
discharge process is water giving up a proton at a surface site as part of H2 evolution
(Reaction (4-5), pg. 118). Furthermore, the results of this section suggest that the H2 is
created on the current collector since changing the current collector to Ni, for example, had
such a dramatic impact, but changing the Zn morphology by using Cu instead of Sn did not
affect the self-discharge current. Nevertheless, it would be reassuring to confirm that
changing the surface area of Zn on the same current collector does not affect the self-
discharge rate.
Gregory et al. and Snyder et al. also noted that changing the current collector (in
their case by amalgamating copper grids with mercury) did reduce the self-discharge rate,
but they did not identify the current collector as the determining factor for the self-
discharge rate.132, 175 Their studies were done with mercury additions to the electrode
material, which coated their Zn and current collectors in-situ and reduced the self-discharge
rate since mercury has an even lower H2 evolution rate than Zn. Overall, to the author’s
knowledge no study to date has identified the current collector as the rate determining
factor for self-discharge of rechargeable Zn electrodes.
4.4.4 Electroplating (Charging) Current
The morphology of Zn deposits has been proven to vary with plating current
density75, 76 and so plating Zn at different current densities will change the surface area of
138
the Zn deposit.75 If H2 evolution is occurring on the Zn deposit itself, then performing the
self-discharge experiment on higher surface area Zn deposits should yield a higher self-
discharge rate.
Consecutive Sn foils were charged at different currents, but with a constant capacity
density (i.e. Zn was plated for different times so that all deposits had 0.5 mAh/cm2 of plated
Zn) in case the thickness of the deposit affected the self-discharge rate. Figure 4-11 shows
the self-discharge current (iSD, panel A) and the H2 evolution current (iH2, panel B) as a
function of charging current. The 15 mA/cm2 charging current experiment is shown for
completeness; however, plating at this current was subject to diffusion control. As such, the
15 mA/cm2 data point was ignored while drawing conclusions about this data since the
exposed surface area of the current collector might have changed in this situation. Since all
other iSD values were equal within experimental error, it was determined that iSD was
independent of the plating current. For Sn foil, charged in 3.2 M KOH for 10 min at 3
mA/cm2 (or to 0.5 mAh/cm2), the iSD was 3.6 ± 0.5 µA/cm2.
Since iSD did not depend on the plating rate, this suggests that the rds, Reaction (4-5)
(pg. 118), does not occur on Zn; however, scanning electron microscopy did not reveal an
obvious difference in surface area between the samples (up to 12 mA/cm2), and so this
conclusion is weak. Since the authors that described the deposit morphologies used generic
“low” and “high” current density descriptors and a gel electrolyte, it is difficult to know
which deposit would have been expected in the current experiment.75, 76 If nothing else,
demonstrating that the self-discharge current does not depend on plating rate below the
diffusion control region and that the diffusion control region exists around 15 mA/cm2 was
comforting. As such, all other experiments in this chapter were performed at 3 mA/cm2 to
stay as far from the diffusion control region as possible without making the experiment too
lengthy (to avoid electrolyte wicking problems).
139
Figure 4-11B shows that the parasitic H2 evolution current increases logarithmically
with the plating current, which is generally expected from the Butler-Volmer Equation
(1-14) on page 17. Figure 4-11C shows a plot of ηH2 vs log(iH2), which should only reflect
Figure 4-11: Self-discharge and hydrogen evolution rates with increasing plating current densities. Ignoring the 15 mA/cm
2 data point, iSD seems independent of plating current within experimental error
and has a weighted average of 3.6 ± 0.5 µA/cm2. Panel C shows the Tafel line for the H2 evolution rates.
The fit had a Tafel slope of 18.1 mV, which is unlikely to be real due to the variation in plating conditions and uncertainty in the assumed value of EEq,H2 (410 mV vs Zn in 3.2 M KOH).
0 0.5 1 1.5 2 2.5 3
log( iH2 )
-470
-460
-450
-440
-430
-420
H2 E
vo
lutio
n O
ve
rpo
ten
tia
l,
H
2 (
mV
)
Data
Linear Fit
0 2 4 6 8 10 12 14 16
Plating Current, iTotal (mA/cm2)
1
10
100
1000
H2 E
vo
lutio
n C
urr
en
t,
I H2 (
A/c
m2)
IH2
2
4
6
8S
elf D
isch
arg
e C
urr
en
t,
I SD (
A/c
m2)
ISD
Weighted Average
1 Standard Deviation
A
B
CTafel slope = 18.1 7.4 mV
140
the second term of Equation (1-14), since the first term will be negligibly small at ηH2 = -420
mV. A line was fit to the data and the Tafel slope was calculated to be 18.1 ± 7.4 mV.
According to Trasatti, the Tafel slope for H2 evolution with Reaction (4-5) (pg. 118) as the
rds should be 120 mV.63 Cosidering the vertical error bars, the maximum value of the
measured Tafel slope is lower than the lowest possible Tafel slope put forward by Trasatti63
(30 mV) for the case when Reaction (4-7) is the rds, which makes the measured value
determined here unlikely to be true. An inaccurate Tafel slope measurement is not entirely
surprising for these experiments, since the surface area evolving H2 during the Zn plating
process changes significantly, and not necessarily identically at different plating rates.
Although, note that the constant iSD as the plating current changed does suggest that the Zn-
coated surface area reached approximately the same value after plating had finished.
4.4.5 Effect of Electrolyte Additives
Historically, mercury (Hg) was used as the self-discharge suppressant of choice,14,
132, 174, 175 but environmental and safety concerns resulted in the banning of Hg in
batteries.186 Since then, many researchers have sought out other additives to take the place
of Hg and today indium (In) and bismuth (Bi) are alloyed with Zn in non-rechargeable cells
in place of Hg.186 Additives that are added to the electrode slurry (mixture) are referred to
as “electrode additives”, while dissolved additives added to the electrolyte are referred to as
“electrolyte additives”. In recent years the pursuit of electrolyte additives to reduce self-
discharge rates,145, 146, 164, 165, 179, 180 dendrite growth162 or shape change20 has progressed
with several additives being claimed to be quite effective. However, the effects of these
additives have not been compared to one another. This section compares the effect on self-
discharge rate, if any, of several additives featured in the literature. Since the rate
determining step of self-discharge with this apparatus appears to be Reaction (4-5) (pg.
141
118), any additive that occupies a surface site on the current collector or an impurity in the
Zn, and does not yield it to the formation of Had could reduce the self-discharge rate.
Additionally, any additive that improves the Zn coverage of the current collector would
reduce the self-discharge rate.
In order to compare the effectiveness of these additives, electrolytes with the
additives presented by other authors, at the ideal concentrations suggested by those
authors, were created and tested.20, 145, 162, 164, 165, 179 Testing was done with the most typical
methodology: Cu foil was cycled at 3 mA/cm2 for 10 min in 3.2 M KOH, saturated with ZnO
(about 0.2 M) and left to sit at OCV for 20, 40, 60, 80 and 100 min. At least four successful
runs of each additive were completed and the results from the linear fits were averaged.
The additives used were PEG 400, PEG DiAcid 600 and L-Tartaric Acid (99%) from Aldrich,
Figure 4-12: Self-discharge current in the presence of electrolyte additives. The plating and stripping current was 3 mA/cm
2 for 10 min in 3.2 M KOH, saturated with ZnO, onto Cu foil.
No
ne (
Feb
)
Zn
Fo
rmate
(0.1
M)
PE
G D
iacid
(800 p
pm
)
Tri
ton
X-1
00 (
0.3
mM
)
Ph
osp
ho
ric A
cid
(40
00 p
pm
)
CT
AB
(1 m
M)
SD
S (
10 m
M)
PE
G 4
00 (
1 w
t.%
)
Cit
ric A
cid
(4000 p
pm
)
Su
ccin
ic A
cid
(4000 p
pm
)
No
ne (
Ap
ril)
KF
(6.6
M)
K2C
O3 (
1.8
M)
KF
(3.3
M)
Tart
ari
c A
cid
(4000 p
pm
)
KF
(1.8
M)
an
d K
2C
O3 (
1.8
M)0
2
4
6
8
10
Se
lf D
isch
arg
e C
urr
en
t (
A/c
m2)
142
Succinic Acid (99.0+%), Citric Acid (99.5+%) and KF (99+%) from Sigma-Aldrich,
Hexadecyltrimethylammonium bromide (CTAB, 98+%) from Sigma, Phosphoric Acid (35%
HPO3, 60% NaPO3) and sodium dodecyl sulfate (SDS, 99+%) from Fisher, zinc formate
(98%) from Alfa Aesar, and Triton X-100 (reagent grade) from Amresco.
The results are presented in Figure 4-12. Evidently, the absence of any additives
yielded the lowest self-discharge rate (None(Feb)) but an unsettling variation was noticed
between the same experiment in February and in April (None(April)) that might have been
due to an increase in the lab temperature since these experiments were performed without
temperature control. Regardless, the two experiments are equal within experimental error,
and are also equal to all of the other additive experiments with the exception of the KF &
K2CO3 experiment and the possible exception of the Tartaric Acid experiment. Both of these
experiments had a higher self-discharge current than if the additive had been absent, which
suggests that they either increased the rate of Reaction (4-5) (pg. 118) or increased the
surface area of exposed current collector.
Figure 4-13 shows Scanning Electron Microscopy (SEM) pictures of a few Zn
deposits for demonstration purposes. Panel A shows a Sn foil that has been plated with Zn
when no additive is present. Panel B shows a Zn deposit with 1 wt% PEG 400 electrolyte
additive, which looks to have a higher surface area than the deposit without any additives.
However, the PEG 400 additive did not result in an increase in the self-discharge rate, which
supports the idea that the rate determining H2 evolution step (Reaction (4-5) on page 118)
does not occur on Zn. Panel C shows a Zn deposit with 3.3 M KF as an additive, which shows
a more uniform deposit than the sample without any additive, but otherwise looks similar.
Panel D shows a Zn deposit with 1.8 M KF & 1.8 M K2CO3 additives, which looks like it might
even have holes in the deposit surrounding tiny grains. If those features are holes, then
143
more electrolyte gained access to the current collector below the deposit. Considering the
statistically higher self-discharge rate of this sample (Figure 4-12)
Figure 4-13: Scanning Electron Microscopy (SEM) pictures of Zn deposits on Sn foil from electrolytes with different additives. Zn plating was at a rate of 3 mA/cm
2 for 10 min (i.e. 0.5 mAh/cm
2). The electrolyte
was 3.2 M KOH, saturated with ZnO, and contained various additives as labeled above.
D – 1.8 M K2CO3, 1.8 M KF
20 μm
C – 3.3 M KF
B – 1 wt% PEG 400A – NONE
144
than any other sample, this holey theory is compatible with the idea that the rate
determining H2 evolution step occurs on the current collector.
Figure 4-14 shows the parasitic H2 evolution rates, which were similarly identical
for most additives. The only additive that fared statistically better than None (April) was KF
(3.3 M), although an increase in concentration seemed to negate the benefit. This is likely
because 3.3 M KF acts as a simple supporting electrolyte and increases the conductivity of
the electrolyte, whereas 6.6 M KF is such a high concentration that the electrolyte
conductivity decreases again. This concept was supported by the fact that the overpotential
to plate Zn in the 6.6 M KF electrolyte was about 5.5 mV higher than it was in 3.3 M KF
electrolyte. According to the Tafel slope of 18.1 mV, derived in Section 4.4.4, this should
result in an increase in the parasitic H2 evolution current from 7 μA/cm2 for 3.3 M KF to 14
Figure 4-14: Parasitic H2 evolution current in the presence of electrolyte additives. The plating and stripping currents were 3 mA/cm
2 for 10 min in 3.2 M KOH, saturated with ZnO, onto Cu foil.
KF
(3.3
M)
KF
(6.6
M)
Su
ccin
ic A
cid
(4000 p
pm
)
No
ne (
Ap
ril)
CT
AB
(1 m
M)
Cit
ric A
cid
(4
000 p
pm
)
No
ne (
Feb
)
PE
G D
iacid
(800 p
pm
)
H3P
O4 (
4000 p
pm
)
Tart
ari
c A
cid
(4
000 p
pm
)
Zn
Fo
rmate
(0.1
M)
SD
S (
10 m
M)
Tri
ton
X-1
00 (
0.3
mM
)
PE
G 4
00 (
1 w
t.%
)
K2C
O3 (
1.8
M)
KF
(1.8
M)
an
d K
2C
O3 (
1.8
M)0
20
40
60
80
100
H2 E
vo
lutio
n C
urr
en
t (
A/c
m2)
145
μA/cm2 for 6.6 M KF, which matches the data within experimental error. This result
suggests that the reason 3.3 M KF produces statistically less parasitic H2 during charge is
due to its increased electrolyte conductivity compared to the other additives, which are not
concentrated enough to significantly enhance conductivity. The exception being the
samples with K2CO3.
Conversely, the additives that appeared to increase the parasitic current were PEG
400, K2CO3 and the combination of K2CO3 & KF. As was mentioned above, K2CO3 seems to
promote larger holes in the Zn deposit, which would increase the surface area on which H2
evolution occurs during charge. Zn plating in the 1.8 M K2CO3 & 1.8 M KF solution occurred
at an overpotential about 10.8 mV higher than in the 3.3 M KF electrolyte, which would
suggest an iH2 of 28 μA/cm2 in the 1.8 M K2CO3 & 1.8 M KF electrolyte based on the
measured value of 7 ± 4 μA/cm2 in the 3.3 M KF electrolyte. Since the theoretical 28 μA/cm2
is significantly lower than the measured value of 92 ± 8 μA/cm2, the increase in parasitic H2
evolution in baths containing K2CO3 cannot be solely due to the increase in Zn plating
overpotential, but could be explained by a combination of an increased Zn plating
overpotential and a holey deposit. Adler et al. studied the effects of adding KF, K2CO3 and
LiOH to KOH electrolyte in Ni-Zn cells.92 They determined that both [3.2 M KOH, 1.8 M KF,
1.8 M K2CO3] and [3.5 M KOH, 3.3 M KF] electrolyte formulations were excellent at
extending the cycle life of Ni-Zn cells by staving off shape change and generally reducing the
capacity-loss per cycle. These formulations are thus important for rechargeable Ni-Zn cells
and so it is interesting to observe that the KF & K2CO3 formulation behaved so poorly here
as it was the favoured formulation in the paper by Adler et al..20 One possible explanation
for the extension in cycle life would be that this formulation reduces the CE of the Zn
electrode to be more in line with the Ni electrode CE, which would lead to less overcharging
of the Zn electrode over many cycles. In effect, reducing the amount of Zn that is left
146
undischarged each cycle increases the number of cycles required to completely fill the
available Zn capacity.
At first glance, it may seem surprising that none of the additives seemed to improve
the self-discharge rate of the Zn electrode, considering that the papers from the literature
that these additives and concentrations were taken from suggested that they do just that.20,
145, 162, 164, 165, 179 However, a closer inspection of the experimental methods of these papers
reveal several reasons why the results presented in this chapter have come about.
Lee et al., who suggested Phosphoric, Succinic, Tartaric and Citric acids, used linear
potential sweeps, reaching currents as high as 400 mA at potentials as low as -4.2 V vs
Hg/HgO, to claim that these acids reduce self-discharge.145 Without any data at the actual
potential (about -1.4 V) and currents (about 3 µA/cm2) where Zn corrosion occurs, nor any
direct measurement of capacity lost or H2 evolved, their results are questionable. Kim et al.,
who suggested Zn Formate, also used high current density linear potential sweeps and cited
the differences between the curves at high currents as their reasoning for believing their
additives decrease self-discharge rates.165 Finally, Dobryszycki et al., who tested PEG 400,
also used a linear potential sweep method and compared the changes in the curves at
currents around 1 mA to make claims about the benefits of PEG 400.179 Since none of these
studies attempted to prove that their Tafel slopes extended to the corrosion potential or
current, their conclusions are questionable. The experimental results of this section suggest
that Phosphoric, Succinic, Tartaric and Citric acids, as well as Zn Formate and PEG 400 are
not effective electrolyte additives within the parameters of this experimental method.
Cohen-Hyams et al., who recommend PEG DiAcid 600, used a commercially made
prismatic cell and a comparatively small amount of gel electrolyte.164 They then heated the
cell to 50°C in a sealed, stiff container and measured the volume of H2 produced over 10
hours. Since they used a gel electrolyte, which slows diffusion rates, a larger active material
147
to electrolyte ratio and an increased temperature, it is not surprising that they came to a
different conclusion. However, they also did not use a control, making a comparison
between PEG DiAcid and the absence of it impossible. Regardless, PEG DiAcid 600 did not
reduce the self-discharge rate within the parameters of the experimental method presented
here.
Gomes et al., who tested SDS, CTAB and Triton X-100, did not measure Zn corrosion
at all.162 They were more interested in the surface morphology of Zn plated with these
different additives. These additives were tested here to see if they adjusted the coverage of
the current collector (by Zn), which would bring about a change in the self-discharge rate.
Evidently, the Zn coverage did not change significantly with any of these additives since the
self-discharge rate did not change. Also, note that the addition of SDS, CTAB or Triton X-
100, which were observed by Gomes et al. to change the Zn morphology,162 did not change
the self-discharge rate, similarly to PEG 400. This further confirms that the rate limiting H2
evolution does not occur on the Zn deposit.
4.5 Foil Experiment Conclusions
The results of this chapter demonstrate that the self-discharge rate is controlled by
the overpotential for H2 evolution of the current collector material and the surface area of
current collector that remains exposed to the electrolyte after Zn plating. Figure 4-15
shows a schematic of this mechanism, which is essentially the galvanic corrosion of Zn.
Galvanic corrosion has not been formally recognized in the literature as the rate
determining mechanism in the self-discharge of rechargeable Zn electrodes and has major
ramifications for researchers who have been using Ni foam124, 126, 127, 131 or even silver135, 175
as a current collector, or graphite123, 128, 187 as a conductive additive. Recall that Cu was
shown to be a poor current collector material in Chapter 2, and should also be avoided. In
148
the coin cells, more current collector surface area was left exposed than in the foil
experiments of this chapter, which could explain the difference between the results in
Figure 2-18C (pg. 85) and Figure 4-8 (pg. 134). Indium (In) would be a good current
collector material, but it is rare and expensive (~700 US$/kg In vs 24 US$/kg Sn).
Researchers should instead use Sn electroplated current collectors. An ideal Zn electrode
current collector might well be Sn electroplated Cu foam. Commercial battery
manufacturers might already be aware of this since at least one rechargeable Ni-Zn
manufacturer (PowerGenix) uses a Sn-coated Cu expanded mesh as the Zn electrode
current collector.113 This also helps explain how non-rechargeable alkaline batteries can
have a shelf-life of 8 years. The current collector in “alkaline batteries” is a low surface area
nail in the center of the cell or coin cell cap surface that has been electroplated with Sn, In,
Bi and/or Zn (with proprietary techniques that produce a hole-free coating).188, 189 Overall,
self-discharge rates are kept low in alkaline batteries by using Zn alloyed with indium
and/or bismuth, keeping the current collector surface area small (compared to a
rechargeable cell) and using a gel electrolyte, which slows diffusion and further reduces the
activity of water.82, 188, 189
Figure 4-15: Schematic of the proposed mechanism for self-discharge in rechargeable Zn electrodes. The mechanism is the galvanic corrosion of Zn. The self-discharge rate is controlled by the rate of H2
production on the current collector.
Current Collector
Zn Zn Zn Zn
149
Section 4.4.5 demonstrated that many additives, such as Phosphoric, Succinic,
Tartaric and Citric acids, as well as Zn Formate, PEG 400 and PEG DiAcid 600 are not
effective as self-discharge inhibitors when using a rechargeable Zn electrode with a current
collector, contrary to the claims of several authors.145, 146, 164, 165, 179, 180 Recently,
rechargeable Zn electrodes made entirely of Zn (i.e. Zn plated onto a Zn foam current
collector) have been proposed, and these additives might behave differently in that case;190,
191 however, a current collector made of Zn runs the risk of dissolving every cycle and
therefore might be a foolish idea for long cycle life cells. A few Zn plating additives
including SDS, CTAB and Triton X-100 were also shown to have no significant effect on self-
discharge rates. Finally, K2CO3, which is an electrolyte additive intended to extend cycle
life,20 was shown to accelerate self-discharge.
The “charge-wait-discharge” method of measuring the self-discharge rate of
rechargeable electrodes demonstrated in this chapter is also new and should make
measurements of the self-discharge rate easier in that a battery researcher does not have to
come up with a means of collecting and measuring H2 gas evolution. In particular, this
method should work quite well on rechargeable Zn-air cells where the CE of the positive
electrode will not limit the discharge capacity of the Zn electrode and the Zn electrode will
be exposed to the conditions of a battery-like cell instead of the more usual H2 evolution
experiment where some form of Zn is placed in a vial full of electrolyte.174, 175, 179
Additionally, the charge-wait-discharge method can produce time dependent rates of self-
discharge by taking the derivative of the resulting QD vs tOCV data, if applicable.
The primary lingering concern with the experiments presented here was the
inability to measure self-discharge rates over long periods of time (i.e. > 15 hours) due to
electrolyte wicking and the failure of the marine epoxy to prevent it. As was mentioned in
Section 4.4.1, researchers have observed different trends in the self-discharge rate with
150
respect to time.175, 176, 179 The cause of these varied results has not been elucidated;14 but
clearly, further experiments with the charge-wait-discharge method in an apparatus that is
not at risk of breaking down and that last at least 10 days175 should be performed to
determine if self-discharge rates remain constant or increase with time. This was the goal
of Chapter 5.
151
Chapter 5: Self-Discharge Experiments Using Coin Cells
5.1 Motivation
As was discussed in Section 4.4.1 (pg. 129), controversy exists in the literature
about the time dependence of the self-discharge rate (iSD) of Zn electrodes.14, 132, 174-176, 179 In
Chapter 4, self-discharge rates appeared to be constant with time, and this fact was
exploited in the data analysis by fitting a line to the discharge capacity (or CE) vs OCV time
data. However, those experiments only probed the first 2 hours of OCV time (a.k.a. self-
discharge time) due to problems with electrolyte wicking. Additionally, those experiments
were conducted in flooded cells, without separators or stack pressure, and without ZnO
necessarily building up on the current collector (due to gravity since the foils were vertical).
The rate determining step determined in Chapter 4 suggests that these factors should not
affect the self-discharge rate, but it was prudent to confirm that. Along those lines, the
experiments in this chapter establish three things about Zn electrodes: (1) They suggest
that the iSD of Zn in a coin cell is the same as that measured in a flooded cell. (2) They also
suggest that the iSD of Zn in a coin cell is constant in time, just like the flooded cells of
Chapter 4. (3) They demonstrate that additives can behave differently in a battery-like cell
than in a flooded cell.
The coin cells developed in Chapter 2 can be charged and left to sit for days without
worrying about electrolyte wicking issues, and they are a battery-like system with
separators, stack pressure, small amounts of electrolyte, current collectors and ZnO that
builds up directly on the current collector. A ‘storage system’ already existed in-house that
was designed to monitor the shelf-life of a cell by measuring the potential over time.
Monitoring the potential of the cell revealed the self-discharge rate of the Ni electrode, the
potential of which is dependent on the state of charge, but the state of charge of the Zn
152
electrode did not bring about a change in potential until it had finished discharging, due to
its flat potential curve at slow discharge rates. As such, the storage system could be used to
measure the length of time until all of the Zn had dissolved off of the current collector and to
determine the self-discharge rate of the Ni electrode. The ability to measure the length of
time until the Zn electrode finished discharging was enough to determine the average self-
discharge current by dividing the capacity stored by the Zn electrode (mAh) by the time to
complete self-discharge (h). However, this technique did not work when the Ni electrode
finished self-discharging first and so the first challenge was to measure the self-discharge
rate of the Ni electrode.
5.2 Self-Discharge of Ni Electrodes in Coin Cells and Commercial Ni-Zn Cells
To measure the self-discharge rate of the Ni electrode and compare this rate to that
of a commercial Ni electrode for the sake of interest, a coin cell and a commercial cell were
charged and then their potentials were monitored over time as they self-discharged, as
shown in Figure 5-1. The ‘storage system’ used to monitor the cells was a Keithley 2750
potentiometer, programmed to only connect to the cell once per hour to record the cell
Figure 5-1: Self discharge of a Ni-Zn coin cell and commercial AA cell (PKCell). The terminals of the cells were only connected to the potentiometer long enough to collect a measurement once per hour, thereby leaving the cell truly disconnected the majority of the time. The commercial PKCell Ni-Zn AA cell was still
discharging at the time of writing after 2,800 h.
0 50 100 150 200 250 300
For Coin Cell: Time (h), For PKCell: Time/10 (h/10)
1.6
1.65
1.7
1.75
1.8
1.85
1.9
Ce
ll P
ote
ntia
l (V
)
Coin Cell
PKCell AA
153
potential. As such, the cells were left disconnected from the measuring device the majority
of the time. In the figure it appears that the commercial cell, with a capacity of 1530 mAh,
self-discharges more slowly than does the coin cell, with a capacity of 3.69 mAh. But since
this data does not contain direct information about the current, more information is needed
together with Figure 5-1 to determine the actual self-discharge current. It is important to
note that the Zn electrode potential is flat during the majority of self-discharge, and so the
entire potential drop until 1.63 V (about 260 h) observed in Figure 5-1 is due solely to the
Ni electrode losing charge and intercalating H+ ions and corresponding e−. A self-discharge
current acquired using Figure 5-1 will therefore only represent the self-discharge rate of the
Ni electrode. The steeper potential drop below 1.63 V is due to the Zn electrode
approaching the end of its state of charge, as was demonstrated in Figure 3-4 (pg. 98).
Figure 5-2: dQ/dV curves for a typical Ni-Zn coin cell and commercial AA cell (PKCell). The coin cell was discharged at a C/5 rate while the PKCell was discharged at a C/20 rate, yielding discharge capacities of 3.691 mAh and 1,532 mAh, respectively. Both cells were held at 30. ± 0.1°C. The SoC vs V lines (blue)
correspond to the right-side y-axis. The PKCell data was intentionally offset by +0.1 V to separate the two data sets for easier examination.
1.4 1.5 1.6 1.7 1.8 1.9 2
Ni-Zn Cell Potential (V), (+0.1 V for PKCell)
0
2
4
6
8
10
12
14
dQ
/dV
, N
orm
aliz
ed
to
Dis
ch
arg
e C
ap
acity (
1 /
V)
0
0.2
0.4
0.6
0.8
1
1.2
1.4
Sta
te o
f C
ha
rge
, S
oC
(%
Ch
arg
ed
)
Coin Cell, dQ/dV vs V
Coin Cell, SoC vs V
PKCell, dQ/dV vs V+0.1
PKCell, SoC vs V+0.1
154
To determine the self-discharge current, a reference curve for the potential must
first be obtained to specify the link between potential and state of charge. Then, the
derivative of both the self-discharge curve and the reference curve are multiplied together
to acquire the current as a function of potential:
𝑑𝑄(𝑉)
𝑑𝑉∙
𝑑𝑉
𝑑𝑡=
𝑑𝑄(𝑉)
𝑑𝑡= 𝐼𝑆𝐷,𝑁𝑖(𝑉). (5-1)
Figure 5-2 shows the reference potential curve (in blue) and the derivative of it (in black)
for the V vs Q curves of the two cells shown in Figure 5-1, acquired in a separate
experiment. The dQ/dV data was normalized to account for the larger capacity of the
commercial cell by dividing the data by the capacity of the relevant cell. Because of this, the
area under both dQ/dV curves is equal to 1.
Figure 5-3 shows the dV/dt curves for the same two cells, acquired directly from
Figure 5-1. A fit was applied to both data sets here (not shown) to allow for interpolation to
generate data points at the same potentials as the data points in Figure 5-2. The data from
Figure 5-2 is then multiplied by the fit from Figure 5-3 to generate the Ni electrode self-
discharge current as a function of potential, which is shown in Figure 5-4. Again, the data
has been normalized to the discharge capacity of the two cells to allow them to be compared
to each other. The “1/year” unit effectively means “how many times would this Ni electrode
Figure 5-3: dV/dt curves calculated from the V vs t data in Figure 3-1.
1.6 1.65 1.7 1.75 1.8 1.85 1.9
Cell Potential (V)
0
4
8
12
16
20
dV
/dt
(mV
/h)
Coin Cell
PKCell AA
155
discharge in one year”. Evidently, the commercial Ni-Zn cell had a Ni electrode that self-
discharged via Reaction (1-26) (pg. 25) more than four times slower than the Ni electrode
in the coin cell. This was likely due to proprietary techniques and materials used by
commercial cell manufacturers.114 The coin cell Ni electrode here displayed an average self-
discharge current of 14.4 μA, or 8.14 μA/cm2, down to 1.63 V. The self-discharge current
likely stayed low below 1.63 V, so this averaged rate would be lower still if the data in
Figure 5-1 was complete. Regardless, knowing the relative scale of the self-discharge
current of the Ni electrode is important because if the Ni electrode reaches the end of
charge before the Zn electrode does, then a measurement of the Zn electrode self-discharge
rate cannot be made. Since the self-discharge rate of a coin cell Ni electrode demonstrated
here was on the same scale, and greater than, the Zn self-discharge currents measured by
the foil experiments, the Ni electrode of a coin cell left at open circuit might finish
discharging first.
Figure 5-4: Normalized self-discharge current of the Ni electrodes of a coin cell and a commercial AA cell (PKCell). Normalization was achieved by dividing the currents by the discharge capacity of the respective
cell. The PKCell cell uses the right-side y-axis, which is 4x lower in scale than the left-side y-axis.
1.6 1.65 1.7 1.75 1.8 1.85 1.9
Cell Potential (V)
0
20
40
60
80
No
rma
lize
d S
elf D
isch
arg
eC
urr
en
t, I
SD/Q
Dis
. (1
/ y
ea
r)0
4
8
12
16
20
No
rma
lize
d S
elf D
isch
arg
eC
urr
en
t, I
SD/Q
Dis
. (1
/ y
ea
r)
Coin Cell
PKCell AA
156
5.3 Experimental Methods
5.3.1 The “Race to the Bottom” Between Self-Discharging Ni and Zn Electrodes
The most confounding problem with using Ni-Zn coin cells to measure the self-
discharge rate of Zn electrodes is the fact that the Ni electrodes have a lower coulombic
efficiency (CE = QDis./QCharge) than the Zn electrodes and a similar self-discharge rate. This
means that if the cell is charged to a fixed potential limit, the Ni electrode will always
contain less charge than the Zn electrode and will thus finish discharging before the Zn
electrode. Figure 5-5 demonstrates what the potential curves look like when either a Ni
electrode or a Zn electrode finish discharging first. The simplest way to tell whether the Zn
or Ni electrode finished discharging first is the presence or absence of the Sn dissolution
plateau, respectively. The Sn dissolution process was described in Section 1.6.2 (pg. 23).
In order to measure Zn electrode self-discharge rates, the goal must be to measure
the relative shelf-life (i.e. time) of Zn electrodes in coin cells under different conditions. The
potential-monitoring storage system allowed the determination of the time at which the Zn
Figure 5-5: Example self-discharge data for coin cells. The completion of discharge by the Zn electrode can be identified by the presence of the Sn dissolution plateau. The self-discharge current is determined by dividing the theoretical capacity of the Zn electrode by the time the cell took to fully discharge the Zn
electrode. If the Ni electrode instead finished discharging first, then the potential dropped to about 0.9 V vs Zn, where it finished intercalating H
+ and e− as shown in Figure 3-4.
0 50 100 150 200 250 300
Time (h)
1
1.1
1.2
1.3
1.4
1.5
1.6
1.7
1.8
1.9
Ce
ll P
ote
ntia
l (V
)
Ni Finishes Discharging First
Zn Finishes Discharging First
Zn electrode fully discharged
Sn dissolving
Ni electrode fully discharged
157
electrode finished discharging; however, to ensure the Zn electrode discharged first, special
precautions during the preparation of these cells had to be taken.
5.3.2 Preparation Procedure for the Ni-Zn Coin Cells
Typical coin cells were fabricated as described in Section 2.2 (pg. 47), with the
following changes: 1.5 cm diameter electrodes of both Ni and Zn were used instead of 1.27
cm diameter electrodes. They were punched out of the foil using a knife punch acquired
from DPM Solutions without using any sacrificial layers to aid the punching process. Zn
electrodes used 0.001” thick Sn foil instead of Cu foil. PbO was not added to the Zn
electrodes, since no additives other than the ones intended to be tested were desired; the
ZnO electrodes were thus 95.5 wt% ZnO. The ZnO electrode slurries were mixed using the
Mazerustar in the same way that the Ni electrode slurries were mixed since it was easier
than using the ball mill and just as effective. Finally, different sized notch bars were used to
make electrodes of different capacities for reasons that will be described momentarily.
As was described in Section 2.3.2 (pg. 54), Ni electrodes must be ‘formed’ before
they can be used. In this work, that process is always completed with a larger capacity Zn
electrode before moving the formed Ni electrode to a new cell with a smaller capacity Zn
electrode. A large capacity Zn electrode was used during formation cycling to avoid
excessive overcharging of the Zn electrode and the associated risk of dendrite-induced short
circuits. Large capacity Ni electrodes (ex. 3.6 mAh) were created with an 0.011” notch bar.
These electrodes were formed in a cell with a large capacity Zn electrode (ex. 20 mAh)
created with a 0.006” notch bar. Figure 5-6 shows the formation cycling of the Ni electrodes
before they were transplanted into the storage cells with additives. The formation
procedure included 4 cycles at a C/2 rate with charge terminating at 100% of the
theoretical capacity of the Ni electrode, and a discharge ending at 1.4 V. The 5th cycle was at
158
a C/5 rate with charge terminating at 120% of the theoretical capacity and the 6th charge
half-cycle ended at 1.8 V. The last short charge half-cycle was intended to leave the
electrode in a slightly charged state to prevent it from entering into overdischarge due to
self-discharge before the next procedural step could be completed.
Once formation was finished, the cell was carefully dismantled using a Cell Opener
(DPM Solutions), which avoids short circuiting the cell and does not destroy the cell
components, and the Ni electrode was removed. It was moved to a new cell with new
separators, new electrolyte and a fresh, smaller capacity Zn electrode (ex. 1.6 mAh) created
with a 0.0015” notch bar. This new cell was put back on the Maccor charger and cycled in
such a way as to leave the Zn electrode fully charged and the Ni electrode significantly more
Figure 5-6: Formation of Ni electrodes for storage experiments. Ni electrodes were formed in coin cells with larger capacity Zn electrodes, as shown here, and then transferred to new cells with smaller capacity
Zn electrodes to be prepared for storage.
Table 5-1: Summary of storage preparation procedures. These procedures all begin in a constant current mode, but shift to constant voltage if the voltage limit is reached during charge. “C” refers to the theoretical capacity of the Zn electrode. 0.5 C = CTheory/2 h. A limitation of 1.5 C means the Zn electrode was overcharged by 50%. The discharge procedure was the same for all cycles.
Procedure Half-cycle Current Limitations Repeat n Times
A Charge 0.5 C 1.5 C 3 2.06 V
B Charge 0.5 C 1.2 C 1 2.06 V Charge 0.5 C 1.4 C 1
C Charge 0.5 C 1.5 C 3 2 V, 150 µA
All Discharge 0.5 C 1.4 V Varied
0 2 4 6 8 10 12 14 16 18 20 22 24
Time (h)
1.4
1.6
1.8
2
2.2
Cell
Po
ten
tia
l (V
)
Formation Cycling
159
charged than the Zn electrode.
Achieving the state where the Ni electrode was holding more charge than the Zn
electrode was tricky, and three procedures for accomplishing this were used in this work.
These three procedures are shown in Figure 5-7 and defined in Table 5-1. Some cells from
all three procedures “failed” in that the Ni electrode finished self-discharging first, but the
proportion of cells that failed this way was reduced with each new preparation procedure.
Only data from cells where the Zn electrode finished discharging first was used to draw
conclusions, which included cells from all three procedures. The first procedure (A) was
quite aggressive, overcharging the cell by 50% for three cycles in a row. This increased the
Figure 5-7: Preparation cycling of a pre-formed Ni electrode and a small capacity Zn electrode in a Ni-Zn coin cell before placing the cell on the long term storage system. The x-axis is normalized to the
theoretical capacity of the Zn electrode. The current in all of these procedures was QTheory, Zn/2 h except where the potential was limited to 2 V in panel C. These three example cells contained no electrolyte
additives.
0 1 2 3 4 5 6 7
Normalized Capacity (mAh/CTheory)
1.4
1.6
1.8
2
0
0.4
0.8
1.2
1.6
Cu
rre
nt
(mA
)
1.4
1.6
1.8
2
Cell
Po
ten
tia
l (V
) 1.4
1.6
1.8
2
2.20 1 2 3 4 5 6 7
C
A - Storage Preparation Procedure A
B
Zn electrode fully charged
160
risk and rate of Zn dendrite formation and subsequent cell failure. In order to reduce the
risk of short circuiting, procedure B only had one conditioning cycle and the overcharge of
the first and second cycles was limited to 20% and 40%, respectively, as listed in Table 5-1.
20% overcharge was chosen because the typical Ni electrode coulombic efficiency
witnessed during this work was greater than 80% so it was thought that 20% overcharge
would leave the Ni electrode at a higher state of charge than the Zn electrode by the end of
the charge half-cycle. This was found to be overly optimistic since the discharge capacities
of cycle 1 in procedure B varied wildly between 61% and 103% of the theoretical capacity
of the Zn electrode, ostensibly because the Ni electrode had a lower CE than 80% in some
cells during cycle 1. Note that the point where the Zn electrode becomes fully charged is
marked in panel B. The slight step in potential was identifiable because the current was
high enough to make the transition from Zn plating to H2 evolution noticeable as was
described in Section 3.1.3 (pg. 96).
For the final procedure, it was discovered that holding the Ni electrode at 2.00 V
during charge and letting the current decay resulted in cells that were more reliably Zn
capacity limited. Figure 5-7C shows this procedure C, while Table 5-1 lists the relevant
parameters it used. It was decided that at least two conditioning cycles were required: The
first cycle was to re-wet or re-form the Ni electrode to return it to proper working order
and the second was to measure the accessible Zn capacity. Current was included on the
right-side y-axis in panel C of Figure 5-7 to illustrate how the current decayed when the cell
reached 2.00 V and was held there until the current decayed to 150 µA.
Throughout these experiments, it was assumed that any H2 produced on the
negative electrode successfully escaped the vicinity of its production since the diffusion
constant of H2 in water is quite large (D = 45×10-6 cm2/s).192 A rough estimate of the time
161
required for a H2 molecule to diffuse from the center of the electrode to the edge (d = 0.75
cm) can be calculated from
𝑡 =𝑑2
𝜋𝐷= 1.1 ℎ𝑜𝑢𝑟𝑠. (5-2)
Since the experiments lasted about 300 hours, H2 had plenty of time to diffuse out of the
electrolyte. Any H2 that then escaped into the cell would have then escaped the cell
altogether since the pressure release valve was weak (i.e. scotch tape), thereby keeping the
internal pressure in the coin cells used here at 1 atm.
Recall that the purpose of overcharging the Zn electrode while further charging the
Ni electrode was so that the capacity that self-discharged during storage would be equal to
the theoretical capacity of the Zn electrode. After the storage preparation procedure, the
cell was immediately moved to the storage system where its potential was measured once
per hour for several hundred hours. Two example data sets have already been shown in
Figure 5-5. Both the preparatory cycling and storage were carried out at 30.0 ± 0.1 °C. The
average self-discharge current was determined by taking the theoretical Zn electrode
capacity and dividing it by the time to Zn electrode failure measured by the storage system.
5.4 Effect of Time and Electrolyte Additives on the Self-Discharge of Ni-Zn Coin
Cells
Coin cells with pre-formed Ni electrodes and the same additives used in Section
4.4.5 were created, prepared and placed on the storage system. As reasoned in Chapter 4,
the rate determining step of self-discharge is Reaction (4-5) (pg. 118) on the current
collector. If the additive effectively reduces H2 evolution on Sn by occupying surface sites
on the current collector, then it will reduce the self-discharge rate of the Zn electrode.
162
Figure 5-8 shows the results of these experiments. Unfortunately, the difficulty of
the cell preparation procedure and time limitations led to the large error bars shown in the
figure. From the “None” data of Figure 5-8, the self-discharge current of Zn electrodes in Ni-
Zn coin cells was equal, within experimental error, to the rate measured using the flooded
cells of Chapter 4 (about 3.5 μA/cm2). The fact that the self-discharge rate was the same
suggests that the same rate determining step is in control in a battery-like system.
Of particular importance is the fact that the average self-discharge currents (iSD) in
Figure 5-8 were all under 3.5 μA/cm2, which is close to the initial rates measured with the
foil experiments of 3.1 μA/cm2. If the Zn corrosion current increased markedly by a factor
of about 10 as observed by Dobryszycki et al.,179 then a higher average would be expected
Figure 5-8: Self-discharge rates of Ni-Zn coin cells with various electrolyte additives. The bar heights and error bars represent the average and standard deviation of 4 cells, except for K2CO3, KF and K2CO3 and
PEG DiAcid which all had only 3 cells. The base electrolyte to which all the additives were added was 3.2 M KOH, saturated with ZnO.
No
ne
Tart
ari
c A
cid
(40
00 p
pm
)
Ph
osp
ho
ric A
cid
(4000
pp
m)
Su
ccin
ic A
cid
(400
0 p
pm
)
Tri
ton
X-1
00 (
0.3
mM
)
CT
AB
(1 m
M)
K2C
O3 (
1.8
M)
PE
G D
iacid
(80
0 p
pm
)
PE
G 4
00
(1 w
t.%
)
KF
(3.3
M)
Cit
ric
Acid
(400
0 p
pm
)
KF
(1.8
M)
an
d K
2C
O3
(1.8
M)
Zn
Fo
rmate
(0.1
M)0
0.5
1
1.5
2
2.5
3
3.5
4
4.5
5
Se
lf D
isch
arg
e C
urr
en
t (
A/c
m2)
163
from the coin cell experiments after about 10 days. Similarly, if iSD had decreased by a factor
of about 4 over the first 10 days as observed by Gregory et al., then a lower average would
be expected.175 However, a change in iSD was not observed, which suggests that the iSD is
constant in time as observed in the charge-wait-discharge experiments of Chapter 4 and by
Meesus et al. and Ruetschi et al..174, 176
For the additives, four successful experiments with each additive were completed,
except for K2CO3, KF & K2CO3, and PEG Diacid which all had only 3 experiments. In
comparison with the blank (3.6 ± 1.0 μA/cm2), the only additive that is statistically lower
(i.e. not equal within experimental error) is Zn formate (1.9 ± 0.6 µA/cm2). Researchers
hypothesize that additives, such as Zn formate, adsorb onto the electrode surface and
reduce the rate of water electrolysis (i.e. Reaction (4-5) on page 118).165 Determining
whether or not Zn formate adsorbs onto the current collector surface more strongly or
weakly than the other additives tested here could be pursued as future work.
The fact that KF & K2CO3 do not increase the self-discharge rate in full coin cells, but
do increase it in a flooded 3-electrode experiment like the foil experiments is difficult to
reconcile. The presence of a Ni electrode, separators and stack pressure can change the
interactions of electrolyte additives from what they were in a flooded 3-electrode foil
experimental set up. To be specific, Ni electrodes operate at potentials up to 2 V vs Zn, so if
an additive reacts at any potential up to 2 V, it will react on the Ni electrode. Furthermore,
microporous separators, along with stack pressure, can influence the morphology of the Zn
deposit. What factors are important in the present situation requires further research to
explain. Again, the purpose of this research was to develop a method of measuring the self-
discharge rate of battery-like rechargeable cells in order to compare the effectiveness of
these additives to one another.
164
An important observation during these coin cell self-discharge experiments was that
mass was lost over the course of the experiments. The low humidity in the lab during
winter, when these experiments were run, at 30°C coupled with the pressure relief valve
being a simple cellophane tape-covered hole resulted in a water loss rate of about 1 to 3
μL/day when there was only 30 to 40 μL of electrolyte in each cell to begin with. This water
loss should not have affected the self-discharge rate until the electrodes themselves started
drying out, at which point the surface area would have shrank and so too would the self-
discharge current. The critical volume of electrolyte at which the self-discharge rate was
affected was not easily determined, since the self-discharge rate of the Zn electrode at a
given point in time could not be determined using the storage system. In the future, this
added complication could be avoided by storing the cells in a humidity controlled box. If the
humidity is kept at the proper level with respect to the KOH concentration in the electrolyte,
as determined by Figure 1-5, then evaporation from the electrolyte will effectively be
eliminated.
5.5 Coin Cell Self-Discharge Conclusions and Future Work
This chapter demonstrated four things. (1) The procedure for measuring the self-
discharge rate of an intercalation electrode (like Ni) was demonstrated. By measuring the
potential of the Ni electrode at open circuit over time and comparing the rate of potential
loss to a calibration curve from a slowly discharged Ni electrode, the self-discharge rate as a
function of time or potential can be determined. In this chapter, Ni electrodes made for coin
cells were measured to have an average self-discharge current of about 8.1 µA/cm2. This
rate was over 4x faster than the iSD of a Ni electrode in a commercial AA Ni-Zn cell, but this
was expected since manufacturers use proprietary techniques and materials to reduce self-
discharge.114 Of more immediate importance was the fact that this rate outstripped the iSD
165
of the Zn electrodes of Chapter 4. If both electrodes were charged to the same state of
charge in a cell and then left to self-discharge, the faster iSD of the Ni electrode would result
in the Ni electrode reaching the end of discharge before the Zn electrode. As such, one way
to use Ni-Zn cells to determine if the self-discharge rate of Zn electrodes increased over time
was to overcharge the Zn electrode to leave the Ni electrode at a higher state of charge so
that the Zn electrode would finish discharging first during a self-discharge measurement.
(2) The potential monitoring of the overcharged Ni-Zn cells yielded the amount of
time until the Zn electrode had fully self-discharged, which in turn yielded the average self-
discharge rate of the Zn electrode. Since this rate was equal, within experimental error, to
the rate measured in Chapter 4, it was concluded that the iSD in coin cells was the same as in
the flooded cells of Chapter 4 and that the iSD remained constant throughout the first 10
days, in agreement with some authors,176 but at odds with others.132, 175, 179 This result is
important because it confirms that short term experiments, like the charge-wait-discharge
method of Chapter 4, can provide meaningful mechanistic conclusions. If the self-discharge
current had changed, then the results of Chapter 4 would require further proof that the rate
determining step (rds) observed at short times continued to be the rds into the long term. A
constant iSD also suggests that the surface area of the current collector that is exposed to the
electrolyte does not increase with time, since the self-discharge current is controlled by H2
evolution on the current collector (Reaction (4-5) on page 118). This means that the Zn that
dissolves cannot originate from the edges of the base of the pores in the Zn deposit (see
Figure 4-15) since this would increase the surface area of exposed current collector.
(3) The results of the additives suggest that the other cell components, like the
separator and positive electrode, can affect additives to either enhance or reduce their
effects on the Zn electrode. For instance, the presence of K2CO3 was notably detrimental in
the flooded cells of Chapter 4, but did not significantly affect the iSD of the coin cells. Why
166
K2CO3 behaves differently in coin cells than in the flooded cell was not determined in this
work but would be a valuable endeavor for researchers interested in Ni-Zn cells.
Conversely, Zn formate did not significantly enhance iSD in Chapter 4, but it did have a
noticeably beneficial effect in the coin cells. Of all the additives studied in this thesis, Zn
formate was the only one to statistically reduce the self-discharge rate, and so it warrants
further research to determine how it achieved this. Overall, the fact that the self-discharge
current of Zn electrodes exposed to additives in battery-like cells was different than that in
flooded cells suggests that further research on additives should be performed, or at least
confirmed, in battery-like cells before an additive is declared effective. This is currently not
the practice in the literature,145, 146, 165, 179, 180 and would improve the quality of research on
self-discharge inhibitors.
(4) The difficulty of making and overcharging, without shorting, the Ni-Zn cells of
this chapter demonstrates the importance of finding an alternative positive electrode to Ni
to act as the counter electrode to Zn in future research efforts. A positive electrode with a
higher coulombic efficiency (CE) and lower self-discharge current than Zn would allow the
relatively easy charge-wait-discharge procedure of Chapter 4 to be used with a battery-like
cell in place of waiting for the cell to completely self-discharge or trying to collect H2 gas
from the cell. A durable bi-functional air electrode would satisfy both requirements (higher
CE and lower iSD than Zn) since the capacity of the air electrode, which is stored in the
electrolyte and air, is larger than that stored in Zn, no matter whether the cell is being
charged or discharged. Furthermore, a bi-functional air electrode used in a battery-like cell
would ensure that additives being tested are properly evaluated in the intended system
(assuming the additive is intended to be used in Zn-air cells). Consequently, developing or
acquiring a durable bi-functional air electrode should be the first priority in continuing the
research efforts discussed in this thesis.
167
Chapter 6: Conclusions
6.1 Regarding Coin Cells
6.1.1 Chapter 2 Conclusions
The purpose of the research in Chapter 2 was to convert the ubiquitous Li-ion lab-
scale coin cell into a test vehicle for rechargeable Zn electrodes to facilitate and encourage
more research into Zn-air and other alkaline metal-air technologies. The importance of
several aspects of Ni-Zn cell design was demonstrated. This should help inform researchers
who have been trying to enter into the research area of Ni-Zn and Zn-air cells while
seemingly oblivious to the importance of these aspects, as evidenced by a lack of
consideration for or reporting of those aspects:123, 124, 126-128, 130, 131
(1) The quantity of electrolyte in relation to the amount that can be held by the
electrodes and separators has been shown to affect the shape-change phenomenon of the
Zn electrode.43, 87, 88 Consequently, it is important to make experimental cells that can
operate with minimal amounts of electrolyte so that pools of electrolyte are avoided. The
coin cell is one example of these so-called “battery-like” cells. Many authors do not report
how much electrolyte they used, or even whether or not it was more than the amount
required to soak the electrodes and separators.123-131
(2) Separators must be chosen properly, both in terms of number and type. The
importance of the separators has been understated in the literature;70, 193 therefore, it was
enlightening to demonstrate the cycle life of cells with incorrectly chosen combinations of
separators. In the literature, authors tend to report which separators they used, but no one
has published a comparison of the cycle life of Ni-Zn cells built with different separators
before.
168
(3) The research presented in Chapter 2 demonstrated the importance of stack
pressure in determining cycle life. As such, the presence or absence of stack pressure
should be reported in the literature. Although actual stack pressure measurements would
be ideal, authors should at least state whether there was any kind of stack pressure applied
to the electrodes or if the electrodes were simply dangled in the electrolyte. This is
especially true for Ni-Zn cells since the importance of stack pressure for proper Ni electrode
operation has been demonstrated in the past.101, 102
(4) Chapter 2 also demonstrated that the orientation of the coin cell can affect the
cycle life. This concept is fairly specific to the coin cell design since it has an air pocket.
Consequently, the Ni-Zn coin cells developed here should not be rotated more than 90° to
keep the electrolyte from flowing into empty internal space.
(5) The stability and parasitic gas evolution propensity of all materials that are
exposed to the electrolyte at the potentials of the corresponding electrode seem to have
been overlooked by several authors.124, 126, 127, 131 Chapter 2 demonstrated that materials
like stainless steel are unsuitable as casing components or current collectors since they
support high parasitic currents, which hinders cycle life. Ni metal should be used for
positive-side components and current collectors. Cu was also shown to be unsuitable as a
current collector for Zn in that it reduced the cycle life of coin cells in comparison with Sn.
For the first time, Sn (tin) was demonstrated to enhance the cycle life of Zn electrodes, and
researchers should consider coating their Zn current collectors with Sn in the future.
The advantage of having a low H2 evolving current collector that also promotes a flat
Zn deposit and does not alloy with Zn is particularly notable because it might explain the
results of a few authors who claim that a metallic oxide additive to the electrode is
beneficial.15, 115, 127, 159, 160, 194-196 These additions might operate simply by coating the current
169
collector; in which case, it would likely be more efficient to simply use a different current
collector in the first place.
(6) As discussed at the end of Section 2.3.6 (pg. 72), reproducibility has historically
been poorly reported in the literature with few authors reporting it at all.118, 119, 123 This
could be due to a lack of space, materials or time, but frighteningly it could also be due to
the erratic behaviour of cells and the authors’ apprehension to report anything other than
their best data. The consequence of erratic discharge capacity vs cycle data on standard
deviations was touched on in Section 2.3.3 (pg. 58). In the author’s opinion, researchers
should produce at least three identical cells and report the average and standard deviations
of the discharge capacities vs cycle number and/or the cycle life. Otherwise, the results are
not as powerful as they could have been, and are more difficult to compare to the results of
other authors. The ability to compare different advancements across research papers is
also limited by the fact that authors have adopted the poor habit of not reporting their cell
designs. As Chapter 2 showed, the cell design can affect the cycle life, and so comparisons of
cycle life between bodies of research requires detailed cell designs to be reported.
6.1.2 Chapter 3 Conclusions
Section 3.1 demonstrated some fundamental features of the 2-electrode Ni-Zn cell
potential curves by conducting experiments with 3-electrode coin cells. It was
demonstrated that during charging, the potential of the Zn electrode only reveals when it
has finished charging if the current is high enough to create a noticeable potential difference
between Zn plating and H2 evolution. It was also demonstrated that a Ni electrode has a
more abrupt drop in potential when it finishes discharging as compared to the Zn electrode.
This had not been drawn attention to in the literature and was a useful tool in some
circumstances to determine whether the Ni or Zn electrode had finished discharging first.
170
Most importantly though, it was also demonstrated that Ni electrodes commonly
finish discharging before the Zn electrodes with Sn current collectors used in coin cells in
this thesis. That is to say, the Ni electrodes had a lower coulombic efficiency (CE). This
meant that Ni electrodes were insufficient as a counter electrode to Zn in a 2-electrode
system where the purpose was to measure the discharge capacity of the Zn electrode.
Conversely, this also meant that Zn was a fine counter electrode to Ni if the purpose of the
research was to measure the discharge capacity of the Ni electrode. This revelation
weakens the results of several studies that use 2-electrode Ni-Zn cells and claim that it was
the discharge capacity of a modified Zn electrode that was measured.126-128, 130, 131 A lower
CE than Zn does not discount their results, but it does complicate them since a direct
measurement of the intended variable might not have been achieved. For instance, the
cycle life measurements made in Chapter 2 were carried out in intentionally Ni electrode
limited coin cells, but the difference in cycle life between cells containing a Cu or Sn current
collector was so dramatic that Sn can still be concluded to be superior to Cu. The trouble
comes when a researcher wants to demonstrate why. If a counter electrode with a superior
CE to Zn were present in the coin cell, then every cycle the discharge capacity would reflect
only the behaviour of the Zn electrode instead of, for example, reflecting one electrode in
early cycles and then the other in later cycles. Consequently, Ni electrodes should not be
used in 2-electrode cell research intended to improve the Zn electrode unless they are pre-
charged and have a large-enough capacity compared to the Zn electrode to reach the end of
the Zn electrode cycle life before themselves becoming fully discharged. Alternatively, if a
Ni electrode that had a higher CE than the Zn electrode were developed, this would also
work. Either a reference electrode should be used or a new counter electrode should be
found.
171
A bi-functional air electrode has a higher CE than the Zn electrode, suggesting that it
should be used instead of Ni as the counter electrode. If a researcher can acquire or make
an air electrode that outlives the Zn electrode then air electrodes should be used in future
research efforts. Section 3.2 demonstrated how to adapt a coin cell to work with Zn and air
electrodes for researchers who have durable, bi-functional air electrodes.
Coin cells can also be adapted to work with acidic aqueous cell chemistries, like
LiMn2O4 – Zn as demonstrated in Section 3.3. These cells demonstrated that a counter
electrode to Zn with a higher CE than Zn would not necessarily be advantageous if the
counter electrode has a limited capacity available to be charged. Effectively, the LiMn2O4
limited the charging half-cycles, while Zn limited the discharging half-cycles, leading to a
short cycle life. In combatting this issue, it was realized that overcharging one electrode
(LiMn2O4 in this case) could cause that electrode to finish discharging first, even if the other
electrode (Zn in this case) had a lower CE. Using this concept, the Zn electrodes in Chapter
5 were overcharged so that they would be first to finish discharging despite the lower CE of
the Ni electrode. In general, this trick of overcharging an electrode essentially trades
electrolyte (which is consumed during overcharging) to increase cycle life. As such,
researchers should state whether they are intentionally overcharging as part of their cycling
regime or not, since it affects the cycle life. In situations where overcharging is present, it is
even more important to include the amount of electrolyte used in the cell as part of the
experimental procedure since a particular cycling regime might overcharge a cell so much
that the electrolyte is significantly changed (i.e. pH) or consumed before the electrodes
themselves fail.
172
6.2 Coin Cell Future Work
Any future 2-electrode, battery-like cell research on Zn electrodes should begin with
acquiring or fabricating durable bi-functional air electrodes and making Zn-air cells, since
air electrodes effectively have infinite capacity. Provided the air electrode functioned as
designed, this would guarantee that the Zn electrode would finish discharging first in every
discharge half-cycle, thereby allowing accurate CE and self-discharge measurements of the
Zn electrode to be made.
In order to eliminate H2O evaporation as a concern from future efforts, humidity
(and temperature) controlled test chambers should also be developed. Then, the best
practices outlined in this thesis regarding cell design, reproducibility, and reporting should
generate high quality research on the cycle life of Zn electrodes for rechargeable alkaline Zn
cells.
These Zn-air cells could also be used with the charge-wait-discharge method
described in Chapter 4 to measure the self-discharge rate of Zn electrodes as a function of
time. This would be particularly useful because the effect of any sort of cell modification on
the self-discharge and H2 evolution currents, such as electrode additives, different active
materials, new separators or non-liquid electrolytes, could be tested instead of limiting the
scope to electrolyte additives.
If the goal of a research project is instead to work with thick electrodes like those
used in commercial cells, then a new current collector structure (other than Sn foil) with a
larger surface area should be developed first. Cu foam has a 3D structure and high surface
area, but it should be electroplated with Sn first since Sn improves the cycle life. These
thicker Zn electrodes could either be used in thicker format coin cells or in the same thinner
coin cells used in this thesis with a smaller spring (like a wave-spring) as long as enough
current collector was left exposed to make contact with the Sn-plated canister.
173
Alternatively, an entirely new cell could be designed that uses transparent, alkaline-
resistant plastic, has the ability to adjust the stack pressure, can be used with minimal
amounts of electrolyte, allows current collector tabs to extend out of the cell without
leakage, and has the option to include a reference electrode (like Zn foil). However, such a
cell should be designed to maintain the small size, cost and manufacturing time of coin cells.
If such a design were realized, it would be a contender for the recognized standard cell
design for Zn-air cell research, which the Zn-air field seems to need.
Finally, if the gas outlets of a Zn-air cell were connected directly to a differential
electrochemical mass spectrometer (DEMS) then not only could H2 evolution rates be
measured, but carbon corrosion at the positive electrode could also be analyzed.197, 198
DEMS is a powerful technique for studying metal-air systems since it allows the researcher
to monitor the gasses produced by the cell as a function of time or state of charge.
6.3 Regarding Self-Discharge Measurements
6.3.1 Chapter 4 Conclusions
The new charge-wait-discharge method of measuring the self-discharge rate of
charged Zn electrodes was introduced in Chapter 4 and demonstrated using foil electrodes.
It revealed that the self-discharge rate of a charged Zn electrode was not dependent on time,
KOH concentration, or plating rate. The only factor that did change the self-discharge rate
was the current collector, leading to the conclusion that the mechanism controlling the rate
of self-discharge was galvanic corrosion, where H2 was evolved on the current collector
while Zn dissolved to provide the electrons.
Therein, it was demonstrated that nickel (Ni) and graphite (C) have self-discharge
rates over 30× higher than copper (Cu), indium (In) or tin (Sn), damning the use of Ni and C
as current collector material and/or conductive electrode additive, respectively. Lead (Pb)
174
also had a poor self-discharge rate of 2× higher than Cu, which was surprising considering
that Cu has a higher exchange current density than Pb for H2 evolution.65 This was
explained through reasoning that the Zn deposit might leave more current collector surface
area exposed on the Pb surface than on the Cu surface. The sensitivity of the self-discharge
rate on exposed current collector surface area could also explain the difference between
using Cu and Sn current collectors in the coin cells; if it is assumed that the entire current
collector was not covered with Zn (unlike the charge-wait-discharge foil experiments), then
the Cu current collector could have promoted a higher self-discharge rate than the Sn. This
was the first time that the current collector has been identified as the primary factor
affecting the self-discharge rate of rechargeable Zn electrodes.
Several electrolyte additives that have been claimed to serve various purposes for
rechargeable Zn electrodes were then tested using the charge-wait-discharge method. Only
one of them significantly affected the self-discharge rate. That additive was the
combination of 1.8 M K2CO3 & 1.8 M KF, which appeared to promote a holey Zn deposit that
potentially exposed more current collector to the electrolyte and significantly increased the
self-discharge rate. Therefore, none of the additives tested were deemed to be useful in
reducing the self-discharge rate, suggesting that the charge-wait-discharge method might
be a more effective self-discharge measurement technique than linear sweep voltammetry
or H2 gas collection.145, 146, 164, 165, 179
6.3.2 Chapter 5 Conclusions
The coin cell self-discharge experiments of Chapter 5 were primarily concerned
with determining whether the self-discharge rate increased, decreased or stayed constant
over a several day time period. It was determined that the self-discharge rate remained
constant over time since Zn electrodes displayed average self-discharge rates that nearly
175
matched the measurements of the foil charge-wait-discharge experiments of Chapter 4. The
nearly equal values obtained from both experiments also suggested that the foil
experiments were accurate in reproducing the situation in a battery-like cell such as the
coin cell.
In the process of determining the above, a new method of measuring the self-
discharge rate of a Ni electrode was demonstrated. That method yielded the self-discharge
rate as a function of time or state of charge. The average discharge rate of the Ni electrode
in the coin cells was determined to be on the same order of magnitude as that of the Zn
electrode. This meant that the Zn electrode had to be overcharged to leave the Ni electrode
with more charged capacity than the Zn electrode so that the Zn electrode would finish
discharging first. This method worked as predicted, and allowed the average self-discharge
rate of the Zn electrode to be determined.
Finally, this method was used to determine whether any of the additives tested in
the flooded foil experiments of Chapter 4 behaved differently in Ni-Zn coin cells. A few of
them did. Of note was Zn formate, which was the only additive to statistically reduce the
self-discharge rate, and the combination of 1.8 M K2CO3 and 1.8 M KF, which did not
increase the self-discharge rate as it had in the flooded foil experiments. The reasons for
these discrepancies were not elucidated at the time of writing, but the fact that they
occurred demonstrates that electrolyte additives can behave differently in a battery-like cell
that has separators, stack pressure, a small amount of electrolyte and a positive electrode.
As such, future efforts to determine the effectiveness of additives should be confirmed in
battery-like cells, and not simply tested in a flooded cell and assumed that the result will
apply equally well in both cases.
176
6.4 Self-Discharge Measurement Future Work
The primary goal for moving forward with the charge-wait-discharge self-discharge
measurements is the same as future work for coin cells: acquire a durable bi-functional air
electrode. Once a rechargeable Zn-air cell that maintains a relatively constant discharge
capacity over at least about 10 cycles has been developed, then the charge-wait-discharge
method can be used directly on a battery-like cell. For completeness, the results of Chapter
4 should be repeated in the Zn-air cell to confirm that the mechanism of self-discharge is the
same. Then, the researcher is free to measure the self-discharge rate of Zn with any number
of potential electrolyte additives, electrode additives, electrode coatings, new active
materials, etc. The ones that cause a noticeable change in the self-discharge rate can then
be further studied by other experiments to attempt to learn how they function.
Another interesting challenge would be to determine whether electrochemical
impedance spectroscopy (EIS) can be used to determine the self-discharge rate of
rechargeable Zn electrodes. Cachet and Wiart published several interesting papers on
analyzing the processes occurring on a Zn electrode in alkaline electrolyte using EIS.38, 39, 199-
203 However, the same sort of work has not been done on a Zn electrode that has been
plated onto a current collector.
6.5 A Note on World Resources
Astute readers might have noticed that “sustainable” was not one of the qualities
associated with Zn in the introduction to this thesis. An interesting story lies behind this:
One of the reasons for initiating research on Zn-air batteries in 2007 was the fear of world
Li supplies being insufficient to provide enough batteries to replace the cars in the world
with electric vehicles. However, that idea was convincingly argued to be false in 2008 by
Keith Evans, although the author did not find this article until 2011.204 To double check the
177
claim that Li was not in short supply, the method pioneered by M. King Hubbert205 and
explained by McFarland et al.206 was used to generate predictions of the year of peak
material production for zinc207 (Zn), nickel208 (Ni), cobalt209 (Co), manganese210 (Mn) and
lithium211 (Li). Figure 6-1 shows the resulting Gaussian fits to the historical data acquired
from the US Geological Survey (USGS) website.212 The fits were confined to have an area
under the curve equal to the estimated amount of a particular resource (ex. Zn) that ever
existed on Earth, which was also acquired from the USGS. The production rates of some
resources, such as Zn, vastly dwarf the production rates of other resources, such as Li, so the
data in Figure 6-1 was normalized to the peak production rate of that resource so that the
year at which the peaks occur could more easily be compared. In order to understand the
significance of the data, a short discussion of the error is necessary.
The fits are quasi-single point fits, so the peak year is dependent on which year’s
production rate the Gaussian is fit to. To generate a standard deviation, the fit was applied
to the production rates of each year from 2000 to 2014 and the average peak year was
determined. An example of this data is shown in Figure 6-2. These peak years and their
Figure 6-1: The predicted world production rates of five metals that are important to battery technologies. Predictions were calculated using Hubbert’s model, which is a Gaussian fit to the historical production rates with the area under the curve set to equal the estimated amount of resource on Earth.
1900 1950 2000 2050 2100 2150 2200
Year
0
0.2
0.4
0.6
0.8
1
No
rma
lize
d P
rod
uctio
n R
ate
From Left to RightNickel
Zinc
Cobalt
Lithium
Manganese
178
standard deviations are shown in Table 6-1, along with the peak production rates. It should
be noted that the peak years determined this way were not randomly distributed about the
mean but instead trended towards a nearer date, as shown in Figure 6-2, and so these
predicted years of peak production might be further away than in reality. The production
rates are a good reminder that although the amount of Zn on Earth is vastly larger than the
amount of Co, Zn is predicted to run out before Co because humans consume vastly larger
quantities of Zn each year.
Also of importance is the accuracy of the estimate of resource remaining on Earth.
Figure 6-2: Year of peak production of Zn as a function of the year used to generate the Gaussian fit. For instance, the cumulative production of Zn up to the year 2000 was 327,396,000 tonnes, which generated a peak production year of 2065, while that up to the year 2014 was 484,206,000 tonnes, which generated
a peak production year of 2056.
Table 6-1: Calculated years of peak resource production for five metals that are important to cell technologies. The peak year was calculated using the Hubbert method and data from the US Geological Survey. The peak year was an average calculated from 15 fits to data ending in the year 2000 to 2014.
When discussing the topic of peak oil, uninformed people state that new oil is always being
found and so the model must just be unrealistic, without realizing that resource discovery is
implicitly included in Hubbert’s peak model. New resource discoveries do increase the
estimate of total resources remaining on Earth, but not by enough to significantly move the
year of the peak. For example, in the highly unlikely event that an incredible amount of
previously undiscovered Zn was found that doubled the amount of Zn currently estimated
to be on Earth, the peak calculated here would shift from the year 2060 ± 4 to 2100 ± 6.
Although 40 years might seem like a lot, it is in fact tiny since the discussion at hand is
concerned with the amount of Zn available for all humanity for all time.
Clearly then, the impending end of cheap raw ore of many important metals within
the next century is sobering and indicative of the coming end of the consumer era along
with a dramatic increase in the importance of recycling and products made from plentiful or
cheaply recycled materials. Ironically, Figure 6-1 and Table 6-1 show that Zn will run out
before Co; however, Zn is more easily recycled from spent cells than Ni and Co are,
suggesting that Zn might still be the better option. Whatever cell chemistry holds the
highest market share in the future, its continued dominance will depend on its
sustainability.
180
References
1. N. Ramez, http://rameznaam.com/2015/04/14/energy-storage-about-to-get-big-and-cheap/, Accessed: April 17 2015 (Last updated: 2015).
2. P. Mock and S. A. Schmid, in Encyclopedia of Electrochemical Power Sources Editor: J. Garche, p. 566, Elsevier, Amsterdam (2009).
3. C. J. Boreiko, in Encyclopedia of Electrochemical Power Sources Editor: J. Garche, p. 233, Elsevier, Amsterdam (2009).
4. Y. Guo, in Encyclopedia of Electrochemical Power Sources Editor: J. Garche, p. 241, Elsevier, Amsterdam (2009).
5. C. D. Parker, in Encyclopedia of Electrochemical Power Sources Editor: J. Garche, p. 225, Elsevier, Amsterdam (2009).
6. J. R. Dahn and G. M. Ehrlich, in Linden's Handbook of Batteries, 4th ed., Editors: T. B. Reddy and D. Linden, p. 26.1, McGraw-Hill, Toronto (2010).
7. G. Girishkumar, B. McCloskey, A. C. Luntz, S. Swanson and W. Wilcke, J. Phys. Chem. Lett., 1, 14 (2010).
8. S. A. Freunberger, Y. Chen, Z. Peng, J. M. Griffin, L. J. Hardwick, F. Barde, P. Novak and P. G. Bruce, J. Am. Chem. Soc., 133, 20 (2011).
9. M. Xu, D. G. Ivey, Z. Xie and W. Qu, J. Power Sources, 283 (2015).
10. A. C. Luntz and B. D. McCloskey, Chem. Rev., 114, 23 (2014).
11. O. Haas and J. V. Wesemael, in Encyclopedia of Electrochemical Power Sources, 1st ed., Editor: J. Garche, p. 384, Elsevier, Amsterdam (2009).
12. T. B. Atwater and A. Dobley, in Linden's Handbook of Batteries, 4th ed., Editors: T. B. Reddy and D. Linden, p. 33.1, McGraw-Hill, Toronto (2010).
13. O. Haas, F. Holzer, K. Muller and S. Muller, in Handbook of fuel cells: fundamentals, technology, applications. Fundamentals and survey of systems, 1st ed., Editors: H. Gasteiger, A. Lamm and W. Vielstich, p. 382, Wiley, Milan (2003).
14. X. G. Zhang, Corrosion and Electrochemistry of Zinc, 1st ed., Plenum Press, New York (1996).
15. F. R. McLarnon and E. J. Cairns, J. Electrochem. Soc., 138, 2 (1991).
16. K. Kotaich and S. E. Sloop, in Encyclopedia of Electrochemical Power Sources, 1st ed., Editor: J. Garche, p. 188, Elsevier, Amsterdam (2009).
26. A. M. Moos, Chemical & Engineering News, 46, 40 (1968).
27. J. Passaniti, D. Carpenter and R. McKenzie, in Linden's Handbook of Batteries, 4th ed., Editors: T. B. Reddy and D. Linden, p. 13.16, McGraw-Hill, Toronto (2010).
28. H. Arai and M. Hayashi, in Encyclopedia of Electrochemical Power Sources, 1st ed., Editor: J. Garche, p. 55, Elsevier, Amsterdam (2009).
29. J. O. Bockris, Z. Nagy and A. Damjanov, J. Electrochem. Soc., 119, 3 (1972).
30. L. A. Tinker and K. A. Striebel, in Energy Storage Systems in Electronics, 1st ed., Editors: T. Osaka and M. Datta, p. 409, Taylor & Francis (2000).
31. V. Neburchilov, H. Wang, J. J. Martin and W. Qu, J. Power Sources, 195, 5 (2010).
32. L. Jöerissen, in Encyclopedia of Electrochemical Power Sources, 1st ed., Editor: J. Garche, p. 356, Elsevier, Amsterdam (2009).
33. J. Y. Huot, in Encyclopedia of Electrochemical Power Sources, 1st ed., Editor: J. Garche, p. 883, Elsevier, Amsterdam (2009).
78. D. S. Hall, C. Bock and B. R. MacDougall, J. Electrochem. Soc., 160, 3 (2013).
79. I. T. Bae, J. Electrochem. Soc., 155, 5 (2008).
80. S. T. Mayer and R. H. Muller, J. Electrochem. Soc., 139, 2 (1992).
81. P. Vanysek, in CRC Handbook of Chemistry and Physics, 79th ed., Editor: D. R. Lide, p. 8-21, CRC Press, Boca Raton (1998).
82. J. C. Nardi and R. J. Brodd, in Linden's Handbook of Batteries, 4th ed., Editors: T. B. Reddy and D. Linden, p. 11.1, McGraw-Hill, Toronto (2010).
83. J. W. Diggle, A. R. Despic and J. O. Bockris, J. Electrochem. Soc., 116, 11 (1969).
84. M. Liu, G. M. Cook and N. P. Yao, J. Electrochem. Soc., 128, 8 (1981).
85. W. G. Sunu and D. N. Bennion, J. Electrochem. Soc., 127, 9 (1980).
86. W. G. Sunu and D. N. Bennion, J. Electrochem. Soc., 127, 9 (1980).
87. J. McBreen, J. Electrochem. Soc., 119, 12 (1972).
88. J. Jorné, T. C. Adler and E. J. Cairns, J. Electrochem. Soc., 142, 3 (1995).
89. K. W. Choi, D. N. Bennion and J. Newman, J. Electrochem. Soc., 123, 11 (1976).
90. K. W. Choi, D. Hamby, D. N. Bennion and J. Newman, J. Electrochem. Soc., 123, 11 (1976).
91. R. Jain, T. C. Adler, F. R. Mclarnon and E. J. Cairns, J. Appl. Electrochem., 22, 11 (1992).
92. T. C. Adler, F. R. Mclarnon and E. J. Cairns, J. Electrochem. Soc., 140, 2 (1993).
93. P. Pei, K. Wang and Z. Ma, Appl. Energy, 128 (2014).
94. S. Muller, F. Holzer, H. Arai and O. Haas, J. New Mat. Electrochem. Systems, 2, 4 (1999).
95. D. U. Lee, J. Choi, K. Feng, H. W. Park and Z. Chen, Advanced Energy Materials, 4, 6 (2014).
96. S. W. Donne, G. A. Lawrance and D. A. J. Swinkels, J. Electrochem. Soc., 144, 9 (1997).
97. M. R. Bailey and S. W. Donne, J. Electrochem. Soc., 159, 12 (2012).
98. X. Li, Y. Song, L. Wang, T. Xia and S. Li, Int. J. Hydrogen Energ., 35, 8 (2010).
99. Y. Ratieuville, W. L. Wu, D. Lincot, J. Vedel and L. T. Yu, J. Electrochem. Soc., 146, 9 (1999).
100. P. Stevens, G. Toussaint, G. Caillon, P. Viaud, P. Vinatier, C. Cantau, O. Fichet, C. Sarrazin and M. Mallouki, ECS Transactions, 28, 32 (2010).
185
101. K. Micka, J. Mrha and B. Klapste, J. Power Sources, 5, 2 (1980).
102. V. Koudelka, J. Malík, J. Mrha, I. Krejčí and M. Špinka, J. Power Sources, 6, 2 (1981).
103. D. Yunchang, Y. Jiongliang, L. Hui, C. Zhaorong and W. Zeyun, J. Power Sources, 56, 2 (1995).
104. K. Watanabe, T. Kikuoka and N. Kumagai, J. Appl. Electrochem., 25, 3 (1995).
105. C. Delmas and C. Tessier, J. Mater. Chem., 7, 8 (1997).
106. M. C. Bernard, R. Cortes, M. Keddam, H. Takenouti, P. Bernard and S. Senyarich, J. Power Sources, 63, 2 (1996).
107. R. S. Jayashree, P. V. Kamath and G. N. Subbanna, J. Electrochem. Soc., 147, 6 (2000).
108. C. Greaves, M. A. Thomas and M. Turner, J. Power Sources, 12, 3-4 (1984).
109. S. Deabate, F. Fourgeot and F. Henn, Electrochim. Acta, 51, 25 (2006).
110. C. Tessier, L. Guerlou-Demourgues, C. Faure, C. Denage, B. Delatouche and C. Delmas, J. Power Sources, 102, 1-2 (2001).
111. PowerGenix, http://powergenix.com/cells/, Accessed: May 29 2015 (Last updated: 2014).
112. PKCell, http://www.pkcell.net/?cat=28, Accessed: May 29 2015 (Last updated: 2015).
113. F. Feng, J. Phillips, S. Mohanta, J. Barton and Z. M. Muntasser, US Patent, 13/452,629, US 2012/0205248 A1 (2012).
114. M. Geng, S. Mohanta, J. Phillips, Z. M. Muntasser and J. Barton, US Patent, 13/250,217, US 2012/0018669 A1 (2012).
115. J. McBreen and E. Gannon, J. Electrochem. Soc., 130, 10 (1983).
116. J. K. Weaver, F. R. McLarnon and E. J. Cairns, J. Electrochem. Soc., 138, 9 (1991).
117. R. Jiang and D. Chu, Rev. Sci. Instrum., 76, 6 (2005).
118. S. Muller, F. Holzer and O. Haas, J. Appl. Electrochem., 28, 9 (1998).
119. Y. Shen and K. Kordesch, J. Power Sources, 87, 1-2 (2000).
120. S. Muller, F. Holzer and O. Haas, in Batteries for the 21st Century, 1st ed., Editors: W. R. Cieslak and K. M. Abraham, p. 101, Electrochemical Society (1999).
121. J. X. Yu, H. X. Yang, X. P. Ai and X. M. Zhu, J. Power Sources, 103, 1 (2001).
122. C. Zhang, J. M. Wang, L. Zhang, J. Q. Zhang and C. N. Cao, J. Appl. Electrochem., 31, 9 (2001).
206. E. L. McFarland, J. L. Hunt and J. L. Campbell, Energy, Physics and the Environment, 3rd ed., Thomson, Toronto (2006).
207. A. C. Tolcin, US Geological Survey, http://minerals.usgs.gov/minerals/pubs/commodity/zinc/index.html, Accessed: February 10 2015 (Last updated: 2015).
208. P. H. Kuck, US Geological Survey, http://minerals.usgs.gov/minerals/pubs/commodity/nickel/index.html, Accessed: February 10 2015 (Last updated: 2015).
209. K. B. Shedd, US Geological Survey, http://minerals.usgs.gov/minerals/pubs/commodity/cobalt/index.html, Accessed: February 10 2015 (Last updated: 2015).
210. L. A. Corathers, US Geological Survey, http://minerals.usgs.gov/minerals/pubs/commodity/manganese/index.html, Accessed: February 10 2015 (Last updated: 2015).
211. B. W. Jaskula, US Geological Survey, http://minerals.usgs.gov/minerals/pubs/commodity/lithium/index.html, Accessed: February 10 2015 (Last updated: 2015).
212. T. D. Kelly and G. R. Matos, US Geological Survey, http://minerals.usgs.gov/minerals/pubs/historical-statistics/, Accessed: February 10 2015 (Last updated: 2014).
Appendix A: Simple and Intermediate Modeling of a Cell
A.1 Simple Zn-Air Cell
When people pitch new battery chemistries to investors, or anyone else that they
want to impress, they tend to quote the “theoretical” energy density of a given chemistry.
To calculate this, they conveniently ignore the cell casing, current collectors (metal foil that
the electrodes are stuck to), separators, electrolyte, electrode porosity, reaction products
and, thus, reality. Figure A-1 shows two such theoretical Zn-air cells, where Figure A-1B is
slightly more realistic than Figure A-1A in that it accounts for the expanded volume of the
reaction product (ZnO).
If Figure A-1A were a functional cell, it would have a gravimetric capacity density
(GCD) of
𝐺𝑟𝑎𝑣𝑖𝑚𝑒𝑡𝑟𝑖𝑐 𝐶𝑎𝑝𝑎𝑐𝑖𝑡𝑦 𝐷𝑒𝑛𝑠𝑖𝑡𝑦 (𝐺𝐶𝐷) =𝑛𝐹
𝑀𝑀∙
1
3.6 𝐶𝑚𝐴ℎ
=2∙96485
65.38∙3.6= 820𝐴ℎ
𝑘𝑔 . (A-1)
Here, MM is the molar mass and n is the moles of e- per mole of active material. To get the
volumetric capacity density, simply multiply by the density of the material (ρ):
𝑉𝑜𝑙𝑢𝑚𝑒𝑡𝑟𝑖𝑐 𝐶𝑎𝑝. 𝐷𝑒𝑛. (𝑉𝐶𝐷) = 𝐺𝐶𝐷 × 𝜌𝑍𝑛 = 820𝐴ℎ
𝑘𝑔× 7.14𝑘𝑔
𝐿= 5,850𝐴ℎ
𝐿. (A-2)
Figure A-1: Example of three different simple cell models. Both models A and B represent a Zn-air cell. Model A consists of only a piece of pure Zn metal, while model B consists of a solid block of pure ZnO, the discharge product of model A, which is larger. ZnO occupies the same space in a cell that was occupied by Zn, but this is not the case for Li in a Li-air cell as shown in model C. Model C shows the space where the
Li was before discharge and where the Li2O2 is formed after discharge in a non-aqueous Li-air cell.
Zn ZnO Li Li2O2
A B C
192
Finally, both of these values can be converted into energy densities by multiplying them by
the average cell potential (Vavg) for this chemistry, which in the case of Zn-air is 1.2 V:
In comparison to the ubiquitous LiCoO2 – Carbon, Li-ion battery that has a theoretical GED
of about 370 Wh/kg and a VED of about 1,370 Wh/L, these numbers for Zn-air are huge and
get bigger if one assumes they can coax the Vavg higher with additives or other tricks.
A slightly better approach to calculating a theoretical cell energy density is to take
reaction products into account. Often, active materials will change size when they are
cycled and space for them in the cell must be factored in to the model. ZnO is about 55%
larger than Zn, for example. The reaction products are also sometimes located in entirely
different areas of the cell. Li2O2 in a Li-air battery is actually formed inside the air electrode,
while the Li originates at the negative electrode as shown in Figure A-1C. Dealing with a
different material (ZnO, say) means the MM and ρ will change, which in turn changes the
Table A-1: Theoretical capacity and energy densities of various cell chemistries mentioned in this thesis. Since active materials change volume during cycling, each cell chemistry has two entries to better determine realistic values. The Li-ion cell ‘LiCoO2 – C’ is present for comparison to the current most important rechargeable technology in the world. The simple model ignores cell casing, current collectors, separators, electrolyte and electrode porosity. The intermediate model includes all of these things, but is still an ideal.
Discharged LiCoO2 - C 3.65 100 365 375 1,368 600 to 700
193
GCD, VCD, GED and VED. This still constitutes a “simple” model, but the difference between
considering a charged state of the cell and a discharged state is notable. Table A-1 shows
the theoretical capacity and energy quantities for several cell chemistries mentioned in this
thesis, as well as how performing the calculations with the discharged state of the active
materials changes the values. Table A-1 will be referred back to several times throughout
this text as the relevant section is covered.
A.2 Intermediate Zn-Air Cell
The best compromise between a theoretical cell capacity and reality is an
intermediate cell model that takes into account the cell casing, current collectors,
separators, electrolyte, electrode porosity and reaction products, which can be made in
Excel. In the case of Zn-air, the current collector could be a Sn-coated Cu foam with 97%
porosity, the separator could be something like Celgard 5550, which is 100 µm thick, the
electrolyte is assumed to occupy the pores of the electrodes and the thick separator, and the
Zn electrode porosity is about 50% to allow for expansion of the Zn into ZnO. In order to
compare this cell with common Li-ion cells, it is assumed that this Zn-air cell is being rolled
(wound) and inserted into an 18650 cell, which is 1.8 cm in diameter and 6.50 cm tall. In
the case of an 18650 cell, the jelly-roll to cell casing volume ratio is about 70.0 v%. Figure
Figure A-2: Schematic of the stack for the intermediate model of a Zn-air battery. The thick dashed line is the gap added to prevent evolved O2 bubbles from disturbing the O2 reduction electrode. In reality, the
entire stack would be mirrored before being rolled into a jelly-roll.
ZnO
Air Electrode + Gap Thickness, tAir
Zn Electrode Thickness, tZnO
Separator Thickness, tSep
Current Collector = Cu FoamPorosity of Foam, PCuFoam = 97%Porosity of ZnO, PZnO = 20%
Mass% ZnO = 95.5%, ρZnO = 5.6 g/cm3
Mass% PTFE = 2.8%, ρPTFE = 2.2 g/cm3
Mass% CMC = 1.7%, ρCMC = 0.5 g/cm3
Oxygen Reduction Electrode
Oxygen Evolution Electrode
194
A-2 shows the electrodes laid out flat before being rolled up, which is known as the “stack”.
Recently, Toussaint et al. have taken to using a separate electrode for the O2
reduction (Reaction (1-7)) and oxygen evolution (Reaction (1-17)) reactions to extend cycle
life.21 This works by avoiding support structure destruction and MnO2 dissolution as
discussed in Sections 1.9.1 (pg. 30) and 1.9.2 (pg. 31). They use a simple stainless steel
mesh as the O2 evolution electrode. Unfortunately, the O2 reduction electrode still suffers
support destruction if it is too close to the O2 evolution electrode so a gap is left between the
two, as shown in Figure A-2. That gap could be filled with a low weight structurally rigid
material that repels O2 bubbles but has holes large enough to allow the electrolyte to easily
flow through it, like PTFE. This is easily included in the model being explored here, as
shown in Figure A-2.
To mathematically determine the VEDCell within the intermediate model, the VCD’ZnO
of a ZnO electrode that is porous and contains binder is first calculated using
𝑉𝐶𝐷𝑍𝑛𝑂
′ =(𝑃𝐶𝑢𝐹𝑜𝑎𝑚 − 𝑃𝑍𝑛𝑂) ∙ 𝑚%𝑍𝑛𝑂 ∙ 𝐺𝐶𝐷𝑍𝑛𝑂
(𝑚%
𝜌 )𝑍𝑛𝑂
+ (𝑚%
𝜌 )𝐶𝑀𝐶
+ (𝑚%
𝜌 )𝑃𝑇𝐹𝐸
(A-5)
where P is porosity, wt% is the weight percent of the electrode material and ρ is the density.
This accounts for the fact that the volume of any electrode is not all active material. Note
that when the cell is charged, the ZnO will shrink as it becomes Zn and thus the porosity of
the negative electrode will increase to about 48% at full charge. To continue the model, the
VCDZnO′ is multiplied by the average discharge potential, fraction of cell canister volume
occupied by the jelly-roll, and then by the fraction of the thickness that is capacity-holding
ZnO:
𝑉𝐸𝐷𝐶𝑒𝑙𝑙 = 𝑉𝐶𝐷𝑍𝑛𝑂′ (𝑉𝐴𝑣𝑔) (
𝑉𝐽−𝑟𝑜𝑙𝑙
𝑉𝐶𝑎𝑛) (
𝑡𝑍𝑛𝑂
𝑡𝑍𝑛𝑂+𝑡𝐴𝑖𝑟+𝑡𝑆𝑒𝑝). (A-6)
Here, VAvg is the average discharge potential, VJ-roll is the volume of the jelly-roll, VCan is the
volume of the outside dimensions of the cell canister and the t’s are all thicknesses. Figure
195
A-3 shows the results of this model if the thickness of the stack is decreased in steps from
the maximum of 9 mm, and as the thickness of the air electrode is linearly increased (the x-
axis). Since only a whole number of stacks can fit in the 9 mm radius of the 18650, the
thickest electrodes would be 9 mm/1, 9 mm/2, 9 mm/3 and so on. A thicker stack
effectively represents a thicker ZnO electrode. Figure A-3 demonstrates that Zn-air cells
could, in theory, achieve large VEDs if the air electrode (and space) is kept thin. For
example, Zn-air button cells have Zn electrodes that are about 4 mm thick, so a stack of 4.5
mm with a 3.4 mm ZnO electrode and 1.0 mm air electrode would yield over 1,400 Wh/L.
However, even if the air electrode is granted a thickness approaching that of the ZnO
electrode the Zn-air cell could still deliver an impressive 1,000 Wh/L.
A.3 Simple Ni-Zn Cell
Ni-Zn cells are a little more challenging to model with the simple model. This is due
to the presence of the positive electrode, which was conveniently ignorable in the case of
Figure A-3: Volumetric energy density of a Ni-Zn 18650 cell using the intermediate model. Each successive line represents an increasing thickness of the ZnO electrode. The x-axis reflects an increasing
air electrode thickness, which includes the space meant to allow air bubbles to escape. The separator thickness was assumed to be 0.1 mm. Since an 18650 cell has a diameter of 18 mm, the maximum stack
thickness is the radius, 9 mm.
0
200
400
600
800
1000
1200
1400
1600
1800
2000
Ce
ll V
olu
me
tric
En
erg
yD
en
sity,
VE
DC
ell (W
h/L
)
0 1 2 3 4 5 6 7 8 9
Air Electrode Thickness, tAir (mm)
1.5 mm
1.8 mm 2.25 mm
3.0 mm 4.5 mm 9.0 mm
tStack = ...
196
the Zn-air cell. The GCDs and VCDs of the positive (+) and negative (-) electrodes are
determined by Equations (A-1) and (A-2). Then the individual electrodes’ GCD and VCD
values are combined via
𝐺𝐶𝐷𝐶𝑒𝑙𝑙 =𝑛𝐹
𝑀𝐶𝑒𝑙𝑙=
1
(1
𝐺𝐶𝐷++
1𝐺𝐶𝐷−
) (A-7)
and
𝑉𝐶𝐷𝐶𝑒𝑙𝑙 =𝑛𝐹
𝑉𝐶𝑒𝑙𝑙=
1
(1
𝑉𝐶𝐷++
1𝑉𝐶𝐷−
) (A-8)
to generate values for the cell as a whole: GCDCell and VCDCell. Here, n is the number of moles
of electrons stored in either of the two electrodes, F is Faraday’s constant, MCell is the mass
of the entire cell, and VCell is the volume of the entire cell, although these variables are only
shown for clarification purposes; only the right hand side of the equations were used to
generate the values in Table A-1. The GED and VED were then calculated by multiplying by
Vavg using Equations (A-3) and (A-4).
A.4 Intermediate Ni-Zn Cell
The intermediate model of a Ni-Zn cell is similar to that of the Zn-air cell. The main
difference is the fact that the thickness of the Ni electrode is determined by the thickness of
the zinc electrode since the two electrodes must hold a particular ratio of capacities.
Several cells in the literature use an abundance of Zn active material in case some Zn drifts
away and becomes electronically insulted from the current collector, although ideally, the
ratio of Zn to Ni active material capacity would be 1:1 in order to maximize the energy
density of the cell by avoiding the excess volume and weight of a Zn reservoir. In any case,
the thickness of the Ni electrode is
197
𝑡𝑁𝑖 =𝑉𝐶𝐷𝑍𝑛𝑂
′ ∙ 𝑡𝑍𝑛
𝑉𝐶𝐷𝑁𝑖′ ∙ 𝑅
(A-9)
where the t’s are thicknesses, the VCDXX′ s are volumetric capacity densities that were
calculated taking into account the electrode material recipe as in Equation (A-5), and R is
the Zn to Ni capacity ratio. A schematic of the stack is shown in Figure A-4.
Since researchers have historically added more Zn active material than necessary,
the intermediate model of the Ni-Zn 18650 cell was performed for a varying ratio, R, of Zn
to Ni capacities. The results are shown in Figure A-5. From the model it is evident that Ni-
Zn cells have the potential to achieve about half of the VED of a Zn-air cell (550 Wh/L). The
Figure A-4: Schematic of the stack for the intermediate model of a Ni-Zn battery. The current collectors for both electrodes are metal foams that permeate the electrodes and are assumed to have a 97 v%
porosity. The separator was assumed to be 100 µm thick.
Figure A-5: Volumetric energy density of a Ni-Zn 18650 cell using the intermediate model. The successive data sets are for decreasing stack thicknesses of 9 mm divided by 1, 5, 9 and 13. The capacity limiting
electrode is ZnO below R = 1, and Ni(OH)2 above R = 1.
ZnO
Ni Electrode Thickness, tNi
Zn Electrode Thickness, tZnO
Separator Thickness, tSep
Current Collector = Cu FoamPorosity of Foam, PCuFoam = 97%Porosity of ZnO, PZnO = 20%
Mass% ZnO = 95.5%, ρZnO = 5.6 g/cm3
Mass% PTFE = 2.8%, ρPTFE = 2.2 g/cm3
Mass% CMC = 1.7%, ρCMC = 0.5 g/cm3
Ni(OH)2Current Collector = Ni FoamPorosity of Foam, PCuFoam = 97%Porosity of Ni, PNi = 20%
Mass% Ni(OH)2 = 91%, ρNi(OH)2 = 4.1 g/cm3
Mass% PVDF = 2%, ρPVDF = 1.4 g/cm3
Mass% CoOOH = 5%, ρCoOOH = 4.9 g/cm3
Mass% C = 2%, ρC = 2 g/cm3
0.5 1 1.5 2 2.5 3
Capacity Ratio, R (QZn / QNi)
300
400
500
600
700
Ce
ll V
olu
me
tric
En
erg
yD
en
sity,
VE
DC
ell (W
h/L
)
1.8 mm
1.0 mm
0.7 mm
9.0 mm
tStack = ...
198
main benefit of Ni-Zn cells over Zn-air is the absence of air holes and, thus, water
management issues as discussed in Section 1.9.4 (pg. 33).
The LiCl and ZnCl2 are intended to be dissolved in the electrolyte, but for the purposes of
the simple model, where the goal is to obtain the highest energy densities possible, it will be
assumed that LiCl and ZnCl2 precipitate out as solids upon formation. As such, the capacity
densities of the positive (+) electrode in the charged state, where it is assumed the LiCl
precipitates out during charging, becomes a combination of both MnO2 and LiCl, and can be
calculated using
𝐺𝐶𝐷+ =𝑛𝐹
𝑀+=
𝐹
(𝑁∙𝑀𝑀)𝑀𝑛𝑂2+(𝑁∙𝑀𝑀)𝐿𝑖𝐶𝑙 and (A-13)
199
𝑉𝐶𝐷+ =𝑛𝐹
𝑉+=
𝐹
(𝑁∙𝑀𝑀
𝜌)
𝑀𝑛𝑂2
+(𝑁∙𝑀𝑀
𝜌)
𝐿𝑖𝐶𝑙
, (A-14)
where F is Faraday’s constant, n is the number of moles of e- stored in the electrode, MM is
the molar mass and N is the number of moles of substance per mole of electrons. For
instance, NMnO2= 2mol MnO2
mol e− . GCD− and VCD− were calculated using Equations (A-1) and
(A-2), while GCDCell and VCDCell were calculated using Equations (A-7) and (A-8), and finally,
GEDCell and VEDCell were calculated via Equations (A-3) and (A-4). The results are listed in
Table A-1. It is clear from the table that the LiMn2O4 – Zn cell has the lowest energy
densities of all the cell chemistries considered here. The advantage of this particular cell
chemistry would be a large cycle life, safety and low price, but whether or not its energy
density can realistically be high enough to be useful in things like cell phones depends on
how much volume the electrolyte requires since it must contain the dissolved LiCl and
ZnCl2. This can be explored using the intermediate model.
A.6 Intermediate LiMn2O4-Zn Cell
A schematic of the intermediate model stack for a LiMn2O4-Zn cell is shown in Figure
A-6. The electrolyte used by Yan et al. was made by dissolving in water: 3 M LiCl and 4 M
ZnCl2, and then adjusting the pH upward to pH 4 using LiOH.167 This means that adding
Figure A-6: Schematic of the stack for the intermediate model of a LiMn2O4-Zn cell. Although two current collectors are in the figure, mirroring the stack before rolling it means only one tCC need be considered.
more capacity to the cell requires adding more electrolyte or increasing the concentration
of the electrolyte. Since the maximum concentration of ZnCl2 and LiCl in water at 25°C is
31.7 M and 19.9 M, respectively, and since this cell requires 2 moles of LiCl for every mole of
ZnCl2, it is safe to assume that the LiCl concentration when the cell is in the charged state
will be the limiting factor if precipitation is to be avoided. The VCD of the electrolyte is
𝑉𝐶𝐷𝐸𝑙𝑒𝑐𝑡𝑟𝑜𝑙𝑦𝑡𝑒 =𝑛𝐹𝐶
1000𝑚𝐿
𝐿
, (A-15)
where F is Faraday’s constant, C is the concentration of the pertinent species (LiCl in this
case) and n is the number of moles of electrons per mole of species (1 in this case). The rest
of the calculations were done as in previous sections: Equations (A-1) and (A-5) were used
to calculate the VCD of Zn and MnO2 respectively. Given a fixed stack thickness, Equation
(A-9) (R = 1) was then used to calculate the thickness of the electrolyte, Zn and MnO2 layers.
Finally, the total VEDCell was calculated using Equation (A-6). The results of this
intermediate model are shown in Figure A-7 for an increasing concentration of LiCl and at
incremental stack thicknesses corresponding to the maximum, 9 mm, divided by 1, 5, 9 and
13.
Figure A-7: Volumetric energy density of a LiMn2O4 – Zn cell in the charged state using an intermediate model. The successive data sets are for decreasing stack thicknesses of 9 mm divided by 1, 5, 9 and 13.
The maximum concentration of LiCl in pure water at 25°C is about 20 M. Note that tStack = telectrolyte +
tZn + tMnO2+ tSep + tCC where tSep = 0.01 mm and tCC = 0.02 mm.
0 2 4 6 8 10 12 14 16 18 20
LiCl Concentration (M)
200
225
250
275
300
325
350
375
400
Ce
ll V
olu
me
tric
En
erg
yD
en
sity,
VE
DC
ell (W
h/L
)
0.7 mm1.0 mm
1.8 mmStack Thickness, tStack = ... 9.0 mm
201
Since the thicknesses of the separator (tSep) and current collector (tCC) are so thin,
the stack thickness does not strongly affect the volumetric energy density. Evidently, the
LiMn2O4-Zn cell modeled here could realistically obtain a maximum of about 375 Wh/L
before LiCl would start precipitating out, regardless of the electrode thicknesses. Instead,
the concentration of the electrolyte is far more important for this cell. No consideration for
issues with conductivity or freezing point associated with high concentrations has been
included in this model. In the unlikely case that high LiCl concentrations are not a problem,
particles precipitating out of electrolytes tend to clog vital pore volume in separators and
electrodes; thereby increasing the tortuosity of the path that must be taken by travelling
ions, which leads to an increase in cell impedance and a reduction in discharge potential
and rate capability. Hence, precipitation of LiCl (or ZnCl2) is best avoided if possible. If
precipitation is avoided, this technology could achieve about half the VED of a Li-ion cell
(LiCoO2 – C). This would limit the success of LiMn2O4-Zn cells in mobile devices, like cell
phones, where energy density is the more important than cycle life. However, the LiMn2O4-
Zn cell could excel in electric vehicles or grid energy storage where cycle life and cost/kWh
are the most important factors.
A.7 Simple Non-Aqueous Lithium Air (Li-Air) Cell
Currently, non-aqueous Li-air cells are attracting a lot of research money because
the GED of a Li-air cell calculated using the simple model of the charged state is nearly as
high as gasoline (10,400 Wh/kg), and stakeholders are led to believe that achieving an
energy density surpassing that of any other cell is likely. To clarify, the “Charged” entry in
Table A-1 treats both the air and Li electrodes as if they were in the charged state, in which
case the air electrode is empty and assumed to occupy no volume. The improved simple cell
model for a discharged Li-air cell calculated here demonstrates that expectations of energy
202
densities higher than gasoline are unfounded because the Li2O2 that precipitates during
discharge does so within the air electrode on the opposite side of the separator from
whence it came. Recall Figure A-1C. This means that volume within the air electrode must
be left vacant for when the Li2O2 precipitates. The “Discharged” entry in Table A-1 treats
the air electrode as if it is in the discharged state to account for the Li2O2 and the Li
electrode as if it is in the charged state to account for Li for the purposes of calculating
VCDCell and VEDCell. To make this calculation simpler, the air electrode in the discharged
state is assumed to be a solid block of Li2O2. Since the Li metal is not actually present in the
discharged state, the mass of the cell is determined solely by the Li2O2 and so the GCDCell and
GEDCell calculations for the discharged state are unmodified from the method used to
calculate the charged state of the Li-air cell. The equations used to calculate these simple
models have already been covered and include Equations (A-1) and (A-2) for each
electrode, and then (A-7), (A-8), (A-3), and (A-4) in that order. The results are listed in
Table A-1. It is apparent from this consideration of the discharged state of the Li-air cell
that energy densities approaching that of gasoline are pure fantasy.
A.8 Intermediate Non-Aqueous Li-Air Cell
Considering an intermediate model of the Li-air cell that includes the carbon
structure of the air electrode, porosity within the air electrode and diffusion limitations of
organic electrolyte are even more sobering. A schematic of the intermediate model stack is
shown in Figure A-8.
As an example of air electrode porosity, Xiao et al. claimed to have obtained the
highest capacity air electrode reported up until 2011 with a carbon structure that had a
porosity of 63%. Their air electrode would have to have either expanded when Li2O2
precipitated out inside the air electrode, or the Li2O2 ended up on the outside of the air
203
electrode in order for it to attain the claimed 15,000 mAh/g C. If the electrode expanded,
then after expansion the air electrode had a porosity of about 90%, assuming no volume
was left over for electrolyte and thus diffusion. Assuming an electrode needs a porosity of
about 20% for ions to diffuse through it, the volume left over for Li2O2 is about 70% of the
total volume of the electrode, which is likely a best case scenario. As such, the modified
𝑉𝐶𝐷𝐿𝑖2𝑂2
′ = (𝑃𝐴𝑖𝑟 − 𝑃𝐷𝑖𝑓𝑓)𝑉𝐶𝐷𝐿𝑖2𝑂2, (A-16)
where VCDLi2O2 is calculated using Equation (A-2), PAir is the porosity of the air electrode
itself and PDiffusion is the porosity that must remain after discharge for ions to diffuse through
the electrode and thereby allow the electrode to be charged again in the next cycle. The
stack thickness was calculated using Equation (A-9) given a particular Li negative electrode
thickness and that R = 1. The stack thickness was then used with Equation (A-6) to
calculate VEDCell. The results of this model for several porosities are shown in Figure A-9.
As Figure A-9 shows, even with the inclusion of the air electrode and Li2O2 reaction
products, Li-air cells appear to be able to deliver quite high volumetric energy densities.
However, one more consideration should be taken into account. Non-aqueous cells have the
weakness of having a low diffusivity for the primary charge carrier, Li+. The diffusion
constant, D, of Li+ in a typical non-aqueous electrolyte is about 10-6 cm2/s as compared to
that of OH− in water which is about 5.27×10⁻⁵ cm2/s.35 As such, non-aqueous Li-ion
Figure A-8: Schematic of the stack for the intermediate model of a Li-air cell. PAir refers to the overall porosity of the air electrode carbon structure while PDiffusion is the porosity that must be left empty in
order for ions to diffuse freely through the electrode. Mirroring the stack before rolling it means only half of a current collector (½tCC) need be considered. tCC and tSeparator were assumed to be 10 μm and 100 μm
respectively.
Air Electrode
Li
tAir
tLi
tSeparator
½tCC
Porosity, PLi = 0%Mass% Li = 100%, ρLi = 0.534 g/cm3
Porosities: PAir = Varies, PDiffusion = 20%
204
batteries have to keep their stack thicknesses below about 500 μm in order to keep currents
at useful rates whereas an aqueous cell using OH− can have a stack thickness as high as 2.5
cm and still achieve the same rate. This is why the x-axis in Figure A-9 only extends to
2,000 µm, whereas Figure A-3, Figure A-5 and Figure A-7 all have their x-axes extended to
the thickest stack thickness possible, 9,000 µm. Under the limitation of a 500 µm stack
thickness, Li-air can only achieve between about 1,000 and 1,400 Wh/L according to this
ideal model, which is essentially the same range possible with Zn-air.
It should be noted that the barriers to developing a long cycle life and safe Li-air
battery are still significant and include increasing the coulombic efficiency of the pure Li
metal along with preventing all of the following: electrolyte decomposition during charging,
Li dendrite growth, H2O or O2 from getting at the Li electrode, CO2 from poisoning the air
electrode, O2 bubbles from destroying the air electrode during charging, precipitated Li2O2
particles from losing contact with the OER catalyst, electrolyte evaporation, and Li from
being a safety hazard. This list is not exhaustive. These issues are instead mentioned for
context; compared to these, the issues facing Zn-air batteries are minor or the same in some
Figure A-9: VEDCell of a non-aqueous Li-air cell as the thickness of the Li electrode (tLi) is increased. This dependence has been calculated for increasing amounts of volume available within the air electrode for Li2O2 to precipitate out. tCC and tSep were assumed to be 10 μm and 100 μm respectively. Although the stack shown here is up to 0.2 cm thick, the maximum stack thickness for a non-aqueous Li-ion battery is
actually about 0.05 cm due to diffusion rate limitations.
0 0.02 0.04 0.06 0.08 0.1 0.12 0.14 0.16 0.18 0.2
Stack Thickness, tAir + tLi + 1/2tCC + tSep (cm)
600
800
1000
1200
1400
1600
1800
Ce
ll V
olu
me
tric
En
erg
yD
en
sity,
VE
DC
ell (W
h/L
)
40%
50%
60%
Air Electrode Volume Left for Li2O2 = 30%
70%
205
cases. Given these results, it seems unwise to invest capital in Li-air research in comparison
to Zn-air.
206
Appendix B: Permissions to Reprint Material from the Literature
The following e-mail was received in response to a permission request to reproduce the work
from P. Bonnick and J. R. Dahn, A Simple Coin Cell Design for Testing Rechargeable Zinc-Air or
Alkaline Battery Systems, Journal of the Electrochemical Society, 159, 7, A981-A989
(2012).147
Dear Patrick Bonnick, Thank you for your permission request. Since you are the author of the article, as per the ECS
Transfer of Copyright Agreement, you have the right to reproduce your own work. Please see part
"C" of the "Rights of Authors" section on the agreement: http://www.electrochem.org/dl/support/assets/crtf.pdf Please let me know if you have any questions, or if there is anything additional I can do to assist. -Logan Streu Logan Streu | Content Associate & Assistant to the CCO