NASA/TM-2001-209035 Development of a Mars Airplane Entry, Descent, and Flight Trajectory James E. Murray NASA Dryden Flight Research Center Edwards, California Paul V Tartabini NASA Langley. Research Center Hampton, Virginia \ \ \ V, January 2001 https://ntrs.nasa.gov/search.jsp?R=20010013134 2018-07-12T08:18:21+00:00Z
Telephone the NASA Access Help Desk at(301) 621-0390
Write to:
NASA Access Help Desk
NASA Center for AeroSpace Information7121 Standard Drive
Hanover, MD 21076-1320
NASA/TM-2001-209035
Development of a Mars Airplane Entry,
Descent, and Flight Trajectory
James E. Murray
NASA Dryden Flight Research Center
Edwards, California
Paul V Tartabini
NASA Langley Research Center
Hampton, Virginia
National Aeronautics and
Space Administration
Dryden Flight Research CenterEdwards. California 93523-0273
January 2001
NOTICEUse of trade names or names of manufacturers in this document does not constitute an official endorsement
of such products or manufacturers, either expressed or implied, by the National Aeronautics and
Space Administration.
Available from the following:
NASA Center for AeroSpace Information (CASI)7121 Standard Drive
Hanover, MD 21076-1320
(301 ) 621-0390
National Technical Information Service (NTIS)
5285 Port Royal Road
Springfield, VA 22161-2171(703) 487-4650
DEVELOPMENT OF A MARS AIRPLANE ENTRY,
DESCENT, AND FLIGHT TRAJECTORY
James E. Murray*
NASA Dryden Flight Research Center
Edwards, California
Paul V. Tartabini t
NASA Langley Research Center
Hampton, Virginia
Abstract Nomenclature
An entry, descent, and flight (EDF) trajectory profile Symbols
for a Mars airplane mission is defined as consisting of gthe following elements: ballistic entry of an aeroshell;supersonic deployment of a decelerator parachute; hg
subsonic release of a heatshield; release, unfolding, and
orientation of an airplane to flight attitude; and hAGL
execution of a pullup maneuver to achieve trimmed,
horizontal flight. Using the Program to Optimize
Simulated Trajectories (POST) a trajectory optimization Nproblem was formulated. Model data representative of a
specific Mars airplane configuration, current models of Pa
the Mars surface topography and atmosphere, and timeocurrent estimates of the interplanetary trajectory, were
incorporated into the analysis. The goal is to develop anEDF trajectory to maximize the surface-relative altitude VI
of the airplane at the end of a pullup maneuver, while VRsubject to the mission design constraints. The trajectory
performance was evaluated for three potential mission
sites and was found to be site-sensitive. The trajectory YIRV
performance, examined for sensitivity to a number of
design and constraint variables, was found to be most
sensitive to airplane mass, aerodynamic performance YR
characteristics, and the pullup Mach constraint. Based
on the results of this sensitivity study, an airplane-drag
optimized trajectory was developed that showed a
significant performance improvement.0
Subscripts
gravity on Earth
areographic altitude above the Mars
reference ellipsoid, m (fig. 3)
areographic altitude above the Martian
surface, m (as defined by MarsGRAM
2000)
newton
pascals
time offset of origin (POST programvariable)
inertial velocity, m/sec
velocity relative to the rotating planet(Mars), m/sec
MarsGRAM 2000 returns the atmosphere state variables
(temperature, pressure, and density), the surfaceelevation, and several subsidiary variables to POST.
This approach gives POST all the information necessary
to compute the air-relative state vector for the airplane
for any location on the planet at any time; all spatial,
seasonal, and diurnal atmospheric variations modeled
by MG2K are made available to the analysis.
Entry Interface State Vector
The interplanetary flight trajectory constrains the
range of available entry interface states, and thus the
range of sites on the planet accessible to the mission.
Entry interface was defined at an areocentric radius of
3527.20 km, and the range of available entry interface
state vectors was provided by reference 3. The entry
interface state vector (3 position components, 3 velocity
components) was supplied as a function of two
independent variables: the entry interface direction
angle. 0. and the entry interface inertial flightpath angle,
YIRV • The entry interface direction (or "clock")
angle. 0, is defined in figure 4, and Y1RV_ iS defined infigure 3.9 The entry interface cartesian state vector was
supplied in the Mars-centered inertial (MCI) system of
December 17. 2003, zero-hour GMT for a 0, YIRv,matrix defined by
For illustration purposes, the 0, YIRV, coordinate
system can be converted (internally by POST) to the
areocentric latitude and longitude coordinate system.
Figure 5 shows the transformation of the 0, YIRV,matrix supplied by Paul Penzo II into the equivalent
areocentric latitude, longitude matrix.
For entry interface times other than the specified zero-
hour GMT, the entry interface areocentric latitude
remains unchanged, but the entry interface longitude
changes owing to the rotational velocity of Mars. An
entry after zero-hour GMT would be further west; an
entry prior to zero-hour GMT would be further east. By
allowing the entry interface time to be offset from
zero-hour GMT, nearly the complete planet is made
accessible to the analysis. Entry time offset relative to
zero-hour GMT is modeled by the internal POST
variable timeo. Thus, within POST, the entry interface
state is completely specified by three independent
variables: 0. YIRV_' and timeo. This approach allowsthe analysis access to all sites available on the planet.
YIRVe, deg
--0----24 deg ---o---16 deg
-22 deg ---o-- -14 deg
---,----20 deg _-12 deg
-18 deg ---a--- -10 deg
.c 8oI::0
z 600 = -70 °"
'_ 40 0
'I=
f-O =-6o°
=-so_'_ o =- 40°
= -30 ° "_
= 30°-_o "
62o
= o
_-2o
"_ -4o
"0" -60
_ -80
0
0 =-1(
0= 10 °-
0
0=50
0 = -20 °
_0=0 o
_0= 20°40°
= 0_=60°
-20 0 20 40 60 80 100 120 140
Loncji_ude at entry interface, dog East000583
-100 o < 0 < 70 °
-24°-<YIRV <-12°
Figure 5. Entry interface areocentric latitude as a
function of entry interface longitude for entry at zero-hour GMT December 17, 2003.
6American Institutc of Aeronautics and Astronautics
Mass Properties
The mass of the complete system at entry (backshell,
heatshield, parachute assembly, and airplane) is 40 kg.
The mass of the heatshield, based on preliminary design
work, is 3.6 kg. Mass lost as a result of ablation of the
heatshield is not modeled. The mass of the airplane
alone is 18.0 kg.
Aerodynamics;
The aerodynamic model for the aeroshell included
only drag coeffÉcient and was the same as the
aerodynamic model used for the Mars 2001 lander, t4
The parachute used in this analysis was based on scalingthe parachute used in the Mars Pathfinder mission, 6
assuming an equal packing density. The inflated
diameter of the aeroshell parachute is 1.61 m, and thereference diameter for the aeroshell parachute is 2.53 m.
The aeroshell parachute aerodynamic model wasadapted from the Mars Pathfinder project work. For this
analysis, the model consists of three parts: the basicdrag coefficient, 10 one scale factor as a function ofMach number,16 and a second scale factor as a function
of deployment time (parachute inflation dynamics). The
drag coefficient used by POST is the product of allthree.
.9
.8E.7
_..5_.4U
,I::.3_.2
.1
Unlt Reynolds 1_ 4 Machnumber,1/m number ooo584
Figure 6. Airplane lift coefficient model.
in drag coefficient and a drop in lift coefficient at the
increased Mach numbers and reduced unit Reynolds
numbers. Mach number and unit Reynolds number are
functions of atmospheric state variables as well as true
airspeed. For the wide variation in atmospheric
conditions on the planetary scale considered in the
analysis, a wide variation in flight Mach number and
Reynolds number is possible, even at the same true
airspeed flight condition.
The airplane aerodynamic model was developed
using a combination of computational fluid dynamics
codes, wind tunnel tests, and engineering judgment. The
resulting aerodynamic model lift and drag coefficients
were a function of flight condition (Mach number, unit
Reynolds number), control surface deflection, and angle
of attack. Because the EDF analysis used only the 3-
DOF (translational) equations of motion, aircraft pitchdynamics were not modeled. Thus, the dependency on
control surface deflection and angle of attack was
removed, and only the dependency on flight condition
was retained, resulting in lift and drag coefficients astwo-dimensional tables of Mach number and unit
Reynolds number. The lift coefficient value at each table
entry was the maximum usable lift coefficient (90
percent of the maximum trimmed lift coefficient) at the
corresponding flight condition (Mach number, unit
Reynolds number), and is shown in figure 6. This lift
coefficient value was selected to provide high lift during
the pullup maneuver, while still giving a measure of stall
margin. The drag coefficient value at each table entry
was the drag coefficient at the maximum usable lift
coefficient, and is shown in figure 7.
For the flight envelope considered, both the lift and
drag coefficients are strong functions of both Mach
number and unit Reynolds number; there is a steep rise
Based on engineering judgment, the time required for
the airplane to unfold from its stowed configuration was
set to 1.0 sec, and the time required for the airplane to
maneuver to a wings-level attitude in preparation for
executing the pullup maneuver was set at 5.0 sec.
During airplane unfolding and orientation, the airplane
is modeled as having zero lift coefficient and the drag
coefficient shown in figure 7. During the pullupmaneuver, the airplane is modeled as having the lift
coefficient shown in figure 6 and the drag coefficient
.18
.16
.14"_ .12
.10O .0ecn.06
.04
.02
4 1.0
11_ 4Un'flReynolds 0"_-..2 '4 Machnumber, l/m number ooose5
Figure 7. Airplane drag coefficient model.
7American Institute of Aeronautics and Astronautics
shown in figure 7. The lift coefficient makes an abrupt
(step) transition between the orientation maneuver and
the pullup maneuver.
Results of the Baseline Trajectories
Three potential mission sites were studied in this
analysis: Parana Valles (PV) at approximately 25 ° S and
11 ° W, Acidalia Planitia (AP) at approximately 55 ° N
and 27 ° W, and Hellas Planitia (HP) at approximately
38 ° S and 63 ° E. In the context of this analysis, the site
latitude and longitude are those values at the end of the
trajectory. The PV site was selected for its value to the
scientific community. The AP and the HP sites were
identified through a planetwide search for a global
maximum of hAGLf. The existence of a number of localterrain features with low site topography (for example,
impact basins, craters) makes such a planetwide search
sensitive to the initial value of the control vector
(specifically 0, YtRV, and timeo) used in the analysis,
and susceptible to convergence to a local maximum
rather than the global maximum. Hence, a wide range of
initial values was used, guided by an existing
topographical map of the planet. 17 In the Northern
Hemisphere, the search was conducted for all longitudes
and latitudes between 35 ° N and 55 ° N, and yielded two
local maxima; the largest local maximum found was the
AP site. The Southern Hemisphere was searched only
within the Hellas basin, the dominant depression in that
hemisphere. Two local maxima were identified within
the Hellas basin and the best site was selected.
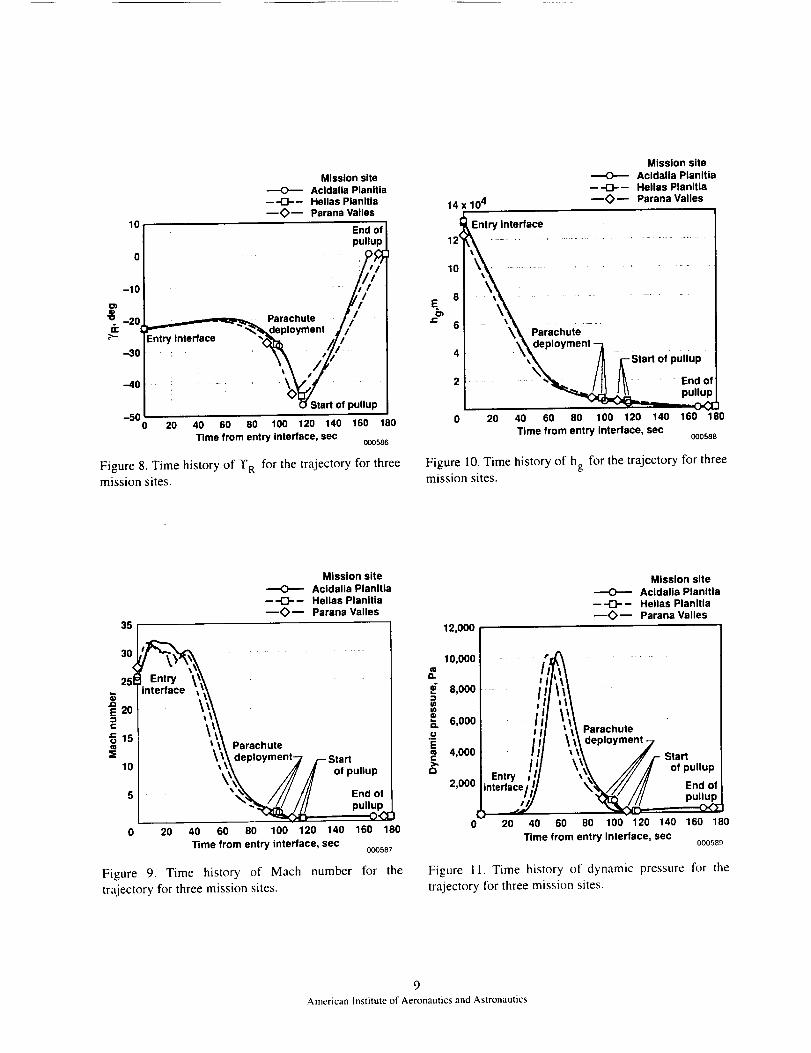
Figures 8 through 11 show time histories of the EDF
trajectory for these three mission sites. On each figure,
the symbols denote the points along the trajectory where
significant mission events occur. The trajectories for the
three sites show a number of similarities. Each
trajectory starts at an YR_ near -22 ° (fig. 8), the lower
boundary on the YR_ constraint. The trajectory Mach
number (fig. 9), hg (fig. 10), and dynamic pressure
(fig. 11) profiles during the hypersonic and supersonic
flight regimes are largely a function of YR¢' and are
similar in profile. Some site-specific differences are
evident, however. The value of YR at the start of the
pullup maneuver (fig. 8) varies among the sites, the time
required to execute the pullup maneuver also is shorter
for the AP site than for the other two sites.
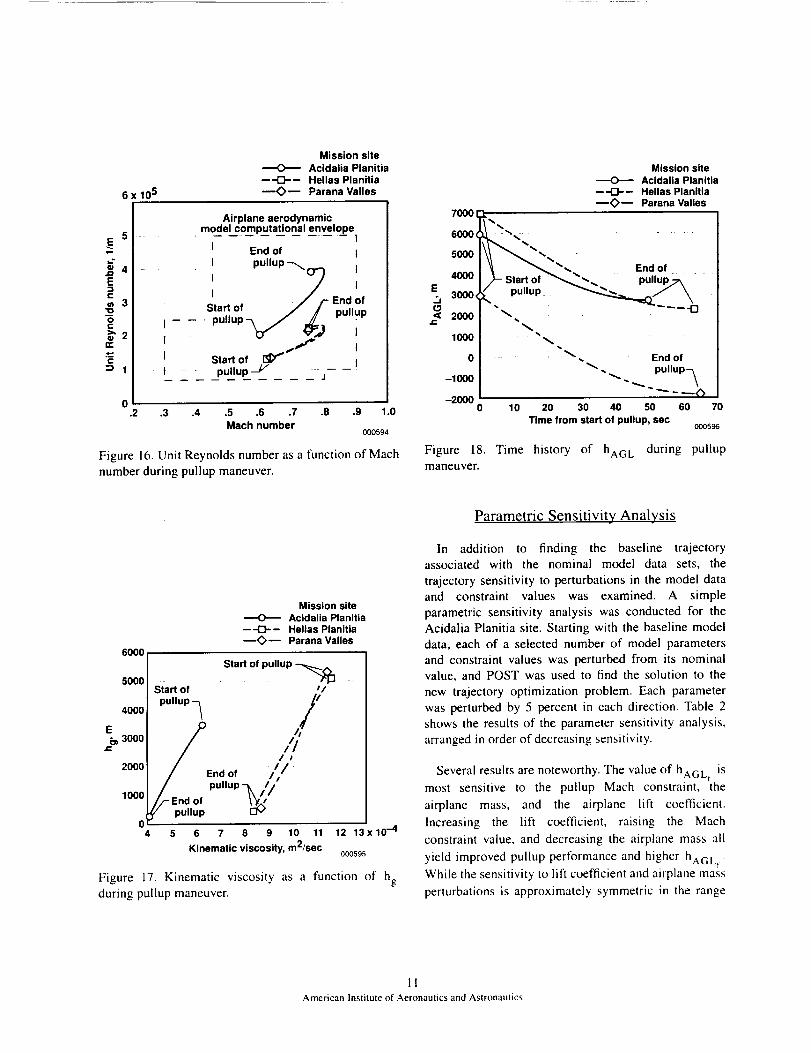
Figures 12 through 18 show a detailed view of the
pullup maneuver for each of the three trajectories. Note
that the time scales have been shifted so that they start
with initiation of the pullup maneuver. The trajectoriesfor the HP and PV sites are similar and the AP site is
significantly different. Most notably, even though the
pullup maneuver starts at a steeper YR for the AP site,the pullup maneuver for the AP site takes significantly
less time (fig. 12), and thus achieves less net altitude
loss during the pullup maneuver (fig. 14) as compared to
the HP and PV sites. The pullup maneuver at the AP site
is executed with less net altitude loss largely because of
its increased lift during the pullup maneuver (fig. 15);
increased lift rotates the velocity vector more quickly
toward "_'R = 0. The higher lift is largely a result ofimproved airfoil lift performance at the increased
Reynolds numbers achieved at the AP site (fig. 16); the
increased Reynolds numbers are largely caused by
reduced temperature and resulting reduced kinematic
viscosity (fig. 17) at this Northern Hemisphere site.
While figure 14 presents the altitude with respect to
the Mars reference ellipsoid, hg, figure 18 presents the
altitude with respect to the Mars local surface, hAG L .
The relatively low surface topography at both the AP
and the HP sites yield hAGLf values in excess of2000 m, The relatively elevated surface topography at
the PV site yields a negative value for hAGLt; thetrajectory at the PV impacts the Mars surface before
completing the pullup maneuver.
Summary information for the three potential mission
sites studied is presented in table 1.
Table 1. Summary characteristics of three
potential mission sites.
Mission site hg, m hAGL_, m
Acidalia Planitia 263 2745
Hellas Planitia 420 2327
Parana Valles 549 -1803
8American Instituteof Aeronautics and Astronautics
considered, the sensitivity to the value of the pullup
Math constraint is asymmetric.
The direction of the sensitivity to airplane drag
coefficient requires comment. Increasing the airplane
drag coefficient by 5 percent helps to limit the airspeedand Mach number buildup during the pullup maneuver.
This allows the pullup maneuver to be initiated at an
increased altitude where atmospheric density (and hence
aerodynamic forces) is less. The increased drag
coefficient compensates for the reduced density to keepthe Mach number below the constraint limit, and the
result is an increased hAGLf.
Increasing the total entry mass yields a net increase in
altitude. The entry system with the higher mass (that is,
higher ballistic coefficient) experiences lower
deceleration as a result of aerodynamic drag, and it
carries further downrange. The system with higher mass
attains parachute deployment at a shallower YR, the
pullup maneuver requires less altitude, and a higher
hAGLt results. Sensitivities to the remaining parametric
variations are small in magnitude.
Airplane-Drag Optimized Trajectory Design
The preceding sensitivity analysis results show that
increasing the drag coefficient of the airplane during the
pullup maneuver yields an improvement in hAGLI. Thesensitivity study results indicate the direction for
performance improvement, but do not indicate the
magnitude of the drag increment or the maximum
performance increment that is achievable by increasing
the drag coefficient. To address these issues, the original
problem formulation was modified to give an airplane-
drag optimized trajectory design formulation.
The physical mechanism used for adding drag to the
airplane was unimportant for this design iteration.Modest amounts of drag could be added with dive
brakes; larger amounts of drag could be added with a
drogue parachute; both drag and lift could be added
with a flapped airfoil. For this analysis, the drag
increment was cast in a generic form as a drag
coefficient multiplier; the magnitude of the multiplier
resulting from the analysis would then suggest the
physical mechanism to be implemented.
First, the original optimal control vector was
augmented with the inclusion of
• Airplane drag coefficient multiplier
° Release time for the drag multiplier, relative to the
start of the pullup maneuver
The second element was added to the optimal control
vector to model release of the drag-producing
12American Institute of Aeronautics and Astronautics
mechanism partway through the pullup maneuver, and
to allow POST to select the optimal release time. The
objective fimction and the constraints remained
identical to the original problem formulation.
Only the AP site was studied in this analysis. For the
new problem formulation, the optimal drag coefficient
multiplier was 3.02 and the optimal release point for the
drag device was at a Mach number of 0.77. For
illustration purposes, this drag coefficient increment can
be converted to an equivalent drogue parachute to be
attached to the airplane. It is equivalent to that of a DGB
parachute with a drag coefficient of 0.55 and an inflated
diameter of 0.38 m, or about 37 percent of the airplane
wingspan.
Time history results for the AP site are shown in
figures 19 through 23. The large drag increment has a
strong impact on the whole trajectory design.
The optimal YIRV becomes much shallower, risingfrom -22 ° for the baseline trajectory design to -17.6 °
for the airplane-drag optimized design as shown in
figure 19. The shallower entry reduces the maximum
deceleration from 20 Earth g to 14 Earth g, as shown in
figure 20, and stretches the time for the EDF trajectory
from 160 sec to 220 sec.
Compared to the baseline design, the airplane-drag
optimized design starts at a higher hAG L as shown in
figure 21, a higher Mach number as shown in figure 22,
and a higher dynamic pressure as shown in figure 23.
Although the atmospheric density is reduced at the
increased hAG L , the additional airplane drag keeps the
Mach number below the constraint limit throughout the
pullup maneuver, allowing the start of the pullup
maneuver to rise from an hAG L of 61300 m for the
baseline design to 9400 m for the airplane-drag
optimized design. The Mach number reaches the
constraint limit twice during the pullup maneuver; once
while the additional drag is present, and again after the
additional drag is released. Throughout most of the
pullup maneuver, the dynamic pressure is lower for the
airplane-drag optimized design than for the baseline
design. Consequently, the aerodynamic lift is lower, and
more altitude is consumed in performing the puilup
maneuver for the airplane-drag optimized design than
for the baseline design. However, because the pullup
maneuver is initiated at an increased altitude, hAGLtrises from 2745 m for the baseline design to 4477 m for
the airplane-drag optimized design.
0
-5
-10
-15
-20•D -25
::_ -30
-35
-40
-45
-50
Baseline
---C)--- Airplane-drag optimized
End of
//-%Tr,,ce pu,,up-7- ,/
y_:u---. / /Aeroshell %./ ,//• V ,"
(_/ pullup
50 100 150 200 250
Time from entry interlace, sec 000597
Figure 19. Comparison of time histories of T R for thebaseline and airplane-drag optimized trajectories tbrthe AP mission site.
2O
Baseline
----D-- Airplane-drag optimized
o_16J¢
14
¢_12= II I i- Aeroshell
10 I_ _t ]_ parachute
u 8 // \ /I deployment
° t!\it ,"o 6ill_" 4 i-Entry //--Start of pullup
_ interface I t.
0 50 100 150 200 250
Time from entry interface, sec 0o0598
Figure 20. Comparison of time histories ofacceleration for the baseline and airplane-drag
optimized trajectories for the AP mission site.
13American Institute of Aeronautics and Astronautics
10,000[
9,000
8,000
E 7,000
O 6,000(<t
.1¢
5,000
4,000
3,000
2,000
---O---- Baseline---'(2-- Airplane-drag optimized
%%
% %%%, "_, _-- Airplane'_, \ parachute
_- Start of "%_.<releaseI pullup End of
_. pullup -7End O|
10 20 30 40 50 60 70 80 90Time from start of pullup, sec
000599
Figure 21. Comparison of time histories of hAG L for
the pullup maneuver for the baseline and airplane-drag
optimized trajectories for the AP mission site.
300
Baseline---1:3--- Airplane--drag optimized
al(a.
.=
in
Q.
tJ
al
CI
280
260
240
220
200
180
160
140
120_
100
End of
/ End of / pullup "-'1
/ pullup --I _.__. _
/ .... ......// -
/_" _'''-- Llrplane
rP_lra::$te
10 20 30 40 50 60 70 80 90
Time from start of pullup, sec_0_1
Figure 23. Comparison of time histories of dynamic
pressure for the pullup maneuver for the baseline and
airplane-drag optimized trajectories for the AP mission
site.
Conclusions
.90
-----O--- Baseline---(3-- Airplane-drag optimized
.85
.80
.75E==.r0JZU
.65
.60 _
.55
.5O
End of/-- Start of -,uilup
J pullup 7
,/ z_ Airplane puliup/ parachute
release
Start of
pullup
10 20 30 40 50 60 70 80 90
Time from start of pullup, sec000600
Figure 22. Comparison of time histories of Math
number for the pullup maneuver for the baseline and
airplane-drag optimized trajectories for the AP
mission site.
For the trajectory optimization problem formulated,
and for using the model data representative of this Mars
airplane configuration, the models of the Martian
surface topography and atmosphere, and the estimates
of the entry state vector, the following conclusions were
drawn:
1. For all sites considered, the optimal trajectories
were driven to the steepest allowable entry
flightpath angles. Parachute deployments occurred
between 5 and 7.5 kilometers above the surface
and at Mach numbers ranging from 1.7 to 1.9. The
pullup maneuver required several kilometers of
altitude to execute, as a result of the low available
lift coefficient at the transonic, low-Reynolds-
number flight condition.
2. The performance of the EDF trajectory is very site-
sensitive for two primary reasons. The wide
variation in surface topography on the planetary
scale considered has a direct effect on hAGLt.Additionally, the wide variation in atmospheric
conditions on the planetary scale considered
results in a similarly wide variation in flight Mach
number and Reynolds number, even at the same
true airspeed flight condition. The aerodynamic
performance of the airplane is a strong function of
14
American Institute of Aeronautics and Astronautics
both lift and drag coefficients; hence the additional
sensitivity of hAGLr tO the site considered. For the
best-performing site (Acidalia Planitia), hAGLfwas 2745 m above the surface; for the poorest-
performing site (Parana Valles), it was impossible
to complete the pullup maneuver before surfaceimpact.
3. The sensitivity analysis showed that hAGLf wasmost sensitive to the mass and aerodynamic
characteristics of the airplane, and the pullup Mach
constraint. Both decreasing the airplane mass and
increasing the maximum available lift coefficient
yielded large improvements in hAGLr. Relaxingthe maximum Mach number constraint on the
airplane during the pullup maneuver also yielded a
large improvement, while tightening this constraint
by the amount studied made it impossible to
execute the puIlup maneuver before surface impact.
Increasing the drag coefficient of the airplane
during the pullup maneuver yielded a significant
increase in hAGLI. The increased drag coefficient
allowed the pullup maneuver to be started at an
increased altitude while still maintaining the samemaximum Mach number limit.
4. The airplane drag-optimized trajectory design isfundamentally different than the baseline
trajectory design. For the drag-optimized
trajectory the optimal entry flightpath angle is
shallower, the parachute deployment occurshigher, the pullup maneuver starts at a shallower
flightpath angle, and the whole trajectory takes
longer to execute. The result is a significantperformance improvement over the baseline
design; hAGL, rose from 2745 m to4477 m.
References
1Reed, R. Dale, "High-Flying Mini-Sniffer RPV:Mars Bound'?," Astronautics and Aeronautics, vol. 16,
no. 6, June 1978, pp. 26-39.
2Clarke, V. C., Jr., A. Kerem, and R. Lewis, A MARS
Airplane...Oh Really?, AIAA paper 79-0067, January1979.
3Anonymous, Study of Advanced Atmospheric EntrySystems for Mars, NASA CR-157548, July 1978.
4Colozza, Anthony J., Preliminary Design of a
Long-Endurance Mars Aircraft, NASA CR-185243,April 1990.
5Anonymous, Aerospace Vehicle Design, Spacecraft
Section, Volume 3, NASA CR- 184743, May 1988.
6Bouras, Peter and Tim Fox, An Autonomous Flying
Vehicle for Mars Exploration, AIAA paper 90-3235,September 1990.
7Hall, David W., Robert W. Parks, and Dr. Steve
Morris, "Conceptual Design of the Full-Scale VehicleDesign, Construction, and Test of Performance andDeployment Models (Final Report)," May 27, 1997,David Hall Consulting, 1111 West El Camino Real,Suite 109, Sunnyvale, California, at websitehttp://www.rcdpeace.org, viewed October 16, 2000 atWeb page titled Visit to the Red Planet.
8Smith, S. C., A. S. Hahn, W. R. Johnson, D. J.
Kinney, J. A. Pollitt, and J. R. Reuther, The Design ofthe Canyon Flyer, An Airplane for Mars Exploration,AIAA paper 2000-0514, January 2000.
9Brauer, G. L., D. E. Cornick, and R. Stevenson,
Capabilities and Applications of the Program to
Optimize Simulated Trajectories (POST). ProgramSumma O, Document, NASA CR-2770, February 1977.
l°Peng, Chia-Yen, Jet Propulsion Laboratory,
unpublished personal communication, May 1999.
I IPenzo, Paul A., Senior Engineer, Navigation and
Mission Design Section, Jet Propulsion Laboratories,unpublished personal communication, September 1999.
12Sergeyevsky, Andrew B., Gerald C. Snyder, andRoss A. Cuniff, Interplanetary Mission DesignHandbook, Volume L Part 2: Earth to Mars
Ballistic Mission Opportunities, 1990-200_5, JPLPublication82-43, September 15, 1983. NASA STIArchives, 1984.
13Knacke, Theo W., Parachute Recovery SystemsDesign Manual, NWC TP 6575, March 1991.
I')Braun, Robert D., Richard W. Powell, E McNeil
Cheatwood, David A. Spencer, and Robert A. Mase, TheMars Surveyor 2001 Lander: A First Step TowardPrecision Landing, IAF-98-Q.3.03, September 1998.
15Justus, C. G. and B. F. Jarvis, Mars Global
Reference Atmospheric Model (Mars-GRAM)Version3.8: User's Guide, NASA TM-1999-209629,
May 1999.
16Fallon, Edward J. II, System Design Overview of theMars Pathfinder Parachute Decelerator Subsystem,AIAA-97-1511, 1997.
lTBatson, R. M., E M. Bridges, and J. L. Inge, Atlas
of Mars." the 1:5,000,000 Map Series, NASA SP-438,1979.
15American Institute of Aer(_nauticsand Astronautics
REPORT DOCUMENTATION PAGE Form ApprovedOMB No. 0704-0188
Pui_ic reporting burden for Ihis collection ot informahon is estimated to average 1 hour per response, including the time for reviewing instructions, searching exishng data sources, gathering andmaintaining the data needed, and completing and reviewing the collection ol information Send comments regarding this burden estimate or any other aspect ol this collection of information,including suggestions for reducing this b_Jrden,toWashington Headquarters Services, Directorate for information Operations and Re _orts. 1215 Jefferson Davis Highway. Sude 1204. Arlington.VA 22202-4302, and Io the Offcce of Management and Budget, Paperwork Reduction Projecl (0704-0188). Washington. DC 20503
1. AGENCY USE ONLY (Leave blank) 2. REPORT DATE 3. REPORT TYPE AND DATES COVERED
January 2001 Technical Memorandum
4.TITLE AND SUBTITLE
Development of a Mars Airplane Entry, Descent, and Flight Trajectory