SANDIA REPORT SAND2008-7045 Unlimited Release Printed October 2008 Development of a Model Colloidal System for Rheology Simulation Nelson Bell, David Tallant, Martin Piech, P.R. Schunk, Amalie Frischknecht Prepared by Sandia National Laboratories Albuquerque, New Mexico 87185 and Livermore, California 94550 Sandia is a multiprogram laboratory operated by Sandia Corporation, a Lockheed Martin Company, for the United States Department of Energy’s National Nuclear Security Administration under Contract DE-AC04-94AL85000. Approved for public release; further dissemination unlimited.
Transcript
SANDIA REPORT SAND2008-7045 Unlimited Release Printed October 2008
Development of a Model Colloidal System for Rheology Simulation Nelson Bell, David Tallant, Martin Piech, P.R. Schunk, Amalie Frischknecht Prepared by Sandia National Laboratories Albuquerque, New Mexico 87185 and Livermore, California 94550 Sandia is a multiprogram laboratory operated by Sandia Corporation, a Lockheed Martin Company, for the United States Department of Energy’s National Nuclear Security Administration under Contract DE-AC04-94AL85000. Approved for public release; further dissemination unlimited.
Issued by Sandia National Laboratories, operated for the United States Department of Energy by Sandia Corporation. NOTICE: This report was prepared as an account of work sponsored by an agency of the United States Government. Neither the United States Government, nor any agency thereof, nor any of their employees, nor any of their contractors, subcontractors, or their employees, make any warranty, express or implied, or assume any legal liability or responsibility for the accuracy, completeness, or usefulness of any information, apparatus, product, or process disclosed, or represent that its use would not infringe privately owned rights. Reference herein to any specific commercial product, process, or service by trade name, trademark, manufacturer, or otherwise, does not necessarily constitute or imply its endorsement, recommendation, or favoring by the United States Government, any agency thereof, or any of their contractors or subcontractors. The views and opinions expressed herein do not necessarily state or reflect those of the United States Government, any agency thereof, or any of their contractors. Printed in the United States of America. This report has been reproduced directly from the best available copy. Available to DOE and DOE contractors from U.S. Department of Energy Office of Scientific and Technical Information P.O. Box 62 Oak Ridge, TN 37831 Telephone: (865) 576-8401 Facsimile: (865) 576-5728 E-Mail: [email protected] Online ordering: http://www.osti.gov/bridge Available to the public from U.S. Department of Commerce National Technical Information Service 5285 Port Royal Rd. Springfield, VA 22161 Telephone: (800) 553-6847 Facsimile: (703) 605-6900 E-Mail: [email protected] Online order: http://www.ntis.gov/help/ordermethods.asp?loc=7-4-0#online
Development of a Model Colloidal System for Rheology Simulation
Nelson Bell, David Tallant, P.R. Schunk, Amalie Frischknecht Sandia National Laboratories
P.O. Box 5800 Albuquerque, New Mexico 87185
Martin Piech
United Technologies Research Center 411 Silver Lane, MS129-22
East Hartford, CT 06108
ABSTRACT The objective of the experimental effort is to provide a model particle system that will enable modeling of the macroscopic rheology from the interfacial and environmental structure of the particles and solvent or melt as functions of applied shear and volume fraction of the solid particles. This chapter describes the choice of the model particle system, methods for synthesis and characterization, and results from characterization of colloidal dispersion, particle film formation, and the shear and oscillatory rheology in the system. Surface characterization of the grafted PDMS interface, dispersion characterization of the colloids, and rheological characterization of the dispersions as a function of volume fraction were conducted.
3
4
CONTENTS TITLE ......................................................................................................................3 ABSTRACT ......................................................................................................................3 ACKNOWLEDGEMENTS.................................................................................................4 INTRODUCTION ...............................................................................................................6
Synthesis of Model Particles....................................................................................9 Particle Dispersion.................................................................................................18 Particle Interaction .................................................................................................21 Rheological Characterization.................................................................................25 Ocillatory Characterization....................................................................................31
Introduction The initial project discussions focused on identifying a model particle system in which the particle surfaces could be modified with a polymer layer. The polymer layer and its environment needed to be accurately modeled by the computational effort, and therefore polymers with readily available force field models were discussed. Based on initial discussions, modeling of polydimethylsiloxane (PDMS) polymers were preferred due to the immediate availability of computational parameters. The experimental effort also has a supply of spherical, monodisperse silica particles suitable for use as a model dispersion. A silica dispersion in a low molecular weight silicone oil was chosen as the experimental system for testing. Surface modification of the silica with PDMS chains was performed in order to create stable dispersions which can be related to prior literature as well as be simulated using computational models. There are several examples of materials processing using PDMS surface coatings for dispersion. Niwaz and Neergaard showed that PDMS layers can be used with commercial ceramic materials for dispersion and rheology modification, and can achieve upper limit solids loadings of 60 volume %.1 Several studies have investigated dispersion of nanoparticles in polymer melts for use in optical or other applications.2 For example, silica in polydimethylsiloxane (PDMS) was examined by Rajan et al.,3 in which nanoparticles were formed within the polymer network to create reinforcement of mechanical properties with transparency. However, these nanoparticles acted as crosslinkers of the polymer end functionalities, and were not fluid dispersions. Stevenson et al. presented cobalt nanoparticles in polydimethylsiloxane fluids for use as magneticly directed fluids in biological applications.4 These studies used tri-block copolymers to create large steric layers for 7-18 nm diameter nanoparticles. PDMS surface coatings have also been applied for fundamental study of particle suspension rheology. Spherical particles modified with PDMS surface coatings and dispersed in low molecular weight silicone oil or PDMS solvents were among the initial particle systems used for understanding suspension rheology. Everett and Stageman were among the first to examine the stability of polymethylmethacrylate (PMMA) particles with polydimethylsiloxane (PDMS) surface polymer coatings in n-alkanes (a good solvent), primarily for the upper and lower cloud point of the stabilized particles.5 Choi and Krieger characterized dispersion and rheology of PMMA spheres with PDMS surface coatings in low molecular weight silicone oil.6 The surface structure of their model system was based on adsorption of a triblock copolymer of PDMS-PMMA-PDMS, and the surface thickness of the PDMS layer significantly varied based on the solvent. In alkanes the layer was compressed, but in silicone oil it was extended. The density of surface chains was not examined in these initial reports, but surface coverage or density is a critical parameter related to the surface conformation of the polymer layer and wetting of the solvent or polymer melt. Auroy et al. examined dispersion for surface layers of weak (i.e. low) and strong (i.e. high) grafting density.7 They reported that particle stabilization requires a layer thickness greater than the radius of gyration Rg of the polymer melt, short chains do not stabilize particles in the polymer melt, and that strong grafting is needed for dispersion in alkanes or other good solvents for the PDMS layers.
6
Dispersion of model colloids in solvent systems is focused on development of a repulsive interaction between particles to prevent particle agglomeration, in order to induce stability. The forces between particles include the van der Waals attraction and either electrostatic or steric repulsion interactions. Using a silicone oil medium requires surface modification to allow surface wetting of the initially hydrophilic particles, and this process operates by reaction with surface hydroxyl groups. Hence, surface charging effects should be minimal. The grafting of polymer PDMS layers creates a steric barrier to particle agglomeration in the system. The structure of the grafted layer becomes more important in polymer melts than in solvents. Dispersion of particles in polymeric systems requires treatment of the van der Waals forces but the stabilization mechanism is different than in solution systems, as the enthalpic-entropic interactions of the bound and free polymers play a more important role in the interparticle energy.8 In elastic-steric stabilization, the molecular weight of the absorbing polymer must exceed the free polymer molecular weight to prevent autophobic dewetting interactions.9 The grafting density for surface polymers on nanoparticles is an important parameter, as Hasegawa et al. showed that high grafting density can cause attractive interactions between particles in a polymer melt.10 There is an optimum grafting density where the model nanoparticles experience a weak van der Waals attractive well but do not exhibit dewetting between the bound polymer and free chains in the melt. Yezek et al. examined the graft density and length effects in polymer melts, finding that large grafted polymers exhibit complex swelling interactions with the melt polymers, and low density brushes of short length were predicted to have less swelling and a steep repulsive interaction potential, through brush collapse to the particle surface.11 However, even low density, mushroom-type steric layers create interparticle forces which resist particle agglomeration.12 Using a low molecular weight PDMS oil as a carrier medium allows for treatment of the bound layers as a good solvent. Using self-consistent field theory (SCFT), it is possible to model the repulsion between particles due to the steric layer and thereby gauge the importance of van der Waals and steric length between average nanoparticles. An additional challenge in choosing a good surfactant, beyond the need for particle dispersion, is the impact of the surfactant layer on the effective particle volume fraction φeff,
3
1 ⎟⎠⎞
⎜⎝⎛ +=
Reffδφφ , (1)
where δ is the thickness of the stabilization layer, R is the average particle radius, and φ is the true volume fraction based on the particle core. The additional volume occupied due to the required range of the stabilization mechanism (electrostatic or steric) lowers the maximum packing fraction of the system. This stabilization distance δ is primarily dictated by the range of the van der Waals interaction, and is set to a range where interactions are of the order of the thermal energy in the system (i.e. ~1 kT units). A surfactant must not only prevent particles from being in contact, but it must also minimize the separation distance between particles if high solid content of the solid phase is desired such as in structural composites. Most polymeric surfactants are known to have thicknesses on the order of 10-20 nm. The effectiveness of surface modification that generates grafted steric layers of low polymer density upon nanoparticle dispersion can be examined using suspension rheology. The rheological transitions (i.e. sol-gel) as a function of volume fraction can be scaled to hard sphere transitions and related to the average separation distance between particles and the layer
7
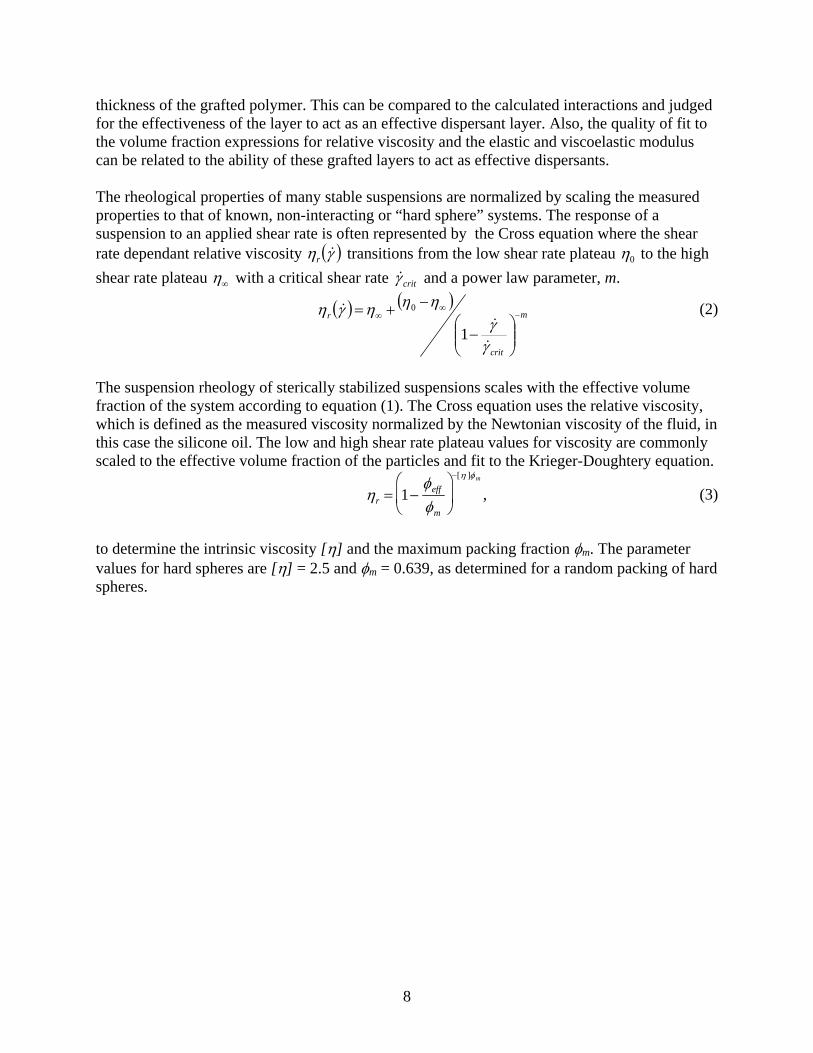
thickness of the grafted polymer. This can be compared to the calculated interactions and judged for the effectiveness of the layer to act as an effective dispersant layer. Also, the quality of fit to the volume fraction expressions for relative viscosity and the elastic and viscoelastic modulus can be related to the ability of these grafted layers to act as effective dispersants. The rheological properties of many stable suspensions are normalized by scaling the measured properties to that of known, non-interacting or “hard sphere” systems. The response of a suspension to an applied shear rate is often represented by the Cross equation where the shear rate dependant relative viscosity ( )γη &r transitions from the low shear rate plateau 0η to the high shear rate plateau ∞η with a critical shear rate critγ& and a power law parameter, m.
( ) ( )m
crit
r −∞
∞
⎟⎟⎠
⎞⎜⎜⎝
⎛−
−+=
γγ
ηηηγη
&
&&
1
0 (2)
The suspension rheology of sterically stabilized suspensions scales with the effective volume fraction of the system according to equation (1). The Cross equation uses the relative viscosity, which is defined as the measured viscosity normalized by the Newtonian viscosity of the fluid, in this case the silicone oil. The low and high shear rate plateau values for viscosity are commonly scaled to the effective volume fraction of the particles and fit to the Krieger-Doughtery equation.
ηr = 1−φeff
φm
⎛
⎝ ⎜
⎞
⎠ ⎟
−[η ]φm
, (3)
to determine the intrinsic viscosity [η] and the maximum packing fraction φm. The parameter values for hard spheres are [η] = 2.5 and φm = 0.639, as determined for a random packing of hard spheres.
8
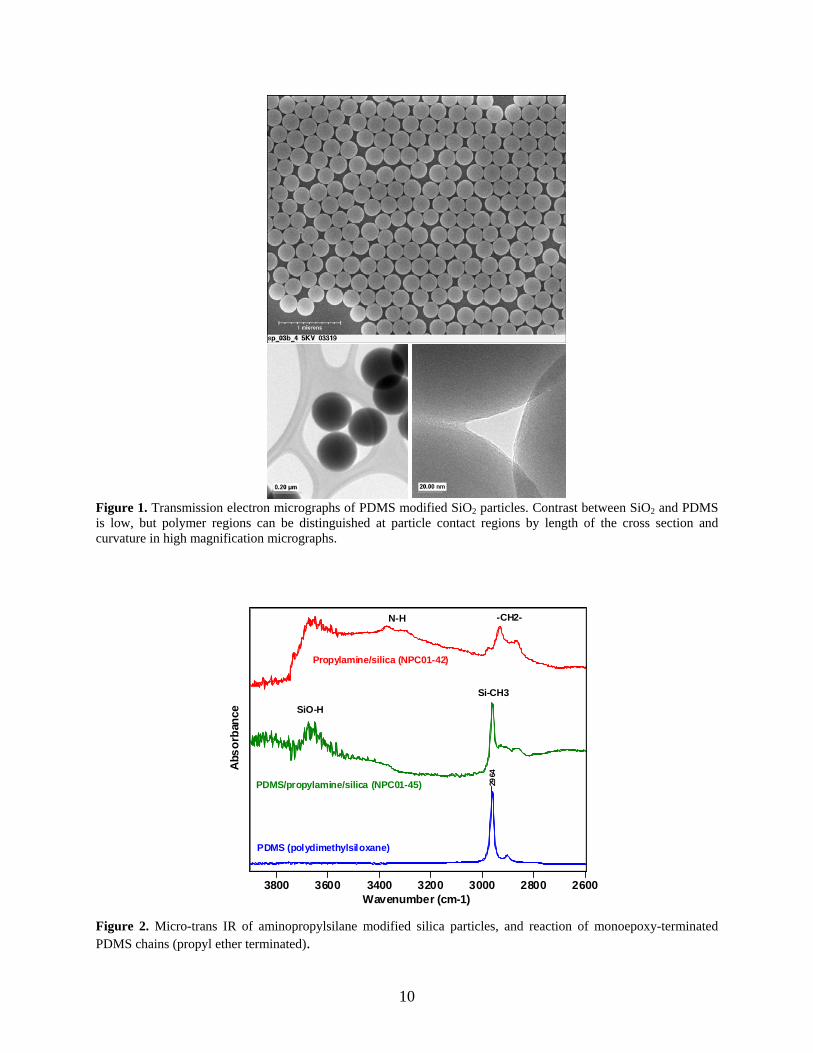
Synthesis of Model Particles The synthetic effort has been successful in modifying monodisperse silica colloids (Fuso Chemical) with a diameter of 284 nm with mono-epoxide terminated PDMS chains, available commercially (MCR-E21,Gelest). Figure 1 shows scanning electron microscopy images of the powder as received from Fuso Chemical. The morphology is spherical and monodisperse, and the particles will self-assemble into hexagonal layers by capillary forces when drying from a suspension. The silica particles were first modified using aminopropylsilane to create an amine terminated surface (Aldrich). They were then reacted in anhydrous toluene with the APS, stirred overnight at 80-90°C in an inert atmosphere. The particles were collected using centrifugation and redispersion methods. The reaction with monoterminated PDMS chains was performed in Clearco 20 Silicone Oil (Clearco Products), as low molecular weight PDMS fluid, and toluene using ethanolamine as catalyst and reacted at 100 oC. The reacted particles were then centrifuged and redispersed in toluene (x3), tetrahydrofuran (x3), and dichloromethane (x5). The particles were dried in vacuum and weighed for accurate addition to the Clearco fluid phase at a defined volumetric concentration. The two molecular weights of the surface termination were 800 and 5000 g/mol. Figure 1 also presents transmission electron micrographs of the surface modified modified particles. Visualization of the PDMS layers is difficult as there is little to no atomic contrast between the SiO2 core and the PDMS layer. However, points of contact between particles do show additional material that indicates a junction between the particles after drying. Chemical characterization of the grafting process was performed using infra-red spectroscopy. Infrared (IR) spectra of the silica powder were obtained, in transmission mode, using a Fourier transform IR spectrometer and its microscope accessory. Figure 2 plots spectra from six clumps of the powder pressed between salt (NaCl) windows. The spectra from two of the clumps have a dominant band peaking near 1125 cm-1 (Figure 2). These spectra are similar to that of an IR spectrum, from an IR library, of amorphous silicon dioxide powder (Figure 2). However, the IR library spectrum has bands indicating the presence of absorbed water (peaking near 3400 cm-1 and 1600 cm-1) and Si-OH groups (900 cm-1 – 1000 cm-1) that are not present in the spectrum we obtained of the silica powder. The spectra from three of the other silica clumps have two intense bands peaking near 1244 cm-1 and 1037 cm-1 (Figure 2). The remaining spectrum has a flat-topped feature indicating saturation of absorption intensity, but it probably also has the 1244/1037 cm-1 band pattern. These bands and the 1125 cm-1 band in the spectra of the clumps discussed in the previous paragraph all occur in the frequency range expected for Si-O motions in the Si-O-Si bonding that dominates the silica structure. However, those clumps exhibiting the 1244/1037 cm-1 band pattern have been chemically modified from the amorphous silicon dioxide structure, (again, see the spectra in Figure 2).
9
Figure 1. Transmission electron micrographs of PDMS modified SiO2 particles. Contrast between SiO2 and PDMS is low, but polymer regions can be distinguished at particle contact regions by length of the cross section and curvature in high magnification micrographs.
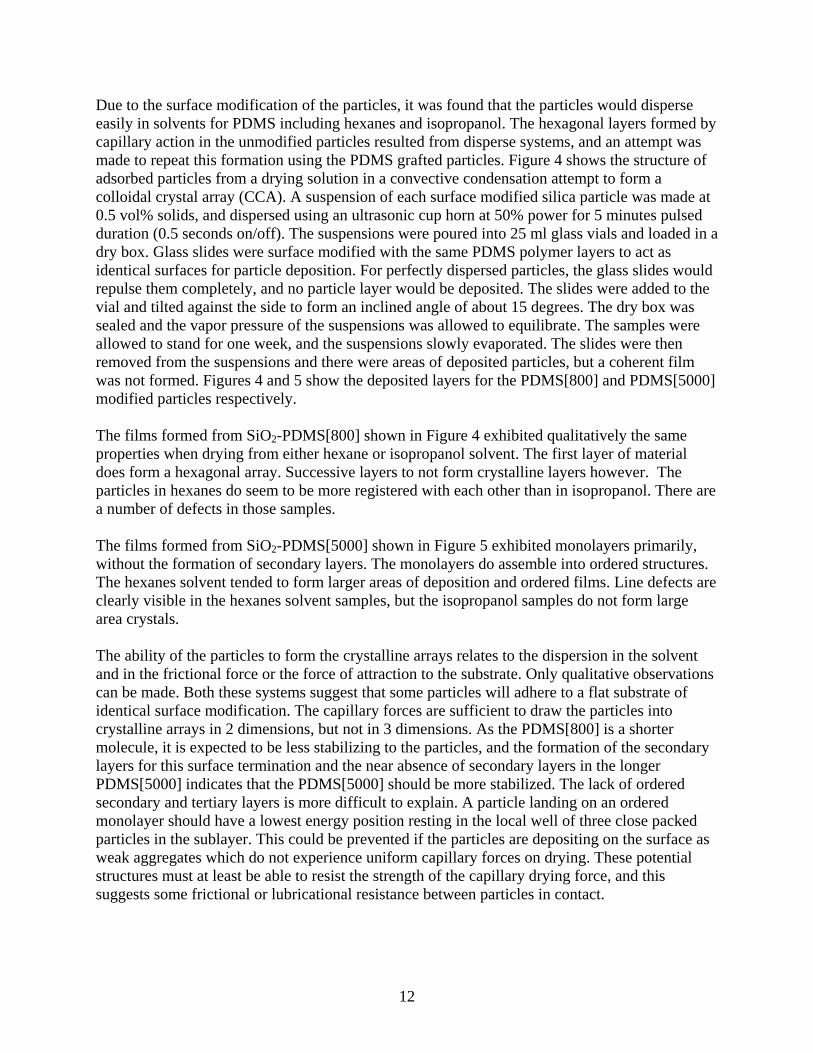
Figure 2. Micro-trans IR of aminopropylsilane modified silica particles, and reaction of monoepoxy-terminated PDMS chains (propyl ether terminated).
10
This report describes the IR analysis of the silica sample (NPC01-45) treated with (ethoxysilane) propylamine and subsequently with an epoxy-terminated polydimethylsiloxane (PDMS, M.W.=800) derivative intended to react with the amine functionality of the propylamine attached to the silica. We placed powder from sample NPC01-45 between salt windows and obtained IR transmission spectra (using the microscope accessory) of ten clumps of the powder. The IR spectra so obtained are similar and were averaged. The average spectrum is shown, along with a representative spectrum of the silica treated with propylamine only (NNPC01-42) and a spectrum of PDMS, in Figure 3. The PDMS spectrum in Figure 3 includes bands due to Si-O motions (1200 cm-1 and lower) and bands due to stretching (2964 cm-1) and bending (1261 cm-1) motions of its Si-CH3 groups. The Si-O bands of the treated silica samples have different vibrational mode patterns from PDMS, reflecting the fact that they include modes due to the silica powder precursor, silica bonded to propylamine species and, in the case of NPC01-45, PDMS polymers. In Figure 3 the presence of Si-CH3 groups from PDMS is apparent in the spectrum of NPC01-45. Also present in its spectrum are bands due to methylene (-CH2-) groups from the propyl species bonding the PMDS to the silica and bands due to SiO-H stretching motions of hydroxyl groups bonded to the remaining silica matrix. Note that the amine (N-H) bands noticeable in the spectrum of the propylamine-treated silica sample (NPS01-42) are not present in the spectrum of the sample treated also with the PDMS derivative. Apparently the amine terminators of the propyl groups largely reacted, as expected, with the PDMS derivative.
3500 3000 2500 2000 1500 1000 Wavenumber (cm-1)
FTIR07033 2nd_1st_PDMS expanded.gwb
2964
1261
Propylamine/silica (NPC01-42)
PDMS/propylamine/silica (NPC01-45)
PDMS (polydimethylsiloxane)
Figure 3. Micro-trans IR of aminopropylsilane modified silica particles, and reaction of monoepoxy-terminated PDMS chains (propyl ether terminated).
11
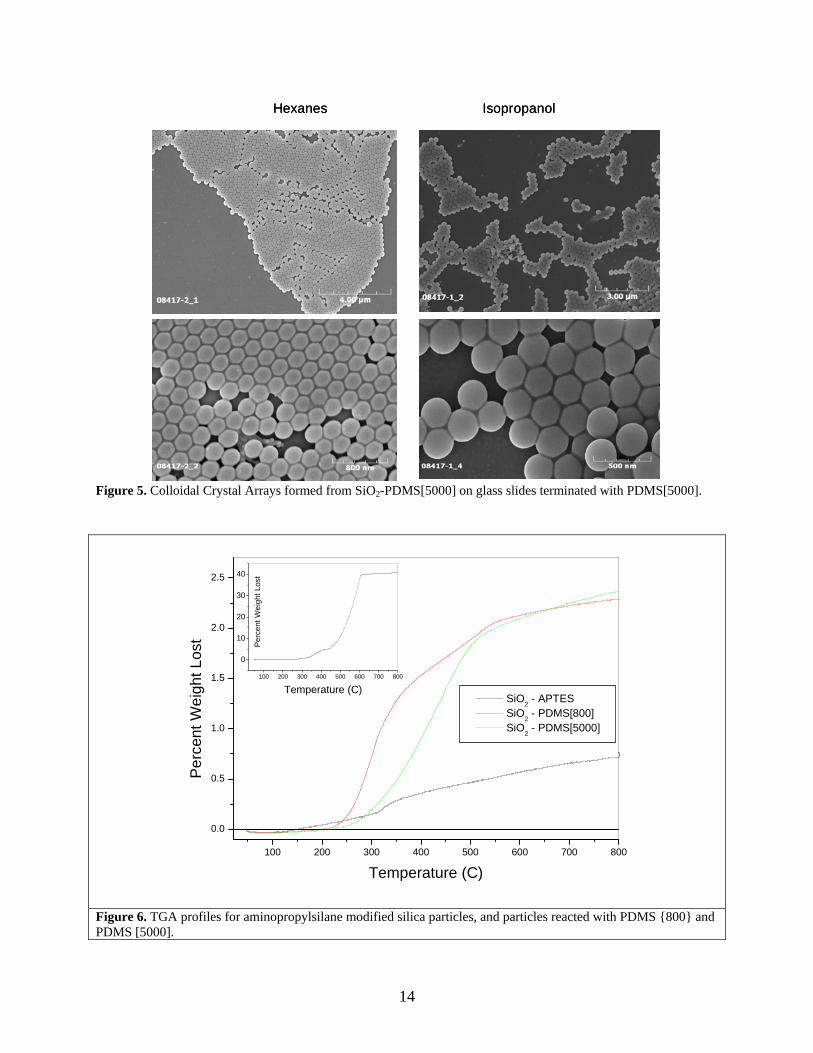
Due to the surface modification of the particles, it was found that the particles would disperse easily in solvents for PDMS including hexanes and isopropanol. The hexagonal layers formed by capillary action in the unmodified particles resulted from disperse systems, and an attempt was made to repeat this formation using the PDMS grafted particles. Figure 4 shows the structure of adsorbed particles from a drying solution in a convective condensation attempt to form a colloidal crystal array (CCA). A suspension of each surface modified silica particle was made at 0.5 vol% solids, and dispersed using an ultrasonic cup horn at 50% power for 5 minutes pulsed duration (0.5 seconds on/off). The suspensions were poured into 25 ml glass vials and loaded in a dry box. Glass slides were surface modified with the same PDMS polymer layers to act as identical surfaces for particle deposition. For perfectly dispersed particles, the glass slides would repulse them completely, and no particle layer would be deposited. The slides were added to the vial and tilted against the side to form an inclined angle of about 15 degrees. The dry box was sealed and the vapor pressure of the suspensions was allowed to equilibrate. The samples were allowed to stand for one week, and the suspensions slowly evaporated. The slides were then removed from the suspensions and there were areas of deposited particles, but a coherent film was not formed. Figures 4 and 5 show the deposited layers for the PDMS[800] and PDMS[5000] modified particles respectively. The films formed from SiO2-PDMS[800] shown in Figure 4 exhibited qualitatively the same properties when drying from either hexane or isopropanol solvent. The first layer of material does form a hexagonal array. Successive layers to not form crystalline layers however. The particles in hexanes do seem to be more registered with each other than in isopropanol. There are a number of defects in those samples. The films formed from SiO2-PDMS[5000] shown in Figure 5 exhibited monolayers primarily, without the formation of secondary layers. The monolayers do assemble into ordered structures. The hexanes solvent tended to form larger areas of deposition and ordered films. Line defects are clearly visible in the hexanes solvent samples, but the isopropanol samples do not form large area crystals. The ability of the particles to form the crystalline arrays relates to the dispersion in the solvent and in the frictional force or the force of attraction to the substrate. Only qualitative observations can be made. Both these systems suggest that some particles will adhere to a flat substrate of identical surface modification. The capillary forces are sufficient to draw the particles into crystalline arrays in 2 dimensions, but not in 3 dimensions. As the PDMS[800] is a shorter molecule, it is expected to be less stabilizing to the particles, and the formation of the secondary layers for this surface termination and the near absence of secondary layers in the longer PDMS[5000] indicates that the PDMS[5000] should be more stabilized. The lack of ordered secondary and tertiary layers is more difficult to explain. A particle landing on an ordered monolayer should have a lowest energy position resting in the local well of three close packed particles in the sublayer. This could be prevented if the particles are depositing on the surface as weak aggregates which do not experience uniform capillary forces on drying. These potential structures must at least be able to resist the strength of the capillary drying force, and this suggests some frictional or lubricational resistance between particles in contact.
12
For the layers deposited using SiO2-PDMS[5000] layers, very few secondary particles were observed. Due to the length of the grafted polymers, these particles should be more stable, and prevent particle adhesion during the convection process. Drying capillary films may also have pulled secondary particles to the drying edge and deposited them at the interface, but the lack of large films makes this unlikely.
Hexanes IsopropanolHexanes Isopropanol
Figure 4. Colloidal Crystal Arrays formed from SiO2-PDMS[800] on glass slides terminated with PDMS[800].
13
Hexanes IsopropanolHexanes Isopropanol
Figure 5. Colloidal Crystal Arrays formed from SiO2-PDMS[5000] on glass slides terminated with PDMS[5000].
100 200 300 400 500 600 700 800
0.0
0.5
1.0
1.5
2.0
2.5
100 200 300 400 500 600 700 800
0
10
20
30
40
Per
cent
Wei
ght L
ost
Temperature (C)
SiO2 - APTES SiO2 - PDMS[800] SiO2 - PDMS[5000]
Perc
ent W
eigh
t Los
t
Temperature (C)
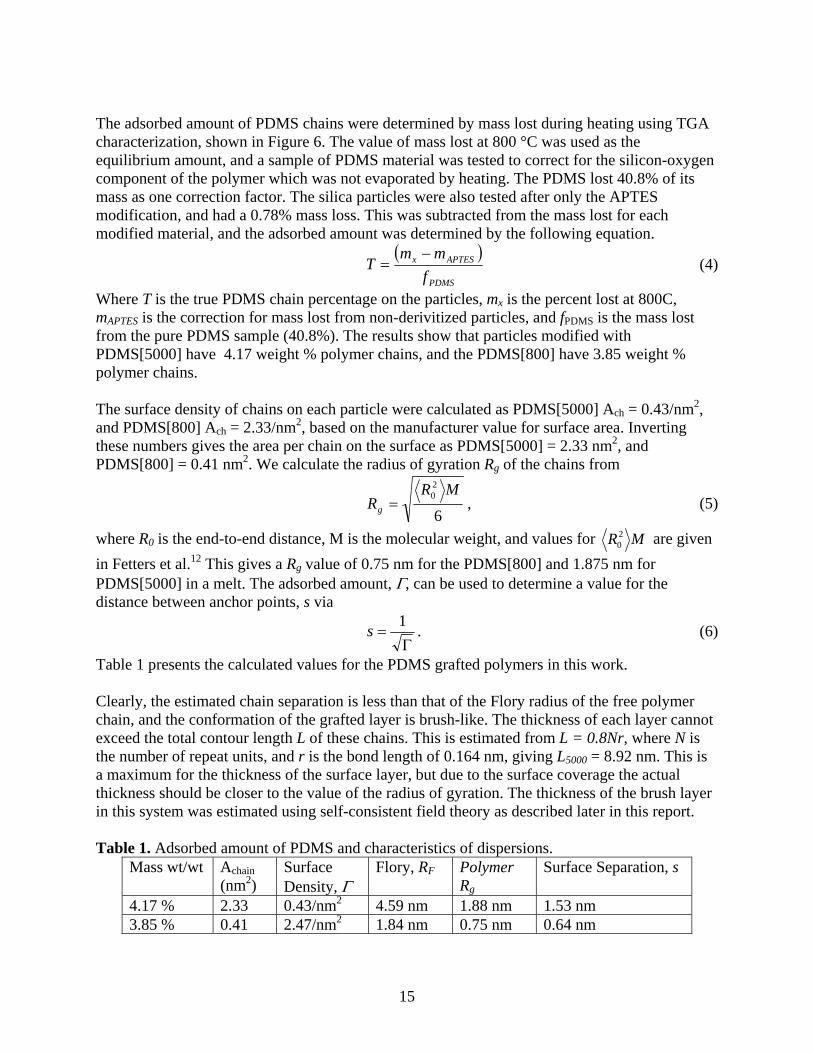
Figure 6. TGA profiles for aminopropylsilane modified silica particles, and particles reacted with PDMS {800} and PDMS [5000].
14
The adsorbed amount of PDMS chains were determined by mass lost during heating using TGA characterization, shown in Figure 6. The value of mass lost at 800 °C was used as the equilibrium amount, and a sample of PDMS material was tested to correct for the silicon-oxygen component of the polymer which was not evaporated by heating. The PDMS lost 40.8% of its mass as one correction factor. The silica particles were also tested after only the APTES modification, and had a 0.78% mass loss. This was subtracted from the mass lost for each modified material, and the adsorbed amount was determined by the following equation.
( )PDMS
APTESx
fmm
T−
= (4)
Where T is the true PDMS chain percentage on the particles, mx is the percent lost at 800C, mAPTES is the correction for mass lost from non-derivitized particles, and fPDMS is the mass lost from the pure PDMS sample (40.8%). The results show that particles modified with PDMS[5000] have 4.17 weight % polymer chains, and the PDMS[800] have 3.85 weight % polymer chains. The surface density of chains on each particle were calculated as PDMS[5000] Ach = 0.43/nm2, and PDMS[800] Ach = 2.33/nm2, based on the manufacturer value for surface area. Inverting these numbers gives the area per chain on the surface as PDMS[5000] = 2.33 nm2, and PDMS[800] = 0.41 nm2. We calculate the radius of gyration Rg of the chains from
6
20 MR
Rg = , (5)
where R0 is the end-to-end distance, M is the molecular weight, and values for MR20 are given
in Fetters et al.12 This gives a Rg value of 0.75 nm for the PDMS[800] and 1.875 nm for PDMS[5000] in a melt. The adsorbed amount, Γ, can be used to determine a value for the distance between anchor points, s via
Γ=
1s . (6)
Table 1 presents the calculated values for the PDMS grafted polymers in this work. Clearly, the estimated chain separation is less than that of the Flory radius of the free polymer chain, and the conformation of the grafted layer is brush-like. The thickness of each layer cannot exceed the total contour length L of these chains. This is estimated from L = 0.8Nr, where N is the number of repeat units, and r is the bond length of 0.164 nm, giving L5000 = 8.92 nm. This is a maximum for the thickness of the surface layer, but due to the surface coverage the actual thickness should be closer to the value of the radius of gyration. The thickness of the brush layer in this system was estimated using self-consistent field theory as described later in this report. Table 1. Adsorbed amount of PDMS and characteristics of dispersions.
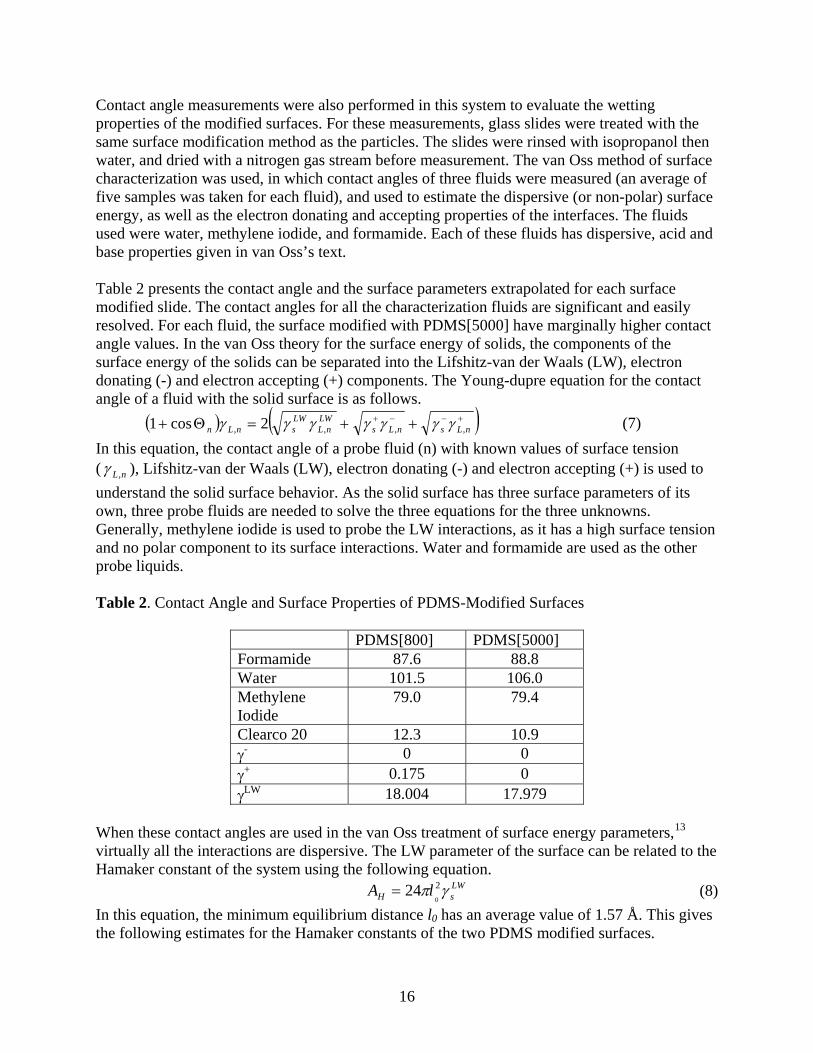
Contact angle measurements were also performed in this system to evaluate the wetting properties of the modified surfaces. For these measurements, glass slides were treated with the same surface modification method as the particles. The slides were rinsed with isopropanol then water, and dried with a nitrogen gas stream before measurement. The van Oss method of surface characterization was used, in which contact angles of three fluids were measured (an average of five samples was taken for each fluid), and used to estimate the dispersive (or non-polar) surface energy, as well as the electron donating and accepting properties of the interfaces. The fluids used were water, methylene iodide, and formamide. Each of these fluids has dispersive, acid and base properties given in van Oss’s text. Table 2 presents the contact angle and the surface parameters extrapolated for each surface modified slide. The contact angles for all the characterization fluids are significant and easily resolved. For each fluid, the surface modified with PDMS[5000] have marginally higher contact angle values. In the van Oss theory for the surface energy of solids, the components of the surface energy of the solids can be separated into the Lifshitz-van der Waals (LW), electron donating (-) and electron accepting (+) components. The Young-dupre equation for the contact angle of a fluid with the sol d surface is as follows. i
( ) ( )+−−+ ++=Θ+ nLsnLsLW
nLLWsnLn ,,,, 2cos1 γγγγγγγ (7)
In this equation, the contact angle of a probe fluid (n) with known values of surface tension ( nL,γ ), Lifshitz-van der Waals (LW), electron donating (-) and electron accepting (+) is used to understand the solid surface behavior. As the solid surface has three surface parameters of its own, three probe fluids are needed to solve the three equations for the three unknowns. Generally, methylene iodide is used to probe the LW interactions, as it has a high surface tension and no polar component to its surface interactions. Water and formamide are used as the other probe liquids. Table 2. Contact Angle and Surface Properties of PDMS-Modified Surfaces
PDMS[800] PDMS[5000] Formamide 87.6 88.8 Water 101.5 106.0 Methylene Iodide
When these contact angles are used in the van Oss treatment of surface energy parameters,13 virtually all the interactions are dispersive. The LW parameter of the surface can be related to the Hamaker constant of the system using the following equation.
LWsH lA γπ 2
024= (8)
In this equation, the minimum equilibrium distance l0 has an average value of 1.57 Å. This gives the following estimates for the Hamaker constants of the two PDMS modified surfaces.
16
A[800] = 3.346x10⁻²⁰ J A[5000] = 3.346x10⁻²⁰ J
The PDMS[800] surface has a weak electron accepting parameter, but the dispersive parameter shows that the Hamaker constant is equal for both modified surfaces. The values of the contact angle for the Clearco 20 silicone oil were also measured and reported in Table 2. These values are the advancing contact angles, which show that the PDMS[5000] modified surface is more wetting than the PDMS[800] modified surface. Figure 7 presents equilibrium contact angle images of the silicone oil used in the rheometry study (Clearco 20, Clearco Fluids). The equilibrium contact angles are too low for the image acquisition software to resolve, but clearly indicate that the silicone oil wets the interfaces of the modified surfaces very well.
PDMS 800 PDMS 5000PDMS 800 PDMS 5000Figure 7. Equilbrium contact angles of Clearco silicone oil on PDMS modified glass substrates.
17
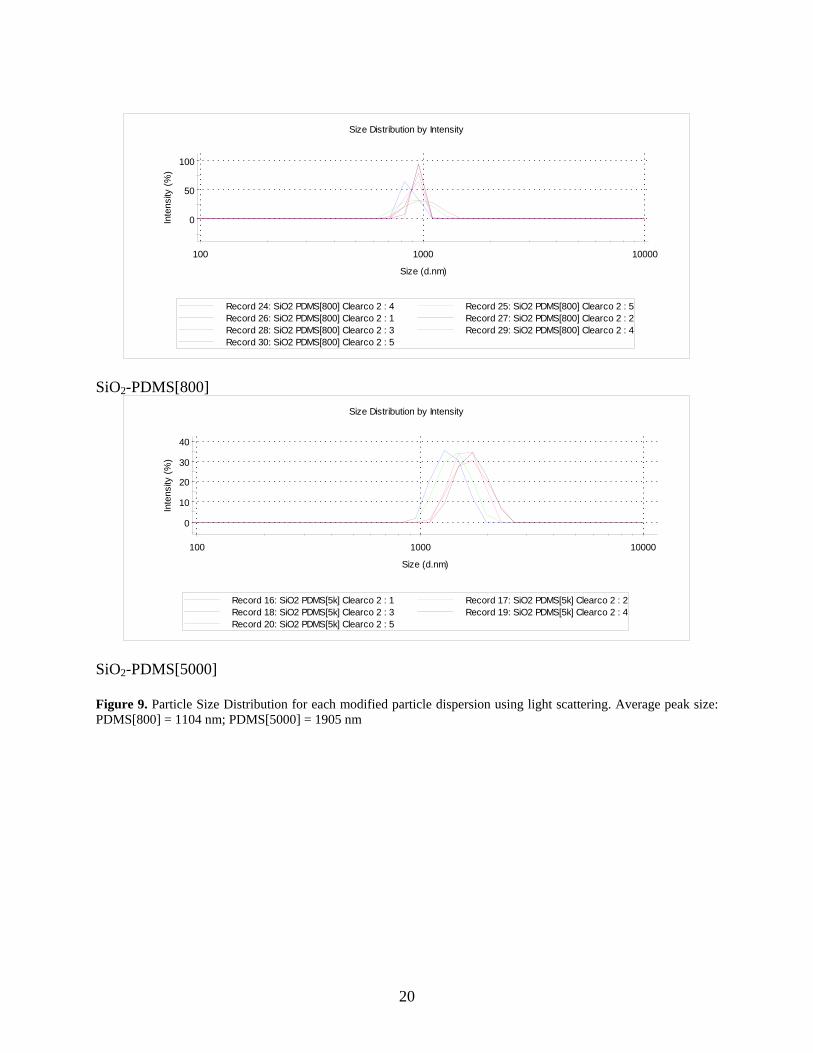
Particle Dispersion Dispersion characterization was performed on each type of particle using the DT1200 Acoustic Spectrometer. Acoustic techniques were used to evaluate both particle size and zeta potential of the surface modified silica particles. Suspensions of each particle were formed at >2 volume % in Clearco 20 silicone fluid. Mixing was performed by manual shaking followed by placement in the ultrasonic bath. Approximately 24 hours were used to disperse each set of particles. Each sample was tested twice. The particle size is estimated by the acoustic scattering over the frequency and gap length of the transducers, and shows that the particles are larger than the primary particle size. Figure 8 shows the particle size distribution as fit by the instrument and the acoustic attenuation raw data for each type of particle. The particles appear to be aggregated into sizes of about 850 nm, as the monomodal distribution is nearly as accurate as the bimodal fit. The estimated size of the units suggests that the particle groupings are likely in 4-7 particles. More mixing energy or time may improve the system. Light scattering measurements were also performed to evaluate the dispersion of the surface modified particles. Samples were prepared by diluting the more concentrated dispersions into Clearco silicone oil until a transparent sample was obtained. Ultrasonic dispersion was used for each sample to mix and disperse the particles. The dispersions were placed in a Zetasizer ZS instrument (Malvern Corporation). Figure 9 shows the particle size distributions fit by the instrument to the light scattering. Again, these samples show evidence of flocculation into multiple particles. In this case, the PDMS[5000] appears to show the larger aggregates. Although the two techniques are not perfectly congruent, both methods suggest some particle flocculation, although it is weak.
18
PDMS [800]
PDMS [5000]
PDMS [800]
PDMS [5000] Figure 8. Particle Size Distribution (PSD) and acoustic spectra of silica particles modified with PDMS[800] and PDMS[5000]. The monomodal peak sizes are PDMS[800] = 858 nm and PDMS[5000] = 846 nm.
SiO2-PDMS[5000] Figure 9. Particle Size Distribution for each modified particle dispersion using light scattering. Average peak size: PDMS[800] = 1104 nm; PDMS[5000] = 1905 nm
20
Particle Interactions The Hamaker constant is the fundamental quantum mechanical term representing the attractive forces between two bodies in either a vacuum or other medium. The Lifshiftz theory for calculating Hamaker constants from optical data is considered a superior method, as optical data incorporates the many body effects present in the material that can be overcalculated from a summation approach of forces between ions or molecules. Lifshtiz theory treats the body as a continuum, and the van der Walls forces can be thought of a fluctuations in the electromagnetic field between them. To calculate these interactions, optical data is used to determine characteristic strengths and frequencies for the electronic transitions of atoms or molecules in the material. Both solids and liquids are treated in this fashion, to give Hamaker constants in vacuum or in liquid medium directly without using the combining relationship given above. To calculate the Hamaker constant for ceramics, the dielectric response function, ε(iξ), (as simplified by Ninham and Parsegian) for each material must be determined. This function defines the electromagnetic response of a material as the sum of relative strengths of the interaction, Cj, at characteristic frequencies, ωj.
,where (7) Here fj is the oscillator strength and ωj is the relaxation frequency (rad/sec), and ξ is the calculation frequency (defined as follows). These values can be determined from the relative strengths and frequencies in the absorption spectrum. It may not be simple to apply this model in the case of complex adsorption behavior, where a large number of oscillators is required. CIR and CUV are the characteristic adsorption strengths, and ωIR and ωUV are the characteristic frequencies of adsorption in the IR and visible-UV spectra, respectively. Hough and White tabulate many of these values for ceramics, and Bergström also gives tabulated values for ceramics. The dielectric response function is applied in the calculation of the non-retarded Hamaker constant through the differences in dielectric response between materials k and l. The dielectric functions only have to be evaluated at certain discrete imaginary frequencies given by ξm = m(4π2kT/h).
( ) ( )( ) ( )
Δklk m l m
k m l m
i ii i
=−+
ε ξ ε ξε ξ ε ξ
(8)
and the materials k and l are summed through the Hamaker equation.
A kTs
s
sm132
12 323
10
32
==
∞
=
∞
∑∑ ' (Δ Δ ) (9)
The prime on the summation of m terms indicates that the first term (the static dielectric constant) is only given half weight. For the full Lifshitz calculation, a summation over s = 1 to 4 and m = 3000 can be employed. (s is a counting variable over all different frequencies.)
( ) ∑=
⎟⎠⎞
⎜⎝⎛+
+=N
j
j
jCi
12
11
ωξ
ξεj
jfωπ
2jC =
21
The Hamaker constant for amorphous silica in PDMS fluid was calculated using Lifshitz theory and published parameters for silica and PDMS.14 The value was found to be . For particles with diameter of 284 nm, the interactions between two spheres will be on the order of thermal energy at a separation of 7.76nm. For steric layers of 3.5 nm thickness on both particles, interactions in the system should be fairly negligible, and only the wetting interaction between the free solvent PDMS and the chains should be active. The model system may have a residual electrostatic effect due to the unreacted amine termination sites of the silica colloids.
JAH201027.0 −×=
Table 3. Parameters for calculation of the Hamaker constant for silica in PDMS melt.
The calculation of the interaction energy between particles is required to estimate the further behavior of the system. The particle-particle interaction is well described here by the superposition of the van der Waals attraction and the steric repulsion. Between identically sized particles, these forces can be estimated using equations (10) – (12). The van der Waals attraction is given by
⎥⎦
⎤⎢⎣
⎡⎟⎟⎠
⎞⎜⎜⎝
⎛ −++
−−= 2
22
2
2
22
2 4ln24
26
)()(
DaD
Da
aDaDA
DV effA (10)
where Aeff represents the effective Hamaker constant corrected for retardation effects, D is the separation between particle centers, and a stands for the particle radius. The Hamaker constant is estimated from
)()(232
)(3)0()0()0()0(
43)(
5.123
21
223
21
2
31
31 DFnn
nnhkTDAeff +−
⎟⎟⎠
⎞⎜⎜⎝
⎛+−
=π
ωεεεε (11)
where ω is the relaxation frequency. The static dielectric constant is represented by ε(0)i with i=1 for the particle and i=2 for the solvent. Correspondingly, ni stands for the material refractive index. Finally, the term F(D) is given by
325.15.02
321
3 )2()(24
1)(−
⎪⎭
⎪⎬⎫
⎪⎩
⎪⎨⎧
⎥⎦⎤
⎢⎣⎡ −++=
caDnnnDF ωπ (12)
Steric repulsion due to loss of configurational entropy of the tethered PDMS chains opposes the van der Waals attraction. The average spacing between the grafted polymers dictates whether the grafted chains form a polymer brush (in which polymers interact with their nearest neighbors and thus must stretch away from the grafting surface) or a mushroom conformation (in which the polymers are separated from each other and do not interact). The transition from the mushroom to the brush regime occurs when the distance between grafting points s becomes less than the characteristic size of a free polymer coil. Thus to estimate the steric part of the interaction potential between the particles, we need to determine the grafting density of the chains.
22
In steric stabilization of polymer-brush coated particles in a polymer melt, the stability of the system is dependent on the interactions of the free chains with the brush, and depends on the grafting density and the length of both the grafted and free chains.15 When the homopolymer melt wets the brush, the force is purely repulsive. Long matrix chains can dewet from the polymer brush, leading to a “dry brush” in which the melt does not penetrate into the brush. In this case, an interfacial tension forms between the brush and melt. When the attached and matrix chains are chemically identical as is the case here, this is a purely entropic phenomenon known as autophobic dewetting. For the case of two opposing brushes in a melt, the presence of this interfacial tension results in an attractive force between the two brushes.16 We calculated the brush profiles and the interaction energy between brushes on two opposing particles using self-consistent field theory (SCFT).17 This is a mean-field theory which includes the configurational entropy of the polymer chains, the constraint of the grafting surface, and any interactions between species in the system. We employed a standard version of SCFT which involves solving the SCFT equations in real space on a regular mesh.18 Since the Flory radius of the grafted PDMS chains is significantly smaller than most of the nanoparticle diameters, we assume that the chains are grafted onto flat surfaces which represent the particles. We take the Flory interaction parameter χ = 0 between the grafted chains and the solvent chains (the silicone oil), since both consist of identical monomers. The remaining parameters required for the theory are the grafting density and molecular weights. The grafted chains with molecular weight Mw = 5000 g/mol contain approximately 67 monomers, so we took the degree of polymerization of the grafted chains to be Ng = 67. Similarly, the silicone oil is represented by short chains with degree of polymerization Ns = 7. For PDMS at 298K, the monomer size can be calculated from b2 = C∞l0 3,29 which gives b = 0.559 nm. In units of b2, the grafting density is then Γ = 0.0569/b2. The system is assumed to be incompressible, so that the volume fractions of grafted chains and solvent chains add to one everywhere:φg + φs =1. A mesh spacing of 0.5b and a discretization of the chain contour of 0.5b were used in the calculations, with an error tolerance of 10-5. Figure 10 shows the volume fraction profiles for the grafted and solvent chains near an isolated particle surface, located at x=0. Consideration of Figure 10 indicates that the two surface modification methods have produced different behavior between the two systems. The shorter PDMS[800] layer actually does not allow the solvent to penetrate, and forms a collapsed surface layer, indicated by the nearly step function profile of the grafted layer density. For the PDMS[5000] surface brush, the solvent penetrates and the brush is extended. There is a significant amount of solvent chains throughout the PDMS[5000] brush layer, due to the relatively low grafting density and also the favorable interactions between the solvent and grafted chains. The brush profile is consistent with previous results for weakly stretched wet brushes.19 One measure of the brush thickness is where the profile has decreased to half its maximum value, which occurs at a height of about 5 nm, consistent with the estimates obtained from the TEM images. The two surface terminations contrast the behavior of a dry and a wet brush condition.
23
0 2 4 6 8 10 12 14 16
0.0
0.2
0.4
0.6
0.8
1.0
Den
sity
Distance (nm)
PDMS[800] Phibrush Phisolvent
PDMS[5000] Phibrush Phisolvent
Figure 10. Density profiles for grafted layers and solvent for the PDMS[800] and PDMS[5000] layers on each particle system. We then calculated the interaction energy between two brushes as a function of the distance D between the grafting surfaces. The excess surface free energy W(D), in units of kT per unit area of surface, is a direct output of the SCFT calculation. It is purely repulsive, due to compression of the brushes as the distance is decreased. We can convert this free energy to the force between two spherical particles using the Derjaguin approximation:20
( ) ( )haWhF π≈ , (13) where a is the radius of the particle and h is the surface separation between particles. After applying the Derjaguin approximation, we convert to an interaction energy between the two spherical particles by integrating:
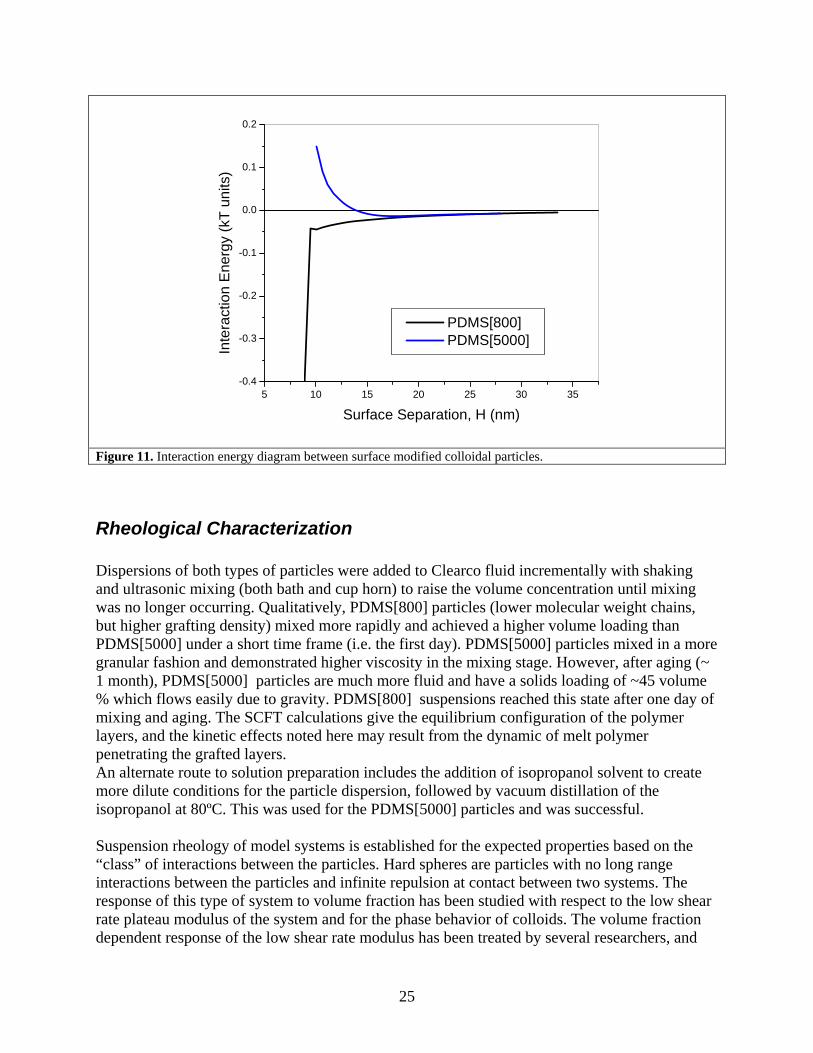
( ) ( )∫−= dhhFhE . (14) The results are presented in Figure 11. The PDMS[800] colloids are not predicted to have a stabilizing layer, as the interaction energy decreases as particles continue to approach from a separated position, until at contact the surfaces enter a preferred low energy bound state. In contrast, the PDMS[5000] coated particles have an expression that is expected for a stable system, in which there is a short range repulsion force which extends a significant distance from the particle surface. Due to the van der Waals interactions, there is a weak attractive minimum at 17-18 nm surface separation, but the strength of this minimum is less than 1 kT units, equivalent to less than the energy of Brownian motion. Therefore, the particles can be easily outside of this minimum due to the natural thermal energy of the system, and a strong interaction cannot be expected. This surface modification should behave as a disperse system.
24
5 10 15 20 25 30 35-0.4
-0.3
-0.2
-0.1
0.0
0.1
0.2
Inte
ract
ion
Ene
rgy
(kT
units
)
Surface Separation, H (nm)
PDMS[800] PDMS[5000]
Figure 11. Interaction energy diagram between surface modified colloidal particles.
Rheological Characterization Dispersions of both types of particles were added to Clearco fluid incrementally with shaking and ultrasonic mixing (both bath and cup horn) to raise the volume concentration until mixing was no longer occurring. Qualitatively, PDMS[800] particles (lower molecular weight chains, but higher grafting density) mixed more rapidly and achieved a higher volume loading than PDMS[5000] under a short time frame (i.e. the first day). PDMS[5000] particles mixed in a more granular fashion and demonstrated higher viscosity in the mixing stage. However, after aging (~ 1 month), PDMS[5000] particles are much more fluid and have a solids loading of ~45 volume % which flows easily due to gravity. PDMS[800] suspensions reached this state after one day of mixing and aging. The SCFT calculations give the equilibrium configuration of the polymer layers, and the kinetic effects noted here may result from the dynamic of melt polymer penetrating the grafted layers. An alternate route to solution preparation includes the addition of isopropanol solvent to create more dilute conditions for the particle dispersion, followed by vacuum distillation of the isopropanol at 80ºC. This was used for the PDMS[5000] particles and was successful. Suspension rheology of model systems is established for the expected properties based on the “class” of interactions between the particles. Hard spheres are particles with no long range interactions between the particles and infinite repulsion at contact between two systems. The response of this type of system to volume fraction has been studied with respect to the low shear rate plateau modulus of the system and for the phase behavior of colloids. The volume fraction dependent response of the low shear rate modulus has been treated by several researchers, and
25
gives several expressions for the relative viscosity, as noted by the Krieger-Doughtery equation21, Quemada equation,22 and the model of Saito.23 The limiting volume fraction for particle rheology is shear rate dependent, with a low shear plateau at 0.63 volume fraction and 0.71 volume fraction at the high shear rate limit.24 The phase behavior is also important to characterize, and hard sphere systems were found to obey predictions up to 0.50 volume fraction of particles.25 The shear thinning behavior of hard spheres is characterized by a characteristic Peclet number, which is only a function of volume fraction. Its definition is given by ( ) ( )∞∞ −+= ηηηη 02
1cr Pe .
There is also a reduced shear stress which rises up to volume fractions of 0.5, and then decreases in magnitude. Shear thinning results due to the structural transition induced by the interaction of Brownian (thermal) forces and hydrodynamic interactions induced by shear.26 At low shear rates, the structure is dominated by the thermal motion of the particles and the viscosity will remain constant while the particle structure is preserved. Increasing shear will alter the particle structure until a second plateau is developed where viscosity is constant again. Shear thickening can occur beyond these shear rates by the method of hydrodynamic clustering.27 For polymer coated particles, Potanin and Russel calculate the impact of lubrication forces, which act in the normal direction to the particle surface, to the viscosity of high shear rate suspensions.28 This has an impact on the high shear viscosity ∞η and the high frequency viscosity ∞′η for systems near the random packing limit. The phase diagram of a hard sphere colloidal system has a number of critical volume fractions which lead to structural transitions.29 At low volume fractions, the particles diffuse via Brownian motion, and the structure of a dispersion is fluid-like. There is a two-phase region bounded by volume fractions of 0.494 and 0.54 between the fluid and crystalline phases. The maximum packing fraction is shear rate dependant as described previously, at either 0.63 for low shear or 0.71 for the high shear regions. The absolute maximum for particle packing occurs in a face centered cubic structure with volume fraction of 0.74. Additionally, rapid increase in particle density is predicted to lead to a metastable glassy structure at 0.58 volume fraction. There can be confusion in data scaling to hard sphere systems with respect to the location of the maximum packing fraction between the glassy limit (0.58) and the random close packed limit (0.63). Generally, phase behavior for repulsive particles can be scaled to the hard sphere model. Phan et al. scaled the effective hard sphere volume fraction to the disorder-order transition for model hard sphere systems.30 For colloidal particles with weak attractions, the phase behavior exhibits shifts based on the strength of the attraction between particles, which is characterized by the Baxter parameter. The phase diagram exhibits a two phase region with a gas-liquid critical point at low (~0.1) volume fraction, and a percolation line in the system.31,32,33 the development of aggregates or percolating structures in the particle system lead to increasing viscosity, higher degrees of shear thinning, thixotropic effects, and the development of a yield stress in the system, as well as a lower maximum solids loading in a system. It is typical for a weakly attractive system to fail to resolve a low shear rate plateau viscosity, as the Brownian motion responsible for maintaining the initial particle structure is greatly slowed due to the particle attractions. Lu et al. recently reported that the gelation of a particle system due to weak attractions is related to the volume fraction, strength of interaction, and the range of attractive potential scaled by the particle
26
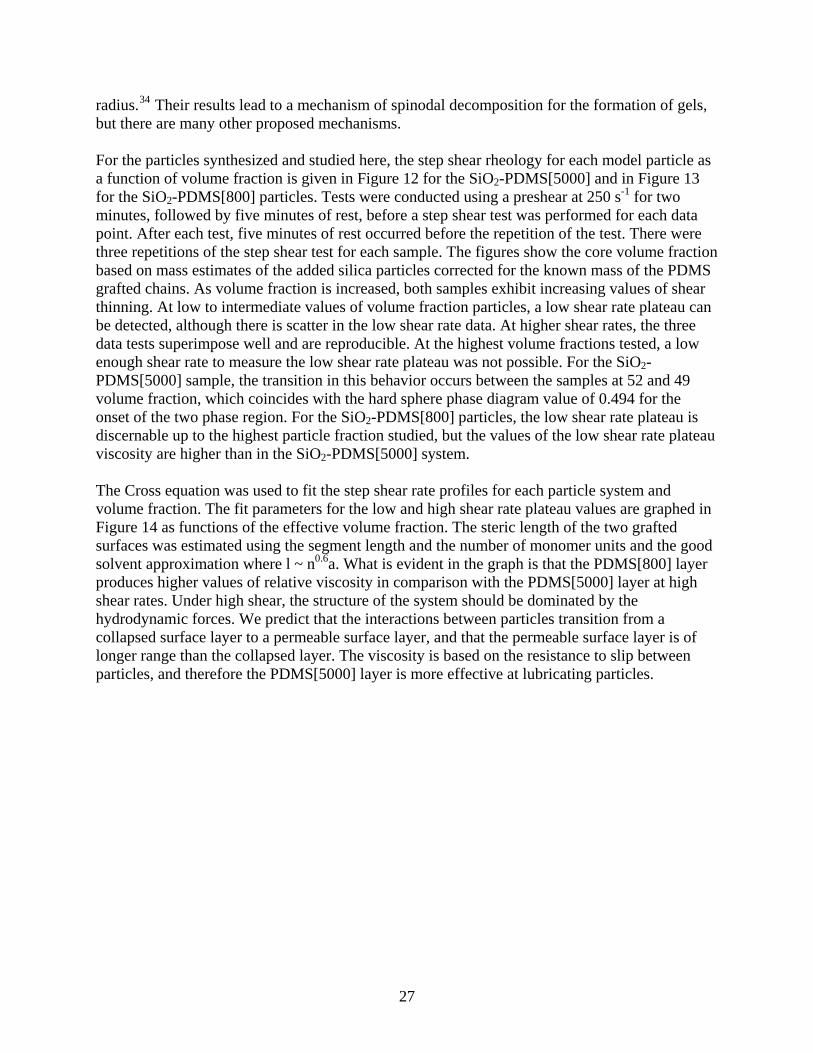
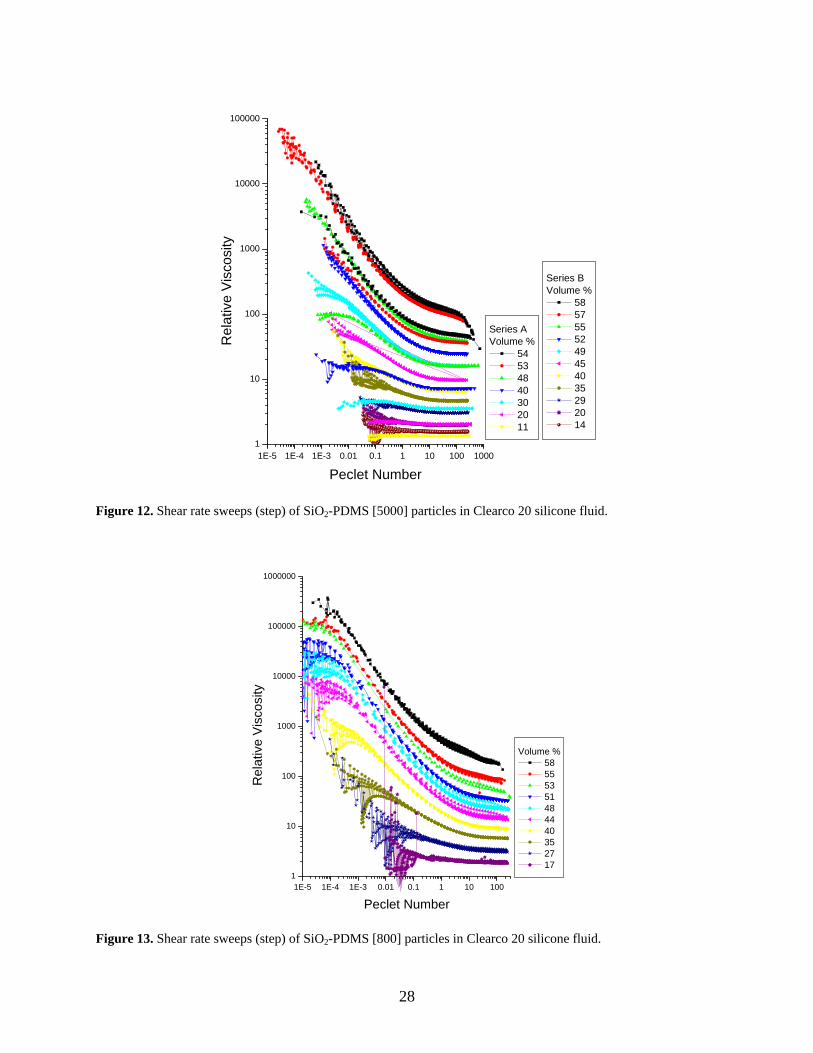
radius.34 Their results lead to a mechanism of spinodal decomposition for the formation of gels, but there are many other proposed mechanisms. For the particles synthesized and studied here, the step shear rheology for each model particle as a function of volume fraction is given in Figure 12 for the SiO2-PDMS[5000] and in Figure 13 for the SiO2-PDMS[800] particles. Tests were conducted using a preshear at 250 s-1 for two minutes, followed by five minutes of rest, before a step shear test was performed for each data point. After each test, five minutes of rest occurred before the repetition of the test. There were three repetitions of the step shear test for each sample. The figures show the core volume fraction based on mass estimates of the added silica particles corrected for the known mass of the PDMS grafted chains. As volume fraction is increased, both samples exhibit increasing values of shear thinning. At low to intermediate values of volume fraction particles, a low shear rate plateau can be detected, although there is scatter in the low shear rate data. At higher shear rates, the three data tests superimpose well and are reproducible. At the highest volume fractions tested, a low enough shear rate to measure the low shear rate plateau was not possible. For the SiO2-PDMS[5000] sample, the transition in this behavior occurs between the samples at 52 and 49 volume fraction, which coincides with the hard sphere phase diagram value of 0.494 for the onset of the two phase region. For the SiO2-PDMS[800] particles, the low shear rate plateau is discernable up to the highest particle fraction studied, but the values of the low shear rate plateau viscosity are higher than in the SiO2-PDMS[5000] system. The Cross equation was used to fit the step shear rate profiles for each particle system and volume fraction. The fit parameters for the low and high shear rate plateau values are graphed in Figure 14 as functions of the effective volume fraction. The steric length of the two grafted surfaces was estimated using the segment length and the number of monomer units and the good solvent approximation where l ~ n0.6a. What is evident in the graph is that the PDMS[800] layer produces higher values of relative viscosity in comparison with the PDMS[5000] layer at high shear rates. Under high shear, the structure of the system should be dominated by the hydrodynamic forces. We predict that the interactions between particles transition from a collapsed surface layer to a permeable surface layer, and that the permeable surface layer is of longer range than the collapsed layer. The viscosity is based on the resistance to slip between particles, and therefore the PDMS[5000] layer is more effective at lubricating particles.
27
1E-5 1E-4 1E-3 0.01 0.1 1 10 100 10001
10
100
1000
10000
100000
Series AVolume %
54 53 48 40 30 20 11
Rel
ativ
e Vi
scos
ity
Peclet Number
Series BVolume %
58 57 55 52 49 45 40 35 29 20 14
Figure 12. Shear rate sweeps (step) of SiO2-PDMS [5000] particles in Clearco 20 silicone fluid.
1E-5 1E-4 1E-3 0.01 0.1 1 10 1001
10
100
1000
10000
100000
1000000
Rel
ativ
e V
isco
sity
Peclet Number
Volume % 58 55 53 51 48 44 40 35 27 17
Figure 13. Shear rate sweeps (step) of SiO2-PDMS [800] particles in Clearco 20 silicone fluid.
SiO2-PDMS[800] Low SiO2-PDMS[5000] Low SiO2-PDMS[800] Hi SiO2-PDMS[5000] Hi
Figure 14. Zero and infinite shear viscosity of SiO2-PDMS[800] and SiO2-PDMS[5000] particles determined by fitting of Cross equation to shear rate data. Parameters for the Krieger-Doughtery equation fits shown in the graph are given in the inset display.
Also visible in Figure 14 is the inflexion point in the viscosity at low shear for the PDMS[800] grafted particles, as opposed to the volume fraction dependence of the PDMS[5000] grafted particles, which fit the Krieger-Doughtery equation. Zero shear rate values could not be fit to the Krieger-Doughtery equation over the full range of volume fractions tested. The Krieger-Doughtery equation could be fit to data below a volume fraction of 0.45, and those parameters are presented in the inset display. For weakly attractive particles, there is a model for the low shear rate viscosity presented by Krishnamurthy and Wagner, incorporating the Baxter parameter for the attraction between particles. The form of the equation is
2
2
1
9.11
⎟⎟⎠
⎞⎜⎜⎝
⎛−
⎟⎟⎠
⎞⎜⎜⎝
⎛+
=
m
Br
φφ
τφ
η
(15)
The attractive part of the interaction potential is given by the Baxter parameter, which characterizes the “sticky factor” of the particles.35 This parameter can be measured by characterization of the second virial coefficient, but for the purpose of fitting the data, a stronger particle attraction is given by a small τB, and weaker interactions are given by large values of τB BB. The display in Figure 14 shows that the τB parameter to fit the high volume fraction data is extremely small, indicating a strong attraction between particles. This equation was developed for dispersion using large macromolecules (gelatin) in which excess gelatin is unadsorbed and creates depletion interactions between particles. These particles should have a wetting interaction based attraction, and it is difficult to rationalize such a strong attraction with a system that can be mixed to achieve a high volume fraction of 0.58. The behavior of the SiO2-PDMS[800] particles
29
can be more easily understood as a system of aggregates which are weakly attracting, which create a percolating structure above 0.45 volume fraction. The low shear rate viscosity of samples above 0.45 volume fraction is suggestive of a different particle structure, which may be based on crowding or the mode coupling theory (MCT) of particle motion. In MCT, the structure of the particles surrounding a diffusing particle (i.e. the cage) must “open” to allow the particle to move to a new position. The dispersion characterization did show that the particles are present in multiples of primary particles, and this may indicate that the lubrication of aggregates is a source for the discontinuity. This mechanism would be more similar to the packing of non-spherical particles, and be indicative of a phase transition for the packing of plates or rods. It would also be suggestive of a two-phase system, where tightly packed primary particles and dispersed single particles are in equilibrium. Further characterization of the state of dispersion is needed for improved understanding.
30
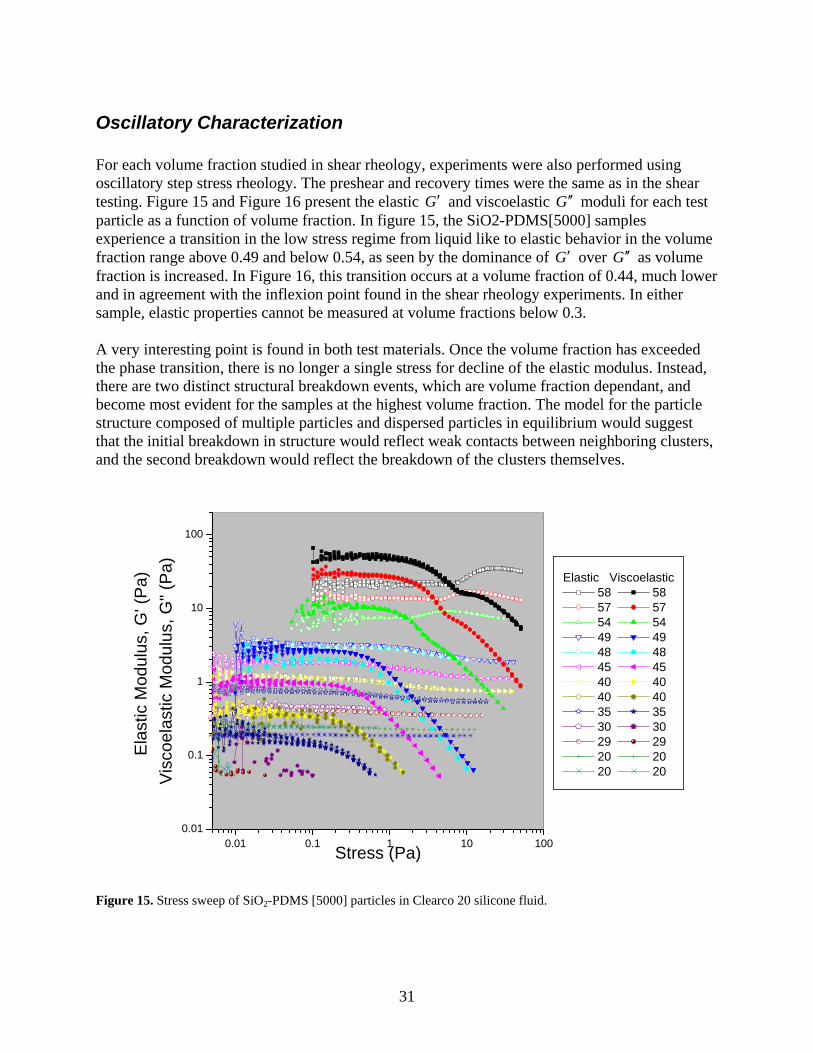
Oscillatory Characterization For each volume fraction studied in shear rheology, experiments were also performed using oscillatory step stress rheology. The preshear and recovery times were the same as in the shear testing. Figure 15 and Figure 16 present the elastic G′ and viscoelastic G ′′ moduli for each test particle as a function of volume fraction. In figure 15, the SiO2-PDMS[5000] samples experience a transition in the low stress regime from liquid like to elastic behavior in the volume fraction range above 0.49 and below 0.54, as seen by the dominance of G′ over G as volume fraction is increased. In Figure 16, this transition occurs at a volume fraction of 0.44, much lower and in agreement with the inflexion point found in the shear rheology experiments. In either sample, elastic properties cannot be measured at volume fractions below 0.3.
′′
A very interesting point is found in both test materials. Once the volume fraction has exceeded the phase transition, there is no longer a single stress for decline of the elastic modulus. Instead, there are two distinct structural breakdown events, which are volume fraction dependant, and become most evident for the samples at the highest volume fraction. The model for the particle structure composed of multiple particles and dispersed particles in equilibrium would suggest that the initial breakdown in structure would reflect weak contacts between neighboring clusters, and the second breakdown would reflect the breakdown of the clusters themselves.
Figure 16. Stress sweep of SiO2-PDMS [800] particles in Clearco 20 silicone fluid.
32
SUMMARY The obvious difference between the behavior of the samples is the volume fraction for the transition between the two states. The PDMS[800] samples have higher viscosity at the equivalent volume fraction, which we attribute to the attractive interactions between particles and the expectation of particle clustering. The PDMS[800] particles also show a discontinuous transition in the low shear rate plateau viscosity characteristics. The SCFT calculations suggest that these particles are more attractive and have less stabilization between surfaces, and the dispersion characterization methods show flocculation. The contact angle characterization suggests that the PDMS[800] particles have marginally poorer wetting characteristics than the PDMS[5000] interfaces. However, the PDMS[5000] system also exhibits flocculation into clusters. The SCFT calculations also predict a weak, long range van der Waals attraction between the particles, and flocculation was detected with both light scattering and acoustic characterization techniques. The shear and oscillatory rheology suggest that the transition of these particles into hydrodynamically controlled structures requires less energy than in the PDMS[800] grafted particles. This indicates that lubrication forces may be stronger in this surface termination.
The differences between the two grafted polymer layers are more complex than can be explained from a simple interaction energy consideration. Further understanding would be promoted by visualization of the particles and the aggregates structures formed, as well as by direct measurement of the interaction force and/or energy between particles. Wetting interactions could be related to the second virial coefficient of the modified particles as well. These studies could be performed in a future program.
33
REFERENCES 1 M.B. Niwaz and L.J. Neergaard, “Rheology of silicone-coated ceramic powders,” J. Mat. Sci. Lett., 16 (1997) 870-871. 2 K.C. Krogman, T. Druffel, and M.K. Sunkara, “Anti-reflective Optical Coatings Incorporating Nanoparticles,” Nanotechnology 16 (2005) S338-S343. 3 G.S. Rajan, G.S. Sur, J.E. Mark, D.W. Schaeffer, and G. Beaucage, “Preparation and Characterization of Some Unusually Transparent Poly(dimethylsiloxane) Nanocomposites,” J. Polym. Sci. B: Polym Phys. 41 (2003) 1897-1901. 4 J.P. Stevenson, M. Rutkornpituk, M. Valada, A.R. Esker, S.W. Charles, S. Wells, J.P. Dailey, and J.S. Riffle, “Magnetic Cobalt Dispersions in Poly(dimethylsiloxane) Fluids,” J. Magnetism and Magnetic Matls. 225 (2001) 47-58. 5 D.H. Everett and J.F. Stageman, “Stability studies on polymer colloids in simple liquids,” Coll. Polym. Sci., 255 (1977) 293-294. 6 G.N. Choi, and I.M. Krieger, “Rheological Studies on Sterically Stabilized Dispersions of Uniform Colloidal Spheres I. Sample Preparation,” J. Coll. Interface Sci., 113 (1986) 94-100. 7 P. Auroy, L. Auvray, and L. Leger, “Silica Particles Stabilized by Long Grafted Polymer Chains,” J. Coll. Interf. Sci. 150 (1992). 8 R. Krishnamoorti, “Strategies for Dispersing Nanoparticles in Polymers,” MRS Bull. 32 (2007) 341-347. 9 D.N. Napper, Polymeric Stabilization of Colloidal Dispersions, R.H. Ottewill and r.L. Rowell, Eds., Academic Press, 1983, pp. 324-329. 10 R. Hasegawa, Y. Aoki, and M. Doi, “Optimum Graft Density for Dispersing Particles in Polymer Melts,” Macromolecules 29 (1996) 6656-6662. 11 L. Yezek, W. Shartl, Y. chen, K. Gohr, and M. Schmidt, “Influence of Hair Density and Hair Length on Interparticle Interactions of Spherical Polymer Brushes in a Homopolymer Matrix,” Macromolecules 36 (2003) 4226-4235. 12 F. Li and F. Pincet, “Confinement Free Energy of Surfaces Bearing End-Grafted Polymers in the Mushroom Regime and Local Measurement of the Polymer Density,” Langmuir 23 (2007) 12541-12548. 13 C.J. van Oss, Interfacial Forces in Aqueous Media, CRC Taylor and Francis, New York, 2006. 14 L. Bergstrom, “Hamaker Constants of Inorganic Materials,” Adv. Coll. Interf. Sci, 70 (1997) 125-169. 15 A. Striolo and S.A. Egorov, “Steric Stabilization of Spherical Colloidal Particles: Implicit and Explicit Solvent,” J. Chem. Phys. 126 (2007) 014902. 16 M. W. Matsen and J. M. Gardiner, J. Chem. Phys. 115, (2001). 2794 17 Fredrickson, G. H., The Equilibrium Theory of Inhomogeneous Polymers (Clarendon Press, Oxford, 2006). 18 We used the software package OCTA (<http://octa.jp>) for the SCFT calculations 19 Netz, R. R. and Schick, M. Macromolecules 31, 5105-5122 (1998). 20 J. Israelachvili, Intermolecular and Surface Forces, Academic Press, London, 1995. 21 I.M. Krieger and T.J. Doughtery, Trans. Soc. Rheol. 3 91959) 137. 22 D. Quemada, Lecture Notes in Physics: Stability of thermodynamic Systems, J. Cases-Vasquez and J. Lebon, Eds. Springer, Berlin, 1982, p. 210. 23 N. Saito, J. Phys. Soc. Japan, 5 (1950) 4. ; 7 (1952) 447. 24 J.C. van der Werff and C.G. de Kruif, “Hard-sphere Colloidal Dispersions: The Scaling of Rheological Properties with Particle Size, Volume Fraction, and Shear Rate,” J. Rheol. 33 (1989) 421-454. 25 C.G. de Kruif, W.J. Briels, R.P. May, and A. Vrij, Langmuir 4 (1988) 664. 26 J. Mewis and J. Vermant, “Rheology of Sterically Stabilized Dispersions and Latices,” Prog. Org. Coatings 40(2000) 111-117. 27 Laun, Die Angew. Makr. Chem (1984). 28 A.A. Potanin and W.B. Russel, “Hydrodynamic Interaction of Particles with Grafted Polymer Brushes and Applications to Rheology of Colloidal Dispersions, “Phys. Rev. E 52 (1995) 730-737.
34
29 P.N. Pusay and W. van Megan, “Phase behaviour of Concentrated Suspensions of Nearly Hard Colloidal Spheres,” Nature 320 (1986) 340-342. 30 S.-E. Phan, W.B. Russel, Z. cheng, J. Zhu, P.M. Chaiken, J. H. Dunsmuir, and R.H. Ottewill, “Phase Transition, Equation of State, and Limiting Shear Viscosities of Hard Sphere Dispersions,” Phys. Rev. E 54 (1996) 6633-6645. 31 J. Bergenholtz, Ph.D. Thesis, Statics and Dynamics of Colloidal Suspensions with Attractive Interactions N.J. Wagner, Advisor, Univ. Delaware, 1996. 32 J. Bergenholtz and M. Fuchs, Nonergodicity Transitions in Colloidal Suspensions with Attractive Interactions,” Phys. Rev. E, 59 (1999) 5706-. 33 L. Krishnamurthy, Microstructure and Rheology of Polymer-Colloid Mixtures Ph.D. Thesis, N.J. Wagner, Advisor, Univ. Delaware, 2005. 34 P.J. Lu, E. Zaccarelli, F. ciulla, A.B. Schofield, F. Sciortino, and D.A. Weitz, “Gelation of Particles with Short-Range Attraction,” Nature Lett. 453 (2008) 499-503. 35 R.J. Baxter, “Percus-Yevick Equation for Hard Spheres with Surface Adhesion,” J. Chem.. Phys. 49 (1968) 2770-2774.
35
Distribution 1 MS 0899 Technical Library, 9536 (electronic copy) 1 MS 0123 D. Chavez, LDRD Office, 1011 (electronic copy) 1 MS-0836 Randy Schunk, 1516 (electronic copy) 1 MS-0836 Joel Lash, 1516 (electronic copy) 1 MS-0836 Jeremy Lechman, 1516 (electronic copy) 1 MS-1303 Gary Grest, 1114 (electronic copy) 1 MS-1314 Matt K. Petersen, 1114 (electronic copy) 1 MS-1316 W. Michael Brown, 1416 (electronic copy) 1 MS-1316 Steven Plimpton, 1416 (electronic copy) 1 MS-1411 Nelson Bell, 1816 (electronic copy) 1 MS-1411 David Tallant, 1822 (electronic copy) 1 MS-1411 Amalie Frischknecht, 1814 (electronic copy) 1 MS-1415 Carlos Gutierrez, 1114 (electronic copy) 1 Martin Piech (electronic copy) United Technologies Research Center 411 Silver Lane, MS129-22 East Hartford, CT 06108