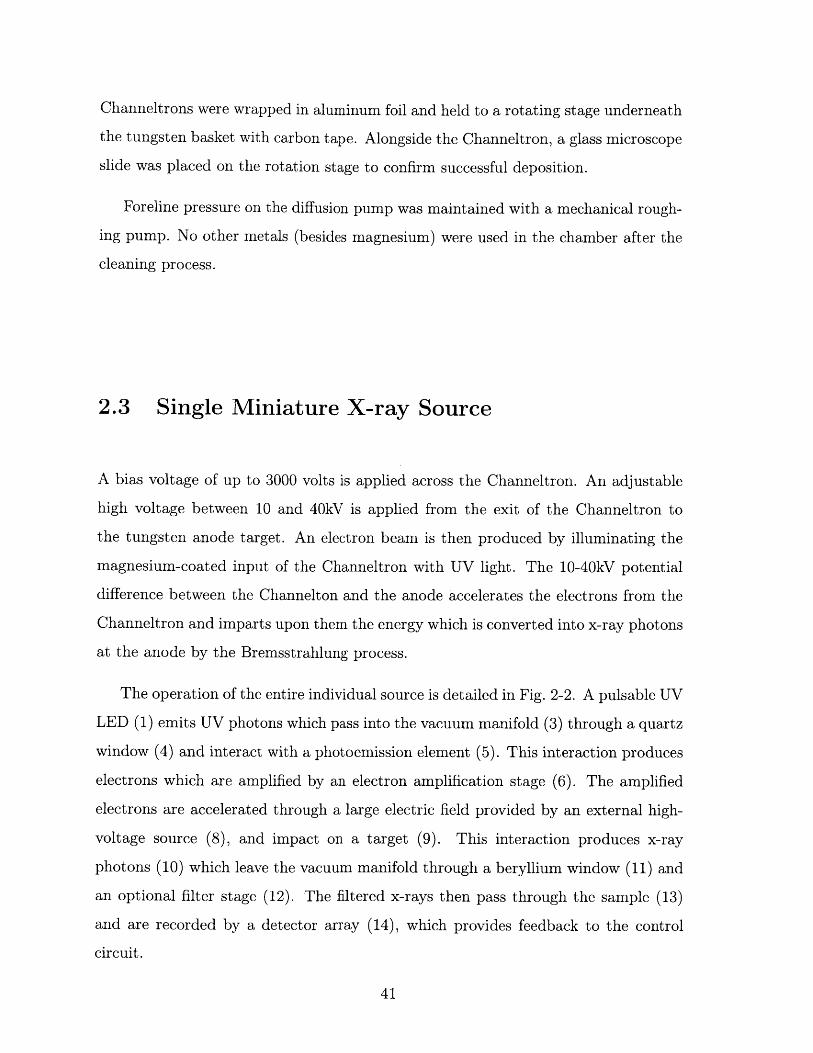
Development of a Motion-Free Tomographic Imaging System by Avilash Cramer Submitted to the Department of Electrical Engineering and Computer Science in partial fulfillment of the requirements for the degree of Master of Science at the MASSACHUSETTS INSTITUTE OF TECHNOLOGY February 2018 Massachusetts Institute of Technology 2018. All rights reserved. Signature redacted A u th o r ........................_ - ------------ - Department of Electrical Engineering and Computer Science , Jan 29, 20(18 Certified by.... C ertified by .................... Accepted by ............... Signature redacted Elfar Adalsteinsson Professor, MIT EECS & IMES iJesis Stu1pervisor Signature redacted Rajiv Gupta Associate Professor, Harvard Medical School Thesis Supervisor Signature redacted LebIie A)olodziejski Chair, Department Committee on Graduate Theses OF TECHNOILN TE MAR 26 O LIBRARIES Co 0
Transcript
Development of a Motion-Free Tomographic Imaging
System
by
Avilash Cramer
Submitted to the Department of Electrical Engineering and ComputerScience
in partial fulfillment of the requirements for the degree of
Master of Science
at the
MASSACHUSETTS INSTITUTE OF TECHNOLOGY
February 2018
Massachusetts Institute of Technology 2018. All rights reserved.
Signature redactedA u th o r ........................_ - - - - - - - - - - - - - -
Department of Electrical Engineering and Computer Science, Jan 29, 20(18
Certified by....
C ertified by ....................
Accepted by ...............
Signature redactedElfar Adalsteinsson
Professor, MIT EECS & IMESiJesis Stu1pervisor
Signature redactedRajiv Gupta
Associate Professor, Harvard Medical SchoolThesis Supervisor
Signature redactedLebIie A)olodziejski
Chair, Department Committee on Graduate Theses
OF TECHNOILN TE
MAR 26 O
LIBRARIES
Co0
2
Development of a Motion-Free Tomographic Imaging System
by
Avilash Cramer
Submitted to the Department of Electrical Engineering and Computer Scienceon Jan 29, 2018, in partial fulfillment of the
requirements for the degree ofMaster of Science
Abstract
Computed tomography (CT) is the clinical standard for diagnosing many emergentmedical conditions, such as stroke and traumatic brain injuries. Unfortunately, thesize, weight, and expense of CT systems make them inaccessible for patients outsideof large trauma centers.
We have designed a module containing multiple miniature x-ray source that wouldallow for CT scanners to be significantly lighter weight and cheaper, and to operatewithout any moving parts. This could expand access to this valuable diagnostictool to rural and low-income communities, emergency medicine, battlefield care, andextended space missions.
As part of this system, we present a photocathode-based x-ray source, created bydepositing a thin film of magnesium on an electron amplifier. When illuminated by aUV LED, this photocathode emits a beam of electrons, with a maximum beam currentof up to 500 uA per amplifier. The produced electrons are then accelerated througha high voltage to a tungsten target. These sources are individually addressable andcan be pulsed rapidly, through electronic control of the LEDs. Seven of these sourcescomprising a 17.5 degree arc are housed together within a custom vacuum manifold.A full ring of these modules could be used for CT imaging.
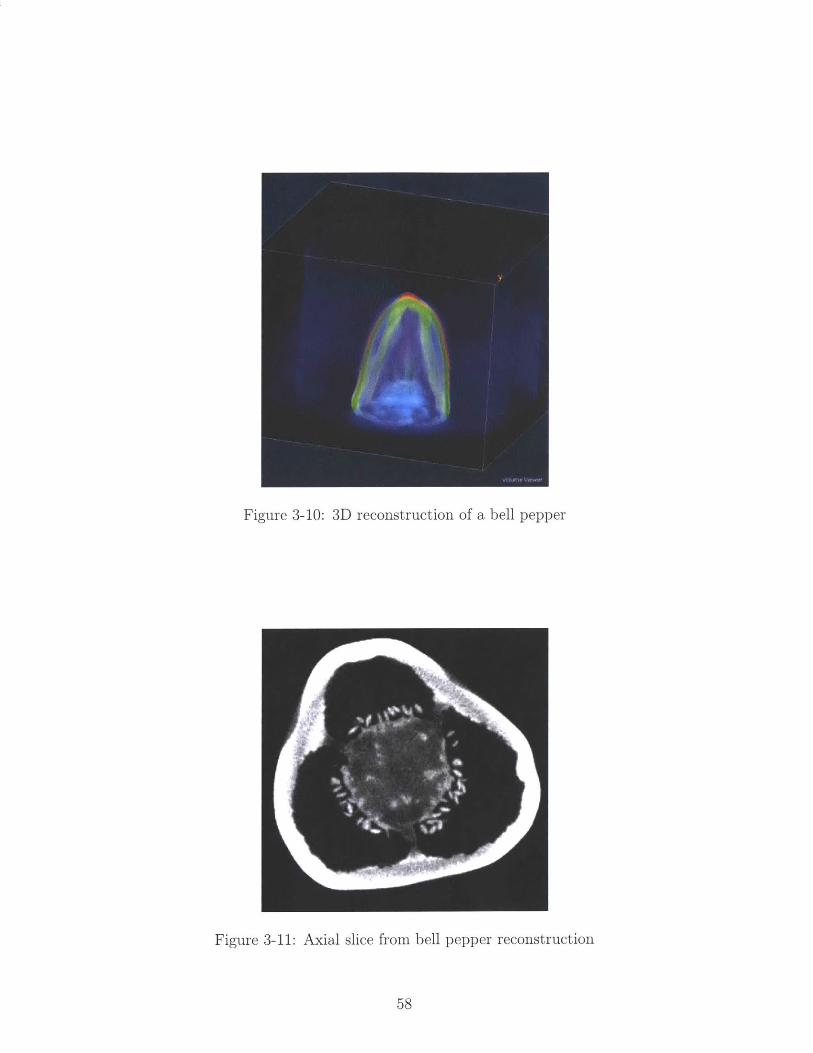
By turning the sources on and off one after another in series, we are able to demon-strate limited-angle x-ray tomography without any moving parts. With a clinicalflat-panel detector, we demonstrate 3D reconstructions of several biological samples.
Thesis Supervisor: Elfar AdalsteinssonTitle: Professor, MIT EECS & IMES
Thesis Supervisor: Rajiv GuptaTitle: Associate Professor, Harvard Medical School
3
4
Funding Acknowledgements
I was supported by the National Institute of Biomedical Imaging and Bioengineering
(NIBIB), of the National Institutes of Health under award number 5T32EB1680; by
the US Army Medical Research Contract Acquisition Activity under award number
W81XWH-15-C-0052; and by the Eran Broshy Fellowship in Medical Engineering &
Science.
5
Acknowledgments & Author Contributions
This project was truly collaborative effort, and would not have be possible without
the help of our tight-knit lab group.
While I was involved with the development of everything described in the thesis,
I had particular ownership of the photocathode production, the electrical control and
PCB design, and many of the source characterization exercises.
I want to give specific credit to the people below:
- Wolfgang Krull, Tim Moulton, Dr. Xiaochun Lai, Tim Boers, Dr. Dufan Wu,
and Dr. Kai Yang at MGH. In particular, Tim M. is responsible for much of the
mechanical design and Arduino programming; Xiaochun and Tim B. developed our
calibration process; Dufan was the lead on the image reconstruction; Wolfgang was
responsible for the coordinating the overall system design and integration; and Kai
helped with the source characterization experiments as well as radiation safety in the
lab.
- Steve Kenyon, Zaven Arzoumanian, Keith Gendreau, and the rest of the NICER
team at the National Aeronautics and Space Administration's Goddard Spaceflight
Center. They were the ones who first thought of coating Channeltrons with magne-
sium, and did the precision aluminum and tungsten machining.
- Jake Hecla, formerly at MIT NSE, for much of the high-voltage system design,
and for his work getting this project off the ground in the year before I joined the
Gupta lab.
In addition, I would also like to extend my thanks to
- Leigh Ann Kesler, Pete Stahl, Cody Dennett, Steven Jeapal and Prof. Michael
Short at MIT nuclear science and engineering for all of their help disassembling,
re-assembling, and using the thermal evaporator.
- Dr. Achuta Kadambi, formerly of the MIT Media Lab, for all of our long con-
versations on graduate school and photon-arrival x-ray imaging. Congratulations on
a successful PhD defense!
I owe also a great deal to my thesis supervisors,
6
- Prof. Elfar Adalsteinsson, at MIT EECS, for his support on the production of
this thesis
- Prof. Rajiv Gupta, at Harvard Medical School, for his guidance and leadership
in the last few years, and his encyclopedic knowledge of the history, systems, and
practice of radiology.
None of this would have been possible for me without the tremendous love and
support of my friends and family. I would like to thank my parents, Alan Cramer
and Jayashree Kalpathy-Cramer, for their tremendous life-long support, teaching, and
encouragement. I would also like to thank my grandparents, and in particular, my
grandmother Ananthy Kalpathy, who, we recently learned, was a researcher in x-ray
devices in the early 60s.
Finally, the best part of my experience at MIT has been my peers. To all of my
friends, classmates, and climbing buddies who help keep me sane - this one's for you.
1.2 Common scintillators in medical imaging . . . . . . . . . . . . . . . . 29
1.3 K-line of common anode element choices for x-ray imaging . . . . . . 31
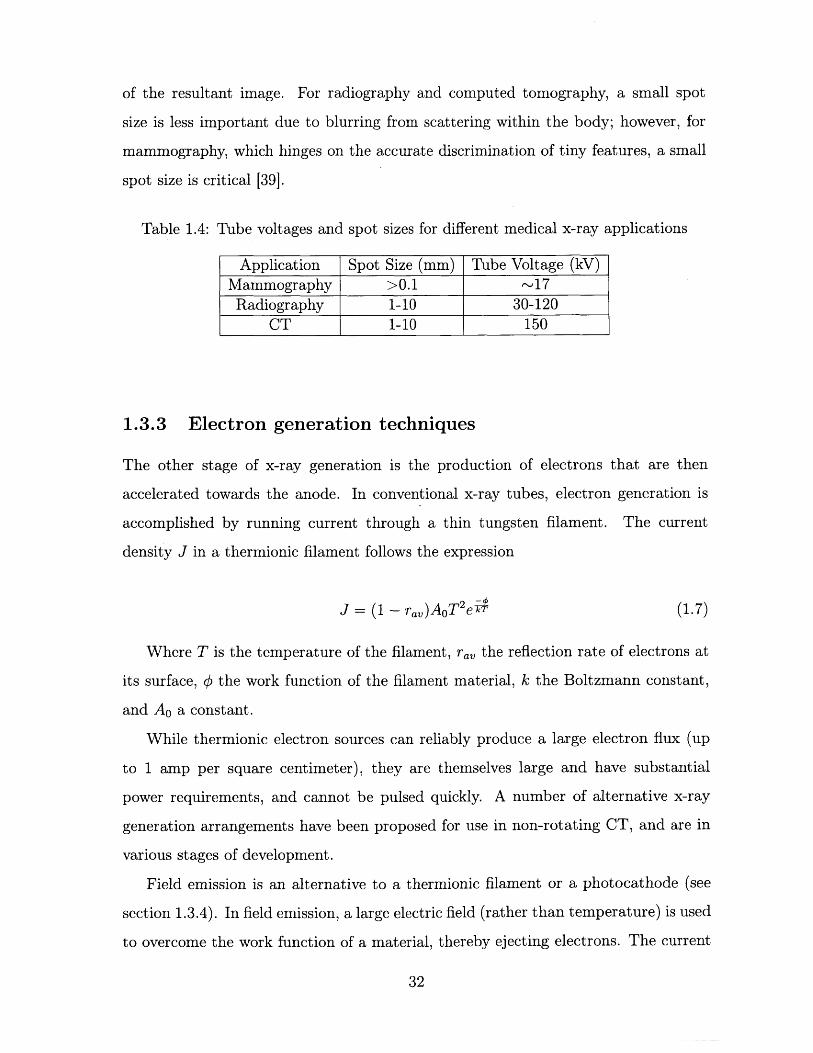
1.4 Tube voltages and spot sizes for different medical x-ray applications . 32
13
14
Chapter 1
Introduction
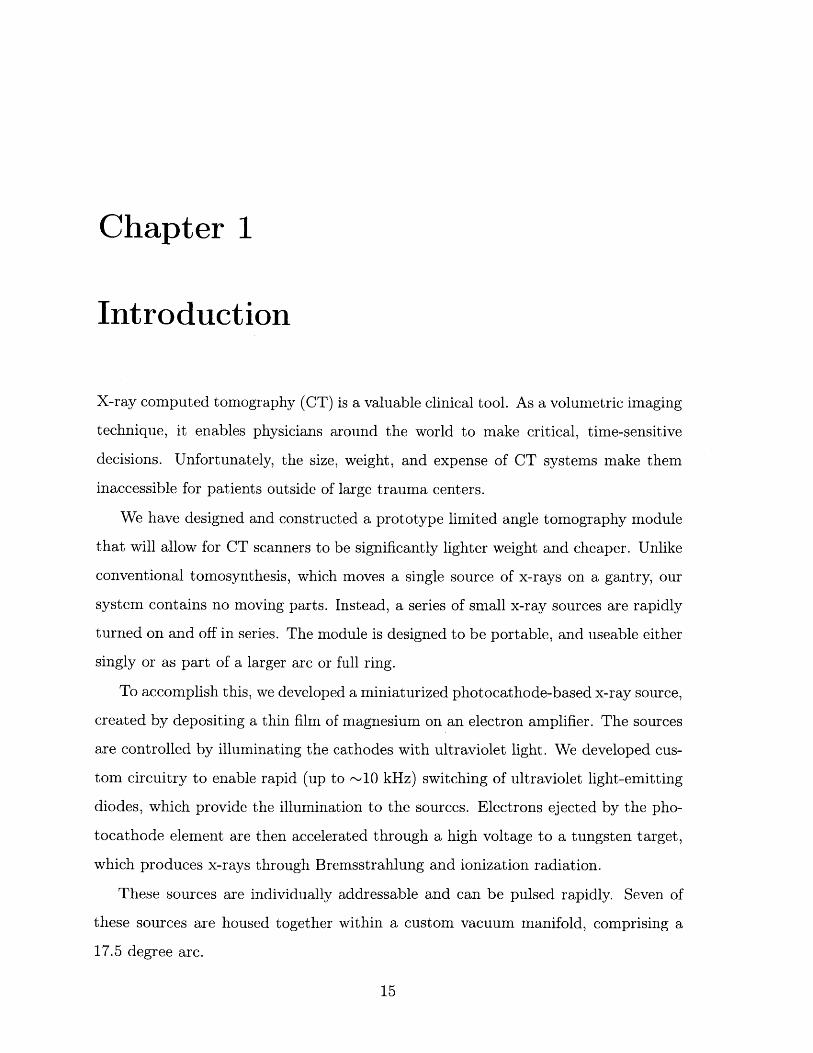
X-ray computed tomography (CT) is a valuable clinical tool. As a volumetric imaging
technique, it enables physicians around the world to make critical, time-sensitive
decisions. Unfortunately, the size, weight, and expense of CT systems make them
inaccessible for patients outside of large trauma centers.
We have designed and constructed a prototype limited angle tomography module
that will allow for CT scanners to be significantly lighter weight and cheaper. Unlike
conventional tomosynthesis, which moves a single source of x-rays on a gantry, our
system contains no moving parts. Instead, a series of small x-ray sources are rapidly
turned on and off in series. The module is designed to be portable, and useable either
singly or as part of a larger arc or full ring.
To accomplish this, we developed a miniaturized photocathode-based x-ray source,
created by depositing a thin film of magnesium on an electron amplifier. The sources
are controlled by illuminating the cathodes with ultraviolet light. We developed cus-
tom circuitry to enable rapid (up to -10 kHz) switching of ultraviolet light-emitting
diodes, which provide the illumination to the sources. Electrons ejected by the pho-
tocathode element are then accelerated through a high voltage to a tungsten target,
which produces x-rays through Bremsstrahlung and ionization radiation.
These sources are individually addressable and can be pulsed rapidly. Seven of
these sources are housed together within a custom vacuum manifold, comprising a
17.5 degree arc.
15
By turning the sources on and off one after another in series, we are able to
demonstrate limited-angle x-ray tomosynthesis without any moving parts. With a
standard clinical flat-panel detector, we demonstrate 3D reconstructions of several
biological samples.
By replacing the single source and rotating gantry of conventional CT with a
distributed ring of miniaturized, photocathode-based x-ray sources, our prototype
demonstrates a novel reimagining of the tomographic x-ray imaging.
1.1 Volumetric Imaging Techniques
1.1.1 Conventional CT
Computed tomography (CT), also known as computed axial tomography (CAT), is a
versatile 3D x-ray imaging modality, is the diagnostic standard for the management
of stroke, traumatic brain injury, and many other emergent conditions. More broadly,
multi-angle tomosynthesis - passing an x-ray beam through a sample and measuring
its intensity at a multitude of angles around a common axis - is used in a variety of
medical and industrial applications. Tomosynthesis produces a data set consisting
of a large number of projections through the same cross-section at different angles.
'Tomography' is generally used to refer to volumetric imaging from a full ring of
acquisition angles, while 'tomosynthesis' generally refers to a volumetric imaging from
an arc ('limited angle') of acquisition angles. Computational algorithms such as the
inverse Radon transform are then used to create an attenuation image of the cross-
section from the series of projection images [251.
Conventional CT systems use a large thermionic source mounted opposite a de-
tector on a helical gantry. Images are acquired from hundreds of angles as the gantry
spins at up to 300 rpm. As such, the spinning gantry is a substantial mechanical and
electrical engineering challenge.
The design and construction of clinical CT has undergone several changes over
the years. First generation CT system used a pencil beam x-ray source, and a single
16
detector that rotated opposite the source. The detector and source would move both
linearly and radially to get a full image, an acquisition scheme known as 'translate-
rotate'. The slice thickness (z-axis resolution) was determined by collimator settings
on x-ray tube. First generation CT scanners had a 25-30 minute scan time.
Second generation CT replaced the pencil beam with a fan beam x-ray source. An
asymmetrical spot size (created by angling the anode target relative to the electron
beam) is used to reduce dose outside the detector field of view (FOV) for each acquisi-
tion. As in first-gen CT, second gen used a 'translate-rotate' acquisition scheme, but
with multiple detectors in an array opposite the source rather than a single detector.
Having a larger fan beam and multiple detectors reduced the scan time to around 90
seconds.
In third generation CT, a large fan beam x-ray source is used, with large detector
array that moves opposite the source. The x-ray irradiation area is large enough that
no translation required, as the fan entirely encompasses the patient. 3rd generation
CT scanners also saw the introduction of a helical slip ring, a mechanical gantry
system where x-ray sources trance a single helical path around the patient, allowing
for very fast scan times (on the order of 30 seconds for a whole body scan). 3 rd
generation CT is widely adopted as the standard in modern hospitals.
Fourth generation CT in very similar to 3 rd generation CT, with the key difference
that the detector array comprises a full 360 degrees, meaning that no detector motion
is required [25, 64].
Recently, dual energy CT have been introduced in hospitals as well. In dual energy
CT, a single area is imaged with x-rays at two different energies. The difference
between the two resultant images can provide additional contrast. Dual energy CT
imaging is accomplished using two sources at different voltages and angles, or else a
single source that is quickly switching between two voltages [24].
While a large number of variations exist on the general principle, nearly all use
a moving gantry holding a thermionic x-ray source. Some non-rotating CT concepts
have been realized using electron accelerators and a magnetically steered beam aimed
at a large ring anode surrounding the target object, although they have not yet been
17
widely adopted, for technical and economic reasons.
CT can be combined with an intravenous contrast agent, such as iodine, in a
technique known as CT angiography (CTA). CTA is a quick and robust method of
visualizing blood vessels.
It is worth comparing and contrasting CT to three other volumetric imaging
modalities: ultrasound, magnetic resonance imaging (MRI), and positron emission
tomography (PET). While MRI and ultrasound deliver no ionizing radiation, the
typical dose' delivered to the patient for a head CT is 2-4 milliSieverts (mSv), and
for an abdomen CT is 10-20 mSv. For PET, the typical dose is on the order of 7
mSv. The average American receives a yearly radiation dose of 6.2 mSv, roughly half
of which comes from medical procedures.
If the linear-no-threshold (LNT) model of cancer risk is to be believed, it is possi-
ble that up to 2 percent of all cancers in the US are caused from radiation delivered by
CT alone 181. However, that figure is debated [69, 62], and assumes a whole-body,
uniform dose from computed tomography. The LNT model itself widely disputed.
This debate is unlikely to be resolved as a controlled trial of human radiations would
be unethical and impractical, but the minimum yearly dose clearly linked to an in-
crease in cancer risk is 100 mSv.
In any case, CT also has many advantages over MRI. CT is a much quicker
procedure than MRI. Additionally, MRI is contraindicated for patients with embedded
shrapnel, cardiac pacemakers, or other ferrous metal implants, as they are a significant
burn and trauma risk in the presence of powerful magnetic fields. MRI, PET, and
CT are unavailable for bariatric patients who cannot fit in the bore of the respective
imaging system (typically on the order of 80 cm). Many CT and MRI protocols use
a contrast agent, which also presents the risk of an adverse reaction in the patient.
1.1.2 PET
Another volumetric medical imaging technique is positron emission tomography (PET).
In PET imaging, a solution containing a molecule (commonly a sugar, such as raclo-
'Effective dose
18
pride) tagged with an unstable radioactive isotope is injected into the patient. As
the isotope decays, it releases a positron (an electron anti-particle), which annihilates
an electron and release two 511 keV gamma rays in opposite directions. A ring of of
high-speed gamma ray detectors surrounds the patient. By recording simultaneous
detections, it is possible to form a 3D intensity map of the tagged molecule. PET
is a powerful tool in that it can provide physicians and scientists with biochemical
activity information within the body. However, since images are a stochastic map of
the location of tagged molecules, the poor anatomical from PET images is quite poor
[43, 38].
1.1.3 Ultrasound
Ultrasound is a medical imaging modality that uses the reflection of high frequency (1-
18 MHz, depending on the application) sound waves to image soft tissue. Ultrasound
has essentially no medical risk (such as from ionizing radiation or contrast agents),
and is highly portable- as such, it is often the preferred imaging tool in low-resource
environments. However, ultrasound is limited in its ability to penetrate deep into
tissue or bone [34, 33].
1.1.4 MRI
In MRI, a large magnetic field (typically 3 Tesla) is used to align a small fraction
of odd-numbered nuclei within the patient. A radio frequency (RF) pulse at the
Larmor frequency of the protons in the magnetic field is used to flip a fraction of the
aligned nuclei to a higher-energy state. As the particles 'relax' to the lower energy
state, they emit an RF pulse at the same frequency. The delay before this second
pulse is emitted is known as the relaxation time, and is dependent on the interaction
of individual protons with charged particles in their vicinity. Different tissue types
have different proton densities and thus different relaxation times. This diversity in
relaxation times provides the contrast in MRI images.
Simultaneous PET/CT, PET/MRI and MRI/CT system have all seen use in re-
19
cent years [56, 35, 41]. PET provides activity data, but poor resolution and anatomic
data. CT provides anatomical information, and in conjunction with an intravenous
contrast agent (CT angiography), can provide an excellent visualization of bone and
blood vessels. MRI provides exceedingly high resolution anatomical data as well as
soft tissue contrast.
However, the engineering challenge of having multiple modalities image the same
subject without interfering with each other is non-trivial, and additional imaging
procedures can have risks of their own, especially if they involve ionizing radiation.
The use of PET/CT for oncological management in young people, in particular, has
been critiqued [21]. Regardless, a smaller form-factor CT system could be more
easily combined with other imaging systems.
1.2 Clinical Motivation
1.2.1 Disparities in Access
Worldwide, some three-quarters of the global population has no access to medical
radiography of any kind, let alone computed tomography. This relative paucity of
radiography equipment extends not just to advanced systems like MRI and CT, but
also to simple projection x-ray imaging, leading to a widespread inability to diagnose
virulent and debilitating conditions such as tuberculosis [61]. The disparities in
access for volumetric imaging are even more acute. In OECD2 countries [42], there
is an average on 1 CT scanner per 65,000 people. In low-income countries 3, there is
one CT scanner per 3,500,000 people.
1.2.2 Stroke Management
Even in high-income nations, CT systems are generally only available in major trauma
center hospitals, and need to be supplied with continuous, 3-phase power. This lack
2 Organization for Economic Co-operation and Development, a collection of 35 mostly high-incomenations
3 Defined as having a per capital Gross National Income of less than $1005 (2016 dollars)
20
of portability contributes the particular challenges of healthcare delivery in rural com-
munities, but affects pre-hospital care in essentially every demographic community.
CT is used to diagnose a wide variety of illness and injuries: traumatic brain in-
juries, pulmonary embolisms, even appendicitis4 . One especially common pathology
where CT helps guide critical medical decision making is stroke. Stroke - hypoperfu-
sion of brain tissue - is the second leading cause of death worldwide and the leading
cause of disability in the US. Stroke symptoms include one-side paralysis, slurring,
vertigo, and many others. Even when survived, strokes often result in permanent
brain damage. Timely interventions are crucial to stroke management [57].
Strokes come in two broad flavors: hemorrhagic (bleeding) and ischemic. Ischemic
strokes can be further subdivided' into two subcategories: thrombotic (caused by a
clot), and embolic (caused by a embolus, a catch-all term for a variety of blockages).
In ischemic strokes, timely treatment by thrombolytic drugs (such as recombinant
tissue plasminogen activators) can be critical step to saving lives and brain tissue.
However, in a hemorrhagic stroke, one of the blood vessels inside the skull is bleeding,
filling a portion of the cranial cavity with blood. In the case of a hemorrhagic stroke,
delivering thromobolytic drugs would be a devastating and possibly fatal mistake.
Distinguishing between ischemic and hemorrhagic strokes is accomplished through
neuroimaging.
As per the MGH stroke management guidelines [171, patients with symptoms
indicative of a stroke first receive a non-contrast CT to determine if the stroke is
hemorrhagic or ischemic, and to rule out a non-stroke pathology (termed a 'mimic')'.
In the case that the stroke is ischemic, patients receive an intravenous contrast injec-
tion, and CT angiography scan. This is done to visualize the occlusion, and the extent
of the occluded area. Finally, a diffusion weighted MR image (DWI) is performed to
determine the extent of tissue death, and subsequently whether a given patient is a
candidate for more invasive, mechanical removal of a thrombus/embolus. Variations
4As the author can attest from a June 2017 incident5 Technically, systemic hypoperfusion (low-blood pressure) can also cause ischemia in brain tissue.6 Hypo/hyperglycemia, epilepsy, multiple sclerosis, and intracranial tumors are common stroke
mimics
21
of this protocol are used in hospitals around the world [63, 23, 7, 58, 32].
Given the importance of CT in stroke management, and the widespread prevalence
of strokes, one of the most convincing applications for a mobile CT scanner is the
prompt diagnosis of stroke. A CT scanner that could fit in an ambulance could
possibly allow paramedics to distinguish between hemorrhagic and ischemic strokes,
and in the latter case, deliver thrombolytic drugs in the field.
A few mobile head CT systems have been pioneered in recent years, but they
are not without their drawbacks. Neurologica has introduced the 1592 kg BodyTom,
and the 438 kg CereTom as mobile systems for body and neuroimaging, respectively;
Toshiba markets a mobile CT system that requires a dedicated multi-axle trailer.
Mobile stroke units (basically, a CT scanner in a tractor-trailer) have been im-
plemented by pre-hospital care providers, and provided positive patient outcomes in
a few communities in Germany and in the US [11, 70]. The benefits of pre-hospital
Computed Tomography Angiography (CTA), in particular, have been reported on
in the last few months [23]. However, mobile stroke units (MSUs) have an annual
operating cost of approximately 1 million USD (for 12 hours of use a day), and in
some areas treat as few as 1.5 patients per week [7].
Because of their costs and marginal gains in health outcomes, the reception of mo-
bile stroke units by the EMS community has been lukewarm. A searing 2017 review
of the technology in the Journal of Emergency Medical Services notes that "[mo-
bile stroke units] are expensive and financially non-sustainable. Without widespread
deployment, they stand to benefit few, if any, patients. The money spent on these de-
vices would be better spent on improving the current EMS system including paramedic
education, the availability of stroke centers, and on the early recognition of ELVO
[emergent large vessel occlusion] strokes" [5].
An editorial in Emergency Physicians Monthly was even harsher, claiming that
A computed tomography system that does not have any moving parts, could be
significantly cheaper, lighter, and more portable than current mobile stroke units.
This could address many critiques of the current MSU systems.
22
1.2.3 Traumatic Brain Injuries
Stroke is not the only pathology for which CT is a preferred imaging system. Although
imaging guidelines in head injuries is still an area of active debate and research, CT
currently (and for the foreseeable future) plays a large role in clinical management of
traumatic brain injury (TBI).
In the first 24 hours following a head injury - and if imaging is indicated - CT
is the preferred neuroimaging technique. CT is best imaging tool for detecting skull
fractures, acute subarachnoid, and parenchymal hemorrhages, the latter two of which
are deadly and rapidly emergent conditions that can require immediate interven-
tion [73, 45]. MRI is occasionally in recommended TBI management 48-72 hours
after injury if there is a suspicion of certain of late-changing conditions (subtle le-
sions), or in the detection of subacute and chronic conditions. PET and ultrasound
not likely to be useful in acute head injury management, as the former offers too poor
anatomic resolution and the latter is unable to penetrate the skull [3].In both stroke and TBI management, CT has a vital role in early stages of care.
For these conditions and many others, CT is powerful and versatile tool in emergency
medical care, and especially in the critical first hours of treatment. In emergency
settings, CT has the addition advantage of a quick scan time, making it easier for
patients who are intubated, agitated, or who have limbs in splints or traction.
1.2.4 Combat Care
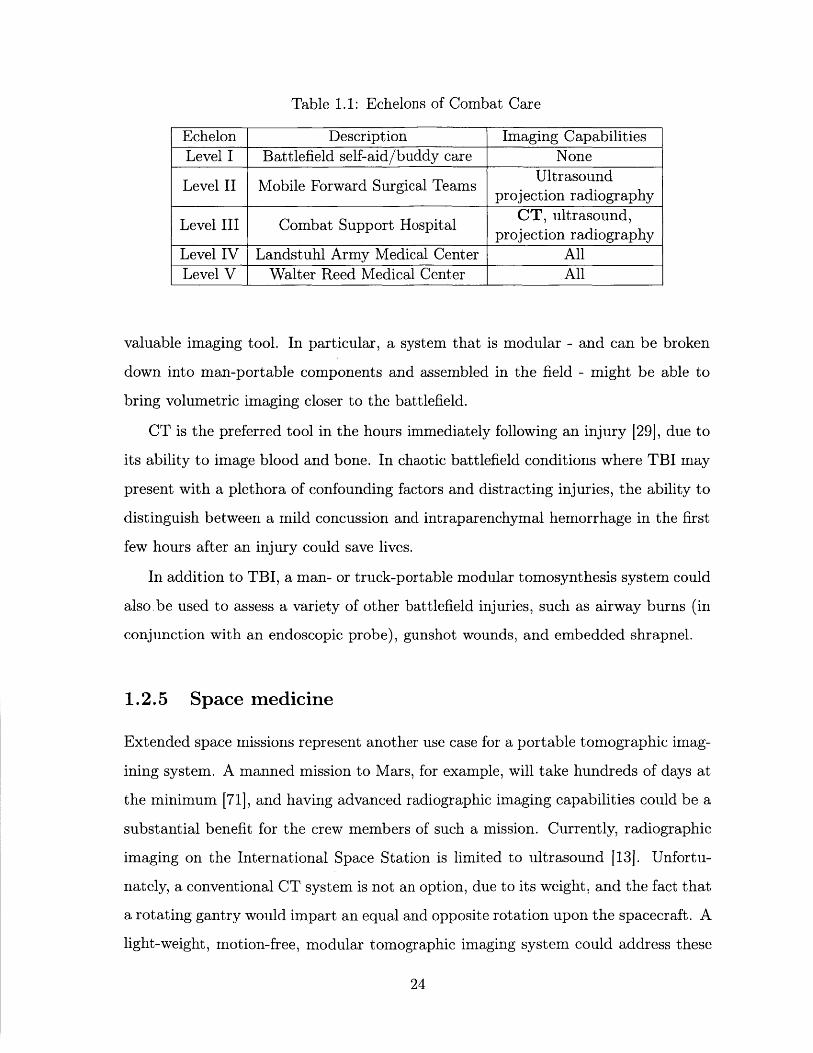
As shown in Table 1.1 NATO military care in the wars in Iraq and Afghanistan is
divided into five echelons of care [1].
CT is not typically available to Echelon I or II combat care. This includes aircraft
carriers, mobile forward surgical teams, and forward operating bases, which generally 7
operate without a volumetric medical imaging capability, despite performing surgeries
that would routinely be accompanied by volumetric imaging in the civilian world [14].
Developing a motion free CT system could dramatically increase access to this7During the Iraq war, one mobile forward surgical team in Mosul was occasionally equipped with
a single CT system
23
Table 1.1: Echelons of Combat Care
Echelon Description Imaging CapabilitiesLevel I Battlefield self-aid/buddy care None
UltrasoundLevel II Mobile Forward Surgical Teams .jtradprojection radiography
Level III Combat Support Hospital CT, ultrasound,projection radiography
Level IV Landstuhl Army Medical Center AllLevel V Walter Reed Medical Center All
valuable imaging tool. In particular, a system that is modular - and can be broken
down into man-portable components and assembled in the field - might be able to
bring volumetric imaging closer to the battlefield.
CT is the preferred tool in the hours immediately following an injury [29], due to
its ability to image blood and bone. In chaotic battlefield conditions where TBI may
present with a plethora of confounding factors and distracting injuries, the ability to
distinguish between a mild concussion and intraparenchymal hemorrhage in the first
few hours after an injury could save lives.
In addition to TBI, a man- or truck-portable modular tomosynthesis system could
also.be used to assess a variety of other battlefield injuries, such as airway burns (in
conjunction with an endoscopic probe), gunshot wounds, and embedded shrapnel.
1.2.5 Space medicine
Extended space missions represent another use case for a portable tomographic imag-
ining system. A manned mission to Mars, for example, will take hundreds of days at
the minimum [71], and having advanced radiographic imaging capabilities could be a
substantial benefit for the crew members of such a mission. Currently, radiographic
imaging on the International Space Station is limited to ultrasound [13]. Unfortu-
nately, a conventional CT system is not an option, due to its weight, and the fact that
a rotating gantry would impart an equal and opposite rotation upon the spacecraft. A
light-weight, motion-free, modular tomographic imaging system could address these
24
issues.
Even with a motion-free system, there remain many barriers to use for x-ray
imaging in space. Most prominently, getting the mass of protective lead vests (for
caregivers) out of Earth's gravity well would be a substantial expense [191. However,
a manned mission to Mars is contingent on, among other things, the development of
lightweight radiation protection for GeV energy cosmic rays [71], which are millions
of times more energetic than medical x-rays.
1.2.6 Tomosynthesis applications
Beyond CT, limited angle tomography has a number of clinical and proposed uses.
Digital Breast Tomosynthesis (DBT) is a technique that has been pioneered in recent
years in which x-ray images are acquired as the source moves in an arc across the
breast [51]. A 3D image of the breast is then reconstructed. It is currently unknown
whether DBT provides significantly better outcomes than conventional 2D mammog-
raphy. A large, randomized trial (TMIST) began in 2017 and will conclude in 2020
to assess the efficacy of DBT as breast cancer screening technique over conventional
2D mammography [22].
Another possible application for portable volumetric imaging is in the design of
custom prosthetics. Modern 3D printers allow for highly customized prosthetic com-
ponents. However, the global burden of amputations falls most heavily in areas that
lack access to volumetric medical imaging. A portable system for extremity tomosyn-
thesis could find use in the design of custom prosthetics.
Tomosynthesis of the knee and hands has also been proposed [36, 20] as a mech-
anism to study the progression of arthritis and osteoporosis.
1.3 Technical Background
In this section I discuss the physical processes by which medical x-ray images are
acquired, and how x-ray production is achieved, and relevant advances in ultraviolet
photocathode technologies.
25
1.3.1 X-ray images
X-ray is a common term of energetic electromagnetic waves with a wavelength of
10-11 to 10- meters, or equivalently, photons in the 100 to 100,000 electron-Volt
energy range.
X-ray tubes have been in use since the late 1800s for a variety of applications.
Though the size and exact function of x-ray tubes vary greatly, they all share two ba-
sic components: an electron source, and a target held at a high potential positive with
respect to the electron source [68]. The potential difference between the anode and
the cathode draws electrons from the electron source and accelerates them towards a
metal anode target, such as tungsten or molybdenum. The electron beam's interaction
with the target metal generates x-rays. Both transmission-type and reflection-type
geometries are used, the latter to create an anisotropic source at an angle to the elec-
tron beam axis. Physically, the emission of x-rays is caused by the rapid deceleration
of electrons that impact the target, a process known as Bremmstrahlung radiation,
and by the ejection of electrons from the k- or 1-shells of the target metal. Many
implementations of x-ray tubes include a method for managing the heat buildup in
the target, by liquid-cooling or rotating the target.
Conventionally, the electron source in medical x-ray tubes is a type of thermionic
source, in which a filament (often tungsten) is heated, ejecting electrons from its
surface. This occurs once the electrons have enough thermal energy to overcome the
work function of the metal. For tungsten, this occurs at temperatures above 2200
degrees C [64].
In medical x-ray tubes, a molybdenum cup is commonly used to focus the ejected
electrons onto the target anode. This focusing enables a small spot size.
X-ray imaging has a wide variety of uses in medicine. In this thesis, I focus on three
applications in particular: radiography, mammography, and computed tomography
(CT). X-ray radiography is used to diagnose orthopedic injuries, tuberculosis, and
many emergent conditions.
Mammography is an x-ray screening technique for breast cancer [491, the second
26
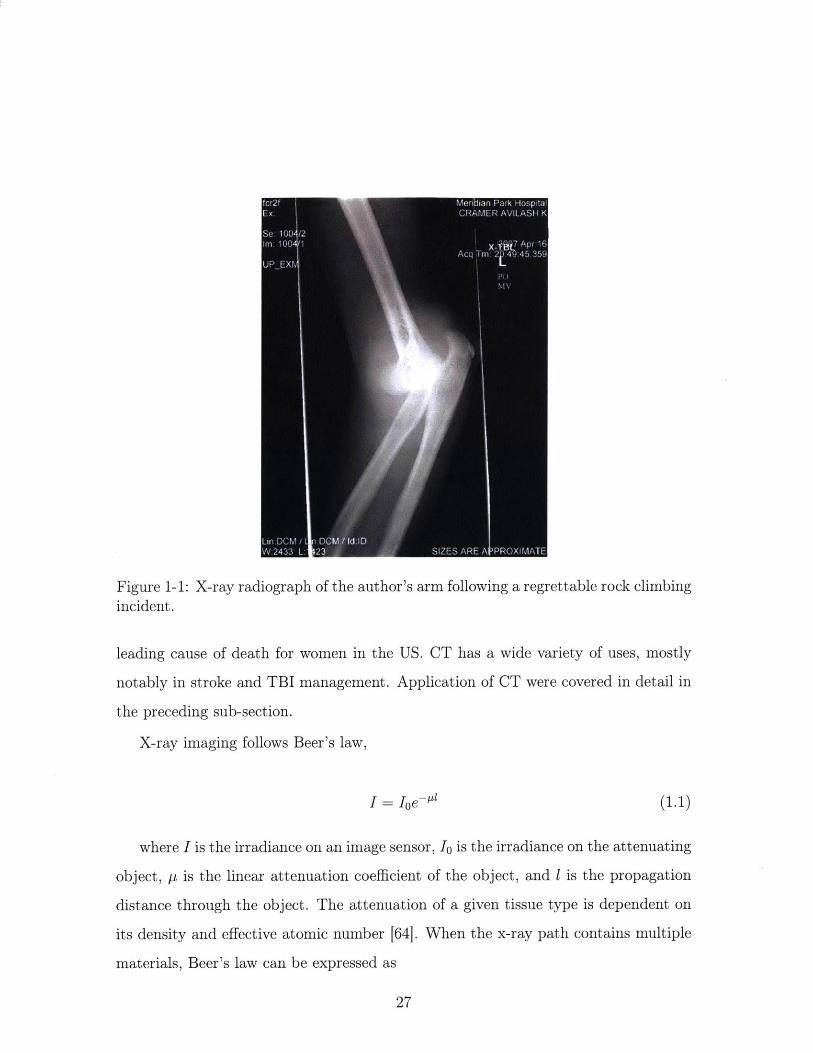
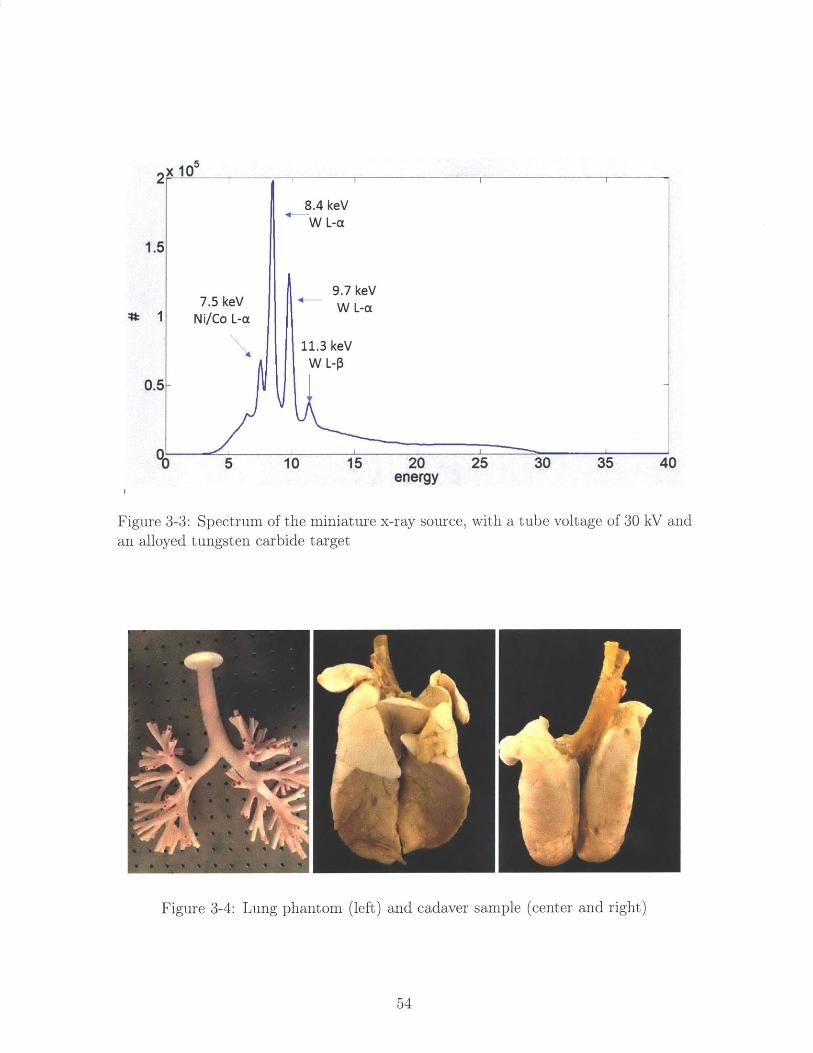
Figure 1-1: X-ray radiograph of the author's arm following a regrettable rock climbingincident.
leading cause of death for women in the US. CT has a wide variety of uses, mostly
notably in stroke and TBI management. Application of CT were covered in detail in
the preceding sub-section.
X-ray imaging follows Beer's law,
I=Ioe-- (1.1)
where I is the irradiance on an image sensor, 1 is the irradiance on the attenuating
object, p is the linear attenuation coefficient of the object, and 1 is the propagation
distance through the object. The attenuation of a given tissue type is dependent on
its density and effective atomic number [64]. When the x-ray path contains multiple
materials, Beer's law can be expressed as
27
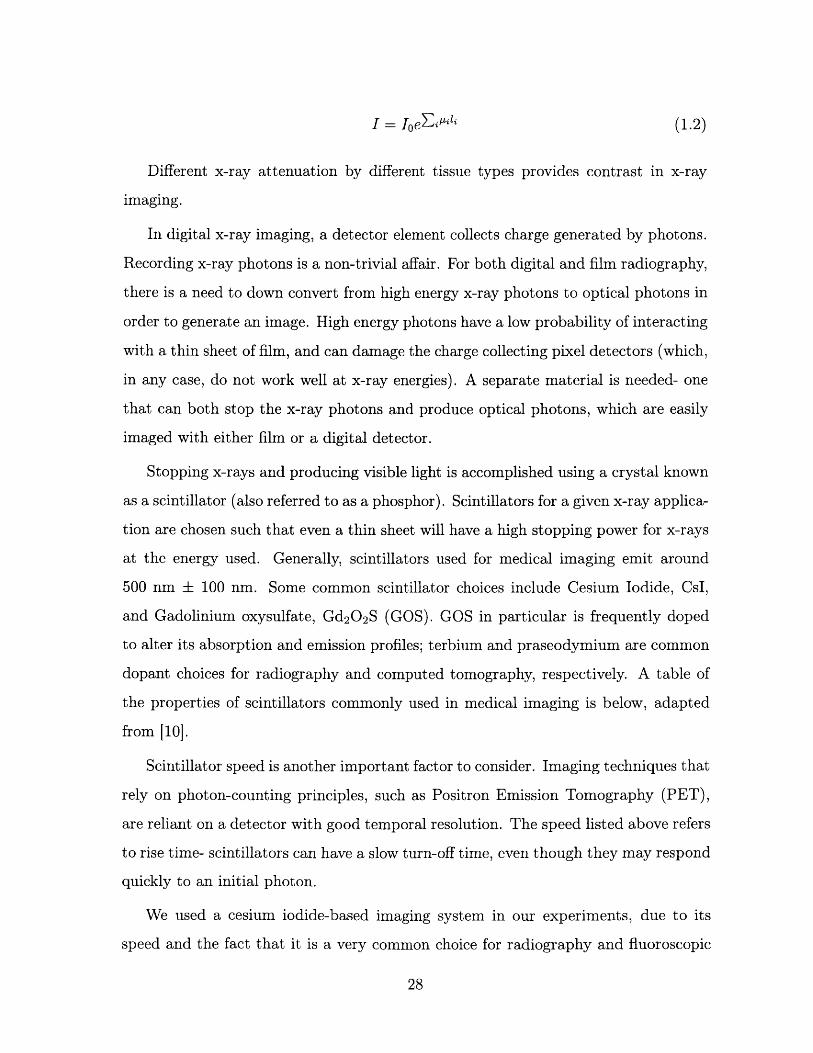
I = IoeEiii (1.2)
Different x-ray attenuation by different tissue types provides contrast in x-ray
imaging.
In digital x-ray imaging, a detector element collects charge generated by photons.
Recording x-ray photons is a non-trivial affair. For both digital and film radiography,
there is a need to down convert from high energy x-ray photons to optical photons in
order to generate an image. High energy photons have a low probability of interacting
with a thin sheet of film, and can damage the charge collecting pixel detectors (which,
in any case, do not work well at x-ray energies). A separate material is needed- one
that can both stop the x-ray photons and produce optical photons, which are easily
imaged with either film or a digital detector.
Stopping x-rays and producing visible light is accomplished using a crystal known
as a scintillator (also referred to as a phosphor). Scintillators for a given x-ray applica-
tion are chosen such that even a thin sheet will have a high stopping power for x-rays
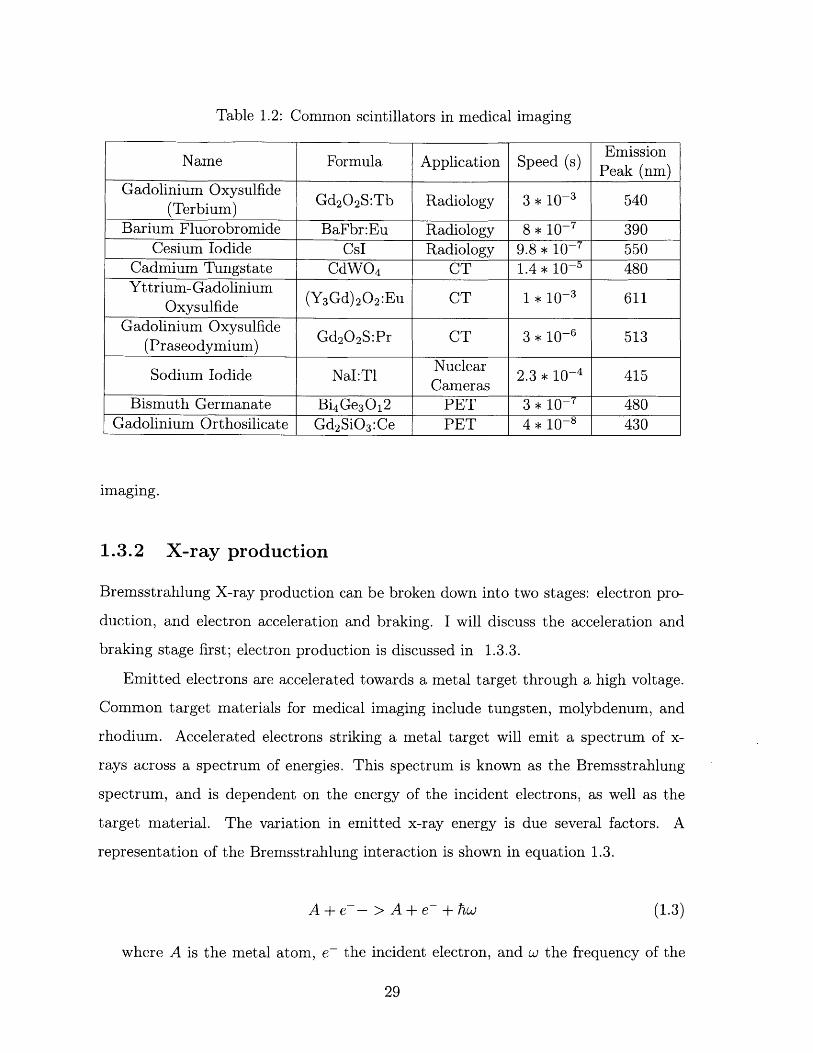
at the energy used. Generally, scintillators used for medical imaging emit around
500 nm 100 nm. Some common scintillator choices include Cesium Iodide, CsI,
and Gadolinium oxysulfate, Gd2 0 2 S (GOS). GOS in particular is frequently doped
to alter its absorption and emission profiles; terbium and praseodymium are common
dopant choices for radiography and computed tomography, respectively. A table of
the properties of scintillators commonly used in medical imaging is below, adapted
from [101.
Scintillator speed is another important factor to consider. Imaging techniques that
rely on photon-counting principles, such as Positron Emission Tomography (PET),
are reliant on a detector with good temporal resolution. The speed listed above refers
to rise time- scintillators can have a slow turn-off time, even though they may respond
quickly to an initial photon.
We used a cesium iodide-based imaging system in our experiments, due to its
speed and the fact that it is a very common choice for radiography and fluoroscopic
28
Table 1.2: Common scintillators in medical imaging
FEmissionName Formula Application Speed (s) Peak (nm)
ify an IP address for Ethernet, or Local IDSB. If FirstFound is selected, Local ID isred for USB.
Read Values
HV (kV)
Current (mA)
Mutt HV (kV)
10.000000
0 Pump on
A 0 E-stopped
FST OP
rts/iteretion
ow sit e
eroroutcode
source
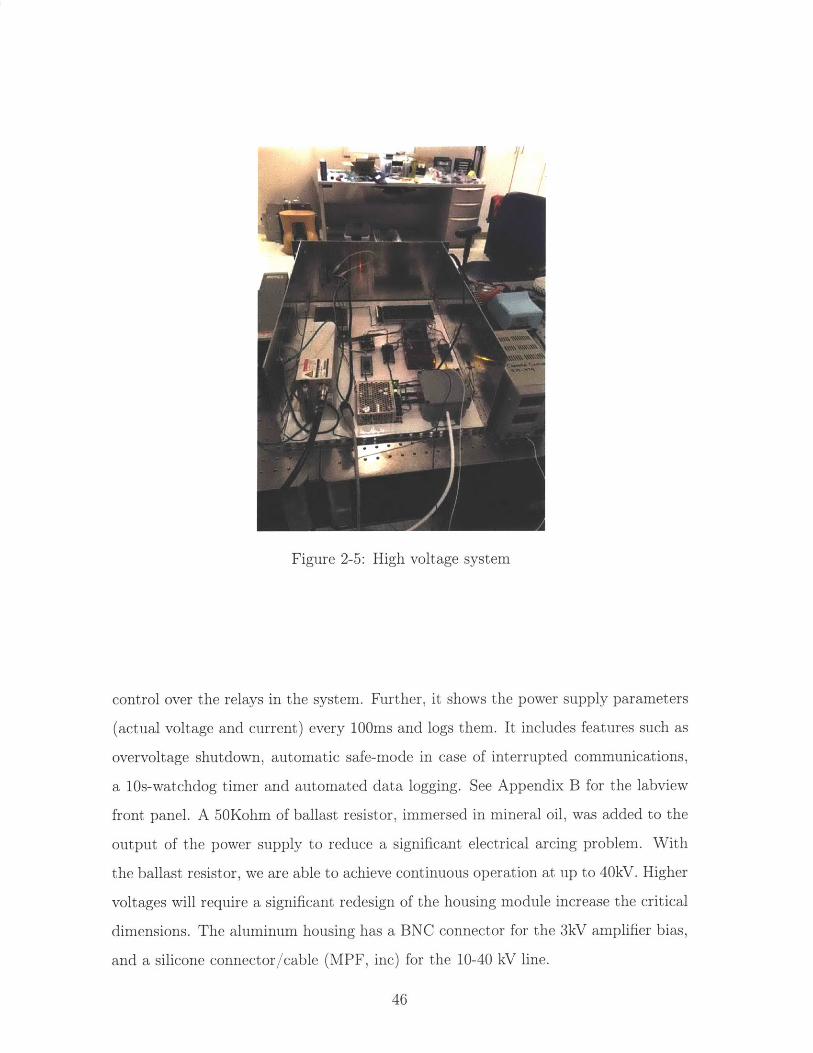
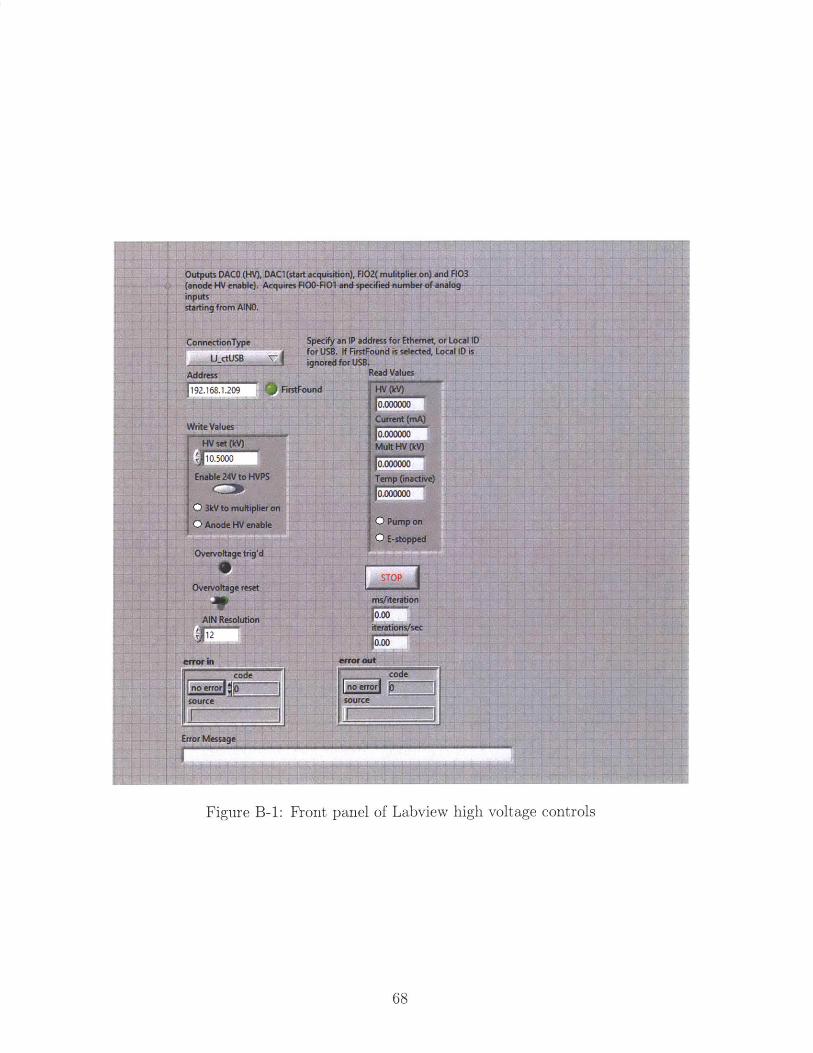
Figure B-1: Front panel of Labview high voltage controls
68
-7 7
Appendix C
HVPS Block Diagram
USB
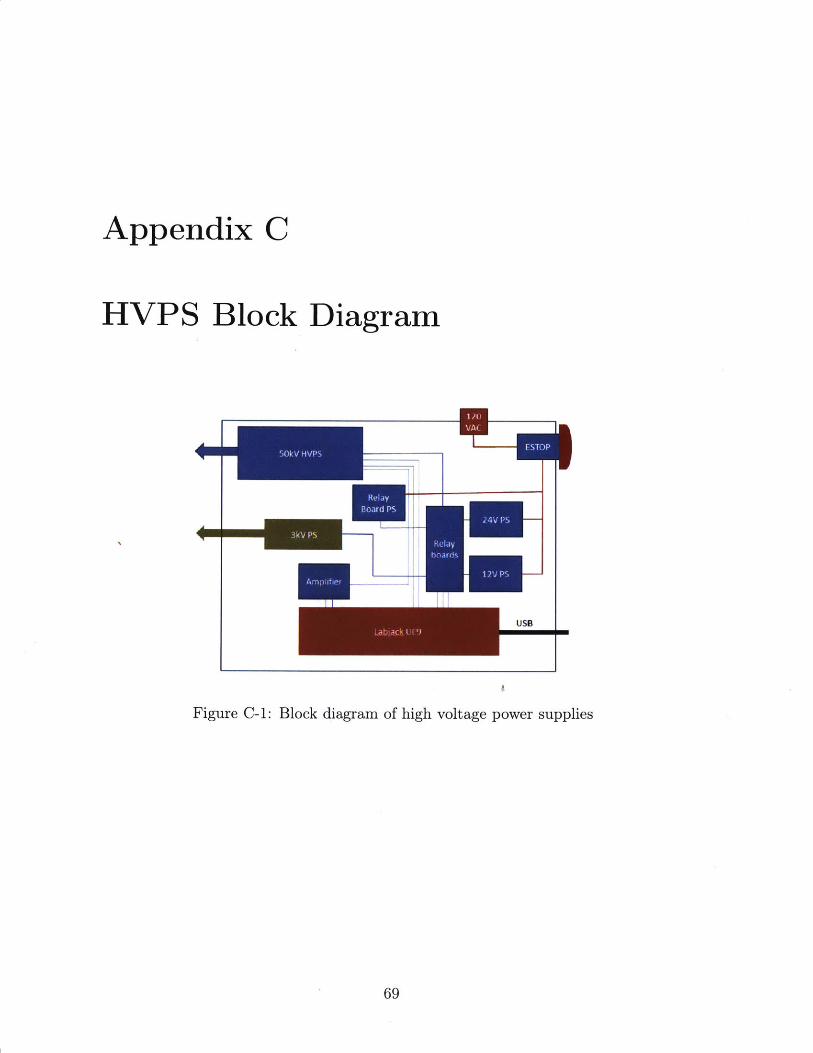
Figure C-1: Block diagram of high voltage power supplies
69
Relay
Board PS
70
...... ............ .. .--- , - .--. ",- -1-11 "1,.,,. 1 - I I - I I I- I 1-1- 1--l- -;-- 11 1 1 . I I I -, , I 1 -1 1 11 1 1 - - 1 -1 -- l-I'll I .-I
Bibliography
[1] Mark R. Bagg, Dana C. Covey, and Elisha T. Powell. Levels of medical care in theglobal war on terrorism. The Journal of the American Academy of OrthopaedicSurgeons, 14(10 Spec No.):S7-9, 2006.
[2] R. J. Batt and C. H. B. Mee. Effect of Film Structure on Photoelectric Emissionfrom Thin Films of Aluminium. Journal of Vacuum Science and Technology,6(4):737-740, July 1969.
[3] Miriam H. Beauchamp, Michael Ditchfield, Franz E. Babl, Michael Kean, CathyCatroppa, Keith 0. Yeates, and Vicki Anderson. Detecting Traumatic BrainLesions in Children: CT versus MRI versus Susceptibility Weighted Imaging(SWI). Journal of Neurotrauma, 28(6):915-927, April 2011.
[4] H. Bethe and W. Heitler. On the stopping of fast particles and on the creationof positive electrons. Proc. R. Soc. Lond. A, 146(856):83-112, August 1934.
[5] Bryan Blesdoe. Mobile Stroke Units: A Device in Search of an Indication. Journalof Emergency Medical Services, January 2017.
[6] Jean-Marc Bonard, Christian Klinke, Kenneth A. Dean, and Bernard F. Coll.Degradation and failure of carbon nanotube field emitters. Physical Review B,67(11):115406, March 2003.
[7] Ritvij Bowry, Stephanie Parker, Suja S. Rajan, Jose-Miguel Yamal, Tzu-ChingWu, Laura Richardson, Elizabeth Noser, David Persse, Kamilah Jackson, andJames C. Grotta. Benefits of Stroke Treatment Using a Mobile Stroke UnitCompared With Standard Management: The BEST-MSU Study Run-In Phase.Stroke, 46(12):3370-3374, December 2015.
[8] David J. Brenner and Eric J. Hall. Computed Tomography AAT An IncreasingSource of Radiation Exposure. New England Journal of Medicine, 357(22):2277-2284, November 2007.
[9] Richard Bukata. Are Mobile CT Stroke Units Worth the Price Tag? EmergencyPhysicians Monthly, January 2017.
[10] Steven Duclos. Scintillator Phosphors for Medical Imaging. The ElectrochemicalSociety Interface, 1998.
71
[11] Martin Ebinger, Benjamin Winter, Matthias Wendt, Joachim E. Weber, CarolinWaldschmidt, Michal Rozanski, Alexander Kunz, Peter Koch, Philipp A. Kellner,Daniel Gierhake, Kersten Villringer, Jochen B. Fiebach, Ulrike Grittner, AndreasHartmann, Bruno-Marcel Mackert, Matthias Endres, Heinrich J. Audebert, andSTEMO Consortium. Effect of the use of ambulance-based thrombolysis on timeto thrombolysis in acute ischemic stroke: a randomized clinical trial. JAMA,311(16):1622-1631, April 2014.
[121 Albert Einstein. On a Heuristic Point of View Concerning the Production andTransformation of Light. Annalen der Physik, 17:132-148, 1905.
[13] C. Michael Foale, Alexander Y. Kaleri, Ashot E. Sargsyan, Douglas R. Hamilton,Shannon Melton, David Martin, and Scott A. Dulchavsky. Diagnostic Instru-mentation Aboard ISS: Just-In-Time Training for Non-Physician Crewmembers.Aviation, Space, and Environmental Medicine, 76(6):594-598, June 2005.
[14] Les Folio. Combat Radiology: Diagnostic Imaging of Blast and Ballistic Injuries.Springer, New York, NY, June 2010.
[15] Keith C. Gendreau, Zaven Aroumanian, Steven J. Kenyon, and Nick SalvatoreSpartana. Miniaturized high-speed modulated x-ray source, February 2014. U.S.Classification 378/123, 378/136; International Classification H01J35/06; Coop-erative Classification H01J35/06, H05G1/70, H01J35/065.
[16] E L Gingold, X Wu, and G T Barnes. Contrast and dose with Mo-Mo, Mo-Rh,and Rh-Rh target-filter combinations in mammography. Radiology, 195(3):639-644, June 1995.
[17] Ramon Gilberto Gonzalez, William A. Copen, Pamela W. Schaefer, Michael H.Lev, Stuart R. Pomerantz, Otto Rapalino, John W. Chen, George J. Hunter,Javier M. Romero, Bradley R. Buchbinder, Mykol Larvie, Joshua Adam Hirsch,and Rajiv Gupta. The Massachusetts General Hospital acute stroke imagingalgorithm: an experience and evidence based approach. Journal of Neurolnter-ventional Surgery, 5(suppl 1):i7-i12, May 2013.
[18] Robbie Gonzalez. NASA Can Use Pulsars to Navigate Deep Space. Where toNow? WIRED, January 2018.
[19] R. Hart and M. R. Campbell. Digital radiography in space. Aviation, space, andenvironmental medicine, 73(6):601-606, June 2002.
[20] Daichi Hayashi, Li Xu, Frank W. Roemer, David J. Hunter, Ling Li, Avinash M.Katur, and Ali Guermazi. Detection of Osteophytes and Subchondral Cysts inthe Knee with Use of Tomosynthesis. Radiology, 263(1):206-215, April 2012.
[21] Bingsheng Huang, Martin Wai-Ming Law, and Pek-Lan Khong. Whole-bodyPET/CT scanning: estimation of radiation dose and cancer risk. Radiology,251(1):166-174, April 2009.
72
[22] National Cancer Instititue. TMIST (Tomosynthesis Mammographic Imag-ing Screening Trial). https://www.cancer.gov/about-cancer/treatment/clinical-trials/nci-supported/tmist.
[23] Seby John, Sarah Stock, Thomas Masaryk, Andrew Bauer, Russell Cerejo, KenUchino, Stacey Winners, Peter Rasmussen, and Muhammad S. Hussain. Perfor-mance of CT Angiography on a Mobile Stroke Treatment Unit: Implications forTriage. Journal of Neuroimaging: Official Journal of the American Society ofNeuroimaging, 26(4):391-394, July 2016.
[24] Thorsten R. C. Johnson. Dual-Energy CT: General Principles. American Journalof Roentgenology, 199 (5 _supplement):S3-S8, November 2012.
[25] Willi A. Kalender. X-ray computed tomography. Physics in Medicine & Biology,51(13):R29, 2006.
[26] Faiz Khan. The Physics of Radiation Therapy, 3rd Ed. Lippincott Williams andWilkins, Philadelphia, 2003.
[27] Ahmed Kirmani, Dheera Venkatraman, Dongeek Shin, Andrea ColaAgo, FrancoN. C. Wong, Jeffrey H. Shapiro, and Vivek K. Goyal. First-Photon Imaging.Science, 343(6166):58-61, January 2014.
[28] A. V. Korol, 0. I. Obolensky, A. V. Solov'yov, and I. A. Solovjev. The full rela-tivistic description of the bremsstrahlung process in a charged particle-atom col-lision. Journal of Physics B: Atomic, Molecular and Optical Physics, 34(9):1589,2001.
[29] Bruce Lee and Andrew Newberg. Neuroimaging in Traumatic Brain Imaging.NeuroRx, 2(2):372-383, April 2005.
[30] Zejian Liu, Guang Yang, Yueh Z. Lee, David Bordelon, Jianping Lu, and OttoZhou. Carbon nanotube based microfocus field emission x-ray source for mi-crocomputed tomography. Applied Physics Letters, 89(10):103111, September2006.
[31] R.A Loch. Cesium-Telluride and Magnesium for high quality photocathodes,June 2005. Master's Thesis, University of Twente.
[32] K. 0. Lovblad, H. J. Laubach, A. E. Baird, F. Curtin, G. Schlaug, R. R. Edelman,and S. Warach. Clinical experience with diffusion-weighted MR in patients withacute stroke. American Journal of Neuroradiology, 19(6):1061-1066, June 1998.
[33] 0. J. Ma, J. R. Mateer, M. Ogata, M. P. Kefer, D. Wittmann, and C. Apra-hamian. Prospective analysis of a rapid trauma ultrasound examination per-formed by emergency physicians. The Journal of trauma, 38(6):879-885, June1995.
73
[34] 0. John Ma, Jeffrey G. Norvell, and Srikala Subramanian. Ultrasound appli-cations in mass casualties and extreme environments. Critical Care Medicine,35(5):S275, May 2007.
[35] Axel Martinez-MA fller, Michael Souvatzoglou, Gaspar Delso, Ralph A. Bund-schuh, Christophe Chefd'hotel, Sibylle I. Ziegler, Nassir Navab, MarkusSchwaiger, and Stephan G. Nekolla. Tissue Classification as a Potential Ap-proach for Attenuation Correction in Whole-Body PET/MRI: Evaluation withPET/CT Data. Journal of Nuclear Medicine, 50(4):520-526, April 2009.
[36] K. Martini, A. S. Becker, R. Guggenberger, G. Andreisek, and T. Frauenfelder.Value of tomosynthesis for lesion evaluation of small joints in osteoarthritic handsusing the OARSI score. Osteoarthritis and Cartilage, 24(7):1167-1171, July 2016.
[371 P Michelato. Photocathodes for RF photoinjectors. Nuclear Instruments andMethods in Physics Research Section A: Accelerators, Spectrometers, Detectorsand Associated Equipment, 393(1):455-459, July 1997.
[38] Gerd Muehllehner and Joel S. Karp. Positron emission tomography. Physics inMedicine & Biology, 51(13):R117, 2006.
[39] Phillip E Muntz and Wende Westinghouse Logan. Focal Spot Size and ScatterSuppression in Magnification Mammography. American Journal of Roentgenol-ogy, 133:453-459, September 1979.
[40] Schoenitz M Dreizin E. Nie, H. Oxidation of Magnesium: Implication for Agingand Ignition. The Journal of Physical Chemistry C, 120:974-983, December 2015.
[41] Takeshi Nishioka, Tohru Shiga, Hiroki Shirato, Eriko Tsukamoto,Kazuhiko Tsuchiya M.d, Takashi Kato, Keiichi Ohmori, Akira Yamazaki,Hidefumi Aoyama, Seiko Hashimoto, Ta-Chen Chang, and Kazuo Miyasaka.Image fusion between 18fdg-PET and MRI/CT for radiotherapy planningof oropharyngeal and nasopharyngeal carcinomas. International Journal ofRadiation Oncology, 53(4):1051-1057, July 2002.
[431 J. M. Ollinger and J. A. Fessler. Positron-emission tomography. IEEE SignalProcessing Magazine, 14(1):43-55, January 1997.
[441 D Palmer. A Review of Metallic Photocathode Research, 2005. SLAC-TN-05-080.
[45] Hae-Kwan Park, Won-Il Joo, Chung-Kee Chough, Chul-Beom Cho, Kyung-JinLee, and Hyoung-Kyun Rha. The clinical efficacy of repeat brain computed to-mography in patients with traumatic intracranial haemorrhage within 24 hoursafter blunt head injury. British Journal of Neurosurgery, 23(6):617-621, Decem-ber 2009.
74
[46] Richard Parmee, Clare Collins, William Milne, and Matthew Cole. X-ray gener-ation using carbon nanotubes. Nano Convergence, 1(34), 2014.
[47] W. G. Penney. The photoelectric effect in thin metallic films. Proc. R. Soc.Lond. A, 133(822):407-417, October 1931.
[48] F. Le Pimpec, F. Ardana-Lamas, C. P. Hauri, and C. Milne. Quantum efficiencyof technical metal photocathodes under laser irradiation of various wavelength.Applied Physics A, 112(3):647-661, September 2013. arXiv: 1202.0152.
[49] Etta D. Pisano, Constantine Gatsonis, Edward Hendrick, Martin Yaffe, Janet K.Baum, Suddhasatta Acharyya, Emily F. Conant, Laurie L. Fajardo, LawrenceBassett, Carl D'Orsi, Roberta Jong, and Murray Rebner. Diagnostic Perfor-mance of Digital versus Film Mammography for Breast-Cancer Screening. NewEngland Journal of Medicine, 353(17):1773-1783, October 2005.
[50] G. J. van der Plaats. Medical X-Ray Techniques in Diagnostic Radiology: A text-book for radiographers and Radiological Technicians. Springer Science & BusinessMedia, December 2012. Google-Books-ID: dpfqCAAAQBAJ.
[51] Steven P. Poplack, Tor D. Tosteson, Christine A. Kogel, and Helene M. Nagy.Digital Breast Tomosynthesis: Initial Experience in 98 Women with Abnor-mal Digital Screening Mammography. American Journal of Roentgenology,189(3):616-623, September 2007.
[52] R. A. Powell, W. E. Spicer, G. B. Fisher, and P. Gregory. Photoemission Studiesof Cesium Telluride. Physical Review B, 8(8):3987-3995, October 1973.
[53] Connor Puett, Christina Inscoe, Allison Hartman, Jabari Calliste, Dora K.Franceschi, Jianping Lu, Otto Zhou, and Yueh Z. Lee. An update on carbonnanotube-enabled X-ray sources for biomedical imaging. Wiley InterdisciplinaryReviews. Nanomedicine and Nanobiotechnology, 10(1), January 2018.
[54] Xin Qian, Andrew Tucker, Emily Gidcumb, Jing Shan, Guang Yang, XiomaraCalderonaARColon, Shabana Sultana, Jianping Lu, Otto Zhou, Derrek Spronk,Frank Sprenger, Yiheng Zhang, Don Kennedy, Tom Farbizio, and Zhenxue Jing.High resolution stationary digital breast tomosynthesis using distributed carbonnanotube xaARray source array. Medical Physics, 39(4):2090-2099, April 2012.
[55] Bryan P. Ribaya, Joseph Leung, Philip Brown, Mahmud Rahman, and Cattien V.Nguyen. A study on the mechanical and electrical reliability of individual carbonnanotube field emission cathodes. Nanotechnology, 19(18):185201, May 2008.
[56] Christin Sander. Neurovascular coupling to D2/D3 dopamine receptor occupancyusing simultaneous PET/functional MRI I Proceedings of the National Academyof Sciences. Proceedings of the National Academy of Sciences, 110(27):11169-11174.
75
[57] Jeffrey L. Saver. Time Is Brain - Quantified. Stroke, 37(1):263-266, January2006.
[58] Peter D. Schellinger, Olav Jansen, Jochen B. Fiebach, Werner Hacke, and KlausSartor. A Standardized MRI Stroke Protocol: Comparison with CT in Hypera-cute Intracerebral Hemorrhage. Stroke, 30(4):765-768, April 1999.
[59] Jing Shan. Development of a Stationary Chest Tomosynthesis System UsingCarbon Nanotube X-ray Source Array. PhD thesis, UNC Chapel Hill, 2015.
[60] Jing Shan, Andrew W. Tucker, Yueh Z. Lee, Michael D. Heath, Xiaohui Wang,David H. Foos, Jianping Lu, and Otto Zhou. Stationary chest tomosynthesisusing a carbon nanotube x-ray source array: a feasibility study. Physics inMedicine & Biology, 60(1):81, 2015.
[61] Jason Silverstein. Most of the World Doesn't Have Access to X-Rays. TheAtlantic, September 2016.
[62] Rebecca Smith-Bindman. Radiation Dose Associated With Common ComputedTomography Examinations and the Associated Lifetime Attributable Risk ofCancer. Archives of Internal Medicine, 169(22):2078, December 2009.
[631 Andrew M. Southerland, Karen C. Johnston, Carlos A. Molina, Magdy Selim,Noreen Kamal, and Mayank Goyal. Suspected Large Vessel Occlusion - ShouldEMS transport to the nearest PSC or bypass to a CSC with Endovascular Ca-pabilities? Stroke; a journal of cerebral circulation, 47(7):1965-1967, July 2016.
1641 Perry Sprawls. The Physical Principles of Medical Imaging, 2nd Ed. Med-ical Physics Publishing, Madison, Wisconsin, 1995. Accessed online athttp://www.sprawls.org/ppmi2.
[651 T. Srinivasan-Rao, J. Schill, I. Ben Zvi, and M. Woodle. Sputtered magnesiumas a photocathode material for rf injectors. Review of Scientific Instruments,69(6):2292-2296, June 1998.
[66] James R. Stevenson and Eugene B. Hensley. Thermionic and Photoelectric Emis-sion from Magnesium Oxide. Journal of Applied Physics, 32(2):166-172, Febru-ary 1961.
[67] H. Sugie, M. Tanemura, V. Filip, K. Iwata, K. Takahashi, and F. Okuyama.Carbon nanotubes as electron source in an x-ray tube. Applied Physics Letters,78(17):2578-2580, April 2001.
[68] Elihu Thompson. Roentgen-ray Tube, August 1896. US575772 A. The GeneralElectric Company, Assignee.
[691 Maurice Tubiana. Computed Tomography and Radiation Exposure. New Eng-land Journal of Medicine, 358(8):850-853, February 2008.
76
[701 Silke Walter, Panagiotis Kostopoulos, Anton Haass, Isabel Keller, MartinLesmeister, Thomas Schlechtriemen, Christian Roth, Panagiotis Papanagiotou,Iris Grunwald, Helmut Schumacher, Stephan Helwig, Julio Viera, HeikoKAfirner, Maria Alexandrou, Umut Yilmaz, Karin Ziegler, Kathrin Schmidt,Rainer Dabew, Darius Kubulus, Yang Liu, Thomas Volk, Kai Kronfeld, Chris-tian Ruckes, Thomas Bertsch, Wolfgang Reith, and Klaus Fassbender. Diagnosisand treatment of patients with stroke in a mobile stroke unit versus in hospital:a randomised controlled trial. The Lancet. Neurology, 11(5):397-404, May 2012.
[71] David R. Williams and Matthew Turnock. Human Space Exploration The NextFifty Years. McGill Journal of Medicine : MJM, 13(2), June 2011.
[72] L. T. Williams, V. S. Kumsomboone, W. J. Ready, and M. L. R. Walker. Life-time and Failure Mechanisms of an Arrayed Carbon Nanotube Field EmissionCathode. IEEE Transactions on Electron Devices, 57(11):3163-3168, November2010.
[731 D. M. Yealy and D. E. Hogan. Imaging after head trauma. Who needs what?Emergency Medicine Clinics of North America, 9(4):707-717, November 1991.
[74] Quan Yuan, Aaron W. Baum, R. Fabian W. Pease, and Piero Pianetta. Effectof oxygen adsorption on the efficiency of magnesium photocathodes. Journalof Vacuum Science & Technology B: Microelectronics and Nanometer StructuresProcessing, Measurement, and Phenomena, 21(6):2830-2833, November 2003.