Laboratory for Chemical Technology, Ghent University http://www.lct.UGent.be Development of a one-Dimensional boiling model: Part I – A two-phase flow pattern map for a heavy hydrocarbon feedstock Pieter Verhees, Abdul Akhras Rahman, Kevin M. Van Geem, Geraldine J. Heynderickx 1 CHISA, Prague, 28/08/2016
Transcript
Laboratory for Chemical Technology, Ghent University
http://www.lct.UGent.be
Development of a one-Dimensional boiling model: Part I – A two-phase
flow pattern map for a heavy hydrocarbon feedstock
Pieter Verhees, Abdul Akhras Rahman, Kevin M. Van Geem, Geraldine J. Heynderickx
1
CHISA, Prague, 28/08/2016
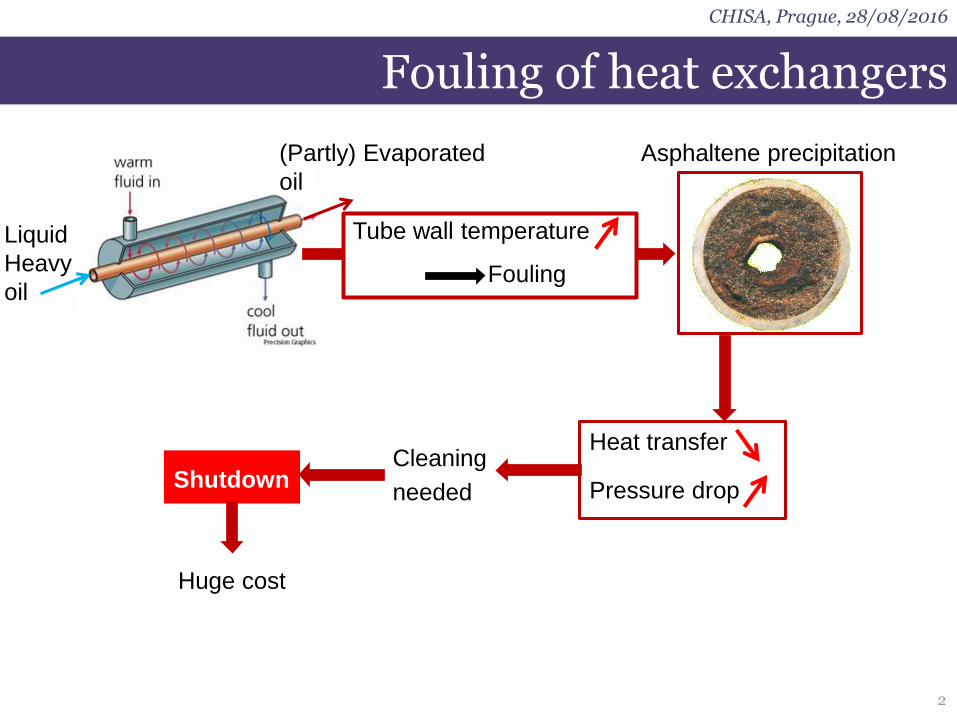
Fouling of heat exchangers
2
CHISA, Prague, 28/08/2016
Asphaltene precipitation
Liquid
Heavy
oil
Heat transfer
Pressure drop
Cleaning
needed
(Partly) Evaporated
oil
=Fouling
Tube wall temperature
Shutdown
Huge cost
Fouling of heat exchangers
3
CHISA, Prague, 28/08/2016
Asphaltene precipitation
Liquid
Heavy
oil
Heat transfer
Pressure drop
Cleaning
needed
(Partly) Evaporated
oil
=Fouling
Tube wall temperature
Shutdown
Huge cost
=Prediction fouling 1D modeling
Fouling – Flow regime
4
CHISA, Prague, 28/08/2016
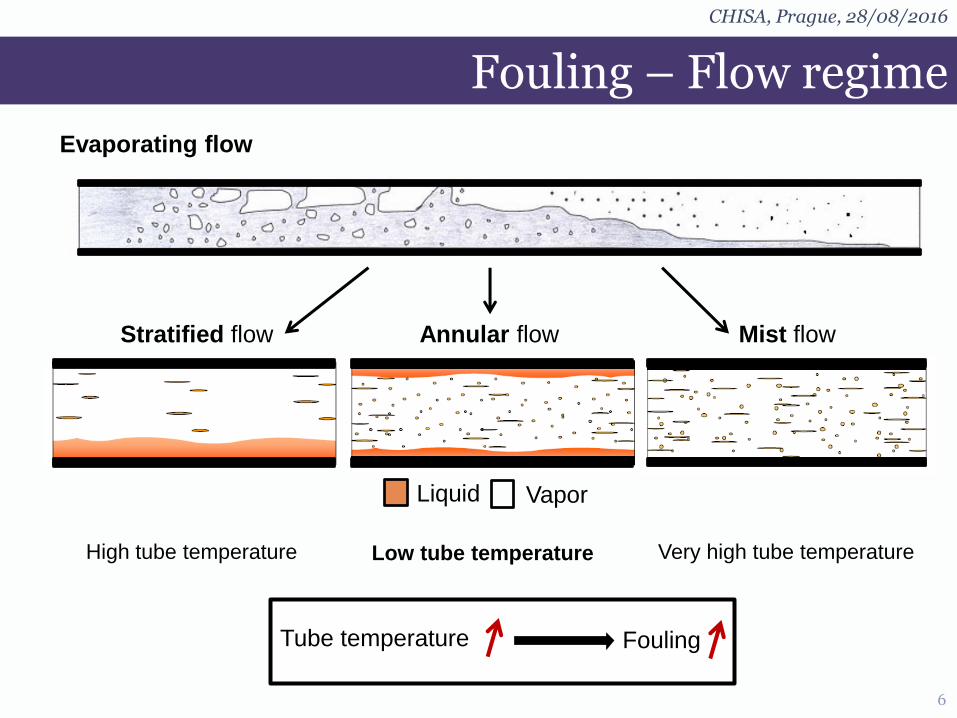
Evaporating flow
Fouling – Flow regime
5
CHISA, Prague, 28/08/2016
High tube temperature Low tube temperature Very high tube temperature
Evaporating flow
Stratified flow Annular flow Mist flow
Liquid Vapor
Fouling – Flow regime
6
CHISA, Prague, 28/08/2016
High tube temperature Low tube temperature Very high tube temperature
Evaporating flow
Stratified flow Annular flow Mist flow
Liquid Vapor
Tube temperature Fouling
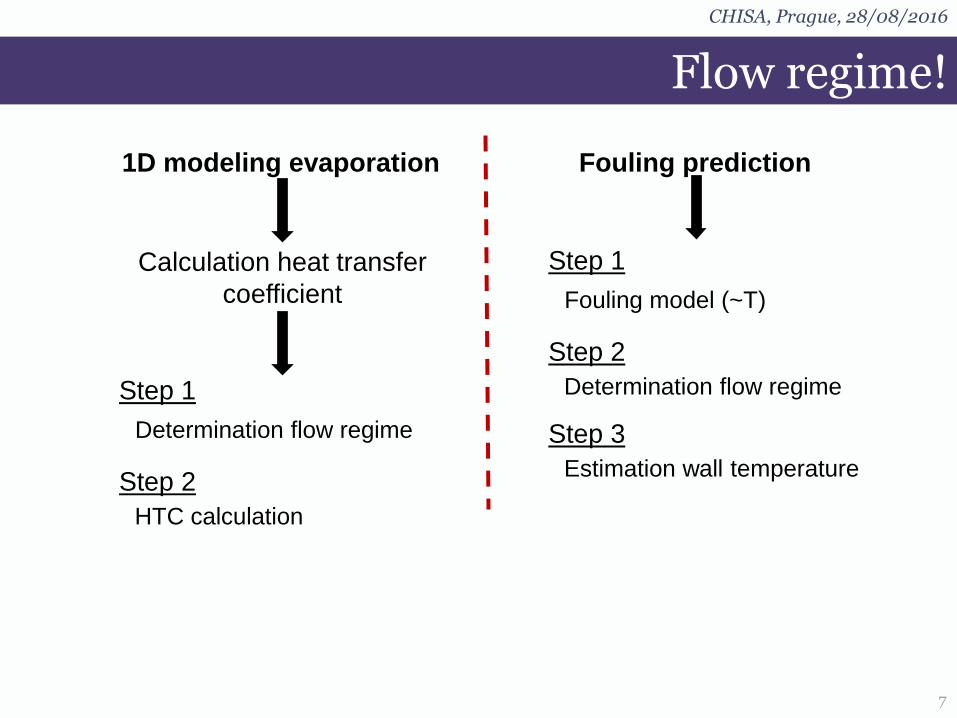
Flow regime!
7
CHISA, Prague, 28/08/2016
1D modeling evaporation
Calculation heat transfer
coefficient
Step 1
Step 2
Determination flow regime
HTC calculation
Fouling prediction
Step 1
Step 2
Fouling model (~T)
Determination flow regime
Step 3
Estimation wall temperature
Flow regime!
8
CHISA, Prague, 28/08/2016
1D modeling evaporation
Calculation heat transfer
coefficient
Step 1
Step 2
Determination flow regime
HTC calculation
Fouling prediction
Step 1
Step 2
Fouling model (~T)
Determination flow regime
Step 3
Estimation wall temperature
Accurate flow regime prediction is important
Flow regime map
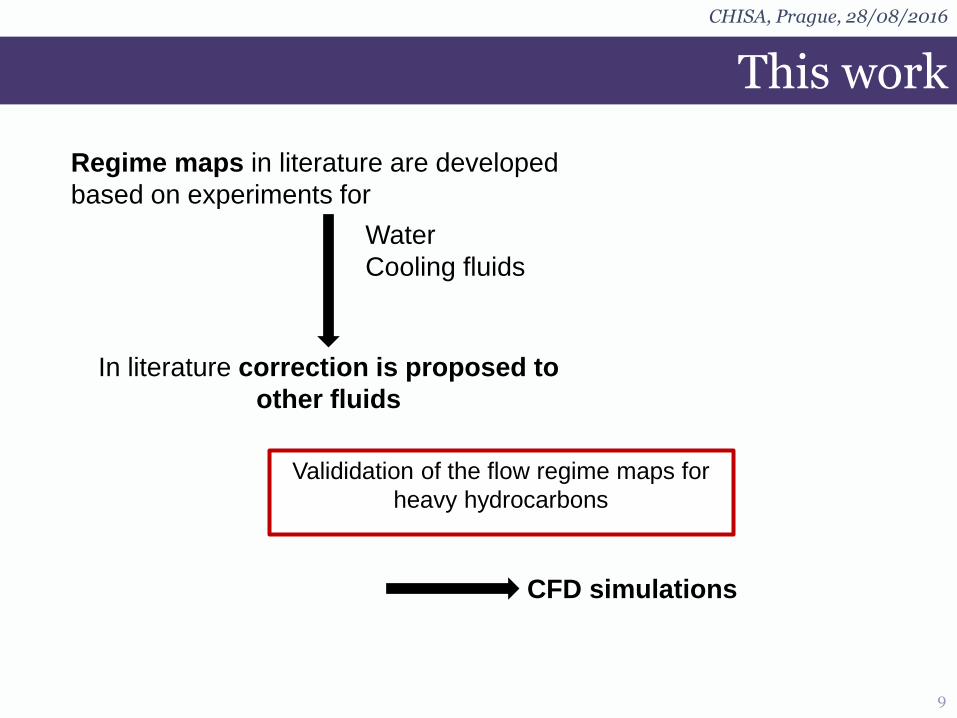
This work
9
CHISA, Prague, 28/08/2016
Regime maps in literature are developed
based on experiments for
Water
Cooling fluids
In literature correction is proposed to
other fluids
Valididation of the flow regime maps for
heavy hydrocarbons
CFD simulations
Adiabatic flow regime map
10
CHISA, Prague, 28/08/2016
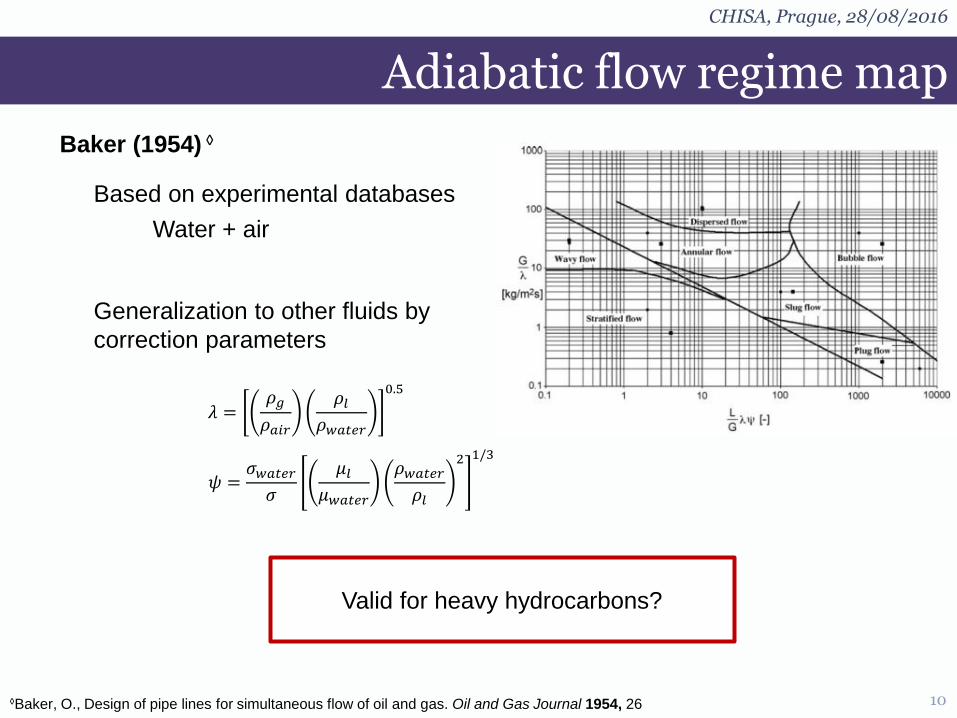
𝜆 =𝜌𝑔
𝜌𝑎𝑖𝑟
𝜌𝑙𝜌𝑤𝑎𝑡𝑒𝑟
0.5
𝜓 =𝜎𝑤𝑎𝑡𝑒𝑟𝜎
𝜇𝑙𝜇𝑤𝑎𝑡𝑒𝑟
𝜌𝑤𝑎𝑡𝑒𝑟𝜌𝑙
2 1/3
Baker (1954) ◊
Based on experimental databases
Water + air
Generalization to other fluids by
correction parameters
Valid for heavy hydrocarbons?
◊Baker, O., Design of pipe lines for simultaneous flow of oil and gas. Oil and Gas Journal 1954, 26
CFD Model
11
CHISA, Prague, 28/08/2016
ANSYS FLUENT 13.0
Multiphase model: Volume of Fluid
Interface tracking: Geo-reconstruct
Actual interface
Piece wise linear
interface
Accurate when mesh size is an order of magnitude smaller
than radius of curvature
Validated with Water + Air simulations
Interface
reconstruction
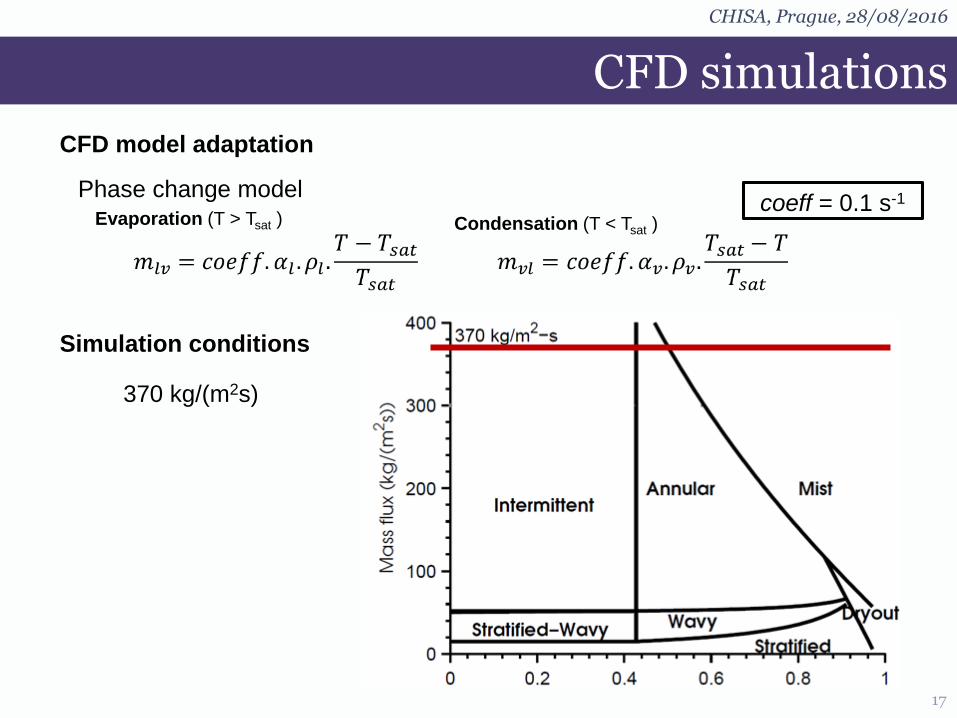
CFD simulations
Gasoil is complex hydrocarbon mixture
Represented by 1 pseudocomponent
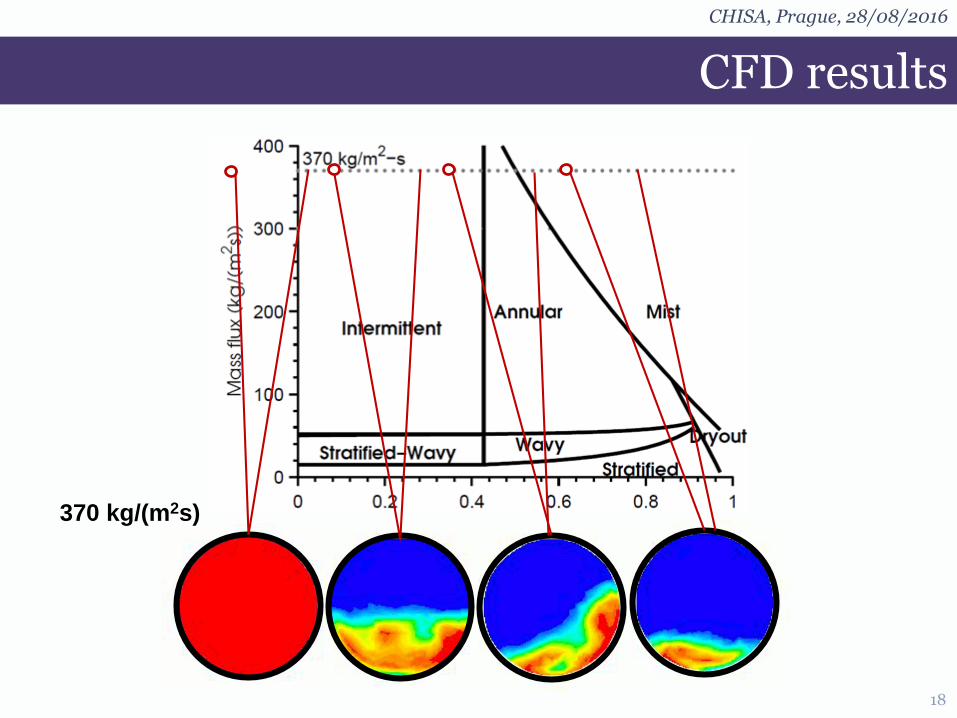
7 simulations are performed
Operating conditions
All seven regimes are
observed
Feed
Simulation conditions
W
P
Sl
A
St
MB
CHISA, Prague, 28/08/2016
12
CFD results
13
CHISA, Prague, 28/08/2016
W
P
Sl
A
St
MB
Wavy
Stratified
Plug
Slug
Liquid Vapor◊De Schepper, S. C. K.; Heynderickx, G. J.; Marin, G. B., CFD modeling of all gas-liquid and vapor-liquid flow regimes
predicted by the Baker chart. Chemical Engineering Journal 2008, 138, (1-3), 349-357
CFD results
14
CHISA, Prague, 28/08/2016
W
P
Sl
A
St
MB
Annular
Mist
Bubble
Liquid Vapor
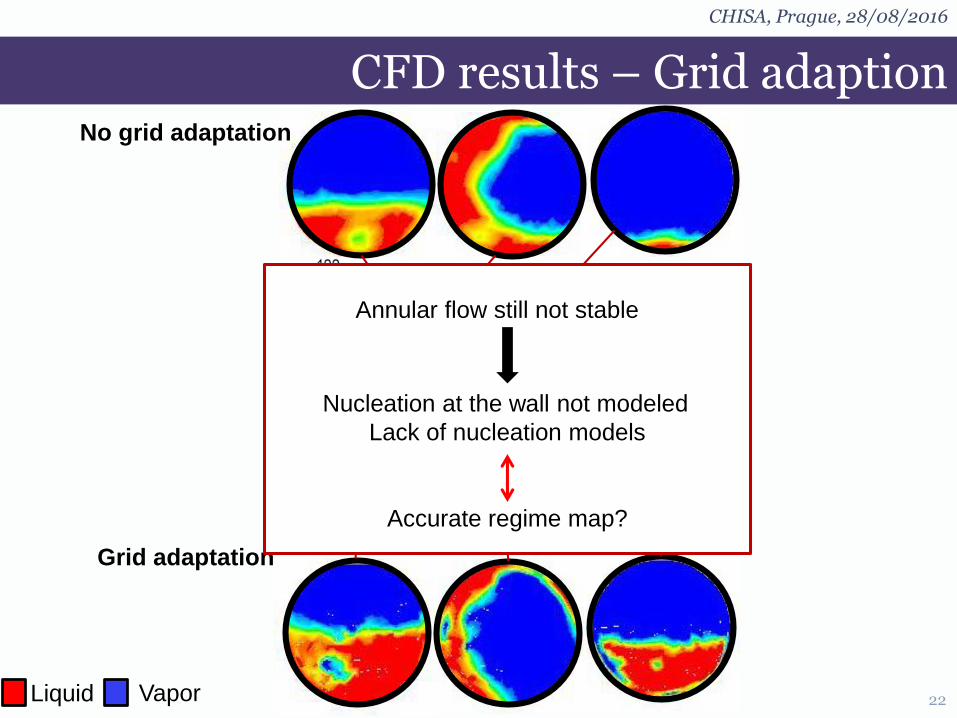
CFD results
15
CHISA, Prague, 28/08/2016
W
P
Sl
A
St
MB
Annular
Mist
Bubble
Liquid Vapor
Evaporation has an effect on flow regimes
Diabatic flow regime map
Diabatic flow regime map
16
CHISA, Prague, 28/08/2016
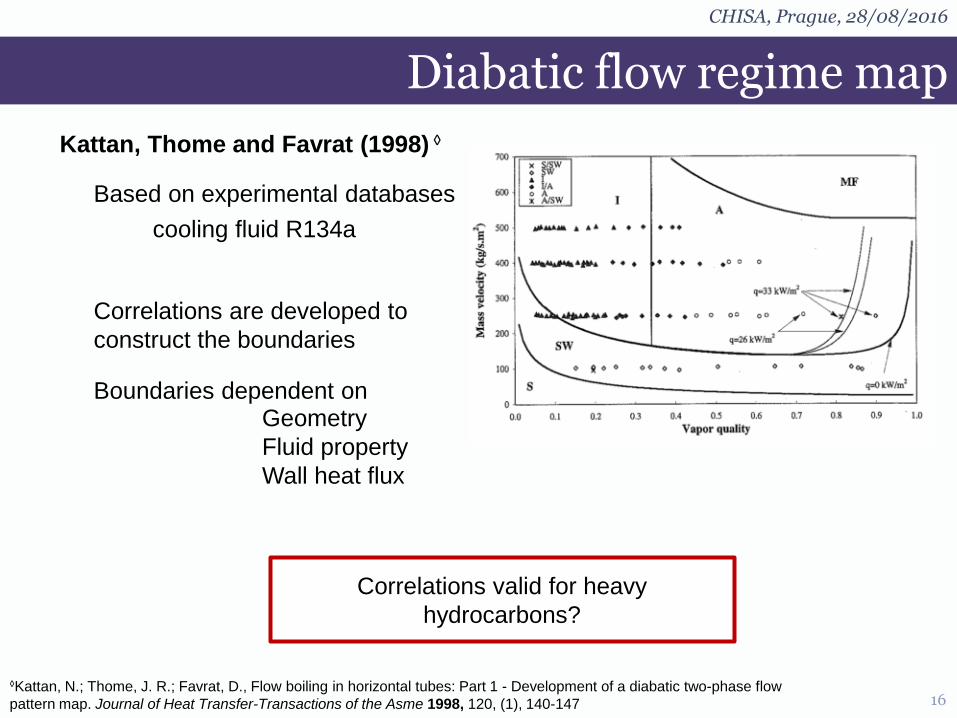
Kattan, Thome and Favrat (1998) ◊
Based on experimental databases
cooling fluid R134a
Correlations are developed to
construct the boundaries
Geometry
Fluid property
Wall heat flux
Correlations valid for heavy
hydrocarbons?
◊Kattan, N.; Thome, J. R.; Favrat, D., Flow boiling in horizontal tubes: Part 1 - Development of a diabatic two-phase flow
pattern map. Journal of Heat Transfer-Transactions of the Asme 1998, 120, (1), 140-147