International Journal of Engineering & Technology IJET-IJENS Vol:15 No:03 20
152803-6969-IJET-IJENS © June 2015 IJENS I J E N S
Development of a Platform Dedicated to
The TeleMedical Practice under local architecture
USB-HID and distant TCP-IP A.Nemmiche
#1, M.Benabdellah
#2, N.Hamlil
#3, S. Rerbal
#4, G.Nassar *
5
#Biomedical engineering Department, AbouBekrBelkaidTlemcen University
BP 230, Tlemcen 13000, Algeria [email protected]
[email protected]
[email protected]
4Souhila
[email protected]
*Valenciennes University
UVHC - Campus Mont Houy - 59313 Valenciennes, France [email protected]
Abstract—The telemedical practice consists in taking from
patient a multidimensional and multimedia information
representative of its physiopathological state, to stream them to
a local computer terminal initially then to a distant computer
terminal in the second time.
We propose through this article :
1) The realization of a noninvasive and nonintrusive
telemedical platform dedicated to simultaneous
acquisition and in real-time up to sixteen
unidimensional physiological signals.
2) The realization of a hardware interface built
around the C.A.N series AD0830 of Analog Device
ensuring the digitalization of the signals and the
microcontroller 18F2550 of Microchip ensuring
their transfers from the patient towards the local
post under protocol USB with specifications HID.
3) The realization of a graphical interface under
environment Visual BASIC making profitable the
component Winsock compatible with the
operating system Windows and architecture
client-server allowing the connection of the
various terminals computer for the transfer of the
data through the telemedical networks under
protocol TCP-IP.
Index Term— Telemedicine, USB, HID, mcHID.dll, TCP-IP,
Microcontroller, firmware, VB6, socket
I. INTRODUCTION
The medico surgical practice (Diagnosis, therapeutic,
monitoring) brings the use of a panoply of technical
equipment The current power of the information and
communication technics enable us to think of the progressive
integration of this multitude of technical equipment in the
form of telemedical polyvalent platform, adaptive and
evolutive which would transform a computer terminal into a
true station of local practice medico surgical or distant and
which would lead in the long term to materialization of the
concepts of Tele hospital, of health smart home (H.S.H),
of medicalised domiciliation of the patients reached by a
chronic diseases or of shared Individual medical folder.
This infatuation is often represented by the term e-health on
the structural level and Telemedicine on the functional level
[1], [11], [14], [15], [18].
The originality of the device that we developed lies in
following facts:
The recourse to external converters A/D with the
microcontroller which work at the same time makes
it possible to optimize the speed of digitalization of
the various signals.
The simultaneous collection of several signals
representative of different physiological functions
makes it possible to establish their inter correlations
with the implementation of suitable algorithms
allowing to better pose the diagnosis and to better
carry the therapeutic indications.
The automatic calibration of display according to
the number of signals at the entry of the device
facilitates their exploitations by the actors of the
Telemedicine.
The integration of several complementary
examinations in a such system makes it possible to
avoid the systematic recourse to patient orientation
towards various specialized services and allows a
precious time gain for the patient, for the doctor
and for the medical management cost of this patient.
And finally the embarked character of the
telemedical platform allows:
■ The realization of complementary examinations
regardless the site where the patient is located and
consequently one better apprehension of the urgent
what to do.
■ The exemption of the care to all and much wider
coverage in rural and isolated areas.
We present through this article:
1- The implementation hardware and software of a
micro controlled platform able to take on patient several
unidimensional signals, to stream them to a local station
under the architecture of communication USB-HID
built under environment MPLAB [2]-[4].
2- The Implementation of an application allowing the
display, the filing and digital processing of the various
International Journal of Engineering & Technology IJET-IJENS Vol:15 No:03 21
152803-6969-IJET-IJENS © June 2015 IJENS I J E N S
signals built under environment Visual BASIC witch
making profitable API (Programming Application
Interfaces) mcHID.dll for standard USB-HID
(Universal Serial Bus-Human Interface Device) [5].
3- The iimplementation of a telemedical network for
the transfer of the data under protocol TCP-IP using in
particular the component Winsock of Visual BASIC
which allows the implementation of Client-Server-
architecture [6]-[8].
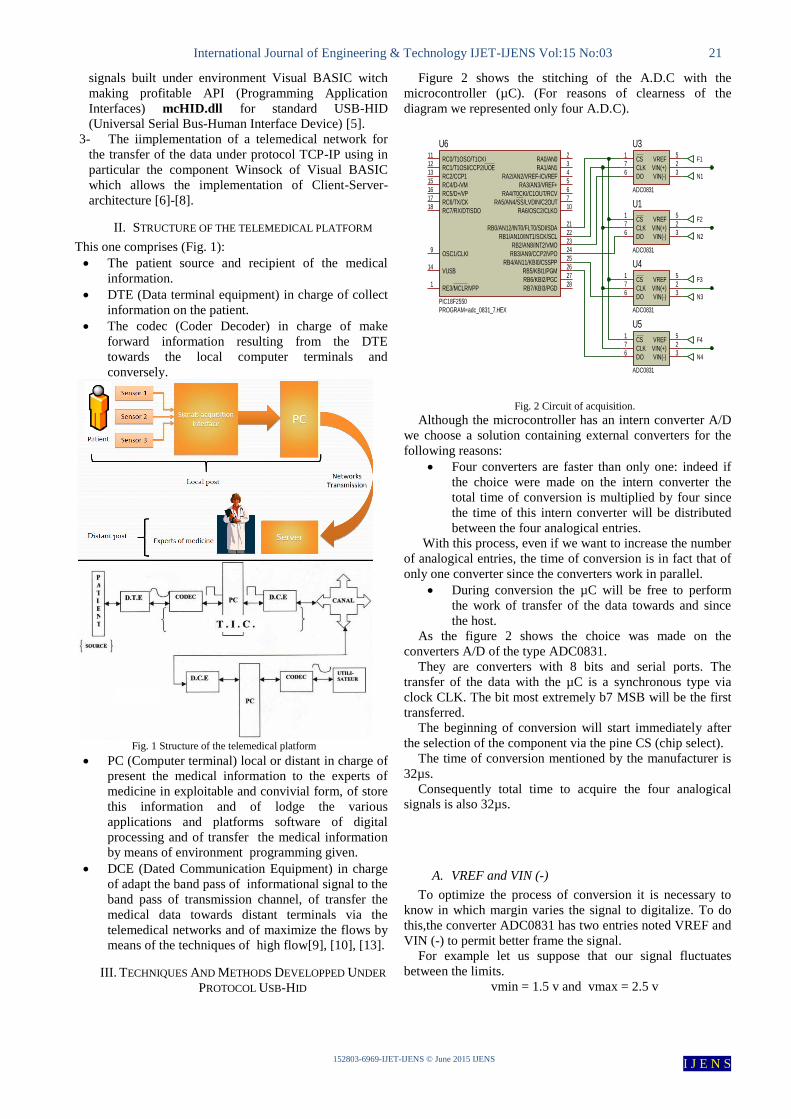
II. STRUCTURE OF THE TELEMEDICAL PLATFORM
This one comprises (Fig. 1):
The patient source and recipient of the medical
information.
DTE (Data terminal equipment) in charge of collect
information on the patient.
The codec (Coder Decoder) in charge of make
forward information resulting from the DTE
towards the local computer terminals and
conversely.
Fig. 1 Structure of the telemedical platform
PC (Computer terminal) local or distant in charge of
present the medical information to the experts of
medicine in exploitable and convivial form, of store
this information and of lodge the various
applications and platforms software of digital
processing and of transfer the medical information
by means of environment programming given.
DCE (Dated Communication Equipment) in charge
of adapt the band pass of informational signal to the
band pass of transmission channel, of transfer the
medical data towards distant terminals via the
telemedical networks and of maximize the flows by
means of the techniques of high flow[9], [10], [13].
III. TECHNIQUES AND METHODS DEVELOPPED UNDER
PROTOCOL USB-HID
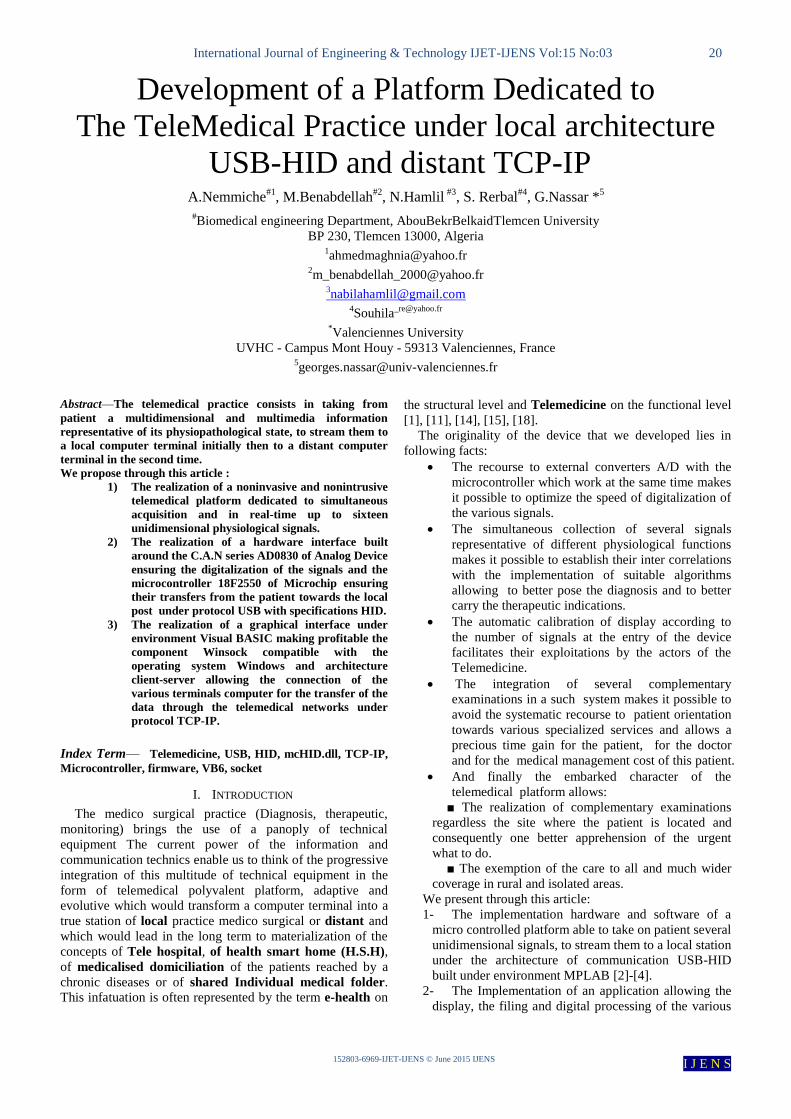
Figure 2 shows the stitching of the A.D.C with the
microcontroller (µC). (For reasons of clearness of the
diagram we represented only four A.D.C).
Fig. 2 Circuit of acquisition.
Although the microcontroller has an intern converter A/D
we choose a solution containing external converters for the
following reasons:
Four converters are faster than only one: indeed if
the choice were made on the intern converter the
total time of conversion is multiplied by four since
the time of this intern converter will be distributed
between the four analogical entries.
With this process, even if we want to increase the number
of analogical entries, the time of conversion is in fact that of
only one converter since the converters work in parallel.
During conversion the µC will be free to perform
the work of transfer of the data towards and since
the host.
As the figure 2 shows the choice was made on the
converters A/D of the type ADC0831.
They are converters with 8 bits and serial ports. The
transfer of the data with the µC is a synchronous type via
clock CLK. The bit most extremely b7 MSB will be the first
transferred.
The beginning of conversion will start immediately after
the selection of the component via the pine CS (chip select).
The time of conversion mentioned by the manufacturer is
32µs.
Consequently total time to acquire the four analogical
signals is also 32µs.
A. VREF and VIN (-)
To optimize the process of conversion it is necessary to
know in which margin varies the signal to digitalize. To do
this,the converter ADC0831 has two entries noted VREF and
VIN (-) to permit better frame the signal.
For example let us suppose that our signal fluctuates
between the limits.
vmin = 1.5 v and vmax = 2.5 v
CS1
VIN(+)2
VIN(-)3
CLK7
VREF5
DO6
U3
ADC0831
CS1
VIN(+)2
VIN(-)3
CLK7
VREF5
DO6
U1
ADC0831
CS1
VIN(+)2
VIN(-)3
CLK7
VREF5
DO6
U4
ADC0831
CS1
VIN(+)2
VIN(-)3
CLK7
VREF5
DO6
U5
ADC0831
RA0/AN02
RA1/AN13
RA2/AN2/VREF-/CVREF4
RA3/AN3/VREF+5
RA4/T0CKI/C1OUT/RCV6
RA5/AN4/SS/LVDIN/C2OUT7
RA6/OSC2/CLKO10
OSC1/CLKI9
RB0/AN12/INT0/FLT0/SDI/SDA21
RB1/AN10/INT1/SCK/SCL22
RB2/AN8/INT2/VMO23
RB3/AN9/CCP2/VPO24
RB4/AN11/KBI0/CSSPP25
RB5/KBI1/PGM26
RB6/KBI2/PGC27
RB7/KBI3/PGD28
RC0/T1OSO/T1CKI11
RC1/T1OSI/CCP2/UOE12
RC2/CCP113
VUSB14
RC4/D-/VM15
RC5/D+/VP16
RC6/TX/CK17
RC7/RX/DT/SDO18
RE3/MCLR/VPP1
U6
PIC18F2550
PROGRAM=adc_0831_7.HEX
F1
N1
F2
N2
F3
N3
F4
N4
International Journal of Engineering & Technology IJET-IJENS Vol:15 No:03 22
152803-6969-IJET-IJENS © June 2015 IJENS I J E N S
See how we will position the two reference voltage
standards VREF and VIN (-):
VIN(-) = vmin = 1.5 v
VREF = vmax – vmin = 2.5 – 1.5 = 1 v
The n value resulting from conversion of the signalVIN (+)
is worth:
n = ( ) ( )
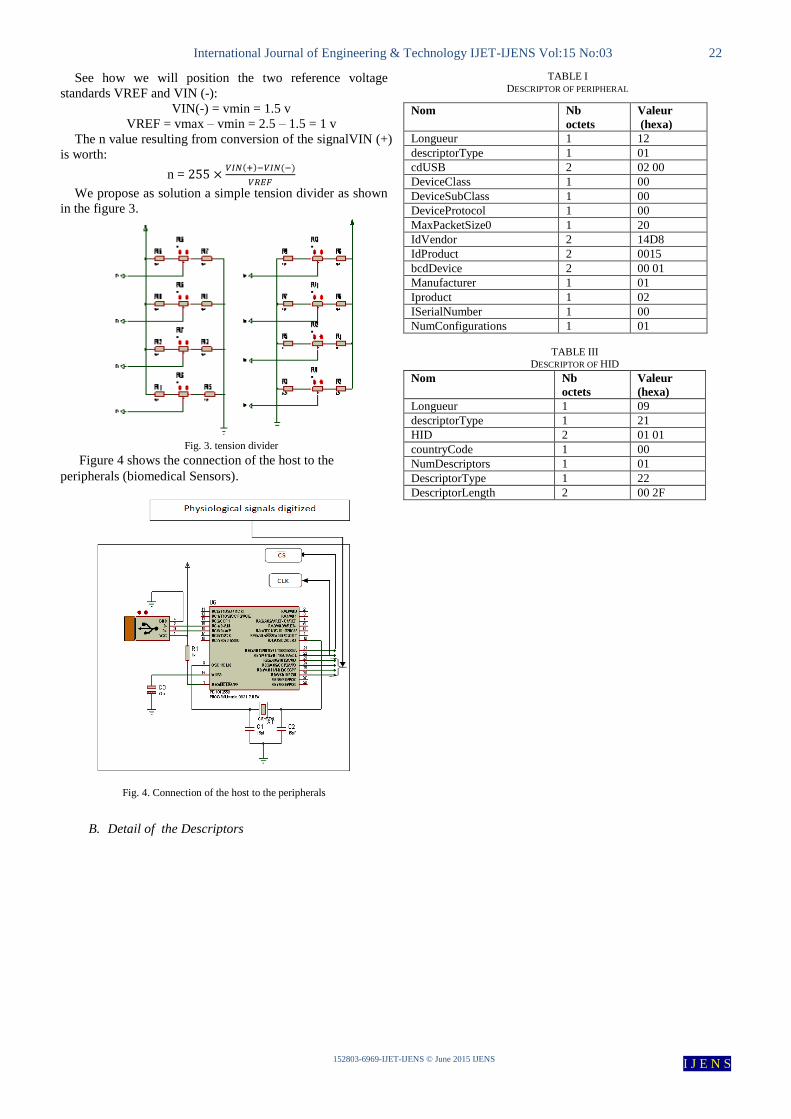
We propose as solution a simple tension divider as shown
in the figure 3.
Fig. 3. tension divider
Figure 4 shows the connection of the host to the
peripherals (biomedical Sensors).
Fig. 4. Connection of the host to the peripherals
B. Detail of the Descriptors
TABLE I
DESCRIPTOR OF PERIPHERAL
Nom Nb
octets Valeur
(hexa) Longueur 1 12
descriptorType 1 01
cdUSB 2 02 00
DeviceClass 1 00
DeviceSubClass 1 00
DeviceProtocol 1 00
MaxPacketSize0 1 20
IdVendor 2 14D8
IdProduct 2 0015
bcdDevice 2 00 01
Manufacturer 1 01
Iproduct 1 02
ISerialNumber 1 00
NumConfigurations 1 01
TABLE III DESCRIPTOR OF HID
Nom Nb
octets
Valeur
(hexa)
Longueur 1 09
descriptorType 1 21
HID 2 01 01
countryCode 1 00
NumDescriptors 1 01
DescriptorType 1 22
DescriptorLength 2 00 2F
International Journal of Engineering & Technology IJET-IJENS Vol:15 No:03 23
152803-6969-IJET-IJENS © June 2015 IJENS I J E N S
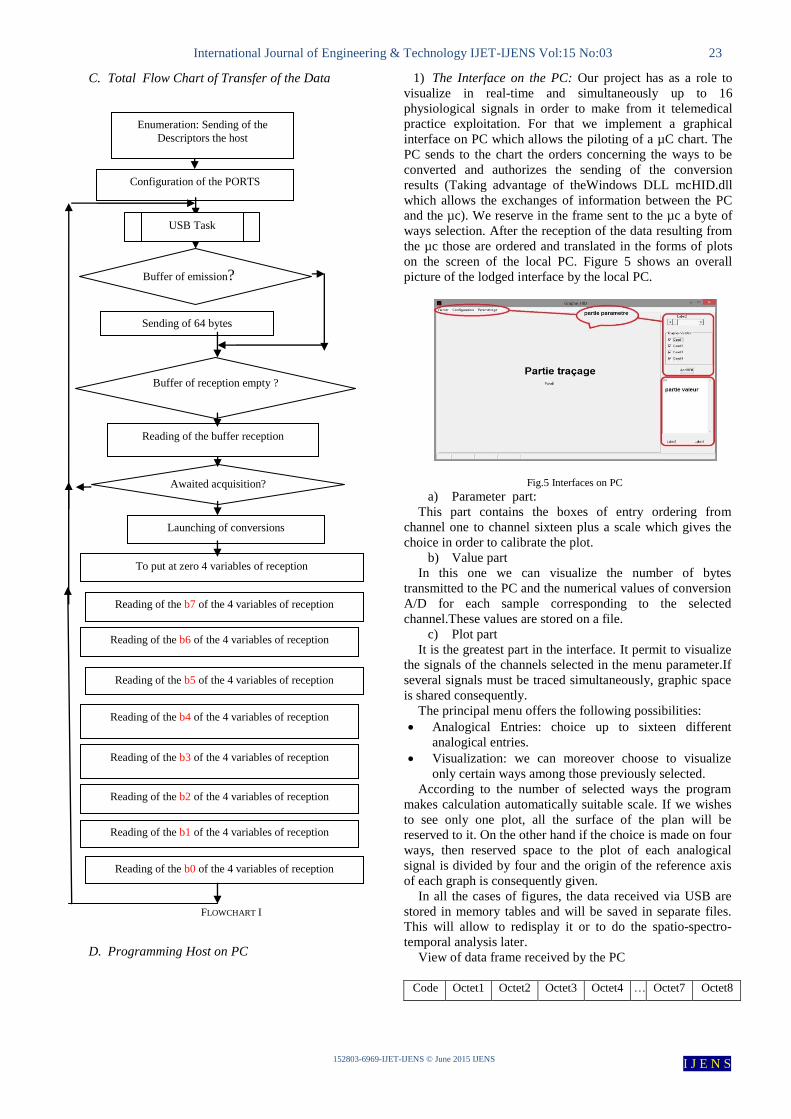
C. Total Flow Chart of Transfer of the Data
FLOWCHART I
D. Programming Host on PC
1) The Interface on the PC: Our project has as a role to
visualize in real-time and simultaneously up to 16
physiological signals in order to make from it telemedical
practice exploitation. For that we implement a graphical
interface on PC which allows the piloting of a µC chart. The
PC sends to the chart the orders concerning the ways to be
converted and authorizes the sending of the conversion
results (Taking advantage of theWindows DLL mcHID.dll
which allows the exchanges of information between the PC
and the µc). We reserve in the frame sent to the µc a byte of
ways selection. After the reception of the data resulting from
the µc those are ordered and translated in the forms of plots
on the screen of the local PC. Figure 5 shows an overall
picture of the lodged interface by the local PC.
Fig.5 Interfaces on PC
a) Parameter part:
This part contains the boxes of entry ordering from
channel one to channel sixteen plus a scale which gives the
choice in order to calibrate the plot.
b) Value part
In this one we can visualize the number of bytes
transmitted to the PC and the numerical values of conversion
A/D for each sample corresponding to the selected
channel.These values are stored on a file.
c) Plot part
It is the greatest part in the interface. It permit to visualize
the signals of the channels selected in the menu parameter.If
several signals must be traced simultaneously, graphic space
is shared consequently.
The principal menu offers the following possibilities:
Analogical Entries: choice up to sixteen different
analogical entries.
Visualization: we can moreover choose to visualize
only certain ways among those previously selected.
According to the number of selected ways the program
makes calculation automatically suitable scale. If we wishes
to see only one plot, all the surface of the plan will be
reserved to it. On the other hand if the choice is made on four
ways, then reserved space to the plot of each analogical
signal is divided by four and the origin of the reference axis
of each graph is consequently given.
In all the cases of figures, the data received via USB are
stored in memory tables and will be saved in separate files.
This will allow to redisplay it or to do the spatio-spectro-
temporal analysis later.
View of data frame received by the PC
Code Octet1 Octet2 Octet3 Octet4 … Octet7 Octet8
Buffer of emission?
Sending of 64 bytes
Buffer of reception empty ?
Reading of the buffer reception
Awaited acquisition?
Launching of conversions
To put at zero 4 variables of reception
Reading of the b7 of the 4 variables of reception
Reading of the b6 of the 4 variables of reception
Reading of the b5 of the 4 variables of reception
Reading of the b4 of the 4 variables of reception
Reading of the b2 of the 4 variables of reception
Reading of the b1 of the 4 variables of reception
Reading of the b0 of the 4 variables of reception
Configuration of the PORTS
USB Task
Reading of the b3 of the 4 variables of reception
Enumeration: Sending of the
Descriptors the host
International Journal of Engineering & Technology IJET-IJENS Vol:15 No:03 24
152803-6969-IJET-IJENS © June 2015 IJENS I J E N S
View of data frame sent by the PC
code Value1 : CAG Value2 : channelsto be
treated
2) Flow chart host on PC:
FLOWCHART II
IV. RESULTS UNDER PROTOCOL USB-HID
The figure6 shows the display of only one signal (EKG)
Fig. 6. Viewing of only one signal (EKG)
The figure7 shows the display of six physiological signals:
1) Electrocardiogram EKG is acquired by
amplifier of instrumentation AD620.
2) Complex QRS Detected.
3) The photopléthysmogram PPG is acquired by
a molecular spectrophotometry of absorption in
the infra-red representative of the concentration
of oxyhemoglobin pulse HbO2 [17].
4) Pneumotachgram PTG is acquired by
Pneumotachography of Fleisch with variable
reluctance and representative of the ventilatory
flow [16].
5) The index of variation Pleth PVI obtained by
the averaging of PPG and representative of
respiratory variation of the PPG correlated with
the response to the vascular filling RVF.
6) Current volume Vt (Tidal volume) obtained by
integration of the inspiratory flow and
representative of the efficiency of the
ventilatory muscle function that might be
exploited during telemonitoring of the
mechanical ventilation.
Fig . 7. Viewing respectively ECG, QRS, PPG, PTG,
PVI and VT
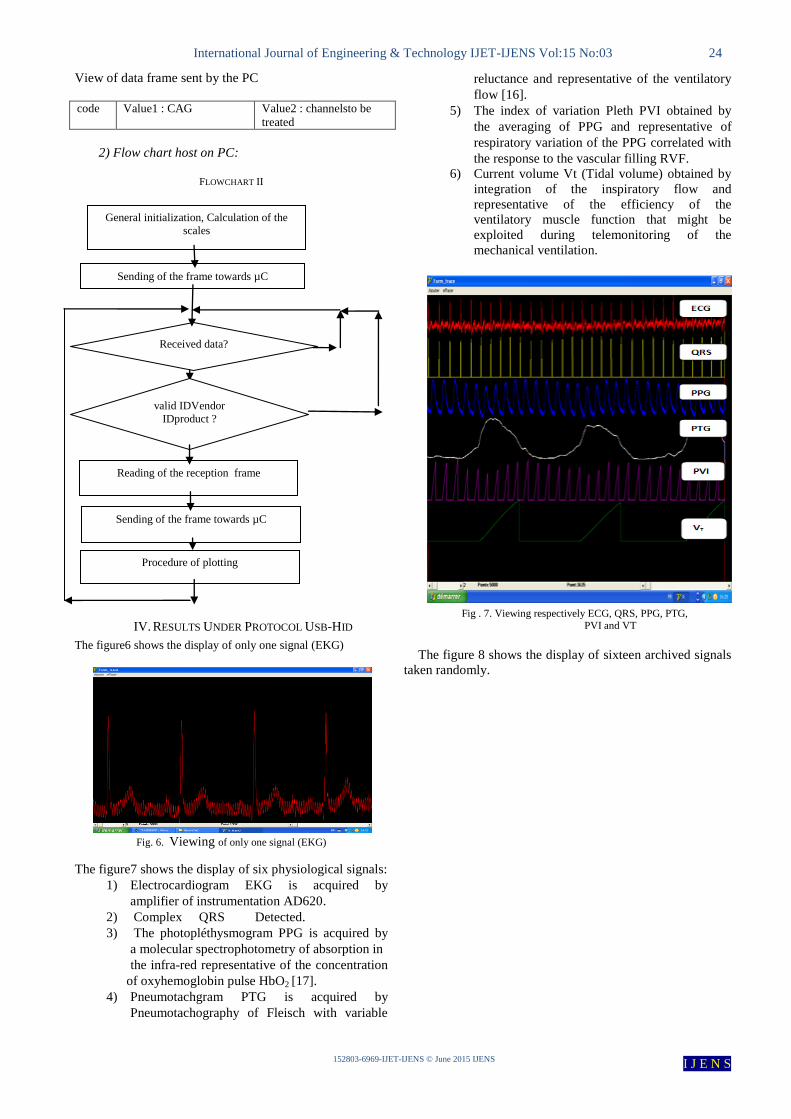
The figure 8 shows the display of sixteen archived signals
taken randomly.
General initialization, Calculation of the
scales
Sending of the frame towards µC
Received data?
Reading of the reception frame
Sending of the frame towards µC
Procedure of plotting
valid IDVendor
IDproduct ?
International Journal of Engineering & Technology IJET-IJENS Vol:15 No:03 25
152803-6969-IJET-IJENS © June 2015 IJENS I J E N S
Fig. 8. Showing of sixteen signals archived.
V. SOME FUNCTIONALITY OF THE GRAPHICAL USER
INTERFACE
This graphical user interface provides to the practitioners
of telemedicine a very large number of options relating to
operating signals (spatially, temporally and spectrally) which
provide an efficient and rapid diagnosis aid [12].
We present through the figures some of these possibilities.
The figure 9 shows the possibility of reversing any signal.
Fig. 9. Inversion of signal
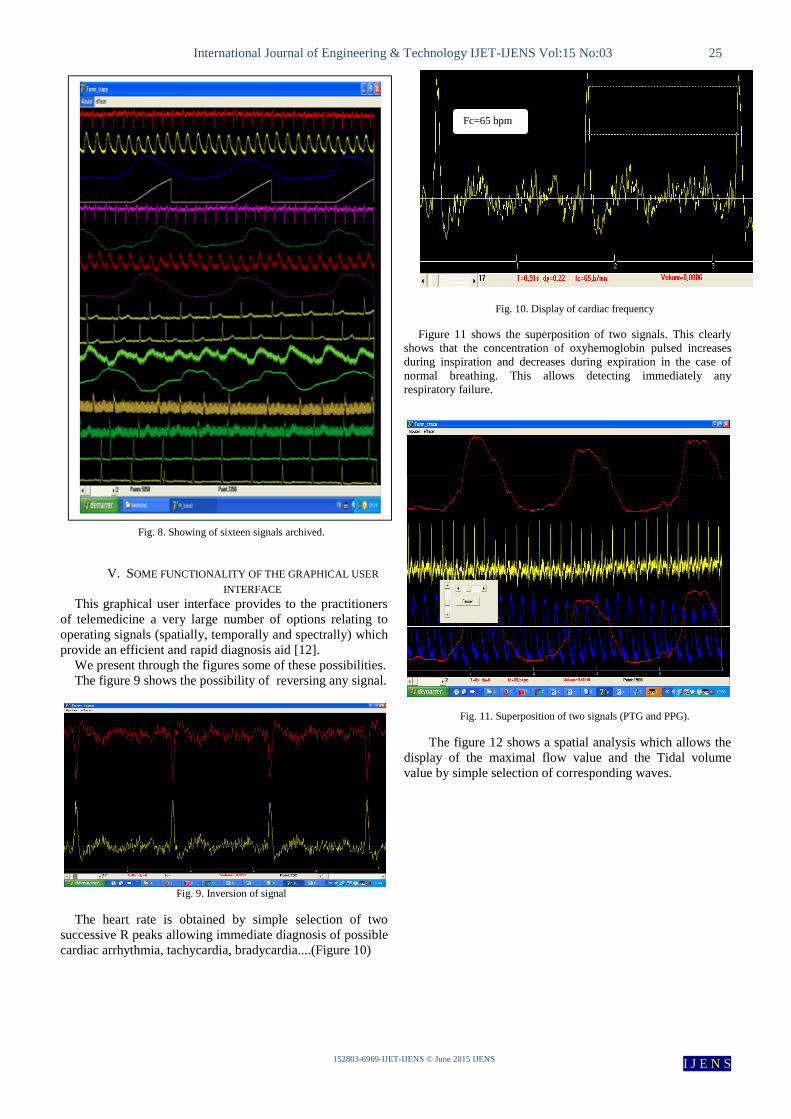
The heart rate is obtained by simple selection of two
successive R peaks allowing immediate diagnosis of possible
cardiac arrhythmia, tachycardia, bradycardia....(Figure 10)
Fig. 10. Display of cardiac frequency
Figure 11 shows the superposition of two signals. This clearly
shows that the concentration of oxyhemoglobin pulsed increases
during inspiration and decreases during expiration in the case of
normal breathing. This allows detecting immediately any
respiratory failure.
Fig. 11. Superposition of two signals (PTG and PPG).
The figure 12 shows a spatial analysis which allows the
display of the maximal flow value and the Tidal volume
value by simple selection of corresponding waves.
Fc=65 bpm
International Journal of Engineering & Technology IJET-IJENS Vol:15 No:03 26
152803-6969-IJET-IJENS © June 2015 IJENS I J E N S
Fig. 12. Spatial analysis.
The figure 13 shows a temporal analysis which allows
to display the duration of any waves by simple selection.
Fig. 13. Temporal analysis.
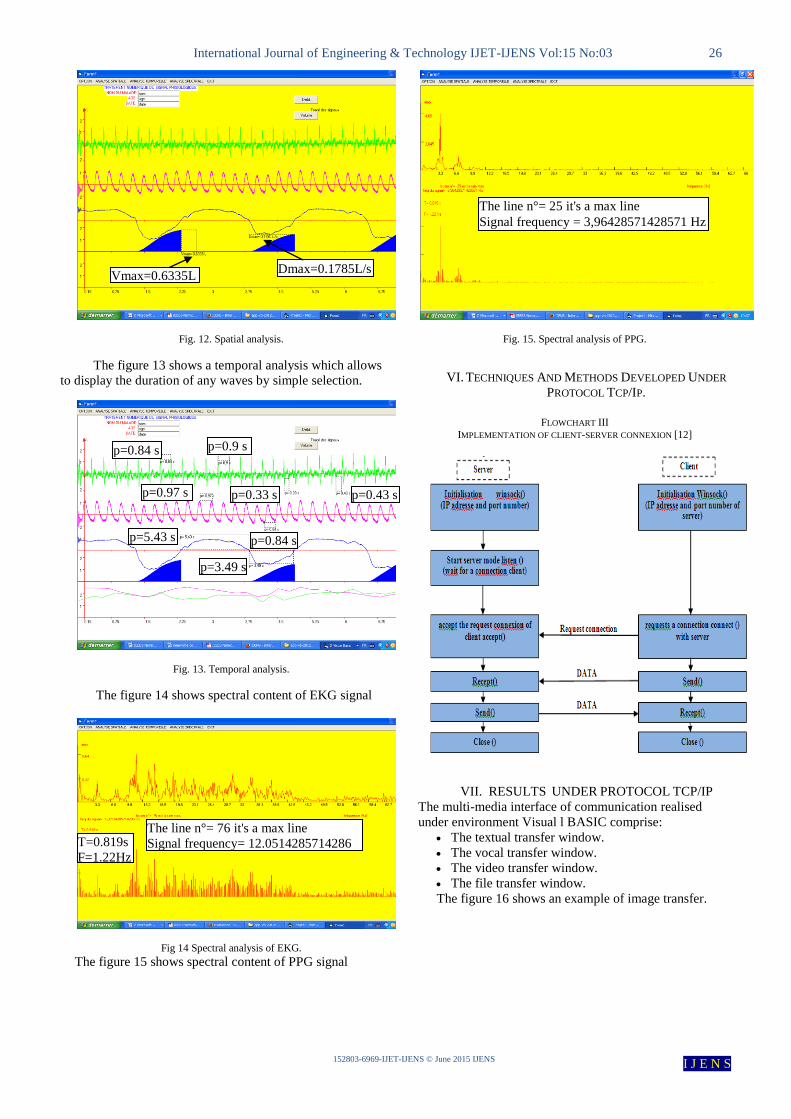
The figure 14 shows spectral content of EKG signal
Fig 14 Spectral analysis of EKG.
The figure 15 shows spectral content of PPG signal
Fig. 15. Spectral analysis of PPG.
VI. TECHNIQUES AND METHODS DEVELOPED UNDER
PROTOCOL TCP/IP.
FLOWCHART III
IMPLEMENTATION OF CLIENT-SERVER CONNEXION [12]
VII. RESULTS UNDER PROTOCOL TCP/IP
The multi-media interface of communication realised
under environment Visual l BASIC comprise:
The textual transfer window.
The vocal transfer window.
The video transfer window.
The file transfer window.
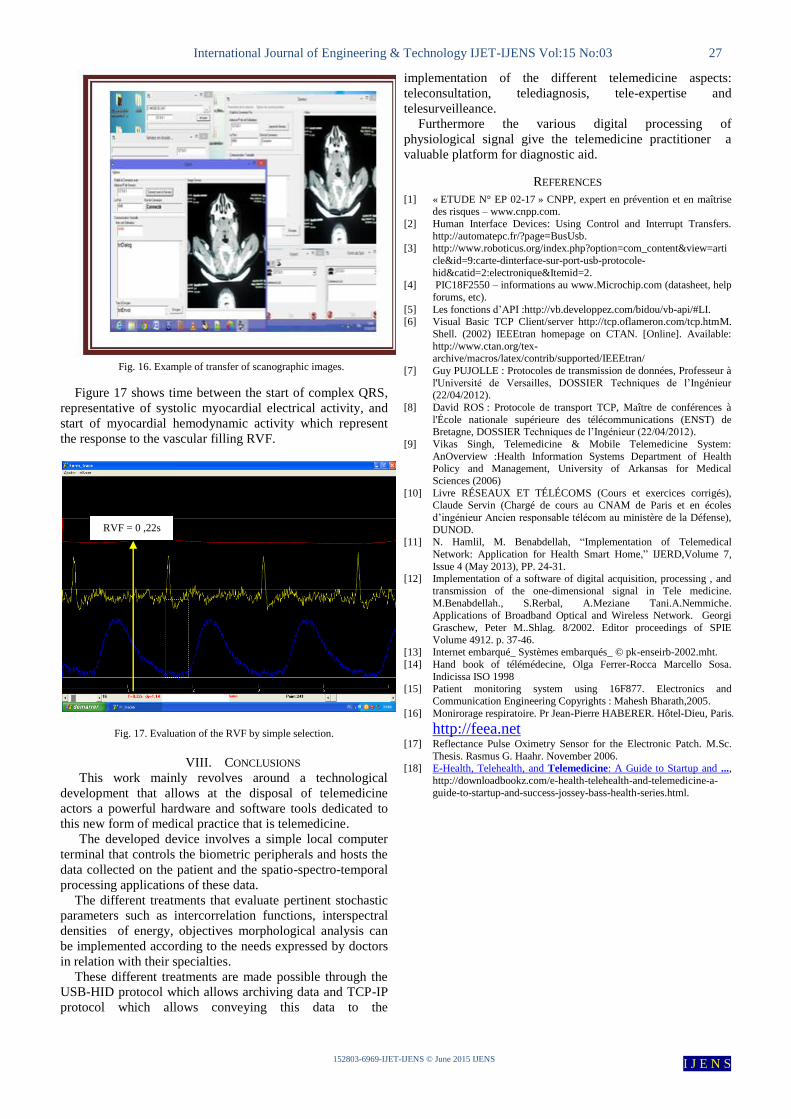
The figure 16 shows an example of image transfer.
Vmax=0.6335L Dmax=0.1785L/s
The line n°= 25 it's a max line
Signal frequency = 3,96428571428571 Hz
p=0.84 s p=0.9 s
p=5.43 s
p=3.49 s
p=0.84 s
p=0.97 s p=0.33 s p=0.43 s
The line n°= 76 it's a max line
Signal frequency= 12.0514285714286
Hz
T=0.819s
F=1.22Hz
International Journal of Engineering & Technology IJET-IJENS Vol:15 No:03 27
152803-6969-IJET-IJENS © June 2015 IJENS I J E N S
Fig. 16. Example of transfer of scanographic images.
Figure 17 shows time between the start of complex QRS,
representative of systolic myocardial electrical activity, and
start of myocardial hemodynamic activity which represent
the response to the vascular filling RVF.
Fig. 17. Evaluation of the RVF by simple selection.
VIII. CONCLUSIONS
This work mainly revolves around a technological
development that allows at the disposal of telemedicine
actors a powerful hardware and software tools dedicated to
this new form of medical practice that is telemedicine.
The developed device involves a simple local computer
terminal that controls the biometric peripherals and hosts the
data collected on the patient and the spatio-spectro-temporal
processing applications of these data.
The different treatments that evaluate pertinent stochastic
parameters such as intercorrelation functions, interspectral
densities of energy, objectives morphological analysis can
be implemented according to the needs expressed by doctors
in relation with their specialties.
These different treatments are made possible through the
USB-HID protocol which allows archiving data and TCP-IP
protocol which allows conveying this data to the
implementation of the different telemedicine aspects:
teleconsultation, telediagnosis, tele-expertise and
telesurveilleance.
Furthermore the various digital processing of
physiological signal give the telemedicine practitioner a
valuable platform for diagnostic aid.
REFERENCES
[1] « ETUDE N° EP 02-17 » CNPP, expert en prévention et en maîtrise des risques – www.cnpp.com.
[2] Human Interface Devices: Using Control and Interrupt Transfers.
http://automatepc.fr/?page=BusUsb. [3] http://www.roboticus.org/index.php?option=com_content&view=arti
cle&id=9:carte-dinterface-sur-port-usb-protocole-
hid&catid=2:electronique&Itemid=2. [4] PIC18F2550 – informations au www.Microchip.com (datasheet, help
forums, etc).
[5] Les fonctions d’API :http://vb.developpez.com/bidou/vb-api/#LI. [6] Visual Basic TCP Client/server http://tcp.oflameron.com/tcp.htmM.
Shell. (2002) IEEEtran homepage on CTAN. [Online]. Available:
http://www.ctan.org/tex-archive/macros/latex/contrib/supported/IEEEtran/
[7] Guy PUJOLLE : Protocoles de transmission de données, Professeur à
l'Université de Versailles, DOSSIER Techniques de l’Ingénieur (22/04/2012).
[8] David ROS : Protocole de transport TCP, Maître de conférences à
l'École nationale supérieure des télécommunications (ENST) de Bretagne, DOSSIER Techniques de l’Ingénieur (22/04/2012).
[9] Vikas Singh, Telemedicine & Mobile Telemedicine System:
AnOverview :Health Information Systems Department of Health Policy and Management, University of Arkansas for Medical
Sciences (2006)
[10] Livre RÉSEAUX ET TÉLÉCOMS (Cours et exercices corrigés), Claude Servin (Chargé de cours au CNAM de Paris et en écoles
d’ingénieur Ancien responsable télécom au ministère de la Défense),
DUNOD. [11] N. Hamlil, M. Benabdellah, ―Implementation of Telemedical
Network: Application for Health Smart Home,‖ IJERD,Volume 7,
Issue 4 (May 2013), PP. 24-31. [12] Implementation of a software of digital acquisition, processing , and
transmission of the one-dimensional signal in Tele medicine.
M.Benabdellah., S.Rerbal, A.Meziane Tani.A.Nemmiche.
Applications of Broadband Optical and Wireless Network. Georgi
Graschew, Peter M..Shlag. 8/2002. Editor proceedings of SPIE
Volume 4912. p. 37-46. [13] Internet embarqué_ Systèmes embarqués_ © pk-enseirb-2002.mht.
[14] Hand book of télémédecine, Olga Ferrer-Rocca Marcello Sosa.
Indicissa ISO 1998 [15] Patient monitoring system using 16F877. Electronics and
Communication Engineering Copyrights : Mahesh Bharath,2005.
[16] Monirorage respiratoire. Pr Jean-Pierre HABERER. Hôtel-Dieu, Paris.
http://feea.net
[17] Reflectance Pulse Oximetry Sensor for the Electronic Patch. M.Sc.
Thesis. Rasmus G. Haahr. November 2006. [18] E-Health, Telehealth, and Telemedicine: A Guide to Startup and ...,
http://downloadbookz.com/e-health-telehealth-and-telemedicine-a-
guide-to-startup-and-success-jossey-bass-health-series.html.
RVF = 0 ,22s


![An Open Platform for Modeling Method Conceptualization: The OMiLAB Digital Ecosystemeprints.cs.univie.ac.at/5462/1/[Bork+19] An Open Platform... · 2019-05-22 · dedicated open ecosystem](https://static.documents.pub/doc/80x56/5ed68741ff0e593c0b64036f/an-open-platform-for-modeling-method-conceptualization-the-omilab-digital-bork19.jpg)


