NCHRP IDEA Program Development of a Portable Stress Measurement Instrument Final Report for NCHRP IDEA Project 179 Prepared by: Glenn Washer, Pedro Ruiz-Fabian University of Missouri Paul Fuchs Fuchs Consulting, Inc. October 2017
Transcript
NCHRP IDEA Program
Development of a Portable Stress Measurement Instrument
Final Report for NCHRP IDEA Project 179
Prepared by: Glenn Washer, Pedro Ruiz-Fabian University of Missouri
Paul Fuchs Fuchs Consulting, Inc.
October 2017
Innovations Deserving Exploratory Analysis (IDEA) Programs Managed by the Transportation Research Board
This IDEA project was funded by the NCHRP IDEA Program.
The TRB currently manages the following three IDEA programs:
• The NCHRP IDEA Program, which focuses on advances in the design, construction, and maintenance of highway systems, is funded by American Association of State Highway and Transportation Officials (AASHTO) as part of the National Cooperative Highway Research Program (NCHRP).
• The Safety IDEA Program currently focuses on innovative approaches for improving railroad safety or performance. The program is currently funded by the Federal Railroad Administration (FRA). The program was previously jointly funded by the Federal Motor Carrier Safety Administration (FMCSA) and the FRA.
• The Transit IDEA Program, which supports development and testing of innovative concepts and methods for advancing transit practice, is funded by the Federal Transit Administration (FTA) as part of the Transit Cooperative Research Program (TCRP).
Management of the three IDEA programs is coordinated to promote the development and testing of innovative concepts, methods, and technologies.
For information on the IDEA programs, check the IDEA website (www.trb.org/idea). For questions, contact the IDEA programs office by telephone at (202) 334-3310.
IDEA Programs Transportation Research Board 500 Fifth Street, NW Washington, DC 20001
The project that is the subject of this contractor-authored report was a part of the Innovations Deserving Exploratory Analysis (IDEA) Programs, which are managed by the Transportation Research Board (TRB) with the approval of the National Academies of Sciences, Engineering, and Medicine. The members of the oversight committee that monitored the project and reviewed the report were chosen for their special competencies and with regard for appropriate balance. The views expressed in this report are those of the contractor who conducted the investigation documented in this report and do not necessarily reflect those of the Transportation Research Board; the National Academies of Sciences, Engineering, and Medicine; or the sponsors of the IDEA Programs.
The Transportation Research Board; the National Academies of Sciences, Engineering, and Medicine; and the organizations that sponsor the IDEA Programs do not endorse products or manufacturers. Trade or manufacturers’ names appear herein solely because they are considered essential to the object of the investigation.
Development of a Portable Stress Measurement Instrument
IDEA Program Final Report
DRAFT
NCHRP IDEA Project 179
Prepared for the IDEA Program
Transportation Research Board
The National Academies
Prepared By:
Glenn Washer, Ph.D.
Pedro Ruiz-Fabian, Graduate Research Assistant
University of Missouri
Columbia, MO
Paul Fuchs, Ph.D.
Fuchs Consulting Inc.
Leesburg, VA
November 2017
NCHRP IDEA PROGRAM COMMITTEE
CHAIR
DUANE BRAUTIGAM
Consultant
MEMBERS
ALLISON HARDT
Maryland State Highway Administration
JOE HORTON
California DOT
DAVID JAREDGeorgia DOTMAGDY MIKHAIL
Texas DOT
TOMMY NANTUNG
Indiana DOT
MARTIN PIETRUCHA
Pennsylvania State University
VALERIE SHUMAN
Shuman Consulting Group LLC
L.DAVID SUITS
North American Geosynthetics Society
FHWA LIAISON DAVID KUEHN
Federal Highway Administration
AASHTO LIAISON KEITH PLATTE
American Association of State Highway
Transportation Officials
TRB LIAISON RICHARD CUNARD
Transportation Research Board
COOPERATIVE RESEARCH PROGRAM STAFF STEPHEN PARKER
Senior Program Officer
IDEA PROGRAMS STAFF CHRISTOPHER HEDGES Director, Cooperative Research Programs LORI SUNDSTROM
Deputy Director, Cooperative Research Programs
INAM JAWED
Senior Program Officer
DEMISHA WILLIAMS
Senior Program Assistant
EXPERT REVIEW PANEL
HODA AZARI, FHWA
STEVE LOVEJOY, Oregon DOT
SCOTT STOTTLEMEYER, Missouri DOT
MIKE BROKAW, Ohio DOT
ACKNOWLEDGEMENTS
The research team would like to acknowledge the Missouri Department of Transportation (MoDOT) for their
support of this research. This included providing steel plate materials from a decommissioned truss bridge,
identifying and allowing the use of a suitable test bridge, and equipment and manpower in support of the field
testing portion of the research.
i
TABLE OF CONTENTS
List of Figures ...................................................................................................................................................... ii
List of Tables ....................................................................................................................................................... ii
1 IDEA Product ............................................................................................................................................... 2
1.1 How does the new technology work? .................................................................................................. 2
1.2 How does the instrument operate?....................................................................................................... 3
2 Concept and Innovations .............................................................................................................................. 3
3.4 Field Testing ...................................................................................................................................... 22
3.4.1 Test Description ............................................................................................................................ 22
3.4.2 Verification of Total Stress Measurements ................................................................................... 23
LIST OF FIGURES Figure 1. Photograph of the portable stress measurement technology developed through the research. ............. 2 Figure 2. Photograph showing the USM technology applied to a gusset plate (A) and the resulting total stress
measurement (B). .................................................................................................................................................. 3 Figure 3. Schematic diagram of the test arrangement for USM (A) and ultrasonic birefringence data used to
determine stress (B) .............................................................................................................................................. 4 Figure 4. The pure – mode polarization direction, X and Y axis, rotated through the angle ϕ with respect to
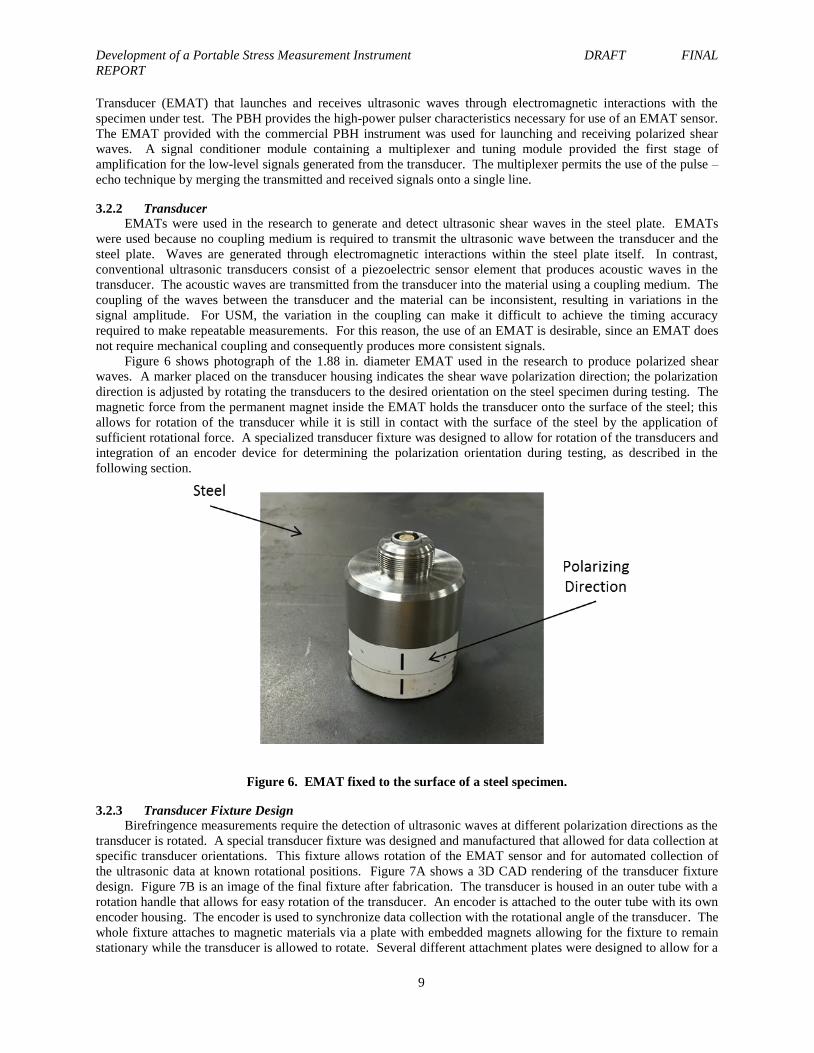
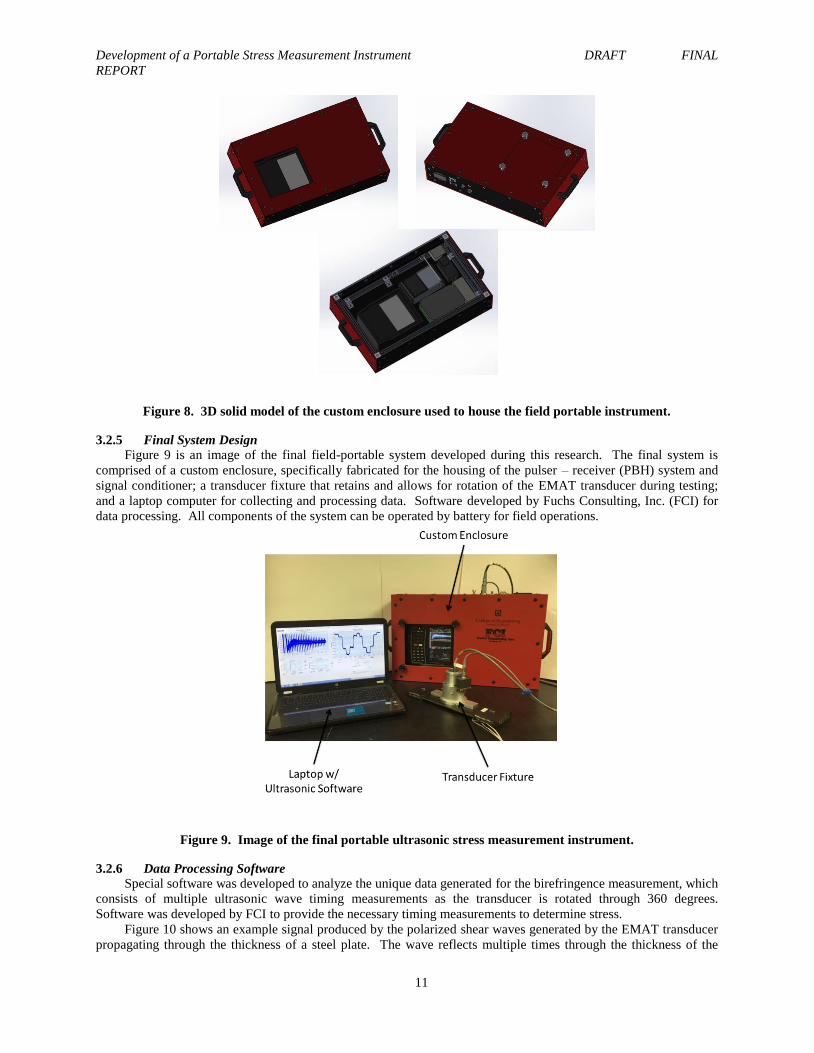
the transverse and rolling direction, X0 and Y0 axis, due to the presence of shear stress. ..................................... 6 Figure 5 Block diagram of the field portable instrument design concept (FCI). .................................................. 8 Figure 6. EMAT fixed to the surface of a steel specimen. ................................................................................... 9 Figure 7. (A) EMAT fixture 3D solid model. (B) Fabricated EMAT fixture. ................................................... 10 Figure 8. 3D solid model of the custom enclosure used to house the field portable instrument. ....................... 11 Figure 9. Image of the final portable ultrasonic stress measurement instrument. .............................................. 11 Figure 10. (A) Sample A – scan of shear waves propagating through the thickness of a material. (B) Individual
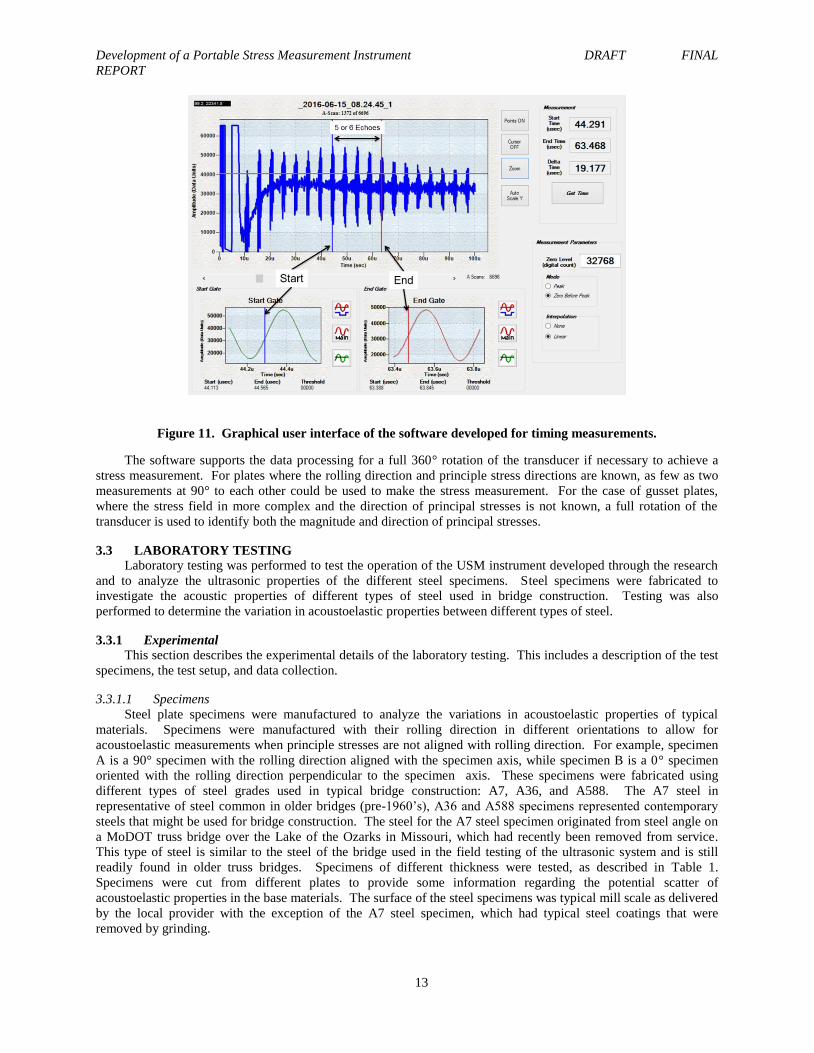
wave packet showing the three-cycle pulse. ....................................................................................................... 12 Figure 11. Graphical user interface of the software developed for timing measurements. ................................ 13 Figure 12. Photograph of the steel specimens fabricated to determine the texture and stress acoustic constants.
The red arrows represent the rolling direction of the steel material. ................................................................... 14 Figure 13. Basic test setup consisting of the loading apparatus, strain gage acquisition system, and portable
ultrasonic instrumentation. .................................................................................................................................. 15 Figure 14. Time-of-flight measurements showing variation in arrival time as the transducer is rotated through
360° at different levels of applied stress. ............................................................................................................ 17 Figure 15. Stress-acoustic relationship for 0° and 90° specimens. ..................................................................... 18 Figure 16. Time-of-flight measurements of the 45° specimen. (A) the average data of two rotations from three
tests. (B) sine regression obtained from the average data. .................................................................................. 19 Figure 17. Relationship between birefringence and uniaxial tensile stress for the specimens fabricated out of
A36 steel. ............................................................................................................................................................ 19 Figure 18. Relationship between the pure-mode polarization rotation φ and uniaxial tensile stress for the 45°
and 60° specimens. .............................................................................................................................................. 20 Figure 19. Birefringence shear stress versus strain gage shear stress for the 45° and 60° specimens. ............... 21 Figure 20. Images of the waveforms obtained from testing varying surface conditions including (A) bare, (B)
primer, and (C) painted. ...................................................................................................................................... 22 Figure 21. Side view photograph of the pony truss bridge used for field testing. ............................................... 23 Figure 22. Photograph of extracted core and coring tool. .................................................................................. 24 Figure 23. Results of field testing showing shear stress measurement made with USM as compared with strain
gage measurements of stress. .............................................................................................................................. 24
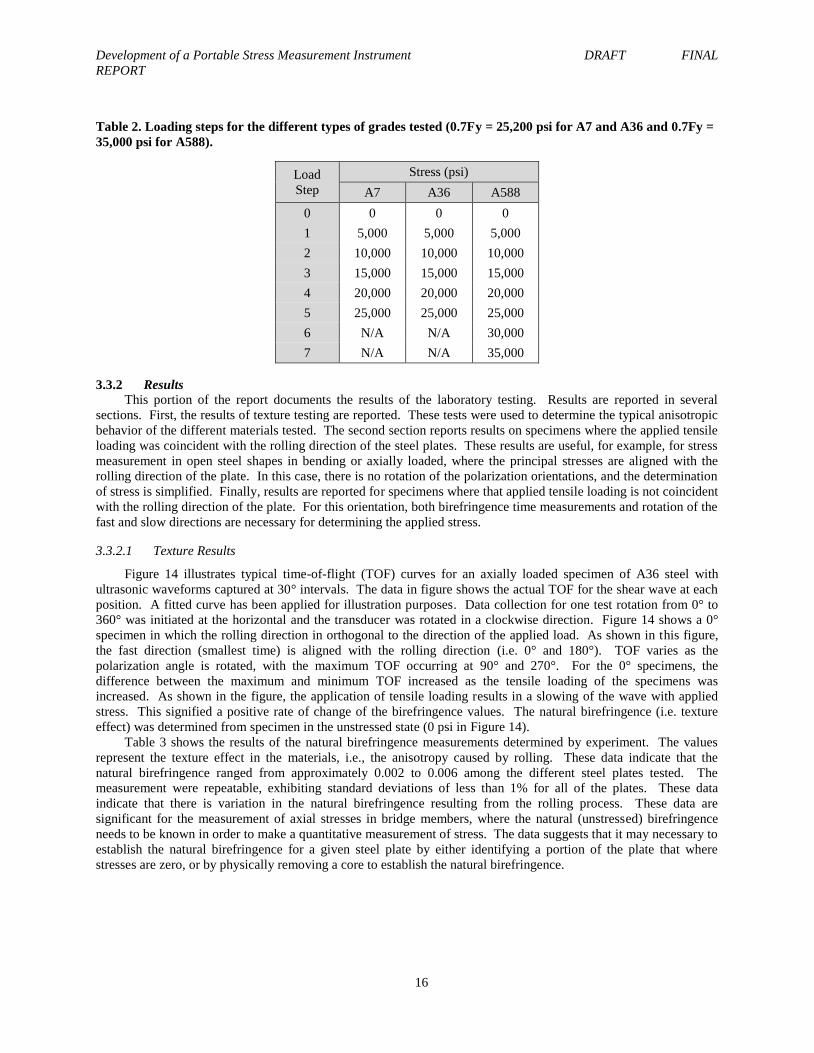
LIST OF TABLES Table 1. Summary of the characteristics of the fabricated test specimens. ........................................................ 14 Table 2. Loading steps for the different types of grades tested (0.7Fy = 25,200 psi for A7 and A36 and 0.7Fy =
35,000 psi for A588). .......................................................................................................................................... 16 Table 3. Natural birefringence measurements for steel specimens. ................................................................... 17 Table 4. Summary of the acoustoelastic constants for the 0° and 90° specimens. ............................................. 18 Table 5. Summary of the birefringence, φ, shear stress, and calculated stress acoustic constant for the 45°
specimen. ............................................................................................................................................................ 20 Table 6. Shear stresses measured with USM and strain gages at location 1. ..................................................... 25
Development of a Portable Stress Measurement Instrument DRAFT FINAL
REPORT
1
EXECUTIVE SUMMARY This report documents the results of IDEA project 179, Development of a Portable Stress Measurement
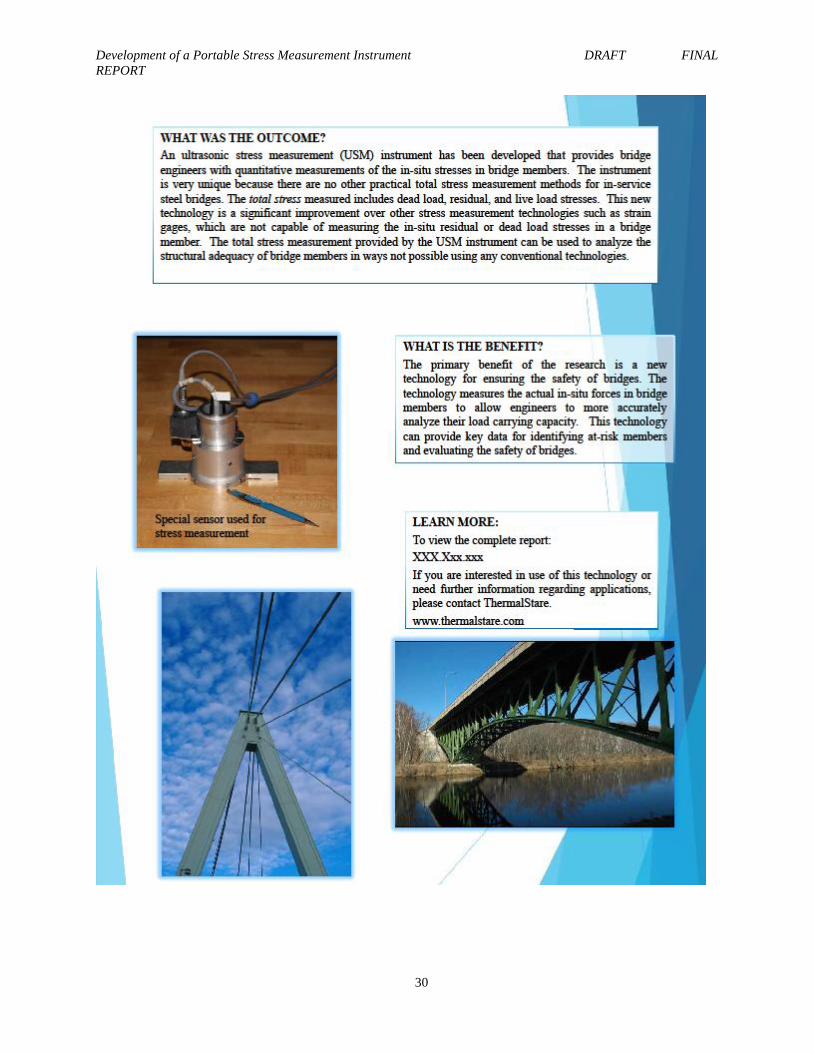
Instrument. An ultrasonic stress measurement (USM) instrument has been developed that provides bridge engineers
with quantitative measurements of the in-situ stresses in bridge members. The instrument is very unique because
there are no other practical total stress measurement methods for in-service steel bridges. The total stress measured
includes dead load, residual, and live load stresses. This new technology is a significant improvement over other
stress measurement technologies such as strain gages, which are not capable of measuring the in-situ residual or
dead load stresses in a bridge member. The total stress measurement provided by the USM instrument can be used
to analyze the structural adequacy of bridge members in ways not possible using conventional technologies.
The USM instrument uses ultrasonic birefringence to measure the total stress in a steel bridge member.
Ultrasonic birefringence is a well-established physical phenomenon that has been used as a laboratory method for
decades. The technology developed through the research extends the application of the birefringence measurements
to practical field applications. The USM instrumentation developed is a portable, battery-operated system designed
to be suitable for practical stress measurement in the field.
The USM instrument provides a tool that helps bridge owners assess bridge safety through data previously not
available. Currently, accurate safety evaluation of bridges can be difficult due to the uncertainty in knowing the
actual loads carried by individual bridge members. Engineers must rely on theoretical assumptions based on design
drawings to analyze load distributions. Design drawings typically do not represent the actual conditions in the field.
Locked or damaged bearings, corrosion damage, impact damage, and misalignment of members can result in
unanticipated load distributions. As a result, analysis to determine if a member has adequate capacity to carry the
applied forces can be inaccurate, because the load distribution is uncertain. The USM instrument developed can
now actually measure the in-situ forces and resulting stress directly to provide the data needed to more accurately
assess structural adequacy and ensure bridge safety.
The USM instrument was developed by integrating and modifying commercially available equipment into a
single portable instrument containing all components needed for the measurements. Instrument development
included specialized software to automatically process birefringence data to determine the magnitude of stresses. A
custom transducer fixture was designed and manufactured that supports the transducer rotation necessary for
birefringence measurements. The USM instrument was tested in the laboratory and through field testing that
verified the accuracy of the total stress measurement.
Laboratory testing was used to determine key acoustic properties of common bridge steels. These laboratory
studies consisted of determining the natural birefringence and acoustoelastic constants for steel, which are used to
relate measured ultrasonic birefringence to the total stress in the steel. Laboratory studies were also used to
develop and test the integrated hardware and software developed through the research.
The operation and capabilities of the USM instrument were verified through a field test. The field test
consisted of measuring the shear stresses in a gusset plate of a truss bridge under different loading conditions. The
total stress measurement was verified by removing a core from the gusset plate at the same location where the USM
was made. Stresses in the core were measured using a conventional strain gage rosette to determine the stresses
released when the core was removed from the plate. It was found that the USM was capable of accurately
determining the total stress in the gusset plate.
Future plans to promote this new technology include more experience with field measurements. Additional
measurements will improve the instrument and will provide a better understanding of how and where the
measurements can best be applied. This project represented a significant step in creation of a portable stress
measurement instrument and a first-generation prototype was developed. Additional system integration is planned
for making the system more portable and easier to use with the end-goal of providing a commercial instrument
available to the highway bridge community.
Development of a Portable Stress Measurement Instrument DRAFT FINAL
REPORT
2
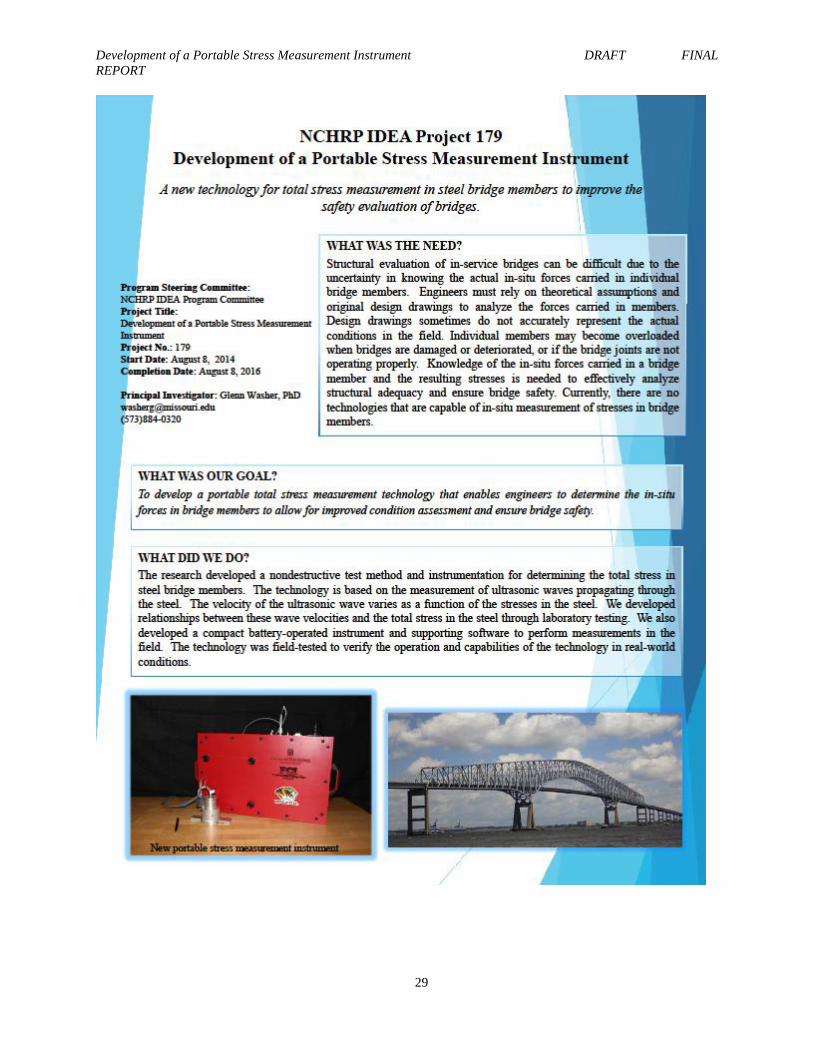
1 IDEA PRODUCT A unique ultrasonic stress measurement (USM) instrument has been developed that provides bridge engineers
with quantitative measurements of the in-situ stresses in bridge members. The unique feature of the USM tool is the
measurement of total stress in a steel member. The total stress measured includes dead load, residual, and live load
stresses. This new technology is a significant improvement over other stress measurement technologies such as
strain gages, which are not capable of measuring the in-situ residual or dead load stresses in a bridge member. The
total stress measurement provided by the new USM instrument technology can be used to analyze the structural
adequacy of bridge members in ways not possible using conventional technologies such as strain gages.
The portable USM instrument shown in Figure 1 consists of an ultrasonic transducer, data acquisition, and
wireless computer interface that interfaces with the data acquisition system to record and process data. The
integrated system measures the in-situ stress carried by a steel bridge member. This tool can be used to identify
critically-stressed members, identify repair or replacement needs, and ensure bridge safety. For example, the tool
can be used to assess the potential for gusset-plate buckling, evaluate the load paths in redundant structures, evaluate
damage following an extreme event, or to identify load distributions in a truss bridge.
The key innovations from the research are the ability to measure total stresses in bridge members and the
development a battery- operated, portable instrument that is practical for field measurements. These developments
provide an important new technology for assessing bridge safety.
1.1 HOW DOES THE NEW TECHNOLOGY WORK?
The instrument uses ultrasonic birefringence to measure the total stress in a steel bridge member. Ultrasonic
birefringence is a well-established physical phenomenon that has been used as a laboratory method for decades. The
resulting USM is the through-thickness average stress carried by the member being evaluated. This measurement is
unique because it includes the total stress in the material, including residual, dead load, and live-load stresses. The
instrumentation developed through this research is battery operated and designed to be suitable for practical stress
measurement in the field.
Figure 1. Photograph of the portable stress measurement technology developed through the research.
Development of a Portable Stress Measurement Instrument DRAFT FINAL
REPORT
3
Figure 2 illustrates the application of the technology in the field to measure stresses carried by a gusset plate.
The photograph in Figure 2A shows the instrument developed through the research with the transducer placed on a
gusset plate, and a truck used to apply different loads on the bridge. The results shown in Figure 2B indicate the
total shear stress measured by the USM technology as compared with the actual total shear stress. These data verify
the capability of the USM developed through the research to make an accurate measurement of stress in the field.
1.2 HOW DOES THE INSTRUMENT OPERATE?
The instrument operates by placing the transducer of the surface of a steel bridge member. The transducer
attaches magnetically to the surface of the steel. The transducer is manually rotated to collect the ultrasonic
birefringence data needed to determine the total stress carried by the member. Data is analyzed by using specialized
software developed through the research. This software automatically calculates the ultrasonic birefringence data
needed for analyzing the magnitude and direction of principal stresses. The USM technology developed is battery
operated and portable for use in the field, and is simple to operate. A single measurement takes about 1-2 minutes to
complete, with the data acquisition and analysis being largely automated through software developed as part of the
research.
2 CONCEPT AND INNOVATIONS
The concept of this research was to develop a practical nondestructive technology for measuring the total stress
carried in bridge members. This new technology provides a tool that helps bridge owners ensure bridge safety
through better analysis of existing bridges. Effective safety evaluation of bridges can be difficult due to the
uncertainty in the actual loads carried by individual bridge members. Engineers must rely on theoretical
assumptions based on design drawings to analyze load distributions, and these design drawings typically do not
represent the actual conditions in the field. Locked or damaged bearings, corrosion damage, impact damage, and
misalignment of members can result in unanticipated load distributions. As a result, analysis to determine if a
member has adequate capacity to carry the applied forces is compromised, because the load distribution is uncertain.
The technology developed measures the in-situ forces and resulting stress directly to provide the data needed to
assess structural adequacy and ensure bridge safety.
Conventional technologies such as strain gages are only capable of measuring the live load portion of stresses
in a bridge member. Strain gages cannot measure the dead load stresses resulting from the weight of bridge
materials, locked-in stresses resulting from member misalignment, or residual stresses. These stresses are often
larger than the live load stresses applied by traffic loading. The safety evaluation of bridges can be greatly improved
Figure 2. Photograph showing the USM technology applied to a gusset plate (A) and the resulting total stress
measurement (B).
Development of a Portable Stress Measurement Instrument DRAFT FINAL
REPORT
4
by a technology that measures the total stresses carried in a bridge member, including the live load, dead load,
locked-in, and residual stresses. In fact, the measurement of total stresses in bridge members was identified as the
number two research priority by a working group of state bridge engineers, industry, and academics assembled by
the FHWA in 2016[1]. The concept of the research was to develop a nondestructive tool that can address the need
for practical, quantitative measurement of total stress to assist bridge owners in ensuring bridge safety.
The USM technology developed is based on measuring the ultrasonic birefringence in a steel plate.
Birefringence is the difference in ultrasonic wave velocity between orthogonally polarized shear waves, which
varies as a function of stress. Figure 3A shows a schematic diagram of the test arrangement for making the stress
measurement using polarized shear waves. As shown in the figure, the transducer is placed on the surface of the
steel, and a polarized shear wave is launched from the transducer. The wave propagates through the thickness of the
plate, reflecting from the opposite surface and detected by the transducer. The travel time for the wave to propagate
through the plate is determined as shown in Figure 3B. When the transducer is rotated, the travel time varies
revealing a “fast” direction and a “slow” direction. The birefringence is the difference between the ultrasonic
velocities in the “fast” and “slow” directions. As shown in the figure, the magnitude of the birefringence varies as a
function of the stress. For the data shown in the figure, the birefringence is larger for a stress of 25,000 psi as
compared with a stress of 0 psi.
The concept of USM based on birefringence has been the subject of study in the past, primarily utilized for
research and laboratory applications. Practical instrumentation, sensor technology and software for applying USM
for measuring total stress in bridge members has not been developed previously.
The research reported herein developed a practical field instrument for performing ultrasonic birefringence
measurement to determine the total stress in steel plates. The key innovations from the research are the ability to
measure total stresses in bridge members and the development a battery operated, portable, practical instrument for
field measurements. These developments provide an important new technology for assessing bridge safety.
Figure 3. Schematic diagram of the test arrangement for USM (A) and ultrasonic birefringence data used
to determine stress (B)
Development of a Portable Stress Measurement Instrument DRAFT FINAL
REPORT
5
3 INVESTIGATION This portion of the report describes the investigation and testing completed as part of the research. Section 3.1
provides background on the underlying theory governing the use of ultrasonic waves to measure total stress, and
discusses the application of the technology for the evaluation of gusset plates in truss bridges. Section 3.2 describes
the development of the USM instrument and supporting software. The ultrasonic measurement of stress in bridge
steels has been the subject of limited previous research with only a few field applications for stress measurement in
bridges. Therefore, the research included laboratory testing to assess key parameters and develop the operation of
the USM technology. Section 3.3 describes the laboratory testing completed as part of the research. These testes
were used to evaluate key ultrasonic properties of bridge steel such as the acoustoelastic constants needed to convert
birefringence measurements to stress measurements.
To demonstrate the implementation of the technology in the field, the research included a field trial in which
the new USM technology was used to evaluate shear stresses in a gusset plate of a truss bridge. This application
was selected due to its relevance the 2007 collapse of the I-35W bridge over the Mississippi River in Minneapolis,
in which a gusset plate failure resulted in the collapse of the entire bridge. Section 3.4 describes the field testing
completed as part of the research to demonstrate field implementation of the technology and verify the stress
measurements.
3.1 BACKGROUND
3.1.1 Ultrasonic Stress Measurement with Birefringence
Ultrasonic testing (UT) utilizes high frequency sound energy for characterization and examination of material
properties of structural members in a bridge. Typical UT systems consist of a pulser/receiver, a transducer, and a
display window for measurement analysis. UT inspection is currently used for flaw detection in welds, dimensional
measurements (e.g. plate thickness) of materials, and material characterization (e.g. modulus).
The use of ultrasonic waves for stress measurement is a less common use of the technology. Ultrasonic stress
measurement is based on the variation of wave velocity caused by applied strain. The elastic properties of a metal
are a function of strain in the material; therefore, when the material undergoes strain the velocity of the wave will
change [2]. This phenomenon is known as the acoustoelastic effect. For small changes in an wave velocity a
relationship between the measured velocity of the acoustic waves and stress can be linearly characterized by
Equation 1:
𝑉 = 𝑉0 + 𝑘𝜎 (1)
where 𝑉0 is the wave velocity in an unstressed medium, 𝑘 is a material-dependent acoustoelastic constant, and
𝜎 is the stress in the material [2, 3]. This general relationship has been used in the past for applications such as
determining the stress in prestressing strand, measuring fatigue loading in steel bridges, and measuring stress in
railroad tracks[4-6]. In this research, ultrasonic birefringence has been applied for measuring stress in the gusset
plates and other steel bridge members.
In an isotropic homogeneous material, ultrasonic shear waves propagate at a single velocity regardless of wave
polarization direction. In steel, the shear wave velocity is approximately 10,500 ft/sec. However, if a material
exhibits anisotropy, the velocity of the shear waves will become dependent of the polarization direction of the wave.
Anisotropy in a material occurs for two reasons; texture and stress [7]. The texture effect, or the natural
birefringence, is typically due to the fabrication process of the material. Mechanical process introduces a texture to
the material by elongating the polycrystalline grain structure into a preferred orientation in the rolling direction.
This causes a “natural” birefringence effect, 𝐵0, in the steel when the stresses in the material are nominally zero. As
a result, the fast pure – mode polarization direction is coincident with the rolling direction of the unstressed steel
material, and the slow pure – mode polarization direction is transverse to the rolling direction in the same unstressed
steel material.
Stresses in the material that result in strain relative to the natural positions of the atoms also cause anisotropy in
the material. The ultrasonic birefringence method measures the anisotropy (as manifested through the wave
velocities) caused by stress in the material to quantify the level of stress, relative to the unstressed state. In this way,
the USM measurement includes any stresses causing the material to be strained. This includes residual stresses, live
load stresses, and dead load stresses.
The material anisotropy results in polarization orientations where the wave velocity is at a maximum and
minimum, typically termed the “fast” and “slow” wave direction. These orientations are known as pure – mode
Development of a Portable Stress Measurement Instrument DRAFT FINAL
REPORT
6
polarization directions and are orthogonal to one another. The normalized difference in velocity of the pure-mode
polarization directions is the acoustic birefringence, B, defined by Equation 2:
𝐵 =𝑉𝑓 − 𝑉𝑠
𝑉𝑎𝑣𝑔
(2)
where 𝑉𝑓 is the velocity of the fast wave, 𝑉𝑠 is the velocity of the slow wave, and 𝑉𝑎𝑣𝑔 is the average velocity of the
wave. These types of measurements are independent of material thickness because the wave propagates over the
same material distance. Therefore, the difference between those measurements can be characterized as the transit
time, or time-of-flight (TOF), of the wave through the material thickness. Acoustic birefringence can then be
rewritten as follow in Equation 3:
𝐵 =𝑡𝑓 − 𝑡𝑠
𝑡𝑎𝑣𝑔
(3)
where 𝑡𝑓 is the TOF of the fast wave, 𝑡𝑠 is the TOF of the slow wave, and 𝑡𝑎𝑣𝑔 is the average TOF of the wave.
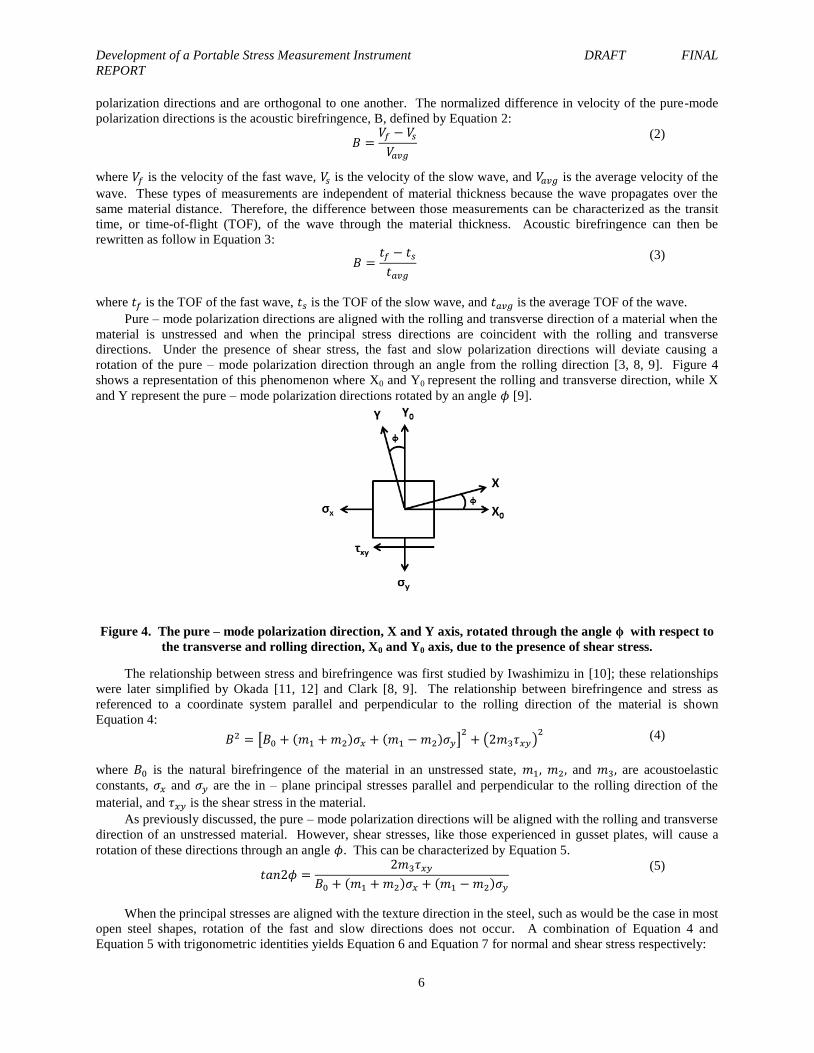
Pure – mode polarization directions are aligned with the rolling and transverse direction of a material when the
material is unstressed and when the principal stress directions are coincident with the rolling and transverse
directions. Under the presence of shear stress, the fast and slow polarization directions will deviate causing a
rotation of the pure – mode polarization direction through an angle from the rolling direction [3, 8, 9]. Figure 4
shows a representation of this phenomenon where X0 and Y0 represent the rolling and transverse direction, while X
and Y represent the pure – mode polarization directions rotated by an angle 𝜙 [9].
Figure 4. The pure – mode polarization direction, X and Y axis, rotated through the angle ϕ with respect to
the transverse and rolling direction, X0 and Y0 axis, due to the presence of shear stress.
The relationship between stress and birefringence was first studied by Iwashimizu in [10]; these relationships
were later simplified by Okada [11, 12] and Clark [8, 9]. The relationship between birefringence and stress as
referenced to a coordinate system parallel and perpendicular to the rolling direction of the material is shown
Equation 4:
𝐵2 = [𝐵0 + (𝑚1 +𝑚2)𝜎𝑥 + (𝑚1 −𝑚2)𝜎𝑦]2+ (2𝑚3𝜏𝑥𝑦)
2 (4)
where 𝐵0 is the natural birefringence of the material in an unstressed state, 𝑚1, 𝑚2, and 𝑚3, are acoustoelastic
constants, 𝜎𝑥 and 𝜎𝑦 are the in – plane principal stresses parallel and perpendicular to the rolling direction of the
material, and 𝜏𝑥𝑦 is the shear stress in the material.
As previously discussed, the pure – mode polarization directions will be aligned with the rolling and transverse
direction of an unstressed material. However, shear stresses, like those experienced in gusset plates, will cause a
rotation of these directions through an angle 𝜙. This can be characterized by Equation 5.
𝑡𝑎𝑛2𝜙 =
2𝑚3𝜏𝑥𝑦
𝐵0 + (𝑚1 +𝑚2)𝜎𝑥 + (𝑚1 −𝑚2)𝜎𝑦
(5)
When the principal stresses are aligned with the texture direction in the steel, such as would be the case in most
open steel shapes, rotation of the fast and slow directions does not occur. A combination of Equation 4 and
Equation 5 with trigonometric identities yields Equation 6 and Equation 7 for normal and shear stress respectively:
Development of a Portable Stress Measurement Instrument DRAFT FINAL
REPORT
7
𝑚1(𝜎𝑥 + 𝜎𝑦) + 𝑚2(𝜎𝑥 − 𝜎𝑦) = 𝐵𝑐𝑜𝑠2𝜙 − 𝐵0 (6)
and
𝜏𝑥𝑦 =𝐵 sin 2𝜙
2𝑚3
(7)
It is notable that the final equation does not depend on the natural birefringence in the material, but rather only
on the measured birefringence at a given stress level, and the appropriate stress-acoustic constant, m3. These
equations demonstrate the relationship between the stress state of a material and birefringence measurements. In
this research, these relationship have been used to measure the total stress in steel gusset plates, focusing on the
shear stress measurement that requires calculating both the angle of the pure mode rotations and the birefringence.
3.1.2 Stress Measurement In Gusset Plates
A key motivation for the research was the need for improved methods to evaluate the structural capacity of
steel bridge members, including gusset plates in truss bridges. The need for structural evaluation of gusset plates
was revealed by the collapse of the I35W bridge in 2007. This tragic accident, in which 13 motorist were killed,
was caused by the failure of an over-stressed gusset plate in one of the bridge joints [13]. The gusset plates that
failed were not adequately sized to properly support the large compressive forces transmitted from the primary truss
members.
Previous research by Mentes indicated gusset plates fail in one of two ways. For thin gusset plates, less than
3/8 in thickness, the plate fails due to buckling, while thick gusset plates, greater than 5/8 in thickness, fail due to
shear failures [14]. The work performed by Ocel with the Federal Highway Administration determined the main
cause of gusset plate failure was due to the high shear stresses in the gusset plates. This work included full-scale
testing of 13 gusset plate members using experimental and analytical methods. The results from these investigations
determined that half of the test specimens failed due to buckling and the other half failed due to shear yielding [15].
Ocel concluded that:
Although it may seem odd to use a shear formulation to predict buckling, the research showed that
once a partial shear plane in the gusset plate along a compression member yields, its elastic
modulus decreases and thus reduces the out-of-plane rotational restraint the plate can provide to
the idealized column [15].
The work performed by Ocel is further reiterated in a study of in-service gusset plates in bridges performed by
the University of Washington for the Washington State Department of Transportation. This study concluded that
buckling in gusset plates did not occur prior to yielding of the gusset plate in any of the connections studied. The
interaction of the complex stresses generated in the gusset plate members, as previously described by Whitmore,
initiated the yielding of the members [16]. Therefore, it is of the upmost importance to assess the magnitude of
shear stresses in gusset plates to identify members potentially at risk of failure.
This previous research indicates that the analysis of shear stresses in the gusset plates is key to assessing the
risk of failure. However, analytical determination of the forces and stresses in the gusset plate is complicated by the
need to estimate the load induced from the axial-force members joined by the gusset plate. As previously discussed,
determining the force carried in these members and transferred by the gusset plate is complicated by the uncertain
load distribution in truss bridges. An additional complication for gusset plates is that the plates commonly have
corrosion damage resulting in section loss. Therefore, even if the forces were known, the total section of the plate
carrying those loads may be uncertain. A direct measurement of total stress, such as offered by the USM technology
developed through this research, overcomes these challenges. Since the USM instrument measures total stress, the
effect of any section loss is measured directly in the stress measurement. The unknown distribution of forces is also
mitigated, since the total stress measurement assesses the effect of those loads, even if the loads themselves are
unknown. For these reasons, the research focused on the measurement of shear stresses in gusset plates to
demonstrate the unique characteristics and utility of the USM technology.
It should be noted that there are other more conventional applications for the USM, some of which have been
developed in the past. For example, Lozev et. al. [3] explored measuring the locked-in forces in an I-shaped
member of a jointless bridge. Clark et. al. [8] implemented USM as a tool to determine if a pin and hanger
connection were locked by measuring the bending stresses in the hanger plate. Fuchs et. al. [5] developed USM for
Development of a Portable Stress Measurement Instrument DRAFT FINAL
REPORT
8
monitoring applied live loads for the purpose of measuring stress ranges for analyzing remaining fatigue life. Axial
stresses in truss members and bending stresses in open and closed steel bridge members are additional applications
where the ability of USM to measure normal stresses could be applied. USM in this research focused on the unique
application of gusset plates as described above, although much of the developmental laboratory testing that will be
described illustrates the measurement of axial stresses that could be applied to primary bridge members.
3.2 DEVELOPMENT OF THE USM INSTRUMENT
A field-ready instrument was developed through modification of commercially-available hardware and
integration into a practical system suitable for field implementation. The primary components of the system
consisted of the following:
1. A pulser-reciever for launching and detecting polarized shear waves
2. Computer software for signal analysis
3. Wireless link for communication
4. Rotational ransducer fixture with encoder
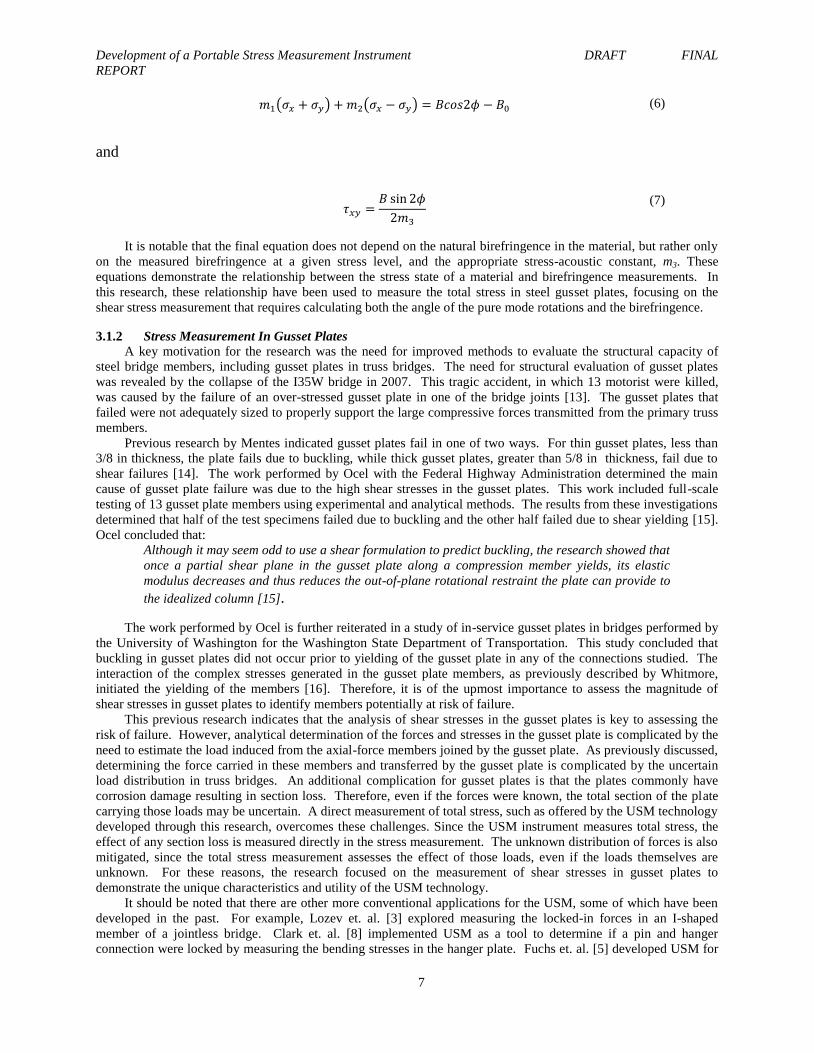
The design of the system is intended to create a small, portable system that is easy to use in the field. This
system contains a minimum number of components and operates in a near – automatic mode. Figure 5 shows a
block diagram of the instrument developed through the research. The design incorporates a self-contained data
acquisition system, a wireless router, battery and signal conditioning module. Each of these components was
mounted in a suitable field-ready enclosure. A specialized rotational transducer fixture was designed and
manufactured that allowed the transducer to be rotated in a circular fashion to support the birefringence
measurement. A laptop computer was used for data collection and signal processing of the data. The synchronized
data collection is triggered by the transducer position, and processed via the remote laptop computer that
communicates with the system through a wireless router or via a USB connection. The following section describes
each of the components of the USM instrument developed through the research.
Figure 5 Block diagram of the field portable instrument design concept (FCI).
3.2.1 Ultrasonic Pulser- Receiver
A commercially available ultrasonic instrument (Innerspec Temate® Powerbox H (PBH)) was used to provide
the pulser-receiver for launching and receiving ultrasonic waves. The commercial instrument was used to because it
integrated several key components necessary for USM such as an ultrasonic pulser, high speed ultrasonic receiver,
and a transducer for launching and receiving ultrasonic waves. The transducer is an Electromagnetic Acoustic
Development of a Portable Stress Measurement Instrument DRAFT FINAL
REPORT
9
Transducer (EMAT) that launches and receives ultrasonic waves through electromagnetic interactions with the
specimen under test. The PBH provides the high-power pulser characteristics necessary for use of an EMAT sensor.
The EMAT provided with the commercial PBH instrument was used for launching and receiving polarized shear
waves. A signal conditioner module containing a multiplexer and tuning module provided the first stage of
amplification for the low-level signals generated from the transducer. The multiplexer permits the use of the pulse –
echo technique by merging the transmitted and received signals onto a single line.
3.2.2 Transducer
EMATs were used in the research to generate and detect ultrasonic shear waves in the steel plate. EMATs
were used because no coupling medium is required to transmit the ultrasonic wave between the transducer and the
steel plate. Waves are generated through electromagnetic interactions within the steel plate itself. In contrast,
conventional ultrasonic transducers consist of a piezoelectric sensor element that produces acoustic waves in the
transducer. The acoustic waves are transmitted from the transducer into the material using a coupling medium. The
coupling of the waves between the transducer and the material can be inconsistent, resulting in variations in the
signal amplitude. For USM, the variation in the coupling can make it difficult to achieve the timing accuracy
required to make repeatable measurements. For this reason, the use of an EMAT is desirable, since an EMAT does
not require mechanical coupling and consequently produces more consistent signals.
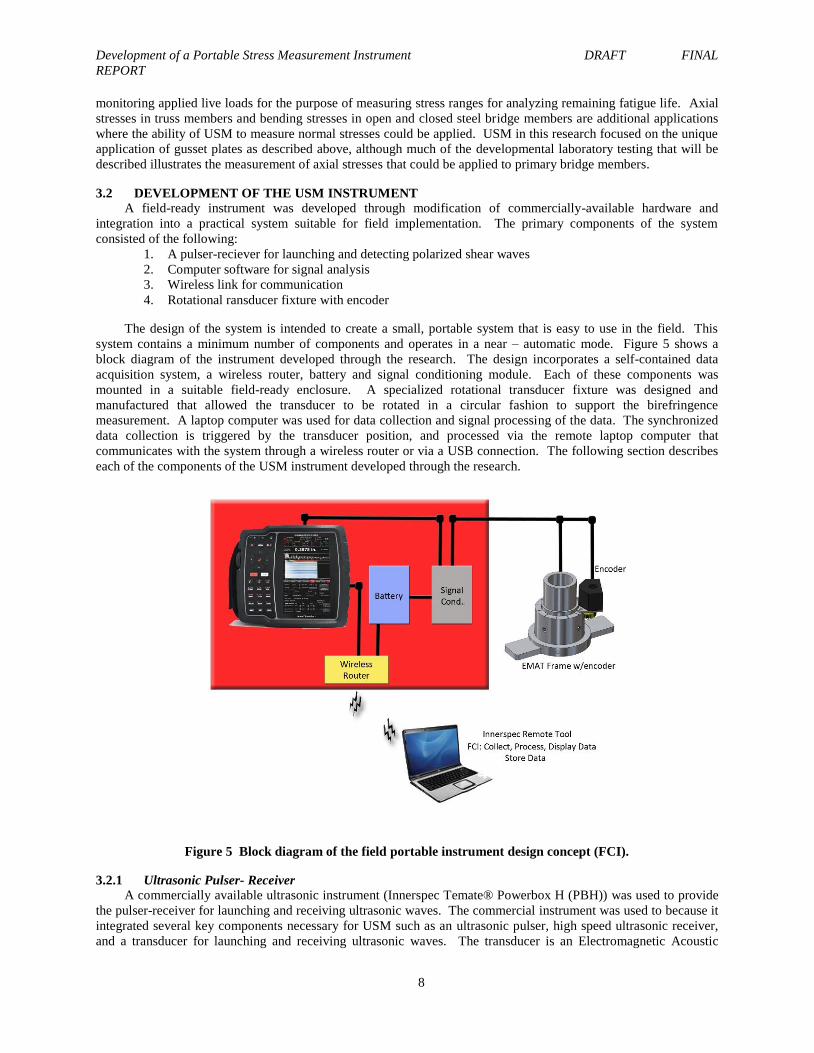
Figure 6 shows photograph of the 1.88 in. diameter EMAT used in the research to produce polarized shear
waves. A marker placed on the transducer housing indicates the shear wave polarization direction; the polarization
direction is adjusted by rotating the transducers to the desired orientation on the steel specimen during testing. The
magnetic force from the permanent magnet inside the EMAT holds the transducer onto the surface of the steel; this
allows for rotation of the transducer while it is still in contact with the surface of the steel by the application of
sufficient rotational force. A specialized transducer fixture was designed to allow for rotation of the transducers and
integration of an encoder device for determining the polarization orientation during testing, as described in the
following section.
Figure 6. EMAT fixed to the surface of a steel specimen.
3.2.3 Transducer Fixture Design
Birefringence measurements require the detection of ultrasonic waves at different polarization directions as the
transducer is rotated. A special transducer fixture was designed and manufactured that allowed for data collection at
specific transducer orientations. This fixture allows rotation of the EMAT sensor and for automated collection of
the ultrasonic data at known rotational positions. Figure 7A shows a 3D CAD rendering of the transducer fixture
design. Figure 7B is an image of the final fixture after fabrication. The transducer is housed in an outer tube with a
rotation handle that allows for easy rotation of the transducer. An encoder is attached to the outer tube with its own
encoder housing. The encoder is used to synchronize data collection with the rotational angle of the transducer. The
whole fixture attaches to magnetic materials via a plate with embedded magnets allowing for the fixture to remain
stationary while the transducer is allowed to rotate. Several different attachment plates were designed to allow for a
Development of a Portable Stress Measurement Instrument DRAFT FINAL
REPORT
10
variety of different mounting options to address different possible geometric restraints. For example, for large plates
where there are few spatial constraints, an attachment plate with four magnetic-arm plates was designed that
provides for maximum stability of the transducer. For situations where spatial constraints are significant, such as
where connected members intersect, a ring-shaped magnetic attachment without magnetic-arm plates was designed.
Development of a Portable Stress Measurement Instrument DRAFT FINAL
REPORT
28
6 INVESTIGATORS’ PROFILE Dr. Glenn Washer is a Professor at the University of Missouri – Columbia (MU). Before joining the
University, Dr. Washer was with the Federal Highway Administration (FHWA) at the Turner Fairbank Research
Center (TFHRC) where he served as the director of the FHWA Nondestructive Evaluation (NDE) program. Dr.
Washer has expertise in a wide variety of NDE technologies for the condition assessment of highway bridges,
including ultrasonics, thermography, ground penetrating radar, radiography and the visual inspection of bridges. Dr. Paul Fuchs is a private consultant and business owner. He develops commercial technology to assess civil
structures, including laser measurement technologies, infrared imaging instrumentation and systems, and ultrasonics.
Dr. Fuchs received his Ph.D. in Electrical Engineering from West Virginia University in 1995. Dr. Fuchs has over
nineteen years of experience as an entrepreneur and business owner. This includes experience developing,
managing, and conducting research projects and related activities for an engineering consulting, instrumentation
design and development company.
Drs. Fuchs and Washer began the company ThermalStare, LLC in 2015 to commercialize products developed
through their research. The products ThermalStare is commercializing were developed under funding programs
such as the FHWA Small Business Innovative Research (SBIR) program, the National Pooled Fund Program, and
the NCHRP IDEA program. A suite of technologies that were initiated as research projects are now commercially
available from Thermalstare. Applications include, but are not limited to, bridge deck and soffit inspection, thermal
stress measurement, coating assessment, and long-term bridge monitoring systems. ThermalStare clients include the
US Navy, state Departments of Transportation, and engineering consulting companies.
Development of a Portable Stress Measurement Instrument DRAFT FINAL
REPORT
29
Development of a Portable Stress Measurement Instrument DRAFT FINAL