Page 1
DIPARTIMENTO DI INGEGNERIA DELL’ENERGIA DEI SISTEMI,
DEL TERRITORIO E DELLE COSTRUZIONI
RELAZIONE PER IL CONSEGUIMENTO DELLA
LAUREA MAGISTRALE IN INGEGNERIA GESTIONALE
Development of a Reverse Supply Chain Model for Home Appliances Remanufacturing in China
RELATORI CANDIDATO
Prof. Ing. Gino Dini Matteo Grava
Dipartimento di Ingegneria Civile e Industriale [email protected]
Dott. Yuchun Xu
School of Applied Sciences, Cranfield University
Page 2
Sessione di Laurea del 03/12/2014
Anno Accademico 2013/2014 Consultazione consentita
Page 3
i
Development of a Reverse Supply Chain model for Home Appliances
Remanufacturing in China Matteo Grava
SOMMARIO
Questo lavoro di ricerca deriva dell’Individual Project svolto presso la Nanjing
University of Aeronautics and Astronautics (NUAA) nel periodo
Maggio/Settembre 2014, nell’ambito del programma di Double Degree tra
l’Università di Pisa e Cranfield University per l’anno 2013/2014. Il progetto fa
parte di un programma di ricerca chiamato “7 th Framework Programme for
Research and Technological Development (FP7)”, sponsorizzato dalla
Comunità europea ed è stato svolto interamente a Nanjing in Cina.
Tradizionalmente le aziende che producono elettrodomestici considerano i
prodotti che sono arrivati alla fine del loro ciclo di vita come una perdita
automatica piuttosto che una un ulteriore opportunità di aumentare i profitti.
Tuttavia, il remanufacturing sembra una strada economicamente vantaggiosa
che permette di recuperare il valore dei prodotti alla fine del loro ciclo di vita e
dunque incrementare i profitti aziendali riducendo sia sprechi che inquinamento.
In questo riguardo, diventa necessario sviluppare un modello di Reverse Supply
Chain (RSC) che spinga le aziende a ritirare i prodotti alla fine del loro ciclo di
vita con il fine del remanufacturing. Questo progetto di tesi si pone come
obbiettivo lo sviluppo di un modello di RSC che renda il remanufacturing di
elettrodomestici alla fine del ciclo di vita una strada economicamente
percorribile nel mercato cinese.
ABSTRACT
This research project derives from the Individual Project that was developed at
Nanjing University of Aeronautics and Astronautics (NUAA) in the period
May/September 2014, because of the Double Degree agreement set between
Pisa and Cranfield for the year 2013/2014. The project is a work package of a
Page 4
ii
research program called “7 th Framework Programme for Research and
Technological Development (FP7)”, sponsored by the European Community
and it was wholly carried out in Nanjing, China. Traditionally, Chinese home
appliances companies consider End-of Life (EOL) products as an automatic
financial loss rather than an opportunity to increase the business profitability.
Remanufacturing seems an EOL alternative, which could increase profits and at
the same time reduce waste and pollution. In this regard, there is a need to
develop a profitable Reverse Supply Chain (RSC) model, which motivates
Chinese home appliances companies to take back EOL products for
remanufacturing. This thesis seeks to develop a RSC model, which makes EOL
home appliances remanufacturing an economically viable EOL alternative in the
Chinese market.
Page 5
iii
ACKNOWLEDGEMENTS
I wish to express my sincere gratitude to all those people, which have helped
and supported me during these 3 months of thesis project in China.
Firstly, I would like to thank my supervisors Dr. Yuchun Xu and Prof. Ing. Gino
Dini. Their support, encouragements and guidance have been fundamental to
reach new goals and accomplish successfully this project. Especially, I am
profoundly grateful for the opportunity they offered to me. This period in China
has been a beautiful experience, which I will never forget.
Secondly, I would like to thank the PhD students in NUAA University in Nanjing.
Their continuous help and support to handle and solve every day problems has
been fundamental. Especially, I would like to acknowledge Dr. Kun Zheng for its
collaboration in the market research carried out.
Thirdly, I would like to express my gratitude to my family back home in Forte dei
Marmi for the continuous support they gave me during my MSc in Cranfield and
especially during these three months in China. Their love has been determinant
for the success of my studies. In addition, I would like to dedicate this thesis to
my grandmother Bruna, which passed away last November.
Lastly, I would like to extend my gratitude to all those people I had the chance
to meet in China. Thank you for all moments we spent together. I will never
forget you.
Page 7
v
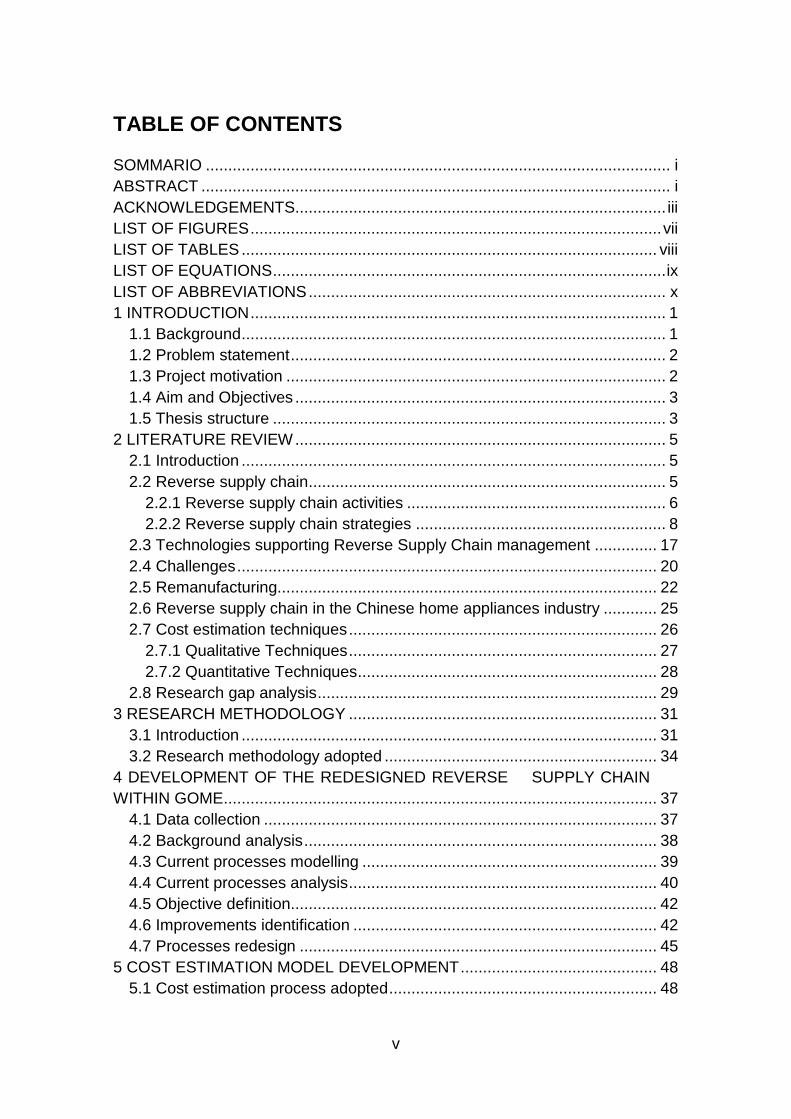
TABLE OF CONTENTS
SOMMARIO ........................................................................................................ i
ABSTRACT ......................................................................................................... i
ACKNOWLEDGEMENTS................................................................................... iii
LIST OF FIGURES ............................................................................................ vii
LIST OF TABLES ............................................................................................. viii
LIST OF EQUATIONS ........................................................................................ ix
LIST OF ABBREVIATIONS ................................................................................ x
1 INTRODUCTION ............................................................................................. 1
1.1 Background ............................................................................................... 1
1.2 Problem statement .................................................................................... 2
1.3 Project motivation ..................................................................................... 2
1.4 Aim and Objectives ................................................................................... 3
1.5 Thesis structure ........................................................................................ 3
2 LITERATURE REVIEW ................................................................................... 5
2.1 Introduction ............................................................................................... 5
2.2 Reverse supply chain ................................................................................ 5
2.2.1 Reverse supply chain activities .......................................................... 6
2.2.2 Reverse supply chain strategies ........................................................ 8
2.3 Technologies supporting Reverse Supply Chain management .............. 17
2.4 Challenges .............................................................................................. 20
2.5 Remanufacturing..................................................................................... 22
2.6 Reverse supply chain in the Chinese home appliances industry ............ 25
2.7 Cost estimation techniques ..................................................................... 26
2.7.1 Qualitative Techniques ..................................................................... 27
2.7.2 Quantitative Techniques ................................................................... 28
2.8 Research gap analysis ............................................................................ 29
3 RESEARCH METHODOLOGY ..................................................................... 31
3.1 Introduction ............................................................................................. 31
3.2 Research methodology adopted ............................................................. 34
4 DEVELOPMENT OF THE REDESIGNED REVERSE SUPPLY CHAIN
WITHIN GOME ................................................................................................. 37
4.1 Data collection ........................................................................................ 37
4.2 Background analysis ............................................................................... 38
4.3 Current processes modelling .................................................................. 39
4.4 Current processes analysis ..................................................................... 40
4.5 Objective definition.................................................................................. 42
4.6 Improvements identification .................................................................... 42
4.7 Processes redesign ................................................................................ 45
5 COST ESTIMATION MODEL DEVELOPMENT ............................................ 48
5.1 Cost estimation process adopted ............................................................ 48
Page 8
vi
5.2 Cost estimation technique selection........................................................ 49
5.3 Cost breakdown structure (CBS) development ....................................... 52
5.3.1 Activity cost elements identification .................................................. 52
5.4 Cost drivers identification ........................................................................ 53
5.5 Cost estimation relationships (CERs) development ................................ 55
5.6 Cost model implementation .................................................................... 62
6 CASE STUDY ............................................................................................... 63
7 DISCUSSION ................................................................................................ 69
8 CONCLUSIONS ............................................................................................ 71
REFERENCES ................................................................................................. 72
APPENDICES .................................................................................................. 85
Page 9
vii
LIST OF FIGURES
Figure 2-1 RSC activities (Blackburn et al., 2004) .............................................. 7
Figure 2-2 Time Value of Product Returns (Blackburn et al., 2004) ................. 10
Figure 2-3 Centralised RSC model (Blackburn et al., 2004) ............................. 11
Figure 2-4 Decentralized RSC model (Blackburn et al., 2004) ......................... 13
Figure 2-5 Leagile Supply Chain (Wei, 2011) ................................................... 15
Figure 2-6 Generic remanufacturing process (Steinhilper, 1998) ..................... 22
Figure 2-7 Cost estimation techniques (Niazi et al., 2006) ............................... 27
Figure 4-8 Methodology adopted for RSC redesign ......................................... 37
Figure 4-9 Current RSC model (adapted from: Wei, 2011) .............................. 39
Figure 4-10 Redesigned RSC model ................................................................ 45
Figure 4-11 Remanufacturing steps (Sundin, 2005) ......................................... 46
Figure 5 12 Cost estimation process (adapted from: NASA, 2002) .................. 48
Figure 5-13 Cost estimation requirements (NASA, 2002) ................................ 49
Figure 5-14 CBS for EOL home appliances remanufacturing........................... 52
Figure 5-15 MS Excel based cost model .......................................................... 62
Figure 6-16 Top Mount Refrigerator (Haier, 2014) ........................................... 63
Figure 6-17 RSC cost distribution ..................................................................... 65
Figure 6-18 Market research results ................................................................. 66
Page 10
viii
LIST OF TABLES
Table 3-1 Research methodology adopted ...................................................... 33
Table 4-2 Improvements identified to increase the RE ..................................... 43
Table 5-3 Cost drivers for the redesigned RSC model ..................................... 54
Table 6-4 RSC cost breakdown ........................................................................ 64
Table 6-5 Profit margin reachable in the Chinese market ................................ 66
Page 11
ix
LIST OF EQUATIONS
Equation (4-1) ................................................................................................... 42
Equation (5-2) ................................................................................................... 55
Equation (5-3) ................................................................................................... 55
Equation (5-4) ................................................................................................... 56
Equation (5-5) ................................................................................................... 56
Equation (5-6) ................................................................................................... 57
Equation (5-7) ................................................................................................... 57
Equation (5-8) ................................................................................................... 58
Equation (5-9) ................................................................................................... 58
Equation (5-10) ................................................................................................. 58
Equation (5-11) ................................................................................................. 59
Equation (5-12) ................................................................................................. 59
Equation (5-13) ................................................................................................. 60
Equation (5-14) ................................................................................................. 60
Equation (5-15) ................................................................................................. 60
Equation (5-16) ................................................................................................. 61
Page 12
x
LIST OF ABBREVIATIONS
RSC Reverse Supply Chain
EOL End-of-Life
Page 13
1
1 INTRODUCTION
1.1 Background
Waste Electrical and Electronic Equipment (WEEE) Management is a well
known fast increasing waste stream in China with a growth rate from 13 to 15 %
per year and nowadays represents one of the main challenges to sustainability
(Wei and Liu, 2012).
Over past decade, the life cycle of the home electrical appliances has been
considerably shortened, due to technology advancements, compatibility issues,
marketing and attractive customer designs. The result is a larger volume of
WEEE, which is seriously affecting the environment and causing high pollution
level (Kiddee, et al., 2013). The WEEE often contains a large amount of
different hazardous materials such as heavy metals and organic pollutants,
which can be harmful for both environment and humans. When EOL home
appliances are not remanufactured or recycled, new raw materials have to be
extracted to produce a new product, resulting in further environmental burden
(Zhou and Zang 2009; Cui and Forssberg, 2003; Bains e al., 2006: Bohr, 2007).
Some countries have already implemented regulations to cope with the WEEE
growth’s rate in order to reduce it, while others are still lagging behind. In
particular, China is considered the biggest producers, importer and exporter of
WEEE (Yang at al., 2008). The country represents a huge market for home
electrical appliances, which saw its rapid expansion in 1980s (Li et al., 2006;
Yang et al., 2008). Nowadays the yearly amount of e-wastes produced in China
is over 2.3 million tonnes including refrigerators, air conditioners, printers,
computers, washing machines and mobile phones and it is expected to grow
considerably (Wei and Liu, 2012; Qu et al., 2013).
Over past years, Chinese government has published industrially-oriented
regulations to reduce environmental damages caused by manufacturers, such
as eco-industrial parks (Zhu and Cote, 2004; Zhu et al., 2007), circular economy
Page 14
2
(Geng et al., 2009) and energy savings and pollution reduction (ESPR) policies
(Zhu et al., 2011). Thus, the Chinese government is putting under pressure
home appliances manufacturers to take back- EOL products for
remanufacturing and this needs RSCs to support. By remanufacturing EOL
products, the yearly amount of WEEE generated by home appliances could be
reduced, thus benefitting the environment (Plambeck, 2012; Zhang and Wang
2013).
1.2 Problem statement
Although, the Chinese government is encouraging companies to take back and
remanufacture EOL products in order to reduce e-wastes and pollution, most
organisations are lagging to do it, as it is considered a nuisance rather than a
profitable avenue. In this regard, Gome Electrical Appliances Ltd set-up its RSC
to take back products, which do not meet customers’ expectations due to poor
quality and EOL products for recycling or landfilling. However, the current RSC
adopted is experiencing significant asset value losses due to long products
Lead-Time (LT), resulting in low profits generated. Moreover, it is not designed
for products remanufacturing, as it is not considered an economically viable
EOL alternative.
1.3 Project motivation
At light of this, there is a need to improve the current RSC and redesign it for
remanufacturing in order to meet the government encouragements and reduce
environmental damages. On one side, remanufacturing leads to economic
benefits, but it also incurs in extra cost due to the RSC activities carried out to
bring back an EOL product to the remanufacturing facility. Therefore, a cost
estimation model is needed to assess whether the redesigned RSC is
economically viable or not.
Page 15
3
1.4 Aim and Objectives
The aim of the project is to improve the current Gome’s RSC, redesign it for
remanufacturing and develop a cost estimation model to evaluate the economic
viability of home appliances remanufacturing in the redesigned RSC. The
objectives of this project are:
To identify RSC activities, strategies and state of art for returned and
EOL home appliances in China
To model the current RSC adopted by Gome
To improve and redesign the RSC model for remanufacturing
To develop a cost model to estimate the RSC cost for EOL home
appliances remanufacturing
To apply the developed cost estimation model on a selected case study
of EOL refrigerators remanufacturing in order to assess the economic
viability of the redesigned RSC model
1.5 Thesis structure
This thesis is composed by eight chapters. Chapter 2 explains the relevant
literature review on the research topic. In Chapter 3, the research methodology
adopted to carry out this project is presented. In Chapter 4, the current RSC
adopted by Gome is modelled, improved and redesigned for remanufacturing.
In Chapter 5, the cost estimation model is developed and described. In Chapter
6, a case study is performed to assess the economic viability of the redesigned
RSC model. In Chapter 7, the discussion about the results of the project is
accomplished, and the future work on the research topic is explained. Finally,
conclusions are drawn in Chapter 8.
Page 17
5
2 LITERATURE REVIEW
2.1 Introduction
This chapter describes the previous work carried out in the main areas for this
project. Literature review has been performed in RSC, remanufacturing and
cost estimation. The goal is to have a wider understanding of the state of art in
the areas within this project.
2.2 Reverse supply chain
The definition of reverse supply chain (RSC) introduced by Guide & van
Wassenhove (2002) has been embraced in several studies, which describes
RSC as “the series of activities required to retrieve a used product from a
customer and either dispose of or reuse it. From a business point of view, the
implementation and monitoring of RSC necessitate many investments, though
it also carries economic and strategic advantages to enterprises (Brodin,
2002). Indeed, it leads to significant opportunities of cost reductions due to
lower prices of raw materials and spare parts and additional profits by
capturing the remaining value of EOL products (Álvarez-Gil et al., 2007).
A clear evidence of what mentioned is for example a company in the phone
remanufacturing industry, named Recellular, which has remanufactured over a
million phones for 10 years and developed a significant profitable market in
this area.
Moreover, reverse supply chain has a strategic importance, by helping the
enterprise to develop its ‘green image’ with sustainable acknowledgements.
(Álvarez-Gil et al., 2007) It helps the firm to create a positive link with
consumers in order to improve its competitive edge. For example, Nike
encourages its clients to give back their old shoes to be recycled and
converted into the basketballs. By doing so, Nike has slowly developed its
Page 18
6
green management in environmental sustainability and increased number of
costumers. From a customer perspective, the product returned are shipped
back to repair points for reparation and maintenances. As a result, consumers
are free from the risks of buying broken, non-functioning and unsatisfied
products. (Álvarez-Gil et al., 2007)
The “green image” combined with improved customer satisfaction increases
the customer loyalty to the brand, generates a more stable long-term demand
and finally maximizes its long-term success (Wei, 2011).
2.2.1 Reverse supply chain activities
If a company is taking in account to set up a RSC, one of the main challenges
is to define the proper structure that is designed to keep the cost low and at
least maintain the efficiency and effectiveness of the entire organisation. In
order to reach the strategic objectives, Guide & van Wassenhove (2002)
specified it is critical for the enterprise to evaluate its processes, to decide
whether some processes should be outsourced, and choose how to increase
the cost efficiency and value recovery of the system. Aside from having the
understanding about product groups and waste management processes in the
reverse logistics systems, the enterprise should identify the key activities of
the RSC processes so as to improve the control and manage its supply chain
among all the channel members. According to Blackburn et al. (2004), the
majority of RSCs consist of five major processes as shown in Figure 2-1,
namely product acquisition, reverse logistics, inspection and sorting,
remanufacturing and distribution and sale. Remanufacturing represents one of
the viable EOL alternatives. Indeed used products could also be recycled or
landfilled depending on the conditions assessed during inspection.
Page 19
7
Figure 2-1 RSC activities (Blackburn et al., 2004)
Product acquisition: It refers to products collection. Classic examples of
product acquisition is the commercial returns or recalls, because defective
or damaged products. Another example are products pulled upstream by
several incentive policies, such as deposits or reimbursements for product
returns. Lastly, the source of EOL product acquisition is the waste stream,
in which products can be recycled, remanufactured and landfilled
(Prahinski and Kocabasoglu, 2006). Proper management of all these
activities is necessary for the enterprises to guarantee that the cost of
restoring an EOL product to its original specifications will not be higher
than the cost of manufacturing a new product.
Reverse logistics: It delivers returned and EOL products to the selected
facilities for inspection, sorting and disposition (Blackburn et al., 2004).
The main activities involved are transportation, warehousing, distribution,
and inventory management, with the shared objective of cost reduction and
value maximization (Prahinski and Kocabasoglu, 2006).
Page 20
8
Inspection and disposition: It aims to determine the quality of returned
and EOL products in order to sort them in different groups, according to the
recovery strategy selected (Guide and Van Wassenhove, 2002; Prahinski
and Kocabasoglu, 2006). Guide and Van Wassenhove (2002) pointed out
that to maximise the recovery value of EOL products, the inspection activity
should be carried out as early as possible so that the logistics costs related
to transportation can be reduced, while restored units can be resold
quicker.
Remanufacturing. This process aims to repair or recondition valuable
products in order to capture their remaining value (Guide & van
Wassenhove, 2002; Blackburn et al., 2003). An important strategic
concern regarding the reconditioning process is high degree of uncertainty
due to both the timing and quality of returns, leading to low predictability
(Guide & van Wassenhove, 2002; Prahinski & Kocabasoglu 2006).
Therefore, inspection plays a fundamental role to reduce as much as
possible these uncertainties in the earliest stages of the RSC (Guide and
Van Wassenhove, 2002).
Redistribution & Sales. It aims to sell the remanufactured products to
other market segments composed by those customers that are not
interested in new products or that they cannot afford them (Fleischmann et
al., 2000; Prahinski and Kocabasoglu 2006).
2.2.2 Reverse supply chain strategies
The implementation and management of the RSC involves a huge amount of
investments. Every activity implies a considerable volume of costs, from waste
acquisition to its final disposition. Most of the companies view the commercial
product returns, for either repair or maintenances, not as a need of daily tasks
but as a nuisance instead. Therefore, the majority of RSCs have been
Page 21
9
designed with the main goal to keep the cost associated to product recovery
down as much as possible.
The first step of RSC design is to select the best take-back channel, namely
the most suitable collection process that send products back to the
manufacturers. There are three typical collection methods. Manufacturer
collects directly:
- From the users
- Via retailers
- By third-party companies. Outsourcing of the collection process seems
increasing in popularity among companies. This alternative enable companies
to reduce the investment and cost associated to reverse logistics.
Manufacturers such as Compaq, Dell, Cisco and 3M have outsourced the
handling of the reverse product flow. The handling of returned products was
not a core competency of the companies. Therefore, they estimated high
benefit in freeing their distribution centres by the returned flow and moving it
into the operations of outsourcers. These outsource suppliers can bring to
companies significant cost cutting related to the reverse flow, by achieving
economies of scale. In addition, they can provide companies further value-
added services such as refurbishment.
Marginal Time Value
The reverse flow is a considerable asset for several organisations. However,
most of that asset value is lost, because it drops with time as it moves through
the different steps of the RSC until its final disposition. This loss is mainly due
to time delays, which could be minimised, by adopting the proper strategy.
Referring to Figure 2-2, the upper line shows the declining value over time for
a new product (Blackburn et al., 2004).
Page 22
10
Figure 2-2 Time Value of Product Returns (Blackburn et al., 2004)
The lower line represents the decreasing value over time for the
remanufactured version of the same product. The time value of returned
products differs broadly depending on both the specific industry and product.
Indeed, some products are more sensitive to value losses due to time delays
in processing. In Figure 2-2, the marginal time value (MTV) is represented by
the slope s of the lines. Time-sensitive, consumer electronics goods such as
PCs could lose value at rates up to 1% per week, and the rate is even higher
as the product is closer to the end of its life cycle (Blackburn et al., 2004). In
this regard, depending on the MTV of products, companies have to set-up
different RSC strategies in order to reduce as much as possible the value
losses and maximise the asset recovery. The three main strategies that can
be adopted are the centralised, decentralised and leagile model, which are
discussed in further detail below.
Page 23
11
Centralised Model: efficient reverse supply chain
A scheme of a returns supply chain with centralized testing and evaluation of
returns is shown in Figure 2-3. This structure is tailored to achieve economies
of scale, both in processing and transport of products. Each returned product
is shipped to a central location for testing and evaluation to assess its
condition and issue credit. No effort is made to evaluate the state or quality of
the item at the retailer or reseller. The returned products are shipped in bulk in
order to minimize shipping costs. When the quality of the product has been
defined, it is channelled to the appropriate facility for disposition: restocking,
refurbishment or repair, parts salvaging, or scrap recycling. Repair and
refurbishment facilities also tend either to be outsourced or centralised, often
outsourced. The structure is tailored to reduce processing costs, but long
delays are often experienced and they can be excessive.
Figure 2-3 Centralised RSC model (Blackburn et al., 2004)
The centralized and efficient RSC structure achieves processing economies
by delaying credit issuance, testing, sorting and grading until it has been
collected at a central location. Managers of RSCs have broadly implemented
this approach, maybe because it embraces postponement, which is typical of
Page 24
12
the forward supply chain. Postponement (or delayed product differentiation) is
an effective strategy, which enables companies to deal with the cost of variety.
In forward supply chain, manufacturing and stocking a generic product and
delaying the addition of customized modules until the product is closer to the
customer, is cheaper. Indeed, it enables companies to avoid the cost
associated with separate inventories of all varieties of final product. This
structure is also convenient from a third party provider point of view, which
offers credit issuances. In addition, the retailer can ship all the items back to a
central site, avoiding sorting the returns and shipping to multiple.
High speed and time saving are very expensive and useless when the product
has a low MTV, as they add little value to products. In this case, the evaluation
and test activities have to be centralised in a single facility to reduce both
processing and transportation cost (Blackburn et al., 2004).
Decentralised Model: responsive reverse supply chain
On the other hand, significant time advantages can be achieved, if the product
differentiation is done earlier rather than late. This principle design to achieve
early differentiation is called Preponement. Early analysis of product quality
can maximizes asset recovery by minimizing the delay cost. When the
products are returned by the customer, it can be in four different conditions:
new, refurbishable, salvageable for components, or scrap. At arrival, these
products can seems identical and they need be tested and assessed to define
their real conditions. Using Preponement, a field test is done to divide products
into three groups: new, reparable, and scrap. The new, unused products can
be replaced in the market immediately, scrap units can be shipped for
recycling, and the rest of the units can be sent to a central facility for further
assessment and repair. To achieve a responsive RSC through the
Preponement techniques, the testing and evaluation of units must be
decentralized. The reverse supply chain to achieve responsiveness is shown
in Figure 2-4. Rather than having a single point of collection and evaluation,
Page 25
13
Firstly the unit is assessed at multiple sites, when possible at the point of
return from the customer.
Figure 2-4 Decentralized RSC model (Blackburn et al., 2004)
The benefits achievable by using Preponement are:
- Time delays reduction for disposition of new and scrap products; new,
unused products have the highest marginal time value and the most to lose
from delays in processing.
- The processing of the remaining units is faster, namely the products that
necessitate of further testing and repair. By diverting the extremes of product
condition (new and scrap) from the main returns flow, the remaining products
that need to be shipped to specialist for further analysis of their conditions is
reduced. Decreasing the size of recoverable product flow cuts the time delays
in queuing and further evaluation, therefore reducing the asset loss for these
products as well. For high marginal time value products, Preponement can
help companies to increase asset recovery. If a returned product is unused,
shipping it to a centralized test and evaluation site could keep the product off
Page 26
14
the shelves for months. Consequently, the unit could easily lose more than 5
% of its value.
Preponement can reduce part of the loss in that product segment, as well as
reduce the return flow to only those products that necessitate of expert
technicians to evaluate their conditions.
Two significant issues must be addressed to reach a responsive,
decentralized RSCs:
- Technical feasibility: The condition of the product returned must be
determined easily and inexpensively in the field
- Induce the reseller to carry on these activities at the point of return.
One solution could be the incentive alignment via shared savings
contracts, which may help the cooperation between manufacturers and
resellers. However, in this case companies needs to understand the
precise value of these activities. Vendor-managed inventory (VMI)
approach at large retailers represent another option. This would
enables the company using their own technicians to carry on the
disposition activities at the reseller.
This strategy is suitable for high MVT products as products are processed
faster and value losses could be reduced in order to improve the asset
recovery (Blackburn et al., 2004).
Page 27
15
Leagile Reverse Supply Chain
It aims to achieve the benefits generated by both the lean and agile approach
and the scheme of this strategy is shown in Figure 2-5.
Figure 2-5 Leagile Supply Chain (Wei, 2011)
The de-coupling point into the RSC network represents the application of
postponement strategy. The aim is to adopt a lean approach for predictable
standard products or components and agile strategy for unpredictable, special
products or components. Hence, the lean approach is applied from the
manufacturer side until the de-coupling point to eliminate the waste and the
agile strategy is adopted from the de-coupling point downstream to the
customer in order to achieve a quicker response to the volatile market demand
and increase the customer satisfaction. By implementing this solution, a
company can achieve the benefits coming from both the lean and agile
approach such as overall lead-time and cost reductions, and customer service
improvements (Christopher et al., 2006).
Several de-coupling point locations in the leagile RSC are shown in Figure 2-
5, which act as service spots for products repairs and maintenances, in order
to cope with the unpredictable customer demands. Most of the returned
products are tested, disassembled, inspected and repaired at the service
Page 28
16
points, by achieving a reduction in lead-time and waiting time for repairs.
Moreover, the closer the position of service point is to the end customers, the
higher flexibility and responsiveness the supply chain could reach. Afterwards,
from the decoupling point to the manufacturer, a lean strategy is implemented,
aiming to cut down the transportation costs using economy of scale, because
the demands for spare parts or products are consolidated in the service sites
and can be easily measured and precisely predicted. The drawback of this
system relies on the creation of inventories at the repair centre sites, leading
to extra costs. However this cost can be kept as down as possible, using
reliable methods of demand forecasting.
In conclusion a case study conducted by Banomyong et al. (2008), about the
comparison between lean or agile reverse system and leagile reverse logistics
process, highlight that overall the leagile strategy lead to considerable savings.
Indeed the transportation costs and space rental costs for repair spots have
been decreased, while more operation costs and inventory holding costs have
been caused, which on the total contribute to a large amount of savings from
the leagile reverse supply chain structure.
Nevertheless, the application of leagile strategy in a RSC design has some
prerequisites:
generic modular product designs
productions for various products
special product designs
Information technology system to keep track of all the information on
sales, demand and inventory level for every type of components or
products at each site for repairs and maintenances.
Page 29
17
2.3 Technologies supporting Reverse Supply Chain
management
Several companies have proposed on the market different solutions to cope
with the product returned in order to minimize the cost and maximize the
customer satisfaction:
- Online return capabilities and electronic processing of returns: When
customers and retailers want to return a product, they can access to the
manufacturer’s website, search by order number of stock keeping units
(SKU) to find their product and check the processes and policies for its
return. The website and its related software are used to record the reason
behind the return, so that the appropriate disposition strategy can be
selected in advance. Thereby, the cost of transportation and processing
time can be reduced. An example online return capabilities combined with
appropriate collection process is represented by Return Valet by catalogue
retailer, Spiegel, Inc. In collaboration with Newgistics and local postal
offices, Spiegel has implemented a procedure where the mail-ordered
products can be returned to local post facilities. The employee authorises
and confirms the return procedure online, prints a receipt with the credit
amount and ships the item back to Spiegel’s distribution centre, which
automatically issues a credit when the product arrives.
- RFID: This technology makes it possible to tag almost everything,
triggering a revolution in how physical objects are integrated in information
services. It is offering important cost reductions in retailers, automotive,
pharmaceutical and personal computer both forward and reverse supply
chain processes. The RFID technology can also be utilised to avoid fake
items return, which are increasing in some industries such as the
electronic. One big problem faced by retailers is determining whether a
returned products was sold by a store or have been stolen at some point
along the supply chain or purchased below the retail value at an outlet
store and then returned to a retailer for refund. The serial number on the
Page 30
18
electronic product code (EPC) of a tag is used to evidently recognise the
unique product. Software companies are now proposing RFID-based
applications to evaluate the product’s validity, so that the proof of
purchase is moved from the customer to the item itself. These
applications use a reader to ‘lock’ the tag at the checkout counter for each
product when it is sold. If the product then is returned, the tag can proof
the product’s validity. Networked RFID solutions enable the connection
between products tagged with an RFID to an information networks, giving
data about the product’ s life cycle to all the partners along the supply
chain. This technology is helping organisations to improve asset tracking,
inventory control and supply-chain operations.
- Built-in technologies: Nowadays, the technology built-in in some goods
can decrease the cost of field assessment to make Preponement
convenient even for items with low marginal costs of time. To achieve this
goal, the technology must offer an easy and cheap way to decide:
If the product is new and has never been used
If the product needs repair
If the product has exceeded its useful life
For instance, automobiles have always been equipped with odometers and
nowadays automobiles have on-board computers that can make available a
time profile of engine usage and warning of potential problems. Designed and
built in technology, also is present in simpler goods such as printers and
power tools. In Germany, Bosch has built into its power toll, a “data logger; a
cheap chip is connected to the electric motor of every tool to record the
number of hours of use and the speed at which the tool has been operated.
By connecting a returned tool to a test machine, Bosch (or a retailer) can
quickly determine if the product is better used for remanufacturing or recycling
Page 31
19
(operated above a certain number of hours) and if the product has been run at
high speed. Tools that have been used under extreme conditions can be
recognised and shipped to a recycling centre; the remainder can be sent back
directly to dedicated remanufacturing site. Some printers have similar
technology to monitor the usage of the product and record the number of
pages that have been printed. By equipping the reseller with a handheld
device, it is easier and quicker determining the conditions of the product.
Using this data, the printer can be more effectively shipped to the selected
processing facility, saving time, and improving asset recovery. Hence,
companies should focus carefully on the design of the products, developing
built-in software able to provide all the necessary information to evaluate
properly the condition of the product in the collection point.
- Web-enabled systems: They enable all the players belonging to supply chain
to collaborate and exchange data. Buyers and seller of components can meet
online using Internet trading hubs and warranty aggregators, reducing the
need of holding large inventories of components. Vendors of e-service
solutions, such as Viryanet and iMedeon, have created systems that integrate
wireless communications with Internet applications to build a portal. These
portals offer a virtual-service environment to companies in field service such
as depot repair and remanufacturing support services. Thus, companies can
communicate and interact on an online, real-time basis concerning the status
of a single, specific transaction regardless of who made the demand, who is
providing the solution, or where in time the transaction is occurring. Web-
based collaborative return authorisation (WCRA) seems to be a commercially
feasible system that has been introduced to cope with different reverse
logistics activities. WCRA improve the visibility of suppliers, manufacturers,
third-party logistics providers, repair depots and customers and controls the
flow of material from one point to another point along the reverse supply chain.
The host ERP has to receive a notification that a third party has received a
returned product and a new product has been sent out. The host ERP has
also track the disposition of the returned items and coordinate various actions.
Page 32
20
Customers can access to the portal, type the information in the system and the
ERP enter data manually and the ERP will identifies that inventory, provide the
authorisation and product-specific labels. At this point the product will be
moved from one point to another in the recovery environment. Being the host
ERP installed securely on the web, anyone can access to it and thus reducing
the investment related to databases.
2.4 Challenges
Increased rules by U.S., European and Chinese governments are obliging
manufacturers to invest in reverse logistics processes to enable an
appropriate disposition of their goods. Computer manufacturers such as Dell
and Hewlett-Packard have been criticised for not properly disposing of the e-
waste they have produced. Some organisation are committed to carry on
internal research in order to environmentally friendly procedures.
Nevertheless, no company will develop processes, which cannot be carried on
in the long term because they are not suitable for the company. Therefore, if
the regulations will oblige the companies to do so, they simply have to sustain
increased manufacturing cost, so the final purchase price for a product will
increase for the customer.
In the near future, the returned product flow is predicted to increase drastically,
therefore companies need to be aware of the importance of RSC to avoid
substantial losses due to inefficiencies in operations. The following challenges
have to be addresses by each company in order to set-up an efficient and
effective RSC:
- Meeting consumer needs: Customers require for the best price and
hassle-free returns policies.
- Volume management: Particularly in peak seasons, several returned
products are time-sensitive to process and restock for resale.
Page 33
21
- Management of costs: The cost of a returned product can achieve up to 7%
to 8% of the cost of goods. If the product has to be remanufactured, this
process is labour intensive, because most of the time is not automated.
- Data management: Having accurate and reliable information is fundamental
to understand why products are returned and develop processes to reduce
this flow
- Disposition of product: Understanding the optimal location to handle,
destroy, salvage and even where to donate goods is fundamental.
- Regulatory compliance: Companies necessitate of a global knowledge
about waste management laws, regulations, and the company’s corporate
social responsibility as well.
- Partnership throughout the product lifecycle: Creating partnerships along
the reverse supply chain is the key to improve the bottom line for each
partner. This is the best approach, which leads to well structure and strong
supplier agreement, cost and information sharing, therefore to a successful
strategy.
Shortened life cycles, increased global competition, new environmental
legislation, and ever more lenient commercial take-back policies at resellers
for customers will increase product returns. This will lead to a decrease of
profit margins in global markets with overcapacity and combined to increased
returned product it will make too expensive for organisation the handling of
goods. To overcome these problems companies need to design products with
an approach that includes the product returns and the operations to carry on
with it. This approach has to be a fundamental part of each company/s
business model. Companies need to set up the forward supply chain and the
reverse supply chain with a design that take benefits of all kinds of product
returns and to embrace a final environmentally friendly disposal. Nowadays,
Page 34
22
the pressure experienced by organisations to find out a convenient process to
manage the returned product flow should drive them to develop new strategies
to exploit the benefits achievable by the revers supply chain.
2.5 Remanufacturing
It is an industrial process to restore products to original conditions or to
upgrade products to new specifications. According to Sundin (2005), it allows
manufacturers to reuse materials and components and to upgrade the quality
and performances of their products, leading to significant economic benefits
(Kerr et al., 2001; Smith et al., 2004). A generic remanufacturing process is
described by several authors as composed by the steps shown in Figure 2-6
(Sundin, 2004; Van Nunen and Zuidwijk, 2004; Steinhilper, 2001).
Figure 2-6 Generic remanufacturing process (Steinhilper, 1998)
Disassembly: This activity aims to separate components and modules
from the product in order to remove faulty or damaged parts (Brennan et
al., 1997). According to Johansson (1997), in order to set-up an efficient
remanufacturing process, companies have to design products, which parts
are easy to identify, access, handle and separate, by integrating Design for
Disassembly (DFD) techniques in the product development cycle. DFD is
an approach to assess the ease of disassembly in the remanufacturing
process during new product design (Gupta et al., 2001).
Cleaning: Components and modules have to be cleaned up in the early
stages of the remanufacturing process in order to be processed in the next
Disassembly Cleaning Inspection Reconditioning Reassembly Testing
Page 35
23
activities. The time required to accomplish this step depends on the
quantity of dust, oil and grace that the products accumulates during its life
cycle and whether if it has been cleaned by the customer on a regular
basis or not. In the home appliances remanufacturing, dust and dirt are
removed from products by applying a pressurised cleaning solution
composed by water and detergent.
Inspection. Typically, this activity is performed through either visual
checks or measurements, employing small hand tools. Recently, built-in
technologies such as “data logger” have been embedded in some products
to collect and provide comprehensive information about the conditions,
under which a product has been run during its life cycle (Errington, 2009).
The information given by the data logger can be loaded into a software
such as Kirus, used by DecionOne (Schatteman, 2002). This software
includes the manufacturer’s own decision rules in order to determine easily
whether to repair, remanufacture, recycle or scrap EOL products according
to the conditions monitored. Several authors pointed out that these new
technologies would significantly decrease the time required to inspect and
test products, leading to improvements in the selection of the recovery
strategy (Parlikad et al., 2006, Ilign and Gupta, 2012).
Reconditioning. It refers to the activity to bring an EOL product into like
new conditions. Depending on the product and industry, this step can be
performed using both machining and manual operations to restore surface
dimensions or material properties and repair geometrical faults. According
to Sundin (2005), in the home appliances industry these activities are
accomplished manually by workers, as the only machines used are for
testing and cleaning.
Reassembly. Once modules and components are repaired, they have to
be reassembled into remanufactured products. This activity is usually
Page 36
24
performed by workers using the same equipment and power tools utilised
in the assembly of a new product.
Testing: The products performances and functionalities are tested in order
to guarantee that remanufactured products meet the quality and
specifications standards. If the remanufactured product’s requirements are
satisfied, it can be delivered to the retailing store to be resold.
It has to be highlighted that some steps depicted in Figure 2-6, could be
omitted or have a different order, depending on the specific product in order to
increase the efficiency and effectiveness of the whole process (Sundin, 2004).
Moreover, when a remanufactured product is placed again into the market, it
will compete with new products. Hence, the market gets ‘segmented ’into new-
product customers and remanufactured product customers. The nature of this
segmentation is defined by the amount of products of the two category
demanded by the customers and their prices. Thereby, defining the
appropriate pricing strategy is a critical decision to avoid the cannibalization of
the new product (which generally have a higher profit margin) from the
remanufactured one. The possible pricing strategies are as it follows:
- High pricing: Setting a high price to give the impression of exclusivity and
luxury
- Low pricing: Setting a low price to sell high volumes of a product
- Market segmentation: Creating differences between products so that they
appeal to different segments of the market and pricing them accordingly
- Price skimming: Setting a high initial price and dropping it over time as the
product becomes outdated
- Penetration pricing: Setting a low price initially to gain market share
Page 37
25
- Revenue management: Changing the price dynamically to adjust for
consumer demand.
The choice of the appropriate price discrimination strategy to create a new
market segment has to be aligned with the company business goal and
therefore with the reverse supply chain design implemented. The common
objective is to maximise the revenues stream coming from remanufactured
product in order to capture as much value as possible and finally to increase
the company’s profit. To implement a successful RSC not focuses on the cost
minimisation, but on the revenues maximisation, the pricing choice has to be
carefully taken. A wrong strategy may lead the cannibalization of new products
with higher profit margin and consequently a loss of profit.
Overall, products remanufacturing could lead to significant economic benefits
to companies (Kerr et al., 2001; Smith et al., 2004), if the RSC set-up to take
back EOL products is properly designed, according to the MVT of the specific
products.
2.6 Reverse supply chain in the Chinese home
appliances industry
Since 1980s, the Chinese economy has been featured by rapid industrial
growth, becoming the worlds’ top consumer of natural resources and producer
of e-wastes generated by household appliances (Abdulrahman, 2014). In
2005, under the pressure of the European Community Directive on WEEE, it
has been asked to companies to set-up their RSCs to retrieve faulty products
or pay extra money when these products are exported (Zhu and Sarkis, 2006).
Thus, Chinese home appliances companies have gradually adopted RSCs in
order to have unified environmental standards and avoid inconsistencies in
their international operations (Zhu et al., 2011; Zhu and Cote, 2004; Geng and
Cote 2003). According to Zhu and Sarkis (2006) , most of the Chinese
Page 38
26
manufacturers are currently aware of the importance of RSC, but only those
companies which export products have initiated their take-back programs (Wu
et al., 2001). As reported by Zhu (2004), in the home appliances industry, just
13.4% of the companies have implemented their own RSCs to take-back faulty
products, as companies have not realized yet the economic benefits
achievable by EOL products remanufacturing (Ying, 2009). Moreover, several
barriers are further slowing down the implementation of RSCs between
Chinese companies. From a financial perspective, most companies do not
have the initial funds to set-up and monitor the returns systems, while from an
infrastructure point of view, there is lack of in-house facilities such as storage,
vehicles and equipment to handle and transport EOL products (Abdulrahman,
2014). As pointed-out by Zhu and Sarkis (2004), Chinese home appliances
companies may lack of experience and of the required management skills to
implement their RSCs. One possible option to boost companies to take back
and remanufacture EOL products is to make them aware of the economic
benefit achievable.
2.7 Cost estimation techniques
According to Stewart et al. (1995) and Humphreys et al. (1996), cost
engineering has been defined as a scientific and engineering approach, which
aims to explore the techniques and principles to predict the cost of activities or
outputs. From a broader perspective, it includes aspects of profitability
analysis (Curran et al., 2004). Several techniques have been developed to
estimate the cost of a product (Lutters et al. 1997). An exhaustive overview of
the methodologies and techniques has been provided by Nazi et al. (2006), in
which they have been classified into qualitative and quantitative. Moreover,
each category has been further divided into more detailed techniques as
depicted in Figure 2-7 and explained in the following sections.
Page 39
27
Figure 2-7 Cost estimation techniques (Niazi et al., 2006)
2.7.1 Qualitative Techniques
They establish the common features between new products and existing
products in order to use past data to ease the evaluation of the cost of new
products. These techniques can be divided into intuitive and analogical.
a) Intuitive techniques: They estimate the cost of a new product, by
systematically relying on the stored expertise and knowledge of
experts. This knowledge is captured and formalised in a way that can
be reused in order to be available when required (Mills et al., 1987,
Jackson, 1986). These techniques can be further classified in Case-
based methodologies and Decision support systems (DSS).
b) Analogical techniques: They estimate the cost of a new product by
using historical data technically representatives of the cost of the new
product to be calculated. These past data are adjusted upward or
downward, according to the complexity of the new product compared to
the past one (NASA, 2002; Curran et al., 2004). Therefore, the
effectiveness of these techniques rely on the skills of experts to
Product Cost Estimation Techniques
Qualitative Techiniques
Intuitive Techiniques
Analogical Techiniques
Quantitative Techiniques
Parametric Techniques
Analytical Techiniques
Page 40
28
determine accurately the differences between the new and old products
(Asiedu, 1998). The cost estimation can be carried out either using
regression analysis or back propagation neural-network models.
2.7.2 Quantitative Techniques
They evaluate the characteristics, processes and design associated to a
specific product in order to estimate its cost. These techniques can be
classified into parametric and analytical.
a) Parametric Techniques: Statistical techniques based on historical data and
mathematical algorithms are employed to express cost as a function of its
parameters, also called cost drivers, which change as cost changes. In this
regard, a relationship is established between cost as the dependant variable
and the cost driving parameters as independent variables (Curran et al.,
2004). The implicit assumption besides these techniques is that the same
factors, which affected the cost of a product in the past, will affect the cost of
the new product in the future (NASA, 2002). According to Curran et al. (2004),
these techniques are the easiest to implement and can be applied even by
non-technical experts.
b) Analytical Techniques: These techniques are used to estimate the cost of
activities and components (Curran et al., 2004). Thus, the total cost of a
product is calculated by aggregating the cost of all resources consumed.
Analytical techniques can be used just if detailed information and data
regarding the product design and configuration are available. They can be
further divided into different subcategories, namely Operation–based
approach, Activity-based approach, Featured-based approach, Breakdown
approach and Tolerance-based cost models. In particular, Activity-based
approach or Activity-based Costing (ABC) allocates accurately costs among
product categories, depending on the amount of resources consumed. The
ABC technique aims to identify the relationships among resources, activities
Page 41
29
and products in order to understand the amount of activities and therefore the
resources consumed by a cost object (Jagolinzer, 1999; Needy et al., 2003).
As products consume resources at different rates and require different level of
support (Cima, 2001, Hughes et al., 2003), this approach enables companies
to get reliable information about the true cost of products and therefore their
profitability (Cardos et al., 2008; Johnson, 2008).
2.8 Research gap analysis
The previous work carried out in this research area shows that some effort
have been done to understand why Chinese companies are lagging behind to
implement their RSCs. Much attention has been dedicated to which drivers
could possibly motivate companies to set-up RSCs in order to remanufacture
EOL products. Most of the previous models developed focuses on recycling
systems, laws and regulations, as major mean to reduce the amount of WEEE
and pollution. In this regard, relevant researches have been carried out
regarding the environmental performances of EOL home appliances
remanufacturing compared to new products manufacturing. In addition, some
earlier studies have been accomplished to investigate the economic benefit of
remanufacturing by estimating the cost at component level. However, no RSC
and cost estimation models have been developed to evaluate the RSC cost for
EOL home appliances remanufacturing from a high-level perspective.
Page 43
31
3 RESEARCH METHODOLOGY
3.1 Introduction
The methodology embraced to accomplish this research is presented in this
chapter. The activities carried out to reach the objectives stated in section 1.4
and the respective outputs are exhibited in Table 3-1. Furthermore, an
exhaustive explanation of the research methodology adopted is provided.
OBJECTIVE ACTIVITY OUTPUT
Identify RSC activities, strategies and state of art for returned and EOL home appliances in China
o Carry out literature review
Understanding of the RSC activities, strategies and state of art for returned and EOL home appliances in China
Page 44
32
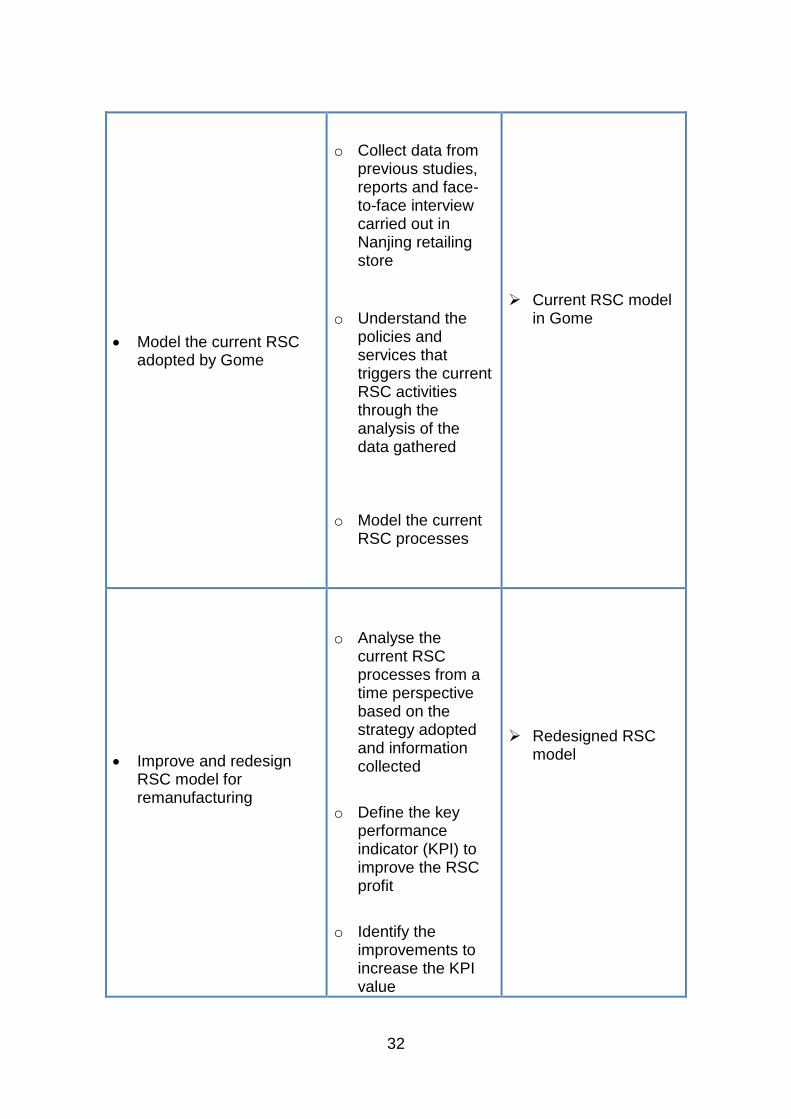
Model the current RSC adopted by Gome
o Collect data from previous studies, reports and face-to-face interview carried out in Nanjing retailing store
o Understand the policies and services that triggers the current RSC activities through the analysis of the data gathered
o Model the current RSC processes
Current RSC model in Gome
Improve and redesign RSC model for remanufacturing
o Analyse the current RSC processes from a time perspective based on the strategy adopted and information collected
o Define the key performance indicator (KPI) to improve the RSC profit
o Identify the improvements to increase the KPI value
Redesigned RSC model
Page 45
33
o Redesign RSC processes
Develop a cost model to estimate the RSC cost for EOL home appliances remanufacturing
o Develop the cost breakdown structure (CBS)
o Identify the cost drivers
o Establish the cost estimation relationships (CERs)
o Develop the cost model framework and architecture
o MS Excel programing
Cost breakdown structure (CBS)
Cost drivers
Cost estimation relationships (CERs)
Conceptual cost estimation model
Cost estimation model implemented
Apply the developed cost estimation model on a selected case study of EOL refrigerators remanufacturing in order to assess the economic viability of the redesigned RSC model
o Perform a case study related to EOL refrigerators remanufacturing
Economic viability assessed
Table 3-1 Research methodology adopted
Page 46
34
3.2 Research methodology adopted
First of all, the literature review was carried out in order to gather knowledge on
the main project areas, namely reverse supply chain, remanufacturing and cost
estimation techniques. Moreover, returned and EOL home appliances strategies
adopted by Chinese companies were investigated in order to understand the
state of art.
The RSC adopted by Gome Electrical Appliances Ltd. was selected as case
study to be improved and redesigned for remanufacturing. Data and information
about the current reverse processes implemented were collected, by reviewing
previous studies, annual and interim reports, press releases and
announcements made by the company. An additional information source was
used to increase the understanding of Gome reverse processes. A non-
structured interview was conducted in the retailing store of Nanjing to Gome’s
employees. The data collected from these different sources were compared and
combined to identify the policies adopted by Gome and the services offered to
customers.
The current reverse processes were analysed from a time perspective and the
recovery efficiency of the system was selected as KPI to drive the
improvements. Afterwards, the remanufacturing process was modelled and
integrated together with the improvements identified in the redesigned RSC.
The development of the cost estimation model was conducted by adopting the
procedure described in the “NASA Cost Estimating Handbook” (NASA, 2002).
Thus, the cost breakdown structure was built, the cost drivers identified and the
cost estimation relationships established. In this way, it was possible developing
the framework and architecture of the cost model. Moreover, the cost model
developed was implemented in MS Excel in order to provide a tool, which
enables the user to estimate the total RSC cost for home appliance
remanufacturing. The key elements which drove the selection of this software
platform were the user friendliness, compatibility with other software
applications, popularity, flexibility and software availability.
Page 47
35
The economic viability of the redesigned RSC model was assessed by carrying
out a case study. In this regard, the cost estimation model was applied to
assess the RSC cost for refrigerators remanufacturing. In addition, a market
research was carried out to estimate the potential market and retailing price for
a remanufactured refrigerator in China in order to understand the profit margin
achievable.
Page 49
37
4 DEVELOPMENT OF THE REDESIGNED REVERSE
SUPPLY CHAIN WITHIN GOME
The methodology shown in Figure 4-8 has been adopted to improve and
redesign Gome’s RSC for remanufacturing.
Figure 4-8 Methodology adopted for RSC redesign
4.1 Data collection
This step has been carried out in order to understand which products trigger the
reverse activities and which policies Gome put in place. The information
gathered relies on the following different sources:
- Gome’s annual and interim reports
- Gome’s press releases
- Gome’s announcements
Page 50
38
- Previous studies and interviews conducted in Gome
- Face-to-face interview to Gome’s employees in Nanjing’s retailing store
Due to confidentiality issues, the data acquired about the reverse processes
set-up by Gome are mainly qualitative.
4.2 Background analysis
The current RSC takes back products covered by the Safeguard and Recycling
policy in order to offer customers value-added services and increase the
completive edge.
The Safeguard policy allows customers to return products in retailing stores
within an allotted time for both refunding and exchanging, if products are
defective or fail to fulfil the customer’s expectation (Gome Electrical Appliances
Ltd., 2009).
The Recycling policy offers customers the collection of EOL home appliances.
Customers can log-into Gome’s website and take an appointment for the
collection of used products in order to receive a payment according to the
quality of the product returned (Gome Electrical Appliances Ltd., 2014).
Page 51
39
4.3 Current processes modelling
The current RSC adopted by Gome has been modelled based on the analysis
of data and information collected and it is shown in Figure 4-9.
Figure 4-9 Current RSC model (adapted from: Wei, 2011)
Referring to Figure 4-9, products for exchange and refunding are returned from
customers directly to the retailing store (PER). Products for recycling are
collected by Gome in the customer’s house and then delivered by truck in the
retailing store (PR). Afterwards, PER are tested to evaluate their quality and
sorted in three sub-categories, namely New or Unused Products (NUP), Non-
Valuable Products (NVP) and Valuable Products (VP).
New or Unused Products (NUP)
These products after simple renewing tasks carried out by specialists are
immediately sent to counters and resold.
Page 52
40
Non-Valuable Products (NVP)
These products are shipped together with PR to the Third Party for recycling or
scraps, as their remaining value is not sufficient to generate a profit margin.
Valuable Products (VP)
The remaining value of these products is enough to achieve a profit margin, so
they are shipped in bulk by truck to the associated sub-logistics centre through
the reverse logistic. In this centre, skilled engineers are employed to perform a
further evaluation of the product quality and determine its remaining value.
According to the extent of damages, products can be either delivered to the
Third Party for scrap or recycling or can be repaired, marked and wrapped in
plastic to be resold in the retailing store.
However, some of these products could have complex internal problems that
cannot be solved by specialists. In this case, they are delivered to the Original
Equipment Manufacturer (OEM). In the OEM facility, products are inspected
again to identify the root causes of low quality and performances, problems are
solved and products are delivered to the sub-logistics centre and eventually
resold in the retailing store.
4.4 Current processes analysis
In this section, the current reverse processes are analysed from a time
perspective according to the benefits and drawbacks associated to the different
RSC strategies and design discussed in section 2.2.2. The current problems
experienced have been identified based on the data gathered and confirmed
during the interview conducted in Nanjing retailing store.
Page 53
41
Leagile strategy
The current RSC model has been designed in order to achieve the benefits of
the leagile strategy, as it follows:
From customers to sub-logistics centre, the system aims to speed up the
collection and sorting to ensure responsiveness and high customer
satisfaction, by adopting the decentralized model.
From sub-logistics centre to the OEM, the system aims to reduce wastes.
In this case, the centralised model is adopted. Indeed once the product
has been collected, refunded or exchanged, the customer is already
satisfied, so next activities focus on cost reduction. The enabler of this
strategy is the decoupling point in the sub-logistics centre, which acts as
a repair spot to cope with the unpredictable customer demand and hold
the spare parts inventory. By centralising the repair activities, products
are consolidated to achieve operations efficiency. In addition, the
valuable products (VP) are shipped in bulk among facilities to achieve
full-load trucks in order to reduce transportation cost.
Problems experienced
The main problem experienced is long products Lead-Time (LT), defined as the
time that elapses from the moment a product is collected in the retailing store to
the moment a product is repaired and ready to be resold. The long products LT,
which is approximately 15 days, is caused by:
The size of the reverse flow from the retailing store to the sub-logistics
centre, due to the large amount of returned product for exchange or
refunding
The full-load trucks policy adopted by both retailer and manufacturer.
Indeed, products are held in storage areas for several days before being
Page 54
42
delivered to the selected facility in order to achieve cost reductions in
transportation.
The slow products processing causes significant asset value losses, especially
for high MVT products, resulting in reduced profitability of the whole system.
4.5 Objective definition
The goal is to reduce the asset values losses caused by the current RSC
design and integrate the remanufacturing process to capture the remaining
value of EOL products.
The current system performances are evaluated based on the recovery
efficiency (RE), which is estimated as it follows:
𝑹𝑬 = 𝑽𝒂𝒍𝒖𝒆 𝑹𝒆𝒄𝒐𝒗𝒆𝒓𝒆𝒅 ÷ 𝑹𝒆𝒔𝒐𝒖𝒓𝒄𝒆𝒔 𝒖𝒔𝒆𝒅 (4-1)
According to Geethan et al. (2011), the recovery efficiency is one of the major
key performance indicators (KPIs) to evaluate the profitability of the whole RSC.
Indeed, if the value recovered increases and the resources consumed
decrease, the profit generated by reselling a recovered product will be higher.
4.6 Improvements identification
Relevant opportunities to reduce asset value losses and the amount of
resources used to perform the reverse activities have been identified, by
benchmarking the RSC strategies and design solutions adopted by Gome’s
competitors both in China such as Suning Appliance (Wei, 2011) and
worldwide. The improvements proposed with the respective benefits and impact
on the RE of the current RSC are shown in Table 4-2.
Page 55
43
IMPROVEMENT BENEFITS IMPACT ON RE
Early and
complete
products
categorisation
Shortened LT for valuable products
Waste reduction
Increased value recovered
Decreased resources used
Delocalisation of
repair activities
in the retailing
store
Shortened LT for repairable products
Reduced operations cost for repairable products
Increased value recovered
Decreased resources used
Implementation
of EOL products
remanufacturing
Capture the remaining value of EOL products
Increased value recovered
Table 4-2 Improvements identified to increase the RE
Early and complete products categorisation: The quality of both returned
products and EOL products is completely assessed in the retailing store
through an accurate field test. This test aims to select early the best
recovery strategy for each product according to the remaining value. In this
way, the size of the returned flow is decreased, as just valuable products are
delivered to the sub-logistics centre, so they can be processed faster.
Furthermore, the resources consumed to handle, inspect and transport non-
valuable products are a waste, as these products do not contribute to
generate profits. By identifying these products during the initial test, they are
handled and inspected just in the retailing store and directly transported to
the Third Party, leading to increased operations efficiency. Overall, the
products value losses due to time delays could decrease and the value
Page 56
44
recovered increase. Moreover, operations could be carried out saving a
significant amount of resources, resulting in higher RE.
Delocalisation of repair activities: The repair activities are moved from the
sub-logistics centre to the after-sale service centre set up in the retailing
store. In this way, the LT of repairable products is shortened and operations
efficiency increased, as transportation between the retailing store and the
sub-logistics centre and inspection/sorting in the sub-logistics centre are not
necessary anymore. Indeed, the best repair strategy is selected in the after-
sale centre, where products are handled and repaired. Overall, the value
recovered for repairable products could increase and the resources
consumed to accomplish repair activities decrease, leading to higher RE.
Implementation of EOL products remanufacturing: In the current RSC,
EOL products are collected just for recycling or disposal. This leads to
decreased RE, as no value is recovered from those products, while
resources are consumed for their collection, handling and transportation.
Therefore, in the redesigned RSC model, the remanufacturing process is
integrated as a viable EOL option in order to increase the amount of value
recovered and achieve higher RE.
Page 57
45
4.7 Processes redesign
The current RSC model has been redesigned in order to increase the RE of the
system and consequently the profit, by implementing the improvements
previously identified. The redesigned RSC model is shown in Figure 4-10.
Figure 4-10 Redesigned RSC model
The reverse flow is triggered by both End-Of-Life products (EOLP) collected by
truck in the customers’ houses and Products for Exchange and Refunding
(PER), returned directly from customers to the retailing store. Instead of
delivering EOLP directly to the Third Party for recycling or disposal, EOLP are
collected into the retailing store, disassembled and tested together with PER.
The test performed by specialists aims to determine the remaining value of both
EOLP and PER in order to select the best recovery strategy. Hence, valuable
products (VP) are sorted further in two sub-categories, namely VP1 for quick
repair and VP2 for remanufacturing.
Page 58
46
VP1 for quick repair
This sub-category is composed by those products, which have simple problems
that can be easily solved, by adjusting mechanical parts. These goods are
immediately repaired in the after-sale service centre, where worktables
adjustable in height are installed to ease the accomplishment of the task, then
marked, packed and eventually resold.
VP2 for remanufacturing
This sub-category is composed by those valuable products, which cannot be
repaired in the retailing store and have to be remanufactured in the sub-logistics
centre to be restored to their original specifications. In the sub-logistics centre,
the home appliances remanufacturing line operates to bring EOL products into
like new conditions. The line is labour intensive as activities are carried out
manually and the only machines used are for testing and cleaning. According to
Sundin (2005), the steps, which compose a generic home appliances
remanufacturing line are shown in Figure 4-11.
Figure 4-11 Remanufacturing steps (Sundin, 2005)
Repair or Exchange: Once the VP2 has reached the sub-logistics
centre, according to the recovery strategy selected, faulty and damaged
parts are either repaired or replaced with new and recovered spare parts.
Cleaning: According to Sundin (2005), this activity could be time-
consuming depending on the structure of the specific product. Therefore,
it should be carried out by using a steam pressure-cleaning machine in
order to remove dust, oil and grace efficiently.
Repair or Exchange Cleaning Final check
Page 59
47
Final check: According to Adler (2006), each home appliances has to
pass electrical safety tests in order to guarantee that the product respect
the international safety standards. Each test is executed automatically
by an inspector machine, which investigate the electrical behaviour of the
product’s components according to the requirements previously defined.
In this activity, workers are employed just for plugging and unplugging
the product in the machine.
Finally, the home appliances are marked as remanufactured products and
eventually wrapped in plastic. If a product has low MVT, it is shipped in bulk to
the retailing store to achieve full-load truck and cut down transportation cost. If a
product has high MVT, a trade-off between transportation cost and product
value losses due to time delays is taken into account to maximise the profit
reachable.
Page 60
48
5 COST ESTIMATION MODEL DEVELOPMENT
5.1 Cost estimation process adopted
The aim of the cost estimation model is to assess the high-level RSC cost for
EOL home appliances remanufacturing. The model has been developed by
following the methodology adopted by NASA (2002) show in Figure 5-12, which
is described in further detail in the next sections.
Figure 5 12 Cost estimation process (adapted from: NASA, 2002)
The aim of the cost estimation model is to assess the high-level RSC cost for
EOL home appliances remanufacturing. The model has been developed by
following the methodology adopted by NASA (2002), which is described in
further detail in the next sections.
Page 61
49
5.2 Cost estimation technique selection
In order to select the most suitable cost estimation technique to evaluate the
total RSC cost for home appliances remanufacturing, the four elements shown
in Figure 5-13 have to be understood.
Figure 5-13 Cost estimation requirements (NASA, 2002)
Expectations: The cost model developed is expected to provide the total RSC
cost for remanufacturing a home appliance in the redesigned RSC model. The
outcome of the model could be used to assess the economic viability of the
redesigned RSC.
Data: The data gathered to develop the cost model consists of:
1. Remanufacturing process data. They include the Operation Time (OT)
needed to carry out each activity, labour cost, machine cost, electricity cost
Page 62
50
and new spare parts cost. This data have been gathered from a previous
work carried out by Sundin (2004) in the Electrolux remanufacturing facility
in Sweden, a non-structured interview conducted to the Shop Floor Manager
in Siemens factory in Nanjing and from Internet websites.
2. Transportation cost data. They include the distance between facilities, the
labour cost and the fuel cost. This data have been gathered both from
literature review and internet websites.
3. Storage cost data. Due to lack of significant information, the estimation of
this cost element rely on the total cost breakdown for home appliances
remanufacturing developed by Sundin (2004).
4. Retailing price. It has been estimated through surveys (see Appendix B) to
potential Chinese customers in Nanjing.
Resources. One cost estimator (MSc student) has been in charge of
developing the cost model. Two PhD. Students of Nanjing University of
Aeronautics and Astronautics (NUAA) have been employed as translators for
the surveys.
Schedule. The development of the cost estimation model has to be
accomplished in approximately four weeks.
By taking in consideration the cost estimation requirements previously defined,
the qualitative and parametric techniques have been discarded to develop the
cost model, due to lack of significant past data regarding home appliances
remanufacturing. Consequently, analytical techniques are the most suitable to
be adopted in order to estimate the total RSC cost for home appliances
remanufacturing. In particular, the Activity-Based Costing (ABC) technique has
Page 63
51
been selected to carry on the cost estimation. ABC technique estimates the
total cost, by identifying the activities needed to collect, handle and
remanufacture the product along the RSC and the respective resources
consumed. Afterwards, the amount of different resources consumed by the
reverse activities is estimated based on the time required to accomplish each of
the activities. Finally, the unit cost of each resource consumed is calculated in
order to estimate the total cost for each activity.
Page 64
52
5.3 Cost breakdown structure (CBS) development
The redesigned RSC model described in chapter 4 has been used to identify
the activities performed from the collection of an EOL product to the sale of the
same remanufactured product in the retailing store. Afterwards, the main cost
elements of these activities have been defined. The information needed to
identify the cost elements associated to each activity previously identified has
been gathered from the literature review. In this way, it has been possible
developing the CBS shown in Figure 5-14.
Figure 5-14 CBS for EOL home appliances remanufacturing
5.3.1 Activity cost elements identification
The activity cost elements have been identified based on the literature review
and are considered as follow:
Labour cost: It represents the direct cost of workers employed to accomplish
the activity taken into consideration.
Page 65
53
Machine cost: It represents the cost of equipment used to accomplish the
activity taken into consideration. This category cost includes electricity,
depreciation and tools.
Spare Parts cost: It represents the cost of new or restored components and
modules used to replace faulty parts that cannot be repaired due to poor
quality.
Transportation cost: It contains the cost of the fuel needed to transport a
product from a facility to another
5.4 Cost drivers identification
The cost drivers are parameters or variables, which directly affect the cost of an
activity. As it can be found in literature, the cost estimation process can be
carried out by using the “time-driver ABC technique”. This approach allows cost
drivers to be estimated on the base of the practical capacity of resources
supplied. Two different types of cost drivers, namely transactional drivers and
duration drivers can be used to estimate cost:
Transactional drivers: They count the number of times an activity is
performed and typical examples are number of setups, number of production
runs, number of shipments etc.
Duration drivers: They calculate the time required to carry out an activity and
typical examples are number of direct labour hours, number of machine
hours, number of material handling hours etc.
Because of the availability of information regarding operation times needed to
perform home appliances reverse activities, the cost estimation has been
Page 66
54
carried out by selecting duration drivers as parameters and variables, which
affect the cost. The cost drivers identified for each activity involved in the
redesigned RSC model are shown in Table 5-3.
Table 5-3 Cost drivers for the redesigned RSC model
The number of spare parts used to replace faulty components and modules
varies depending on the quality of each part within an EOL product.
Determining the type and quantity of components in advance is complex
(Thierry et al., 1995; Seitz and Peattie, 2004). For the purpose of the cost
estimation, this cost element is considered as fixed, namely it does not vary
according to a cost driver.
Page 67
55
5.5 Cost estimation relationships (CERs) development
The CERs express the relationships between the cost elements of each activity
within the redesigned RSC model and the cost drivers identified. Based on the
cost drivers shown in Table 5-3, each cost element is defined as a function of
the time consumption. In this way, the cost estimation is performed for the three
cost elements within the CBS and it is described in detail below.
Labour cost: This cost element affects the cost of remanufacturing,
transportation and storage. The relationship between this cost element and the
activities involved in these processes is described as it follows:
For the remanufacturing processes, the labour cost is estimated multiplying the
labour rate by the total remanufacturing time and it is estimated as it follows:
𝑪𝒍𝒂𝒃𝒐𝒖𝒓,𝒓 = 𝑹𝒍𝒂𝒃𝒐𝒖𝒓 × (𝒕𝒓𝒆𝒎𝒂𝒏𝒖𝒇𝒂𝒄𝒕𝒖𝒓𝒊𝒏𝒈) (5-2)
Where,
𝐶𝑙𝑎𝑏𝑜𝑢𝑟,𝑟: Remanufacturing labour cost (£)
𝑅𝑙𝑎𝑏𝑜𝑢𝑟: Labour rate (£/hour)
𝑡𝑟𝑒𝑚𝑎𝑛𝑢𝑓𝑎𝑐𝑡𝑢𝑟𝑖𝑛𝑔: Total remanufacturing time, which includes operations time,
loading time and operator allowance time.
Labour rate (𝑅𝑙𝑎𝑏𝑜𝑢𝑟)
It is estimated by dividing the monthly salary by the number of working days per
month and the number of working hours per day. It is estimated as follows:
𝑹𝒍𝒂𝒃𝒐𝒖𝒓 = 𝑾𝒎 ÷ 𝑫𝒎 ÷ 𝑯𝒅 (5-3)
Where,
𝑅𝑙𝑎𝑏𝑜𝑢𝑟 : Labour rate (£/hour)
Page 68
56
𝑊𝑚 : Monthly wage (£)
𝐷𝑚 : Number of working days per month
𝐻𝑑 : Number of working hours per day
Loading time (𝑡𝑙)
The loading time is the time needed to load, unload and transport a component
from a workstation to another. It is calculated as a percentage of the operation
time as it follows:
𝒕𝒍 = 𝟎. 𝟏 × 𝒕𝒐𝒑 (5-4)
Where,
𝑡𝑙 : Loading time (hour)
𝑡𝑜𝑝 : Operation time (hour)
Operator allowance time (𝑡𝑜𝑎)
It includes the allowance for both personal needs such as water, restroom,
phone call etc. and fatigue due to work related stress and conditions. It can be
calculates as a percentage of the operation time as it follows:
𝒕𝒐𝒂 = 𝟎. 𝟎𝟓 × 𝒕𝒐𝒑 (5-5)
Where,
𝑡𝑜𝑎 : Operator allowances time
𝑡𝑜𝑝 : Operation time (hour)
Page 69
57
For the transportation, the labour cost is calculated by multiplying the labour
rate by the summation of the transportation time from the customer’s house to
the retailing store, from the retailing store to the sub-logistics centre and from
the sub-logistics centre to the retailing store. It is estimated as it follows:
𝑪𝒍𝒂𝒃𝒐𝒖𝒓,𝒕 = 𝑹𝒍𝒂𝒃𝒐𝒖𝒓 × (𝒕𝒕𝒓𝒂𝒏𝒔𝒑𝒐𝒓𝒕𝒂𝒕𝒊𝒐𝒏,𝒄−𝒓 + 𝒕𝒕𝒓𝒂𝒏𝒔𝒑𝒐𝒓𝒕𝒂𝒕𝒊𝒐𝒏,𝒓−𝒔+ 𝒕𝒕𝒓𝒂𝒏𝒔𝒑𝒐𝒓𝒕𝒂𝒕𝒊𝒐𝒏,𝒔−𝒓)
(5-6)
Where,
𝐶𝑙𝑎𝑏𝑜𝑢𝑟,𝑡: Transportation labour cost (£)
𝑡𝑡𝑟𝑎𝑛𝑠𝑝𝑜𝑟𝑡𝑎𝑡𝑖𝑜𝑛,𝑐−𝑟: Transportation time from customer’s house to retailing store
(hour)
𝑡𝑡𝑟𝑎𝑛𝑠𝑝𝑜𝑟𝑡𝑎𝑡𝑖𝑜𝑛,𝑟−𝑠: Transportation time from retailing store to sub-logistics centre
(hour)
𝑡𝑡𝑟𝑎𝑛𝑠𝑝𝑜𝑟𝑡𝑎𝑡𝑖𝑜𝑛,𝑠−𝑟: Transportation time from sub-logistics centre to retailing store
(hour)
The transportation time includes both the operation time and loading time. The
loading time is the time needed to load a product into a truck and to unload it
from the truck. The loading time for the transportation process is estimated as
shown in equation 5-4 for the remanufacturing process.
For the storage process, the labour cost is calculated by multiplying the labour
rate by the product handling time and it is estimated as it follows:
𝑪𝒍𝒂𝒃𝒐𝒖𝒓,𝒔 = 𝑹𝒍𝒂𝒃𝒐𝒖𝒓 × 𝒕𝒉𝒂𝒏𝒅𝒍𝒊𝒏𝒈 (5-7)
Where,
𝐶𝑙𝑎𝑏𝑜𝑢𝑟,𝑠: Storage labour cost (£)
𝑅𝑙𝑎𝑏𝑜𝑢𝑟: Labour rate (£/hour)
𝑡ℎ𝑎𝑛𝑑𝑙𝑖𝑛𝑔: Product handling time (hour)
Product handling time ( 𝑡ℎ𝑎𝑛𝑑𝑙𝑖𝑛𝑔)
Page 70
58
The product handling time, which includes the time required to move, store,
protect and control a product in the RSC cannot be precisely estimated due to
unavailability of significant information. As described in literature, product
handling can be carried out manually or automatically depending on the system
adopted. For the cost estimation, it is assumed as accomplished manually and it
is estimated as a percentage of the transportation time as it follows:
𝒕𝒉𝒂𝒏𝒅𝒍𝒊𝒏𝒈 = 𝟎. 𝟑 × 𝒕𝒕 (5-8)
Where,
𝑡ℎ𝑎𝑛𝑑𝑙𝑖𝑛𝑔 : Product handling time (hour)
𝑡𝑡 : Total time to transport a product along the reverse supply chain
Machine cost: It is calculated by summing up the machine cost related to
testing/sorting, cleaning and final check. The estimation is as it follows:
𝑪𝒎𝒂𝒄𝒉𝒊𝒏𝒆 = 𝑪𝒎𝒂𝒄𝒉𝒊𝒏𝒆,𝒕 + 𝑪𝒎𝒂𝒄𝒉𝒊𝒏𝒆,𝒄 + 𝑪𝒎𝒂𝒄𝒉𝒊𝒏𝒆,𝒇𝒄 (5-9)
Where,
𝐶𝑚𝑎𝑐ℎ𝑖𝑛𝑒: Total machine cost (£) 𝐶𝑚𝑎𝑐ℎ𝑖𝑛𝑒,𝑐: Machine cost
for cleaning
𝐶𝑚𝑎𝑐ℎ𝑖𝑛𝑒,𝑖: Machine cost for testing/sorting 𝐶𝑚𝑎𝑐ℎ𝑖𝑛𝑒,ℎ: Machine cost for
final check
The machine cost related to each activity is calculated as a summation between
the depreciation rate of the machine used multiplied by the activity time and
both the electricity and tools rates multiplied by the operation time. The
estimation is as it follows:
𝑪𝒎𝒂𝒄𝒉𝒊𝒏𝒆,𝒂𝒄𝒕𝒊𝒗𝒊𝒕𝒚 = 𝑹𝒅𝒆𝒑 × 𝒕𝒂𝒄𝒕𝒊𝒗𝒊𝒕𝒚 + (𝑹𝒆𝒍𝒆𝒄𝒕𝒓𝒊𝒄𝒊𝒕𝒚 + 𝑹𝒕𝒐𝒐𝒍𝒔) × 𝒕𝒐𝒑 (5-10)
Where,
Page 71
59
𝐶𝑚𝑎𝑐ℎ𝑖𝑛𝑒,𝑎𝑐𝑡𝑖𝑣𝑖𝑡𝑦: Machine cost to accomplish the activity (£)
𝑅𝑑𝑒𝑝: Depreciation rate of the machine used (£/hour)
𝑡𝑎𝑐𝑡𝑖𝑣𝑖𝑡𝑦: Activity time (hour)
𝑅𝑒𝑙𝑒𝑐𝑡𝑟𝑖𝑐𝑖𝑡𝑦: Electricity rate (£/hour)
𝑅𝑡𝑜𝑜𝑙𝑠: Tools rate (£/hour)
𝑡𝑜𝑝: Operation time (hour)
Depreciation rate ( 𝑅𝑑𝑒𝑝)
It represents the loss of value of an asset over time and it is estimated by
dividing the initial value of the asset by its life cycle time as it follows:
𝑹𝒅𝒆𝒑 = 𝒗 ÷ 𝒕𝒍𝒄 (5-11)
Where,
𝑅𝑑𝑒𝑝: Depreciation rate of the asset used (£/hour)
𝑣 ∶ Initial value of the machine (£)
𝑡𝑙𝑐 : Life cycle time (hour)
Electricity rate (𝑅𝑒𝑙𝑒𝑐𝑡𝑟𝑖𝑐𝑖𝑡𝑦)
The electricity rate is calculated as it follows:
𝑹𝒆𝒍𝒆𝒄𝒕𝒓𝒊𝒄𝒊𝒕𝒚 = 𝑾 × 𝑬𝒑 (5-12)
Where,
𝑅𝑒𝑙𝑒𝑐𝑡𝑟𝑖𝑐𝑖𝑡𝑦 ∶ Electricity rate (£/hour)
𝑊 ∶ Wattage (W)
Page 72
60
𝐸𝑝 ∶ Electricity price (£/Kwh)
The wattage it is calculated as it follows:
𝑾 = 𝑰 × 𝑽 (5-13)
Where,
𝑊 ∶ Wattage (W)
𝐼 ∶ Current (A)
𝑉 ∶ Voltage (V)
Transportation Cost: it is calculated by summing up the cost of transporting an
end-life home appliance from a location to another along the RSC and it is
estimated as it follows.
𝑪𝒕𝒓𝒂𝒏𝒔𝒑𝒐𝒓𝒕𝒂𝒕𝒊𝒐𝒏 = 𝑪𝒄−𝒓 + 𝑪𝒓−𝒔 + 𝑪𝒔−𝒓 (5-14)
Where,
𝐶𝑡𝑟𝑎𝑛𝑠𝑝𝑜𝑟𝑡𝑎𝑡𝑖𝑜𝑛: Total transportation cost (£)
𝐶𝑐−𝑟: Transportation cost from customer’s house to retailing store
𝐶𝑟−𝑠: Transportation cost from retailing store to sub-logistics centre
𝐶𝑠−𝑟: Transportation cost from sub-logistics centre to retailing store
The cost of transporting an EOL home appliance from a location to another is
given by the sum of depreciation of the transportation mean used and fuel rate
multiplied by the operation time. It is estimated as it follows:
𝑪𝒇𝒓𝒐𝒎−𝒕𝒐 = (𝑹𝒅𝒆𝒑𝒓𝒆𝒄𝒊𝒂𝒕𝒊𝒐𝒏 + 𝑹𝒇𝒖𝒆𝒍) × 𝒕𝒐𝒑 (5-15)
Page 73
61
Where,
𝐶𝑓𝑟𝑜𝑚−𝑡𝑜: Transportation cost from a location to another within the RSC (£)
𝑅𝑑𝑒𝑝𝑟𝑒𝑐𝑖𝑎𝑡𝑖𝑜𝑛: Depreciation rate (£/hour)
𝑅𝑓𝑢𝑒𝑙: Fuel rate (£/hour)
𝑡𝑜𝑝: Operation time (hour)
Fuel rate (𝑅𝑓𝑢𝑒𝑙)
It varies significantly according to the transportation mean selected and it is
calculated by multiplying the cost of fuel per km by the distance driven per hour.
It is estimated as it follows.
𝑹𝒇𝒖𝒆𝒍 = ( 𝑪𝒇 ÷ 𝑭) × 𝑺 (5-16)
Where,
𝑅𝑓𝑢𝑒𝑙: Fuel rate (£/hour)
𝐶𝑓 : Cost of fuel (£/l)
𝐹 : Fuel consumption rate (l/km)
𝑆 ∶ Speed (km/hour)
Page 74
62
5.6 Cost model implementation
The conceptual cost estimation model developed has been integrated in MS
Excel in order to provide a tool, which enables the user to estimate the high-
level cost of the redesigned RSC for EOL product remanufacturing. Figure 5-14
shows the menu spreadsheet of the tool, in which the user has to type the value
of cost drivers and parameters related to the specific home appliance taken into
account in order to get the total cost as output, which is automatically estimated.
Figure 5-15 MS Excel based cost model
Page 75
63
6 CASE STUDY
The cost estimation model developed in chapter 5 has been applied in order to
assess whether the redesigned RSC model for remanufacturing is economically
viable or not. In this way, it is also demonstrated that the cost estimation model
can be used to calculate the high-level RSC cost for EOL products
remanufacturing.
The Haier HT21TS45SW Top Mount Refrigerator (Haier, 2014) shown in Figure
6-15 has been selected to carry on the case study. Details on how the cost
estimation is carried out can be found in Appendix A.
Figure 6-16 Top Mount Refrigerator (Haier, 2014)
Moreover, a market research (see Appendix B) has been conducted among
potential customers in Nanjing in order to understand both the potential market
for remanufactured refrigerators and the attractive retailing price. In this way, it
has been predicted the profit margin reachable by remanufacturing an EOL
refrigerator in the redesigned RSC model in order to assess the economic
viability.
Page 76
64
High-level Reverse supply chain cost results
The output of the cost estimation tool indicates that the total cost to transport,
store and remanufacture an EOL refrigerator is approximately £79.82 (see
Appendix A), as shown in the breakdown of the RSC cost in Table 6-4.
Table 6-4 RSC cost breakdown
As shown in Figure 6-17, the remanufacturing process contributes for the
largest share of the RSC cost. In particular, testing and sorting represent the
activities that consume most resources in terms of labour and machine hours,
accounting for the 95% of the total remanufacturing cost.
Page 77
65
Figure 6-17 RSC cost distribution
As no activities are completely automated, the labour cost constitutes the major
cost element, accounting for the 76% of the total RSC cost.
Profit margin
This is the output of the cost estimation and aims to determine whether the
remaining value of a remanufactured refrigerator is enough to cover the whole
RSC cost and generate a profit margin or not.
The retailing price for a new unit of the refrigerator model taken in consideration
has been estimated as £370, which is the average of the retailing prices
collected in Walmart, Gome and Suning’s retailing store in Nanjing.
Page 78
66
The results given by the market research carried out are shown in Figure and
indicate that a customer would buy the remanufactured product if it can save
60% of the money, the attractive retailing price for the remanufactured
refrigerator is £148.
Figure 6-18 Market research results
Therefore, the potential profit margin reachable per unit is calculated as shown
in Table B-2.
Unit selling price (£) 148
Cost per unit (£) 79.82
Profit margin per unit (£) 68.18
Profit margin ratio (%) 46%
Table 6-5 Profit margin reachable in the Chinese market
0
1
2
3
4
5
6
7
8
9
10
40% 50% 60% 70% 75%
Fre
qu
en
cy
Discount expected
Market research results
Page 81
69
7 DISCUSSION
The results of the cost estimation model applied to the refrigerator case study
indicate that the RSC model redesigned for remanufacturing is economically
viable. In particular, remanufacturing EOL home appliances could generate
significant economic benefits in the Chinese industry. If EOL products are
remanufactured rather than recycled or landfilled, their remaining value is
enough to cover the whole RSC cost and generate further profits.
On the other side, as the cost of labour represents the major cost element, the
economic performances of the redesigned RSC could vary considerably
according to the labour laws and working conditions related to each specific
country. Indeed, if the remanufacturing process is carried out in different
countries, where the cost of labour is more expensive than in China, the profit
generated by selling remanufactured home appliances will be deeply affected.
Moreover, testing and inspection represent the bottleneck of the redesigned
RSC model and are the most expensive activities. On one side, the early and
complete categorisation of returned and EOL products speeded-up the
processing of valuable products and reduced the waste related to products for
recycling and disposal. On the other side, the cost of these activities is
increased, as more resources have been allocated to test accurately the quality
of each component in order to select the best cost-effective recovery strategy in
the retailing store. In this regard, it is necessary evaluating the benefits
achievable by integrating built-in technologies and software, which support the
strategy selection process in order to reduce the operations time, eliminate the
bottleneck and eventually increase further the whole RSC recovery efficiency.
Moreover, some limitations associated with this project can be identified:
- There were no possibilities to directly interact with home appliances
companies, apart from an interview carried out in Gome’s retailing store
in Nanjing. Consequently, there have been difficulties to collect
Page 82
70
quantitative data to improve the RSC model and to feed the cost model.
In this regard, the data and knowledge used are largely from literature.
- The RSC and in particular the remanufacturing process has been studied
and modelled at high-level, considering the whole system. Moreover, the
accurate cost of spare parts used to replace faulty or damaged
components has not been calculated due to unavailability of reliable
data.
In order to overcome the mentioned limitations, the future work is suggested to
focus on the following activities:
- Collect quantitative data in order to feed the model with a set of more
realistic information.
- Develop further the cost estimation model to integrate the cost estimation
at component level. In this way, a more accurate and realistic evaluation
of the economic benefit generated by EOL home appliances
remanufacturing could be achieved.
Page 83
71
8 CONCLUSIONS
This research has been motivated by the need to develop an economically
viable RSC model in the Chinese home appliances industry to motivate
companies to take back EOL products for remanufacturing in order to reduce
the amount of WEEE yearly generated. In this regard, the current RSC adopted
by Gome has been improved and redesigned for remanufacturing. Furthermore,
the economic viability of the redesigned RSC model has been assessed
through a cost estimation tool implemented in MS Excel.
The long products LT experienced in the current RSC has been shortened and
consequently the asset value losses have been reduced. Moreover, the
remanufacturing process has been integrated in the redesigned RSC to provide
an EOL alternative, which enables the company to recover the remaining value
of used products.
The cost estimation model based on the ABC technique has been developed,
which can calculate the cost of the each activity involved in the redesigned RSC
model including labour, machine and transportation cost.
The MS Excel based costing tool has been developed based on the cost
estimation model framework and architecture, which can estimate the high-level
RSC cost for home appliances remanufacturing.
The costing tool has been applied to a selected case study related to
refrigerators remanufacturing in order to assess whether the redesigned RSC
model leads to economic benefits or not.
The results have confirmed that the retail price estimated through a market
research among potential Chinese customers is enough to cover the total RSC
cost and generate further profits.
Therefore, the redesigned RSC model is economically viable and it allows the
company to capture the profit-making opportunities generated by EOL home
appliances remanufacturing.
Page 84
72
REFERENCES
Abdulrahman, M.D., Gunasekaran, A., Subramanian, N. (2014), Critical barriers
in implementing reverse logistics in the Chinese manufacturing sectors, Int. J.
Production Economics, Vol. 147, p. 460-471.
Adler, W D. (2006), Refrigerator Performance Testing in the Household
Refrigerator Industries Today. Available: http://www.transfairgmbh.homepage.t-
online.de/Transfair%20Survey%20Refrigerator%20Performance%20Testing.pdf
,Last accessed 7th Aug.
Álvarez-Gil, M. J., Berrone, P., Husillos, J., & Lado, N. (2007), Reverse
logistics, stakeholders' influence, organizational slack, and manager's posture,
Journal of Business Research, Vol. 60, p. 463-473.
Asiedu, Y., Gu, P. (1998), Product life cycle cost analysis: state of the art
review, International Journal of Production Research, Vol. 36, No. 4, p. 883-
908.
Bains, N., Goosey, M., Holloway, L., Shayler, M. (2006), An Integrated
Approach to Electronic Waste (WEEE) Recycling: Socio-economic Analysis
Report. Rohm and Haas Electronic Materials Ltd., UK.
Banomyong, R., Veerakachen, V., & Supatn, N. (2008), Implementing leagility
in reverse logistics channels. International Journal of Logistics: Research and
Applications, Vol. 11, No. 1, p. 31-47.
Page 85
73
Blackburn, J., Guide, V., Souza, G. and Van Wassenhove, L. (2004), Reverse
supply chains for commercial returns, California management review, Vol. 46,
No. 2, p.6--22.
Bohr, P. (2007), The Economics of Electronics Recycling New Approaches to
Extended Producer Responsibility. PhD thesis, Technischen Universitat, Berlin,
Germany.
Brennan L., Gupta, S., Taleb, K. (1994), Operations planning issues in an
assembly/disassembly environment, International Journal of Operations &
Production Management, Vol. 14, No. 9, p. 67-57.
Briney, A. (2014), A List of China's 23 Provincial Divisions, available:
http://geography.about.com/od/chinamaps/a/chinaprovinces.htm. Last accessed
13th Jul 2014.
Brodin, M. H. (2002), Logistics Systems for Recycling, Linköping: Linköping
Universitet.
Cardos, I.R., Pete, S. (2008), "Activity-Based Costing (ABC) and Activity-Based
Management (ABM) Implementation – Is this the solution for organizations to
gain profitability?, available at SSRN: http://www.revecon.ro/articles/2011-
1/2011-1-9.pdf tp://ssrn.com/abstract=962461.
Page 86
74
Christopher, M., Peck, H., & Towill, D. (2006), A Taxonomy for Selecting Global
Supply Chain Strategies, International Journal of Logistics Management, Vol.
17, No. 2, p. 277-287.
Cima (2001), Activity-Based Management-An Overview, available at SSRN:
http://www.cimaglobal.com/Documents/ImportedDocuments/ABM_techrpt_0401
.pdf.
CleanTechnica (2013), What's the average price of electricity in...., available:
http://cleantechnica.com/2013/09/30/average-electricity-prices-around-world/.
Last accessed 11th Jul 2014.
Cui, J., Forssberg, E. (2003), Mechanical recycling of waste electric and
electronic equipment: a review, Journal of Hazardous Materials, Vol. 99, No. 3,
p. 243-263.
Curran, R., Raghunathan, S., Price M. (2004), Review of aerospace
engineering cost modelling: The genetic casual approach, Progress in
Aerospace Sciences, Vol. 40, p. 487-453.
Daimer Industries. (2014), Steam Cleaners, available:
http://www.daimer.com/steam-cleaners/. Last accessed 7th Aug.
Errington, M. (2009), Business processes and strategic framework for
inspection in remanufacturing, PhD Thesis, University of Exeter, UK.
Page 87
75
Fleischmann, M., Krikkle, H.R., Dekker, R., Flapper, S.D.P. (2006). A
characterization of logistics networks for product recovery. Omega- International
Journal of Management Science 28, 653-666.
Galileo TP. (2014). PQ ELECTRIC, Available:
http://www.galileotp.com/products/pq-electric-P35.htm, Last accessed 7th
August.
Geethan, K. A. V., Jose, S., Chandar, C. S. (2011), Methodology for
Performances Evaluation of Reverse Supply Chain, International Journal of
Engineering and Technology, Vol.3, No.3, p. 213-224.
Geng, Y., Cote, R. (2003), Environmental management systems at the industrial
park level in China, Environmental Management, Vol. 31, No. 6, p. 784–794.
Geng, Y., Zhu, Q., Doberstein, B., Fujita, T. (2009), Implementing China’s
circular economy concept at the regional level: a review of progress in Dalian,
China, Waste Management, Vol. 29, p. 996-1002.
Gimein, M. (2013), If U.S. Wages Rose as Fast as China's, Factories Would
Now Pay $50 an Hour, available: http://go.bloomberg.com/market-
now/2013/03/27/if-u-s-wages-rose-as-fast-as-chinas-factories-would-pay-50-an-
hour/. Last accessed 14th Jul 2014.
Gome Electrical Appliances Ltd. (2014), GOME Announces 201 4 Q1 Results,
available: http://www.gome.com.hk/attachment/2014051912153017_en.pdf,
Last accessed 28th June 2014.
Page 88
76
Gome Electrical Appliances Ltd. (2014), Recycling policies, available:
http://huishou.gome.com.cn/?intcmp=sy-D-1-1-0. Last accessed 27th June
2014.
Gome Electrical Appliances Ltd. (2014). Annual Report 2013, available:
http://www.gome.com.hk/attachment/2014042306300817_en.pdf, Last
accessed 2nd July 2014.
Guide, V., Van Wassenhove L. (2009), The Evolution of Closed-Loop Supply
Chain Research, Operations Research, Vol. 57, No 1, p. 11-13.
Guide, V., Van Wassenhove, L. (2002), The Reverse Supply Chain, Harvard
Business Review, Vol. 80, No. 2, p. 25-26.
Gupta, S.M., Veerakamolmal, P. (2001), Aggregate planning for end-of-life
products. In: Sarkis, J. (Ed.). Greener Manufacturing and Operations: From
Design to Delivery and Back. Greenleaf Publishing Ltd., Sheffiled, U.K. pp. 205-
222.
Haier. (2014), HT21TS45SW Top Mount Refrigerators, available:
http://www.haier.com/us/products/kitchen/refrigerators/top-mount-
refrigerators/ht21ts45sw.shtml, Last accessed 14th Jul 2014.
Hughes, S.B.; Gjerde, K.P. (2003), “Do Different Cost Systems Make a
Difference?”, Management Accounting Quarterly, Vol. 5, No. 1, p. 22-30.
Page 89
77
Humphreys, K., Wellman, P. (1996), Basic cost engineering, 3rd edition
(Revised and expanded).
Ilgin, M. A. and Gupta, S. M. (2012), Remanufacturing Modelling and Analysis,
CRC Press / Taylor & Francis Group.
Jackson, P. (1986), Introduction to experts systems, Reading, MA: Addison-
Wesley Publishing Company, ISBN: 0-201-14223-6.
Jagolinzer, P. (1999), Activity-Based Costing and Management. In: Jagolinzer,
P. Cost Accounting: An introduction to cost management. South-Western
Educational Publishing, p. 120-130.
Johansson, G. (1997), Design for disassembly-a framework, Licentiate thesis at
the Division of Production System, Department of Mechanical Engineering at
Linkoping University, AFR-report 174.
Johnson, R. (2008), Traditional Costing Vs. Activity-Based Costing, available:
http://smallbusiness.chron.com/traditional-costing-vs-activitybased-costing-
33724.html. Last accessed 10th Jul 2014.
Kerr W., Ryan C. (2001), Eco-efficiency gains from remanufacturing – a case
study of photocopier remanufacturing at Fuji Xerox Australia, Journal of Cleaner
Production, Vol. 9, p. 75-81.
Page 90
78
Kiddee, P., Naidu, R., Wong, M.H. (2013), Electronic waste management
approaches: An overview, Waste Management, Vol. 33. No. 4, p. 1237-1240.
Li, J. (2011), Reverse supply chain in Gome, (W. Yin, Interviewer).
Li, J., Tian, B., Liu, T., Liu, H., Wen, X., Honda, S. (2006), Status quo of e-waste
management in China, Journal of Material Cycles and Waste Management, Vol.
8, No. 1, p. 13-20.
Lutters, D.,Streppel, A.H., Kroeze, B., Kals, H.J.J. (1997), Adaptive press-brake
control in air bending, In: Belfast Proceedings of the fifth international
conference on sheet metal.
Mills, P., Jones, R., Sumiga J. (1987), The integration of cost knowledge and
uncertainty into expert systems for engineering design, In: Fourth EU
conference on automated design. UK: Kempston Publications.
MyTravelCost.com. (2014), Petrol prices in China, 04-Aug-2014, available:
http://www.mytravelcost.com/China/gas-prices/. Last accessed 8th Aug 2014.
Nasr, N., Hughson, C., Varel, E., Bauer, R. (1998), "State of the Art Assessment
of Remanufacturing Technology”, Draft Document, Rochester NY: Rochester
Institute of Technology.
Page 91
79
National Aeronautics and Space Administration (NASA) (2002), "NASA Cost
Estimating Handbook", Cost Analysis Division, NASA Headquarters,
Washington DC.
Needy, K.L.; Nachtmann, H.; Roztocki, N.; Warner, R.C.; Bidanda, B. (2003),
“Implementing activity-based costing systems in small manufacturing firms: A
field study”, Engineering Management Journal, Vol. 15. No. 1, p. 3-10.
Niazi, A., Dai, J., Seneviratne, L., Balabani, S. (2006), "Product Cost Estimation:
Technique Classification and Methodology Review", Journal of Manufacturing
Science and Engineering, Vol. 128, No. 2, p. 563-575.
Parlikad, A.K., McFarlane, D.C., Kulkarni, A.G. (2006), "Improving product
recovery decisions through product information", Innovation in Life Cycle
Engineering and Sustainable Development, p. 153–172.
Plambeck, E.L. (2012), Reducing greenhouse gas emissions through
operations and supply chain management, Energy Economics, Vol. 34, No. 1,
p. 64-S74.
Prahinski, C., Kocabasoglu, C. (2006), Empirical Research Opportunities in
Reverse Supply Chain, The International Journal of Management Science, Vol.
34, p. 519-532.
Qu, Y., Zhu, Q.H., Sarkis, J., Geng, Y., Zhong, Y.G. (2013), A review of
developing an e-wastes collection system in Dalian, China, Journal of Cleaner
Production, Vol. 52, p. 176-184.
Page 92
80
Schatteman, O. (2002), Reverse logistics 2.12, available at:
http://www.ashgate.com/pdf/SamplePages/ghsupplych2.pdf. Last accessed
26th June 2014.
Seitz, M. A. and Peattie, K. (2004), "Meeting the Closed-Loop Challenge: The
case of remanufacturing", California Management Review, Vol. 46, No. 2, p. 74-
89.
Shanghai Highlights. (2013). Shanghai area, available:
http://www.shanghaihighlights.com/essential/#Features. Last accessed 25th Jul
2014.
Smith, V.M., Keoleian, G.A. (2004), The value of remanufactured Engines: Life-
Cycle Environmental and Economic Perspectives, Journal of Industrial Ecology,
Vol. 8, p. 193-221.
Steinhilper, R. (2001), "Recent trends and benefits of remanufacturing: from
closed loop businesses to synergetic networks", in: Ecodesign 2001
Proceedings of the Second International Symposium on Environmentally
Conscious Design and Inverse Manufacturing, p. 481- 488.
Stewart, R., Wyskidsa, R. and Johannes, J. (1995), Cost Estimator’s Reference
Manual (2nd ed.), Johan Wiley & sons Inc., New York.
Sundin E. (2004), Product and Process Design for Successful
Remanufacturing. Linkoping studies in science and technology, Licentiate thesis
Page 93
81
No. 906, Department of Mechanical Engineering, Linkopings Universitet, 581 83
Linkoping, Sweden. ISBN 91-85295-73-6.
Sundin, E., Bras, B. (2005), Making functional sales environmentally and
economically beneficial through product remanufacturing, Journal of Cleaner
Production, Vol. 13, p. 913-925.
Thierry, M., Salomon, M., Van Nunen, J. and Van Wassenhove, L. (1995),
"Strategic Issues in Product Recovery Management", California Management
Review, Vol. 37, No. 2, p. 114- 135.
Van Nunen, J. and Zuidwijk, R. A. (2004), "E-Enabled Closed-Loop Supply
Chains", California Management Review, Vol. 46, No. 2, p. 40- 54.
Wei, L. and Liu, Y. (2012), Present status of e-waste disposal and recycling in
China, Procedia Environmental Sciences, Vol. 16, p. 506--514.
Wei, Y. (2011), Reverse Supply Chain Management- explore the feasibility to
incorporate forward supply chain strategy into the reverse supply chain in the
electronic industry (unpublished Master Thesis), University of Gothenburg,
Gothenburg.
Wu, C.Y., Zhu, Q.H., Geng, Y. (2001), Green supply chain management and
enterprises’ sustainable development, China Soft Science, Vol. 16, No. 3, p.
67–70 (in Chinese).
Page 94
82
Xiang, Z. (2010), China electricity consumption to almost double by 2020: China
Electricity Council, available:
http://news.xinhuanet.com/english2010/china/2010-12/21/c_13658772.htm,
Last accessed 11th Jul 2014.
Yang, J., Lu, B., Xu, C. (2008), WEEE flow and mitigating measures in China,
Waste Management, Vol. 28, No. 9, p. 1589-1597.
Ying, Q. (2009), Research on the implementation of household appliances
reverse logistics, In: Proceedings of the international Conference on Information
and engineering and Computer Science.
Zhang, B., Wang, Z. (2013), Inter-firm collaborations on carbon emission
reduction within industrial chains in China: Practices, drivers and effects on
firms' performances, Energy Economics, Vol. 42, p. 115-131.
Zhou, X., Zhang, M. (2009), Research on Reverse Logistics Network Design of
Household Appliances Based on Green Logistics, International Journal of
Business and Management, Vol. 4, No. 9, p. 251-255.
Zhu, Q., Geng, Y., Sarkis, J., Lai, K. (2011), Evaluating green supply chain
management among Chinese manufacturers from the ecological modernization
perspective, Transportation Research, Vol. 47, No. E, p. 809-812.
Zhu, Q., Lowe, E., Wei, T., Barnes, D. (2007), Industrial symbiosis in China: a
case study of the Guitang Group, Journal of Industrial Ecology, Vol. 11, No. 1,
p. 31-42.
Page 95
83
Zhu, Q., Sarkis, J. (2004), Relationships between operational practices and
performance among early adopters of green supply chain management
practices in Chinese manufacturing enterprises, Journal of Operations
Management, Vol. 22, p. 265-289.
Zhu, Q., Sarkis, J. (2006), An inter-sectorial comparison of green supply chain
management in China: Drivers and practices, Journal of Cleaner Production,
Vol. 14, p. 472-486.
Zhu, Q.H., Cote, R. (2004), Integrating green supply chain management into an
embryonic eco-industrial development: a case study of the Guitang Group,
Journal of Cleaner Production, Vol. 12, No. 8–10, p. 1025–1035.
Page 97
85
APPENDICES
Appendix A Further time and cost calculation
A.1 Activity time calculation
Total remanufacturing time (𝒕𝒓𝒆𝒎𝒂𝒏𝒖𝒇𝒂𝒄𝒕𝒖𝒓𝒊𝒏𝒈)
It has been calculated by summing up the activity time required to accomplish
each of the remanufacturing activities, which comprises of the operation time,
loading time operator allowance time. The result is shown in Table A-1.
Remanufacturing Activities Activity time per unit
(hours) Activity time in %
Initial testing/sorting 27.6 95%
Repair or Exchange 0.38 1.4%
Cleaning 0.86 3%
Final Check 0.07 0.2%
Marking 0.17 0.07%
Packaging 0.093 0.33%
Total remanufacturing
process time 29.1 100%
Table A-1 Activity time for activities within the remanufacturing process
Page 98
86
Operation time (𝒕𝒐𝒑)
The operation time required to accomplish each activity of the remanufacturing
process have been collected from the study conducted by Sundin (2004) in the
Electrolux remanufacturing facility and from information provided by Adler 2006
on Household performance testing. The operation time for each activity within
the remanufacturing process is shown in Table A-2.
Remanufacturing Activities Operation time (OT)
per unit (hours)
Operation time
(OT) in %
Initial testing/sorting 24 95%
Repair or Exchange 0.33 1.4%
Cleaning 0.75 3%
Final Check 0.06 0.2%
Marking 0.017 0.07%
Packaging 0.083 0.33%
Total remanufacturing time 25.24 100%
Table A-2 Operation time for activities within the remanufacturing process
Transportation time (𝒕𝒕𝒓𝒂𝒏𝒔𝒑𝒐𝒓𝒕𝒂𝒕𝒊𝒐𝒏)
It has been calculated by summing up the transportation time required to
transport a product from the customers’ house to the retailing store, from the
retailing store to the sub-logistics centre and from the sub-logistics centre to the
retailing store. The results of calculations are shown in Table A-3.
Page 99
87
Transportation from-to Transportation
time (hours)
Transportation from c-r 1.1
Transportation from r-s 2.5
Transportation from s-r 2.5
Table A-3 Transportation time along the RSC
Further details on the calculations carried out for operation time and loading
time can be found below.
Operation time (𝒕𝒐𝒑)
The time needed to transport a product between different locations has been
determined, by analysing Gome’s network, which includes 125 sub-logistics
centres and 1585 retailing stores spanned in 14 Chinese provinces as shown in
Figure A-1 (Gome, 2014).
Page 100
88
Figure A-1 Gome’s network in China
In this regard, it is assumed that the sub-logistics centre is in Jiangsu province
and the retailing store in Shanghai. The sub-logistics centre remanufactures
EOL refrigerators collected by retailing stores in the whole Jiangsu area and
more specifically, to determine the transportation time required, the case of a
retailing store in Shanghai is taken into account. Shanghai is the largest urban
area in China and it extends for a maximum of 120 km from North to South
(Shanghai Highlights, 2013). Assuming that the retailing store is placed in the
middle of the city, in the worst case, a refrigerator have to be transported for 60
km from the customer house to the retailing store. On the other side, Jiangsu
province has an area of 102,600 sq. km (Briney, 2014). Assuming, that the sub-
logistics centre is in the middle of the province, it can be estimated that in the
worst case products for remanufacturing have to be transported by truck from
the retailing store to the sub-logistics centre for a maximum of 226 km.
Therefore, the operation time required to transport the refrigerator along the
different facilities in the redesigned RSC model is shown in Table A-4.
Page 101
89
Transportation from-to Operation time (hours)
Transportation from c-r 1
Transportation from r-s 2.26
Transportation from s-r 2.26
Table A- 4 Operation time to transport a product along the RSC
Loading time (𝒕𝒍) for transportation
Table A-5 shows the loading time for each transportation along the RSC.
Transportation from-to Loading time
(hours)
Transportation from c-r 0.1
Transportation from r-s 0.33
Transportation from s-r 0.33
Table A- 5 Loading time to transport a product along the RSC
Product handling time ( 𝑡ℎ𝑎𝑛𝑑𝑙𝑖𝑛𝑔)
Table A-6 shows the total handling time required as summation between the
handling time from retailing store to sub-logistics centre and the handling time
from sub-logistics centre to retailing store.
Page 102
90
Handling from-to Handling time
(hours)
𝑡𝑟−𝑠 0.915
𝑡𝑠−𝑟 0.915
𝒕𝒉𝒂𝒏𝒅𝒍𝒊𝒏𝒈 1.82
Table A- 6 Handling time to transport a product along the RSC
A.2 Cost parameters calculation
Labour rate (𝑹𝒍𝒂𝒃𝒐𝒖𝒓)
In China, the average monthly salary for factory workers varies significantly
depending on the province and the number of working hours per month
(Gimein, 2013). The monthly salary value has been collected from an interview
conducted to a shop floor worker in Siemens factory in Nanjing and the labour
rate estimated is shown in Table A-7.
Monthly salary (£) 300.6
Number of working days per month 22
Number of working hours per day 8
Labour rate (£/hour) 1.71
Table A-7 Labour rate for a factory worker
Page 103
91
Depreciation rate ( 𝑹𝒅𝒆𝒑)
The information about the value of the machines used to carry on the
remanufacturing activities have been collected by benchmarking the different
solutions proposed by vendors. The machine selected to perform the initial test
and final check is an electrical safety test machine (Galileo TP, 2014), while the
machine selected for cleaning is a steam pressure washer (Daimer Industries,
2014). The depreciation rate for each of the machines selected is shown in
Table A-8.
Electrical safety
test machine for
initial test and
final check
Steam pressure
washer for
cleaning
Tractor trailer-
truck
for
transportation
𝑣 (£) 4,750 3,350 80,000
𝑡𝑙𝑐 (hours) 70,080 70,080 87,600
𝑹𝒅𝒆𝒑 (£/hour) 0.067 0.048 0.91
Table A-8 Depreciation rate for the machines selected
Electricity rate (𝑹𝒆𝒍𝒆𝒄𝒕𝒓𝒊𝒄𝒊𝒕𝒚)
In China, the electricity price varies according to the province in which the
remanufacturing facility operates. Data regarding the electricity prices in
different provinces have been collected and the average has been estimated
approximately as £ 0.047 per Kwh (CleanTechnica, 2013; Xiang 2010).
Table A-9 shows the results of calculations performed in order to estimate the
electricity rate.
Page 104
92
Electrical safety test
machine
Steam pressure
washer
𝑊 (𝐾𝑤) 5 2.4
𝐸𝑝 (£/Kwh) 0.047 0.047
𝑹𝒆𝒍𝒆𝒄𝒕𝒓𝒊𝒄𝒊𝒕𝒚 (£/hour) 0.23 0.11
Table A-9 Average electricity rate per in China
Tools rate (𝑹𝒕𝒐𝒐𝒍𝒔)
Both the electrical safety test machine and the steam pressure washer do not
utilise consumable tools such as cutting tools to accomplish the related
activities, therefore this parameter is not taken into account for the cost
estimation.
Fuel rate (𝑹𝒇𝒖𝒆𝒍)
The mean used to transport a product along the RSC is a diesel tractor trailer-
truck. Typically, these trucks consumes approximately 1 litre of diesel each 20
km. In China, the price of diesel has been estimated as 0.71 £/l
(MyTravelCost.com, 2014). Table A-10 shows the fuel rate estimated for a
diesel tractor trailer-truck.
𝐶𝑓 (£/l) 0.71
𝐹 (km/l) 20
𝑆 (km/hour) 60
𝑹𝒇𝒖𝒆𝒍: Fuel rate (£/hour) 2.13
Table A-10 Fuel rate for a diesel tractor trailer-truck
Page 105
93
A.3 Cost elements estimation
Labour cost(𝑪𝒍𝒂𝒃𝒐𝒖𝒓)
Table A-11 shows the labour cost estimated respectively for remanufacturing,
transportation and storage.
𝑪𝒍𝒂𝒃𝒐𝒖𝒓,𝒓 (£) 48.58
𝑪𝒍𝒂𝒃𝒐𝒖𝒓,𝒕 (£) 10.37
𝑪𝒍𝒂𝒃𝒐𝒖𝒓,𝒔 (£) 3.11
Table A-11 Labour cost estimation
Machine cost (𝑪𝒎𝒂𝒄𝒉𝒊𝒏𝒆)
Table A-12 shows the machine cost estimated respectively for initial test,
cleaning and final check.
𝑪𝒎𝒂𝒄𝒉𝒊𝒏𝒆,𝒊(£) 2.11
𝑪𝒎𝒂𝒄𝒉𝒊𝒏𝒆,𝒄 (£) 0.13
𝑪𝒎𝒂𝒄𝒉𝒊𝒏𝒆,𝒇𝒄 (£) 0.02
Table A-12 Machine cost estimation
Transportation cost (𝑪𝒕𝒓𝒂𝒏𝒔𝒑𝒐𝒓𝒕𝒂𝒕𝒊𝒐𝒏)
Table A-13 shows the transportation cost estimated respectively from the
customer’s house to retailing store, from retailing store to sub-logistics centre
and from sub-logistics centre to retailing store.
Page 106
94
𝑪𝒄−𝒓 (£) 3.04
𝑪𝒓−𝒔 (£) 6.88
𝑪𝒔−𝒓 (£) 6.88
Table A-13 Transportation cost estimation
Spare parts cost (𝑪𝒔𝒑𝒂𝒓𝒆 𝒑𝒂𝒓𝒕𝒔)
According to Sundin (2005), it accounts for the 5% of the total remanufacturing
cost for a home appliance. Due to lack of significant data and information, this
cost element has not been included in the cost estimation.
A.4 Activities cost estimation
The costs estimated to carry out the activities involved in remanufacturing,
transportation and storage of an EOL refrigerator and identified in the CBS are
respectively shown in Table A-14.
Remanufacturing activities cost (£) 50.83
Transportation activities cost (£) 27.17
Storage activities cost (£) 1.82
Table A-14 Cost of activities involved in the RSC
Page 107
95
Appendix B Surveys and profit margin
B.1 Market research
In order to understand the Chinese customer’s attitude toward remanufactured
refrigerators, a market research has been performed in collaboration with PhD
students of Nanjing University of Aeronautics and Astronautics (NUAA). The
market research consists of the survey shown below, which has been translated
in Chinese and sent to potential customers in Nanjing.
Remanufactured Refrigerator Survey
To answer the following questions, please tick the box.
Question 1
Would you be willing to buy a remanufactured refrigerator, which has the same
performances and quality of a new one?
Yes
No
If you answered yes to Question 1, please answer to Question 2.
Question 2
How much discount would you expect to achieve for a remanufactured
refrigerator compared to the same new model?
10% 15% 20%
Page 108
96
25% 30% 40%
45% 50% 55%
60% 65% 70%
75% 80% 85%
Survey Results
The results of the survey are shown in Table B-1.
Name Gender Q1 Q2
BoSong male No
ChunchunChen female No
HaihuaZhu male Yes 70%
HuixingLi female Yes 70%
JianGuo male No
JuanTang female Yes 70%
JunChen male Yes 60%
JunLin male Yes 70%
KunZheng male Yes 75%
LicaiYe male Yes 50%
LichengZhang male Yes 60%
LingYang female Yes 50%
MinWang female No
PeiZhu male Yes 50%
PengfeiGuo male No
PengYang male Yes 60%
PingYang female No
QingyaXia female Yes 50%
Page 109
97
RuiZhao male Yes 50%
ShengZhou male Yes 40%
ShouzhengYe male Yes 70%
WenbinGu male Yes 60%
WengangLing male Yes 60%
XianzhenMeng female No
XiaofeiXue male Yes 70%
XiaoleiHuang male No
Xiaoliang Jin male Yes 50%
XuemeiZhao female Yes 60%
YangLiu male No
YangYu male Yes 60%
YubinZheng male Yes 60%
YupingZheng female Yes 50%
YuxiaZheng female Yes 70%
YuyunKang male No
YuZheng female Yes 65%
ZeleiSangmale male No
ZequnZhang male No
ZhiguiLiu male Yes 50%
ZiyuWang male Yes 50%
ZongwenAn male Yes 70%
Table B-1 Survey results