Development of a Surface-Enhanced Raman Spectroscopy (SERS)-Based Sensor for the Long Term Monitoring of Toxic Anions Space and Naval Warfare Systems Center, San Diego (SSC San Diego) Code D36 San Diego, CA Final Report June 2003
Transcript
Development of a Surface-Enhanced Raman Spectroscopy (SERS)-Based Sensor for the Long Term
Monitoring of Toxic Anions
Space and Naval Warfare Systems Center, San Diego (SSC San Diego)
Code D36 San Diego, CA
Final Report
June 2003
1
TABLE OF CONTENTS
Page LIST OF FIGURES …………………………………………………………………… 3 LIST OF TABLES ……………………………………………………………………...5 LIST OF ABBREVIATIONS AND ACRONYMS ………………………………….. 6 1. PROJECT BACKGROUND ……………………………………………………… 12 2. TECHNICAL OBJECTIVE ………………………………………………………. 16 3. TECHNICAL APPROACH ……………………………………………………….17
4.1 Detection of Toxic Anions Using Cationic-Coated SERS Substrates……….22 4.1.1 Normal Raman Spectroscopy……………………………………………...22 4.1.2 SERS of Cationic-Coated, Silver/Gold Substrates and Aqueous Solutions of
Perchlorate, Chromate, Dichromate, and Cyanide…………………………23 4.1.3 Characterization of the Interaction of non-Raman Active Ionic Species by
Competitive Complexation………………………………………………...26 4.1.4 Selectivities of the Cationic-Coated Silver SERS Substrates……………...28
4.2.3.1 Solid Phase Extraction……………………………………………….40 4.2.3.2 Chemical Separation Using Supported Liquid Membranes…………41 4.2.3.3 Chemical Separation Using Nanotubule Technology……………….45
4.4.1 Design of a Field Deployable Sensor for the Detection of Anions………..56 4.4.2 Signal Processing Algorithms……………………………………………..62 4.4.2.1 Signal Processing Techniques to Improve the S/N Ratio……………62
4.4.2.2 Signal Processing Algorithms for Speciation………………………..63 5. PROJECT ACCOMPLISHMENTS………………………………………………66
APPENDIX A: POINTS OF CONTACT……………………………………………..83 APPENDIX B: PUBLICATIONS……………………………………………………..84 B1. Presented at the IFPAC-2002……………………………………………...85 B2. Poster at the SERDP/ESTCP Annual Workshop………………………..86 B3. Paper Accepted by Langmuir…………………………….……………….88 B4. Paper Accepted by Applied Spectroscopy………….…………………...123 B5. Patent Application, Navy Case 82434…………………………………...146 APPENDIX C: EXPERIMENTAL…………………………………………………..161
C1. Reagents…………………………………………………………………...161 C2. Detection of Toxic Anions Using Cationic-Coated SERS Substrates….161
C2.1 Preparation of SERS Substrates………………………………………161 C2.2 Normal Raman Spectroscopy (NRS)…………………………………161 C2.3 SERS Measurements………………………………………………….162 C2.4 Manipulation of Spectral Data………………………………………..162
C3. Molecular Modeling to Evaluate Selectivities…………………………..164 C4. Optimization of Electrochemical Etching Parameters…………………165 C5. References…………………………………………………………………166
3
LIST OF FIGURES
Figure 1. Structure of the symmetric cyanine dye DIDC………………………………..13 Figure 2. Schematic summarizing the technical objective……………………………….16 Figure 3. SERS spectra of Ag/CY in the presence of 0, 25, 100, 500, and 1000 ppm
nitrate ion………………………………………………………………………18 Figure 4. SERS response obtained for Ag/CY and 0.5, 1.0, and 5.0 ppm nitrate Ion……………………………………………………………………………...18 Figure 5. Commercially available cationic thiols………………………………………..20 Figure 6. Normal Raman spectra obtained for 104 ppm aqueous solutions of chromate,
dichromate, perchlorate, cyanide, nitrate, sulfate, and phosphate……………..22 Figure 7. Normal Raman concentration response of the anionic species………………..23 Figure 8 (A) SERS spectra of Ag/MMP system in 0, 50, 750, and 10,000 ppm perchlorate. (B) SERS spectra of Au/MMP system in 0, 50, 750, and 10,000 ppm chromate. (C) Ag/MMP-ClO4
- isotherm where K = 1163± 56 and g= -2.51±0.21. (D) Au/MMP-CrO4
= isotherm where K = 2760± 150 and g= -2.80±0.18……………………………………………………………………..24 Figure 9. SERS spectra obtained for MMP (A) and CYSE (B)…………………………25 Figure 10. (A) SERS spectra obtained for Au/CYSM in the presence of chromate. The
SERS spectrum of the coating is indicated by the heavy black line. (B) Concentration response of the 850 cm-1 (black line, solid circles) and the 600 cm-1 (gray line, open circles)……………………….……………………….26
Figure 11. Spectra (A) and concentration response (B) for the Ag/CY/NO3- system as a
function of chloride ion. Nitrate concentration is 1000 ppm. Solution pH is 5.0..27 Figure 12. Ionophore for perchlorate ion ………………………………………………..33 Figure 13. (A) SERS spectra of Au/MEP system as a function of chromate concentration.
(B) Au/MEP-CrO4= isotherm where K = 142800± 7700 and g= -2.068±0.063.
(C) SERS spectra of Ag/MEP system as a function of perchlorate concentration. (D) Ag/MEP-ClO4
- isotherm where K = 38± 11 and g= 1.35±0.24……………………………………………………………………..34
Figure 14. Computer generated structures and electrostatic potential maps of Au/MEP and the Au/MEP · CrO4
= complex. These structures were obtained using the B3LYP/LACVP* method…………………………………………………….35
Figure 15. Computer generated structure of the Au/MEP SAM interacting with a chromate ion…………………………………………………………………………….36
Figure 16. SERS response obtained for Au/MEP and 0.1-1.0 ppm chromate…………...37 Figure 17. Schematic of the cavity in an imprinted polymer selective for 2-aminopyridine
(2-Apy)………………………………………………………………………39 Figure 18. Spectra (A) and concentration response (B) for the Ag/CY/NO3
- system as a function of chloride ion after SPE……………………………………………..40
Figure 19. Schematic of a supported liquid membrane (SLM)……………………..…...42 Figure 20. Structure of dibenzo-18-crown-6 (DB18C6) and plots of transport rate as a
function of anion concentration……………………..………………………..43 Figure 21. Structure of MnIIITTP…………………………………………………………44 Figure 22. Schematic diagram of the electroless Au plating procedure………….……….46
4
Figure 23. SERS spectrum of p-thiocresol on a silver substrate. The symmetric stretching ring mode, νs, is indicated…………………………………………………….48
Figure 24. Intensity of the symmetric stretching ring mode of PTC as a function of anodic/cathodic potential. For each sample 25 sweeps were applied………..49
Figure 25. Schematic of planar waveguide……………………………………………...52 Figure 26. Schematic diagram of the heterostructure assembly glass/3-MPTMS/Ag
colloid of the IO-EWSERS substrate with adsorbed 4-Mpy………………….52 Figure 27. Benoit and Yappert (1996) sensor configuration and propagation of the
excitation………………………………………………………………………53 Figure 28. Schematic of a fractal/microcavity composite….……………………………54 Figure 29. Schematic of the essential components for a SERS sensor to detect toxic
anions………………………………………….……………………………….55 Figure 30. Design of the InPhotonics probe head…….………………………………….57 Figure 31. SERS spectra of p-thiocresol chemisorbed on a 62 Å thick gold film obtained
using the ‘backside’ configuration……….…..……………………………….57 Figure 32. Schematic showing how MCTMS anchors vapor-deposited Au to a glass
substrate……………………………………………………………………….58 Figure 33. SERS spectra of p-thiocresol chemisorbed on thin films of gold on a glass
substrate……………………………..……………………………………….58 Figure 34. Design of adapter used to house the fiber optic probe and the SERS
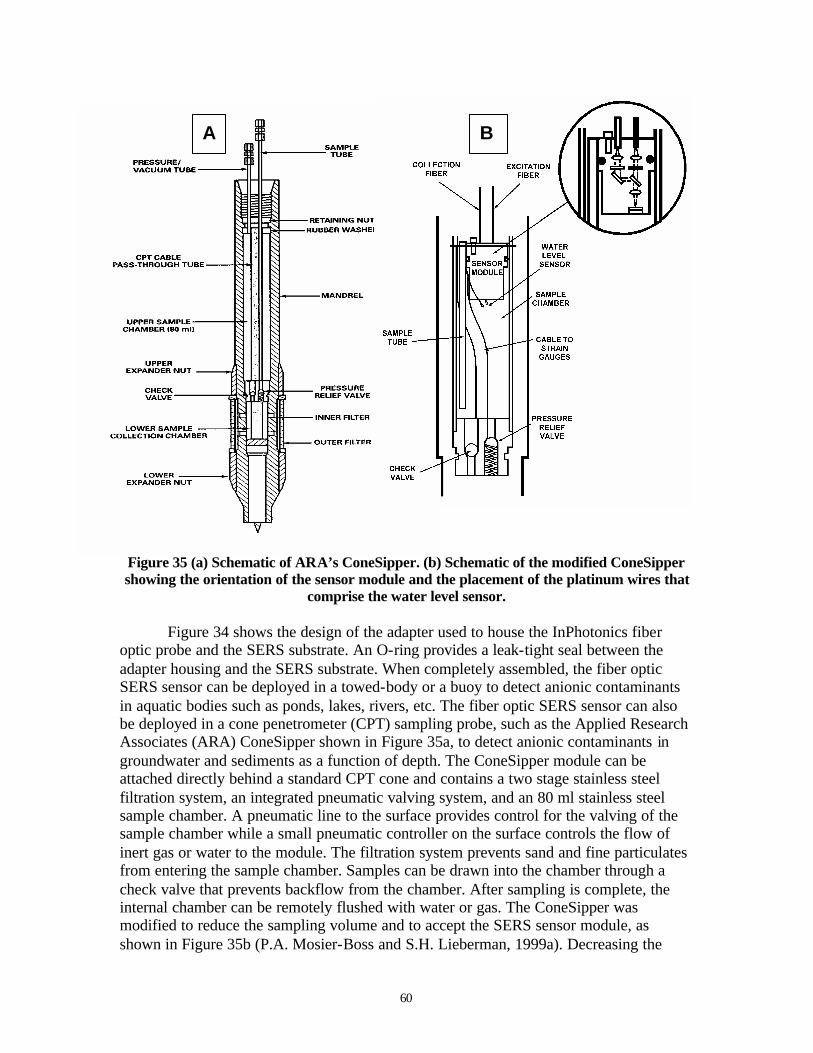
substrate………………………………….…………………………………...59 Figure 35 Schematic of ARA’s ConeSipper…………………………………………….60 Figure 36. The modified insert of the ConeSipper showing the placement of the
InPhotonics fiber optic probe and the adapter that houses the SERS substrate and fiber optic probe………………………………………………………...61
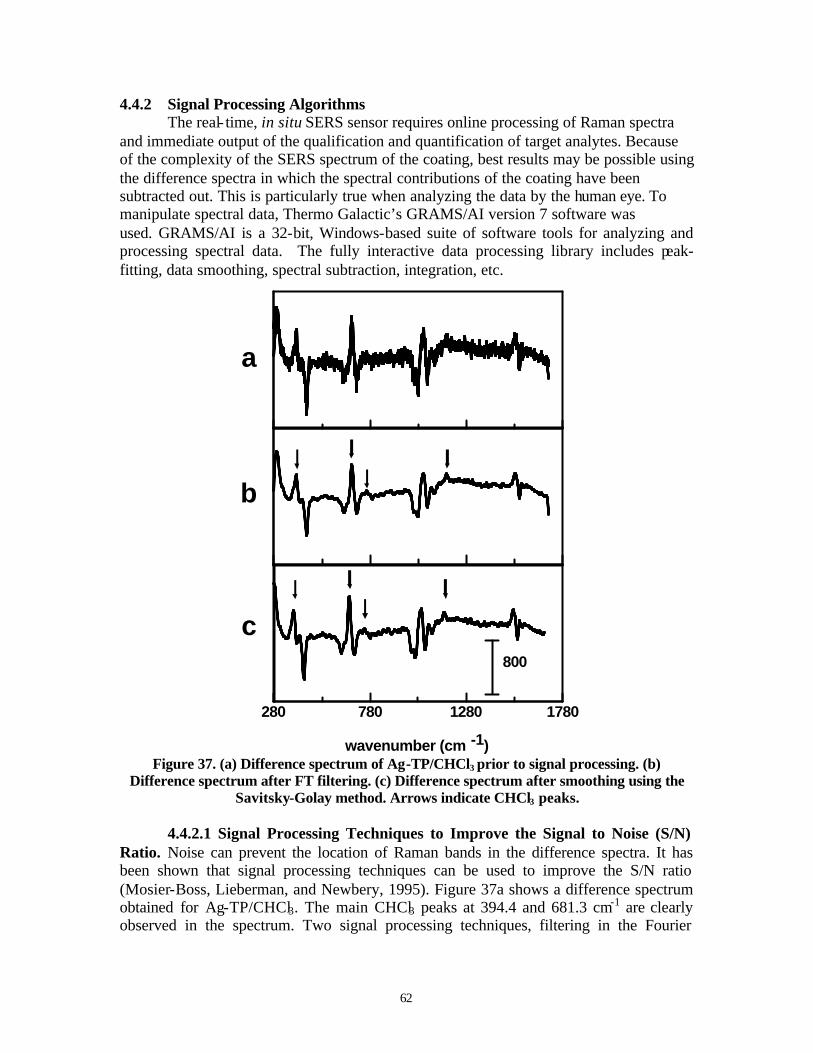
Figure 37. Difference spectrum of Ag-TP/CHCl3 prior to signal processing……………62 Figure 38. Construction of ANN used in the oil- in-water content monitoring system…64 Figure 39. The InPhotonics’ field deployable Raman system, the InPhotote………….71 Figure 40. Spectrum of benzene saturated water (benzene concentration is ~1200 ppm)
obtained using the InPhotote…………………………………………………72 Figure C-1. Schematic of flow-through cell……………………………………………163 Figure C-2. The top two spectra are SERS spectra of Ag/CYSE in the presence and
absence of 1000 ppm nitrate ion……………………………………………..164
5
LIST OF TABLES
Table 1. Raman active vibrational modes of perchlorate, chromate, dichromate, and cyanide …………………………………………………………………………17
Table 2. LODs and experimental parameters used to obtain spectral data summarized in Figures 6 and 7…………………………………………………………………23
Table 3. Summary of ion-pair constants (M-1) and Frumkin parameters for cysteamine thiol derivatives and selected anions as determined by SERS…………………29
Table 4. Summary of ion-pair constants (M-1) and Frumkin parameters for cysteine thiol derivatives and selected anions as determined by SERS……………………….29
Table 5. Summary of ion-pair constants (M-1) and Frumkin parameters for cationic aromatic thiol derivatives and selected anions as determined by SERS………..30
Table 6. Summary of the modifications of CY to yield the chemical derivatives DMA, DEA, CYS, CYSM, and CYSE……………………………………………….31
Table 7. Effect of the anodic/cathodic potentials and number of ORCs on the SERS response of PTC. A sweep rate of 500 mV s-1 was used……………………….50
Table 8. Effect of deposition time of electrocrystallization of silver on the SERS response of PTC…………………………………………………………………………..51
Table 9. Summary of publications……………………………………………………….66 Table B-1 Summary of publications……………………………………………………..84 Table C-1 Summary of Titan’s Capabilities……………………………………………165
6
List of Abbreviations, Acronyms, and Symbols A Peak Area A0 Peak Area in the Absence of Chloride ACl Peak Area in the Presence of Chloride AT Maximum Theoretical Peak Area Ag Silver Ag(CN)2- Dicyano-Silver Complex Ag(CN)3- Tricyano-Silver Complex AgNO3 Silver Nitrate ang angle bending ANN Artificial Neural Network 2-Apy 2-Aminopyridine ARA Applied Research Association ATB 2-Amino-4-Trifluoromethyl Benzenethiol ATR-FTIR Attenuated Total Reflectance-Fourier Transform Infrared Au Gold B3LYP (Becke 3 Term, Lee Yang, Parr) A Hybrid DFT Method BaSO4 Barium Sulfate BF4
- Tetrafluoroborate Br - Bromide BrO3
- Bromate BTEX Benzene Toluene Ethylbenzene Xylene C Carbon c Concentration C Concentration oC Degree Celsius CCD Charge Coupled Device Cd Cadmium CDHS California Department of Health Services CHCl3 Chloroform CH3 Methyl Group CH3COO- Acetate CHEMFET Chemically Sensitive Field Effect Transistor Cl - Chloride ClO4
- Perchlorate cm Centimeter cm-1 Wavenumber CO Carbon Monoxide CO2 Carbon Dioxide CO3
[CrMo6O24H6]3- Hexamolybdochromate Complex Cs Cesium Cu Copper CW Continuous Wave CY Cysteamine CYS Cysteine CYSE Cysteine Ethyl Eester CYSM Cysteine Methyl Ester d Diameter DB18C6 Dibenzo-18-Crown-6 DBR Distributed Bragg Reflector DEA Diethylaminethanethiol DIDC Dimethylindodicarbocyanine DMA Dimethylaminethanethiol DMSO Dimethylsulfoxide DoD Department of Defense DOE Department of Energy E Energy EC-SERS Electrochemical Surface Enhanced Raman Scattering ele Electrostatic Interactions ESTCP Environmental Security Technology Certification Program EWSERS Evanescent Wave Surface Enhanced Raman Scattering f Optical f-Number F- Fluoride Fe Iron FIA Flow Injection Analysis FT Fourier Transform ft Feet g Frumkin Parameter GC Gas Chromatography GS-CrO3 Thiol Ester GSH Glutathione h Hour H Hydrogen Hg Mercury 1H NMR Proton Nuclear Magnetic Resonance H2O2 Hydrogen Peroxide HPO4
= Monohydrogen Phosphate H2PO4
- Dihydrogen Phosphate HSO4
- Monohydrogen Sulfate HPLC High Performance Liquid Chromatography HRP Horse Radish Peroxidase I- Iodide ICP Inductively Coupled Plasma ID Inner Diameter of Tubing in Inch
8
IO Integrated Optics IO4
- Iodate IR Infrared ISE Ion Selective Electrode K Equilibrium Constant K Potassium KCl Potassium Chloride KCN Potassium Cyanide Kf Formation Constant kJ Kilojoules KNO3 Potassium Nitrate L Liter LAP Light Addressable Photoelectrochemical Li Lithium LIF Laser Induced Fluoescence LOD Limit of Detection m Slope of Line m Meter M Molarity MAA Methacrylic Acid ME Mercaptoethanol MEP 4-(2-Mercaptoethyl)Pyridinium mg Milligram MHz Megahertz min Minute MIP Molecularly Imprinted Membrane mm Millimeter mM Millimolar MM Molecular Modeling MMP 2-Mercapto-4-Methyl Pyrimidine Mn Manganese MnO4
= Permanganate MnTTP 5,10,15,20-Tetraphenyl-21H,23H-Porphine Manganese III mol Mole Mo Molybdenum MoO4
= Molybdate 2-MPM 2-Mercaptopyrimidine 4-Mpy 4-Mercaptopyridine ms Millisecond MS Mass Spectrometry 3-MPTMS 3-Mercaptopropyltromethoxysilane ms Millisecond MTBE Methyl Tertiary Butyl Ether mV Millivolt mW Milliwatt MW Molecular Weight
9
N Nitrogen N Number of Sites NT Total Number of Sites Na Sodium NaCl Sodium Chloride NaNO3 Sodium Nitrate n-CdSe N-type Cadmium Selenide ng mL-1 Nanogram per Milliliter NIR Near Infrared nm Nanometer nM Nanomolar NMR Nuclear Magnetic Resonance NO Nitrous Oxide NO2
- Nitrite NO3
– Nitrate NR4
+ Quaternary Ammonium NRS Normal Raman Spectroscopy o- Ortho Substituted Aromatic Ring O Oxygen O2 Oxygen Gas OD Outer Diameter of Tubing OD Optical Density OH- Hydroxide oop Out of Plane o-NPOE 2-Nitrophenyl Octyl Ether OPA o-phthalaldehyde ORC Oxidative-Reductive Cycle p- Para Substituted Aromatic Ring P Phosphorous PAR 4-(2-Pyridylazo)resorcinol Pb Lead PF6
3- Phosphate ppb Parts per Billion ppm Parts per Million pptr Parts per Trillion Pt Platinum PTC p-Thiocresol PVC Polyvinyl Chloride PWC Public Works Center R- Alkyl Group Rb Rubidium
10
Re Rhenium R6G Rhodamine 6g R-SH Thiol s Second S= Sulfide SAM Self Assembled Monolayer Sb Antimony s-BLM Self-Assembled Bilayer Liquid Membrane SCAPS Site Characterization and Analysis Penetrometer System SCE Saturated Calomel Electrode SCN- Thiocyanide Se Selenium SERDP Strategic Environmental Research and Development Program SERS Surface Enhanced Raman Scattering SLM Supported Liquid Membrane S/N Signal- to-Noise Ratio SO3
= Sulfite SO4
= Sulfate SPE Solid Phase Extraction str Bond Stretching Tmin Minimum Temperature t-bu Tertiary Butyl Group TCE Trichloroethylene TE Thermoelectric TEC Thermoelectric Cooler Tl Thallium tor Torsion Deformation TP Thiophenol UV Ultraviolet V Constant= αθ0 V Volt Vn+ Vanadium vdw Van der Waals Interaction Vis Visible VOC Volatile Organic Compound WO4
= Tungstenate α Proportionality Constant α Polarizability Å Angstrom ∆A Change in Peak Area ∆Ghyd Gibb’s Free Energy of Hydration η Refractive Index κ Constant Proportional to Ki /Kj
µ Induced Dipole
µA Microampere µg Microgram
11
µL Microliter µm Micrometer ν Frequency π Electrons in Aromatic Ring θ Surface Coverage σ Uncertainty
12
1. PROJECT BACKGROUND At DoD sites, perchlorate has been used as the oxidizer component and primary ingredient in solid propellant for rockets and missiles. Perchlorate is exceedingly mobile in aqueous systems and can persist for many decades under typical ground and surface water conditions. It has been found in groundwater, drinking water, and soils, mainly in the southwestern United States, at levels ranging from 8 to 3700 ppb. Perchlorate affects the thyroid gland by blocking iodine uptake resulting in lower thyroid hormone levels. Chromate and dichromate are CrVI species that have been used in metal finishing and in metal plating operations. CrVI is a strong oxidizer and is both highly toxic and carcinogenic. Chromate and dichromate are very water soluble and have little interaction with the soil. Consequently, these pollutants are mobile, resulting in widespread groundwater contamination. Chromium contamination is present in over half of the superfund sites. Most cyanide releases into the environment come as a result of mining operations. However, in DoD, cyanide has been used in electroplating processes for silver, cadmium, gold, and copper. Cyanide is highly toxic. Exposure by eye or skin contact or ingestion can be rapidly fatal. More and more DoD sites contaminated with these anions are entering the active remediation and post remediation stages. As a result, the requirement for long-term monitoring has increased. This long-term monitoring can be for process control, for performance measurement, or for compliance purposes and can last up to 30 years. Currently monitoring is done by traditional methods of collecting aqueous samples from monitoring wells or by drilling and collecting soil samples. These samples are then sent to a laboratory for analysis. The collecting and laboratory analysis of samples is both time consuming and costly. Often the analytical results are questionable due to sampling handling procedures and biochemical interactions. A number of technologies have been used to detect these toxic, anionic species. The California Department of Health Services (CDHS) has developed an ion chromatographic method to detect perchlorate (Okamoto et al., 1999). An anion-exchange type column is used with a strong base eluant. However, it was found that the ion chromatographic retention time of perchlorate shifts with concentration. Collette and Williams (2001) used water to extract perchlorate from fertilizers and plant tissues. The perchlorate in the extracts was then detected and quantified using normal Raman spectroscopy. Kowalchyk, Walker, and Morris (1995) used normal Raman spectroscopy as an on- line detector for capillary electrophoresis to detect perchlorate. Field amplified injection into a running electrolyte of 0.1 M KCl increased the analyte concentration at the detection window by up to 1800 times its starting value. Using this method, it was possible to separate and detect sub-ppm concentrations of perchlorate in under three minutes. The method developed by Magnuson, Urbansky, and Kelty (2000) required extraction of perchlorate using a cationic surfactant in either methylene chloride or methyl isobutyl ketone followed by electrospray mass spectrometry detection. Detection limits as low as 300 pptr were demonstrated. ThermoOrion (2002) commercially markets a perchlorate ion selective electrode (ISE). The electrode incorporates a tris (substituted 1,10-phenanthroline) iron (II) ion exchanger dissolved in an organic solvent to give an ion-exchanging liquid that is insoluble in water. The effective concentration range of
13
operation is 0.7-99,500 ppm. While ISEs are sensitive, inexpensive, and exhibit rapid response times, they do require recalibration after every 10-30 samples in order to compensate for changes in temperature or conditions of the sensing membrane (Janata, 1989). Recently, Strauss (2001) coated an ATR-FTIR probe with ion exchange compounds. Using these probes, detection of perchlorate (3 ppb, 60 min analysis time) and cyanide (5 ppb, 15 min analysis time) were achieved. The usual method for determination of CrVI complexes CrVI with 1,5-diphenylcarbohydrazide(diphenylcarbazide), which is detected spectrophotometrically at 540 nm (Saltzman, 1952; Allen, 1958). Recently, Himeno et al. (1998) has developed a capillary electrophoresis technique that simultaneously detects CrVI and CrIII. In this method, CrIII is reacted with MoVI to form a hexamolybdochromate complex, [CrMo6O24H6]3-, which was found to elute after the CrVI species. Ji et al. (2001) reported the detection of trace amounts of CrO4
= using gold-coated, silicon microcantilevers modified with a self-assembled monolayer (SAM) of triethyl-12-mercapto-dodecylammonium bromide. The anions Cl-, Br - , CO3
=, NO3 - , and SO4
= minimally interfered with detection of CrO4
=. Turyan and Mandler (1997) synthesized 4-(2-mercaptoethyl)- pyridinium and used it to form a self assembled monolayer on a gold electrode. They showed that, using these modified electrodes, they could detect the CrVI species electrochemically. Not only were they able to detect CrVI in the parts per trillion levels but they showed that analysis of 0.1 ppb CrVI was not affected by the presence of a 103-fold excess of CrIII. The pyridinium coating showed great selectivity for the CrVI species. The anions Cl-, NO3
-, PO43-, CH3COO-, and ClO4
- did not interfere in the detection of the CrVI species. Only MoO4
= showed a considerable interference. A polyaniline/polystyrene composite glassy carbon electrode was used as a sensitive, flow injection analysis (FIA) detector for the analysis of CrVI species (Yang and Huang, 2001). Sub ppb detection limits were achieved. However, serious interferences were found for Fe3+ and MoO4
= ions with concentrations in the ppb level and for Cu2+, V5+, and Hg2+
ions with concentrations in the ppm level. Balogh et al (2000) demonstrated that chromium (VI) species associate with symmetric cyanine dyes, such as dimethylindodicarbocyanine (DIDC) whose structure is shown in Figure 1. In acidic medium and in the presence of chloride ion, these chromium (VI)-cyanine dye associates can be extracted into aromatic hydrocarbons and esters. It was demonstrated that the chromium (VI) species could be extracted from soil and sewage samples. The absorbance of the colored extracts obey Beer’s law in the range 0.01-2.1 mg L-1. Reductants, such as TlIII, SbV, HgII, ReVII, AuIII, and CuI, were interferences.
Figure 1. Structure of the symmetric cyanine dye DIDC.
dimethylindodicarbocyanine (DIDC)
+CH3
N
CH3
CH3
(CH=CH)2-CH=
CH3Cl-
CH3CH3
N
14
Rosentreter and Skogerboe (1991) developed a method to detect sub ppb concentrations of cyanide ion. Their approach uses silver metal filters which react with cyanide to form the water soluble dicyano-silver complex, Ag(CN)2- , which is then detected by atomic absorption spectroscopy. Detection of cyanide ion by electrochemical surface-enhanced Raman spectroscopy (EC-SERS) has been demonstrated (Storey et al., 1995). Cyanide ion forms strong complexes with silver at the surface of an electrode. The potential dependent response of the band at 2110 cm-1, corresponding to the Ag(CN)3=
complex is linear from 10 ppb to 100 ppm. Sulfate ion is an interference. A light addressable photoelectrochemical (LAP) sensor capable of spatial and temporal resolution of cyanide in solution was demonstrated (Licht, Myung, and Sun, 1996). The sensing element consisted of a n-CdSe electrode immersed in solution with the open circuit potential determined under illumination. In alkaline ferro/ferricyanide solution, the sensor open circuit photopotential is highly responsive to cyanide, linearly responding to (120 mV)log[KCN]. The limit of detection (LOD) is 50 ppm. S= interfered with the sensor whereas NO3
-, Cl-, SO4=, SCN- , and I- did not. A FIA system incorporating a gas-
diffusion membrane to detect cyanide ion was demonstrated by Nomura et al (2000). The principle of measurement was based on the reaction of o-phthalaldehyde (OPA) and cyanide in the presence of glycine to produce a fluorescent isoindole derivative. The cyanide concentration of the samples is proportional to the observed fluorescence intensity with a LOD for CN- of 0.4 ng mL-1. Because sulfite ion and thiols interfered, a gas-diffusion membrane was incorporated into the system to separate gaseous hydrogen cyanide from interferents in the sample thereby improving selectivity. The FIA system was used for continuous, in situ monitoring of cyanide concentrations in river water for five months. It was observed that the sensitivity of the sensor system decreased over time due to degradation of the gas-diffusion membrane. Tatsuma and Oyama (1996) showed that a pyrolytic graphite (PG) electrode on which horseradish peroxidase (HRP) is adsorbed can be used to detect cyanide. A cathodic potential step reduces dissolved O2 to H2O2 at the PG surface. The H2O2 accumulates in the diffusion layer. The potential is then stepped to a potential at which H2O2 is reduced but O2 is not. Since this H2O2 reduction current is catalyzed by HRP adsorbed on the PG surface, it is inhibited by cyanide. Inhibition of the reduction current is monitored for the cyanide determination. A HRP/PG electrode with saturated HRP coverage is reliable and can determine 10-5 to 10-3 M cyanide. Recently, a fast and highly selective assay of cyanide based on its reaction with 2,2-dihydroxy-1,3-indanedione was demonstrated (Drochioiu, 2002). In this assay, 1 mL of sample is mixed with 500 µL of 5 mg mL-1 solution of 2,2-dihydroxy-1,3-indanedione monohydrate in 2% sodium carbonate (pH=10). The absorbance of the purple color is measured at 510 nm, 10-15 min after mixing the reagents. As little as 0.01 µg mL-1 of cyanide could be detected. A 1000 fold molar excess of NO3
-, SO4= , S=, and
SO3= did not interfere with the detection of 0.5 µg mL-1 of CN-. The only interferent was
SCN-. For long-term monitoring purposes, it would be desirable to detect these anionic contaminants in situ and on-site so as to minimize sampling time and costs. The detection methods discussed above require the use of reagents, buffers, and mobile phases. This makes these technologies unattractive for use as a field analytical method to detect perchlorate, chromate, dichromate, and cyanide in situ. The ideal field deployable sensor
15
would be able to detect these toxic anions reversibly in the low ppb concentration range, in situ, on-site, with little or no sample preparation, and with no interferences. One technology that meets many of these criteria is surface-enhanced Raman spectroscopy (SERS) spectroscopy using cationic-coated silver substrates.
16
2. TECHNICAL OBJECTIVE The objective of this project is to demonstrate the detection of perchlorate, chromate, dichromate, and cyanide anions using cationic-coated SERS substrate. As shown in Figure 2, the coating attracts the anions to the SERS substrate where they are identified and quantified by their characteristic Raman emission. The cationic coating stabilizes the SERS substrate, thereby extending its lifetime and has a characteristic SERS spectrum, which can be used as an internal calibration standard. The advantages of this approach over conventional techniques are (1) the required information is obtained in real-time, (2) it doesn’t require the additional cost of an outside laboratory, and (3) decisions can be made in a timely fashion as to whether or not additional sampling is required and where that sampling is needed. In this effort, methods of improving selectivity and sensitivity are addressed as well as sensor design.
Figure 2. Schematic summarizing the technical objective.
7000
32000
57000
inte
nsi
ty
500 1000 1500
wavenumber (cm-1)
ClO4-
Cationic coated SERS substrate
Anions interact with coated substrate yielding the above SERS spectra
17
3. TECHNICAL APPROACH 3.1 Background Perchlorate, chromate, dichromate, and cyanide are polyatomic and exhibit Raman active vibrational modes, which are summarized in Table 1. Consequently, each one of these toxic anions will exhibit a characteristic Raman emission, which can be used for identification purposes. Besides specificity, simultaneous multicomponent analysis is possible due to the high resolution of Raman spectra. Raman spectra can be obtained remotely over optical fibers in real time and there has been significant advances in the development of inexpensive Raman spectrometers, charge-coupled devices, and diode lasers. However, despite these advances normal Raman spectroscopy is, inherently, an insensitive technique. In order to achieve ppb detection limits, the Raman signal needs to be enhanced. In the 1970s, it was discovered that Raman scattering from molecules adsorbed on such noble metals as silver, copper, and gold can be enhanced as much as 106 to 107. Table 1. Raman active vibrational modes of perchlorate, chromate, dichromate, and cyanide.
Cyanide CN- νC≡N = 2050-2250 Since its discovery, surface enhanced Raman scattering (SERS) spectroscopy has
been studied extensively to achieve a better understanding of the enhancement process. Because SERS provides both spectroscopic information and sensitivity, this technique has been shown to be useful for trace analysis. However, the substrates themselves degrade with time resulting in a decrease in signal. On silver and gold surfaces, thiols (R-SH) are known to self-assemble to form compact layers. These thiol coatings have been shown to protect the SERS substrates from surface deterioration thereby extending their lifetimes (Carron and Hurley, 1991). But this approach has an added advantage. The coating can be used to attract analytes of interest, which are then detected and identified by either their SERS response or by spectral changes observed in the SERS spectrum of the coating upon interaction. Using a disulfide modified 4-(2-pyridylazo)resorcinol (PAR) coating on silver, Crane et al. (1995) demonstrated ppb detection of Pb2+, Cd2+, and Cu2+. Octadecylthiol modified silver substrates gave ppm detection of BTEX (Carron, Peitersen, and Lewis, 1992) and chlorinated solvents (Carron and Mullen, 1994).
18
Figure 3. (A) SERS spectra of Ag/CY in the presence of 0, 25, 100, 500, and 1000 ppm
nitrate ion. Spectra obtained using 852 nm excitation and a 6 s acquisition time. (B) Nitrate peak area plotted as a function of nitrate concentration.
Figure 4. SERS response obtained for Ag/CY and 0.5, 1.0, and 5.0 ppm nitrate ion. Spectra obtained using 852 nm excitation and 60 s acquisition times. (A) SERS spectra are between 900 and 1200 cm-1. The spectral contributions of CY have been subtracted out. (B) Nitrate
peak area as a function of concentration. The LOD for nitrate is 224 ppb.
The success of using chemically modified SERS substrates to detect perchlorate, chromate, dichromate, and cyanide anions is dependent upon identifying a suitable thiol coating(s) to attract anions. These toxic anions are negatively charged, ergo they should be attracted to a positively charged thiol. A number of aliphatic, aromatic, and heterocyclic cationic thiols are commercially available. These thiols have been used successfully to detect nitrate and sulfate ion in the ppb-ppm concentration range (Mosier-Boss and Lieberman, 2000). Figure 3a shows SERS spectra obtained for the Ag/cysteamine (Ag/CY) system in the presence of nitrate ion. The evolution of the nitrate peak at 1036 cm-1 can clearly be seen as the anion interacts with the coating. The interaction between the coating and anion was found to be instantaneous and reversible. The concentration response of nitrate in the presence of a Ag/CY substrate is shown in Figure 3b. At low anion concentration, the nitrate peak area increases linearly with
19
concentration. At higher solution concentrations of nitrate, the response levels off as the adsorption sites on the substrate become fully occupied. The adsorption of these anions
onto these cationic-coated substrates is described by a Frumkin isotherm, θ
θ
θg
g
cKecKe
2
2
1+=
, where θ is the fractional coverage of the analyte on the coating, c is the solution concentration of analyte in M, K is the ion-pair constant between the anion and coating, and g is the Frumkin parameter. The Frumkin parameter takes into account interactions between the adsorbed species. The limit of detection (LOD) for the analyte is evaluated at the low concentration end of the adsorption isotherm. In the linear region of the
concentration response, m
LODσ3
= where σ is the uncertainty in the line intercept and m
is the slope of the line (Krull and Swartz, 1998). For the data summarized in Figure 3, the LOD, using a 6 s acquisition time, is 4.2 ppm. However, by increasing the acquisition time to 60 s, an LOD of 224 ppb nitrate was achieved, as shown in Figure 4. 3.2 Methods Commercially available cationic thiols are shown in Figure 5. For seven of the eight thiols shown in Figure 5, the positive charge is localized on the quaternary ammonium group, NR4
+. For MMP, the positive charge is dispersed through the aromatic ring. The ammonium groups of these thiols contain at least one proton, therefore they are considered to be weak bases and can only be used in solutions below pH ≅ 9. The cationic thiols shown in Figure 5 bind to silver and gold surfaces, through their sulfur group, to form self assembled monolayers, SAMs. The SERS response of silver substrates coated with CY, DMA, DEA, CYSE, and MMP has been obtained for nitrate and sulfate ions (Mosier-Boss and Lieberman, 2000). Because the cationic coating on the SERS surface is a molecular monolayer, the interaction with nitrate and sulfate was found to be instantaneous and did not require 15-60 min to equilibrate as was observed for the ion-exchange films used by Strauss (2001). In this effort, the SERS response of cationic-coated substrates to perchlorate, chromate, dichromate, and cyanide was measured using the cationic thiols shown in Figure 5. The cationic thiols shown in Figure 5 are very similar to the stationary phases used in ion chromatography. Consequently, the coatings interact simultaneously with different anionic species. These thiols are ionophores that possess no anion recognition functionalities, other than a positive charge. The ionophores respond simply on the basis of the anion’s lipophilicity, with the more lipophilic anions responding the best. Consequently, the strength of interaction of the cationic thiols will be stronger for those ions that exhibit a higher charge or a smaller solvated radius or greater polarizability. This gives rise to the following selectivity order, known as the Hofmeister series: large lipophilic anions > ClO 4
- > SCN - > I - > NO3- > Br - > Cl - > H2PO4
-
The advantage of using these ionophores is that, for anions exhibiting a Raman-active mode, multiple ionic species can be detected. However, quantification of those species would require knowing the values of the selectivity coefficients – just as is done when compensating for interferents when using ion-selective electrodes. However, the presence of competing anions can make it difficult to detect trace amounts of the desired analyte. In order to detect trace amounts of perchlorate, chromate, dichromate, and cyanide, the
20
Figure 5. Commercially available cationic thiols. selectivity of the coatings needs to be improved. Means of improving selectivity that were examined in this effort included (1) searching the literature to identify ionophores selective for these anionic species, (2) molecular imprinting techniques, and (3) chemical separation of the interferents using either solid phase extraction (SPE), supported liquid membranes (SLMs), or nanotubule technology. In addition to improved selectivity, the sensitivity of the SERS technique needs to be improved in order to detect trace amounts of perchlorate, chromate, dichromate, and cyanide. Using longer acquisition times will result in lower detection limits, as shown in Figure 4. It has been shown that the manner in which the SERS substrates are prepared affects the roughness of the substrates, which in turn affects the magnitude of the response (Norrod et al., 1997). For surfaces that are electrochemically etched, the roughness of the surface is affected by the current, the oxidative and reductive potential limits, and the number of oxidation-reduction cycles (ORCs). These parameters were optimized to prepare substrates that exhibit large,
reproducible SERS responses. Recently, it has been shown that enhancement factors on the order of 1014 to 1015 can be obtained for Ag and Au nanoparticles (Nie and Emory, 1997; Kneipp et. al., 1997). Such enhancement factors make single molecule detection possible. In this effort, the use of nanoparticle technology to increase sensitivity was examined as well as coupling the SERS technology with evanescent waveguide technology. The latter approach effectively lowers the detection limit by increasing the sample path length. For field use, the chemically- modified SERS substrate is housed in a sensor module that is integrated with a Raman spectrometry system. The design of the sensor module is dependent upon how the sensor will be deployed in the field. Out in the field, the SERS sensor module could be inserted into a sample of groundwater brought up to the surface or the SERS probe could be packaged in such a way that it could be lowered into a monitoring well directly. Sampling could then be done at several depths and the anions would be identified and quantified by their SERS response. Alternatively, the SERS sensor module could be placed inside a cone penetrometer sampling probe, such as ARA’s ConeSipper. During a push, the probe is stopped at selected depths and groundwater samples are taken inside the probe and analyzed using the downhole SERS sensor module. In addition, the SERS sensor can be deployed on towed bodies; buoys; or unmanned, underwater, autonomous vehicles to detect these anions in aquatic bodies.
22
4 SUMMARY
4.1 Detection of Toxic Anions Using Cationic-Coated SERS Substrates A description of the experimental procedures and instrumentation used to evaluate the interaction of cationic thiols with perchlorate, chromate, dichromate, and cyanide can be found in Appendix C. Normal Raman spectra of aqueous solutions of perchlorate, chromate, dichromate, and cyanide were obtained as a function of concentration. The measurements were done to determine the extent of ionic associations in solution. Such interactions can result in shifts in the vibrational bands as well as the emergence of new peaks. The interaction of these anions with the cationic coatings, Figure 5, on Ag and Au substrates was then evaluated by SERS. 4.1.1 Normal Raman Spectroscopy of Aqueous Solutions of Perchlorate, Chromate, Dichromate, and Cyanide
Figure 6 shows normal Raman spectra obtained for 104 ppm, aqueous solutions of perchlorate, chromate, dichromate, and cyanide. Normal Raman spectra of nitate, sulfate, and phosphate are also shown. The results summarized in Figure 6 indicate that these anionic species have at least one Raman active mode that can be used for detection. The resolution of the spectrometer is sufficient to differentiate the anionic species.
Figure 7 shows the concentration response for the seven anionic species. The concentration response for all seven anions is linear. Table 2 summarizes the LODs obtained for each species. The LODs vary between 84 and 2600 ppm. It should be noted that the spectral data were obtained using near IR excitation. The intensity of the Raman
Figure 6. Normal Raman spectra obtained for 104 ppm aqueous solutions of chromate, dichromate, perchlorate, cyanide, nitrate, sulfate, and phosphate. Experimental
parameters are summarized in Table 2.
CrO4-2
Cr2O7-2
ClO4-1
CN-1
300 900 1500 2100
wavenumber (cm -1)
NO3-1
SO4-2
PO4-3
300 900 1500 2100
wavenumber (cm -1)
23
signal exhibits a ν4 dependency, where ν is the frequency of the excitation source. Consequently, more intense Raman signals can be obtained using UV or visible excitation sources. However, these excitation sources will also stimulate fluorescence, which is 106 times stronger than Raman scattering. Both the inherent insensitivity of the Raman technique and fluorescence interference prohibit using normal Raman spectroscopy for the long-term monitoring of these anions.
Figure 7. Normal Raman concentration response of the anionic species.
Table 2. LODs and experimental parameters used to obtain spectral data summarized in Figures 6 and 7.
Anion Excitation Wavelength (nm) Acquisition time LOD (ppm) Nitrate 852 @ 50 mW 100 s 260 Sulfate 852 @ 50 mW 100 s 440
Perchlorate 785 @ 62 mW Average 5 spectra / 20 s 84 Chromate 785 @ 62 mW Average 5 spectra / 20 s 146
Dichromate 785 @ 80.2 mW Average 5 spectra / 20 s 239 Cyanide 785 @ 115 mW Average 10 spectra / 10 s 296
Phosphate 852 @ 50 mW 100 s 2600 4.1.2 SERS of Cationic-Coated, Silver/Gold Substrates and Aqueous Solutions of Perchlorate, Chromate, Dichromate, and Cyanide
Figure 8a shows SERS spectra of Ag/MMP obtained in the presence of increasing perchlorate concentration. The concentration response is shown in Figure 8c. At low anion concentration, the perchlorate peak area increases linearly with concentration. At higher solution concentrations of perchlorate, the response levels off as the adsorption
PO43-
ClO41-
SO42-
NO31-, CN1-
Cr2O72-
CrO42-
0
25000
50000
75000
100000
Ram
an in
ten
sity
0 3000 6000 9000 12000
anion concentration (ppm)
24
sites on the substrate become fully occupied. The adsorption of perchlorate is described by a Frumkin isotherm. The selectivities of the cationic coatings will be discussed in section 4.1.4. For Ag/MMP-perchlorate system, the LOD is 9.4 ppm.
Figure 8 (A) SERS spectra of Ag/MMP system in 0, 50, 750, and 10,000 ppm perchlorate. (B) SERS spectra of Au/MMP system in 0, 50, 750, and 10,000 ppm chromate. (C)
Ag/MMP-ClO4- isotherm where K = 1163± 56 and g= -2.51±0.21. (D) Au/MMP-CrO4
= isotherm where K = 2760± 150 and g= -2.80±0.18
In the presence of low concentrations of chromate and cyanide, the cationic
coatings on silver SERS substrates were observed to degrade. Figures 9a and b show the results obtained for silver substrates coated with CYSE and MMP, respectively. When immersed in water, the vibrational peaks of the coating on the substrates exhibit a strong SERS enhancement. However, in the presence of low concentrations of chromate, dichromate, and cyanide, significant degradation of the SERS signal was observed, Figure 9. Better results were obtained using gold SERS substrates. For aromatic thiols such as MMP above, no decrease in the signal of the thiol was observed in the presence of chromate, Figure 8b. The interaction between the coating and chromate was described by a Frumkin isotherm, Figure 8d. For the aliphatic coatings, it was observed that chromate interacted with the coating as evidenced by the appearance of the chromate peak at 850 cm-1, Figure 10a. However, as the concentration of chromate increased, the intensity of the coating peaks decreased and a new peak appeared at ~600 cm-1. It has been shown that chromate interacts with glutathione (GSH) (Meloni and Czernuszewicz, 1993) and other thiols (Mazurek, Nichols, and West, 1991) to form a thiol ester in which
C
D
0
25000
50000
75000
100000
ClO
4- p
eak
area
-0.005 0.018 0.041 0.064 0.087 0.110
M of perchlorate
0
50000
100000
150000
200000C
rO4=
pea
k ar
ea
-0.005 0.027 0.059 0.091
M of chromate
400 800 1200 1600
wavenumber (cm -1)
A
B
400 800 1200 1600
wavenumber (cm -1)
ClO4-
CrO4=
25
Figure 9. SERS spectra obtained for MMP (A) and CYSE (B) coated silver substrates in the presence of chromate. (A) The top spectrum was obtained in water and the
bottom in a 10 ppm chromate solution. (B) The top spectrum was obtained in water. The bottom two spectra were obtained in 10 and 25 ppm chromate.
the chromium binds to the sulfur atom:
GSH + CrO4 = → [GS-CrO3]- + OH- (1) This reaction would explain why the intensity of the coating peaks decrease with increasing chromate concentration. The new peak at 600 cm-1 could be due to the S-Cr stretch. Dichromate reacted with both aliphatic and aromatic cationic thiols on gold SERS substrates. The reaction was similar to that observed for chromate and the aliphatic thiols. In the presence of cyanide ion, a loss in the signal due to the cationic coating on silver substrates was observed as well as an increase in the fluorescent background. The decrease in signal is attributed to formation of Ag(CN)2-/Ag(CN)3= complexes. Better results were obtained using gold substrates. However, at high concentrations of cyanide (≥1000 ppm), a decrease in the SERS signal was also observed for the gold substrates. Ion pair constants could only be obtained for MMP and CYSE. One way to prevent chromate and dichromate from attacking the thiol group of the SAMs used in the investigation would be to use cationic thiols with longer alkyl groups between the thiol and the quaternary amine groups. Recently, Ji et al. (2001) reported using triethyl-12-mercaptododecylammonium bromide as a coating on a microcantilever sensor to detect chromate. There was no evidence of degradation of the SAM in the presence of chromate
A
400 800 1200 1600
wavenumber (cm-1)
B
26
ion. The use of thiols with longer alkyl chains may also protect the silver/gold surfaces from dissolution by cyanide.
Figure 10. (a) SERS spectra obtained for Au/CYSM in the presence of chromate. The SERS spectrum of the coating is indicated by the heavy black line. (b)
Concentration response of the 850 cm-1 (black line, solid circles) and the 600 cm-1 (gray line, open circles)
4.1.3 Characterization of the Interaction of non-Raman Active Ionic Species by Competitive Complexation
Ionic species that are not polyatomic, such as chloride ion, will not exhibit a Raman active mode. Other ionic species may have Raman active modes with poor Raman scattering cross-sections at the excitation wavelength. This is true of the phosphate ionic species. In these instances, the interaction between the coating and the ion can be evaluated by monitoring the spectral changes of the SERS spectrum of the coating. This
0
4x10⁵
8x10⁵
1x10⁶
peak
are
a
-1000 1750 4500
ppm of chromate
7250 10000
1x10⁴
4x10⁴
6x10⁴
inte
nsi
ty
450 850 1250 1650
wavenumber (cm-1)
A
B
27
approach was used to detect metal ions (Heynes et al., 1994; Crane et al., 1995). Heynes et al. (1994) showed that a thiol-derivatized dibenzo-18-crown-6 could be anchored to silver through the thiol group. By monitoring the changes of the SERS spectrum of the coating, the complexation constant of the crown-alkali metal complex, Kf, could be determined. The Kf and selectivity of the coating on silver to Li+, Na+, K+, Rb+, and Cs+ were measured and followed a trend similar to that observed for aqueous solutions. Crane et al. (1995) developed a SERS technique for the determination of Pb2+, Cd2+, and Cu2+ concentrations using a 4-(2-pyridylazo)resorcinol (PAR) coating modified with a disulfide. The disulfide portion of the molecule bonds to the silver substrate. The rest of the molecule is available for complexation with the metal ions. Atomic specificity was demonstrated by the distinct spectral changes that occurred through the interaction of Pb2+, Cd2+, and Cu2+ ions with the coating. The coordination of PAR with metal ions is pH dependent. At pH=6, the detection limits for Pb2+, Cd2+, and Cu2+ were 522, 50.3, and 1.49 ppb, respectively.
Figure 11. Spectra (A) and concentration response (B) for the Ag/CY/NO3- system as a
function of chloride ion. Nitrate concentration is 1000 ppm. Solution pH is 5.0. As shown in Figures 3a and 8, minimal changes are observed upon ion pairing. In
these instances, the ion pair constant can be evaluated using a competitive complexation approach. Competitive complexation was used to examine the interaction of chloride ion and cationic-coated silver substrates (Mosier-Boss, Boss, and Lieberman, 2000; Mosier-Boss and Lieberman, 2001). Figure 11a shows SERS spectra obtained for the Ag/CY/nitrate system in the presence of chloride ion concentration. As the chloride ion concentration increases, the intensity of the nitrate ion decreases indicating that both chloride ion and nitrate ion interact with the cationic coating on the SERS substrate. Figure 11b is a plot of nitrate peak area as a function of chloride ion. For two competing ionic species, it can be shown that the concentration response shown in Figure 11b is described by the following relationship:
Cl
ClNO C
VCA
+=∆
κ3 = A0 - ACl (2)
where A0 and ACl are the areas of the nitrate peak in the absence and presence of chloride ion, respectively, and CCl is the chloride ion concentration in M. In equation 1, V and κ are defined as
2x10⁵
3x10⁵
4x10⁵
5x10⁵
inte
nsi
ty
500 1000 1500
wavenumber (cm -1)
NO3-
0.00 1.00 2.00 3.00 4.00
wt% NaCl solution
0.0
5.0x10⁵
1.0x10⁶
1.5x10⁶
2.0x10⁶
2.5x10⁶
nit
rate
pea
k ar
ea B
A
28
))2(exp(1
))2(exp(
0333
0333
θθα
NONONO
NONONO
gKCgKC
V+
= = αθ0 (3)
and
))2(exp(
))2(exp(1
0
0333
θθ
κClCl
NONONO
gKgKC+
= (4)
where θ0 is the surface coverage of nitrate ion in the absence of chloride ion, α is a proportionality constant, CNO3 is the solution concentration of nitrate ion in M, KNO3 is the ion pair constant between the coating and nitrate ion, KCl is the ion pair constant between the coating and chloride ion, and g is the Frumkin parameter. Chloride ion and nitrate ion have identical charge and are of similar size (chloride has an ionic radius of 181 pm and nitrate’s ionic radius is 179 pm). Their Gibb’s free energies of hydration (∆Ghyd ) are also similar (chloride is -340 kJ mol-1 and nitrate is -300 kJ mol-1 ) indicating that chloride and nitrate have similar solvation properties in water. Consequently, it is not unreasonable to assume that the value of the Frumkin parameter, g, will be approximately the same for both nitrate and chloride ions. Assuming g is the same for chloride and nitrate ions and knowing the values of κ, KNO3 , and CNO3, KCl can be calculated. For two competing anionic species, m and n where n has a Raman active vibrational mode, equations 2-4 can be expressed more generally as:
m
mn C
VCA
+=∆
κ = A0 – Am (5)
))2(exp(1
))2(exp(
0
0
θθα
nnn
nnn
gKCgKC
V+
= = αθ0 (6)
and
))2(exp(
))2(exp(1
0
0
θθ
κmm
nnn
gKgKC+
= (7)
The competive complexation approach, summarized in equations 4-6, was used to
evaluate the interaction of anionic species that do not exhibit a Raman active vibrational mode with the cationic thiol- coated SERS substrates. 4.1.4 Selectivities of the Cationic-Coated SERS Substrates The ion-pair constants obtained for the cationic thiols shown in Figure 5 and the anions investigated are summarized in Tables 3-5. The aromatic thiol ATB did not interact with any of the anions. This lack of interaction is attributed to steric hindrance. ATB adsorbs onto the silver/gold surface through its sulfur atom. This will place the amine group in close proximity to the silver/gold surface facilitating adsorption through the amine group. Such adsorption has been reported for 2-mercaptopyridine (Pang, Hwang, and Kim, 1998). For MMP, the selectivity is CrO4
= ~ NO3- > ClO4
- > Cl- > CN- >> H2PO4
-. An earlier SERS study of 2-mercaptopyrimidine (2-MPM) indicated that 2-MPM lies flat on the surface with three heteroatoms bonding with the surface (Pang, Hwang, and Kim, 1998). Because similar spectral changes were observed for MMP upon adsorption on silver, it can be concluded that MMP has a flat orientation on the silver
29
surface. The stability of the interaction with NO3- is attributed to π-π interactions. Nitrate
is a planar molecule with π-orbitals. Likewise MMP is a planar, aromatic compound with π-orbitals of the appropriate symmetry to interact with the π-orbitals of nitrate ion. This notion is supported by the SERS spectral data. It is observed that the intensity of the peak due to the symmetric ring breathing mode of MMP at 984 cm-1 increases with increasing nitrate concentration, indicating that π-π interactions are occurring between the nitrate ion and MMP (Mosier-Boss and Lieberman, 2000). Table 3. Summary of ion-pair constants (M-1) and Frumkin parameters for cysteamine thiol derivatives and selected anions as determined by SERS.
Anion CY DMA DEA Nitrate K=382±60;
g=-0.30±0.25 K=301±78; g= -2.3±1.1
K=228±29; g= -1.22±0.30
Sulfate K=1620±320; g= -0.37±0.23
K=972±85; g= -1.14±0.13
K=770±100; g= -0.07±0.12
Chloride K=146±23; g= -0.30±0.23
K=310±180; g= -2.3±1.1
K=107±20; g= -1.22±0.30
Dihydrogen phosphate
No interaction No interaction No interaction
Perchlorate K=6150±830 g= -1.10±0.15
K= 404±59 g= -0.64±0.21
K= 4950±250 g= -2.42±0.10
Chromate Forms a thioester Forms a thioester Forms a thioester Dichromate Forms a thioester Forms a thioester Forms a thioester Cyanide Reacts with Ag/Au
substrate Reacts with Ag/Au substrate
Reacts with Ag/Au substrate
Table 4. Summary of ion-pair constants (M-1) and Frumkin parameters for cysteine thiol derivatives and selected anions as determined by SERS.
Anion CYS CYSM CYSE Nitrate No interaction K=307±15;
g= -1.20±0.11 K=513±85; g= -2.06±0.44
Sulfate No interaction No interaction No interaction Chloride Could not evaluate K=36600±6800;
g= -1.20±0.11 K=1190±260; g= -2.06±0.44
Dihydrogen phosphate
No interaction No interaction No interaction
Perchlorate No interaction K=7380±450 g= -2.71±0.10
K=4650±500 g= -2.14±0.18
Chromate Forms a thioester Forms a thioester Forms a thioester Dichromate Forms a thioester Forms a thioester Forms a thioester Cyanide Reacts with Ag/Au
substrate Reacts with Ag/Au substrate
K=700±100 g= 0.17±0.20
30
Table 5. Summary of ion-pair constants (M-1) and Frumkin parameters for aromatic and heterocyclic thiol derivatives and selected anions as determined by SERS.
Anion MMP MEP ATB Nitrate K=2370±200;
g= -2.58±0.15 No interaction No interaction
Sulfate Spectral interference
No interaction No interaction
Chloride K=596±77; g= -2.58±0.15
K=92±22; g= 1.35±0.24
Could not evaluate
Dihydrogen phosphate
No interaction No interaction No interaction
Perchlorate K=1163±56 g= -2.51±0.21
K=38±11 g= 1.35±0.24
No interaction
Chromate K=2760±150 g= -2.80±0.18
K=142800±7700 g= -2.068±0.063
No interaction
Dichromate Forms a thioester Forms a thioester Forms a thioester Cyanide K=146±22;
g= 0.71±17 K=1090±340 g= 0.14±0.30
Reacts with Ag/Au substrate
The results summarized in Tables 3 and 4 indicate that chemical modification of
the cationic coatings can affect their selectivities. The thiols DMA, DEA, CYS, CYSM, and CYSE are essentially chemical derivatives of CY. In these chemical derivatives of CY, either the quaternary ammonium group of CY or the hydrogens on the carbon adjacent to the quaternary ammonium group have been altered, Table 6. The strength of interaction for CY with the anions, Table 3, follows the Hofmeister series: ClO 4
- >> SO4=
> NO3- > Cl- >> H2PO4
-. The strength of interaction for DEA also follows the Hofmeister series. However, CY interacts more strongly with the anions than DEA. The decrease in interaction between the anions and DEA is attributed to dispersion of the positive of the ammonium group into the ethyl groups. This results in a decrease in the charge density of the quaternary ammonium group of DEA. In the case of DMA, the strength of interaction with the anions varies SO4
= > ClO4- > NO3
- ~ Cl- >> H2PO4-. These results for DMA
were rather surprising and indicate that other factors, possibly hydrogen-bonding capability, are involved in its selectivity. Formation of C-H···O hydrogen bonds have been shown to occur and that the hydrogen bond donor strength of methyl groups R-CH3 depend on the nature of R (Desiraju, 1996). As will be discussed later, hydrogen bonding plays a significant role in the anion selectivity of ionophores. CYS did not interact with SO4
= , ClO4-, NO3
-, Cl-, or H2PO4-, Table 4, indicating that the carboxylate group repels
these anions. Esterfication of the carboxylate group to form CYSM results in the following selectivity Cl-> ClO4
- > NO3->> SO4
=, H2PO4- while CYSE has a selectivity of
ClO4-> Cl > NO3
->> SO4=, H2PO4
-. The differences in selectivity compared to CY is attributed to sterics and/or the lipophilic nature of the methyl/ethyl group of the ester moiety. In order to interact with the ammonium group of CYSM/CYSE, the anions have to partition between the methyl/ethyl groups of adjacent CYSM/CYSE molecules to get access to the quaternary ammonium group. Due to sterics, the anions have to shed their
31
hydration shells. Shedding their hydration shell, besides requiring energy, will result in a higher charge density for the anions, which will increase the repulsive forces between the anions and the methyl/ethyl groups of adjacent CYSM/CYSE molecules on the SERS surface. The interaction of chloride ion with CYSM is an order of magnitude greater than the interaction with CYSE. This is attributed to hydrogen bonding between the chloride ion and the methyl group of the ester moiety (Allerhand and von Ragué Schler, 1963; Taylor and Kennard, 1982). Table 6. Summary of the modifications of CY to yield the chemical derivatives DMA, DEA, CYS, CYSM, and CYSE.
Thiol Modification to CY DMA -NH(CH3)2
+
DEA -NH(CH2CH3)2+
CYS -CH(COOH)-NH3+
CYSM -CH(COOCH3)-NH3+
CYSE -CH(COOCH2CH3)-NH3+
4.2 Improving Selectivity The ability to detect and differentiate anionic species using cationic-coated SERS substrates has been demonstrated. Selectivity of the cationic thiols shown in Figure 5 is given by the Hofmeister series. Consequently, detection of trace amounts of the desired analyte using the cationic coatings shown in Figure 5 would be obscured by the presence of competing anionic species. There are two approaches to improve the selectivity of the SERS technique. One approach requires using coatings that are selective for the desired analyte. The other approach requires removal of the interferences prior to detection of the desired analyte. 4.2.1 Identify/Fabricate Selective Ionophores
The ion-pair constants of CY and its chemical derivatives summarized in Tables 3 and 4 clearly indicate that the cationic coatings can be chemically modified to alter their selectivities. It is expected that molecular orbital modeling will aid in predicting the effect chemical modifications have on the selectivities. Alternatively, ionophores selective for the anion can be used in its detection. Many synthetic ionophores for inorganic cations have been developed for use in ion selective electrodes (ISEs) as well as voltammetric and optical sensors (Bühlmann et al., 1998). Noncovalent anion coordination chemistry has been relatively slow to develop in comparison with hosts for cations and even neutral molecules (Steed and Atwood, 2000). While anion hosts obey the same general rules that govern the magnitude of binding constants and host selectivity in cation hosts (primarily preorganization, complementarity, and solvation), their application is made more difficult because of some of the intrinsic properties of anions:
• Anions are relatively large and therefore require receptors of considerably greater size than cations • Even simple inorganic anions occur in a range of shapes and geometries, e.g., spherical (halides), linear (SCN-), planar (NO3
-), tetrahedral (SO4=, PO4
-3), octahedral (PF6
-), etc.
32
• In comparison to cations of similar size, anions have high free energies of solvation. Consequently anion hosts must compete more effectively with the surrounding medium. • Many anions exist only in a relatively narrow pH window • Anions are usually saturated coordinatively and therefore bind only via weak forces such as hydrogen bonding and van der Waals interactions.
Despite these challenges, there have been recent efforts to develop ionophores for inorganic and organic anions. These efforts have been summarized in a number of review articles (Bühlmann, Pretsch, and Bakker, 1998; Schmidtchen and Berger, 1997). However, these efforts have primarily concentrated on discovering ionophores for SO4
=, NO3
-, Cl- , CO3= , NO2
-, ClO4-, and H2PO4
- to be used in ISEs. As such, the ionophores are used as carriers in membranes. The membranes are comprised of the ionophore, a polymeric matrix, such as polyvinyl chloride (PVC), and a plasticizer, such as 2-nitrophenyl octyl ether (o-NPOE). Incorporating the ionophore in a membrane can change the selectivity, as was demonstrated by Xiao et al (1997, 1999). In solutions of DMSO, it was shown that a neutral bis-thiourea ionophore formed strong complexes with strong hydrogen bond acceptors, such as dihydrogen phosphate, acetate, or chloride but weak complexes with weak hydrogen bond acceptors such as hydrogen sulfate, perchlorate, or nitrate. A monolayer of the ionophore on a carbon electrode was selective for the hydrophilic HPO4
2-/H2PO4-. The strength of interaction decreased in the order
H2PO4- > F- ≅ SO4
= > CH3COO- > Cl- . The stability of the interaction with H2PO4- was
attributed to the formation of hydrogen bonds between the oxygen atoms of the anion and the thiourea groups of the receptor. However, incorporating the ionophore in a solvent polymeric membrane resulted in a sensor specific for chloride ion. The selectivity of the solvent polymeric membrane ISE based on the bis(thiourea) ionophore was attributed to the free energies of phase transfer of the anions from the aqueous sample into the organic ISE membrane phase. As a consequence of its lower hydration energy, transfer of chloride from the sample into the membrane phase was energetically more favorable than the phase transfer of phosphate. The results indicated that the selectivity of phosphate binding by the ionophore was not large enough to counterbalance the large difference in the phase transfer energies of the two ions. The results of Xiao et al (1997, 1999) indicate that there is no guarantee that the ionophore in a solvent polymeric membrane will exhibit the same selectivity as a SAM of the ionophore. Consequently, care must be exercised when evaluating the potential use of these anionic ionophores for SERS. A literature survey of potential ionophores for perchlorate, cyanide, chromate, and dichromate was conducted.
A diathiamacrocycle with a phosphine group, Figure 12a, dissolved in o-NPOE has been used as the carrier in PVC membranes on chemically sensitive field effect transistor (CHEMFET) sensors and ion selective electrodes to detect perchlorate (Casabó et al, 1996; Errachid et al, 1997). 31P NMR studies indicated that, inside the membrane, the ionophore exists in the oxidized form. It is believed that the ion-dipole interactions between perchlorate and the P=O group may be responsible for the perchlorate selectivity. Only BF4
- and SCN- were found to be significant interfering anions. Other common anions, such as SO4
=, NO3-, Cl- , CO3
= , and NO2-, did not interfere. A molecular
orbital model of the perchlorate complex with the ionophore is shown in Figure 12b. The molecular structure of the complex was calculated using the B3LYP density functional
33
model and a 6-31G* Gaussian basis set. The B3LYP model accounts explicitly for non-uniformity in electron distributions and also incorporates the Hartree-Fock exchange term. The model indicates that hydrogen bonding, indicated in Figure 12b, contributes to the perchlorate selectivity. In order to bind the ionophore to the SERS substrate, a hydrogen on one of the aromatic groups has to be replaced with a thiol group. However, there is the possibility that the sulfurs in the macrocyclic ring will bind to the SERS substrate, which could affect the selectivity of the ionophore. Also, the ionophore has to be in the oxidized state in order to show selectivity for perchlorate. As a SAM on a Ag substrate, the ionophore may not exist as the oxidized form. It has been demonstrated that polymer coated SERS substrates can be used to detect organic compounds in water (Pal et. al., 1995). It may be possible to dissolve the ionophore, plasticizer (o-NPOE), and PVC in a methanol and use this solution to coat a SERS-active substrate. The resultant polymer-coated SERS substrate should be selective for perchlorate.
Figure 12. (A) Structure of the ionophore for perchlorate ion. The ionophore is
incorporated in PVC membranes used to coat CHEMFET sensors (Casabó et al, 1996). (B) Molecular orbital model (B3LYP/6-31G*) of the perchlorate complex with the ionophore.
Hydrogen bonds are indictaed (…..) .
Cyanide ion has the capability to bind to the iron protoporphyrin sites of heme proteins such as myoglobin and hemoglobin, which can also bind to CO, CO2, O2, and
A
B
34
NO (Cosnier et. al., 2000; Siontorou and Nikolelis, 1997). However, when hemoglobin is converted to methemoglobin, the iron protoporphyrin site loses its ability to bind to CO and O2. Reaction of methemoglobin with cyanide results in the formation of a cyanmethemoglobin complex, which is extremely stable. Incorporation of methemoglobin into a self-assembled bilayer liquid membrane (s-BLM) on a metal support resulted in a sensitive cyanide ion sensor (Siontorou and Nikolelis, 1997). Anions such as NO3
-, SO4=, SCN-, I-, and S= did not interfere with the detection of CN-. However,
the heme proteins are bio-degradable and these sensors exhibit a longevity on the order of 48 h.
Pyridinium derivatives form strong, stable complexes with CrO4= and Cr2O7
=. As discussed vida supra, Turyan and Mandler (1997) used a SAM of 4-(2-mercaptoethyl)-pyridinium to detect these CrVI species electrochemically. The only interference was MoO4
=, presumably due to its similar structure and size. They also observed that a 106 excess of Cu2+ and MnO4
= resulted in a 19 and 6% decrease in the cathodic square wave peak current, respectively, indicating that these ionic species weakly interact with the SAM. Baldwin et al (1996) examined the interaction of Cu2+ with a 4-mercaptopyridine SAM on silver using SERS. They observed changes in the vibrational spectra of the SAM in the presence of Cu2+, indicative of complexation. However, they did not use the spectral changes to measure the formation constant of the complex between the SAM and Cu2+.
Figure 13. (A) SERS spectra of Au/MEP system as a function of chromate concentration.
(B) Au/MEP-CrO4= isotherm where K = 142800± 7700 and g= -2.068±0.063. (C) SERS
spectra of Ag/MEP system as a function of perchlorate concentration. (D) Ag/MEP-ClO4-
isotherm where K = 38± 11 and g= 1.35±0.24.
ClO4-
600 1150 1700wavenumber (cm-1)
14000
36000
58000
inte
nsi
ty
350.0 1025.0 1700.0wavenumber (cm-1)
17000
33000
49000
inte
nsi
ty CrO4=
-0.005 0.050 0.105
CrO4= concentration (M)
20000
100000
180000
CrO
4= pea
k ar
ea
0.000 0.060 0.120ClO4
- concentration (M)
0
7000
14000
ClO
4- p
eak
area
A C
B D
35
The SERS technique was used to evaluate the selectivity of MEP. Figures 13a and c show the spectral data obtained for MEP in the presence of chromate and perchlorate, respectively. The corresponding isotherms are shown in Figures 13b and d. The ion-pair constants for these and other anions are summarized in Table 5. The selectivity of MEP is CrO4
= >>> CN- >> Cl- > ClO4- >>> NO3
- ~ SO4= ~ H2PO4
-. As discussed vide supra, Cr2O7
= reacted with the coatings, including MEP, to form thioesters. The results summarized in Table 5 indicate that MEP is highly selective for CrO4
=. Turyan and Mandler (1997) attributed the high CrVI selectivity of MEP to its hydrogen bonding capabilities. Molecular modeling of the chromate complex with Au/MEP was done using the B3LYP/LACVP* model. The calculated structure of the complex is shown in Figure14. Molecular modeling indicates that formation of the Au/MEP·CrO4
= complex is energetically favorable. The calculated structure of the complex, Figure 14, shows that one of the oxygen atoms of chromate bonds to the proton on the nitrogen atom of the pyridine ring. The N-H bond elongates from 0.999Å in the Au/MEP structure to 2.366Å in the complex. The N-H-O1 bond angle is 163.36°, which places the O4 and O3 atoms of the chromate moeity in close proximity to the hydrogen atom on C1 of the pyridine ring. The O3-H and O4-H bond lengths are 3.063Å and 2.097Å , respectively, suggesting that both chromate oxygens hydrogen bond to the C1 hydrogen.
Figure 14. Computer gene rated structures and electrostatic potential maps of Au/MEP and the Au/MEP · CrO4
= complex. These structures were obtained using the B3LYP/LACVP* method. Hydrogen bonds are indicated (…..) .
O1
O2 O3
O4
N
C1
Au/MEP Au/MEP · CrO4=
complex
36
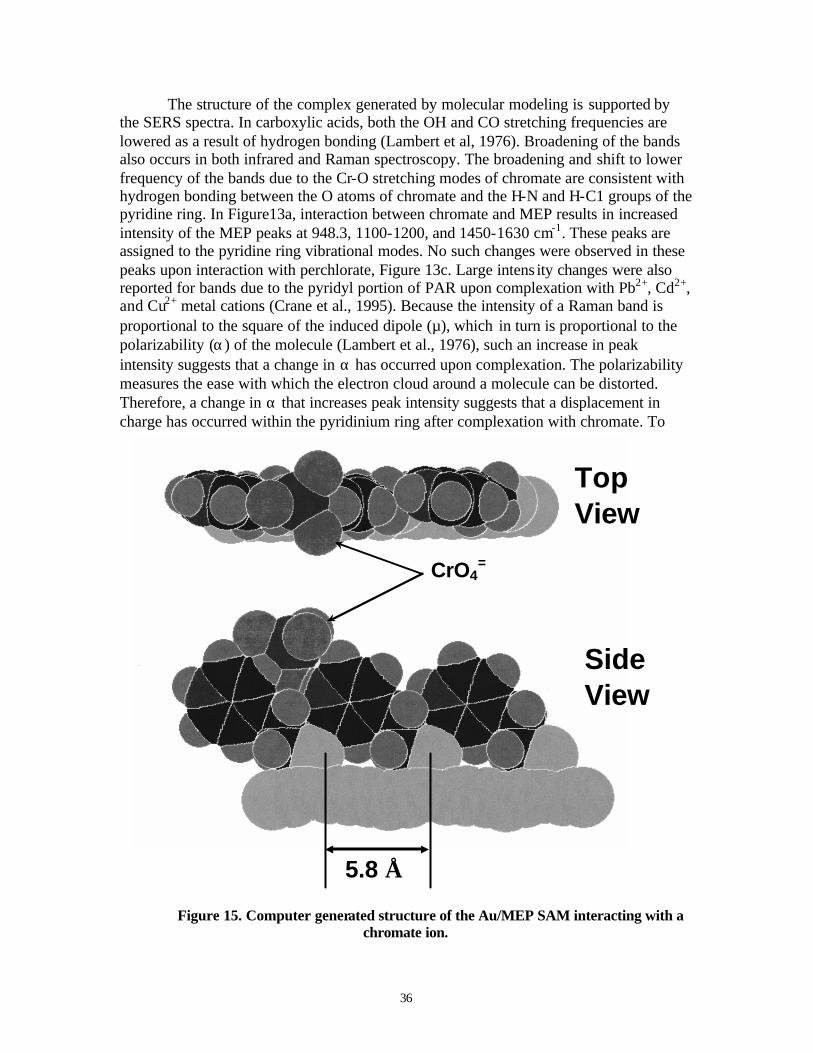
The structure of the complex generated by molecular modeling is supported by the SERS spectra. In carboxylic acids, both the OH and CO stretching frequencies are lowered as a result of hydrogen bonding (Lambert et al, 1976). Broadening of the bands also occurs in both infrared and Raman spectroscopy. The broadening and shift to lower frequency of the bands due to the Cr-O stretching modes of chromate are consistent with hydrogen bonding between the O atoms of chromate and the H-N and H-C1 groups of the pyridine ring. In Figure13a, interaction between chromate and MEP results in increased intensity of the MEP peaks at 948.3, 1100-1200, and 1450-1630 cm-1. These peaks are assigned to the pyridine ring vibrational modes. No such changes were observed in these peaks upon interaction with perchlorate, Figure 13c. Large intens ity changes were also reported for bands due to the pyridyl portion of PAR upon complexation with Pb2+, Cd2+, and Cu2+ metal cations (Crane et al., 1995). Because the intensity of a Raman band is proportional to the square of the induced dipole (µ), which in turn is proportional to the polarizability (α) of the molecule (Lambert et al., 1976), such an increase in peak intensity suggests that a change in α has occurred upon complexation. The polarizability measures the ease with which the electron cloud around a molecule can be distorted. Therefore, a change in α that increases peak intensity suggests that a displacement in charge has occurred within the pyridinium ring after complexation with chromate. To
Figure 15. Computer generated structure of the Au/MEP SAM interacting with a chromate ion.
CrO4=
Top View
Side View
5.8 Å
37
verify this, the electrostatic potential maps for Au/MEP and the Au/MEP·CrO4
= complex were calculated and are shown in Figure 14. The electrostatic potential is a function describing the energy of interaction of a positive charge with the nuclei and fixed electron distribution of a molecule (Hehre et al., 1998). The electrostatic potential map is a graph that shows the value of electrostatic potential on an electron density isosurface corresponding to a van der Waals surface. In the greyscale electrostatic potential maps shown in Figure 14, the darker the color the greater the potential. For both Au/MEP and the Au/MEP·CrO4
= complex, the negative electrostatic potential resides on the sulfur atom. For Au-MEP, the positive electrostatic potential is evenly distributed through the pyridine ring. However, in the complex, the positive potential is shifted towards the chromate moeity of the complex. The resultant displacement in charge could account for the change in polarizability of the pyridinium ring.
Additional molecular modeling of the MEP SAM was done to determine the effect of adjoining MEP molecules on the complexation with chromate. The results are summarized in Figure 15. It can be seen that chromate is able to form hydrogen bonds with the adjoining MEP moiety on the gold surface. Modeling indicates that there are essentially microcavities present between adjacent MEP moeities on the surface with a three-dimensional structure complementary in both shape and chemical functionality to that of the chromate ion.
Figure 16. SERS response obtained for Au/MEP and 0.1-1.0 ppm chromate. (A) SERS spectra between 750-950 cm-1. The spectral contributions of MEP have been subtracted out.
(B) Chromate peak area as a function of concentration. The solid line is calculated using the values of K and g, Table 5.
The MEP-coated gold electrochemical sensor described by Turyan and Mandler
(1997) exhibited great sensitivity. SERS spectra of Au/MEP in the presence of low chromate concentrations (0.1 to 1.0 ppm) were obtained. The results are summarized in Figure 16. Spectra were obtained by averaging five 20 s acquisitions. As shown in Figure 16a, the chromate peak for the 0.1 ppm solution can be easily seen. Figure 16b shows a plot of chromate peak area as a function of concentration. The solid line is the isotherm calculated using K and g for the MEP-chromate complex, Table 5. The LOD was evaluated in the linear region of the curve and is 59.3 ppb.
area
0
60000
120000
180000
240000
300000
0.000000 0.000005 0.000010
concentration of CrO4= (M)
0
5000
10000
15000
20000
25000
inte
nsi
ty
750 800 850 900 950
wavenumber (cm-1)
A B
38
4.2.2 Molecular Imprinting Molecular imprinting is a technique for constructing tailor-made receptor binding
sites in a three-dimensional, cross- linked polymer matrix. The result is the preparation of polymers having a high affinity for a target molecule (Jie and Xiwen, 1999; Al-Kindy et al., 2000). The process involves three key steps: (1) complex formation of the template (print) molecule with the functional monomers (prearrangement step) in a solution containing a high ratio of cross-linker, (2) co-polymerization of the mixture in an inert solvent to form a rigid polymer, and (3) removal of the template molecule, by hydrolysis or extraction, to afford the imprinted polymer. The resulting molecularly imprinted polymers (MIPs) are macroporous matrices possessing microcavities with a three-dimensional structure complementary in both shape and chemical functionality to that of the template. The high degree of cross- linking enables the microcavities to maintain their shape after removal of the template. As a result, the functional groups are held in an optimal configuration for rebinding the template, allowing the receptor to ‘recognize’ the original substrate. These polymers exhibit a tremendous thermal, chemical, and mechanical stability besides having selectivity similar to that of natural systems. Imprinted polymers have been used as substitutes for antibodies in competitive binding assays. The thickness of the polymer film has to be carefully controlled to ensure that the flux of permeate across the membrane is high. The film thickness needs to be thick enough to be free of defects, such as pinholes, but not too thick as to decrease the response time to the analyte. Also the film thickness has to be optimized to take into account the fact that the SERS response of the analyte decreases with increasing distance from the SERS active surface.
The use of polymer-coated SERS substrates to detect organic compounds was demonstrated by Pal et. al. (1995) and Stokes et al (1999). Polyvinylchloride (PVC) coated silver SERS substrates were prepared by dipping the substrates in methanolic solutions of the polymer and allowing them to air dry under ambient conditions. The polymer film protected the SERS substrates from degradation extending their lifetimes from days to months. In addition to prolonging the shelf- life of the SERS-active substrates, it was shown that the polymer coating attracted compounds such as benzoic acid and 2,4-dinitrophenol that were identified/quantitated by their characteristic SERS response. Because the polymer coatings protect the SERS surface and provides some chemical selectivity, it has been suggested that these modified substrates could be used as passive personal dosimeters. While the PVC polymers had not been ‘imprinted’, these studies indicate that polymer-coated SERS substrates can be used as sensors. It is expected that the molecular imprinting technique would improve the selectivity of the SERS-based sensors. A nitrate-selective electrode was prepared by electrochemically mediated impinting of polypyrrole on a glassy carbon electrode (Hutchins and Bachas, 1995). Earlier it was shown that the electropolymerization conditions can control the size selectivity in polypyrrole films. By polymerizing pyrrole in the presence of NaNO3, a film was produced with pores that are complementary to the size of the targeted analyte ion. Both the size of the pore and the charge distribution within the polymerized film form a cavity for nitrate. The electropolymerization variables (constant current vs. potential approach, electropolymerization time, pyrrole and electrolyte concentration, etc.) affect the film morphology and, consequently, the chemical recognition properties of
39
the polypyrrole film. It was found that polymer films prepared using a constant current technique (I =100µA, 1.0 M pyrrole, 0.1 M NaNO3, 20 min electropolymerization time) responded better to nitrate and had a very reproducible response than films prepared by the constant potential method. The selectivity of conventional nitrate selective electrodes follows the Hofmeister series: ClO 4
- > SCN - > I - > NO3- > Br - > Cl - > H2PO4
-. Consequently, perchlorate and iodide are strong interferents for conventional nitrate selective electrodes. By means of size exclusion, the electrodes prepared by electrochemically mediated imprinting pyrrole responded preferentially to nitrate over the larger perchlorate and iodide ions. However, thiocyanate is similar in size to nitrate and remains an interferent. In an unrelated experiment, Liu et al. (2000) electropolymerized pyrrole on a roughened gold electrode and showed that they could obtain SERS spectra of the polymer, as well as the nitrate dopant, as a function of applied potential. The selectivity for nitrate of the polypyrrole films prepared by Hutchins and Bachas (1995) was primarily due to size exclusion. Anions of similar or smaller size would still interfere. Greater selectivity would be achieved by preparing specific receptor sites in the cross- linked polymers. As described vide supra, this requires formation of a complex between the target anion and the monomer followed by polymerization in the presence of crosslinking agents. For example, a molecularly imprinted polymer prepared using 2-aminopyridine as the template molecule and methacrylic acid as the functional monomer exhibited high affinity for 2-aminopyridine (Jie and Xiwen, 1999). 1H NMR and UV-Visible spectrophotometric studies indicated that the selective binding interaction between the template and binding sites in the polymer arose from their cooperative hydrogen-bonding as shown in Figure 17. In order to improve selectivity of imprinted polymer films to perchlorate, chromate, dichromate, and cyanide, monomers must be identified that form complexes with these anions.
Figure 17. Schematic of the cavity in an imprinted polymer selective for 2-aminopyridine (2-Apy). The cavity possesses the shape and arrangement of functional
groups corresponding to that of the template (2-Apy).
4.2.3 Removal of Interferences
Three separation schemes are examined. These are solid phase extraction (SPE), supported liquid membranes (SLMs), and nanotubule technology.
Cavity in polymer
Methacrylic acid (MAA)
2-aminopyridine (2-Apy)
40
4.2.3.1 Solid Phase Extraction (SPE). In ion chromatography, ionic interferences may co-elute or mask peaks of interest, overload the column, or bind irreversibly to the column packing thereby shortening its useful life. Solid phase extraction is used to eliminate many of these interferences prior to ion analysis. There are commercially available SPE cartridges to remove transition metals and divalent cations; surfactants, organic acids, and other organic substances; sulfate ion; and halide ion (Henderson, Saari-Nordhaus, and Anderson, 1991). Sulfate is removed through the formation of BaSO4 . To remove halides, SPE cartridges (Maxi-Clean IC-Ag, Alltech) contain sulfonic acid cation exchange resin in the Ag+ form. The silver contained on the packing reacts with halides in the sample to form an insoluble salt (silver halide). In this process, cations from the sample are taken up by the resin to replace the silver consumed in the precipitation reaction. The net result is removal of halides, and an equivalent amount of sample cations, from the matrix. This process has been shown to have little or no effect on sample anions that form soluble silver salts such as fluoride, nitrate, nitrite, phosphate, and sulfate. When high concentrations of halides are present in a sample, low levels of other anions may be lost during SPE. This loss is attributed to the inclusion of the other anions in the precipitating silver halides.
Figure 18. Spectra (A) and concentration response (B) for the Ag/CY/NO3- system as a
function of chloride ion after SPE. Nitrate concentration is 1000 ppm. Solutions prepared using reagent grade sodium chloride. The 0 wt% NaCl solution was not extracted. Solution
pH is 5.0. Because chloride ion is an ubiquitous anionic species, experiments were
conducted to determine the effectiveness of IC-Ag SPE cartridges in removing chloride ion interference in the detection of nitrate by SERS (Mosier-Boss and Lieberman, 2001). Solutions containing 1000 ppm nitrate and chloride ion concentration ranging from 0-3 % were extracted. The eluates had a slight purplish-blue cast suggestive of the presence of colloidal silver. The presence of silver ion in the eluant was verified by the addition of chloride ion. The SERS results are summarized in Figure 18. Not only did the IC-Ag SPE cartridges remove the chloride ion, but a significant enhancement in the nitrate signal is observed. The horizontal dashed line in Figure 18b represents AT , where AT ∝ NT and NT is the total number of sites available for complexation on the substrate. Consequently, AT is the theoretical maximum peak area. However, as shown in Figure
NO3-SO4
=
A
BNO3
-
0.0 1.0 2.0 3.0
wt% NaCl solution
0
2x10⁶
4x10⁶
6x10⁶
anio
n pe
ak a
rea
SO4=
2x10⁵
3x10⁵
4x10⁵
5x10⁵
inte
nsity
500 1000 1500
wavenumber (cm-1)
41
18b, the observed nitrate peak area is greater than AT after SPE. In addition, with higher chloride ion concentration, the emergence of a peak due to sulfate ion, Figure 18a, is observed. The sulfate ion peak increases with increasing chloride ion concentration. While the response due to nitrate ion was enhanced, no enhancement in the SERS signal of the coating was observed.
Additional experiments showed that the source of the sulfate ion was the reagent grade sodium chloride (contains ≤ 0.004% sulfate) used to prepare the solutions. For a contaminant level of ≤ 0.004% sulfate, the maximum amount of sulfate present in the 3% sodium chloride solution would be 1.2 ppm. From the adsorption properties of sulfate ion on a Ag/CY substrate, the peak area of sulfate in the 3% sodium chloride solution after SPE, Figure 18, corresponds to a sulfate concentration of 120 ppm - for an enhancement factor of 100. But this estimate of the enhancement ignores nitrate ion, which is present in solution at a concentration of 1000 ppm. Taking nitrate ion into account (and KNO3 vs. KSO4 , Table 3), an additional enhancement factor of 450 is possible. Therefore, the overall enhancement of the sulfate peak for the 3% NaCl solution after SPE, Figure 18, can be as high as 45,000.
It was concluded that the enhancements observed in the nitrate and sulfate peaks, Figure 18, are due to the colloidal silver present in the eluates. Anions have been shown to adsorb onto colloidal silver to, essentially, form large negatively charged particles. When Raman spectra of the 1000 ppm nitrate and sulfate eluates were obtained in the absence of the cationic-coated SERS substrate, no increase in the nitrate and sulfate peak areas was observed compared to the spectra obtained for solutions that had not been extracted. Although colloidal silver is present in the eluate, the concentration of colloidal silver in the eluates is not sufficient to see the SERS response for the anions. But the cationic coated SERS substrate, as a result of its positive charge, attracts the negatively charged colloidal particles causing them to aggregate on the surface. Aggregation of these nitrate and sulfate polyanions explains the SERS enhancements observed in these experiments.
The results of SPE using the IC-Ag Plus cartridges indicate that the cartridges do successfully remove the chloride ion from the solution matrix. It was observed for low nitrate and sulfate concentrations, below 100 ppm, removal of the chloride ion by SPE has little or no effect on the magnitude of the Raman signals of the nutrient anions. However, enhancements in the Raman signals of the anions were observed after SPE of solutions containing nitrate and sulfate concentrations greater than or equal to 100 ppm. The enhancements were greater for nitrate ion than sulfate and the observed enhancements coincided with the presence of silver ion presence in the eluate. These enhancements at higher nitrate/sulfate concentration complicate quantification of the anions.
4.2.3.2 Chemical Separation Using Supported Liquid Membranes (SLMs).
Membrane-based chemical separations are potentially more economical and easier to implement than competing separations technologies. Considerable success has been achieved in the development of membranes for the separation of a wide variety of ionic and molecular species. One of the most versatile of membrane types is the liquid membrane system, which involves an immiscible liquid that serves as a semipermeable barrier between two liquid or gas phases. Film thickness, membrane polarity, solvent
42
viscosity, and operating temperature affect transport. The efficiency and selectivity of transport across the immiscible liquid may be markedly enhanced by the presence of a carrier in the membrane phase that reacts rapidly and reversibly with the desired chemical species. One configuration used for liquid membrane separations is the supported liquid membrane (SLM), shown schematically in Figure 19. A supported liquid membrane consists of an organic carrier solution immobilized in a porous hydrophobic polymeric support (Chrisstoffels, de Jong, and Reinhoudt, 1996). Assisted transport through a liquid membrane takes place via the following consecutive steps: partitioning of a species from the aqueous source phase into the membrane phase, complexation of the carrier inside the membrane phase, and transport of the complex through the membrane. At the receiving side of the membrane, decomplexation and partitioning of the species into the aqueous receiving phase takes place. The performance of the SLM is strongly related to the characteristics of the carrier.
Figure 19. Schematic of a supported liquid membrane (SLM). Typically, discussion of liquid membranes focuses on the transport of cations with little mention of the anionic species involved. However, in order to maintain electroneutrality, many membrane carrier systems require that an anion be co-transported along with the cation. Because the anion must also enter and cross the organic phase, it influences transport efficiences. The effects of anion hydration free energy, anion lipophilicity, and anion interaction with benzo groups on benzo-substituted crown ethers have been studied. Lamb et al (1980), using dibenzo-18-crown-6 (DB18C6, structure shown in Figure 20) in chloroform, measured K+ transport. Plots of transport rate as a function of anion concentration for I-, SCN-, NO3
-, and Cl- are shown in Figure 20. The results indicated that K+ transport decreased in the order picrate > PF6
- > ClO4- > IO4
- > BF4
- > I- > SCN- > NO3- > Br - > BrO3
- > Cl- > OH - > F - > acetate > SO4=. This order is
almost identical to that for increasing anion hydration free energy. The larger anions are more easily dehydrated and thus more readily enter the membrane to facilitate transport. It was also shown that when more than one anion is available for co-transport, the anion that normally transfers more readily will be preferred over the other (Christensen, 1978).
43
Figure 20. Structure of dibenzo-18-crown-6 (DB18C6) and plots of transport rate as a function of anion concentration (Lamb et al, 1980).
Planar or flat sheet SLMs are very useful for laboratory research and development purposes, but the surface area to volume ratio of flat sheets is too low for industrial applications (Bartsch and Way, 1996). Industrial chemical and biological separations applications require membranes with higher fluxes and higher transport selectivities. Spiral wound and hollow fiber geometries can be used to increase the surface area of liquid membranes. Surface area to volume ratios for hollow fiber modules can approach 104 m2/m3 and 103 m2/m3 for spiral wound modules. For SLMs, there are several important stability issues including the integrity of the immobilized liquid film, the mechanical stability of the porous support, and chemical stability of the carrier. It has been shown that SLM lifetime correlates to the following parameters: interfacial tension, carrier interaction with water, concentration of the feed and stripping solution, viscosity of the liquid membrane, and the water solubility in the liquid membrane. In general, low osmotic pressure difference between the feed and strip solutions, low water solubility in the liquid membrane, and low carrier solubility in water favor stable SLMs. The ultimate success of the SLMs in separating species depends upon the chemical nature of the carriers. Carriers for the selective transport of neutral molecules, anions, cations, and zwitter ionic species are currently being developed. These efforts are aided in part by computer-based molecular modeling (MM) (Peterson and Lamb, 1996). Molecular modeling is used to predict the formation kinetics and thermodynamic stability of carrier-analyte complexes and several MM software packages are commercially available. It has been demonstrates that 5,10,15,20-tetraphenyl-21H,23H-porphine manganese III (MnTTP), structure shown in Figure 21a, mediates transport of cyanide anion in both bulk and polymer-supported liquid membranes (Sumi et al., 1994). The SLM was prepared by immersing a thin microporous film in an o-NPOE solution. The OH ligand of the complex, MnIIITTP(OH) is easily substituted with cyanide ion. The equilibrium constant of the reaction with cyanide ion is much larger than those with halide ions, acetate, and nitrate. Only cyanide ion was transported selectively in the presence of NO2
-, NO3-, F -, Cl -, CH3COO -, HPO4
=, CO3=, and SO4
=. The calixarenes are a class of macrocycles formed from the condensation of a p-substituted phenol with formaldehyde (Steed and Atwood, 2000). The descriptive name ‘calixarene’ is due to the resemblence of the bowl shaped conformation of the smaller
DB18C6
44
Figure 21. (A) Structure of MnIIITTP. (B) Representation of a lower rim alkylammonium-substituted calix[4]arenes used to extract chromate and dichromate anions.
calixarenes to a Greek vase called a ‘calix crater’. Figure 21b is a representation of a calix[4]arene in the cone conformation showing that the macrocycle is comprised of upper rim substituents, a hydrophobic binding pocket, and lower rim substituents. The calixarenes are extremely versatile host frameworks. Molecular recognition can occur either via the cavity itself or by interactions with the functional groups above or below the cavity. Depending on their degree of functionalization, calixarenes may act as hosts for cations, anions, and neutral molecules. The stability constants of the complexation between calixarene derivatives and anions such as Cl-, CH3COO-, H2PO4
-, NO3-, Br -, I-
and HSO4- have been measured in organic solvents (Danil de Namor, Cleverley, and
Zapata-Ormachea, 1998) and in water (Staffilani et al, 1997). A series of lower rim amine and amide-substituted calix[4]arenes (Georgiev, Wolf, and Roundhill, 1997; Wolf et al, 1999) that have recently been synthesized are of particular interest. It was found that the protonated form of 5,11,17,23-tetra-t-butyl-25,27-bis(aminoethoxy)-26,28-dihydroxycalix[4]arene, Figure 21b, is an effective extractant for transferring the anions CrO4
= and Cr2O7= from an aqueous into a chloroform layer. The anions Cl-, NO3
-, CH3COO-, SO4
=, MoO4=, and WO4
= did not interfere in the extraction of CrO4= and
Cr2O7=. Deprotonation of the dialkylammonium calix[4]arene resulted in reversal with
CrO4= and Cr2O7
= migrating back into the aqueous layer. It was also shown that the calix[4]arene amines were better extractants of CrO4
= and Cr2O7= than the calix[4]arene
amides. In a different study, the hydroxyl groups in the lower rim were replaced with thiol groups to form a thiacalixarene (Marenco, Stirling, and Yarwood, 2001). It was shown that the thiacalixarene formed a SAM on roughened gold surfaces and that SERS spectra could be obtained of the SAM. Using thiacalixarene modified Au surfaces, the
upper rim substtuents
hydrophobic binding pocket
lower rim substituents
B
A
5,10,15,20-tetraphenyl- 21H,23H-porphine manganese III (MnTTP)
45
detection of aromatic analytes by SERS was demonstrated. It may be possible to replace the t-butyl groups of the upper rim of 5,11,17,23-tetra-t-butyl-25,27-bis(aminoethoxy)-26,28-dihydroxycalix[4]arene with thiol groups that will chemisorb onto Ag and Au surfaces to create a SAM that will specifically bind CrO4
= and Cr2O7=, allowing their
detection by SERS. The diathiamacrocycle, shown in Figure 12, when dissolved in o-NPOE could be used to mediate transport of perchlorate anion in SLMs.
4.2.3.3 Chemical Separation Using Nanotubule Technology. An alternative to SLMs is chemical separations using nanotubule technology. Martin and co-workers have been using gold nanotubule membranes to investigate how pore size, charge, and chemistry affect transport selectivities in membranes. The membranes are prepared by a template method shown schematically in Figure 22a (Nishizawa, Menon, and Martin, 1995). An electroless plating procedure is used to plate Au nanotubules into the pores of commercially available polycarbonate track-etched filters (Osmonics, 6 µm thick, 50 or 30 nm pore diameter, 6x10⁸ pores cm-2). This plating method yields an Au tubule within each pore and an Au surface layer on each face of the membrane. The inside diameter of the nanotubule can be varied by varying the plating time. As prepared, these membranes show selective ion transport analogous to that observed in ion-exchange polymers. Ion permselectivity occurs because excess charge density can be present on the inner walls of the metal tubules. The membranes reject ions with the same sign as the excess charge and transport ions of the opposite sign. Because the sign of the excess charge on the tubule can be changed potentiostatically, a metal nanotubule membrane can be either cation selective or anion selective, depending on the potential applied to the membrane.
The shape of the Au nanotubule can be changed by varying the rate of the plating reaction, Figure 22b (Jirage, Hulteen, and Martin, 1997). High plating rates occur at pH = 12. With high plating rates, Au preferentially deposits on the faces of the membranes resulting in nanotubules with bottlenecks on both ends but a larger ID in the middle. Such membranes provide high permeate flux and transport selectivity. While the selectivity is determined by permeation through the bottleneck, the overall flux is determined by permeation in the larger ID tubule that spans the membrane. It was shown that the membranes containing such bottleneck nanotubules can be used to filter molecules on the basis of size. For example, when the bottleneck nanotubule membrane was mounted in a U-tube permeation cell, it was possible to separate pyridine (MW = 79.10) from quinine (MW = 378.47).
Chemically based transport selectivity is accomplished by chemisorbing organic thiols (R-SH) to the Au tubule surfaces, as shown schematically in Figure 22c (Hulteen, Jirage, and Martin, 1998). In one series of experiments (Hulteen, Jirage, and Martin, 1998; Jirage, Hulteen, and Martin, 1999), membranes, with pore sizes varying from 1.5 to 28 nm, were derivatized with either a hydrophobic R group (-C16H33) or a hydrophilic R group (-C2H4–OH). Flux is proportional to both the diffusion coefficient and the partition coefficient for the permeant molecules in the membrane. It was shown that the flux of both pyridine and toluene decreases with decreasing tubule diameter for both R = -C16H33 and R = -C2H4–OH. However, the results showed that while pyridine was preferentially transported in the R = -C2H4–OH membranes, toluene was preferentially transported in the R = -C16H33 membranes. The ratio of fluxes for toluene vs pyridine transport in the
46
Figure 22. (A) Schematic diagram of the electroless Au plating procedure. (B) Schematic illustrations of the shapes of the Au nanotubules obtained by doing the electroless Au plating at pH = 10 and pH = 12. The higher pH results in the formation of bottle -neck
tubules. (C) Sche matic representation of tubules chemically modified by a self assembled monolayer (SAM).
pH = 12 plating
pH = 10 plating
Au surface film
polycarbonate
polycarbonate
pore
conventional tubule
bottle-neck tubule
B
polycarbonate
SAM
pore
Au surface film
C
TOP VIEW
CROSS- SECTIONAL VIEW
polycarbonate membrane
pore Au
electroless Au plating
A
47
d = 1.5 nm R = -C16H33 membrane was measured to be greater than 400 suggesting that this membrane would be useful for separating mixtures containing hydrophobic and hydrophilic molecules, with the hydrophobic molecules being preferentially transported to the permeate. In a second series of experiments (Lee and Martin, 2001) using membranes with 1.4 nm diameter Au tubules, pH-switchable ion-transport selectivity was introduced by chemisorbing L-cysteine to the inside tubule walls. It was shown that at low pH, in which both the amino and carboxyl groups are protonated, these membranes preferentially reject cations and transport anions. At high pH, in which both the amino and carboxyl groups are deprotonated, these membranes preferentially reject anions and transport cations. At pH = 6.0, near the isoelectric point of the chemisorbed cysteine, these membranes show neither cation or anion transport selectivity. 4.3 Improving Sensitivity In conventional SERS, Raman signals from molecules adsorbed on either metal nanoparticles or metal surfaces possessing nanoscale roughness features exhibit enhanced emission as a result of coupling to surface plasmon resonance modes of the me tallic medium. Not surprisingly, the magnitude of the SERS response is dependent upon the surface roughness. It has been shown that a submicroscopic surface roughness (particle sizes on the order of 50-200 Å) as well as an atomic-scale roughness (on the order of atomic dimensions) is required for the observation of SERS. Submicroscopic surface geometries permit surface plasmon resonances necessary for an electromagnetic enhancement of Raman scattered light (Pettinger and Moerl, 1983). Atomic-scale roughness plays a crucial role in the chemical enhancement and is associated with charge transfer excitation. It is believed that atomic-scale roughness may improve the coupling between incident photons and electronic excitations in the metal (Furtak and Macomber, 1983). For long term monitoring purposes, it is desirable to detect perchlorate, chromate, dichromate, and cyanide in the low ppb concentration level. Increased sensitivity and lower detection limits can be achieved by controlling the surface roughness. The electrochemical etching parameters used to prepare the roughened surfaces were optimized to increase sensitivity. In addition, other means of improving the sensitivity of the SERS experiment were examined. These methods include nanoparticle technology, evanescent waveguide technology, and the use of fractal/microcavity composite materials. 4.3.1 Optimization of Electrochemical Etching Parameters
Surfaces exhibiting high SERS activity have been produced by using electrochemical oxidation/reduction cycles, or ORCs (Norrod et al., 1997) to roughen the surface. During the ORC, the electrode is subjected to a triangular sweep from one potential limit at which the electrode can be oxidized and another one at which the electrode can be reduced. The surfaces become pitted during the oxidation step and metal nodules form in the pitted regions during reduction. The degree of pitting is directly related to the current and charge densities. Scanning electron microscopy (SEM) of electrochemically roughened electrodes, as well as colloidal aggregates and metal films, has shown that the SERS active surfaces exhibit a fractal structure (Yamaguchi et al., 1999). It was demonstrated that the magnitude of the SERS response directly corresponds with the fractal dimension.
48
Figure 23. SERS spectrum of p-thiocresol on a silver substrate. The symmetric stretching ring mode, νs, is indicated.
For gold surfaces, two electrochemical procedures were used. The procedure developed by Leung et al. (1987) uses 25 successive positive-negative potential scans at 500 mV s-1 in 0.1 M KCl from –0.3 to +1.2 V vs. SCE. During each cycle, the potential was held at the positive limit for 1.3 s and the negative for 30 s. In the other procedure (Liu and Jang, 2002), the electrode is cycled in 0.1 M KCl from -0.28 V (holding 10 s) to +1.22 V (holding 5 s) at 500 mV s-1 for 25 times. The SERS response for aromatic thiols was approximately the same regardless of the roughening procedure. However, the SERS response of alkyl thiols was stronger using the Liu and Jang procedure. The etching parameters of the silver electrode were optimized by monitoring the change in intensity of the peak due to the symmetric stretching ring mode of p-thiocresol (PTC) at 1075 cm-1, Figure 23. The electrodes were roughened in a 0.1 M KCl solution. The effects of anodic/cathodic potential and number of ORCs were examined. The sweep rate between potentials was 500 mV s-1. During each cycle, the potential was held at the positive limit for 1.3 s and the negative for 30 s. For each roughened substrate, measurements were made at five different spots on the surface. Figure 24 displays these data in a histogram form. The results are summarized in Table 7 and indicate that the optimum etching parameters for silver are using an anodic potential between +1.2 and +1.6, a negative potential of –0.3 V, and 20 ORCs. 4.3.2 Colloids, Nanocrystals, and Colloidal Clusters Suspended metal colloids, with a high specific surface area, can be advantageous to use in observing SERS from low concentrations of adsorbate. SERS requires an electrically conducting surface with features of a size where the surface plasmons are able to resonate with light at the illuminating wavelength. The method of colloid preparation controls the metal particle size and, consequently, the magnitude of the SERS response. Borohydride reduction results in silver sols with small particle size (Shirtcliffe,
0
7000
14000
21000
28000
35000
inte
nsi
ty
250 750 1250 1750
wavenumber (cm-1)
νs
49
Figure 24. Intensity of the symmetric stretching ring mode of PTC as a function of anodic/cathodic potential. For each sample 25 ORCs were applied.
Nickel, and Schneider, 1999). Although the suspensions prepared by this method are fairly monodisperse, the sol exhibits no SERS enhancements. However, it was shown that the silver particles produced using borohydride reduction could be used as nuclei to grow larger silver particles, using ascorbate as a reducing agent, that exhibit SERS enhancement. Hydrazine reduction of silver results in a polydisperse colloid consisting of predominantly spherical particles ranging between 40 and 70 nm in diameter (Nickel et al., 2000). SERS spectra from the dye nile blue A could be recorded from a solution with concentrations as low as 10-10 M. Rivas et al. (2001) described a method of obtaining silver particles with a large particle size by citrate reduction. Large SERS enhancements were measured for spheroidal particles with diameters ranging between 45 and 60 nm. Colloidal silver particles prepared by citrate reduction were reacted with mercaptoethanol (ME) to form a SAM (Tarabara, Nabiev, and Feofanov, 1998). The SAM of ME increased the adsorption of β-carotene enabling SERS spectra of β-carotene to be recorded at concentrations as low as 10 nM.
Recently, enhancement factors on the order of 1014 to 1015 have been reported for SERS of analytes adsorbed on silver and gold nanoparticles (Nie and Emory, 1997; Kneipp et al., 1997; Michaels et al., 1999) and on colloidal gold clusters (Kneipp et al., 1998). To prepare clusters, NaCl was added to colloidal gold solutions to induce aggregation and to achieve formation of colloidal clusters (Kneipp et al., 1998). Prior to aggregation, the colloidal solution contained isolated, nearly spherical, gold particles with a mean size of 60 nm and a narrow size distribution. Aggregation resulted in the formation of fractal clusters in a wide size distribution between 100 nm and a few micrometers. Isolated colloidal particles with 6x10⁻⁷ M crystal violet did not give a measurable SERS signal at 830 nm excitation. However, a strong SERS signal, with enhancements between 109 to 1014, occurs at NIR excitation upon formation of clusters.
Doering and Nie (2002) examined halide ion activation of Ag colloids as a function of time. They found that the typical length of activation was on the order of 10-30 min. Often with a lag time of 1-2 min, more SERS-active particles appear during
0
5000
10000
15000
20000
25000
30000
35000
40000
1 4 7 10 13 16 19 22 25 28 31 34 37 40
1200,-300950,-400
950,-600700,-500700,-600
450,-600150,-600
50
Table 7. Effect of the anodic/cathodic potentials and number of ORCs on the SERS response of PTC. A sweep rate of 500 mV s-1 was used.
activation. The effect correlates with the stability of the silver-halide complex. Chloride activated particles usually reach their maximum intensities within 10 min, whereas bromide takes about 20 min, and iodide takes still longer. The SERS activity of the chloride activated particles begins to decay shortly after the maximum intensity has been reached. After 90 min of treatment, little or no decay in SERS activity was observed for bromide and iodide activated particles.
Nanocrystals of silver and gold are formed by incubating a suspension of colloidal particles with 10 mM NaCl (Michaels, Nirmal, and Brus, 1999). Four to six individual particles aggregate to form composite particles of low symmetry ranging from 120 to 250 nm in size. No fractal character is observed for the aggregates. These aggregates are large, faceted nanocrystals that exhibit multiple scattering resonances and are able to enhance the efficiencies of surface optical processes as much as 14-15 orders of magnitude. Consequently, large SERS effects are associated with these nanocrystals. Using 514.5 nm excitation, Nie and Emory (1997) reported detecting 2x10-11 M rhodamine 6g (R6G) by SERS using silver nanoparticles. Because of the number and surface area of the colloidal nanoparticles, a R6G concentration of 2x10-11 M corresponds to 0.1 analyte molecule per particle. However, it was found that the population of particles that exhibit large SERS enhancements is about 0.1 to 1% in standard colloid
51
preparations (Emory and Nie, 1998). By using size-selective fractionation, the population can be enriched by 10-15%. To obtain 100% active aggregates would require new synthetic routes. Although great enhancements are possible using nanocrystals and colloidal aggregates, they are very difficult to derivatize and are not attractive for a field deployed sensor.
It was shown that SERS-active silver film electrodes could be prepared by electrocrystallization (Sauer, Nickel, and Schneider, 2000). In this procedure, 400 nm thick silver films were vapor-deposited on glass substrates. The electrode was immersed in a solution of 0.1 M KNO3 and 10 mM AgNO3. Electrocrystallization at low overpotentials (-40 mV) leads to the development of relatively few, but large, microcrystals. Crystal growth dominates over nucleation with the effect that most of the surface does not experience any roughening at all. As a result, these surfaces exhibit weak SERS activity. Applying a higher overpotential (-300 mV) for the electrocrystallization process favors nucleation over the growth of already present nuclei. As a result, many small silver microcrystals are formed in a very uniform distribution across the whole surface area. Intense SERS signals were obtained using these surfaces. In this effort, silver film electrodes were prepared by electrocrystallization of silver onto gold electrodes on glass. A 0.1 M KNO3 and 10 mM AgNO3 solution was used and electrocrystallization occurred at an overpotential of –300 mV. Afterwards the electrode was immersed in an ethanolic solution of PTC overnight to form a SAM. The intensity of the peak due to the symmetric stretching ring mode was then measured five different spots on the surface. Results are summarized in Table 8 and indicate that the substrates prepared by the electrocrystallization method are comparable to substrates prepared by electrochemical etching, Table 7.
Table 8. Effect of deposition time of electrocrystallization of silver on the SERS response of PTC.
Electrocrystallization Time (s)
Peak Intensity at 1075 cm-1
30 26600 ± 8400 60 32900 ± 4500 90 21500 ± 5300
4.3.3 Evanescent Waveguide Technology Evanescent waveguide technology effectively lowers the detection limit by increasing the sample pathlength. Either planar or hollow waveguides can be used. Figure 25 shows a schematic of a planar waveguide (Chabay, 1982). The properties of the planar waveguide are ηwaveguide > ηcover ,ηsubstrate and the thickness of the waveguide film is typically 200-1000 nm thick. High refractive index prisms are used to couple the incident light into and out of the waveguide. Alternatively, input and output light couplers can be diffraction gratings, which are fabricated on the substrate using standard lithographic techniques. Within the waveguide, the amplitude of the electromagnetic field decreases very rapidly at the walls. Light that reaches the boundary from within, where the material has a higher index of refraction than the surrounding material, will be totally internally reflected at the interface. However, the amplitude of the field of the light does not drop to zero at the boundary. The amplitude has a tail that decreases exponentially in
52
the direction of an outward normal to the boundary extending into the second medium as shown in Figure 25. The tail represents an electromagnetic field that oscillates at the optical frequency of the incident light, but that does not propagate through the second medium. Consequently, the field is strong only very near the interface between the two media. This protruding field, called the evanescent field, can be used to study absorption or to excite fluorescence emission and Raman scattering.
Figure 25. Schematic of a planar waveguide.
Figure 26. Schematic diagram of the heterostructure assembly glass/3 -MPTMS/Ag
colloid of the integrated optics evanescent wave surface enhanced Raman scattering (IO-EWSERS) substrate with an adsorbed layer of sensor coating, 4-Mpy (Baldwin, Schühler, Butler, and Andrews, 1996). The propagating evanescent wave, TE mode leaks into the 3-
MPTMS/Ag colloid overlayers, increasing the Raman scattering cross section and enhancing the surface 4-Mpy adsorbate vibrations. The selective sensor function of 4-Mpy
is depicted by the H+ ions of MPyH + (o) which are replaced by Cu2+ ions (n).
A schematic of the planar waveguide used by Baldwin et al. (1996) to perform SERS is shown in Figure 26. The waveguide substrate is a glass cover slip (24x30 mm2
x150 µm). The surface of the waveguide was reacted with 3-mercaptopropyltrimethoxy silane (3-MPTMS). The silane moieties covalently bond to the oxide surface of the glass and with each other through siloxane bonds. The resultant silane layer is essentially a
53
one-molecule-thick polymer film. The thiol functionality of 3-MPTMS was used to immobilize colloidal silver particles prepared by the borohydride reduction of AgNO3 . The silver particles were then reacted with 4-mercaptopyridine, which was used as the sensing layer to detect Cu2+. Light was coupled to the waveguide using a high index prism. However, as shown in Figure 26, the Raman scattering was collected using a lens orthogonal to the waveguide. Complexation to Cu2+ was indicated by changes in the spectral features of the 4-mercaptopyridine coating.
Hollow waveguides have also been used to obtain Raman spectral data (Benoit and Yappert, 1996; Holtz, Dasgupta, and Zhang, 1999; Dijksteaetal et al., 1999; Altkorn, Koev, and Pellegtier, 1999). In the Benoit and Yappert (1996) study, a polished quartz Raman waveguide was used for the analysis of aqueous solutions. The sensor configuration and propagation of excitation light through the hollow waveguide are shown in Figure 27. Raman scattering of the capillary walls and the sample occurs as the light passes through the waveguide. The capillary tube acts as both a partially reflective waveguide and a sample cell. The reflections within the sample volume and the capillary walls allow the effective excitation and collection of Raman signals at long sample lengths. One disadvantage of using polished quartz tube waveguides for aqueous measurements is that the waveguide is formed at the glass/air interface and not the glass/solution interface. This leads to wave propagation problems and light loss due to contamination of the glass surface. Another disadvantage for normal Raman spectroscopy is that the laser is propagating through both the solution and the quartz tube, which leads to signal variability in a dynamic flowing system due to changes in refractive index and the generation of a large Raman signal due to the quartz tubing. Using capillary tubes made of materials with refractive indices less than that of water (η=1.33) will overcome these limitations. If the refractive index of the capillary material is lower than that of the sample, total internal reflection can be achieved and the incoming light will be fully captured in the capillary. Until recently, no capillary cell material was available with a refractive index smaller than that for aqueous solutions. Teflon AF (2,2-bis (trifluoro methyl)-4,5-difluoro-1,3-dioxole) is an amorphous fluoropolymer that is the first commercially available polymer with a refractive index (η=1.29-1.31) lower than that of water. Hollow waveguides have been fabricated using Teflon AF. These waveguides have been used to obtain Raman spectra of dilute aqueous solutions of aromatic nitro compounds (Dijkstra et al., 1999) and organic solvents (Holtz, Dasgupta, and Zhang, 1999).
Figure 27. Benoit and Yappert (1996) sensor configuration and propagation of the excitation.
Although both planar and hollow waveguides increase sensitivity by increasing sample pathlength, hollow waveguides have greater applicability for use in an
54
environmental sensor. Hollow waveguides can be easily coupled to optical fibers. There are fewer optical components associated with hollow waveguides resulting in easier, less shock-sensitive alignment.
4.3.4 Fractal/Microcavity Composite Materials
Fractal/microcavity composites are novel materials developed by Robert Armstrong’s group at New Mexico State University Las Cruces (NMSU-LC) and licensed by LaSys, Inc. These materials exhibit a greatly enhanced SERS response. The fractal/microcavity composite is comprised of a quartz capillary tube containing a suspension of colloidal silver, as shown in Figure 28a (Kim et al., 1999). Conventional SERS arises from coupling of molecular emissions to surface plasmon resonances. In addition to conventional SERS enhancement, significant additional enhancement also results from coupling of the SERS emissions to resonance modes of the fractal/microcavity. Both the fractal medium and the microcavity are resonant systems, exhibiting a broad spectrum of high-Q resonance modes. In the composite, the Q’s of these resonance modes combine multiplicatively (rather than additively) with the result that Raman and luminescence emission from molecules adsorbed on the composite exhibit enhancements that are many orders of magnitudes greater than that of conventional SERS. In fact, optical enhancement factors of 1026 have been observed for Raman emissions from sodium citrate molecules using these composites (Kim et al., 1999). These huge enhancement factors in the SERS response make single molecule detection possible.
Figure 28. (A) Schematic of a fractal/microcavity composite. (B) SERS spectra of acetonitrile (1), 5 ppm malathion in acetonitrile (2), and the difference spectrum (3)
obtained using a fractal/microcavity composite, 632.8 nm excitation, 12 mW power, and 100 ms acquisition time. The enhancement due to the fractal/microcavity composites is on the order of 1012. Although this particular fractal/microcavity composite is not the most
optimal (i.e., 1026), it is still approximately 300 times more sensitive than the electrochemically etched Ag/Au substrates used to generate the spectral data shown in
Figures 3, 4, and 8.
55
In experimental studies of fractal/microcavity composite SERS spectra, several general features may be identified. First, molecular signal levels are uniformly large even for extremely low concentrations of emitting molecules, including concentrations in the single molecule level. Second, laser excitation sources are uniformly low so that, for example, mW-level, CW pumping sources may be used. Third, as a result of the extremely large enhancement, nonlinear optical responses are easily generated enriching the spectrum and providing additional opportunities for spectral identification. All of these spectral features have been observed in experimental spectra obtained from the composites. These include studies of luminescence and Raman emission from dye molecules, and Raman emissions from several molecules including sodium citrate, malathion, L-glutamic and L-aspartic acids, and pyridine. Representative composite-SERS spectra from these molecules are available in the literature (Kim et al, 1999; Drachev et al, 2001). An example of spectral data is shown in Figure 28b that was obtained using this fractal material located on the inside surface of a hollow microcavity. The enhancement of the SERS signal is on the order of 1012. Using larger fractal/microcavity composites will result in much larger enhancements and lower detection limits. However, although the configuration in which the fractal material is located on the inside surface of a hollow microcavity can be used under laboratory conditions to detect analytes, it is not field deployable. The silver aggregates are very fragile and can precipitate out. Also, in this configuration, sample has to be introduced inside the capillary tube in order for the analyte to interact with the silver colloidal particles. For field applications, it would be ideal to locate the fractal material on the outside surface of the microcavity. LaSys, Inc., in conjunction with NMSU-LC and State University of New York (SUNY) Buffalo, is currently investigating the use of a flash pyrolosis method of attaching the fractal material to the outside of the microcavity.
Figure 29. Schematic of the essential components for a SERS sensor to detect toxic anions.
4.4 Sensor Design The SERS technique requires intimate contact between the sample and the enhancing surface. Therefore the sensor has to be designed in such a manner as to allow the sample to come in contact with the SERS substrate. The essential components of the
laser
CCD
optical fibers
SERS substrate
sample
spectrometer computer control of instrumentation
56
sensor are illustrated in Figure 29. As shown in Figure 29, the SERS surface is in contact with the sample. Optical fibers are used to transmit the excitation light from the laser to the sample and the Raman emissions to the spectrometer. In the spectrometer, a grating is used to disperse the Raman emissions onto a CCD detector. The resultant spectrum is then displayed on the computer monitor. For field applications the SERS sensor system needs to be compact, robust, portable, and easy to operate. Recent years have seen significant advances in the development of inexpensive, portable Raman systems comprised of diode lasers operating in the near-IR, fiber-optic probes, holographic notch filters for the rejection of the Rayleigh line, a single grating monochromator, and a charge-coupled device (CCD) detector for multichannel detection. These Raman systems contain a minimum of optical components resulting in high throughputs and, once coupled to a laser and spectrometer, optical fiber probes require no further alignment. 4.4.1 Design of a Field Deployable Sensor for the Detection of Anions There are two approaches for obtaining groundwater samples from monitoring wells. One uses a peristaltic pump to bring samples to the surface. This approach is limited to depths of 32 ft or less. The other approach uses samplers, which vary in diameter between 1 and 3 in. The samplers are lowered into the monitoring well to the desired depth. A sample is then taken and brought up to the surface. Once collected, samples are then packaged and sent away for laboratory analysis or, if possible, a mobile lab unit is brought on site to analyze samples as they are received. Use of the SERS sensor system would replace the need to send out samples for analysis. Out in the field, either the SERS sensor module would be inserted into a sample of groundwater brought up to the surface or the SERS probe is packaged in such a way that it could be lowered into a monitoring well directly. Sampling could then be done at several depths and the anions would be identified and quantitated by their SERS response. The advantages of the SERS sensor over conventional techniques are (1) the required information is obtained in real- time, (2) it doesn’t require the additional cost of an outside laboratory, and (3) decisions can be made in a timely fashion as to whether or not additional sampling is required and where that sampling is needed.
To deliver the excitation light and collect the Raman emissions, an InPhotonics fiber optic probe is used. The design of the probe head is shown in Figure 30. The probe head can be as small as 0.5 inches in diameter and 4 inches long. Fiber optic probes are available for six excitation wavelengths (514, 532, 632, 670, 785, and 830 nm). However, the filters and steering optics are permanently affixed. Consequently, switching excitation wavelengths requires purchasing a new probe assembly. The working distance of the probe is factory set. Focal lengths can be either 5, 7.5, or 10 mm. Because the optical fibers, filters, and steering optics are permanently aligned, this probe design is robust and is resistant to physical shock. The OD > 8 at the laser line. As a result long fiber lengths, up to 200 m, can be used. The next issue is mounting the SERS substrate. The most common types of SERS substrates include electrodes; colloidal particles immobilized on a solid surface; island films prepared by vacuum deposition of metal; and metal-covered surfaces having submicrometer structure such as microspheres, monolithic posts, etc. (Mosier-Boss and Lieberman, 1999a). Of these structures, thin metal films (≤ 200 Å) on optically
57
Figure 30. Design of the InPhotonics probe head.
transparent substrates (such as glass) allows spectral data to be obtained using a ‘backside’ configuration in which the excitation light passes through the substrate and metal film and is focused onto the SERS/sample interface (Mosier-Boss and Lieberman, 1999b). Advantages of the backside configuration are greater signal intensities; reduced attenuation of the signal by water, which strongly absorbs near IR excitation; and minimized fluorescence interference since excitation only occurs at the metal film/liquid interface. Reducing interferences due to fluorescence and attenuation of water makes the backside configuration attractive for environmental monitoring. Figure 31 shows that the backside configuration can be used to obtain spectral data of thiol-coated SERS substrates. In Figure 31, SERS spectra of p-thiocresol-coated gold film were obtained in
Figure 31. SERS spectra of p-thiocresol chemisorbed on a 62 Å thick gold film obtained using the ‘backside’ configuration. The top spectrum shows a peak at 991 cm-1
that is attributed to benzene. The presence of this peak indicates that benzene is interacting with the coating.
58
Figure 32. Schematic showing how MCTMS anchors vapor-deposited Au to a glass
substrate. The silane moieties of MCTMS covalently bind to the oxide surface of the glass and each other through Si-O-Si bonds. The thiol groups bond to gold atoms during vapor deposition. A gold-thiolate bond anchors the organic moiety of p-thiocresol to the gold film
to form a self-assembled monolayer (SAM). the absence (bottom spectrum) and presence (top spectrum) of benzene. The peak at 991 cm-1 in the top spectrum of Figure 31 is attributed to the ring breathing mode of benzene. Although vapor-deposited Ag and Au films exhibit high SERS sensitivity and spectral data can be obtained using the ‘backside’ configuration, the usefulness of these films for environmental and other applications is limited by the poor adherence of the metal films to the glass substrates. It was found that treating the glass with (3-mercaptopropyl) trimethoxy silane (MCTMS) greatly improved adhesion between Au and Ag metal films and the glass (Mosier-Boss and Lieberman, 1999a). Figure 32 illustrates how MCTMS anchors vapor-deposited Au to a glass substrate. The silane moieties of MCTMS covalently bind to the oxide surface of the glass and with each other through siloxane bonds. The resultant silane layer is essentially a one-molecule-thick polymer film. The thiol functionality of MCTMS is available for bonding with gold atoms during vapor
Figure 33. SERS spectra of p-thiocresol chemisorbed on thin films of gold on a
glass substrate. (a) Top and bottom spectra are of untreated and MCTMS treated glass, respectively. (b) SERS response after electrochemical roughening of the gold film prior to
reaction with p-thiocresol .
A
B
59
Figure 34. Design of adapter used to house the fiber optic probe and the SERS substrate. deposition. Afterwards the Au on the substrate is reacted with a thiol, R-SH, in an ethanolic solution. A gold thiolate bond attaches the organic moiety of the thiol to the gold film. However, as shown in Figure 33a, treatment of the glass substrates with MCTMS results in a suppression of the SERS response. This suppression of the SERS response is attributed to a reduction in the surface roughness. The MCTMS covalently bonds to both the gold and the glass, and an increase in the binding energy between the substrate and metal film results in decreased island formation. Decreased island formation results is less surface roughness and a suppression of the SERS response. It was found that roughening the glass substrates prior to MCTMS treatment recovers the SERS response. Also, as shown in Figure 33b, electrochemical roughening of Au films on MCTMS-treated glass substrates results in significant enhancements of the SERS response.
groove for O-ring
set screw to hold fiber optic probe in place
groove for O-ring
mount for SERS substrate
plate, holding SERS substrate in place
pass through for screws used to immobilize adapter in the ConeSipper
60
Figure 35 (a) Schematic of ARA’s ConeSipper. (b) Schematic of the modified ConeSipper showing the orientation of the sensor module and the placement of the platinum wires that
comprise the water level sensor. Figure 34 shows the design of the adapter used to house the InPhotonics fiber
optic probe and the SERS substrate. An O-ring provides a leak-tight seal between the adapter housing and the SERS substrate. When completely assembled, the fiber optic SERS sensor can be deployed in a towed-body or a buoy to detect anionic contaminants in aquatic bodies such as ponds, lakes, rivers, etc. The fiber optic SERS sensor can also be deployed in a cone penetrometer (CPT) sampling probe, such as the Applied Research Associates (ARA) ConeSipper shown in Figure 35a, to detect anionic contaminants in groundwater and sediments as a function of depth. The ConeSipper module can be attached directly behind a standard CPT cone and contains a two stage stainless steel filtration system, an integrated pneumatic valving system, and an 80 ml stainless steel sample chamber. A pneumatic line to the surface provides control for the valving of the sample chamber while a small pneumatic controller on the surface controls the flow of inert gas or water to the module. The filtration system prevents sand and fine particulates from entering the sample chamber. Samples can be drawn into the chamber through a check valve that prevents backflow from the chamber. After sampling is complete, the internal chamber can be remotely flushed with water or gas. The ConeSipper was modified to reduce the sampling volume and to accept the SERS sensor module, as shown in Figure 35b (P.A. Mosier-Boss and S.H. Lieberman, 1999a). Decreasing the
A B
61
volume of the sample chamber will require less sampling time and will reduce the risk of clogging the filters with sediments. As shown in Figure 35b, two platinum wires are positioned on either side of the SERS sensor module. The wires are insulated except at the tips. These two platinum wires comprise the water level sensor, which is used to indicate when the water level inside the sample chamber has reached the SERS sensor module. Figure 36 shows the modified insert of the ConeSipper. The placement of the adapter that houses the InPhotonics fiber optic probe and SERS substrate is also shown. It can be seen that the platinum wires of the water level sensor are even with the SERS substrate. Once assembled, the insert is forced into a thin-walled, stainless-steel tube. The three O-rings of the insert, Figure 36, hold the tube in place and provide leak-tight seals. The tube creates the sample chamber. The sensor module is then placed inside the ConeSipper.
Figure 36. The modified insert of the ConeSipper showing the placement of the InPhotonics fiber optic probe and the adapter that houses the SERS substrate and fiber optic probe.
InPhotonics fiber optic probe
O-ring
Adapter that houses fiber optic probe and SERS substrate
Pt wires of water level sensor
Pass-through for cable to strain gauges
O-rings
Pin holding check valve in place
SERS substrate
62
4.4.2 Signal Processing Algorithms The real- time, in situ SERS sensor requires online processing of Raman spectra and immediate output of the qualification and quantification of target analytes. Because of the complexity of the SERS spectrum of the coating, best results may be possible using the difference spectra in which the spectral contributions of the coating have been subtracted out. This is particularly true when analyzing the data by the human eye. To manipulate spectral data, Thermo Galactic’s GRAMS/AI version 7 software was used. GRAMS/AI is a 32-bit, Windows-based suite of software tools for analyzing and processing spectral data. The fully interactive data processing library includes peak-fitting, data smoothing, spectral subtraction, integration, etc.
Figure 37. (a) Difference spectrum of Ag-TP/CHCl3 prior to signal processing. (b) Difference spectrum after FT filtering. (c) Difference spectrum after smoothing using the
Savitsky-Golay method. Arrows indicate CHCl3 peaks. 4.4.2.1 Signal Processing Techniques to Improve the Signal to Noise (S/N)
Ratio. Noise can prevent the location of Raman bands in the difference spectra. It has been shown that signal processing techniques can be used to improve the S/N ratio (Mosier-Boss, Lieberman, and Newbery, 1995). Figure 37a shows a difference spectrum obtained for Ag-TP/CHCl3. The main CHCl3 peaks at 394.4 and 681.3 cm-1 are clearly observed in the spectrum. Two signal processing techniques, filtering in the Fourier
a
800
b
280 780 1280 1780
wavenumber (cm -1)
c
63
domain and smoothing using the Savitsky-Golay method, were employed to improve the signal-to-noise ratio (S/N).
The Raman spectrum and the Fourier-domain spectrum are two representations of the same function. One goes back and forth between the two representations by means of the Fourier transform equations. A Fourier transform (FT) separates the constituent spatial frequencies in a spectrum. Consequently, it is convenient to filter in the Fourier domain to attenuate undesirable spatial frequencies. In the Fourier domain, random noise occurs at high spatial frequencies. The use of a low-pass filter reduces the high spatial frequency features improving the S/N ratio as shown in the inverse transformed spectrum, Figure 37b. With FT filtering, the weak CHCl3 peaks at 773.4 and 1213.4 cm-1 become apparent in the difference spectrum.
The Savitsky-Golay method is a convolution approach, which performs a least squares fit to a specified “window” of data points. Smoothing is controlled by the degree of the “polynomial” and the number of “points” parameters. The degree of “polynomial” specifies the order of the polynomial to fit over the specified number of “points.” Thus, the larger the number of points specified and the lower the order of polynomial, the heavier the smoothing. The effectiveness of the Savitsky-Golay smoothing method in improving the S/N ratio is shown in Figure 37c. By applying the Savitsky-Golay approach, the weak CHCl3 peaks at 773.4 and 1213.4 cm-1 become apparent in the difference spectrum.
4.4.2.2 Signal Processing Algorithms for Speciation. Online processing of Raman spectra is desired identify and quantify target analytes. Conventional methods in machine interpretation of spectra include simple search and matching procedures, correlation tables, various statistical approaches (e.g., regression, principle component analysis, and factor analysis), different pattern recognition techniques and expert systems, both rule- and table-driven. Some of these approaches have shown promise, resulting in successful applications (Munk et al., 1991; Wythoff et al., 1990; Zupan and Gasteiger, 1991). However, these methods fail when spectra become complicated. Therefore, a challenge that remains is to achieve the desired accuracy and reliability, particularly for samples that have a low concentration and low S/N.
In recent years, artificial neural networks (ANNs) have proven very useful for signal processing, and pattern recognition and classification. ANNs have been used to investigate problems that cannot be easily solved by conventional methods in many fields. A major advantage of ANNs is that they have the capability of discovering patterns that are so obscure as to be imperceptible to either human researchers or traditional statistical methods (Yang and Griffiths, 1999). Another advantage of ANNs is that once a network is well trained, it can retain excellent performance even if degraded, noisy, or missing data are applied (Elling et al., 1997). ANNs are extremely useful when the functional relationship between dependent and independent variables is not known. ANNs are also valuable as they provide a flexible way of implementation when trained on examples.
ANNs have been applied to spectral signal interpretation since 1986 and most applications focus on obtaining structural information and identifying and quantifying compounds from various spectra including fluorescence, Raman, infrared, UV-Vis, mass, and NMR (Zupan and Gasteiger, 1999). An ANN can be trained to recognize and handle
64
nonlinear phenomena including spectral features that are subject to shifts and broadening due to interactions between compounds. Of particular interest is its potential both for extracting information from very noisy spectra and for analyzing highly complex convoluted spectra of complex mixtures. Among many of the different types of neural networks, the multilayer feedforward networks trained with back-propagation have been used most widely (Zupan and Gasteiger, 1991; Zupan and Gasteiger, 1999). This type of network is particularly powerful for pattern recognition and classification and function approximation. It has been shown that a three- layer (input, hidden, and output layers) feedforward, error-backpropagation ANN with sigmoid activation functions is a universal approximater because it can approximate any continuous function to any degree of accuracy (Castro et al., 2000; Warner and Misra, 1996).
Figure 38. Construction of ANN used in the oil-in-water content monitoring
system.
Recently ANNs have been applied to an oil- in-water content monitoring system. The ANN approach has been used to improve the in situ, real-time quantification of petroleum products in wastewater using an online fluorescence detection scheme, even in the presence of various physical and chemical interferences (He et al., 2000). When fluorescence intensity is used in a linear model to predict single oil concentrations in oily
65
water mixtures, the measurement accuracy falls between 40-67%. When trying to predict mixtures of four oil types, the prediction rate is only 28%. Using fluorescence and light scattering data as inputs to an artificial neural network, Figure 38, prediction of oil concentrations is 100% accurate for single oils and 98% accurate for mixed oils. The trained ANN has been successfully used to qualitatively identify oils and quantitatively predict oil concentrations with high accuracy in complex aqueous media by using multivariate spectra of fluorescence and light scattering (Andrews and Lieberman, 1994; He et al., 2000; He et al., 2001). The real- time oil detection and quantification technology is being transitioned to commercial applications.
An ANN-based, multivariate, multispectral algorithm would be useful to process the Raman spectral signal in real time. The multivariate signal-processing algorithm could improve the accuracy of the measurement and account for potential interferences that might arise from the coating and environmental factors such as dissolved organic matter and interfering anions. Furthermore, it has been demonstrated that the ANN method allows for enhancing detection levels - lower detection limits and improving the analysis of low S/N spectra (Lerner et al., 1993). The obvious benefits of increased sensitivity include the ability to detect and analyze ever-lower concentrations with shorter data acquisition times. Even more important is the possibility of using simpler, lower-cost instrumentation to accomplish the same tasks that previously required a high-end system. Sensitivity enhancement on one to two orders of magnitude can be achieved using ANNs. Specifically, Raman spectra with a S/N of <1 have permitted positive identification of organic compounds with close to 100% confidence (Lerner et al., 1993; Lerner and Lu, 1993)
66
5 PROJECT ACCOMPLISHMENTS
Table 9 summarizes the publications that have, or are, in the process of being published.
Table 9. Summary of publications.
Title Forum “Applications of Chemically Modified SERS Substrates”
Presented at the IFPAC-2002 Sixteenth International Forum Process Analytical Chemistry/ OnSite 2002 Tenth International Conference On-Site Analysis, San Diego, CA Jan. 22-25, 2002
“Development of a Surface-Enhanced Raman Spectroscopy (SERS)-Based Sensor for the Long-Term Monitoring of Toxic Anions”
Poster at the SERDP-ESTCP Partners in Technology Technical Symposium and Workshop, Washington D.C., Dec. 3-5, 2002
“Surface Enhanced Raman Spectroscopy (SERS) and Molecular Modeling of the Chromate Interaction with 4-(2-Mercaptoethyl) Pyridinium”
Langmuir, accepted.
“Detection of Anions by Normal Raman Spectroscopy and Surface Enhanced Raman Spectroscopy (SERS) of Cationic-Coated Substrates”
Applied Spectroscopy, accepted.
“Integrated Optical Waveguide Sensor” Patent, Navy Case 82434
67
6. CONCLUSIONS
The detection of chromate, perchlorate, and cyanide by SERS of cationic coatings has been demonstrated. Knowing the values of K and g for the interaction between the coating and the anion, the calibration curve can be generated using a single anion calibration standard (Mosier-Boss and Lieberman, 2001). Detection limits are in the ppb-ppm concentration range. Dichromate could not be detected using the SERS technique because it reacted with the alkyl and aromatic cationic thiols to form a thioester. The cationic thiols possess no anion recognition functionality other than a positive charge. In general, the strength of interaction of the cationic thiols was stronger for those ions that exhibit a higher charge or a smaller solvated radius or a greater polarizability. It was shown that 4-(2-mercaptoethyl)pyridinium (MEP) exhibited great selectivity for chromate. This selectivity was attributed to hydrogen bonding. Molecular modeling indicates that there are microcavities present between adjacent MEP moieties on the SERS surface with a three-dimensional structure complimentary both in shape and chemical functionality to that of the chromate ion. Using the MEP coating and averaging five spectra obtained using 20 s acquisition times, an LOD of 59.3 ppb chromate was achieved. Improved selectivities for the other anions can be achieved through the use of molecular imprinting. Roughening parameters for both silver and gold substrates were optimized to increase sensitivity of the SERS technique. The use of waveguides to increase sensitivity was examined and it was determined that hollow waveguides have great applicability for use in an environmental sensor. Additional work needs to be done on implementation. Signal processing techniques, in particular filtering in the Fourier domain and smoothing using the Savitsky-Golay method, can be used to improve the S/N ratio and, consequently, sensitivity. Artificial neural networks (ANNs) can be used to automate speciation and improve sensitivity. Use of the SERS sensor system would replace the need to send out samples for analysis. Out in the field, the SERS sensor module would be inserted into a sample of groundwater brought up to the surface or the SERS probe has to be packaged in such a way that it could be lowered into a monitoring well directly. Sampling could then be done at several depths and the anions would be identified and quantified by their SERS response. Alternatively, the sensor can be deployed in a towed-body or a buoy to detect anionic contaminants in aquatic bodies such as ponds, lakes, rivers, etc. The fiber optic SERS sensor can also be deployed in a cone penetrometer (CPT) sampling probe. The advantages of the SERS sensor over conventional techniques are (1) the required information is obtained in real-time, (2) it doesn’t require the additional cost of an out side laboratory, and (3) decisions can be made in a timely fashion as to whether or not additional sampling is required and where that sampling is needed. The ‘backside configuration’ of obtaining spectral data is attractive for environmental monitoring. In the backside configuration, the excitation light passes through the substrate and a thin metal film (≤ 200 Å) and is focused onto the SERS/sample interface. Advantages of the backside configuration are greater signal intensities; reduced attenuation of the signal by water, which strongly absorbs near IR excitation; and minimized fluorescence interference since excitation only occurs at the
68
metal film/liquid interface. An adapter was fabricated that houses an InPhotonics fiber optic probe and a SERS substrate.
69
7. TRANSITION PLAN
The results of this investigation indicate that SERS is an attractive, sensitive technique for the long term monitoring of toxic anions. Detection limits in the ppb-ppm concentration range are easily achievable. The characteristic spectral signature of the analyte allows for accurate speciation. The instrumentation is portable and easy to operate. Use of the SERS sensor system would replace the need to send out samples for analysis. As described previously, the sensor can be deployed in a number of configurations – it can be lowered into monitoring wells; placed in a towed body, a buoy, or inside a cone penetrometer sampling probe; etc. Use of such a system would result in savings both in cost and time. The cost of an outside laboratory to perform the analysis of samples is dependent upon the required analytical procedure. For example, VOCs are typically done by purge-and-trap GC-MS and metals are analyzed using ICP, which cannot differentiate between CrVI and CrIII species. Analytical costs can range anywhere between $50.00 and $100.00 per sample. If analytical results for multiple contaminants are requested for each sample, the costs increase accordingly. It can also take weeks or months to obtain the final analytical results. The advantage of in-situ sensors is monitoring in real-time, which aids in the decision making process. The instrumentation is a one-time, up-front cost. A portable Raman system complete with diode laser, CCD detector, spectrometer, fiber-optic umbilical, and SERS sensor module is estimated to cost between $40-50K. These costs are comparable to other, commercially available, portable environmental systems and to the Navy SCAPS (Site Characterization and Analysis Penetrometer System) laser induced fluorescence (LIF) system used to detect subsurface petroleum hydrocarbon plumes. It should be noted that a budget of $50K would pay for 500-1000 analyses. During the SCAPS metal sensors ESTCP demonstration, a total of 127 samples from six push holes at four different sites were analyzed (Lieberman et al., 2001). This number of samples is insignificant compared to the sampling required for long-term monitoring. Consequently, it is expected that the cost savings resulting from not sending samples to outside laboratories for analysis would more than pay for the instrumentation. Cost of operation of the instrumentation would be comparable to the costs currently accrued for obtaining samples, packaging them, and shipping them. The success of using SERS to detect perchlorate, chromate, dichromate, and cyanide anions is dependent upon identifying a suitable thiol coating(s) to attract the anions to the SERS surface. A selective coating, MEP, has been identified for the detection of chromate ion. However, dichromate reacts with the coating to form a thioester. In order to use this technique to detect dichromate, either dichromate is converted to chromate by the addition of carbonate or blocking functional groups (such as negatively charged carboxylate or sulfonate groups) are placed near the sulfur atom of the thiol to prevent formation of a thioester. Both of these approaches will need to be explored further in order to advance this technology. Because the ion pair constant for chromate and MEP is very large (>105), one would think that this will cause problems with reversibility. However, Turyan and Mandler (1997) showed that reduction of CrVI to CrIII regenerates the surface. This will require modification of the sensor module to provide for electrochemical capabilities. For perchlorate, CY is probably the optimum coating of the ones investigated. As shown in Table 3, the ion pair constant for
70
perchlorate and CY is approximately six times stronger than that for sulfate, 20 times stronger than nitrate’s, and 60 times stronger than chloride’s. However, this coating cannot be used to detect perchlorate in the presence of chromate, dichromate, and cyanide. For cyanide, the MEP coating exhibits the greatest sensitivity. As shown in Table 6, the ion pair constant for cyanide and MEP is approximately ten times stronger than that for chloride and 30 times stronger than that for perchlorate. The cyanide concentration needs to be 1000 ppm or less for detection. At higher cyanide concentrations, degradation of the signal is observed as the cyanide reacts with the gold surface. Also the MEP coating cannot be used to detect cyanide in the presence of chromate and dichromate. Molecular imprinting would need to be done to create films that are specific for perchlorate and cyanide. 7.1 Proposed Implementation The Environmental Sciences Division of SSC SD has been successful in developing and transitioning field screening technology. Both the LIF and GeoVIS video imaging systems were transitioned to Navy SCAPS (Site Characterization and Analysis Penetrometer System) units operated by NAVY PWC in San Diego, CA and Jacksonville, FL. The GeoVIS imaging system has also been transitioned to the Department of Energy (DOE) penetrometer system operated out of Savannah River. Besides cone penetrometry, the Navy SCAPS units operated by NAVY PWC also install microwells and do sampling. Currently the samples are packaged and sent to an off-site laboratory for analysis. However, the SERS technology, once fully developed, will allow personnel to complete the analysis in real- time. Besides the detection of anions, this technology has the capability to detect VOCs, metal ions, drugs, explosives (Sylvia, Spencer, and Janni, 2000), and agents used in chemical warfare. The coated SERS substrate can be mounted on a thermoelectric cooler (TEC) to detect volatile and semi-volatile compounds. For example, in this laboratory, detection of ng quantities of TCE, chloroform, and MTBE has been demonstrated using TEC-SERS. The SERS technology fits into a number of SERDP and ESTCP areas of interest including bioremediation, compliance, and monitoring. In bioremediation, treatment systems are composed of treatment wells and monitoring wells. In the treatment wells, growth substrates, such as toluene, and other nutrients (nitrate, phosphate, etc.) are injected to promote microbial growth and activity. The TEC-SERS and SERS probes could be used in the monitoring wells to monitor concentrations of the nutrients injected as well as the contaminants being co-metabolized with the growth substrate. Such a capability could be used to optimize the bioremediation process. The SERS technology shows a great deal of promise in detecting and speciating a wide range of chemical compounds. It is expected that the potential benefits of this technology will lead to more extensive follow-on development efforts within SERDP and future transition to DoD, other SERDP partners, and the private sector as a cost effective monitoring capability for the Environmental Restoration Program. Besides the Navy SCAPS units, there are cone penetrometer systems operated by the Army and private sector as well as companies specializing in environmental sampling. Finally, both TEC-SERS and SERS could be used for process control applications, monitoring contaminants present in run-off, as well as applications in homeland security and force protection.
71
8. RECOMMENDATIONS
The objective of this seed project was to demonstrate that toxic anions such as chromate, dichromate, cyanide, and perchlorate can be detected by SERS using cationic coatings. Except for dichromate, this objective has been met. Most promising results were obtained using MEP to detect chromate. The Au/MEP SAM exhibited remarkable selectivity for chromate ion and detection limits on the order of 59 ppb were readily achieved. This coating can differentiate between CrVI and CrIII, something that can not be done using conventional techniques. Because chromium contamination is present in over half of the superfund sites, further development of the Au/MEP system is recommended. However, it was shown that dichromate reacts with MEP to form a thioester. In order to use this technique to detect dichromate, either dichromate needs to be converted to chromate by the addition of carbonate or blocking functional groups (such as negatively charged carboxylate or sulfonate groups, or a longer alkyl chain between the sulfur atom and the recognition element) need to be placed near the sulfur atom of the thiol to prevent formation of a thioester. Alternatively a SiO 2 overcoat can be vapor-deposited onto the SERS surface. A silane containing pyridinium could then react with the Si-O bonds to form the selective coating. The use of SiO 2 overcoated SERS substrates has been demonstrated by Lacy et al. (1996). These potentia l solutions need further investigation. Also the use of electrochemical pulsing to either drive off CrVI or reduce CrVI to CrIII needs to be explored to regenerate the Au/MEP surface. The use of electrochemical pulsing will require modification of the sensor module.
Figure 39. The InPhotonics’ field deployable Raman system, the InPhotote.
A hollow waveguide for SERS should be developed to increase the sensitivity of the SERS technique. An ANN training set needs to be assembled for MEP and the
72
anions. The ANN would be used to automate speciation and quantification. An ANN would also improve sensitivity. A field deployable system needs to be assembled. InPhotonics offers the InPhotote, a compact, rugged, portable Raman spectrometer shown in Figure 39. It is comprised of a frequency stabilized, 300 mW adjustable power, 785 nm external cavity diode laser; a high throughput, proprietary, linear spectrograph with no moving optical or mechanical parts; a two-stage TE-cooled 1024x128 pixel CCD array detector running at –25 °C; and a RamanProbe fiber optic sampling probe (Figure 30) that has a 5 m cable length and 5 mm working distance. There are FC couplers on the instrument so probes with longer lengths or configurations can be easily attached and detached. All components are shock-mounted in a rugged, water-resistant case. The fully integrated system weighs 20 lbs and has outer dimensions of 16 in x 10 in x 9 in. The system can be battery powered. The InPhotote has been designed for field identification of unknown chemicals using normal Raman spectroscopy. The system is sensitive as shown by the spectrum obtained for benzene saturated water (~ 1200 ppm benzene), Figure 40. For field use, the fiber optic probe would be housed inside a SERS sensor module, as shown in Figures 34 and 36. How the SERS sensor can be deployed in the field has been described vide supra.
Figure 40. Spectrum of benzene saturated water (benzene concentration is ~1200 ppm) obtained using the InPhotote. The spectrum was obtained using 785 nm excitation (120 mW
power at the sample) and a 60 s acquisition time.
200 625 1050 1475 1900
wavenumber (cm-1)
0
2500
5000
7500
10000
inte
nsi
ty
benzene
73
9. REFERENCES 1952 B.E. Saltzman. “Microdetermination of Chromium With Diphenylcarbazide by
Permanganate Oxidation: Improved Method of Oxidation and Color Development”, Anal. Chem., Vol. 24, p. 1016-1020.
1958 T.L. Allen. “Microdetermination of Chromium With 1,5-
Diphenylcarbohydrazide”, Anal. Chem., Vol. 30, p. 447-450. 1963 A. Allerhand and P. von Ragué Schleter. “Halide Anions as Proton Acceptors in
Hydrogen Bonding”, J. Am. Chem. Soc., Vol. 85, p. 1233-1237. 1976 J.B. Lambert, H.F. Shurvell, L. Verbit, R.G. Cooks, and G.H. Stout. Organic
Structural Analysis, Macmillan Publishing, New York. 1978 J.J. Christensen, J.D. Lamb, S.R. Izatt, S.E. Starr, G.C. Weed, M.S. Astin, B.D.
Stitt, and R.M. Izatt. “Effet of Anion Type on Rate of Facilitated Transport of Cations Across Liquid Membranes via Neutral Macrocyclic Carriers”, J. Am. Chem. Soc., Vol. 100, p. 3219-3220.
1980 J.D. Lamb, J.J. Christensen, S.R. Izatt, K. Bedke, M.S. Astin, and R.M. Izatt.
“Effects of Salt Concentration and Anion on the Rate of Carrier-Facilitated Transport of Metal Cations Through Bulk Liquid Membranes Containing Crown Ethers”, J. Am. Chem. Soc., Vol. 102, p. 3399-3403.
1982 I. Chabay. “Optical Waveguides”, Anal. Chem., Vol. 54, p. 1071A-1080A. 1982 R. Taylor and O. Kennard. “Crystallographic Evidence for the Existence of
C-H···O, C-H···N, and C-H···Cl Hydrogen Bonds”, J. Am. Chem. Soc., Vol. 104, p. 5063-5070.
1983 B. Pettinger and L. Moerl. “Influence of Foreign Metal Atoms Deposited at
Electrodes on Local and Nonlocal Processes in Surface Enhanced Raman Scattering”, J. Electron Spectrosc. Relat. Phenom., Vol. 29, p. 383-395.
1983 T.E. Furtak and S.H. Macomber. “ Voltage-Induced Shifting of Charge-Transfer
Excitations and Their Role in Surface Enhanced Raman Scattering”, Chem. Phys. Lett., Vol. 95, p. 328-332.
1987 L.-W.H. Leung, D. Gosztola, and M.J. Weaver. “Surface-Enhanced Raman
Scattering from Gold Electrodes Modified by Underpotential-Deposited Silver and Copper Monolayers: Spectral and Double-Layer Comparisons with Silver and Copper Electrodes”, Langmuir, Vol. 3, p. 45-58.
1989 J. Janata. Principles of Chemical Sensors, Plenum Press, New York, NY.
74
1990 B.J. Wythoff, S.P. Levine, and S.A. Tomellini. “Spectral Peak Verification and Recognition Using a Multilayered Neural Network”, Anal. Chem., Vol. 62, p. 2702-2709.
1991 K.T. Carron and L.G. Hurley. “Axial and Azimuthal Angle Determination With
Surface-Enhanced Raman Spectroscopy: Thiophenol on Copper, Silver, and Gold Surfaces”, J. Phys. Chem., Vol. 95, p. 9979-9984.
1991 I.K. Henderson, R. Saari-Nordhaus, and J.M. Anderson, Jr. “Sample Preparation
for Ion Chromatography by Solid-Phase Extraction”, J. Chromatogr., Vol. 546, p. 61-71
1991 W. Mazurek, P.J. Nichols, and B.O. West. “Chromium (VI)-Thioester Formation
in N,N-Dimethylformamide”, Polyhedron, Vol. 10, p. 753-762. 1991 M.E. Munk, M.S. Madison, and E.W. Robb. “Neural Network Models for
Infrared Spectrum Interpretation”, Mikrochimica Acta, Vol. II, p. 505-514. 1991 J.J. Rosentreter and R.K. Skogerboe. “Trace Determination and Speciation of
Cyanide Ion by Atomic-Absorption Spectroscopy”, Anal. Chem., Vol. 63, p. 682-688.
1991 J. Zupan, and J. Gasteiger. “Neural Networks: A New Method for Solving
Chemical Problems or Just a Passing Phase?”, Anal. Chim. Acta, Vol. 248, p.1-30.
1992 K. Carron, L. Peitersen, and M. Lewis. “Octadecylthiol-Modified Surface-
Enhanced Raman Spectroscopy Substrates: A New Method for the Detection of Aromatic Compounds”, Environ. Sci. Technol., Vol. 26, p. 1950-1954.
1993 J.M. Lerner and T. Lu. “Practical Neural Networks Aid Spectroscopic Analysis”,
Photonics Spectra, August, p. 93-98. 1993 J.M. Lerner, T. Lu, M. Angel, and K.Kyle. “Enhancing Minimum Detection
Levels of Chlorinated Hydrocarbons”, Am. Lab., Sept., p. 36C-36G. 1993 P.A. Meloni and R.S. Czernuszewicz. “Complexation of Hexavalent Cromium to
Glutathione from Raman Spectroscopy”, Vibrational Spectosc., Vol. 5, p. 205-213.
1994 J.M. Andrews and S.H. Lieberman. “Neural Network Approach to Qualitative
Identification of Fuels and Oils from Laser Induced Fluorescence Spectra”, Anal. Chim. Acta, Vol. 285, p. 237-246.
1994 K.T. Carron and K. Mullen. “Adsorption of Chlorinated Ethylenes at 1-
Octadecanethiol- Modified Silver Surfaces”, Anal. Chem., Vol. 66, p. 478-483.
75
1994 K. Sumi, M. Kimura, E. Kokufuta, and I. Nakamura. “Selective Uphill Transport
of Cyanide Ion Mediated by Tetraphenylporphinatomanganese (III) Complex Through Bulk and Polymer-Supported Liquid Membranes”, J. of Membrane Sci., Vol. 86, p. 155-169.
1995 L.G. Crane, D. Wang, L.M. Sears, B. Heynes, and K. Carron. “SERS Surface
Modified With a 4-(2-(Pyridylazo)Resorcinol Disulfide Derivative: Detection of Copper, Lead, and Cadmium”, Anal. Chem., Vol. 67, p. 360-364.
1995 R.S. Hutchins and L.G. Bachas. “Nitrate-Selective Electrode Developed by
Electrochemically Mediated Imprinting/Doping of Polypyrrole”, Anal. Chem., Vol. 67, p. 1654-1660.
1995 W.K. Kowalchyk, P.A. Walker III, and M.D. Morris. “Rapid Normal Raman
Spectroscopy of Sub-ppm Oxy-Anion Solutions: The Role of Electrophoretic Preconcentration”, Appl. Spectrosc., Vol. 49, p. 1183-1188.
1995 P.A. Mosier-Boss, S.H. Lieberman, and R. Newbery, “Fluorescence Rejection in
Raman Spectroscopy by Shofted-Spectra, Edge-Detection, and FFT Filtering Techniques”, Appl. Spectrosc., Vol. 49, p. 630-638.
1995 M. Nishizawa, V.P. Menon, and C.R. Martin. “Metal Nanotubule Membranes
with Electrochemically Switchable Ion-Transport Selectivity”, Science, Vol. 268, 700-702.
1995 A. Pal, D.L. Stokes, J.P. Alarie, and T. Vo-Dinh. “Selective Surface-Enhanced
Raman Spectroscopy Using a Polymer-Coated Substrate”, Anal. Chem., Vol. 67, p. 3154-3159.
1995 J.M.E. Storey, T.E. Barber, R.D. Shelton, E.A. Wachter, K.T. Carron, and Y.
Jiang. “Applications of Surface-Enhanced Raman Scattering (SERS) to Chemical Detection”, Spectrosc., Vol. 10, 20-25.
1996 J. Baldwin, N. Schühler, I.S. Butler, and M.P. Andrews. “Integrated Optics
Evanescent Wave Surface Enhance Raman Scattering (IO-EWSERS) of Mercaptopyridines on a Planar Optical Chemical Bench: Binding of Hydrogen and Copper Ion”, Langmuir, Vol. 12, p. 6389-6398.
1996 J. Casabó, L. Escriche, C. Pérez-Jiménez, J.A. Muñoz, F. Teixidor, J. Bausells,
and A. Errachid. “Application of a New Phosphadithiamacrocycle to ClO 4- -
selective CHEMFET and Ion-Selective Electrode Devices”, Anal. Chim. Acta, Vol. 320, p. 63-68.
76
1996 R.A. Bartsch and J.D. Way. “Chemical Separations with Liquid Membranes: an Overview”, in Chemical Separations with Liquid Membranes, R.A. Bartsch and J.D. Way, eds., American Chemical Society, Washington, D.C., p. 9-15.
1996 V. Benoit and M.C. Yappert. “Characterization of a Simple Raman Capillary/Fiber
Optical Sensor”, Anal. Chem., Vol. 68, p. 2255-2258 1996 L.A.J. Chrisstoffels, F. De Jong, and D.N. Reinhoudt. “Mechanistic Studies of
Carrier-Mediated Transport Through Supported Liquid Membranes”, in Chemical Separations with Liquid Membranes, R.A. Bartsch and J.D. Way, eds., American Chemical Society, Washington, D.C., p. 18-56.
1996 G.R. Desiraju. “The C-H···O Hydrogen Bond: Structural Implications and
Supramolecular Design”, Acc. Chem. Res., Vol. 29, p. 441-449. 1996 R.T. Peterson and J.D. Lamb. “Design of Macrocyclic Carriers” in Chemical
Separations with Liquid Membranes, R.A. Bartsch and J.D. Way, eds., American Chemical Society, Washington, D.C., p. 130-141.
“Characterization of SiO 2-Overcoated Silver-Island Films as Substrates for Surface-Enhanced Raman Scattering”, Anal. Chem., Vol. 68, p. 1003-1011.
1996 S. Licht, N. Myung, and Y. Sun. “A Light Addressable Photoelectrochemical
Cyanide Sensor”, Anal. Chem., Vol. 68, 954-959. 1996 T. Tatsuma and N. Oyama. “H2O2 –Generating Peroxidase Electrodes as
Reagentless Cyanide Sensors”, Anal. Chem., Vol. 68, p. 1612-1615. 1996 B. Warner and M. Misra. “Understanding Neural Networks as Statistical Tools”,
Am. Statistician, Vol. 50, p. 284-293. 1997 J.W. Elling, J.P.L. Sharbari Lahiri, Randy S. Roberts, Susan I. Hruska, Kristin L.
Adair, Alan P. Levis, Robert G. Timpany, and John J. Robinson. “Hybrid Artificial Intelligence Tools for Assessing GC Data”, Anal. Chem., Vol. 69, p. 409 A-415 A.
1997 A. Errachid , C. Pérez-Jiménez , J. Casabó, L. Escriche, J.A. Muñoz, A.Bratov,
and J. Bausells. “Perchlorate-selective MEMFETS and ISEs Based on a New Phosphadithiamacrocycle”, Sensors and Actuators B, Vol. 43, p. 206-210.
1997 E.M. Georgiev, N. Wolf, and D.M. Roundhill. “Lower Rim Alkylammonium-
substituted Calix[4]arenes as ‘Proton-Switchable’ Extractants for Chromate and Dichromate Anions”, Polyhedron, Vol. 16, p. 1581-1584.
77
1997 K.B. Jirage, J.C. Hulteen, and C.R. Martin. “Nanotubule-Based Molecular-Filtration Membranes”, Science, Vol. 278, p. 655-658.
1997 K. Kneipp, Y. Wang, H. Kneipp, L.T. Perelman, I. Itzkan, R.D. Dasari, and M.S.
Feld. “Single Molecule Detection Using Surface-Enhanced Raman Scattering (SERS)”, Phys. Rev. Lett., Vol. 78, p. 1667-1670.
1997 K.L. Norrod, L.M. Sudnik, D. Rousell, and K.L. Rowlen. “Quantitative
Comparison of Five SERS Substrates: Sensitivity and Limit of Detection”, Appl. Spectrosc., Vol. 51, 994-1001.
1997 S. Nie and S.R. Emory. “Probing Single Molecules and Single Nanoparticles by
Surface-Enhanced Raman Scattering”, Science, Vol. 275, p. 1102-1106. 1997 F.P. Schmidtchen and M. Berger. “Artificial Organic Host Molecules for
Anions”, Chem. Rev., Vol. 97, p. 1609-1646. 1997 C.G. Siontorou and D.P. Nikolelis. “Cyanide Ion Multisensor Based on
Methemoglobin Incorporated in Metal Supported Self-Assembled Bilayer Lipid Membranes and Modified with Platelet-Activating Factor”, Anal. Chim. Acta, Vol. 355, p. 227-234.
Juneja, and R.S. Burkhalter. “Anion Binding within the Cavity of π-Metalated Calixarenes”, J. Am. Chem. Soc., Vol. 119, p. 6324-6335.
1997 I. Turyan and D. Mandler. “Selective Determination of Cr(VI) by a Self-
Assembled Monolayer-Based Electrode”, Anal. Chem., Vol. 69, p. 894-897. 1997 K.P. Xiao, P. Bühlmann, S. Nishizawa, S. Amemiya, and Y. Umezawa, “A
Chloride Ion-Selective Solvent Polymeric Membrane Electrode Based on a Hydrogen Bond Forming Ionophore”, Anal. Chem., Vo l. 69, p. 1038-1044.
1998 P. Bühlmann, S. Amemiya, S. Nishizawa. K.P. Xiao, and Y. Umezawa.
“Hydrogen-Bonding Ionophores for Inorganic Anions and Nucleotides and Their Application in Chemical Sensors”, J. Inclusion Phenom. Mol. Recognit. Chem., Vol. 32, p. 151-163.
1998 P. Bühlmann, E. Pretsch, and E. Baker. “Carrier-Based Ion-Selective Electrodes
and Bulk Electrodes. 2. Ionophores for Potentiometric and Optical Sensors”, Chem. Rev., Vol. 98, p. 1593-1687.
1998 A.F. Danil de Namor, R.M. Cleverley, and M.L. Zapata-Ormachea.
“Thermodynamics of Calixarene Chemistry”, Chem. Rev., Vol. 98, p. 2495-2525.
78
1998 S.R. Emory and S. Nie. “Screening and Enrichment of Metal Nanoparticles with Novel Optical Properties”, J. Phys. Chem. B, Vol. 102, p. 493-497.
1998 W.J. Hehre, J. Yu, P.E. Klunzinger, and L. Lou. A Brief Guide to Molecular
Mechanics and Quantum Chemical Calculations, Wavefunction, Inc., Irine, CA. 1998 S. Himeno, Y. Nakashima, and K.-I. Sano. “Simultaneous Determination of
Chromium (VI) and Chromium (III) by Capillary Electrophoresis”, Anal. Sci., Vol. 14, p. 369-373.
1998 J.C. Hulteen, K.B. Jirage, and C.R. Martin. “Introducing Chemical Transport
Selectivity into Gold Nanotubule Membranes”, J. Am. Chem. Soc., Vol. 120, p. 6603-6604.
1998 K. Kneipp, H. Kneipp, R. Manoharan, E.B. Hanlon, I. Itzkan, R.R. Dasari, and M.S.
Feld. “Extremely Large Enhancement Factors in Surface-Enhanced Raman Scattering for Molecules on Colloidal Gold Clusters”, Appl. Spectro., Vol. 52, p. 1493-1497.
1998 I.S. Krull and M.E. Swartz. “Determining Limits of Detection and Quantification”,
LC·GC, Vol. 16, p. 464-465. 1998 Y.S. Pang, H.J. Hwang, and M.S. Kim. “Adsorption of 2-Mercaptopyridine and 2-
Mercaptopyrimidine on a Silver Colloidal Surface Investigated by Raman Spectroscopy”, J. Mol. Struct., Vol. 441, p. 63-76.
1998 V.V. Tarabara, I.R. Nabiev, and A.V. Feofanov. “Surface-Enhanced Raman
Scattering (SERS) Study of Mercaptoethanol Monolayer Assemblies on Silver Citrate Hydrosol. Preparation and Characterization of Modified Hydrosol as a SERS-Active Substrate”, Langmuir, Vol. 14, p. 1092-1098.
1999 R. Altkorn, I. Koev, and M.J. Pelletier. “Raman Performance Characteristics of
1999 R.J. Dijkstra, A.N. Bader, G.Ph. Hoornweg, U.A. Th. Brinkman, and C. Gooijer. “On-Line Coupling of Column Liquid Chromatography and Raman Spectroscopy Using a Liquid Core Waveguide”, Anal. Chem., Vol. 71, p. 4575-4579.
1999 M. Holtz, P.K. Dasguota, and G. Zhang. “Small-Volume Raman Spectroscopy with a Liquid Core Waveguide”, Anal. Chem., Vol. 71, p. 2934-2938.
1999 Z. Jie and H. Xiwen. “Study of the Nature of Recognition in Molecularly
Imprinted Polymer Selective for 2-Aminopyridine”, Anal. Chem. Acta, Vol. 381, p. 85-91.
79
1999 K.B. Jirage, J.C. Hulteen, and C.R. Martin. “Effect of Thiol Chemisorption on the Transport Properties of Gold Nanotubule Membranes”, Anal. Chem., Vol. 71, p. 4913-4918.
1999 W. Kim, V.P. Safonov, V.M. Shalaev, and R.L. Armstrong. “Fractals in
Microcavities: Giant Coupled, Multiplicative Enhancement of Optical Responses”, Phys. Rev. Letts, Vol. 82, p. 4811-4814.
1999 A.M. Michaels, M. Nirmal, and L.E. Brus. “Surface Enhanced Raman Spectroscopy
of Individual Rhodamine 6g Molecules on Large Ag Nanocrystals”, J. Am. Chem. Soc., Vol. 121, p. 9932-9939.
1999a P.A. Mosier-Boss and S.H. Lieberman. “Environmental Applications of Surface
Ion Chromatography to Detect Perchlorate”, J. Amer. Water Works Assoc., Vol. 91, p. 73-84.
1999 N. Shirtcliffe, U. Nickel, and S. Schneider. “Reproducible Preparation of Silver
Sols with Small Particle Size Using Borohydride Reduction: For Use as Nuclei for Preparation of Larger Particles”, J. Colloid Interface Sci., Vol. 211, p. 122-129.
1999 D.L. Stokes, A. Pal, V.A. Narayanan, and T. Vo-Dinh. “Evaluation of a
Chemical Vapor Dosimeter Using Polymer-Coated SERS Substrates”, Anal. Chim. Acta, Vol. 399, p. 265-274.
D.M. Roundhill. “Synthesis and Crystal Structures of Lower Rim Amine and Carbamoyl Substituted Calixarenes as Transfer Agents for Oxyanions Between an Aqueous and a Chloroform Phase”, Polyhedron, Vol. 18, p. 885-896.
1999 K.P. Xiao, P. Bühlmann, and Y. Umezawa, “Ion-Channel-Mimetic Sensing of
Hydrophilic Anions Based on Monolayers of a Hydrogen Bond-Forming Receptor”, Anal. Chem., Vol. 71, p. 1183-1137.
1999 Y. Yamaguchi, M.K. Weldon, and M.D. Morris. “Fractal Characterization of
SERS-Active Electrodes Using Extended Focus Reflectance Microscopy”, Appl. Spectrosc., Vol. 53, p. 127-132.
80
1999 H. Yang and P.R. Griffiths. “Application of Multilayer Feed-Forward Neural Networks to Automated Compound Identification in Low-Resolution Open-Path FT-IR Spectroscopy”, Anal. Chem., Vol. 71, p. 751-761.
1999 J. Zupan, and J. Gasteiger. Neural Networks in Chemistry and Drug Design,
Second ed. Wiley-VCH, New York. 2000 S. Al-Kindy, R. Badia, J.L. Suárez-Rodríguez, and M.E. Díaz-García.
“Molecularly Imprinted Polymers and Optical Sensing Applications”, Crit. Rev. in Anal. Chem., Vol.30, p. 291-309.
2000 I.S. Balogh, I.M. Maga, Á Hargitai-Tóth, and V. Andruch. “Spectrophotometric
Study of the Complexation and Extraction of Chromium (VI) with Cyanine Dyes”, Talanta, Vol. 53, p. 543-549.
2000 J.L. Castro, C.J. Mantas, and J.M. Benitez. “Neural Networks with a Continuous
Squashing Function in the Output are Universal Approximators”, Neural Networks, Vol. 13, p. 561-563.
2000 S. Cosnier, C. Gondran, R. Wessel, F.-P. Montforts, and M. Wedel. “Poly(pyrrolr-
metallodeuteroporphyrin)electrodes: towards Electrochemical Biomimetic Devices”, J. Electroanal. Chem., Vol. 488, p. 83-91 .
Monitoring of Oils in Wastewater Using Combined Ultraviolet Fluorescence and Light Scattering with an Artificial Neural Network”, Technical Report 1816, SSC-San Diego, San Diego, CA.
2000 Y.-C. Liu, B.-J. Hwang, W.-J. Jian, and R. Santhanam. “In Situ Cyclic
Voltammetry-Surface-Enhanced Raman Spectroscopy: Studies on the Doping-Undoping of Polypyrrole Film”, Thin Solid Films, Vol. 374, p. 85-91.
2000 M.L. Magnuson, E.T. Urbansky, and C.A. Kelty. “Microscale Extraction of
Perchlorate in Drinking Water with Low-Level Detection by Electrospray Mass Spectrometry”, Talanta, Vol. 52, p. 285-291.
2000 P.A. Mosier-Boss, R.D. Boss, and S.H. Lieberman. “Determination of the Ion-
Pair Constant between Chloride Ion and Cationic-Coated, Silver SERS Substrates Using Competitive Complexation”, Langmuir, Vol. 16: p. 5441-5448.
2000 P.A. Mosier-Boss and S.H. Lieberman. “Detection of Nitrate and Sulfate by
Normal Raman Spectroscopy and SERS of Cationic-Coated, Silver Substrates”, Appl. Spectrosc., Vol. 54, p. 1126-1135.
81
2000 U. Nickel, A. zu Castell, K. Pöppl, and S. Schneider. “A Silver Colloid Produced by Reduction with Hydrazine as Support for Highly Sensitive Surface-Enhanced Raman Spectroscopy”, Langmuir, Vol. 16, p. 9087-9091.
2000 Y. Nomura, K. Nagakubo, H.-S. Ji, A. Watanabe, T. Akimoto, S. McNiven, K.
Hayashi, Y. Arikawa, and I. Karube. “Continuous In Situ Cyanide Monitoring a Highly Selective FIA System”, Vol. 34, p. 2618-2622.
2000 G. Sauer, U. Nickel, and S. Schneider. “Preparation of SERS-Active Silver Film
Electrodes via Electrocrystallization of Silver”, J. Raman Spectrosc., Vol. 31, p. 359-363.
2000 Steed and J.L. Atwood. Supramolecular Chemistry, John Wiley and Sons, Ltd.,
Chichester, England. 2000 J.A. Sylvia, K.M. Spencer, and J.A. Janni. “Sniffing Landmines With Surface
Enhanced Raman Spectroscopy”, Eighth International Conference On-Site Analysis, Lake Las Vegas, NV Jan. 23-26, 2000.
2001 T.W. Collette and T.L. Williams. “Determination of Perchlorate in Some
Fertilizers and Plant Tissue by Raman Spectroscopy”, 222nd American Chemical Society National Meeting, Chicago, IL Aug. 26-30, 2001.
2001 V.P Drachev, W. Kim, V.P. Safonov, V.A. Podolikiy, N.S.
Zakovryashin, V.M. Shalaev, and R.L. Armstrong. “Low-Threshold and Broad-Band Multiphoton-Excited Light Emission from Metal Particle-Adsorbate Complexes in a Microcavity”, J. Modern Optics, in press.
2001 L.-M. He, L.L. Kear-Padilla, S.H. Lieberman, and J.M. Andrews. “Application of
Neural Networks in Online Oil Content Monitors”, p. 1404-1409 Proceedings of the International Joint Conference on Neural Networks, Vol. 2, Washington, DC. July 14-19.
2001 H.-F. Ji, T. Thundat, R. Dabestani, G.M. Brown, P.F. Britt, and P.V. Bonnesen.
“Ultrasensitive Detection of CrO4= Using a Microcantilever Sensor”, Anal.
Chem., Vol. 73, p. 1572-1576. 2001 S.B. Lee and C.R. Martin. “pH-Switchable, Ion-Permselective Gold Nanotubule
Membrane Based on Chemisorbed Cysteine”, Anal. Chem., Vol. 73, p. 768-775. 2001 C. Marenco, C.J.M. Stirling, and J. Yarwood. “Thiacalixarene Self-Assembled
Monolayers on Roughened Gold Surfaces and Their Potential as SERS-Based Chemical Sensors”, J. Raman Spectrosc., Vol. 32, p. 183-194.
2001 S.H. Lieberman, P.A. Boss, J. Cortes, and W.T. Elam. “Site Characterization and
Analysis Penetrometer System (SCAPS) Heavy Metal Sensors
82
Demonstration/Validation”, SPAWAR Systems Center San Diego Technical Report 1868.
2001 P.A. Mosier-Boss and S.H. Lieberman. “Detection of Anionic Nutrients by SERS
of Cationic-Coated Silver Substrates. Effect of Chloride Ion”, Appl. Spectrosc., Vol. 55, p. 1327-1336.
2001 L. Rivas, S. Sanchez-Cortes, J.V. Garcia-Ramos, and G. Morcillo. “Growth of
Silver Colloidal Particles Obtained by Citrate Reduction to Increase the Raman Enhancement Factor”, Langmuir, Vol. 17, p. 574-577.
2001 S.H. Strauss. “Monitoring Low Levels of Ionic Pollutants In Water Using
Attenuated Total Reflectance Infrared Spectroscopy”, 222nd American Chemical Society National Meeting, Chicago, IL Aug. 26-30, 2001.
2001 Y.-J. Yang and H.-J. Huang. “A Polyaniline-Modified Electrode-Based FIA
System for Sub-ppb-Level Chromium (VI) Analysis”, Anal. Chem., Vol. 73, p. 1377-1381.
2002 W.E. Doering and S. Nie. “Single-Molecule and Single-Nanoparticle SERS:
Examining the Roles of Surface Active Sites and Chemical Enhancement”, J. Phys. Chem. B, Vol. 106, p. 311-317.
2002 G. Drochioiu. “Fast and Highly Selective Determination of Cyanide with 2,2-
Dihydroxy-1,3-indanedione”, Talanta, Vol. 56, p. 1163-1165. 2002 Y.C. Liu and L.-Y. Jang. “Relationship between Crystalline Orientations of Gold
and Surface-Enhanced Raman Scattering Spectroscopy of Polypyrrole and Mechanism of Roughening on Gold via Cyclic Voltammetry”, J. Phys. Chem. B., Vol. 106, p. 6748-6753.
2002 ThermoOrion. “Sensing the Future”.
83
APPENDIX A: POINTS OF CONTACT
Dr. Pamela A. Boss SSC San Diego Code 2363 53475 Strothe Rd. Rm. 204 San Diego, CA 92152-6365 (619) 553-1603 FAX: (619)767-4339 email: bossp @spawar.navy.mil Dr. Stephen Lieberman SSC San Diego Code 2361 53475 Strothe Rd. Rm. 209 San Diego, CA 92152-6325 (619) 553-2778 FAX: (603)909-8049 email: lieberma @spawar.navy.mil Dr. Peter Seligman SSC San Diego Code 23601 53475 Strothe Rd. Rm. 231 San Diego, CA 92152-6335 (619) 553-5403 FAX: (619)553-6553 email: [email protected]
84
APPENDIX B: PUBLICATIONS Table B-1. Summary of publications.
Title Forum “Applications of Chemically Modified SERS Substrates”
Presented at the IFPAC-2002 Sixteenth International Forum Process Analytical Chemistry/ OnSite 2002 Tenth International Conference On-Site Analysis, San Diego, CA Jan. 22-25, 2002
“Development of a Surface-Enhanced Raman Spectroscopy (SERS)-Based Sensor for the Long-Term Monitoring of Toxic Anions”
Poster at the SERDP-ESTCP Partners in Technology Technical Symposium and Workshop, Washington D.C., Dec. 3-5, 2002
“Surface Enhanced Raman Spectroscopy (SERS) and Molecular Modeling of the Chromate Interaction with 4-(2-Mercaptoethyl) Pyridinium”
Langmuir, accepted.
“Detection of Anions by Normal Raman Spectroscopy and Surface Enhanced Raman Spectroscopy (SERS) of Cationic-Coated Substrates”
Applied Spectroscopy, accepted.
“Integrated Optical Waveguide Sensor” Patent, Navy Case 82434
85
B1. Presented at the IFPAC-2002 Sixteenth International Forum Process Analytical Chemistry/ OnSite 2002 Tenth International Conference On-Site Analysis, San Diego, CA Jan. 22-25, 2002
Applications of Chemically Modified SERS Substrates
Pamela A. Mosier-Boss and Stephen H. Lieberman
Because surface enhanced Raman spectroscopy (SERS) provides both spectroscopic information and sensitivity, this technique has been shown to be useful for trace analysis. However, the substrates themselves degrade with time resulting in a decrease in signal. On silver and gold surfaces, thiols (R-SH) are known to self-assemble to form compact layers. These thio l coatings have been shown to protect the SERS substrates from surface deterioration thereby extending their lifetimes. But this approach has an added advantage. The coating can be used to attract analytes of interest, which are then detected and identified by either their SERS response or by spectral changes observed in the SERS spectrum of the coating upon interaction. Aromatic solvents, chlorinated hydrocarbons, metal ions, and anions have been detected using thiol-coated SERS substrates. In this communication, the use of SERS to detect contaminants of environmental concern as well as chemical warfare agents is discussed. In particular, the preparation of SERS substrates, data analysis, and sensor design will be examined.
86
B2. Poster at the SERDP/ESTCP Annual Workshop, Washington D.C., Dec. 2002.
Development of a Surface Enhanced Raman Spectroscopy (SERS)-Based Sensor for the
Long Term Monitoring of Toxic Anions
Dr. Pamela A. Boss SPAWAR Systems Center San Diego Code 2363
For long-term monitoring purposes, it would be desirable to detect anionic contaminants such as chromate, dichromate, cyanide, and perchlorate in-situ and on-site so as to minimize sampling time and costs. Technical approaches currently used to detect these anions require the use of reagents, buffers, and mobile phases. This makes these technologies unattractive for use as a field analytical method to detect these anions in-situ. The ideal field deployable sensor would be able to detect these toxic anions reversibly in the low ppb concentration range, in-situ, on-site, with little or no sample preparation, and with no interferences. One technology that meets many of these criteria is SERS spectroscopy using cationic-coated silver substrates.
The advantages of SERS over other spectroscopic techniques are specificity and sensitivity. All polyatomic species will exhibit a characteristic Raman signature that can be used to both identify and quantify it. However, with time, these substrates oxidize resulting in a decrease in the SERS signal. To protect the silver or gold SERS substrates from degradation, the surface is allowed to react with a thiol to form a self-assembled monolayer. The added advantage with this approach is that thiol coatings can be chosen to attract the analytes of interest. In this SERDP sponsored effort, detection of chromate, dichromate, perchlorate, and cyanide using cationic-coated SERS substrates has been demonstrated. The interaction of these anions with the cationic coatings is described by
the Frumkin isotherm, θ
θ
θg
g
cKecKe
2
2
1+= , where θ is the fractional coverage of the analyte
on the coating, c is the solution concentration of analyte in M, K is the ion-pair constant between the anion and coating, and g is the Frumkin parameter. The Frumkin parameter takes into account interactions between the adsorbed species. Limits of detection in the ppb-ppm concentration range have been achieved. However, the coatings used in this investigation possess no anion recognition functionalities, other than a positive charge. Consequently these coatings interact simultaneously with different anions. Means of improving selectivity have been examined. These means include identifying ionophores specific for the anions and removal of the interferences using solid phase extraction, supported liquid membranes, and nanotubule technology. The electrochemical etching parameters have been optimized to lower the detection limit. A sensor module has been designed that can be used either stand-alone or inserted inside a modified, cone penetrometer sampler probe. When used in the stand-alone mode, the sensor module is immersed in samples obtained from monitoring wells. By inserting the sensor module inside a cone-penetrometer sampler probe, sampling of groundwater can be done at
87
various depths. Either sampling approach will provide the required information in real-time without requiring the additional cost of an outside laboratory.
88
B3. Paper Accepted by Langmuir
Surface Enhanced Raman Spectroscopy (SERS) and Molecular Modeling of the Chromate Interaction with 4-(2-Mercaptoethyl)Pyridinium
P.A. Mosier-Bossa and S.H. Lieberman
SPAWAR Systems Center San Diego, Code 236, San Diego, CA 92152
ABSTRACT The interaction of 4-(2-mercaptoethyl)pyridinium (HMEP+) hydrochloride with chromate was investigated using surface enhanced Raman spectroscopy (SERS) and molecular modeling. It was shown that HMEP+ on the gold surface attracted chromate to the SERS surface and that the adsorption of chromate onto the substrate is described by a Frumkin isotherm. The ion-pair constant for the chromate-HMEP+ interaction is more than three orders of magnitude larger than that measured for the HMEP+ interaction with perchlorate ion. The high selectivity of HMEP+ for chromate is attributed to hydrogen bonding between adjacent HMEP+ moieties on the SERS surface.
1. INTRODUCTION
Pyridinium derivatives form strong, stable complexes with chromate and dichromate.1-3 Recently, this complexation has been used for both Cr(VI) extraction4-6 and detection.7 Vinylpyridinium anion exchange membranes4 and poly(4-vinylpyridine) coated silica gel6 have been shown to be efficient, selective sorbents for removing chromium (VI) species from solution. The traditional approach for treating Cr(VI) contaminated water is to chemically reduce Cr(VI) to Cr(III), followed by precipitation of chromic hydroxide, Cr(OH)3. The vinylpyridinium modified anion exchange membranes and silica gels do not reduce the Cr(VI) oxoanions into Cr(III) cations. As a result these technologies avoid the difficulties at low Cr(VI) concentrations (mg/L to µg/L) where the redox reaction is kinetically slow. Nor do these technologies generate the sludge that results from the traditional treatment. By binding the Cr(VI) species and thereby removing them from the industrially generated wastestream, the vinylpyridinium modified anion exchange membranes and silica gels show great promise in the selective recovery and recycling of Cr(VI). Turyan and Mandler7 synthesized 4-(2-mercaptoethyl)-pyridinium and used it to form a self-assembled monolayer (SAM) on a gold electrode. They then used the modified electrodes to preconcentrate Cr(VI) prior to detection by cathodic stripping square wave voltammetry. Using these electrodes, they were able to detect Cr(VI) species in the parts per trillion level. They showed that the analysis of 0.1 ppb Cr(VI) was not affected by the presence of a 1000 fold excess of Cr(III). The pyridinium coating showed great selectivity for the Cr(VI) species. The anions chloride, nitrate, phosphate, acetate, and perchlorate did not interfere in the detection of the Cr(VI) species. Only molybdate anion showed a considerable interference, due to its similar structure and size.
a Author to whom correspondence should be sent.
89
Turyan and Mandler7 suggested that the high Cr(VI) selectivity of their pyridinium-functionalized SAM is due to hydrogen bonding. The existence of hydrogen bonding in the pyridinium-Cr(VI) complexes has been confirmed by X-ray diffraction, IR, and 1H NMR spectroscopic techniques.2,3 One technology that could prove useful in probing the pyridinium-Cr(VI) complexation is surface enhanced Raman spectroscopy (SERS). Because they are polyatomic species, both the pyridinium-functionalized SAM and Cr(VI) oxoanions will exhibit characteristic Raman spectra. The SERS technique has been used to follow the adsorption of Pb2+, Cd2+, and Cu2+ metal cations onto a 4-(2-pyridylazo)resorcinol (PAR) coated silver substrate.8 Ionic species such as Pb2+, Cd2+, and Cu2+ do not exhibit a Raman active mode. However, it was possible to monitor the interaction between the cation and coating by examining the changes in the SERS spectrum of the coating. Recently SERS has been used to examine the complexation of pyridine-functionalized SAMs with porphyrins9,10 and Cu2+ cations.11 In this communication, molecular modeling and SERS are used to obtain a better understanding of the Cr(VI)-pyridinium complexation.
2. EXPERIMENTAL 2.1 Reagents
Sodium chromate (Aldrich), sodium perchlorate (Aldrich), 4-(2-mercaptoethyl) pyridinium (HMEP+) hydrochloride (Toronto Research Chemicals), 2-mercapto-4-methylpyrimidine (HMMP+) hydrochloride (Avocado Research Chemicals), potassium chloride (Aldrich), and HPLC grade water (Aldrich) were used as received. Ethanol (HPLC grade, Aldrich) was dried by refluxing over magnesium turnings, distilling, and collecting the middle fraction. Aqueous solutions of perchlorate and chromate were prepared using deionized water.
2.2 Preparation of SERS Substrates
An insulated copper wire was soldered to a 0.75 cm length of 2 mm diameter gold or silver wire (Aldrich, 99.9%). The silver/gold wire was potted inside a 5mm outer diameter glass tube with a chemically resistant epoxy (Epoxy Patch 1C, Hysol). Prior to use, the silver/gold disk of the electrode was electrochemically roughened in a 0.1 M KCl solution using a PAR 173 potentiostat under computer control. To roughen silver, 25 successive oxidation-reduction cycles (ORCs) from –300 to 1200 mV vs. the Ag/AgCl reference electrode at a sweep rate of 500 mW s-1 were used. For each scan, the potential was held at 1.3 s at the positive limit and 30 s at the negative limit. The gold surface was roughened by cycling the electrode from –280 mV (holding 10 s) to 1220 mV (holding 5 s) at 500 mV s-1 for 25 times. After electrochemical roughening, the silver/gold electrode was rinsed with water (HPLC grade, Aldrich) and then ethanol (HPLC grade, Aldrich). The electrode was immersed in a dilute thiol solution in ethanol and allowed to react for approximately 24 h to form a self-assembled monolayer (SAM). Before use, the substrates were rinsed thoroughly with ethanol and stored in water between uses. 2.3 Normal Raman Spectroscopy
Normal Raman spectra were collected in rigidly held cuvettes. Raman measurements were made either with the Raman Solution 785 (Detection Limit) system or the Chromex Raman One imaging spectrograph. The Raman Solution 785 system has
90
a ƒ number of 2; a fixed position, 1200 grooves/mm grating; and a TE cooled Kodak 0400 CCD. The Chromex Raman One has a 250 mm focal length. The detector for the Chromex Raman One is a Princeton Instruments thermoelectrically cooled charge-coupled device (CCD) with controller (Model TE/CCD-1153EM with ST-135). To match the ƒ number of the collection fiber (ƒ = 2.2) to that of the spectrometer (ƒ = 4), an input coupler (Detection Limit, Model SIC-1000-Chromex) is used. Spectra are obtained using a 100 µm entrance slit, a 600 grooves/mm grating blazed at 750 nm whose position can be moved, and a CCD detector temperature of –50 °C. For both systems, a fiber optic sampling probe operating at 785 nm (InPhotonics, Model RPS785-12-10) is used to deliver the laser excitation to the sample and transfer the Raman emissions to the spectrometer. The excitation source for both systems is a tunable, continuous-wave (CW) laser diode (Spectra Diode Laser, SDL-8630) operating at 785 nm. A tunable optical isolator (Optics for Research, Model IO-7-NIR) is used to prevent backscatter of the laser beam into the laser cavity. The 785 nm laser line is focused into the silica/ silica clad, 100 µm, excitation fiber using a 5X microscope objective lens. 2.4 Evaluation of Cationic-Coated SERS Substrates
The flow-through cell to evaluate the concentration response of the cationic-coated SERS substrates to chromate and perchlorate has been described elsewhere.12 SERS measurements were made using either the Raman Solution 785 system (Detection Limit) or the Chromex Raman One, described above. The flow-through cell is held in place with the “Opti-Claw” optical mount (New Focus, P/N 9832). The Opti-Claw is mounted on an x,y,z-translation stage (Newport Corporation, P/N 460A). 2.4 Manipulation of Spectral Data
In these experiments, anion peak area is plotted as a function of anion solution concentration. To obtain the area of the anion peak, one subtracts out the spectral contributions of the thiol coating.12 All manipulations of the spectral data were done using GRAMS/AI7 (ThermoGalactic), a software package that can be used to subtract spectra interactively as well as integrate peak areas. The usefulness of this approach was discussed earlier.12
Deconvolutions of spectral bands into their component peaks were done using a Marquardt13 nonlinear least squares fitting routine. It was found that the line shapes of the Raman peaks are adequately described by a simple Lorentzian. Therefore, the spectrum S(ν) consisting of M Lorentzian peaks is given by:
∑−= +
=M
iii
iiIS1
2
0
2
2
0
)()(
ννσσν (1)
where each Raman peak, i, is characterized by a center position, ν0i , with a maximum intensity, I0i ,and standard deviation, σ. 2.5 Computer Modeling
Molecular modeling of chromate, bichromate, and the HMEP+ species was done using Titan (Wavefunction, Inc., Schrödinger, Inc.). Titan provides a full range of modern calculation methods including molecular mechanics, semi-empirical, Hartree-Fock molecular orbital, and density functional methods. All electron and pseudopotential
91
basis sets are available. Titan is capable of calculating vibrational frequencies and has a graphical module that provides isosurface displays of molecular orbitals, electron densities, spin densities, and electrostatic potentials.
Although Titan is a very powerful modeling tool, as structures become more complex, the computation times significantly increase. As a result, molecular modeling of the HMEP+ self assembled monolayer (SAM) on a gold surface was done using Alchemy III, a molecular modeling software package from IBM. This modeling was done only after analyzing the spectral data and after modeling the CrO4
= · HMEP+-Au interaction using Titan. Within Alchemy, a graphical form of Dreiding model construction allows accurate and flexible manipulation of structure. Previously, Alchemy III was used to obtain a better understanding of the observed selectivities of the cationic coatings for nitrate and sulfate.3 In this investigation, the purpose of the modeling was to determine the effect of adjoining HMEP+ molecules on the complexation with chromate. The first step requires “building” the molecule. The molecule is comprised of a linear chain of gold atoms onto which HMEP+ units are attached through the sulfur atom. The spacing between the HMEP+units is on the order of 5.8Å. Then chromate is bonded to the pyridine moiety of a HMEP+ unit. Once the molecule is built, the Alchemy minimizer performs a conjugate gradient minimization on a force field equation which is dependent on the positions of the atoms of a selected molecule. The potential energy of the molecule is the sum of the following terms: E = Estr + Eang + Etor + Evdw + Eoop + Eele (2) where all E's represent the energy values corresponding to the given types of interactions. The subscripts denote bond stretching (str), angle bending (ang), torsion deformation (tor), van der Waals interaction (vdw), out of plane bending (oop), and electrostatic interactions (ele). Within the minimizer, the molecular coordinates are modified to obtain reasonable, low energy, molecular geometries. Once minimized, the molecule can be depicted as a spacefilling model in which each atom is represented by a sphere of radius equal to its van der Waals radius. 3. RESULTS AND DISCUSSION 3.1 Raman Spectra of Chromate Solutions
Prior to examining the HMEP+-CrO4= interaction, Raman spectra of chromate
solutions as a function of chromate concentration (250 to 104 ppm) were obtained, Figure 1, to determine equilibria occurring in solution. In this Cr(VI) concentration range, the pH varied from 6 (for 250 ppm chromate) to 7 (for 104 ppm chromate). As shown in Figure 1, there are broad bands observed in the spectra between 250-450 cm-1 and 750-1050 cm-1. The broad bands were deconvoluted into their component peaks as described vide supra. The results are summarized in Figure 1 and Table 1.
The chemistry of aqueous chromate solutions has been studied extensively using conductivity,14 calorimetry,14 electromotive force,14 UV-VIS,15,16 Raman,17,18 and infrared19 spectroscopic measurements. From these studies the following chemical equilibria were proposed:20,21
92
CrO4= + H+ ↔ HCrO4
- (3) 2CrO4
= + 2H+ ↔ Cr2O7= + H2O (4)
2HCrO4= ↔Cr2O7
= + H2O (5)
The above chemical equilibria as well as the total Cr(VI) concentration and pH determines which particular Cr(VI) species predominates in solution. In basic solutions above pH 8 the main species is CrO4
=; in the range 6 ≥ pH ≥ 2 both HCrO4- and Cr2O7
= are in equilibrium. However, the Raman studies conducted by Michel and co-workers17,18 questioned the existence of the HCrO4
- ion in solution. In these studies, Raman spectra of Cr(VI) solutions as a function of Cr(VI) concentration and pH were obtained. No additional peaks were present in the Raman spectra that could be attributed to the HCrO4
-
species. The results of Michel and co-workers17,18 implied that in the pH range 1 to 11, there is only one equilibrium reaction, equation (4).
The results of this investigation, Figure 1, are similar to the results reported by Michel and co-workers. Table 2 summarizes the peak positions reported by Michel and Machiroux as well as those obtained in the current investigation. Taking into consideration equilibria 3-5, at pH 6 and 250 ppm Cr(VI) the principal species should be HCrO4
- (72%) and CrO4= (24%) while at pH 7 and 104 ppm Cr(VI) the principal species
are CrO4= (72%) and HCrO4
- (23%).21 These concentrations of HCrO4- should be
detectable if this species is present in solution. It is also expected that formation of HCrO4
- would shift the positions of the CrO4= peaks. Yet no additional peaks are
observed in the Raman spectra, Figure 1. Molecular orbital modeling was done to resolve these issues. Density function calculations of chromate were done using the B3LYP model and 3-21G* and LACVP* basis sets. The 3-21G* basis set has been shown to yield reasonably good geometrical results for these and other Cr(VI) species.20,22,23 Figure 2 shows the structure of chromate as calcula ted using the B3LYP/3-21G* model. Bond angles and bond lengths are summarized in Table 3. The peak positions and vibrational mode assignments obtained from these calculations are summarized in Table 2. The B3LYP/3-21G* and B3LYP/ LACVP* methods were also used to calculate the structure and vibrational modes of HCrO4
-. The structure of HCrO4- is shown in Figure 2, bond
lengths and bond distances are listed in Table 4, and peak positions and vibrational mode assignments are summarized in Table 5. Although calculations using the LACVP* basis set results in frequencies closer to the experimental values than those obtained using the 3-21G* basis set, the results are for a chromate ion that has had its symmetry significantly reduced removing degeneracies. As a result, subsequent discussions on CrO4
= /HCrO4-
will focus on the 3-21G* basis set calculations. Chromate has tetrahedral symmetry. Using the B3LYP/3-21G* method, the Cr-O
bond length was calculated to be 1.646 Å. This value agrees well with the results obtained using other methods, Table 3.20,24 It also agrees with the value of 1.647 Å determined crystallographically for CaCrO4, in which the chromate ion has tetrahedral site symmetry.25 Because chromate has tetrahedral symmetry, it should have four vibrational modes all of which are Raman active. The B3LYP/3-21G* method was used to calculate the vibrational modes of chromate. The B3LYP model accounts explicitly for nonuniformity in electron distributions and also incorporates the Hartree-Fock exchange term. The results of these calculations are summarized in Table 2, along with the experimental values and the values obtained by others using the LanL2DZ basis set.23
93
The values of ν2 and ν4 (bending modes) calculated using the 3-21G* basis set agree very well with the experimental values. However, the calculated values of ν1 and ν3 (stretching modes) are larger than the experimental values. It has been reported that basis sets such as the 3-21G* overestimates frequencies and that a scaling factor of 0.8-0.9 usually needs to be applied.23 The calculations done using the 3-21G* basis set indicate that ν2, ν3, and ν4 are degenerate modes. The vibrational peak frequencies calculated using the LanL2DZ basis set24 are also overestimated, but not as much as the 3-21G*
basis set calculations. Although there is not an exact match in the calculated and experimental data, the calculated data can be used to indicate trends, especially when comparing different molecular species.
The B3LYP/3-21G* method was used to model the bichromate anion. Bond lengths and bond angles are summarized in Table 4. The results obtained agree reasonably well with those obtained using other methods.20,23 The bichromate species has C2v symmetry. Reduction in symmetry removes degeneracies and all peaks should be Raman active. The vibrational modes of the bichromate anion were calculated using the B3LYP/3-21G*
method. Results are summarized in Table 5, along with results reported using the RHF/3-21G* method.23 The Cr-OH stretching modes should occur between 700 and 800 cm-1. No peaks are observed in this region experimentally, Figure 1. The modeling also indicates that the bichromate Cr-O stretching modes would occur at higher frequencies than that for the chromate species. In Figure 1, no peaks are observed at frequencies greater than 900 cm-1. From the modeling, it can be concluded that the only Cr(VI) species present in the solutions used in this investigation is chromate and not bichromate.
3.2 Normal Raman and SERS Spectra of HMEP+
Figures 3a and b show normal Raman and SERS spectra obtained for HMEP+. The experimental and calculated vibrational modes are summarized in Tables 6-8. As can be seen, there is reasonable agreement between the experimental and calculated values. The assignments of the calculated vibrational modes are shown. These assignments reasonably agree with those reported earlier for 4-mercaptopyridine11,26-29 and substituted pyridine compounds. 30,31 The pyridine ring has C2v symmetry and the Wilson vibration number and symmetry are given in Tables 6-8. These modes will be used to determine the orientation of the pyridine ring relative to the SERS surface.
Earlier studies of 4-mercaptopyridine (4-MP) showed that the ring modes 1 and 8a are markers for N-protonation in normal Raman spectra.29 For ring mode 1, the cation peak in the normal Raman spectrum occurs at 1006 cm-1 and the neutral species at 998 cm-1. The peak due to ring mode 8a occurs at 1619 cm-1 and 1579 cm-1 for the cation and neutral species, respectively. In the normal Raman spectrum of HMEP+, Table 6, the peaks due to ring mode 1 and 8a occur at 1011.7 and 1636 cm-1 respectively, indicating that the nitrogen atom is protonated. In the SERS spectra of 4-MP, the peak due to the ring mode 8a occurs at 1612 cm-1 for the cation and 1580 cm-1 for the neutral species.29 This was a similar trend observed in the normal Raman spectra. However, in the SERS spectra, the peak due to ring mode 1 of 4-MP occurs between 1003 (pH = 1.0) and 1010 (pH =3.6) cm-1 for the cation and 1014 cm-1 for the neutral species. The blue shift of ring mode 1 due to the neutral species is attributed to the nitrogen atom bonding to the silver surface.29 Consequently, for the SERS spectra, only the ring mode 8a peak can be used as a marker for N-protonation. In the case of HMEP+, the peak due to ring mode 8a occurs
94
at 1636 and 1630.9 cm-1 on silver and gold surfaces, respectively. No peaks are observed near 1580 cm-1, which indicates that the cation form of the coating is present on the SERS surfaces.
Bonding through the sulfur atom of HMEP+ is indicated by the loss of peaks due to the CSH deformation at 888.2 cm-1 and the S-H stretch at 2527 cm-1 . The peak due to the C-S stretching vibration was observed to shift to lower frequencies, from 715.9 cm-1
to 701.3 cm-1 on silver and 707.6 cm-1 on gold, upon chemisorption. This shift in the C-S stretching mode indicates an interaction between the sulfur atom of HMEP+ and the silver/gold surface. Similar results were obtained for Raman and SERS studies of the 4-mercaptopyridine system.11,26-29
There are no indications that the pyridine ring of HMEP+ is interacting with the silver/gold surface. The adsorption of nitrogen containing aromatic ringed compounds onto metal surfaces has been studied extensively.32-34 Adsorption can occur either through the aromatic π system or through the nitrogen atom. The former will result in an orientation that is parallel to the surface while the latter results in a perpendicular orientation. It is unlikely that adsorption would occur through the N-H moiety of the ring. It has been shown that pyridinium cation does not adsorb efficiently unless coadsorbed halides enable the formation of ion pairs on the surface.29 If adsorption of pyridine results in a perpendicular orientation, enhancements in the peaks due to the in-plane ring vibrations (12a1, 8b2, and 9a1) would occur, as was observed for 4-MP at low pH11
and for 2-mercaptopyridine (2-MP).35 Also the ν(CH) bonds of the aromatic ring are enhanced when the ring assumes a perpendicular stance with respect to the surface, 35,36 as was observed for 2-MP.35 If adsorption is through the nitrogen atom, a blue shift of the peak due to the ν1 mode (at 1011 cm-1 for HMEP+) would occur, as was observed for 4-MP.35 Molecular modeling confirms that the ν1 peak is blue shifted upon adsorption on gold through either the N or N-H groups. Molecular modeling, using the B3LYP/LACVP* model, indicates that adsorption through the N atom and N-H group are both energetically favorable. Using the B3LYP/LACVP* model, the ν1 peak is calculated to occur at 1019.89 cm-1 for HMEP+, Table 6. For the Au-HMEP+ species and adsorption through the N atom of the pyridine ring, the ν1 peak is calculated to occur at1035.98 cm-1, Table 8. With adsorption through the N-H moiety, the ν1 peak is calculated to occur at 1046.11cm-1, Table 8. Modeling also indicates that the peak due to the ν(S-H) mode shifts to higher wavenumber when adsorption occurs through the N-H group. As shown in Figure 3a, the peaks due to the in-plane stretching modes as well as the ring breathing modes in the SERS spectra of HMEP+ exhibit similar relative intensities and frequency positions as those peaks observed in the normal Raman spectrum. No enhancements in the in-plane ring vibrations are observed. As shown in Figure 3b, the ν(CH) peaks are not evident in the SERS spectrum of HMEP+. There is no peak evident due to the ν(S-H) mode. And no blue shift in the ν1 peak is observed upon adsorption of HMEP+ onto the silver/gold surfaces. Therefore, adsorption through the N atom of MEP and the N-H moiety of HMEP+ does not occur.
Planar adsorption of the pyridine ring results in a disappearance of the bands due to the ν(CH) modes.35,36 As shown in Figure 3b, no peaks due to the ν(CH) modes are observed in the SERS spectrum of HMEP+. However, planar adsorption would also result in enhancement in the peaks due to the out-of-plane ring modes,36 which is not observed in the SERS spectra of HMEP+. There is no evidence that ring π interactions are
95
occurring between the pyridine ring and the Ag/Au surface. Previous studies on the adsorption of benzene and its derivatives has shown that π ring interactions result in substantial broadening and a red shift of ring mode 1,29 which is not observed. Therefore, the pyridine ring of HMEP+ does not bond to the metal surface and that adsorption of HMEP+ onto silver/gold surfaces is solely through the sulfur atom. However, the spectral data cannot unequivocally indicate whether the pyridine ring is oriented parallel or perpendicular to the surface.37
3.3 SERS Investigation of the HMEP+-CrO4
= Interaction Figure 4a shows SERS spectra obtained for Au/HMEP+ in the presence of chromate.
The experimental and calculated vibrational modes are summarized in Table 9. With increasing chromate concentration, a broad new band appears at 835.5 cm-1. This band is attributed to the symmetric and asymmetric Cr-O stretching modes of chromate. The emission band due to chromate in the SERS spectra is significantly broader than that observed in the normal Raman spectra, Figure 1. Also the interaction with HMEP+ shifts the chromate emission to lower frequency (ν1 = 850 cm-1, Table 2). In addition, significant changes in the spectrum of the coating are observed. The changes observed in the spectral features of chromate and the coating upon complexation will be discussed in more detail later.
The chromate peak area in the SERS spectra was obtained by subtracting the spectral contributions of the coating and integrating the peak area under the resultant peak. Because of the broadness of the chromate band in the SERS spectra, no attempt was made to deconvolute the band into its component peaks. A plot of chromate peak area as a function of chromate concentration is shown in Figure 4b. At low chromate concentration, the peak area increases linearly with concentration. At higher solution concentration of chromate, the response levels off as the adsorption sites on the substrate become fully occupied. Like the interaction of nitrate and sulfate with cationic thiols12, the adsorption of chromate onto the HMEP+-coated gold substrate is described by a Frumkin isotherm:
θ
θ
θg
g
cKecKe
2
2
1+= (6)
and
N T
N=θ (7)
where θ is the fractional coverage of the analyte on the coating, N is the number of sites on the substrate occupied by chromate, NT is the total number of sites on the substrate, c is the solution concentration of adsorbate in M, K is the ion-pair constant between the adsorbate and coating, and g is the Frumkin parameter. The Frumkin parameter takes into account interactions between the adsorbed species. N is directly proportional to chromate peak area. The concentration profile shown in Figure 4b was computer analyzed using a Marquardt13 nonlinear least-squares fitting routine to obtain the values of K, g, and NT . The results for g and K are summarized in Table 10. The ion pair constant obtained for the HMEP+-chromate interaction is approximately three orders of magnitude larger than the ion pair constants measured for the quaternary amine thiol coatings and either nitrate or sulfate.12 Such a large ion pair constant could account for the sensitivity reported by
96
Turyan and Mandler7 as well as the observed shift of the chromate band to lower frequency (no shift in the nitrate/sulfate peak positions were observed upon interaction with the cationic thiols12). In the equation describing the Frumkin isotherm, the sign of g indicates the presence of a repulsive or an attractive force upon adsorption. For the HMEP+-chromate interaction, g has a negative value, which indicates that a repulsive force between the adsorbed chromate ions is present. Initially there is a large electrostatic attraction between the negatively charged chromate ions and the positively charged thiol coating. However, as the surface charge is neutralized by the negatively charged chromate ion, there is a resultant decrease in attraction. Similar observations were reported for the SERS substrates modified with cationic thiols and nitrate and sulfate ions12 as well as for SERS substrates coated with 4-(2-pyridylazo) resorcinol disulfide and copper, lead, and cadmium ions.8
It has been shown that pyridinium and dichromate ions associate through hydrogen bonding.2,3,38 Therefore, it is not unreasonable to expect that hydrogen bonding would also occur between HMEP+ and chromate. Molecular modeling of the Au-HMEP+•CrO4
= complex was done using the B3LYP/LACVP* model. The calculated structure of the complex is shown in Figure 5. The experimental and calculated vibrational modes are summarized in Table 9. Molecular modeling indicates that formation of the Au-HMEP+•CrO4
= complex is energetically favorable. The calculated structure of the complex, Figure 5, shows that one of the oxygen atoms of chromate bonds to the proton on the nitrogen atom of the pyridine ring. The N-H bond elongates from 0.999Å in the Au-HMEP+ structure to 2.366Å in the complex. The N-H-O1 bond angle is 163.36°, which places the O4 and O3 atoms of the chromate moeity in close proximity to the hydrogen atom on C1 of the pyridine ring. The O3-H and O4-H bond lengths are 3.063Å and 2.097Å , respectively, suggesting that both chromate oxygens hydrogen bond to the C1 hydrogen.
The structure of the complex generated by molecular modeling is supported by the SERS spectra. In carboxylic acids, both the OH and CO stretching frequencies are lowered as a result of hydrogen bonding.30,39 Broadening of the bands also occurs in both infrared39 and Raman spectroscopy.30,31 The broadening and shift to lower frequency of the bands due to the Cr-O stretching modes of chromate are consistent with hydrogen bonding between the O atoms of chromate and the H-N and H-C1 groups of the pyridine ring. In Figure 4a, interaction between chromate and HMEP+ results in increased intensity of the HMEP+ peaks at 948.3, 1100-1200, and 1450-1630 cm-1. These peaks are primarily assigned to the pyridine ring vibrational modes, Table 9. Large intensity changes were also reported for bands due to the pyridyl portion of PAR upon complexation with Pb2+, Cd2+, and Cu2+ metal cations.8 Because the intensity39 of a Raman band is proportional to the square of the induced dipole (µ), which in turn is proportional to the polarizability (α) of the molecule, such an increase in peak intensity suggests that a change in α has occurred upon complexation. The polarizability measures the ease with which the electron cloud around a molecule can be distorted. Therefore, a change in α that increases peak intensity suggests that a displacement in charge has occurred within the pyridinium ring after complexation with chromate. To verify this, the electrostatic potential maps for Au-HMEP+ and the Au-HMEP+•CrO4
= complex were calculated and are shown in Figure 5. The electrostatic potential is a function describing the energy of interaction of a positive charge with the nuclei and fixed electron
97
distribution of a molecule.40 The electrostatic potential map is a graph that shows the value of electrostatic potential on an electron density isosurface corresponding to a van der Waals surface. On the screen, the maps are colored where red represents large negative values of the potential and blue represents large positive values. In the greyscale electrostatic potential maps shown in Figure 5, the darker the color the greater the potential. For both Au-HMEP+ and the Au-HMEP+•CrO4
= complex, the negative electrostatic potential resides on the sulfur atom. For Au-HMEP+, the positive electrostatic potential is evenly distributed through the pyridine ring. However, in the complex, the positive potential is shifted towards the chromate moeity of the complex. The resultant displacement in charge could account for the change in polarizability of the pyridinium ring.
3.4 Selectivity of HMEP+ for Chromate
Cationic coatings that possess no anion recognition functionalities other than a positive charge respond simply on the basis of the anion’s lipophility, with the more lipophilic anions responding the best.41 Consequently, the strength of interaction of the cationic coating will be stronger for those anions that exhibit a higher charge or a smaller solvated radius or a greater polarizability. This gives rise to the following selectivity order, known as the Hofmeister series:42
However, in addition to a positive charge, HMEP+ exhibits hydrogen bonding capabilities, as was indicated by both molecular modeling and the SERS spectral data. Turyan and Mandler7 attributed the high Cr(VI) selectivity of HMEP+ to its hydrogen bonding capabilities. Additional molecular modeling of the HMEP+ SAM was done to determine the effect of adjoining HMEP+ molecules on the complexation with chromate. Both perpendicular and planar orientations of the pyridinium ring were considered. The results are summarized in Figures 6 and 7. Regardless of the orientation of the pyridinium ring, it can be seen that chromate is able to form hydrogen bonds with the adjoining HMEP+ moiety on the gold surface. Modeling indicates that there are essentially microcavities present between adjacent HMEP+ moeities on the surface with a three-dimensional structure complementary in both shape and chemical functionality to that of the chromate ion. To determine the extent hydrogen bond ing plays in its Cr(VI) selectivity, the interaction of HMEP+ with perchlorate was probed using SERS. In addition the SERS technique was used to measure the interaction of chromate and perchlorate with a similar positively charged, heteroaromatic compound, 2-mercapto-4-methyl pyrimidine hydrochloride (HMMP+).
Figure 8a shows SERS spectra obtained for Ag-HMEP+ in the presence of perchlorate ion. The concentration response is shown in Figure 8b, which is described by the Frumkin isotherm, equation 6. The values of K and g are tabulated in Table 10. Based on the Hofmeister series, in the absence of hydrogen bonding, one would expect HMEP+ to interact strongly with perchlorate. However, the results summarized in Table 10 indicate that the interaction of HMEP+ with chromate is more than three orders of magnitude stronger than that for perchlorate. This difference in the strength of interaction explains why perchlorate did not interfere with the electrochemical detection of Cr(VI) done by Turyan and Mandler7. The interaction between HMEP+ and perchlorate appears to be electrostatic in nature. No significant increase in intensity of the vibrational modes
98
due to the pyridine moiety is observed in the SERS spectra, Figure 8a, as was observed for the chromate interaction, Figure 4a. As discussed vida supra, the increased intensity of these vibrational modes is consistent with hydrogen bonding occurring between the pyridine ring of HMEP+ and chromate.
HMMP+ has two nitrogen atoms in its aromatic ring. The thiol group is on the ring carbon atom between the two nitrogen atoms. Figure 9 shows normal Raman and SERS spectra of HMMP+. The peaks due to the ring modes and their corresponding Wilson vibration number are summarized in Table 11. In the SERS spectrum, no shift in the peak due to ν(C-S) is observed. It is also observed that the ring modes 8a, 12, 3, and 19b disappear in the SERS spectrum. Similar observations of the peaks due to ν(C-S) and the ring modes were made for 2-mercaptopyrimidine (2-MPM) upon adsorption on silver.34 In this earlier study, it was concluded that 2-MPM lies flat on the surface with three heteroatoms bonding with the surface. Because similar spectral changes were observed for HMMP+ upon adsorption on silver, it can be concluded that HMMP+ has a flat orientation on the silver surface. In HMMP+, the positive charge is dispersed between both nitrogen atoms. Because the nitrogen atoms of HMMP+ are in close proximity to the thiol group, partitioning of anions will be sterically hindered. It is therefore expected that the hydrogen bonding capabilities of HMMP+ will be less than that for HMEP+. The interaction between HMMP+ and both chromate and perchlorate was probed using SERS. The spectral data and concentration responses are summarized in Figure 10. The concentration responses are described by Frumkin isotherms and the values of K and g are tabulated in Table 10. Both perchlorate and chromate interact with HMMP+. While the chromate interaction with HMEP+ is more than three orders of magnitude greater than the perchlorate interaction, the chromate interaction is only 2.4 times greater than perchlorate for HMMP+. No changes in intensity in the pyrimidine ring modes, Figures 8a and 8c, are observed indicating that no significant hydrogen bonding is occurring. Both the spectral data and modeling confirms the importance of hydrogen bonding in the selectivity of HMEP+ for chromate.
4.0 CONCLUSIONS
The interaction of 4-(2-mercaptoethyl)pyridinium (HMEP+) hydrochloride with chromate was investigated using SERS and molecular modeling. The SERS spectra indicated that adsorption of HMEP+ onto silver/gold surfaces is through the sulfur atom and that the pyridine ring is protonated. It was shown that the only Cr(VI) species present in solution was chromate ion. Both the normal Raman spectra and molecular modeling indicated that bichromate was not present in solution. It was shown that chromate interacted with HMEP+ and that the concentration response of chromate is described by a Frumkin isotherm. The ion-pair constant for the chromate- HMEP+ interaction is more than three orders of magnitude larger than that measured for the HMEP+ interaction with perchlorate ion. By comparison, the ion-pair constant for the chromate interaction with 2-mercapto-4-methylpyrimidine (HMMP+) hydrochloride is 2.4 times greater than for perchlorate. The selectivity between chromate and HMEP+ is attributed to hydrogen bonding. Molecular modeling shows the presence of microcavities between adjacent HMEP+ moieties on the SERS surface with a three-dimensional structure complementary in both shape and chemical functionality to that of the chromate ion.
99
ACKNOWLEDGMENTS This work was supported by the Strategic Environmental Research and Development Program (SERDP).
Arrieta, J.M.; Torrent, M.; Mestres, J.; Solà, M.; Duran, M. Inorg. Chem. Acta 1997, 258, 53.
24. Bell, S.; Dines, T.J. J. Phys. Chem. A 2000, 104, 11403. 25. Weber, G.; Range, K.J. Z. Naturfor. B 1996, 51, 751. 26. Baldwin, J.A.; Vlcková, B.; Andrews, M.P.; Butler, I.S. Langmuir 1997 13, 3744. 27. Yu, H.-Z.; Xia, N.; Liu, Z.-F. Anal. Chem. 1999, 71, 1354. 28. Zhang, Z.; Imae, T.; Sato, H.; Watanabe, A.; Ozaki, Y. Langmuir 2001 17, 4564. 29. Sook, H.S.; Kim, K.; Kim, M.S. J. Mol. Struct. 1997 407, 139. 30. Jeanmaire, D.L.; Van Duyne, R.P. J. Electroanal. Chem. 1977 84, 1.
100
31. Dollish, F.R.; Fateley, W.G.; Bentley, F.F. Characteristic Raman Frequencies of Organic Compounds John Wiley and Sons: New York, 1974.
32. Colthup, N.B.; Daly, L.H.; Wiberley, S.E. Introduction to Infrared and Raman Spectroscopy, 3rd Ed. Academic Press: San Diego, CA, 1990.
33. Uebe, H.; Ichimura, S.; Yamado, H. Surf. Sci. 1982 119, 433. 34. Kobayashi, M.; Imai, M. Surf. Sci. 1985 158, 275. 35. Pang, Y.S.; Hwang, H.J.; Kim, M.S. J. Mol. Struct. 1998 441, 63. 36. Vivoni, A.; Chen, S.-P.; Ejeh, D.; Hosten, C.M. Langmuir 2000 16, 4564. 37. Ye, Q.; Fang, J.; Sun, L. J. Phys. Chem. B 1997 101, 8221. 38. Gili, P. Rev. Chim, Miner. 1984 24, 171. 39. Lambert, J.B.; Shurvell, H.F.; Verbit, L.; Cooks, R.G.; Stout, G.H. Organic Structural
Analysis Macmillan Publishing Co.: New York, 1976. 40. Hehre, W.J.; Yu, J.; Klunzinger, P.E.; Lou, L. A Brief Guide to Molecular Mechanics
and Quantum Chemical Calculations Wavefunction, Inc.: Irvine, CA 1998. 41. Shugar, G.J.; Dean, J.A. The Chemist’s Ready Reference Handbook McGraw-Hill:
New York, 1990. 42. Hofmeister, F. Arch. Experiment. Pathol. 1888 24, 247.
101
TABLES Table 1. Summary of results obtained from curve-fitting the normal Raman spectrum of obtained for the 104 ppm chromate solution, Figure 1 (CORRL = 0.9986).
Table 3. Effect of method and basis set on the calculated energy of formation, bond length, and bond angles of chromate.
Method B3LYP a B3LYP a HF 23 B3LYP 23 B3LYP 23 Ab Initio 19,b Basis Set 3-21G* LACVP* 3-21G* LanL2DZ 3-21+G 3-21G Energy (a.u.) -1338.74 -387.15
d Cr-O (Å) 1.646 1.656 1.600 1.667 1.669 1.604
< O-Cr-O 109.47º 110.32, 108.61, 112.09
Td
a. This work b. The method used was SFC-MO with double-zeta valence basis set incorporating
pseudopotentials with EPC (effective core potential)
102
Table 4. Effect of method and basis set on the calculated energy of formation, bond length, and bond angles of bichromate. Method B3LYP a B3LYP a Ab Initio 19,b RHF Basis Set 3-21G* LACVP* double zeta val. with
pseudopotentials 3-21G*
Energy (a.u.) -1339.50 -387.9 -309.81
d Cr-O (Å) 1.602 1.513 1.54
d Cr-OH (Å) 1.806 1.853 1.794
d O-H (Å) 0.992 0.972
< O-Cr-O 107.23c, 109.32d, 110.22e,110.32f
106.57, 111.93
< Cr-O-H 109.72 105.51 119.50
a. This work b. The method used was SFC-MO with double-zeta valence basis set incorporating
pseudopotentials with EPC (effective core potential) Referring to HCrO4
- in Figure 3: c = O1-Cr-O2 ; d = O1-Cr-O3 and O1-Cr-O4 ; e = O4-Cr-O3 ; f = O3-Cr-O2 Table 5. Calculated vibrational modes of bichromate. B3LYP, 3-21G* Model This work
1610.5 w 1635.49 1649.44 νr(CC), νr(CN) = 8b(B2)e 1636.0 m 1650.9 1681.52 νr(CC), νr(CN) = 8a(A1)e
a. vw= very weak, w= weak, m= medium, s= strong, vs= very strong, sh = shoulder b. Energy = -721.83 a.u. c. Energy = -725.47 a.u. d. β = in-plane bending, δ = deformation (out of plane bending), γ= wagging, ν = stretching, ρ=
rocking, τ= twisting. Subscripts: r = ring, s = symmetric, as =asymmetric e. Wilson vibration number of the pyridine ring and symmetry for experimental peaks
a. vw= very weak, w= weak, m= medium, s= strong, vs= very strong, sh = shoulder b. Energy = -721.83 a.u. c. Energy = -725.47 a.u. d. β = in-plane bending, δ = deformation(out of plane bending), γ= wagging, ν = stretching, ρ=
rocking, τ= twisting. Subscripts: r = ring, s = symmetric, as =asymmetric e. Wilson vibration number of the pyridine ring and symmetry for experimental peaks
105
Table 7. Experimental and Calculated Values of the Vibrational Modes of HMEP+-Ag. Experimentala Calculatedb
1636.0 w 1652.62 1679.93 νr(CC) = 8a(A1)e a. vw= very weak, w= weak, m= medium, s= strong, vs= very strong, sh = shoulder, br= broad b. Energy = -5897.57 a.u. c. Energy = -870.66 a.u. d. β = in-plane bending, δ = deformation(out of plane bending), γ= wagging, ν = stretching, ρ=
rocking, τ= twisting. Subscripts: r = ring, s = symmetric e. Wilson vibration number of the pyridine ring and symmetry for experimental peaks
106
Table 8. Experimental and Calculated Values of the Vibrational Modes of HMEP+-Au. Experimentala Calculated
a. vw= very weak, w= weak, m= medium, s= strong, vs= very strong, sh = shoulder, br= broad b. Energy = -860.34 a.u. Sulfur atom of H+MEP binds to gold. c. Energy = -861.1 a.u. N-H of H+MEP binds to gold. d. Energy = -860.3 a.u. N of MEP binds to gold. e. β = in-plane bending, δ = deformation, γ= wagging, ν = stretching, ρ= rocking, τ= twisting. Subscripts:
r = ring, s = symmetric f. Wilson vibration number of the pyridine ring and symmetry for experimental peaks g. This mode does not occur for deprotonated MEP binding to gold.
1526.47 1526.92 1533.78 δ(CH2) 1536.4 w 1539.61 1535.96 1540.36 νr(CC) 1574.5 w 1555.91 νr(CC), νr(CN) 1608.8 w 1648.12 1595.86 1601.46 νr(CC), νr(CN) = 8b(B2)f 1630.9 w 1680.33 1688.07 1659.44 νr(CC) = 8a(A1)f
2788.42 2681.44 ν(S-H) a. vw= very weak, w= weak, m= medium, s= strong, vs= very strong, sh = shoulder, br= broad b. Energy = -860.34 a.u. Sulfur atom of H+MEP binds to gold. c. Energy = -861.1 a.u. N-H of H+MEP binds to gold. d. Energy = -860.3 a.u. N of MEP binds to gold. e. β = in-plane bending, δ = deformation, γ= wagging, ν = stretching, ρ= rocking, τ= twisting. Subscripts:
r = ring, s = symmetric f. Wilson vibration number of the pyridine ring and symmetry for experimental peaks g. This mode does not occur for deprotonated MEP binding to gold .
108
Table 9. Experimental and Calculated Values of the Vibrational Modes of the CrO4=
complex with HMEP+-Au. Experimentala Calculatedb
B3LYP/LACVP*
Assignmentc
356.96 δ(CrO3) 389.9 w 370.47 ν(Au-S)
374.95 δ(CrO3) 407.5 w 389.30 δ(O-Cr-O), δr(CH) 425.1 w 408.27 δr(CH)
498.93 δ r(NH) 525.1 w 533.10 δ r(CCC) = 16a(A2)d
598 w 575.44 δ r(CCC) = 16b(B1)d 648.8 w 683.87 δ r(CCC) = 6b(B2)d 678.3 w
1198.7 s 1234.36 β r(CH), γ(CH2) = 9a(A1)d 1262.5 m 1260.58 β r(CH), γ(CH2)
1269.08 β r(CH), γ(CH2) 1299.6 m 1301.84 τ(CH2), νr(CC), νr(CN) = 3(B2)d 1330.9 m 1329.56 τ(CH2), νr(CC), νr(CN) = 3(B2)d
1364.18 γ(CH2) 1426.9 w 1391.13 β r(CH), τ(CH2)
a. vw= very weak, w= weak, m= medium, s= strong, vs= very strong, sh = shoulder b. Energy = -1247.87 a.u. c. β = in-plane bending, δ = deformation, γ= wagging, ν = stretching, ρ= rocking, τ=
twisting. Subscripts: r = ring, s = symmetric, as = asymmetric d. Wilson vibration number of the pyridine ring and symmetry for experimental peaks
109
Table 9. (Continue) Experimentala Calculatedb
B3LYP/LACVP*
Assignmentc
1460.8 m 1474.90 νr(CCC), β r(CH), β r(NH) 1497.9 s 1511.17 δ(CH2) 1522.4 s 1524.06 δ(CH2) 1536.4 s νr(CC) 1574.5 s 1552.83 νr(CC) 1598.5 s 1621.8 νr(CC), νr(CN) = 8b(B2)d 1625.8 s 1654.54 νr(CC) = 8a(A1)d
a. vw= very weak, w= weak, m= medium, s= strong, vs= very strong, sh = shoulder b. Energy = -1247.87 a.u. c. β = in-plane bending, δ = deformation, γ= wagging, ν = stretching, ρ= rocking, τ=
twisting. Subscripts: r = ring, s = symmetric, as = asymmetric d. Wilson vibration number of the pyridine ring and symmetry for experimental peaks Table 10. Ion-pair constants (K in M-1) and Frumkin parameters (g) obtained for HMEP+ and HMMP+ interactions with perchlorate and chromate.
Coating Perchlorate Chromate HMEP+ K = 38 ± 11
g = 1.35 ± 0.24 K = 142800 ± 7700 g = -2.068 ± 0.063
HMMP+ K = 1163 ± 56 g = -2.51 ± 0.21
K = 2760 ± 150 g = -2.80 ± 0.18
110
Table 11. Experimental values of the vibrational modes of HMMP+.
HMMP+
peaksa Ag-HMMP+
peaksa Assignmentb
541.59 m 563.79 m 6b(B2) 645.98 vw,br 652.37 vw,br 6a(A1)
715.21 s 718 m ν(C-S), 10b(B1) 832.39 w 11(B1) 900.56 w 888.16 m 17a(A2) 946.36 w 5(B1) 994.30 m 997.88 vs 1(A1) 1026.25 m 12(A1) 1102.95 m 1101.88 m 18b(B2) 1122.12 vw 9a(A1) 1172.19 m 1187.39 m 15(B2) 1209.47 m 3(B2) 1375.64 w 1376.46 w 14(B2) 1409.72 vw 19a(A1)
a. vw= very weak, w= weak, m= medium, s= strong, vs= very strong, br= broad b. Wilson vibration number of the aromatic ring and symmetry for experimental
peaks30,34
111
FIGURE CAPTIONS
Figure 1. Normal Raman spectra of aqueous chromate solutions (water background has been subtracted out). Concentrations are 250 ppm to 104 ppm chromate. Inserts show the deconvoluted spectra for the 104 ppm chromate solution. Spectra were obtained using the Detection Limit system, 785 nm excitation at 62 mW power, and averaging five 20 s acquisitions. Figure 2. Computer generated structures of chromate and bichromate. These structures were obtained using the B3LYP/3-21G* method. Figure 3. Normal Raman and SERS spectra of HMEP+. (a) Spectra obtained using the Detection Limit system and 785 nm excitation at 62 mW power. Bottom spectrum is the normal Raman spectrum of solid HMEP+ obtained by averaging five 30 s acquisitions. The Ag/ HMEP+ (middle spectrum) and Au/ HMEP+ (top spectrum) were obtained using 80.2 mW laser power and averaging five 15 s and 20 s acquisitions, respectively. (b) Spectra obtained using the Chromex Raman One system, 785 nm excitation at 80.2 mW, and averaging ten 20 s acquisitions. The top spectrum is the normal Raman spectrum of solid HMEP+ and the bottom spectrum is the SERS spectrum of Au/ HMEP+. Figure 4. (a) SERS spectra of Au/HMEP+ as a function of chromate concentration. Spectra obtained using the Detection Limit system, 785 nm excitation at 80.2 mW power, and averaging five 20 s acquisitions. (b) Concentration response obtained for the Au/HMEP+-CrO4
= system. Figure 5. Computer generated structures and electrostatic potential maps of Au/HMEP+ and the Au/HMEP+•CrO4
= complex. These structures were obtained using the B3LYP/LACVP* method. Figure 6. Computer generated structure of the Au/HMEP+ SAM interacting with a chromate ion. The orientation of the pyridine ring is perpendicular to the SERS surface. Figure 7. Computer generated structure of the Au/HMEP+ SAM interacting with a chromate ion. The orientation of the pyridine ring is planar to the SERS surface.
112
Figure 8. (a) SERS spectra of Ag/HMEP+ as a function of perchlorate concentration. Spectra obtained using the Detection Limit system, 785 nm excitation at 80.2 mW power, and averaging five 15 s acquisitions. (b) Concentration response obtained for the Ag/HMEP+-ClO4
- system. Figure 9. Normal Raman spectrum (bottom spectrum) of solid HMMP+ obtained using the Detection Limit system, 785 nm excitation at 62 mW, and averaging five 15 s acquisitions. SERS spectrum (top) of Ag/ HMMP+ obtained using the Detection Limit system, 785 nm excitation at 62 mW, and averaging five 10 s acquisitions. Figure 10. (a) SERS spectra of Ag/HMMP+ as a function of perchlorate concentration. Spectra obtained using the Detection Limit system, 785 nm excitation at 80.2 mW power, and averaging five 10 s acquisitions. (b) Concentration response obtained for the Ag/HMMP+-ClO4
- system. (c) SERS spectra of Au/ HMMP+ as a function of chromate concentration. Spectra obtained using the Detection Limit system, 785 nm excitation at 80.2 mW power, and averaging five 10 s acquisitions. (b) Concentration response obtained for the Ag/HMMP+-CrO4
= system.
113
Figure 1
250 375 500 750 875 1000
-500
500
1500
2500
3500
inte
nsi
ty
250 500 750 1000
wavenumber (cm -1)
114
Figure 2
CrO4-2 HCrO4
-1
O1
O2 O1
O2 O3
O4 O3
O4
115
Figure 3
5000
20000
A
350.0 687.5 1025.0 1362.5 1700.0
wavenumber (cm -1)
B
2200 2450 2700 2950 3200
wavenumber (cm -1)
δ(CSH)
ν(S-H)
116
Figure 4
20000
60000
100000
140000
180000
CrO
4= pea
k ar
ea
-0.005 0.022 0.050 0.077 0.105
CrO4= concentration (M)
CrO4=
17000
25000
33000
41000
49000
inte
nsity
350.0 687.5 1025.0 1362.5 1700.0
wavenumber (cm-1)
A
B
117
Figure 5
N
O1
O2 O3
O4 C1
Au-HMEP+
Au-HMEP+ • CrO4-2
complex
118
Figure 6
CrO4=
Top View
Side View
5.8 Å
119
Figure 7
CrO4=
Top View
Side View
5.8 Å
120
Figure 8
ClO 4-
0
3500
7000
10500
14000
ClO
4- pea
k ar
ea
0.000 0.030 0.060 0.090 0.120
ClO4- concentration (M)
600 875 1150 1425 1700
wavenumber (cm-1)
14000
25000
36000
47000
58000
inte
nsi
ty
B
A
121
Figure 9.
-10000
10000
30000
50000
70000
inte
nsi
ty
500 775 1050 1325 1600
wavenumber (cm-1)
122
Figure 10
ClO4-
CrO4=
D
B0
25000
50000
75000
100000
ClO
4-
peak
are
a
-0.005 0.018 0.041 0.064 0.087 0.110
ClO4- concentration (M)
0
50000
100000
150000
200000
CrO
4=
pea
k ar
ea
-0.005 0.027 0.059 0.091
CrO4= concentration (M)
400 800 1200 1600
wavenumber (cm-1)
A
400 800 1200 1600
wavenumber (cm-1)
C
123
B4. Paper Accepted by Applied Spectroscopy
Detection of Anions by Normal Raman Spectroscopy and Surface- Enhanced Raman Spectroscopy (SERS) of Cationic-Coated Substrates
P.A. Mosier-Bossa and S.H. Lieberman
SPAWAR Systems Center San Diego, Code 236, San Diego, CA 92152
ABSTRACT The use of normal Raman spectroscopy and surface-enhanced Raman spectroscopy (SERS) of cationic-coated silver and gold substrates to detect polyatomic anions in aqueous environments is examined. For normal Raman spectroscopy, using near-infrared excitation, linear
concentration responses were observed. Detection limits varied from 84 ppm for perchlorate to 2600 ppm for phosphate. In general, detection
limits in the ppb-ppm concentration range for the polyatomic anions were achieved using cationic-coated SERS substrates. Adsorption of the
polyatomic anions on the cationic-coated SERS substrates was described by a Frumkin isotherm. The SERS technique could not be used to detect dichromate as this anion reacted with the coatings to form thiol esters. A competitive complexation method was used to evaluate the interaction of
chloride ion with the cationic coatings. Hydrogen bonding and π-π interactions play significant roles in the selectivity of the cationic coatings. Index Headings: SERS; Cationic-Thiols; Polyatomic Anion
1. INTRODUCTION
Anions such as perchlorate, chromate, dichromate, cyanide, nitrate, sulfate, and phosphate are contaminants of environmental concern that can impact the local ecosystem, groundwater, and human health. Perchlorate has been used as the oxidizer component and primary ingredient in solid propellant for rockets and missiles.1,2 Recently, it was shown that perchlorate is present in several fertilizers and fertilizer components at levels up to 0.84 wt % suggesting that fertilizers could be a source for perchlorate accumulation in the food chain.3 Perchlorate is exceedingly mobile in aqueous systems and can persist for many decades under typical ground and surface water conditions. It has been found in groundwater, drinking water, and soils, mainly in the southwestern United States, at levels ranging from 8 to 3700 ppb. Perchlorate affects the thyroid gland by blocking iodine uptake resulting in lower thyroid hormone levels. Chromate and dichromate are Cr(VI) species that have been used in metal finishing and in metal plating operations, in leather tanning, and in wood preservation.4-7 Cr(VI) is a strong oxidizer and is both highly toxic and carcinogenic. Chromate and dichromate are very water soluble and have little interaction with the soil. Consequently, these pollutants are mobile, resulting in widespread
a Author to whom correspondence should be sent.
124
groundwater contamination. Chromium contamination is present in over half of the superfund sites. Most cyanide releases into the environment come as a result of mining operations. However, cyanide has been used in electroplating processes for silver, cadmium, gold, and copper.8 Cyanide is highly toxic. Exposure by eye or skin contact or ingestion can be rapidly fatal. Nitrate, sulfate, and phosphate are ionic nutrients that enter surface waters through runoff from fertilizers used in agriculture, runoff from animal feed lots, and effluents from sewage treatment plants.9 When discharged into surface waters, these anions can promote the unnatural growth of blue-green algae resulting in eutrophication.10 Besides eutrophication, these ionic nutrients have been blamed for the increased incidences of red tide – blooms of toxic, single-celled organisms that have caused die-offs of fish, dolphins, manatees, and other aquatic animals.11
Sites contaminated with perchlorate, Cr(VI) anions, and cyanide are entering the active remediation and post remediation stages. As a result, the requirement for long-term monitoring has increased. This long-term monitoring can be for process control, for performance measurement, or for compliance. Similarly efficient management of anionic nutrients requires continuous monitoring with little or no sample preparation. A number of technologies have been used to detect these anionic species. Perchlorate has been detected using ion chromatography,12
capillary electrophoresis13 and electrospray mass spectrometry.2 Ion selective electrodes have been developed to detect cyanide, nitrate, and perchlorate.14 Nitrate,15,16 phosphate,17 and Cr (VI)18,19 have been detected using colorimetric methods. For long-term monitoring purposes, it would be desirable to detect these anionic contaminants in-situ and on-site so as to minimize sampling time and costs. Although the above detection methods are sensitive, they require either the use of reagents, preconcentration of the analyte, or frequent recalibration of the instrument, or the instumentation is bulky and delicate. Consequently, these technologies are unattractive for use as a field analytical method to detect anions on-site and in-situ.
Earlier, we demonstrated that nitrate and sulfate ions can be detected by surface-enhanced Raman spectroscopy (SERS) using cationic coatings. The positive charge of the coating attracts anions to the surface of the SERS substrate.9 Detection limits for nitrate and sulfate were in the low parts-per million concentration range. Adsorption of nitrate and sulfate onto the cationic coatings was reversible. Inexpensive, robust, portable Raman spectrometer systems comprised of near IR diode lasers, CCD detectors, and fiber optic probes are commercially available. In this communication, we investigate the use of cationic thiol coated SERS susbstrates to detect perchlorate, chromate, dichromate, and cyanide.
ethyl ester (CYSE) hydrochloride (Fluka), 2-amino-4-trifluoromethyl benzenethiol (ATB) hydrochloride (Aldrich), 4-(2-mercaptoethyl) pyridinium (MEP) hydrochloride (Toronto Research Chemicals), and 2-mercapto-4-methylpyr imidine (MMP) hydrochloride (Avocado Research Chemicals) were also used as received. Ethanol (HPLC grade, Aldrich) was dried by refluxing over magnesium turnings, distilling, and collecting the middle fraction. Aqueous solutions of the anions were prepared using deionized water.
2.2 Preparation of SERS Substrates
An insulated copper wire was soldered to a 0.75 cm length of 2 mm diameter gold or silver wire (Aldrich, 99.9%). The silver/gold wire was potted inside a 5mm outer diameter glass tube with a chemically resistant epoxy (Epoxy Patch 1C, Hysol). Prior to use, the silver/gold disk of the electrode was electrochemically roughened in a 0.1 M KCl solution using a PAR 173 potentiostat under computer control. To roughen silver, 25 successive oxidation-reduction cycles (ORCs) from –300 to 1200 mV vs. the Ag/AgCl reference electrode at a sweep rate of 500 mW s-1 were used. For each scan, the potential was held at 1.3 s at the positive limit and 30 s at the negative limit. The gold surface was roughened by cycling the electrode from –280 mV (holding 10 s) to 1220 mV (holding 5 s) at 500 mV s-1 for 25 times. After electrochemical roughening, the silver/gold electrode was rinsed with water (HPLC grade, Aldrich) and then ethanol (HPLC grade, Aldrich). The electrode was immersed in a dilute thiol solution in ethanol and allowed to react for approximately 24 h to form a self-assembled monolayer (SAM). Before use, the substrates were rinsed thoroughly with ethanol and stored in water between uses. 2.3 Normal Raman Spectroscopy
Normal Raman spectra were collected in rigidly held cuvettes. Raman measurements were made either with the Raman Solution 852 system (Detection Limit), Raman Solution 785 system (Detection Limit) or the Chromex Raman One imaging spectrograph. The Raman Solution 785 and 852 systems have a ƒ number of 2; a fixed position, 1200 grooves/mm grating; and a TE cooled Kodak 0400 CCD. The Chromex Raman One has a 250 mm focal length. The detector for the Chromex Raman One is a Princeton Instruments thermoelectrically cooled charge-coupled device (CCD) with controller (Model TE/CCD-1153EM with ST-135). To match the ƒ number of the collection fiber (ƒ = 2.2) to that of the spectrometer (ƒ = 4), an input coupler (Detection Limit, Model SIC-1000-Chromex) is used. Spectra are obtained using a 100 µm entrance slit, a 600 grooves/mm grating blazed at 750 nm whose position can be moved, and a CCD detector temperature of –50 °C. For the Chromex Raman One and Raman Solution 785 systems, a fiber optic sampling probe operating at 785 nm (InPhotonics, Model RPS785-12-10) is used to deliver the laser excitation to the sample and transfer the Raman emissions to the spectrometer. The excitation source for both of these systems is a tunable, continuous-wave (CW) laser diode (Spectra Diode Laser, SDL-8630) operating at 785 nm. A tunable optical isolator (Optics for Research, Model IO-7-NIR) is used to prevent backscatter of the laser beam into the laser cavity. The 785 nm laser line is focused into the silica/ silica clad, 100 µm, excitation fiber using a 5X microscope objective lens. The Raman Solution 852 system uses a 100 mW DBR frequency-stabilized diode laser operating at 852 nm and a fiber-optic mini-Raman probe.
126
2.4 Evaluation of Cationic-Coated SERS Substrates
The flow-through cell to evaluate the concentration response of the cationic-coated SERS substrates to the anions has been described elsewhere.9 SERS measurements were made using either the Raman Solution 785 system (Detection Limit), Raman Solution 852 system (Detection Limit), or the Chromex Raman One, described above. The flow-through cell is held in place with the “Opti-Claw” optical mount (New Focus, P/N 9832). The Opti-Claw is mounted on an x,y,z-translation stage (Newport Corporation, P/N 460A). 2.4 Manipulation of Spectral Data
In these experiments, anion peak area is plotted as a function of anion solution concentration. To obtain the area of the anion peak, one subtracts out the spectral contributions of the thiol coating.9 All manipulations of the spectral data were done using GRAMS/AI7 (ThermoGalactic), a software package that can be used to subtract spectra interactively as well as integrate peak areas. The validity of this approach was discussed earlier.9
3 RESULTS AND DISCUSSION 3.1 Detection of Anions Using Normal Raman Spectroscopy
Perchlorate, chromate, dichromate, nitrate, sulfate, phosphate, and cyanide are polyatomic and exhibit Raman active modes. The position of the Raman peaks used in the concentration studies for these anions are tabulated in Table I. Normal Raman spectra of aqueous solutions of these anions were obtained as a function of anion concentration. Table 1 summarizes the experimental parameters (excitation source, acquisition time) used to obtain the spectral data. The anion peak area was found to vary linearly with concentration as shown in Figure 1. The limit of detection (LOD) was determined using the limit calculation method20-22 in which
m
LODσ3
= (1)
where σ is the uncertainty in the y- intercept and m is the slope of the line. The LODs ranged from 84 ppm for perchlorate to 2600 ppm for phosphate, Table I.
In this investigation, the normal Raman spectral data were obtained using near IR excitation which minimizes fluorescence interference but at a loss of sensitivity due to the ν4 dependence of the Raman scattering cross section of a molecule. Despite the use of near IR excitation and the inherent insensitivity of normal Raman spectroscopy, the LODs obtained for the anions in Table I are fairly good. This is attributed to the increased sensitivity of current instrumentation. For example, Cunningham et al.23 demonstrated the detection of 100 ppm nitrate using 488 nm excitation at 800 mW power. The Raman system employed by Cunningham et al. was a scanning system that used photon counting for signal averaging. Their scans of the nitrate region (950-1150 cm-1) took 100s. The Raman systems used in this investigation are dispersion instruments, However, if the instruments were comparable, using 852 nm excitation and 50 mW power, our system should be less sensitive by a factor of approximately 150, meaning that the LOD for nitrate should be 150,000 ppm. As shown in Table I, the LOD for
127
nitrate in this investigation was 260 ppm, indicating that the current instrumentation is on the order of 60 times more sensitive than the instrumentation used by Cunningham et al. Despite the increased sensitivity of the current instrumentation, detection limits in the ppb to low ppm concentration range are necessary for environmental monitoring of these anions.
3.2 Detection of Anions Using Cationic-Coated SERS Substrates
The success of using chemically modified SERS substrates to detect anionic species is dependent upon identifying suitable thiol coatings to attract the ions. Because these anions are negatively charged, they should be attracted to a positively charged thiol. The following cationic thiols are commercially available: cysteamine (CY) hydrochloride, dimethylaminoethanethiol (DMA) hydrochloride, diethylaminoethanethiol (DEA) hydrochloride, L-cysteine (CYS) hydrochloride, L-cysteine methyl ester (CYSM) hydrochloride, L-cysteine ethyl ester (CYSE) hydrochloride, 2-amino-4-trifluoromethyl benzenethiol (ATB) hydrochloride, 4-(2-mercaptoethyl) pyridinium (MEP) hydrochloride, and 2-mercapto-4-methylpyrimidine (MMP) hydrochloride. The thiols CY, DMA, DEA, CYS, CYSM, and CYSE are aliphatic. ATB is an aromatic thiol and both MMP and MEP are aromatic, heterocyclic thiols.
Figures 2a shows SERS spectra of Ag/CY obtained in the presence of increasing perchlorate concentration. Using 6 s acquisition times, we can clearly see the peak due to 5 ppm perchlorate as this anion is attracted by the positively charged ammonium groups of the coating. The concentration response is shown in Figure 2b. At low anion concentration, the perchlorate peak area increases linearly with concentration. At higher solution concentrations of perchlorate, the response levels off as the adsorption sites on the substrate become fully occupied. The adsorption of perchlorate is described by a Frumkin isotherm
θ
θ
θg
g
cKecKe
2
2
1+= (2)
and
N T
N=θ (3)
where θ is the fractional coverage of the analyte on the coating, N is the number of sites on the substrate occupied by chromate, NT is the total number of sites on the substrate, c is the solution concentration of anion in M, K is the ion-pair constant between the anion and coating, and g is the Frumkin parameter. N is directly proportional to the area of the anion peak. The Frumkin parameter takes into account interactions between the adsorbed species. A negative value of g indicates the presence of repulsive forces upon adsorption while a positive value is indicative of attractive forces. The concentration profile shown in Figure 2b was computer analyzed using a Marquardt24 nonlinear least-squares fitting routine to obtain the values of K, g, and NT . Tables II-IV summarize the values of K and g obtained for the cationic coatings and anions. The selectivities of the cationic coatings will be discussed vide supra.
Difficulties were encountered when cationic-coated silver SERS substrates were used to detect chromate, dichromate, and cyanide. When immersed in water, the vibrational peaks of the coating on the silver substrates exhibit a strong SERS enhancement. However, in the presence of low concentrations of chromate, dichromate, and cyanide, significant degradation of the SERS
128
signal was observed. Better results were obtained using gold SERS substrates. Figure 3-5 summarize the SERS results obtained for Ag/MEP-ClO4
-, Au/MEP-CrO4=, Ag/MMP-ClO4
-, Au/MMP-CrO4
=, and Au/MMP- CN-. For heterocyclic, aromatic thiols such as MMP and MEP, no decrease in the signal of the thiol was observed in the presence of chromate. The concentration response of chromate with either MEP or MMP is described by a Frumkin isotherm, Figures 3b and 4d respectively. For the aliphatic coatings such as CYSM, it was observed that chromate interacted with the coating as evidenced by the appearance of the chromate peak at 835 cm-1, Figure 6. However, as the concentration of chromate increased, the intensity of the coating peaks decreased and a new peak appeared at ~600 cm-1. It has been shown that chromate interacts with glutathione (GSH)25 and other thiols26 to form a thiol ester in which the chromium binds to the sulfur atom:
GSH + CrO4 = → [GS-CrO3]- + OH- This reaction would explain why the intensity of the coating peaks decrease with increasing chromate concentration. The new peak at 600 cm-1 could be due to the S-Cr stretch. Dichromate reacted with both aliphatic and aromatic cationic thiols on gold SERS substrates. The reaction was similar to that observed for chromate and the aliphatic thiols. Cyanide concentrations less than 1000 ppm could only be detected using gold SERS substrates. Higher concentrations of cyanide (≥1000 ppm) resulted in a decrease in the SERS signal. This decrease in signal is attributed to loss of the roughened gold surface due to the formation of soluble Au(CN)2-
/Au(CN)3= complexes. For cyanide, ion pair constants could only be obtained for MEP, MMP, and CYSE.
Ionic species that are not polyatomic, such as chloride ion, will not exhibit a Raman active mode. A competitive complexation approach was developed to evaluate the ion pair constant of these species.27 Figure 7a shows SERS spectra obtained for the Ag/MEP-perchlorate system in the presence of increasing chloride ion concentration. As the chloride ion concentration increases, the intensity of the perchlorate ion decreases indicating that both the chloride and perchlorate ions are interacting with the cationic coating on the SERS substrate. Figure 7b is a plot of perchlorate peak area as a function of chloride ion. For two competing ionic species, it can be shown that the concentration response, Figure 7b, is described by the following relationship27:
Cl
ClClO C
VCA
+=∆
κ4 = A0 - ACl (3)
where A0 and ACl are the areas of the perchlorate peak in the absence and presence of chloride ion, respectively, and CCl is the chloride ion concentration in M. In equation 3, V and κ are defined as:
))2(exp(1
))2(exp(
0444
0444
θθα
ClOClOClO
ClOClOClO
gKCgKC
V+
= = αθ0 (4)
and
129
))2(exp(
))2(exp(1
0
0444
θθ
κClCl
ClOClOClO
gKgKC+
= (5)
where θ0 is the surface coverage of perchlorate ion in the absence of chloride ion, α is a proportionality constant, CClO4 is the solution concentration of perchlorate ion in M, KClO4 is the ion pair constant between the coating and perchlorate ion, KCl is the ion pair constant between the coating and chloride ion, and g is the Frumkin parameter. Chloride ion and nitrate ion have identical charge and are of similar size (chloride has an ionic radius of 181 pm and nitrate’s ionic radius is 179 pm).28 Their Gibb’s free energies of hydration (∆Ghyd ) are also similar (chloride is -340 kJ mol-1 and nitrate is -300 kJ mol-1 )28 indicating that chloride and nitrate have similar solvation properties in water. Consequently, it is not unreasonable to assume that the value of the Frumkin parameter, g, will be approximately the same for both nitrate and chloride ions. Assuming g is the same for chloride and nitrate ions and knowing the values of κ, KClO4 , and CClO4, KCl can be calculated and these values are tabulated in Tables II-IV.
3.3 Selectivities of the Cationic-Coated SERS Substrates The thiol coatings used in this investigation are positively charged. Ionophores that possess no anion recognition functionalities, other than a positive charge respond simply on the basis of the anion’s lipophilicity, with the more lipophilic anions responding the best.29 Consequently, the strength of interaction of the cationic thiols will be stronger for those ions that exhibit a higher charge or a smaller solvated radius or greater polarizability. This gives rise to the following selectivity order, known as the Hofmeister series: large lipophilic anions > ClO 4
- > SCN - > I - > NO3- > Br - > Cl - > H2PO4
-
The ion-pair constants obtained for the cationic thiols and the anions investigated are summarized in Tables II-IV. Not all of the cationic coatings followed the Hofmeister series. The aromatic thiol ATB did not interact with any of the anions. This lack of interaction is attributed to steric hindrance. ATB adsorbs onto the silver/gold surface through its sulfur atom. This places the amine group in close proximity to the silver/gold surface facilitating adsorption through the amine group. Such adsorption has been reported for 2-mercaptopyridine.30 As a result, the amine group of ATB is not of the proper orientation to form complexes with the anions. For MMP, the selectivity is CrO4
= ~ NO3- > ClO4
- > Cl- > CN- >> H2PO4-. An earlier SERS study of 2-
mercaptopyrimidine (2-MPM) indicated that 2-MPM lies flat on the surface with three heteroatoms bonding with the surface.30 Because similar spectral changes were observed for MMP upon adsorption on silver, it can be concluded that MMP has a flat orientation on the silver surface. The stability of the interaction with NO3
- is attributed to π-π interactions. Nitrate is a planar molecule with π-orbitals. Likewise MMP is a planar, aromatic compound with π-orbitals of the appropriate symmetry to interact with the π-orbitals of nitrate ion. This notion is supported by the SERS spectral data. It is observed that the intensity of the peak due to the symmetric ring breathing mode of MMP at 984 cm-1 increases with increasing nitrate concentration, indicating that π-π interactions are occurring between the nitrate ion and MMP.9 The selectivity of MEP is CrO4
= >>> CN- >> Cl- > ClO4- >>> NO3
- ~ SO4= ~ H2PO4
-. As discussed vide supra, Cr2O7=
reacted with the coatings, including MEP to form thioesters. The results summarized in Table IV indicate that MEP is highly selective for CrO4
=. Turyan and Mandler31 attributed the high CrVI
130
selectivity of MEP to its hydrogen bonding capabilities. The peaks due to the symmetric and symmetric stretching modes of chromate occur at 850 and 894 cm-1, respectively. Upon complexation with MEP, the chromate peaks broaden and shift to lower frequency (835 cm-1), which is consistent with hydrogen bonding between the O atoms of chromate and the H-N and H-C groups adjacent to the nitrogen atom of the pyridine ring. As shown in Figure 3a, interaction between chromate and MEP results in increased intensity of the MEP peaks at 948.3, 1100-1200, and 1450-1630 cm-1. These peaks are assigned to the pyridine ring vibrational modes. No such changes were observed in these peaks upon interaction with perchlorate, Figure 3c. Large intensity changes were also reported for bands due to the pyridyl portion of PAR upon complexation with Pb2+, Cd2+, and Cu2+ metal cations.32 The intensity changes indicate that the pyridine ring is involved in the complexation reaction.
The results summarized in Tables II and III indicate that chemical modification of the cationic coatings can affect their selectivities. The thiols DMA, DEA, CYS, CYSM, and CYSE are essentially chemical derivatives of CY. In these chemical derivatives of CY, either the quaternary ammonium group of CY or the hydrogens on the carbon adjacent to the quaternary ammonium group have been altered, Table V. The strength of interaction for CY with the anions, Table 3, follows the Hofmeister series: ClO 4
- >> SO4=
> NO3- > Cl- >> H2PO4
-. The strength of interaction for DEA also follows the Hofmeister series. However, CY interacts more strongly with the anions than DEA. The decrease in interaction between the anions and DEA is attributed to dispersion of the positive of the ammonium group into the ethyl groups. This results in a decrease in the charge density of the quaternary ammonium group of DEA. In the case of DMA, the strength of interaction with the anions varies SO4
= > ClO4- > NO3
- ~ Cl- >> H2PO4-. These results for DMA were rather surprising and
indicate that other factors, possibly hydrogen-bonding capability, are involved in its selectivity. Formation of C-H···O hydrogen bonds have been shown to occur and that the hydrogen bond donor strength of methyl groups R-CH3 depend on the nature of R.33 Furthermore, hydrogen bonding plays a significant role in the anion selectivity of ionophores.34 CYS did not interact with SO4
= , ClO4-, NO3
-, Cl-, or H2PO4-, Table 4, indicating that the carboxylate group repels
these anions. Esterfication of the carboxylate group to form CYSM results in the following selectivity Cl-> ClO4
- >> NO3->> SO4
=, H2PO4- while CYSE has a selectivity of ClO 4
-> Cl > NO3
->> SO4=, H2PO4
-. The differences in selectivity compared to CY is attributed to sterics and/or the lipophilic nature of the methyl/ethyl group of the ester moiety. In order to interact with the ammonium group of CYSM/CYSE, the anions have to partition between the methyl/ethyl groups of adjacent CYSM/CYSE molecules to get access to the quaternary ammonium group. Due to sterics, the anions have to shed their hydration shells. Shedding their hydration shell, besides requiring energy, will result in a higher charge density for the anions, which will increase the repulsive forces between the anions and the methyl/ethyl groups of adjacent CYSM/CYSE molecules on the SERS surface. The interaction of chloride ion with CYSM is an order of magnitude greater than the interaction with CYSE. This is attributed to hydrogen bonding between the chloride ion and the methyl group of the ester moiety.35,36
3.4 Limits of Detection
131
Anion detection limits in the ppb-ppm concentration range are easily achievable using cationic-coated SERS substrates. Figure 8a shows SERS spectra of Au/MEP in the presence of low chromate concentration. The spectral contributions of the coating have been subtracted out showing the peaks due to the symmetric and asymmetric Cr-O stretching modes. The peaks are broadened as a result of hydrogen bonding with the MEP coating. The chromate peaks for the 100 ppb solution can be easily seen. The concentration response is shown in Figure 8b. The solid line is the isotherm calculated using the values of K and g for the MEP-chromate complex, Table IV. The LOD was evaluated in the linear region of the curve and is 59.3 ppb.
4.0 CONCLUSIONS In this communication, it was shown that for normal Raman spectroscopy, using near-infrared excitation, detection limits of the polyatomic anions varied from 84 ppm for perchlorate to 2600 ppm for phosphate. In contrast, detection limits in the ppb-ppm concentration range were obtained for chromate, cyanide, sulfate, perchlorate, and nitrate in aqueous solutions when cationic-coated SERS substrates were employed. The adsorption of these anions onto the coatings was described by a Frumkin isotherm. Dihydrogen phosphate did not interact with the coatings investigated. Because dichromate reacted with the coatings to form a thiol ester, this anion could not be detected using the SERS technique. It was shown that competitive complexation can be used to evaluate the interaction of anions that do not exhibit a Raman active mode, such as chloride. In this approach, the concentration of an anion exhibiting a Raman active vibrational mode is kept constant while the chloride ion concentration is varied. The SERS response of the peak due to the Raman active mode of the probe anion is then monitored as a function of the chloride ion concentration. As the chloride ion concentration increased, the peak area due to the probe ion decreased. At higher chloride ion concentrations, the response of the probe ion levels off. Using this measured response and knowing the values of K and g for the probe ion, it is possible to extract the ion pair constant for chloride and the cationic coating. The selectivity of the coatings for the anions is determined by the positive charge density of the cationic coating and sterics. For example, the aromatic coating ATB did not interact with any of the anions investigated as a result of steric hindrance. Both hydrogen bonding and π-π interactions play significant roles in the selectivity of the cationic coatings. The aromatic, heterocyclic coating MMP owes its selectivity for nitrate ion due to π-π interactions between the aromatic ring and the nitrate ion. The great selectivity of chromate for MEP is attributed to hydrogen bonding. ACKNOWLEDGMENTS This work was supported by the Strategic Environmental Research and Development Program (SERDP).
Technol., 33, 3469 (1999). 4 N.P. Nikolaidis, L.A. Hellerich, and J.A. Lackovic, Environ. Sci. Technol., 33, 2910 (1999).
132
5 P.A. Mosier-Boss, S.H. Lieberman, and G.A. Theriault, Environ. Sci. Technol., 36, 3968 (2002).
6 S. Loyaux-Lawniczak, P. Lecomte, and J.-J. Ehrhardt, Environ. Sci. Technol., 35, 1359 (2001)
7 R.J. Kieber, J.D. Willey, and S.D. Zvalaren, Environ. Sci. Technol., 36, 5321 (2002). 8 Y. Nomura, K. Nagakubo, H.-S. Ji, A. Watanabe, T. Akimoto, S. McNiven, K. Hayashi, Y.
Arikawa, and I. Karube, Environ. Sci. Technol., 34, 2618 (2000). 9 P.A. Mosier-Boss and S.H. Lieberman, Appl. Spect., 54, 1126 (2000). 10 J. Pelley, Environ. Sci. Technol., 32, 462A (1998). 11 J. Pelley, Environ. Sci. Technol., 32, 26A (1998). 12 H.S. Okamoto, D.K. Rishi, W.R. Steeber, F.J. Baumann, and S.K. Perera, J. Amer. Water
Works Assoc., 91, 73 (1999). 13 W.K. Kowalchyk, P.A. Walker III, and M.D. Morris, Appl. Spectrosc, 49, 1183 (1995). 14 ThermoOrion, “Sensing the Future” (2002). 15 H.W. Jannasch, K.S. Johnson, and C.M. Sakamoto, Anal. Chem., 66, 3352 (1994). 16 W. Yao, R.H. Byrne, and R.D. Waterbury, Environ. Sci. Technol., 32, 2646 (1998). 17 I.D. McElvie, D.M.W. Peat, and P.J. Worsfold, Analyt. Proceedings, 32, 437 (1995). 18 B.E. Saltzman, Anal. Chem., 24, 1016 (1952). 19 T.L. Allen, Anal. Chem., 30, 447 (1958). 20. I.S. Krull and M.E. Swartz, LC·GC, 15, 534 (1997). 21. I.S. Krull and M.E. Swartz, LC·GC, 15, 842 (1997). 22. I.S. Krull and M.E. Swartz, LC·GC, 16, 464 (1998). 23. K.M. Cunningham, M.C. Goldberg, and E.R. Weiner, Anal. Chem., 49, 70 (1977). 24. D.W. Marquardt, J. Soc. Ind. Appl. Math , 11, 431 (1963). 25. P.A. Meloni and R.S. Czernuszewicz, Vibrational Spectosc., 5, 205 (1993). 26. W. Mazurek, P.J. Nichols, and B.O. West, Polyhedron, 10, 753 (1991). 27. P.A. Mosier-Boss, R.D. Boss, and S.H. Lieberman, Langmuir, 16, 5441 (2000). 28. F.P. Schmidtchen and M. Berger, Che. Rev., 97, 1609 (1997). 29. G.J. Shugar and J.A. Dean, The Chemist’s Ready Reference Handbook, McGraw-Hill, New
York (1990). 30. Y.S. Pang, H.J. Hwang, and M.S. Kim, J. Mol. Struct., 441, 63 (1998). 31. I. Turyan and D. Mandler, Anal. Chem., 69, 894 (1997). 32. L.G. Crane, D. Wang, L.M. Sears, B. Heynes, and K. Carron, Anal. Chem., 67, 360 (1995). 33. G.R. Desiraju, Acc. Chem. Res., 29, 441 (1996). 34. J.W. Steed and J.L. Atwood, Supramolecular Chemistry, John Wiley and Sons, Ltd.,
Chichester, England. 35. A. Allerhand and P. von Ragué Schleter, Am. Chem. Soc., 85, 1233 (1963). 36. R. Taylor and O. Kennard, J. Am. Chem. Soc., 104, 5063 (1982).
133
TABLES Table I. LODs and experimental parameters used to obtain concentration responses shown in Figure 1.
Anion Raman peak (cm-1)
Excitation Wavelength (nm)
Acquisition time
LOD (ppm)
Nitratea 1047 852 @ 50 mW 100 s 260 Sulfatea 982 852 @ 50 mW 100 s 440
Perchlorateb 935 785 @ 62 mW Average 5 spectra / 20 s
84
Chromateb 847d 785 @ 62 mW Average 5 spectra / 20 s
146
Dichromateb 904e 785 @ 80.2 mW Average 5 spectra / 20 s
239
Cyanidec 2059 785 @ 115 mW Average 10 spectra / 10 s
296
Phosphatea 938 852 @ 50 mW 100 s 2600 a. Spectral data obtained using the Raman Solution 852 system. b. Spectral data obtained using the Raman Solution 785 system. c. Spectral data obtained using the Chromex Raman One system. d. Overlaps with the 884 cm-1 peak. e. Overlaps with the 943 cm-1 peak. Table II. Summary of ion-pair constants (M-1) and Frumkin parameters for cysteamine thiol derivatives and selected anions as determined by SERS.
Anion CY DMA DEA Nitrate K=382±60; a
g=-0.30±0.25 K=301±78; a g= -2.3±1.1
K=228±29; a g= -1.22±0.30
Sulfate K=1620±320; a g= -0.37±0.23
K=972±85; a g= -1.14±0.13
K=770±100; a g= -0.07±0.12
Chloride K=146±23; a,d g= -0.30±0.23
K=310±180; a,d g= -2.3±1.1
K=107±20; a,d g= -1.22±0.30
Dihydrogen phosphate
No interaction a No interaction a No interaction a
Perchlorate K=6150±830 b g= -1.10±0.15
K= 404±59 b g= -0.64±0.21
K= 4950±250 b g= -2.42±0.10
Chromate Forms a thioester b Forms a thioester b Forms a thioester b Dichromate Forms a thioester b Forms a thioester b Forms a thioester b Cyanide Reacts with Ag/Au
substrate c Reacts with Ag/Au substrate c
Reacts with Ag/Au substrate c
a. Spectral data obtained using the Raman Solution 852 system.
134
b. Spectral data obtained using the Raman Solution 785 system. c. Spectral data obtained using the Chromex Raman One system. d. The probe ion is nitrate. Table III. Summary of ion-pair constants (M-1) and Frumkin parameters for cysteine thiol derivatives and selected anions as determined by SERS.
Anion CYS CYSM CYSE Nitrate No interaction b K=307±15; b
g= -1.20±0.11 K=513±85; a g= -2.06±0.44
Sulfate No interaction b No interaction b No interaction a Chloride Could not evaluate K=36600±6800; b,d
g= -1.20±0.11 K=1190±260; a,d
g= -2.06±0.44 Dihydrogen phosphate
No interaction b No interaction b No interaction a
Perchlorate No interaction b K=7380±450 b g= -2.71±0.10
K=4650±500 b g= -2.14±0.18
Chromate Forms a thioester b Forms a thioester b Forms a thioester b Dichromate Forms a thioester b Forms a thioester b Forms a thioester b Cyanide Reacts with Ag/Au
substrate c Reacts with Ag/Au substrate c
K=700±100 g= 0.17±0.20 c
a. Spectral data obtained using the Raman Solution 852 system. b. Spectral data obtained using the Raman Solution 785 system. c. Spectral data obtained using the Chromex Raman One system. d. The probe ion is nitrate.
135
Table IV. Summary of ion-pair constants (M-1) and Frumkin parameters for cysteine thiol derivatives and selected anions as determined by SERS.
Anion MMP MEP ATB Nitrate K=2370±200; a
g= -2.58±0.15 No interaction b No interaction b
Sulfate Spectral interference a
No interaction b No interaction b
Chloride K=596±77; a,d
g= -2.58±0.15 K=92±22; b,e
g= 1.35±0.24 Could not evaluate
Dihydrogen phosphate
No interaction b No interaction b No interaction b
Perchlorate K=1163±56 b g= -2.51±0.21
K=38±11 b g= 1.35±0.24
No interaction b
Chromate K=2760±150 b g= -2.80±0.18
K=142800±7700 b g= -2.068±0.063
No interaction b
Dichromate Forms a thioester b Forms a thioester b Forms a thioester b Cyanide K=146±22; c
g= 0.71±17 K=1090±340 c g= 0.14±0.30
Reacts with Ag/Au substrate c
a. Spectral data obtained using the Raman Solution 852 system. b. Spectral data obtained using the Raman Solution 785 system. c. Spectral data obtained using the Chromex Raman One system. d. The probe ion is nitrate. e. The probe ion is perchlorate. Table V. Summary of the modifications of CY to yield the chemical derivatives DMA, DEA, CYS, CYSM, and CYSE.
Thiol Modification to CY DMA -NH(CH3)2
+
DEA -NH(CH2CH3)2+
CYS -CH(COOH)-NH3+
CYSM -CH(COOCH3)-NH3+
CYSE -CH(COOCH2CH3)-NH3+
136
FIGURE CAPTIONS Figure 1. Plots of anion peak area as a function of concentration. Experimental parameters are
summarized in Table I. Figure 2. (A) SERS spectra of Ag/CY obtained using 785 nm excitation at 80.2 mW power and
averaging five 6 s spectra. Perchlorate concentrations are 5, 100, 500, 1000, and 104 ppm. (B) Perchlorate peak area plotted as a function of perchlorate concentration for Ag/CY.
Figure 3. (A) SERS spectra of Au/MEP system in 0, 1, 10, 50, 100, 1000, and 104ppm chromate.
Spectra obtained using 785 nm excitation at 80.2 mW power and averaging five 20 s spectra. (B) Chromate peak area plotted as a function of chromate concentration for Au/MEP. (C) SERS spectra of Ag/MEP system in 0, 100, and 10,000 ppm perchlorate. Spectra obtained using 785 nm excitation at 80.2 mW power and averaging five 15 s spectra. (D) Perchlorate peak area plotted as a function of perchlorate concentration for Ag/MEP.
Figure 4. (A) SERS spectra of Ag/MMP system in 0, 50, 750, and 104ppm perchlorate. Spectra
obtained using 785 nm excitation at 80.2 mW power and averaging five 10 s spectra. (B) Perchlorate peak area plotted as a function of perchlorate concentration for Ag/MMP. (C) SERS spectra of Au/MMP system in 0, 50, 750, and 104ppm chromate. Spectra obtained using 785 nm excitation at 60 mW power and averaging five 10 s spectra. (D) Chromate peak area plotted as a function of chromate concentration for Au/MMP.
Figure 5. (A) SERS spectra of Au/MMP system in 0, 25, 100, 750 ppm cyanide. Spectra
obtained using 785 nm excitation at 80.2 mW power, 100 µm slits, TCCD= -50 °C, and averaging ten 10 s spectra. (B) Cyanide peak area plotted as a function of cyanide concentration for Au/MMP.
Figure 6. (A) SERS spectra of Au/CYSM system in 0, 10, 25, 100, 250, 5000, and 104ppm
chromate. Spectra obtained using 785 nm excitation at 80.2 mW power and averaging five 20 s spectra. (B) Concentration response of the 850 cm-1 (black line) and the 600 cm-1 (gray line) peaks.
Figure 7. (A) SERS spectra of Ag/MEP/perchlorate obtained as a function of chloride ion
concentration. Insert is an expansion of the perchlorate spectral region. Perchlorate concentration is kept constant at 1000 ppm. The chloride ion concentration is 0, 500, 1000, 2500, and 5000 ppm. Spectra obtained using 785 nm excitation at 80.2 mW
137
power and averaging five 15 s spectra. (B) Perchlorate peak area plotted as a function of chloride concentration for Ag/MEP.
Figure 8. SERS response obtained for Au/MEP and 0.1-1.0 ppm chromate. (A) SERS spectra
between 750-950 cm-1. The spectral contributions of MEP have been subtracted out. The peaks due to the symmetric and asymmetric Cr-O vibrational modes are indicated. Spectra obtained using 785 nm excitation at 80.2 mW power and averaging five 20 s spectra. (B) Chromate peak area as a function of concentration. The solid line is calculated using the values of K and g, Table IV.
138
Figure 1
PO43-
ClO41-
SO42-
NO31-, CN1-
Cr2O72-
CrO42-
0
25000
50000
75000
100000
Ram
an in
ten
sity
0 3000 6000 9000 12000
anion concentration (ppm)
139
Figure 2
400 700 1000 1300 1600
wavenumber (cm-1)
10000
16000
22000
28000
34000
40000
inte
nsity ClO4
-
400 700 1000 1300 1600
wavenumber (cm-1)
10000
16000
22000
28000
34000
40000
inte
nsity ClO4
-ClO4-
-0.010 0.030 0.070 0.110
ClO4- concentration (M)
0
50000
100000
150000
200000
ClO
4- p
eak
area
A
B
140
Figure 3
ClO4-
600 1150 1700wavenumber (cm-1)
14000
36000
58000
inte
nsi
ty350.0 1025.0 1700.0
wavenumber (cm-1)
17000
33000
49000
inte
nsi
ty CrO4=
-0.005 0.050 0.105CrO4
= concentration (M)
20000
100000
180000
CrO
4= p
eak
area
0.000 0.060 0.120ClO4
- concentration (M)
0
7000
14000C
lO4-
pea
k ar
ea
A C
B D
141
Figure 4
ClO4-
CrO4=
D
B
0
25000
50000
75000
100000
ClO
4- p
eak
area
-0.005 0.018 0.041 0.064 0.087 0.110
ClO4- concentration (M)
0
50000
100000
150000
200000
CrO
4= p
eak
area
-0.005 0.027 0.059 0.091
CrO4= concentration (M)
400 800 1200 1600
wavenumber (cm-1)
A
400 800 1200 1600
wavenumber (cm-1)
C
142
Figure 5
7000
17000
27000
37000
47000
inte
nsi
ty
550 860 1170 1480 1790 2100
wavenumber (cm-1)
CN-
0.000 0.010 0.020 0.030 0.040
CN- concentration (M)
0
22000
44000
66000
CN
- pea
k ar
ea
A
B
143
Figure 6
1x10⁴
4x10⁴
6x10⁴
inte
nsity
450 850 1250 1650
wavenumber (cm-1)
0
4x10⁵
8x10⁵
1x10⁶
peak
are
a
-1000 1750 4500
ppm of chromate
7250 10000
A
B
144
Figure 7.
900 960
15000
25000
35000
45000
55000
inte
nsi
ty
1000 1500
wavenumber (cm-1)
500
0.0 0.1 0.2 0.3 0.4 0.5 0.6
wt. % NaCl solution
0.70
2000
4000
6000
ClO
4- pea
k ar
ea
A
B
145
Figure 8
area
0
60000
120000
180000
240000
300000
0.000000 0.000005 0.000010
concentration of CrO4= (M)
0
5000
10000
15000
20000
25000
inte
nsity
750 800 850 900 950
wavenumber (cm-1)
νs(Cr-O) νas(Cr-O)
146
B5. Patent Application, Navy Case 82434
INTEGRATED OPTICAL WAVEGUIDE SENSOR
CROSS-REFERENCE TO RELATED APPLICATIONS
This is a continuation-in-part of Application Serial No. 09/593,675, filed 14 June 2000, entitled A Metal
And Glass Structure For Use in Surface Enhanced Raman Spectroscopy and Method for Fabricating Same (Navy
Case No. 79987).
BACKGROUND OF THE INVENTION
The present invention generally relates to a sensor for detecting anionic nutrients and toxic anions, and
more particularly to a sensor that employs surface enhanced Raman spectroscopy (SERS ) for detecting very small
concentrations of anionic nutrients.
Detection and control of ionic pollutants (i.e., nitrates, sulfates, and phosphates) and toxic anions
(perchlorates, chromate, d: chromate, and cyamide) are important for the protection of the environment. When
waste waters that contain ionic nutrients are discharged into surface waters, they can promote the unnatural growth
of blue-green algae to the detriment of other plant and animal life. The decay of dead algae causes a reduction in
the amount of dissolved oxygen available in the water. Eventually, the excess concentration of nutrients in the body
of water results in the inability of the body to support any other life forms, a process called eutrophication. Besides
eutrophication, ionic pollutants have been blamed for the increased incidences of red tide, blooms of toxic, single-
celled organisms, such as dinoflagellates, that have caused die-offs of fish, dolphins, manatees, and other aquatic
animals. Dinoflagellates are thought to be responsible for the human disease ciguatera. Symptoms of this disease
include loss of coordination, slowed heartbeat, and diarrhea. Most people recover, but some victims die.
Dinoflagellates are also blamed for paralytic shellfish poisoning.
Nitrates represents a potential human health hazard, and nitrate contamination is the most common reason
for the shutdown of public water supply wells. When consumed, nitrates are converted to N-nitroso compounds in
the human stomach. Some of these compounds are carcinogenic. It has been suggested that stomach cancer is
147
associated with nitrate uptake. Furthermore, certain species of bacteria in humans can enzymatically reduce nitrate
to nitrite. The toxic effects of nitrites include vasodilation, lowered blood pressure, and formation of
methemoglobin, a non-oxygen carrying form of hemoglobin. In infants, methemoglobinemia is known as “blue
baby syndrome.”
While ionic pollutants can enter the water supply by a number of natural means, the most significant
contributions result from man made processes, such as fertilizers used in agriculture and effluents from sewage
treatment plants. In order to protect the public health, a need exists for a sensor capable of monitoring ionic
pollutants continuously, simultaneously, in real time, in–situ, and with little or no sample preparation. Such a sensor
needs to be able to differentiate ionic species, not suffer from interferences, be able to detect ppm concentrations of
pollutants, and be reversible. Technologies which have been used in the past include colorimetry, UV-VIS
absorption spectrometry, Raman spectrometry, electrochemical methods such as amperometry, or potentiometry
using ion selective electrodes, and ion exchange chromatography. However, these approaches do not meet all the
desired criteria of specificity, sensitivity, reversibility, real-time, etc.
In the 1970s, it was discovered that Raman scattering from molecules of an analyte of interest adsorbed on
noble metals such as silver, copper, and gold when irradiated with optical energy can be enhanced by as much as 106
to 107 compared to merely irradiating the analyte. This phenomenon is known as surface enhanced Raman
spectroscopy (SERS). A SERS structure generally includes a silver, gold, or copper metal layer formed on a substrate
and is used to detect the presence of an analyte by examining the emissions from the substrate when irradiated with
optical excitation energy. SERS emissions, or spectra, have been used to detect and identify trace organic materials
and as a detection method in gas chromatography, liquid chromatography, and thin layer chromatography.
Electrochemical SERS and SERS of chemically modified surfaces have been used to detect aromatic compounds,
chlorinated hydrocarbons, and other organic contaminants of environmental concern in the ppm range.
Therefore, a need exists for a robust sensor that can detect and identify trace amounts of anionic nutrients
and which can overcome the aforementioned problems.
SUMMARY OF THE INVENTION
148
The present invention is directed to an integrated optical waveguide sensor system for detecting organic
contaminants with a sensitivity of ppm and even ppb in some cases. The sensor includes: an optical waveguide
having a monolithic and roughened metallic layer on which a self-assembled monolayer is formed; an optical energy
source for generating an optical excitation signal to be coupled into the waveguide; and a spectrometer for detecting
spectra of optical energy emitted from the optical waveguide. The waveguide facilitates multiple SERS responses
resulting from interactions between the optical excitation signal and an analyte of interest that may be present on the
surface of the self-assembled monolayer. Certain of the emitted spectra from the waveguide may be correlated to the
presence of specific analytes in contact with the self-assembled monolayer.
These and other advantages of the invention will become more apparent upon review of the accompanying
drawings and specification, including the claims.
BRIEF DESCRIPTION OF THE DRAWINGS
Figure 1 is a cross-sectional view of an integrated optical waveguide sensor that embodies several features
of the present invention.
Figure 2 shows the application of the integrated optical waveguide sensor of Figure 1.
Figure 3 is a cross-sectional view of a SERS structure embodying various features of the present invention.
Figure 4 is an enlarged view of a section of the structure depicted in Figure 2.
Figure 5 represents the formation of a silane layer on surface of a glass substrate in the manufacture of the
invention.
Figure 6 shows the formation of a self-assembled monolayer (SAM) layer on the metal islands bonded to the
glass substrate in the manufacture of the SERS structure of Figures 1 and 2.
Figure 7 shows an integrated optical waveguide sensor system that embodies several features of the present
invention.
Figure 8 shows a system for oxidizing and reducing the smooth, reflective metal coating inside the tube of
Figure 18.
Figure 9 is a graph representing one period of an oxidation-reduction cycle used to manufacture a SERS
structure in the electrochemical cell of Figure 7.
149
Throughout the several views, like elements are referenced using like references.
DESCRIPTION OF THE PREFERRED EMBODIMENT
The present invention is described with reference to Figure 1 where there is shown an integrated optical
waveguide sensor 200 for detecting anionic nutrients using surface enhanced Raman spectroscopy (SERS). By way
of example, the invention may be used to detect nitrate ions for assessing the quality of drinking water. The
invention also may be used to monitor concentrations of nitrates and phosphates to minimize run-off of fertilizers
into aquatic bodies such as a ponds, lakes, or rivers. Other applications of the invention include monitoring the
concentration of ionic nutrients in the effluent of sewage treatment plants to minimize the release of such nutrients
into the environment, and thereby better manage aquatic ecosystems.
Referring to Figure 1, integrated optical waveguide sensor 200 includes a SERS structure 10 affixed to an
optical assembly 222. Optical assembly 222 is a layered structure that includes a transparent or translucent optical
element 14 bonded to an optically transparent element 226 which in turn is bonded to a transparent substrate or
element 224. Optical assembly 222 also includes spaced apart optical coupling gratings 228 affixed between
elements 226 and 224. Optically transparent substrate 224, optically transparent element 226, and optical element
14, may each be made of glass and have indices of refraction and , and respectively, where and
. Optical assembly 222 is commercially available from WZW-Optic of Balgach, Switzerland
Referring to Figures 1 and 2, when in contact with an analyte of interest and illuminated with appropriate
excitation energy, SERS structure 10 produces optical emissions having unique characteristics that are used to detect
the presence of an analyte of interest 252 in an aquatic or gaseous environment 250. By way of example, analytes
may include organic, metallic, and anionic contaminants. Referring to Figures 3 and 4, SERS structure 10 includes a
specially roughened surface 12 formed on optical element 14 which may be made of optically translucent or
transparent materials such as glass or hafnium oxide, on which an adhesion layer 15 is formed. Adhesion layer 15
promotes the bonding of the metal layer 16 to substrate14. The metal layer 16 is formed, as for example, by vapor
deposition, onto adhesion layer 15 to create a monolithic and roughened, patterned metal layer as shown in Figure 4.
150
A thiol coating, or self-assembled monolayer 18 on metal layer 16 protects metal layer 16 from chemical
contamination, thereby extending the lifetime of SERS structure 10 when exposed to aqueous environments from
minutes or hours to months. The roughened surface 12 facilitates both a good SERS response and adhesion of the
metal layer 16 to the substrate 14.
In the fabrication of structure 10, optically transparent substrate 14, such as a clear borosilicate glass, is
carefully cleaned and prepared prior to having a metal film deposited on it. First, substrate 14 is immersed in a
heated or boiling liquid reagent or reagents to remove any oils, metallic materials, and other contaminants that may
be present on substrate14. By way of example, substrate 14 may be immersed in a Pyrex beaker containing boiling
nitric acid for about 30 minutes. However, other liquid reagents also may be used such as hydrofluoric acid,
hydrochloric acid, potassium hydroxide. Next, substrate 14 is removed from the boiling nitric acid and rinsed in
either deionized or distilled water. After the water rinse, substrate 14 is immersed in hot or boiling methanol for
about 30 minutes, followed by immersion in boiling acetone for about 30 minutes. This procedure removes any
remaining organic contaminants. Substrate14 then is removed from the methanol and allowed to air dry, as for
example, about 1 hour.
Referring to Figure 3, cleaned surface 12 of substrate14 is etched to provide surface 12 with a surface
roughness having a maximum peak to valley depth of about 16,000 A, an average peak to valley depth of about
2,500 A, and a peak to peak periodicity of about 12.5 microns. The roughness of surface 12 and its periodicity were
measured using a Dektak3ST Surface Profiler (Vecco Sloan Technology). In contrast, commercial white glass
generally has a surface having a peak to valley depth of about 200,000 A, an average peak to valley depth of about
43,700 A, and a peak to peak periodicity of about 100 microns. The combination of surface roughness and peak to
peak periodicity of surface 12 provides SERS structure 10 with a greatly enhanced SERS response compared to that
of SERS structures that include commercial glass. In one implementation of the invention, portions of or selected
regions of surface 12 may be etched using a chemical etchant such as an HF based cream such as Velvet Etching
Cream, manufactured by McKay International. Experience has shown that etching white glass for approximately 1
151
minute provides the surface roughness characteristics described above. Alternatively, surface 12 may be roughened
using standard photo lithographic techniques.
After etching, optical element 14 is rinsed with distilled or deionized water, followed by an ethanol rinse.
The cleaned, etched substrate 14 is then derivitized in a si lanization agent such as a 1:10 mixture by volume of (3-
mercaptopropyl) trimethoxysilane (MCTMS) in ethanol for about 24 hours to form adhesion layer 15 on roughened
surface 12, shown in Figure 4. Referring now to Figure 5, it is believed that the derivitization process causes a silane
layer 17 to bond to -OH functional groups 19 believed to be present on surface 12 in applications wherein substrate
14 is made of transparent glass or hafnium oxide (hafnia) substrate. Substrate 14 was next rinsed in ethanol to
remove unreacted (3-mercaptopropyl) trimethoxysilane and allowed to air dry. As illustrated in Figure 6, adhesion
layer 15 promotes bonding between roughened surface 12 and monolithic, roughened metal layer 16 having metal
peaks 21.
Still referring to Figure 4, and by way of example, a metal such as gold, silver, or copper may be vapor
deposited onto adhesion layer 15 to form monolithic and roughened metal layer 16 that generally has the contours of
roughened surface 12. In one implementation of the invention, a gold layer was vapor deposited onto roughened
surface 12 using material evaporated from an Aldrich, 99.99% pure gold wire using a Vecco Model EC 200 vapor
deposition system. As a result of the aforesaid processing, adhesion layer 15 durably bonds metal layer 16 to
roughened surface 12 so that SERS structure 10 may provide an effective SERS response after being immersed in an
aqueous environment for months.
After depositing metal layer 16 onto adhesion layer 15 a patterned structure 11, as shown in Figure 6, is
created. Patterned structure 11 may be placed in a dilute ethanolic thiol solution at ambient temperature and
pressure for a period of time, such as 24 hours. While structure 11 is immersed in the thiol solution, metal layer 16
reacts with the thiol to form a durable, self-assembled monolayer 18 on the metal layer 16, as shown in Figure 6.
Thiols selected for fabricating self-assembled monolayer 18 may be selected which have an affinity for the analyte
(organic compounds, metal ions, or anions) of interest. Moreover, detection limits in the ppb to ppm range are
152
possible. TABLE 1 provides, by way of example, a list of examples of thiols and analytes that may be detected using
such thiol coatings. However, TABLE 1 is not to be considered exhaustive.
TABLE 1
Thiol Type:
Useful For Detecting:
1-propanethiol
Benzene, toluene, ethylbenzene,
xylene) and chlorinated solvents cysteamine hydrochloride
anions such as nitrate and sulfate
4-(2-pyridylazo) resorcinol modified with a disulfide group
Pb++, Cd++, and Cu++
thiol derivatized dibenzo 18-crown-6
alkali metals
The operation of sensor 200 is described with reference to Figure 2. Integrated optical waveguide sensor
200 includes a SERS structure 10 affixed to an optical assembly 222. Optical assembly 222 includes an optical
coupling grating 228 affixed between an optically transparent substrate or element 224 and optically transparent
element 226. Optically transparent substrate 224, optically transparent element 226, and optical element 14 have
indices of refraction , , and respectively, where and . Optical energy source 230 generates
an optical excitation signal 232 that is collimated by lens 234 and filtered by filter 236 so as to result in a filtered
optical excitation signal 233. Filter 236 filters out all optical signals having wavelengths other than the wavelengths
of the optical excitation signal 233. Filtered optical excitation signal 233 is directed through optical structure 222
and into optically transparent substrate or element 14. Coupling gratings 228 helps to couple filtered optical signal
233 into and out of integrated optical waveguide sensor 200. Because the index of refraction of optical element
226 is greater than the indices of refraction of optical substrate 224 (n1) and optical element 14 (n2), optically
transparent element 226 serves as a waveguide through which filtered optical signal 233 efficiently propagates. By
way of example, optical energy source 230 may be implemented as a Spectra Diode Laser, Inc. Model SDL-5712-
H1, for generating optical excitation signal 232 as a monochromatic, coherent light signal having a wavelength of
852 nm.
However, portions of filtered optical signal 233 leak from optical element 226 into optical element 14 and
then irradiate samples of an analyte 252 of interest in contact with self-monomer layer 18. Optical signals 233 that
153
come into contact with analyte 252 and self-assembled monolayer 18 undergo a SERS response and are Raman
down-shifted in frequency to produce Raman shifted optical signals 237. Portions of Raman shifted optical signals
237 enter and propagate through optical element 14, optical element 226, and optical substrate 224. Some of the
Raman shifted optical signals 237 are emitted from integrated optical waveguide sensor 200 and then filtered and
transformed by optical filter 240 into filtered Raman shifted optical signals 239. Next, filtered Raman shifted
optical signals 239 are focused and directed by optical lens 242 to spectrometer 246, which may for example, be
implemented as a Chromex Raman One Spectrometer. Optical filter 240 filters out optical energy at wavelengths
equal to or less than the wavelengths of filtered optical signal 233, which may otherwise saturate spectrometer 246.
Spectrometer 246 generates an output signal 247 that represents the spectra of Raman emissions that characterize
filtered Raman shifted optical, i.e., SERS signals 239. Output signals 247 may then be provided to computer 248 for
subsequent processing and analysis.
Figure 7 shows another embodiment of the present invention implemented as integrated optical waveguide
sensor system 300 that includes an optical energy source 302 that generates an optical excitation signal 304 that is
directed by optical fiber 306 through filter 308 and tubular optical waveguide 310. By way of example, optical
energy source 302 may be implemented as a Spectra Diode Laser, Inc. Model SDL-5712-H1, for generating optical
excitation signal 304 as a monochromatic, coherent light signal having a wavelength of 852 nm. Filter 308 is an
optical bandpass filter that removes emissions due to Raman or fluorescent emissions that may be stimulated in
optical fiber 306 by optical excitation signal304. Optical excitation signal 304 signal enters end 311A of optical
waveguide 310. If any analyte of interest 313 is present on the self-assembled monolayer 324 formed around the
inside surface of waveguide 313 Raman shifted or SERS light signals 315 and optical excitation signal 304 are
emitted from end 311B of tubular waveguide 310. Low pass filter 312 blocks light having wavelengths equal to or
shorter than the wavelengths that characterize optical excitation signal 304, but passes Raman shifted optical signal
315 that is directed by optical fiber 314 to spectrometer 316. Optical fibers 306 and 314 preferably are low -OH
silica and/or silica clad optical fibers that are transparent to the wavelength of optical excitation signal 304.
Optical waveguide 310 includes a glass tube 318 having a circumferential, inside surface 320 on which a
monolithic and textured metal layer 322 is formed. Glass tube 318 may be made of hafnium oxide or other types of
glass, having a higher index of refraction than that of distilled water. By way of example, metal layer 322 may be
made of gold or silver because these metals are known to provide an excellent SERS response. A self-assembled
monolayer 324 is formed over metal layer 322.
154
Still referring to Figure 7, in the manufacture of optical waveguide 310, circumferential inside surface 320
of tube 318 is roughened by etched to provide surface 320 with, for example, a surface roughness having a
maximum peak to valley depth of about 16,000 A, an average peak to valley depth of about 2,500 A, and a peak to
peak periodicity of about 12.5 microns. Surface 318 may be etched using a chemical etchant such as an HF based
cream such as Velvet Etching Cream, manufactured by McKay International. Experience has shown that etching
the glass for approximately 1 minute provides the surface roughness characteristics described above. Alternatively,
surface 320 may be etched by immersing tube 318 in a dilute solution of 0.1M hydrofluoric acid (HF) for about one
minute. Next, metal layer 322 may be formed over roughened inside surface 320 of tube 318 by depositing a
monolithic layer 324 of gold or silver over roughened surface 320 using techniques well known by those skilled in
the art. After the formation of metal layer 322, tube 318 and more specifically, the inside surface 320, of tube 318 is
rinsed with distilled water to remove any salts that may have accumulated on the surface 320. Following the
distilled water rinse, tube 318 is rinsed with ethanol (CH3 CH2OH) to remove any distilled water that may be present
on the circumferential inside surface 320. Finally, tube 318 is soaked in a dilute solution of thiol for about 24 hours
at room temperature to create the self-assembled monolayer 324 on monolithic metal layer 322 inside tube 318.
Another method for manufacturing waveguide 310 is described with reference to Figure 8. First, tube 318
in a heated or boiling liquid reagent or reagents such as nitric acid, hydrofluoric acid, hydrochloric acid, or potassium
hydroxide, for about 30 minutes. Such immersion removes any oils, metallic materials, and other contaminants that
may be present on tube 318. Next, substrate tube 318 is removed from the boiling reagent and rinsed in either
deionized or distilled water. After the water rinse, tube 318 is immersed in hot or boiling methanol for about 30
minutes, followed by immersion in boiling acetone for about 30 minutes. This procedure removes any organic
contaminants that may remain on tube 318. Next, tube 318 is removed from the boiling methanol and allowed to
air dry, as for example, about 1 hour. Following cleaning, the process of manufacturing waveguide 310 involves
coating the circumferential inside surface 320 of tube 318 with a monolithic, metal coating 340. In order to fabricate
metal coating 340, an organic metallic paint that preferably containing a reflective metal such gold or silver, is
diluted with toluene or another organic solvent, the concentration of which is not critical, in order to create a diluted
paint mixture. Then, the circumferential inside surface 320 of tube 318 is coated with the diluted paint mixture.
Next, tube 318 maybe thermally reduced by increasing the temperature of the tube from room temperature up to
155
about 590°C at a rate of about 5°C/min in a programmable oven such as a Lindberg Model No. 59246-E6. The tube
318 then is heat soaked at 590°C for about 1 hour, and then allowed to return to room temperature by turning off the
oven. The exposure of tube 318 to such temperatures drives off volatile organics, whereby a smooth, reflective
metallic coating 320 having a thickness, for example, of about 200 nm is well adhered or affixed to circumferential
inside surface 320 of tube 318.
Next, referring to Figure 8, tube 318 is subjected to several oxidation/reduction cycles in order to roughen
metal coating 340. Tube 318 is immersed in an electrochemical cell 111 that includes electrolyte 101 such as a 0.1M
solution of potassium chloride (KCl) held within fluid container 104 and electrodes 105 and 108, and a working
electrode 113 comprised of electrical lead 114 and a clamp 106 for holding tube 318 within the electrolyte 101 so
that there is electrical continuity between electrode 113 and metal coating 340. It is important that metallic clamp
106 not be immersed in the electrolyte 101 to prevent metallic ions from the clamp from contaminating electrolyte
101. Also immersed in electrolyte 101 are counter electrode 105 and reference electrode 108. Counter electrode
105 preferably is made of platinum wire and is positioned inside the tube 318. Reference electrode 108 preferably is
made of silver/silver chloride and is also positioned inside tube 318, but where the tips of electrodes 108 and 105 are
separated. Electrodes 105 and 108 are connected to potentiostat 116 as shown. Similarly, clamp 106 is connected
via wire 114 to potentiostat 116. Potentiostat 116 maintains appropriate voltage levels at each of electrodes 105 and
108, and electrode 113 under the supervision of computer 118 via signal line 120.
Still referring to Figure 8, voltage, VW, of working electrode 113 is modulated from -300 mV to 1200 mV
with respect to the voltage of reference electrode 108 for a predetermined number of oxidative -reductive cycles, as
required to suit the needs of a particular application. An example of an oxidative -reductive cycle is shown, by way of
example, in Figure 9. In an oxidative -reductive cycle, VW is held at -300 mV for about 30 seconds and then ramped
to 1200 mV at a rate of about 500 mV/s. Next, VW is held at 1200 mV for about 1.3 seconds and then reduced to -
300 mV at a rate of about -500 mV/s. Subjecting metal coating 340 to preferably 25 oxidative-reductive cycles of the
type described above transforms smooth, monolithic metal coating 340 into a roughened metal coating 340 having
an average surface roughness of about 20 Å, thereby creating a patterned metal SERS structure.
After creating roughened metal coating 340, tube 318 is rinsed with distilled water to remove any salts that
may have accumulated on the surfaces of tube 318 and roughened metal layer 340. Following the distilled water
rinse, tube 318 is rinsed with ethanol (CH3CH2OH) to remove any distilled water that may be present on surfaces of
156
tube 318 and roughened metal layer 340. Finally, tube 318 is soaked in a dilute solution of thiol for about 24 hours
at room temperature to create the self-assembled monolayer 324 on monolithic metal layer 322 inside tube 318, and
thereby create waveguide 310.
Obviously, many modifications and variations of the present invention are possible in light of the above
teachings. It is therefore to be understood that within the scope of the appended claims, the invention may be
practiced otherwise than as specifically described.
157
THE CLAIMS
I claim:
1. An integrated optical waveguide sensor system, comprising:
an optical waveguide having a monolithic and roughened metallic layer on which a self-assembled monolayer is
formed;
an optical energy source for generating an optical excitation signal; and
a spectrometer for detecting spectra of optical energy emitted from said optical waveguide.
2. The integrated optical waveguide sensor system of claim 1 wherein said optical waveguide is shaped as a tube.
3. The integrated optical waveguide sensor of claim 2 further including a first optical fiber for directing said optical
excitation signal into said optical waveguide.
4. The integrated optical waveguide sensor of claim 2 further including a second optical fiber for directing said
spectra of optical energy emitted from said optical waveguide to said spectrometer.
5. The integrated optical waveguide sensor system of claim 1 which further includes a first optical bandpass filter.
6. The integrated optical waveguide sensor system of claim 1 which further includes a second optical bandpass
filter interposed between said optical waveguide and said spectrometer for substantially preventing said optical
excitation signal from irradiating said spectrometer.
7. The integrated optical waveguide sensor system of claim 1 wherein said roughened metallic layer is formed on a
roughened surface of a glass substrate.
158
8. The integrated optical waveguide sensor of claim 1 wherein said optical waveguide includes:
a first optically transparent element having a first index of refraction ;
a second optically transparent element having a second index of refraction , where ;
an optical coupling grating affixed between said first and second optically transparent elements; and
a third optically transparent element attached to said second optically transparent element and having a third index
of refraction , wherein said third optically transparent element has a roughened surface on which a monolithic
and roughened metal layer and a self-assembled monolayer are affixed, and .
9. The sensor of claim 8 wherein said third optically transparent element includes
an adhesion layer formed on said roughened surface, wherein said metal layer is formed on said adhesion layer and
said self-assembled monolayer is formed over said metal islands.
10. The structure of claim 9 wherein metal layer consists essentially of a metal selected from the group that includes
copper, silver, and gold.
11. The structure of claim 9 wherein said metal layer is formed by vapor depositing said metal on said adhesion
layer.
12. The structure of claim 10 wherein said thiol is selected from the group that includes 1-propanethiol, cysteamine
hydrochloride, 4-(2-pyridylazo) resorcinol modified with a disulfide, and thiol derivatized dibenzo 18-crown-6.
159
13. The structure of claim 10 wherein said roughened surface has an average surface roughness that does not exceed
about 2,500 A and an average peak to peak periodicity that does not exceed about 12.5 microns.
14. The structure of claim 10 wherein said roughened surface has an average peak to peak periodicity that does not
exceed about 12.5 microns.
15. The structure of claim 10 wherein said roughened surface has an average surface roughness that does not exceed
about 2,500 and an average peak to peak periodicity that does not exceed about 12.5 microns.
16. The sensor of claim 10 wherein said first optically transparent layer is made of glass and n1 is approximately
1.56.
18. The sensor of claim 10 wherein said optically transparent substrate is made of borosilicate and n2 is
approximately 1.51.
20. The sensor of claim 10 wherein said second optically transparent layer is made of silica wherein n3 is
approximately 1.46.
21. An integrated optical waveguide, comprising:
a first optically transparent element having a first index of refraction ;
a second optically transparent element having a second index of refraction , where ;
an optical coupling grating affixed between said first and second optically transparent elements; and
160
a third optically transparent element attached to said second optically transparent element and having a third index
of refraction , wherein said third optically transparent element has a roughened surface on which metal islands
and a self-assembled monolayer are affixed, and .
21. The sensor of claim 20 wherein said third optically transparent element includes an adhesion layer formed on
said roughened surface, wherein said metal islands are formed on said adhesion layer and said self-assembled
monolayer is formed over said metal islands.
22. The structure of claim 20 wherein metal islands consist essentially of a metal selected from the group that
includes copper, silver, and gold.
160
ABSTRACT OF THE DISCLOSURE
An integrated optical waveguide sensor system includes: an optical waveguide having a monolithic and roughened metallic layer on which a self-assembled monolayer is formed; an optical energy source for generating an optical excitation signal; and a spectrometer for detecting spectra of optical energy emitted from the optical waveguide. The waveguide facilitates multiple SERS responses resulting from interactions between the optical excitation signal and an analyte of interest that may be present on the surface of the self-assembled monolayer . Thus, the sensor system provides a sensor for detecting organic contaminants with a sensitivity of ppm and even ppb in
161
APPENDIX C: EXPERIMENTAL
C1. Reagents
Cysteamine hyrochloride (CY), dimethylaminoethanethiol hydrochloride (DMA), diethylaminoethanethiol hydrochloride (DEA), L-cysteine hydrochloride (CYS), L-cysteine methyl ester hydrochloride (CYSM), L-cysteine ethyl ester hydrochloride (CYSE), and 2-amino-4-trifluoromethyl benzenethiol hydrochloride (ATB) (Aldrich) were used as received. 4-(2-mercaptoethyl) pyridinium (MEP) hydrochloride (Toronto Research Chemicals) and 2-mercapto-4-methylpyrimidine (MMP) hydrochloride (Avocado Research Chemicals) were used as received. Sodium nitrate (Johnson Matthey), sodium sulfate (Aldrich), sodium chloride (Aldrich), sodium dihydrogen phosphate (Baker), sodium perchlorate (Aldrich), sodium dichromate (Aldrich), sodium chromate (Aldrich), and sodium cyanide (Aldrich) were used as received. Aqueous solutions were prepared using deionized water. The pH of the solutions is 5.0. Ethanol (Aldrich, HPLC grade) was refluxed over magnesium turnings and iodine for three days after which time the solvent was fractionally distilled and the middle third fraction was collected.
C2. Detection of Toxic Anions Using Cationic-Coated SERS Substrates C2.1 Preparation of SERS Substrates
An insulated copper wire was soldered to a 1 cm length of 2 mm diameter silver or gold wire (99.9%, Aldrich). The silver/gold wire was potted inside a 5 mm outer diameter glass tube with a chemically resistant epoxy (Epoxy Patch 1C, Hysol). Prior to use, the silver/gold disk of the electrode was electrochemically roughened. With the use of a PAR 173 potentiostat under computer control, the silver/gold electrode was roughened in a 0.1 M KCl solution by applying 25 successive oxidation-reduction cycles (ORCs) from -300 to 1200 mV vs. the calomel reference electrode at a sweep rate of 500 mV s-1. For each scan, the potential was held for 1.3 s at the positive limit and 30 s at the negative limit. After electrochemical roughening, the electrode was rinsed with water (HPLC grade, Aldrich) and then ethanol (HPLC grade, Aldrich). The electrode was immersed in a dilute thiol solution in ethanol and allowed to react for approximately 24 h to form a self-assembled monolayer (SAM). Before use, the substrates were thoroughly rinsed with ethanol and stored in water between uses.
C2.2 Normal Raman Spectroscopy (NRS)
Normal Raman spectra were collected in rigidly held quartz cuvettes. Raman measurements were made using either the Detection Limit Raman Solution 785 spectrometer system or the Chromex Raman One imaging spectrograph system. The Raman Solution 785 system has a fiber-optic mini-Raman probe (InPhotonics). The excitation and collection fibers of the mini-probe are low OH silica/silica clad and are 90 and 200 µm in diameter, respectively. The mini probe houses the appropriate filters to remove the interferences due to Raman emissions in the optical fibers. The excitation source is a tunable CW laser diode (Spectra Diode Laser, SDL-8630) operating at 785 nm. A tunable optical isolator (Optics for Research, Model IO-7-NIR) is used to prevent backscatter of the laser beam into the laser cavity. The 785 nm line is focused into the
162
excitation fiber of the fiber-optic mini-Raman probe using a 5X microscope objective lens. The spectrograph is in a Czerny-Turner configuration. The spectrograph has an f number of 2, a fixed position 1200 grooves/mm grating (spectral range 350-1600 cm-1), and a TE cooled Kodak 0400 CCD (768 x 512 pixels, Tmin= - 4 °C ). Data collection and operation are controlled by a 133 MHz Pentium-based lap-top computer.
The Chromex Raman One imaging spectrograph has a 250 mm focal length and the optical components of the spectrograph are arranged in a Czerny-Turner configuration. The detector is a Princeton Instruments thermoelectrically cooled charge-coupled device (CCD) with controller (model TE/CCD-1153EM with ST-135). All spectra are obtained with a 100 µm entrance slit, 600 grooves mm-1 grating blazed at 750 nm, and a CCD detector temperature of -52 °C . The excitation source is a tunable CW laser diode (Spectra Diode Laser, SDL-8630) operating at 785 nm. A tunable optical isolator (Optics for Research, Model IO-7-NIR) is used to prevent backscatter of the laser beam into the laser cavity. A fiber optic sampling probe operating at 785 nm (InPhotonics, Model RPS785-12-10) is used to deliver the laser excitation to the sample and transfer the Raman emissions to the spectrometer. The excitation line is focused into the silica/silica clad, 90 µm diameter excitation fiber using a 5X microscope objective lens. To match the f numbers of the collection fiber (f = 2.2) to that of the spectrometer (f = 4), an input coupler (Detection Limits, model SIC-1000-Chromex) is used. A holographic notch filter (Kaiser Optical Systems) inside the spectrometer is used to reject the Rayleigh line.
C2.3 SERS Measurements
Figure C-1a shows a schematic diagram of the flow-through cell used to evaluate the concentration response of cationic-coated, SERS substrates to perchlorate, dichromate, chromate, and cyanide. The body of the flow-through cell is constructed of Teflon®. A 25 mm diameter, 2 mm thick sapphire disk was used as the optically transparent window. A Kel-F window retainer holds the window in place. An O-ring provides a leak-tight seal between the window and the cell body. While a Teflon® bushing holds the SERS substrate in place, another O-ring provides a leak-tight seal around the glass tube of the electrode. The inlet and outlet consist of 20 gauge stainless steel tubing that has been epoxied in place with a chemically resistant epoxy (Epoxy Patch 1C, Hysol). Besides being constructed of chemically resistant materials, the cell has a low sample volume (~0.5 mL). SERS spectra of the surface of the working electrode were obtained either using the Raman Solution 785 (Detection Limit, Inc.) system or the Chromex Raman One system described above. The experimental configuration is shown in Figure C-1b.
C2.4 Manipulation of Spectral Data
In these experiments, anion peak area is plotted as a function of anion solution concentration. To obtain the area of the anion peak, the spectra contributions of the thiol coating are subtracted out. All manipulations of the spectral data were done using Spectra Calc (Galactic Industries, Inc.), a software package that can be used to subtract spectra interactively as well as integrate peak areas. Figure C-2 shows SERS spectra of Ag/CYSE in the presence and absence of nitrate as well as the difference spectrum. Although the nitrate peak overlaps significantly with the broad CYSE peak at 1012 cm-1,
163
subtraction of the spectral contributions of CYSE leaves only the nitrate peak, the area of which can easily be determined.
Figure C-1. (A) Schematic of the flow-through cell used to obtain SERS spectra of cationic-coated, silver substrates. (B) The experimental lab configuration showing placement of the
side viewing fiber optic probe, cell, and xyz translational stage.
164
Figure C-2. The top two spectra are SERS spectra of Ag/CYSE obtained in the presence and absence of 1000 ppm nitrate. Solution pH is 5.0. Spectra were obtained using 852 nm
excitation (laser power at the sample is 50 mW) and 15 s acquisition times. The bottom spectrum is the difference of the top two spectra. The peak at 660 cm-1 is due to the C-S
stretching mode of CYSE.
C3. Molecular Modeling to Evaluate Selectivities Literature searches identified potential ionophores specific for perchlorate, chromate, dichromate, and cyanide. To understand the interactions between the anion and the ionophore, molecular orbital calculations were done using Titan. Titan is the result of a collaboration between Wavefunction, maker of Spartan, and Schrödinger, maker of Jaguar. It combines the full computational speed and power of the latter with the flexibility and ease of the former. Titan provides a full range of modern calculation methods, from molecular mechanics, to semi-empirical and Hartree-Fock molecular orbital, to density function and LMP2. All are integrated into Titan’s graphical user interface. Table C-1 summarizes the methods available and capabilities of Titan.
Although Titan is a very powerful modeling tool, as structures become more complex, the computation times significantly increase. As a result, molecular modeling of the MEP self assembled monolayer (SAM) on a gold surface was done using Alchemy III, a molecular modeling software package from IBM. This modeling was done only after analyzing the spectral data and after modeling the CrO4
= · MEP-Au interaction using Titan. Within Alchemy, a graphical form of Dreiding model construction allows accurate and flexible manipulation of structure. Previously, Alchemy III was used to obtain a better understanding of the observed selectivities of the cationic coatings for nitrate and sulfate (Mosier-Boss and Lieberman, 2000). In this investigation, the purpose of the modeling was to determine the effect of adjoining MEP molecules on the complexation with chromate. The first step requires “building” the molecule. The molecule is comprised of a linear chain of gold atoms onto which MEP units are attached through the sulfur atom. The spacing between the MEP units is on the order of 5.8Å. Then chromate is bonded to the pyridine moiety of a MEP unit. Once the molecule is built, the Alchemy
-10000
10000
30000
50000
70000
Ram
an in
tens
ity
500 700 900 1100 1300 1500
wavenumber (cm-1)
NO3-
660
165
minimizer performs a conjugate gradient minimization on a force field equation which is dependent on the positions of the atoms of a selected molecule. The potential energy of the molecule is the sum of the following terms: E = Estr + Eang + Etor + Evdw + Eoop + Eele where all E's represent the energy values corresponding to the given types of interactions. The subscripts denote bond stretching (str), angle bending (ang), torsion deformation (tor), van der Waals interaction (vdw), out of plane bending (oop), and electrostatic interactions (ele). Within the minimizer, the molecular coordinates are modified to obtain reasonable, low energy, molecular geometries. Once minimized, the molecule can be depicted as a spacefilling model in which each atom is represented by a sphere of radius equal to its van der Waals radius.
Table C-1. Summary of Titan’s Capabilities. METHODS • SYBYL and MMFF94 molecular mechanics • MNDO, MNDO/d. AM1, and PM3 semi-empirical molecular orbital including PM3
parameters for transition metals • Pseudospectral implementations of Hartree-Fock molecular orbital, local (SVWN),
non- local (BP and BLYP), and hybrid (B3LYP) density functional and local MP2 (LMP2)
• Gaussian basis sets including STO-3G, 3-21g, 6-31G*, 6-311G *, cc-pVDZ, and cc-pVTZ all electron basis sets with extensions for further polarization and/or diffuse functions
• Pseudopotential basis sets including LAV3P, LACVP, and LACV3P with extensions for polarization and/or diffuse functions
TASKS • Calculate reaction and activation energies • Determine equilibrium geometries • Determine transition-state geometries • Calculate vibrational frequencies • Identify lowest-energy conformers • Establish conformer distributions • Align molecules • Scan geometrical coordinates and generate reaction sequences CALCULATED PROPERTIES • Mulliken, electrostatic- fit and natural-bond-orbital (NBO) charges • Dipole moments • Enthalpies, entropies, and free energies • Aqueous solvation energies by Cramer/Truhlar SM5.4 model C4. Optimization of Electrochemical Etching Parameters
The working electrode consisted of a 5 mm x 5 mm square of silver foil (Aldrich, 0.5 mm thick). The surface was mechanically polished with 1.0 and 0.3 µm alumina. The silver electrode was rinsed and placed in an electrochemical cell with a Pt counter electrode and saturated calomel reference electrode (SCE). The silver working electrode
166
was electrochemically roughened in 0.1 M KCl by employing a PAR 173 potentiostat under computer control. Earlier Leung, Gosztola, and Weaver (1987) showed that relatively optimal SERS intensities for Ag were obtained by applying five successive ORCs from –600 to 150 mV vs. the SCE at a sweep rate of 500 mV s-1. For each scan, the potential was held at 1.3 s at the positive limit and 30 s at the negative limit. These parameters will be the starting point in the optimization process. After electrochemical roughening, the SERS substrate was rinsed with water and then ethanol. The substrate was then immersed in a dilute solution of p-thiocresol in ethanol and allowed to react for approximately 24 h to form a SAM. Before use, the substrates were thoroughly rinsed with ethanol and stored in water between uses. The number of ORCs and the oxidative/reductive potentials were varied and the effect on the SERS response measured. C5. References 1987 L.-W. H. Leung, D. Gosztola, and M.J. Weaver. “Surface-Enhanced Raman
Scattering from Gold Electrodes Modified by Underpotential-Deposited Silver and Copper Monolayers: Spectral and Double-Layer Comparisons with Silver and Copper Electrodes”, Langmuir, Vol. 3, p. 45-52.
2000 P.A. Mosier-Boss and S.H. Lieberman. “Detection of Nitrate and Sulfate by
Normal Raman Spectroscopy and SERS of Cationic-Coated, Silver Substrates”, Appl. Spectrosc., Vol. 54, p. 1126-1135.