Western Michigan University Western Michigan University ScholarWorks at WMU ScholarWorks at WMU Dissertations Graduate College 8-2010 Development of a Task Assignment Tool to Customize Job Development of a Task Assignment Tool to Customize Job Descriptions and Close Person-Job Fit Gaps Descriptions and Close Person-Job Fit Gaps Bryan W. Booker Western Michigan University Follow this and additional works at: https://scholarworks.wmich.edu/dissertations Part of the Industrial Engineering Commons, and the Manufacturing Commons Recommended Citation Recommended Citation Booker, Bryan W., "Development of a Task Assignment Tool to Customize Job Descriptions and Close Person-Job Fit Gaps" (2010). Dissertations. 93. https://scholarworks.wmich.edu/dissertations/93 This Dissertation-Open Access is brought to you for free and open access by the Graduate College at ScholarWorks at WMU. It has been accepted for inclusion in Dissertations by an authorized administrator of ScholarWorks at WMU. For more information, please contact [email protected].
Transcript
Western Michigan University Western Michigan University
ScholarWorks at WMU ScholarWorks at WMU
Dissertations Graduate College
8-2010
Development of a Task Assignment Tool to Customize Job Development of a Task Assignment Tool to Customize Job
Descriptions and Close Person-Job Fit Gaps Descriptions and Close Person-Job Fit Gaps
Bryan W. Booker Western Michigan University
Follow this and additional works at: https://scholarworks.wmich.edu/dissertations
Part of the Industrial Engineering Commons, and the Manufacturing Commons
Recommended Citation Recommended Citation Booker, Bryan W., "Development of a Task Assignment Tool to Customize Job Descriptions and Close Person-Job Fit Gaps" (2010). Dissertations. 93. https://scholarworks.wmich.edu/dissertations/93
This Dissertation-Open Access is brought to you for free and open access by the Graduate College at ScholarWorks at WMU. It has been accepted for inclusion in Dissertations by an authorized administrator of ScholarWorks at WMU. For more information, please contact [email protected].
DEVELOPMENT OF A TASK ASSIGNMENT TOOL TO CUSTOMIZE JOB DESCRIPTIONS AND CLOSE PERSON-JOB FIT GAPS
Bryan Walter Booker, Ph.D.
Western Michigan University, 2010
Does the knowledge worker fit the job or should the job fit the knowledge
worker? This research developed a methodology and a tool to customize a knowledge
worker’s job design to better fit their knowledge, skills, abilities and characteristics. The
research outcomes support the customization of the job design to improve person-job fit,
the documentation of the customized job design as a position description, and the use of a
structured person-task assignment process. The recommended task assignment process
includes a job aid that uses multivariate equations to predict expected task performance.
Data were collected from two knowledge worker sub-groups: lean leaders and youth
leaders. The data were used to evaluate the hypotheses and to develop and test the
person-task assignment tool.
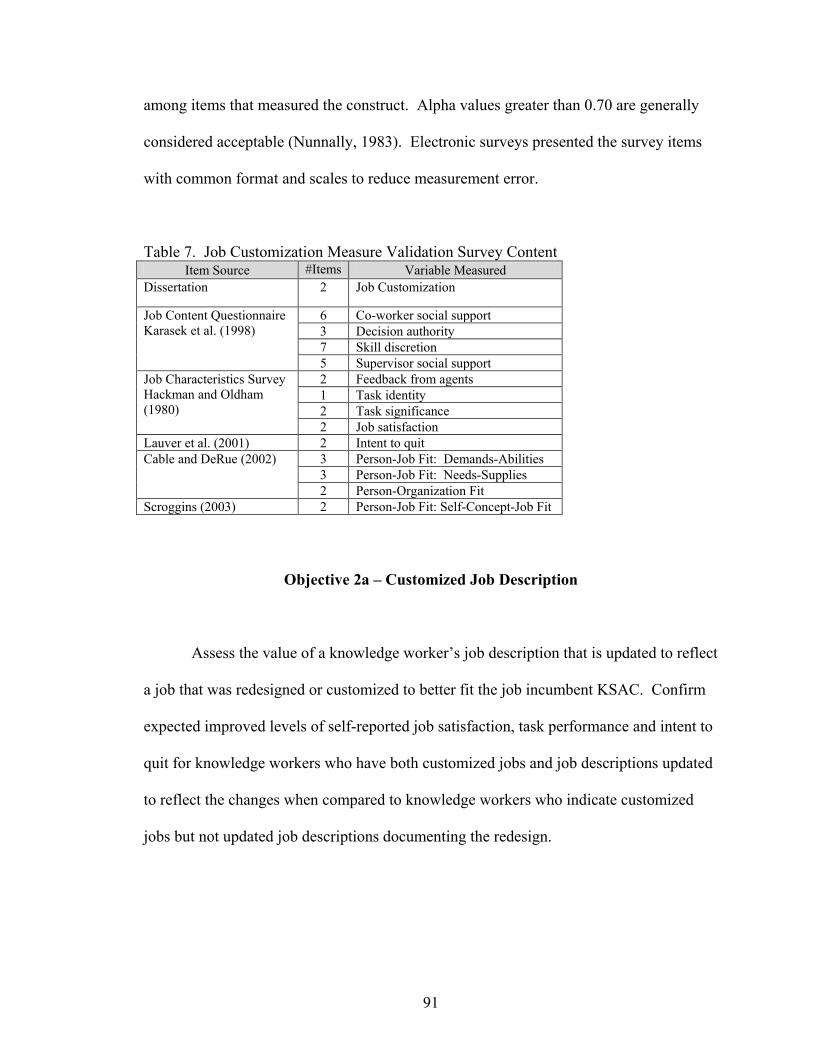
A valid and reliable measure of the level of job customization was developed and
tested. The measure demonstrated significant correlations with measures of person-job
fit and the job outcomes of task performance, job satisfaction and intent to quit. A
method for developing a tool to predict expected task performance for a task assignment
decision was developed and tested. The method reduced twenty-four person-task fit and
preference variables to ten predictive variables for problem solving, project and routine
task performance. The research also investigated the effect of the incumbent’s preferred
behavior style on ratings of person-job fit and the occurrence of job customization.
DEVELOPMENT OF A TASK ASSIGNMENT TOOL TO CUSTOMIZE JOB DESCRIPTIONS AND CLOSE PERSON-JOB FIT GAPS
by
Bryan Walter Booker
A Dissertation Submitted to the
Faculty of The Graduate College in partial fulfillment of the
requirements for the Degree of Doctor of Philosophy
Department of Industrial and Manufacturing Engineering Advisor: Larry Mallak, Ph.D.
Western Michigan University Kalamazoo, Michigan
August 2010
UMI Number: 3424854
All rights reserved
INFORMATION TO ALL USERS The quality of this reproduction is dependent upon the quality of the copy submitted.
In the unlikely event that the author did not send a complete manuscript
and there are missing pages, these will be noted. Also, if material had to be removed, a note will indicate the deletion.
UMI 3424854
Copyright 2010 by ProQuest LLC. All rights reserved. This edition of the work is protected against
unauthorized copying under Title 17, United States Code.
ProQuest LLC 789 East Eisenhower Parkway
P.O. Box 1346 Ann Arbor, MI 48106-1346
Copyright by Bryan Walter Booker
2010
ii
ACKNOWLEDGMENTS
I am thankful for all of the people who either supported or contributed to this
research. Dr. Mallak served as my Dissertation Chairman, mentor and advisor through
the dissertation process. Dr. Mallak not only guided me through the process but also
encouraged me along the way and for that I am grateful.
I am also grateful for Dr. Naranjo who both served on my dissertation committee
and helped me with the statistical analysis of my data and model. I am also thankful for
the time and support from Dr. Lyth, Dr. Aller, and Dr. Fredericks who served as members
of my dissertation committee.
The data collection process was a significant effort and I am thankful for all of the
people who helped coordinate the data collection and most importantly those who
participated. Dr. Elizabeth Cudney offered me an opportunity to present my research at
the 2009 Operations Excellence conference and at the annual 2010 IERC conference.
Terry Carty from the Youthworker Movement was very helpful in developing the contacts
that enabled the youth leader data collection.
Most importantly I wish to thank the love of my life and wife, Linda. She
supported me through the Ph.D. process, encouraged me when I really needed it, and
helped with the data collection process.
Bryan Walter Booker
iii
TABLE OF CONTENTS ACKNOWLEDGMENTS ...................................................................................... ii LIST OF TABLES .................................................................................................. x LIST OF FIGURES ................................................................................................ xiii LIST OF EQUATIONS .......................................................................................... xiv CHAPTER I. INTRODUCTION
Introduction to the Problem ............................................................... 1 Person-Job Fit Gaps ........................................................................... 6 Statement of the Problem and Study Purpose .................................... 10 Expected Results ................................................................................ 13 Definition of Terms............................................................................ 14 Organization of the Remainder of the Study ..................................... 20
37. Regression Job Customization and Person-Job Fit Measures........................ 155
38. Job Customization and Person-Job Fit Correlation Matrix ............................ 156
xii
List of Tables-Continued 39. Job Customization and Person-Job Fit Rank Order Correlation ................... 156 40. Regression: Job Customization and Outcome Measures .............................. 158
41. Custom Job and Outcome Criterion Correlation Matrix ................................ 159
42. Custom Job and Outcome Criterion Rank Order Correlation Matrix ............ 159
18. Job Customization Model .............................................................................. 181
19. Task Assignment Process Aided with the Task Assignment Tool ................ 182
xiv
LIST OF EQUATIONS
1. Assignment Priority Index ............................................................................. 98
2. Assignment Priority Index Model .................................................................. 170
3. Assignment Priority Index Tested ................................................................. 171
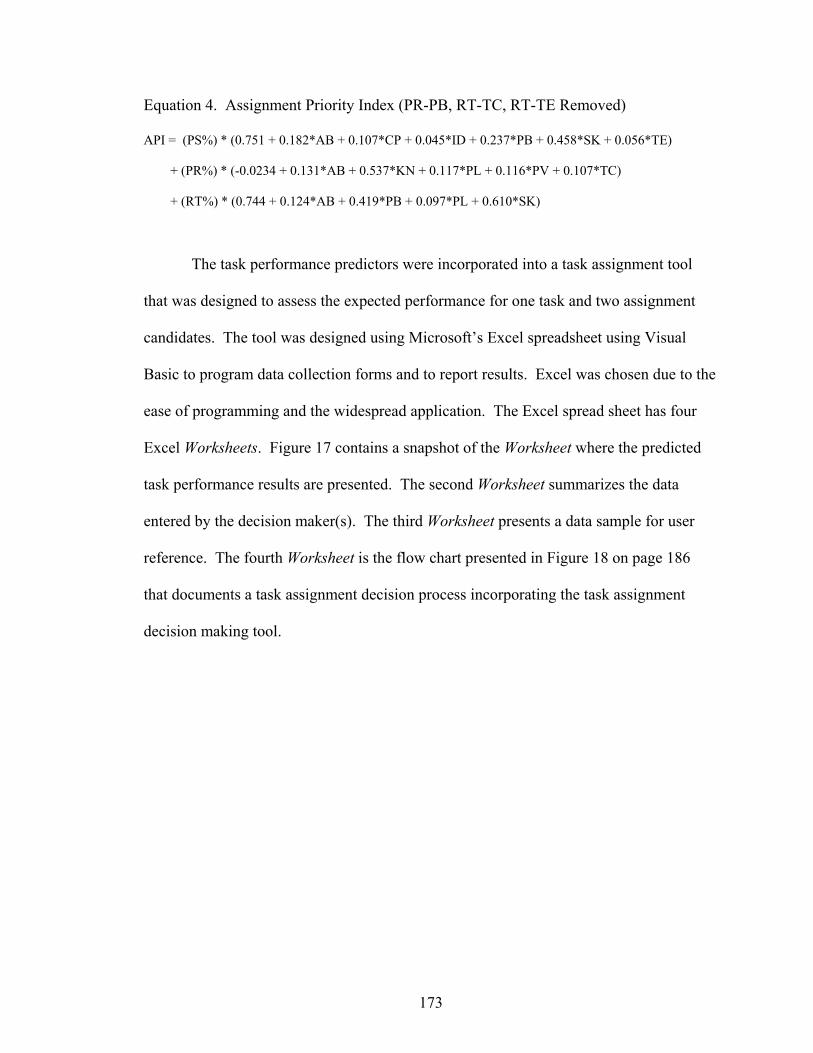
4. Assignment Priority Index (PR-PB, RT-C, RT-TE Removed)...................... 173
1
CHAPTER I
INTRODUCTION
Introduction to the Problem
Peter Drucker (1999) described knowledge worker productivity as the biggest of
the 21st-century management challenges. “In the developed countries, it is their first
survival requirement. In no other way can the developed countries hope to maintain
themselves, let alone maintain their leadership and their standards of living” (p. 92). A
short-term focus prevents some managers from focusing on knowledge worker
improvement.
It’s clear that the managers of knowledge work have a responsibility to optimize work processes, workplace design and technology. Unfortunately, as we’ve been told in numerous companies, line managers often can’t find the time, the resources or the incentive to attend to the issue, because they are expected to focus on current performance (Davenport, Thomas, & Cantrell, 2002, p. 25).
Industrial engineers are knowledge workers who are frequently assigned to the
role of lean leader or coordinator. Forty-five percent of the lean leaders who participated
in this study received education with post secondary degrees in a discipline that they
characterized as industrial engineering. Job growth and demand for industrial engineers
is expected to outpace average job growth through 2016. The U.S. Department of Labor
Bureau of Labor Statistics Occupational Outlook Handbook (2008) reported the actual
2006 USA labor market to be 150,620,175 jobs with a projection of 10.4 percent job
growth by 2016. The industrial engineer occupational code of 17-2112 includes a portion
of the jobs with a title similar to the lean leader and is a source for lean leader job
candidates. Industrial engineer job growth is expected to be 20.3 percent from 201,311
2
jobs in 2006 to 242,263 jobs in 2016. The overall growth for engineering jobs is
expected to be 10.6 percent which is close to the national average job growth rate. The
lean leader job description often includes a wide variety of responsibilities and tasks that
the industrial engineer may not be prepared to fulfill. The industrial engineer may not
have the motivation, knowledge, skills, abilities, preferred behaviors, work experiences
or delegation experience necessary for fulfilling the lean leader job description.
This is a paradox given that job descriptions are normally specific to a group of
jobs. Groups of jobs frequently have similar responsibilities, similar requirements and a
common set of assigned tasks that are infrequently changed. However, job candidate or
incumbent capabilities and motivation vary both between individuals and within
individuals over time. This is especially true for knowledge worker jobs designed with a
large variety of non-routine tasks. This study focused on the process of customizing the
job design to improve person-job fit through the development of a methodology and
resultant tool. Evidence was collected to support the expected relationships between job
customization, person-job fit, job satisfaction, and intent to quit.
The research objectives were developed following the author’s participation in
lean leader and youth leader job redesign processes. One particular youth leader job
redesign process had a goal to improve person-job fit and to ultimately improve the
knowledge worker’s task performance and job satisfaction. The initial unsuccessful
performance improvement process included: task clarification, measurement, goal
setting, coaching, performance feedback, and performance reevaluation. A subsequent
process was initiated to redesign the job to better fit the incumbent’s knowledge, skills,
abilities and characteristics. The redesigned job included task reassignment, changes in
3
assigned tasks, and changes in related management processes. The author identified
similarities between personal job redesign experiences with lean leaders and youth
leaders. The similarities suggested that the redesign process may be generalized and
applied to a common class of knowledge worker jobs. These jobs may be generalized
and classified as knowledge workers with a variety of non-routine tasks.
The observed job redesign process included the identification of outcome
expectations or customer requirements. A listing of the necessary responsibilities,
competencies and tasks for fulfilling the requirements was developed. The incumbent’s
job performance was compared to expectations and assessed. The incumbent’s preferred
behaviors, knowledge, skills, abilities and characteristics (KSAC) were assessed through
a process that was facilitated by a subject matter expert from an external organization.
The process included performance assessment, interviews, and the administering of a
preferred behavior assessment testing instrument. The job was redesigned to better fit the
KSACs of the incumbent through a participative process with the job incumbent,
management and an outside facilitator. The job redesign was successful; however, it did
not address all of the person-environment fit factors that may affect the outcomes of job
satisfaction, task performance and intent to quit. Other person-environment factors that
affect person-environment fit include but are not limited to person-organization fit,
person-vocation fit, person-supervisor fit and person-group fit.
Person-environment fit has been conceptualized as to the degree that a person’s needs are satisfied by the job or the degree that the job demands match the person’s ability. Fit has been operationalized using a variety of content dimensions including skills, needs, preferences, values, personality traits, goals and attitudes (Kristof-Brown, Zimmerman, & Johnson, 2005a, p. 282).
4
Ideal person-job fit will occur when both demands-abilities fit and needs-supplies
fit are high. Quadrant 2 in Figure 1 indicates this ideal or person-job fit target. “Both
needs-supplies fit and demands-abilities fit are complementary, such that the combination
of persona and situation ‘make whole’ or add to it what the other is missing” (Cable &
DeRue, 2002, p. 879). A third dimension of self-concept-job fit was demonstrated to add
incremental validity to predictions of meaningful work (Scroggins, 2003).
Low
1 2
Low 3 4
Pers
on N
eeds
Sup
plie
d by
Job
Hig
h
Job Demands fit Person AbilitiesHigh
All Person Needs Supplied by Job
Pers
on F
its a
ll Jo
b D
eman
ds
Source: Adapted from (Kristof-Brown et al., 2005a) Figure 1. P-J Fit Conceptualized as Demands-Abilities and Needs-Supplies
Knowledge worker job designs and task assignments are interdependent parts of
an organization’s systems. However, efforts to improve knowledge worker productivity
must consider the need to balance the process design and flexibility to adapt to the ever
changing needs of the workplace.
No one has all the answers on how to improve knowledge work, but managers shouldn’t feel paralyzed. They are correct not to attempt to engineer or program knowledge work, but that doesn’t mean such work lacks structure, cyclicality or leverage points for change. The keys are to maintain balance between process and practice, to treat workers doing different kinds of work in appropriate ways,
5
and to focus on more than simply hiring better knowledge workers (Davenport et al.,2002, p. 30).
Riss, Rickayzen, Maus, and van der Aalst (2005) studied a process for integrating
knowledge workers into an engineering change request process. Their research
confirmed the need to allow the flexibility of process execution to take account of
knowledge worker’s characteristics and to ensure required flexibility. This need was
balanced with the need to identify and apply process patterns, to evolve organizational
processes and to support knowledge workers in applying best practices.
Morgeson and Humphrey (2008) developed an integrated conceptualization of a
work design model that incorporated known work design factors. Their model included
task, social, and contextual characteristics applied to individual jobs and teams. They
presented the need for further research regarding work design. Humphrey, Nahrgang and
Morgeson (2007) preformed a meta-analytic summary of work design literature and
confirmed how work design can influence a host of attitudinal, behavioral, cognitive,
well-being, and organizational outcomes.
The work redesign literature has typically ignored the characteristics workers must possess to perform the roles implied by the work characteristics … research in other domains suggest that a range of knowledge, skills, abilities and other characteristics (KSAOs) are needed (Morgeson et al., 2008, p. 20).
Moregeson et al.(2008) described the importance of matching individual abilities
to the job. Although the match has not been systematically addressed there is sufficient
theory to suggest that the match is critical. “This would seem to be a potentially fruitful
6
area for research given the importance of work, design and the relative lack of attention
to issues of fit in the work design literature” (Morgeson et al., 2008).
It is imperative that organizations assign knowledge workers to tasks where they
are capable and motivated to perform with excellence. There are barriers that prevent job
redesign and the modification of job descriptions to improve organization and process
effectiveness. This study assessed the potential benefits offsetting these barriers in terms
of person-job fit job satisfaction, task performance, and reduced intent to quit. A process
for building a task assignment tool was developed to aid the manager with person-task
assignment decisions designed to optimize person-task fit.
Person-Job Fit Gaps
Person-job fit gaps may be expected to be closed by the jobholder over time.
However, the job incumbent may perceive some of the required tasks as unrewarding or
unfulfilling resulting in a low level of motivation or job satisfaction. These unwanted
responsibilities or tasks may drain the jobholder’s theoretical energy reserves and be
prioritized lower than favored tasks. If these undesirable tasks are performed then they
may not be executed with the effort and skill expended on preferred tasks. If a reduction
in job effectiveness results then the manager or supervisor is responsible to close the gap
in order to achieve organization objectives.
Gap Identification
The supervisor may identify the job design versus job-holder characteristic gaps
during the recruiting process, the jobholder’s first days on the job, periodic performance
7
reviews, or through ongoing job-holder self-assessment. The jobholder gaps can be
identified and assessed by the job’s process customers, incumbent, supervisor, or work
group. The gaps may be compensated for in the short term by other incumbent abilities
which may be an inefficient or ineffective long-term solution.
The supervisor may plan to close the identified gaps by reassigning work
responsibilities/tasks, changing the work to be accomplished, changing how work is
accomplished, setting expectations for the jobholder to close the performance gaps, or by
asking their work group to identify gaps and propose reassignment options. The
jobholder or incumbent will frequently have non-transferable knowledge, skills, abilities
or characteristics (KSAC) that are, by definition, not required for or applied to the job
design. These non-transferable KSACs should be considered in the task reallocation.
Figure 2 contains a supervisor’s work reallocation options.
Performance Gap Closure Options and Description
Same Keep expectations the same and expect the job-holder to change or adapt.
Delegate Delegate the job responsibilities to another who holds the same job
description.
Rewrite Rewrite another job description to include new responsibilities or broaden
the responsibility scope to include transferred responsibility without
specifically identifying them.
Reassign Keep the same job descriptions, retain the responsibility as the supervisor
and reassign tasks to other employees.
New Job Create a new job description to complete the unfulfilled tasks. This
additional job description may be assigned to a new or existing person.
Source: (Grant, 1989) Figure 2. Performance Gap Closure Options
8
Best Person Fit
There is a theoretical best fit between the characteristics of the people in a work
group and their environment. Environmental fit may be further defined as five primary
types of person fit: group, job, organization, supervisor, and vocation. Person-job and
person-organization fit are the most studied types of fit (Kristof-Brown et al., 2005a).
Reassignment
Methods for reassigning tasks must consider relevant independent person-job
attributes if the reassignment goal is to optimize the effectiveness of job design through
task assignment decisions. The initial task reassignment cycle for a work group may
require ten percent of a person year and one month duration to complete. See Appendix
O for a task assessment and reassignment process time estimate.
Reassignment Benefits and Costs
There are short and long term costs and benefits associated with a task assignment
process as summarized in Figure 3. The reassigned task performers will go through a
learning process and initially perform transferred tasks at a lower rate of productivity
until they progress along the learning curve. The task reassignment process requires a
task analysis stage that may initiate task redesign and implementation activities that may
last beyond the task reassignment process.
Task reassignments will require more support and direction from management
during the task transfer phase. The task reassignment process is expected to have a short-
term cost and long term improvements in productivity, quality, job satisfaction and
9
employee turnover. It should improve the worker’s capability to be assigned to new
tasks. The process may also consider a variety of independent variables when making the
assignment decisions to optimize the expected benefits of the reassignments. A myopic
task and person assessment preceding a qualitative reassignment process may not achieve
intended benefits.
Time Frame + Benefits - Costs Long Term Intent to Quit
Job Satisfaction Task Effectiveness Work Group Productivity Worker Skills & Capability
Sustain Job Design Process Unaddressed Poor Person-
Vocation or Organization Fits
Short Term Task Assignment Flexibility Task Design Improvement
Change Opportunity Cost Labor to Train Manage Change Process Change
Needs-Supplies Fit: The degree that worker’s needs are met by the workplace
environment because they are similar. This fit may also be defined as supplementary fit
(Kristof-Brown et al., 2005a).
Non-Routine Work: Job characterized by a large number of non-repeating tasks that
cannot be broken down into elements that can easily be taught (Liker & Meier, 2007).
Person-Environment Fit: The compatibility between an individual and a work
environment that occurs when their characteristics are well matched (Kristof-Brown et
al., 2005a).
Person-Job Fit: The match between the abilities of a person and the demands of a job or
the needs/desires of a person and what is provided by the job (Edwards, 1991).
Person-Organization Fit: “The compatibility between people and organizations that
occurs when at least one entity provides what the other needs, they share similar
fundamental characteristics, or both” (Kristof, 1996, pp. 4-5).
18
Perceived Fit: An individual’s direct assessment of their fit to the environment (See
Subjective Fit)
Position Description: Describes specific job tasks and responsibilities in more detail than
the corresponding Job Description (Grant, 1989).
Position Specification: See Job Specification
Promotability: The likelihood of a jobholder to be promoted to jobs at a higher grade
level (Smart, 1999).
Responsibilities: Obligations to perform certain tasks and assume certain duties (Byars,
2006).
Self-Concept-Job Fit: The degree that job tasks match the individual’s self-concept. If
there is a good fit then the individual will experience work as meaningful (Scroggins,
2003, p. 2).
Skills: Specific proficiencies necessary for performing the tasks that make up the job
(Byars, 2006). Proficiency, facility, or dexterity that is acquired or developed through
training or experience (Soukhanov, 1992).
19
Skills Inventory: List of basic employee information including certain characteristics and
skills (Byars, 2006).
Subjective Fit: An individual’s assessment of variables that are indirectly related to
environmental fit. (See Perceived Fit)
Supplementary Fit: Conceptualization of person-job fit where the person and the
environment are similar (Kristof-Brown et al., 2005a, p. 288).
Task: Consists of one or more elements; one of the distinct activities that constitute
logical and necessary steps in the performance of work by an employee. A task is
performed whenever human effort, physical or mental, is exerted for a specific purpose
(Byars, 2006).
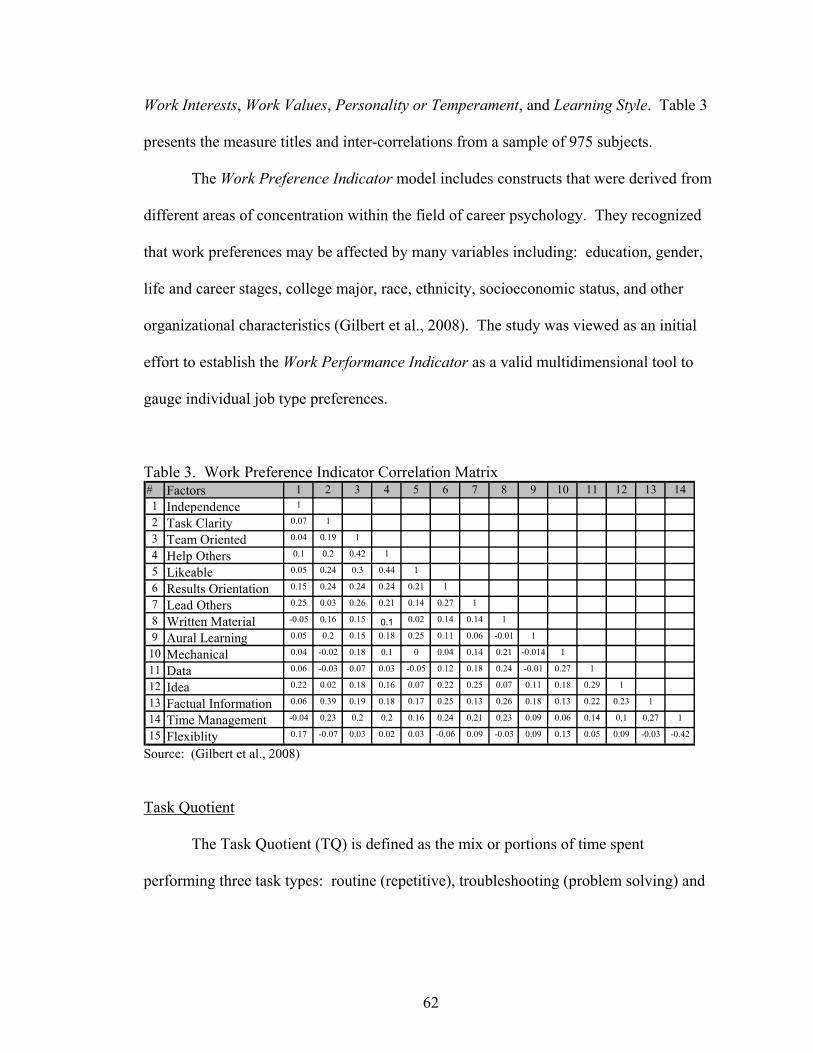
Task Quotient: The Task-Quotient (TQ) is the mix or portions of time spent performing
three task types: routine (repetitive), troubleshooting (problem solving) and project
(planning). In theory as the TQ is aligned closer to the individual's preference, their level
of satisfaction increases (Gazzara,2003).
20
Organization of the Remainder of the Study
Chapter Two contains a review of the literature that identifies key facets and
background relating to job description design, task assignment methods, customization,
and lean leader competencies. The relationship among job competencies, job
descriptions, job specifications, and employee selection is explored. Methods for closing
performance gaps are also explored.
Chapter Three describes the four study objectives. There are two parts of each
objective.
Chapter Four consists of a description of the study methodology that includes the
design of the study, sample and populations, the survey instrument, data collection
procedures, and data analysis procedures.
Chapter Five presents the study results. Results include a descriptive review of
the collected data, differences between the subject groups, demographics, an assessment
of position description value, a validity assessment, a person-environment fit
measurement comparison, and variable correlations. The results chapter also contains an
analysis and interpretation of what was found in the survey data, limitations, conclusions
drawn from the analysis, a recommendation for customizing job descriptions as position
descriptions, summary, contributions, implications, and suggestions for further research.
21
CHAPTER II
LITERATURE REVIEW
Overview
Job design is the umbrella topic under which job customization falls. Job design
is an approach to structuring jobs to optimize organizational outcomes. Individual
outcomes include satisfaction, motivation, and personal growth (Griffin & McMahan,
1994).
Job motivation and task performance are two closely linked outcomes of job
design. Griffin and McMahan (1994) described job motivation as one of the most
common outcome variables studied in relation to jobs. Studies that do not explicitly
include motivation often consider other variables related to motivation such as
contextual performance, satisfaction, effort, and absenteeism. Motivation and job
satisfaction are closely linked as described by Griffin and McMahan (1994).
The goal of some approaches has been to learn how to design jobs so as to improve motivation. In other instances, the presumed relationship has been more indirect and the focus has been on improving related phenomena such as job satisfaction or organizational commitment. The basic thrust of most job design theory and research has rested on the premise that job design and motivation are linked. The implicit belief that has guided this work has been that the design of jobs can be altered so as to motivate job incumbents to work harder, do higher quality work, do more work, and be more satisfied as a result of having worked (Griffin & McMahan, 1994, p. 24).
22
Job description customization is discussed in literature using the following terms:
o Adaptation (Miner, 1990).
o Carving (Griffin, 2002).
o Crafting: Physical and cognitive changes individuals make in the task or relational boundaries of their work (Wrzesniewski & Dutton, 2001).
o Idiosyncratic jobs - Jobs created around specific people (Miner, 1990).
o Job diffusion – Imitation of new jobs by other departments (Miner, 1990).
o Ecology of jobs (Miner, 1990).
This literature review focuses on the relationships between job design
customization, person-environment fit, preferred behavior, job documentation and the
outcomes of job satisfaction, task performance and intent to quit. The study of these
relationships with job design customization was not found in the literature review. Job
customization is operationalized as the change of task, roles, or responsibility
assignments to better fit the job incumbent’s knowledge, skills, abilities or characteristics.
Job Design Customization Model
A job customization model was developed based on the literature review. The
model is depicted as an influence diagram in Figure 5 where arrows denote an influence.
The model variable categories include: outcome criteria, person-environment fit, job
customization, job description, preferred behavior, and demographics.
23
ORGSIZE
YRS,EXPERI-
ENCE
YRS.IN
JOB
GENDER
EDUC-ATION
Criteria - or -
Outcomes
Person – EnvironmentFit Factors
Objective 3b
Objective 2b
JD Exists
Y1Job
Satisfaction
Y3Intent To
Quit
Y2Task
Performance
X5JOB DESCRIPTION
ACCURACY
JOB DESCRIPTION
REVIEW
X7: Demands-Abilities Fit
X3 P-J Fit
X8: Needs-Supplies Fit
X1JOB DESIGN
CUSTOMIZATION
X6JOB DESCRIPTION CUSTOMIZATION
X2PERSONALITY OR
PREFERRED BEHAVIOR
Objective 1b
CUSTOMIZE JOB DESIGN TO FIT PERSON
Objective2a
Objective 3a
Objective 2b
P-O, P-S& P-G FIT
X9: Self-Concept-Job
Fit
Kristof-Bown & Jansen (2006)Inscape Publishing, I. (2004)
The following variable relationships were previously documented in literature.
The variable definitions are found in Figure 6.
Y1 & Y2
There is a weak relationship between job satisfaction and objective measures of
task performance (Lauver & Kristof-Brown, 2001). However, a meta-analysis surprised
the research team when person-job and person-organization fit had a stronger correlation
than any combination of person-organization, job, supervisor, or group fit (Kristof-Brown
et al., 2005a). Other meta-analytic studies have shown a stronger correlation (Judge &
24
Bono, 2001).
Y1 & Y3 & X3
Intent to quit demonstrated a negative correlation to the following variables in
ascending order: Y1 (-0.68), P-O fit (-0.53), and X3 (-0.31). No significant correlation
was demonstrated with task performance (Lauver & Kristof-Brown, 2001).
Y1 & X1
Satisfaction with the work itself has shown strong correlations to the dimensions
of Hackman and Oldham’s (1980).
X1 & X3
The positive relationship between skills and person-job fit were established by
Edwards (1991).
X1 & Y1 & Y2
Holland (1985), presented the argument that satisfaction and performance are
enhanced when a person selects an occupation that is compatible with his or her traits and
skills.
X2 & Y2
Personality is expected to not have an impact on task performance and experience
because personality variables are more highly correlated with contextual performance
25
than with task performance (Motowidlo & Van Scotter, 1994). Contextual performance
is more closely correlated to person-organization fit.
X2 & X3
Two of this study’s four survey items that measure job-fit are personality,
temperament or preferred behaviors questions: My personality is a good match for this
job and I am the right type of person for this type of work. The relationship between
personality to broad job classifications was established by O’Reilly (1977).
X3 & P-O fit & Y1 & Y2
A meta-analysis of both person-job fit and person-organization fit measured both
perceived overall performance and perceived job satisfaction. A significant correlation
between job satisfaction and both person-job fit and person-organization fit exists but not
for overall performance (Kristof-Brown et al., 2005a). The relationships between
P-J fit and P-O fit and the outcome variables of intent to quit, job satisfaction and task
performance were studied by Lauver and Kristof-Brown (2001).
X3 & Y1
Job satisfaction was more strongly related to person-job fit than the three other
components of person-environment fit which are person-organization, person-supervisor
or person-group fit (Kristof-Brown et al., 2005a).
26
X3 & X7 & X8
Both needs-supplies fit and demands-abilities fit are complementary, such that the
combination of person and situation make whole or add to what the other is missing.
(Cable & DeRue, 2002)
X7 & X8 & X9
Scroggins (2003) showed significant correlations between demands-abilities fit,
needs-supplies fit and self-concept-job fit. Cable and DeRue (2002) showed a strong
correlation between demands-abilities fit and needs-supplies fit.
X7 & X8, X9 & Y1
Job satisfaction is the result of rewards and valued job outcomes received as the
result of good performance and not the result of performance itself (Scroggins, 2003).
Scroggins concluded that needs-supplies fit was strongly related to job satisfaction.
Demands-abilities fit had a low correlation with job satisfaction. Self-concept-job was
highly correlated with job satisfaction but not as high as needs-supplies.
X7 & X8 & X9 & Y2
The Kristof-Brown et al. (2005a) meta analysis showed positive correlations with
measures of overall performance but the results were not significant. The study results
vary greatly based on the method used to assess performance. Scroggins (2007) showed
no correlation between his job performance measure collected from performance ratings
and any measure that he collected.
27
X7 & X8 & X9 & Y3
Cable and Derue (2002) and Scroggins (2003) both showed low correlations
between needs-supplies or demand-abilities fit and continuance of organization
commitment. Scroggins (2003) also showed lower correlations between self-concept-job
fit and continuance of organization commitment. The Kristof-Brown et al. (2005a) meta
analysis showed a negative relationship between needs-supplies fit and intent to quit and
a weak relationship between demands-abilities fit and intent to quit.
Experience & Y2
Experience is more highly correlated with task performance than with contextual
performance (Motowidlo & Van Scotter, 1994).
History
The process of job redesign frequently includes the job descriptions, job analysis,
job specifications, performance gap identifications, and a process for improving the
design. Job descriptions have been seen as constraints that limit the flexibility of an
organization to adapt and change. The development of job descriptions is expected to
provide long term gains and the effort to maintain them may seem unfruitful in a fast-
paced and changing environment.
In the mid-1960s and early 1970s job descriptions were shunned somewhat as people began to see them as primarily a symbol of bureaucracy and essentially a constraint on normal employee growth and development, as well as a factor limiting what management could do in the organization in response to demands for rapid change (Grant, 1989, p. 1).
28
The option of eliminating job descriptions to facilitate accelerated organization
change might be considered valid. Bakke (2005), in his bestseller book titled Joy at
Work, describes how people with boxed-in job descriptions present a significant
organizational problem because they have few opportunities to make decisions. The
referenced organization communicated values included treating employees as full-fledged
adults capable of making sound decisions. He also clearly supported the need to define
job responsibilities, role definition and decision making boundaries for each person or
group. It appears that the referenced organization would benefit from clearly defined and
customized job descriptions designed and maintained to support his organization.
Adam Smith (1776/2007) documented in his book The Wealth of Nations
methods to increase the capacity for making straight pins through the assignment of
small groups of repeated tasks. Frederick Taylor (1911) and Frank Gilbreth
(1911/2008) refined task design and their work has been labeled within the field of
scientific management. Scientific management works on the premise that jobs broken
down into standardized best methods and assigned to specialists improve productivity,
output, predictability and quality. Ideally each worker was assigned a job where their
natural abilities enabled them to be most productive when trained to the best method.
Scientific Management promised to profit the worker, the business stakeholders and
society in general by maximizing output per worker.
Early Approaches to Job Design
In the 1950s and 1960s job rotation and job enlargement were responses to the
negative sides of scientific management. These approaches were later incorporated into
29
the job enrichment model. Herzberg’s (1968) two-factor Hygiene and Motivators
theory of motivation assumed that the job must be designed to provide opportunities for
achievement, recognition, responsibility, advancement and growth to motivate people.
The theory had seven principles for vertical, as opposed to horizontal, job loading. The
theory overview can be found in Appendix H. The seventh principle recommends
assigning specific tasks to allow the worker to be an expert and the fourth recommends
allowing job freedom for defining how they get their work done. “Some employees
have expressed preference for higher pay rather than enriched jobs, and others enjoy
their current patterns of on-the-job socialization and friendships more than they do
increased responsibility and autonomy. Essentially, job enrichment can inhibit a
person’s social life at work” (Luthans, 2005, p. 484).
Job Characteristics Theory
Hackman and Oldham’s (1980) “Job Characteristics Theory” theorized that five
feedback) influence three critical psychological states (experienced meaningfulness of
the work, experienced responsibility for outcomes of the work, and knowledge of the
actual results of work activities). Figure 6 presents the relationships among the key
variables in the Job Characteristics Model.
The three psychological states do not cause workers to be internally motivated, to
perform well, or to experience job satisfaction; however, they do create conditions that
30
reinforce repeated high internal work motivation, high quality work performance, high
satisfaction with the work, and low absenteeism and turnover (Hackman & Oldham,
1980). This study measured the outcomes of job satisfaction, task performance and
intent to quit which are similar to high internal work motivation, high quality work
performance, high satisfaction with the work and low absenteeism and turnover.
Job Characteristics Psychological states Personal & Work Outcomes Skill variety Meaningfulness High motivation Task identity High quality work Task significance High satisfaction with work Autonomy Responsibility for outcomes Low turnover/absenteeism Feedback Knowledge of results Moderated by growth need and knowledge, skills & abilities to do job and contextual satisfaction. Source: Hackman and Oldham (1980)
Figure 6: Job Characteristics Model
Oldham and Hackman (2005) proposed a motivating potential score (MPS) that
used a checklist and equation with five core job dimensions as independent variables. He
later challenged the logic of the equation multipliers but the relationships remain sound
(Oldham & Hackman, 2005). A well-designed job with motivating potential will not
motivate the incumbent to perform if there are KSAC gaps. Hackman and Oldham’s
(1980) Job Characteristics Model uses the Job Diagnostic Survey to measure the
Motivating Potential Score (MPS) of job designs by assessing three psychological states.
A higher MPS score is correlated to higher motivation, work quality, work satisfaction
and lower turnover or absenteeism. However, Hackman and Oldham (1980)
demonstrated that the correlation between high MPS scores and job satisfaction or work
31
effectiveness measures was moderated by the incumbent’s growth need, contextual
satisfaction and the degree that the incumbent’s knowledge and skill matched those
required by the job.
Interdisciplinary Approaches to Job Design
Michael Campion (1988) made the following conclusion “different approaches to
job design influence different outcomes, each approach has costs as well as benefits,
trade-offs may be needed, and both theory and practice must be interdisciplinary in
perspective” (p. 1). Interdisciplinary perspectives of job design include industrial
engineering, industrial psychology, organizational behavior, human factors
engineering, and work physiology. The four distinct approaches include the
motivational, mechanistic, perceptual-motor, and biological approaches. The perceptual
and biological approaches are unrelated to this project.
The interdisciplinary perspective was introduced in concert with the Multi-method
Job Design Questionnaire (MJDQ) measurement instrument (Campion, 1985). The
MJDQ is a self-reported 48-item questionnaire that assesses job elements associated with
each job design approach. Campion, Mumford, Morgeson and Nahrgang (2005)
believed that an interdisciplinary approach is necessary because the approaches have
competing outcomes. An obvious example is efforts to standardize work within lean
operations to improve productivity and quality with the undesirable effects of reduced
autonomy and decision-making authority.
32
Motivational Approach
The motivational approach attempts to design work to increase skill and ability
requirements to improve job satisfaction, motivation, involvement and job performance.
Negative aspects of this approach include difficulty finding the right people, significantly
longer training times and higher compensation requirements (Campion & Berger, 1990).
“Motivating jobs may require such higher levels of involvement and commitment that
employees may be faced with mental overload, stress, fatigue, and lower output quality”
(Griffin & McMahan, 1994, p. 27).
Mechanistic Approach
The mechanistic approach can be characterized as classic industrial engineering
and scientific management. The techniques of time study, motion study, and work
simplification are often applied. The early foundation of this approach was developed
by Taylor (1911) and summarized by Gilbreth and Kent (2008). The early
foundations include the basic ideas and arguments from scientific management and time
and motion study (Campion, 1988). The approach focuses on improving the efficiency
with which jobs can be performed. Jobs that are constructed according to the mechanistic
approach require less training and are less expensive to staff. In essence, the jobs are
simplified and have lower levels of responsibility. With mental demands being lower,
output quality may increase and compensation requirements may be reduced
(Campion, 1988). “The mechanistic approach may carry with it additional costs. These
costs include lower job satisfaction and motivation due to boredom brought on by
repetitive, simple tasks. In addition, health problems may also result from the physical
33
demands associated with repetitive, machine-paced work” (Griffin & McMahan, 1994, p.
28).
Standardized work and effective job instruction methods are core components of
lean manufacturing initiatives. Liker and Meier (2007) confirmed, in their book Toyota
Talent, the importance of job analysis, task breakdown, key point identification and the
effective transfer of knowledge to be key elements of a successful lean transformation.
Lean leaders promote and value job analysis, standardization and instruction. Task
standardization frees up workers to creatively improve tasks and to implement
sustainable changes.
Job-Role Differentiation
The role literature emphasizes the process whereby the expected set of behaviors
called a role is established. Role assignments are part of a job description and formalization
of emergent tasks from role assignments fits within the scope of job customization.
A job is regarded as a formal set of task elements influenced by an organization's prime beneficiaries. Roles include both formal and emergent task elements. An emergent task element may eventually evolve into a formal task element if there is consensus among members of a role set that the element is necessary or if the prime beneficiaries decide that the task should be formally established for all job incumbents (Griffin & McMahan, 1994, p. 31).
34
Person-Job Fit
Person-job fit is one dimension of person-environment fit. Job satisfaction is
most strongly influenced by person-job fit (Kristof-Brown et al., 2005a).
P-J fit has strong correlations with the three primary attitudes studied in the fit literature: (.56) with job satisfaction, (.47) with organizational commitment, and (-.46) with intent to quit. P-J fit has a moderate relationship with the attitudes of coworker satisfaction (.32), supervisor satisfaction (.33) and organizational identification (.36). It has a modest correlation with overall performance (.20) and is correlated somewhat more strongly (-.28) with indicators of strain (Kristof-Brown et al., 2005a, pp. 299, 306, 309).
Figure 7 displays the frequently studied Person-Environment fit types of person-
job and person-organization. The Venn diagram in Figure 7 would indicate a perfect fit
between the person, job and organization if the three concentric circles were overlapping
with equal size.
Per
son Job
Organization
Person Job (P-J) Fit
Figure 7. Person-Job-Organization Fit Venn Diagram
The literature review confirmed the expected strong positive relationship with
person-job fit and job satisfaction and a weaker relationship between person-job fit and
35
overall task performance. In a project that evaluated person-job fit and person-
organization fit, Lauver & Kristof-Brown (2001) confirmed a weak relationship between
job satisfaction and objective measures of task performance. The expected strong
negative correlation between person-organization fit and intent to quit was demonstrated.
A later meta-analysis of both person-job fit and person-organization fit measured both
perceived overall performance and perceived job satisfaction (Kristof-Brown et al.,
2005a). There was a significant correlation between job satisfaction for both fit types but
not for overall performance as summarized in Table 1; however, there were more job
satisfaction than overall performance measure studies included in the meta-analysis.
Table 1. Meta-Analysis: Person-Job and Person-Organization Fit Outcome Variable Fit Type Number of
Studies Lower 95%
CI Upper 95%
CI ρ
Job Satisfaction Person-Job 23 .23 .67 .58 Job Satisfaction Person-Org 30 .23 .67 .56 Overall Performance Person-Job 3 (.25) .61 .22 Overall Performance Person-Org 7 (.10) .30 .12 Intent to quit Person-Job 11 (.65) (.15) (.49) Intent to quit Person-Org 24 (.61) (.25) (.52) Source: Correlation coefficients from Kristof-Brown (2005a). Person-Job Fit Meta-Analysis Note: CI interval ranges for Person-Job and Person-Org versus Job satisfaction were both .23 to .67. ρ: estimated true correlation coefficient
Job Descriptions
Job descriptions are developed through the job analysis process and are the
primary source for developing job specifications used to match people to jobs. Job
descriptions are a fundamental vehicle for assigning tasks or groups of tasks. They are an
effective means for an organization to communicate the expectations of each
interdependent job when they are effectively deployed and maintained.
36
Frederick Taylor (1911) grouped jobs into the two classes of management and
workmen. Management plans ahead and workmen execute the tasks. Best methods for
executing routine tasks are established and documented. Management works side by side
with the workmen, helping, encouraging, and smoothing the way for them. Smoothing
the way means increasing the percent of the workday that the worker is performing value
added tasks and producing work that conforms to standards. Workmen who fail to meet
the standards work with a competent teacher who shows them exactly how the work can
best be done. The teacher guides, helps and encourages. They also study the possibility
of shifting the workman to another class of work for which he or she is better suited
either mentally or physically.
The time is fast going by for the great personal or individual achievement of any one man standing alone and without the help of those around him. And the time is coming when all great things will be done by that type of cooperation in which each man performs the function for which he is best suited, each man preserves his own individuality and is supreme in his particular function, and each man at the same time loses none of his originality and proper personal initiative, and yet is controlled by and must work harmoniously with many other men (Taylor, 1911, p. 74).
Each job is part of an interdependent system. Job descriptions are the basic
building blocks of an organization’s system. Every job design has customer and supplier
relationships as part of an interdependent system.
When employees are left alone without job definition, self-interest will dominate their organizational behavior. Job descriptions show how work is designed and work design is a primary determinant of employee-job performance and of employee satisfaction. They confirm that work is planned, and when an organization’s work is planned there is a much higher probability of organizational success then when things are left to chance. Without job
37
descriptions there is an absence of definition. This means that employee motivation, training, staffing, and performance control are not really possible – indeed, management is not really possible (Grant, 1989, pp. 6-7).
The use or misuse of job descriptions has been criticized. The criticism is often
targeted toward their usability, misuse and job scope limitations. Job scope limitations
can be either real or perceived. Recent market place changes include shorter product life
cycles, increased value expectations, more specific customer requirements, increased
competition and higher value expectations. These increased expectations demand
flexible products, processes and people. The job description describes the effective
application of people within this new environment.
Choppin (1996), a Total Quality Management consultant, suggested negotiating
accountabilities and responsibilities, rather than directing how work is accomplished. He
believed that employees should share a common direction, and be free to maximize their
contribution toward that direction.
Most job descriptions are proscriptions. They proscribe and limit people’s activity, rather than enhance and open it. Again, they are usually imposed and are the job as seen through the eyes of the supervisor or manager. There is an implicit assumption that they know best what another person should be doing, and indeed how to do it. It is so easy to close people down, to get the worst from people (Choppin, 1996, p. 43).
Choppin (1996) suggested outlining accountabilities and responsibilities rather
than defining how the job should be performed. Less prescriptive job documentation
allows for the sharing of a common direction and contribution maximization.
The Toyota Production System has developed and used job descriptions to
support an organization’s mission of satisfying customers and promoting creativity. “The
38
Toyota Production System is a highly structured environment that was full of
standardization, but with a great deal of individual initiative and creativity. The
creativity was channeled to improve standards” (Liker & Meier, 2007, p. 94).
Knowledge workers such as product engineers within the Toyota system have a wide
variety of standard processes and rules.
Adler (1999) referred to this form of bureaucracy as enabling, as opposed to
coercive. Coercive forms require documentation to ensure employees who are stubborn,
disobedient, incompetent, or irresponsible do the right thing. Enabling bureaucracy
documents a system to support the work of the doers in an enabling way as opposed to
bolstering the authority of the higher ups. The enabling bureaucracy is viewed as a tool
to better enable task performance as opposed to a weapon used by their superiors (Adler,
1999). An enabling bureaucracy will document job and process expectations in a
standard way that facilitates improvement. Job descriptions define task assignments for
each job and position. Job design negotiations and improvements must be documented to
communicate, train, and form the basis for future change.
What are the key forces that resist modifications of job descriptions? One
example is the practice of establishing job grades and pay rates based on job description
content. Supervisors may have multiple people reporting to them with different job
descriptions. The job descriptions may include different job grades within the same job
description. If not job grades, there may be different pay rates for the same job
description with different output expectations. A position description that modifies the
job description expectations may affect the job rating.
39
Every employee’s job has a description and role within the organization. The
description may be documented or undocumented. It may be defined by the job
incumbent, supervisor or even co-workers within the work group. The job designed by
the incumbent may match the desires of the incumbent but often does not best match their
organization’s needs. “Employees naturally gravitate toward pursuit of self-interests
while at work and toward the expenditure of their effort and time on the more desirable
tasks. This tendency often leads to misdirected effort, from the company’s point of view”
(Grant, 1989, p. 101).
Written job descriptions have often not played a significant role in the prescriptive
assignment of tasks. A variety of factors contribute to this. Grant (1989) lists 21 reasons
why job descriptions are often not used. Some of the relevant reasons include: lack of
understanding, perception of inflexibility, job escapes definition, use inconsistency, lack
of adherence, mechanical use or no motivation for the supervisor to use them. Job
descriptions are also not used due to perceptions that they inhibit the process for selecting
the perceived best person for the job or organization and that the job descriptions should
not be built around the individual. Some managers intend to hire people with a good
person-organization fit and a relatively lower person-job fit. They assume that the person
will be able to perform their initial job assignment effectively.
A number of managers disregard job descriptions in hiring. They say that what they are looking for is a candidate with the right attitude, a willingness to learn, and an aptitude for the work. Experience and developed skills relative to particular duties are not important. Besides, the intent is to mold the job to fit the individual’s unique talents anyway (Grant, 1989, p. 102).
40
Should the job be molded to the person? If the jobholder is not fulfilling the
responsibilities and tasks defined in the job description then there is a performance gap.
How are the tasks fulfilled if the incumbent is not able or motivated to complete them
effectively? Molding or customization of job descriptions is proposed as a partial answer
to these questions.
Organizations will want to adapt jobs to incumbent strengths and weaknesses. Perhaps certain duties should be eliminated from one’s job and assigned elsewhere if these duties, for one reason or another, cannot be performed proficiently by the worker. Perhaps the worker should be assigned other tasks, not normally part of the job, to take advantage of special skills or knowledge he or she has. Also, as the employee grows in the job, job content should evolve to take advantage of the increased capacity of the worker (Grant, 1989, p. 102).
A job description is a group of tasks, roles and responsibilities assigned to a job
title and expected to be performed by a single person. A job description might be a
description of roles and competencies written in behavioral terms. Competencies are
clusters of skills (Joison, 2001). Specific expectations are set by an individual manager
where they define the skills and tasks that make up a job. Documentation of the job
detail for a specific position will be defined as a position description for the purposes of
this paper. See Appendixes M and N for examples of a job description and position
description for a lean leader.
Job descriptions describe twelve different job characteristics according to Grant
(1989). One of the characteristics is the degree of specificity by which the jobholder can
mold the job to better match their specific needs and characteristics. Appendix I contains
the complete listing of the characteristics.
41
Reasons Job Descriptions are Not Used
Job descriptions may not be created, used, or maintained because a supervisor
may feel that the use of job description to design work and manage improvement is not
warranted. The following are some of the common reasons for not using job
descriptions: Job descriptions are used to determine the pay rate; an individual job
position or description change may change the job classification that is assigned to a pay
rate scale. The number of job descriptions may be limited to increase flexibility for
reassignment, clearly show alternate career paths, or reduce human resources department
work. The supervisor may feel that the investment of time required to write and update
the job description is not warranted. Policies frequently do not require periodic job
description review. Or, it is often only under duress that workers perform less than
desirable responsibilities that may be included in their job description.
There are additional reasons why supervisors would neglect the process of
identifying and closing responsibly gaps. The supervisor may have poor writing skills.
The outcome of what the job-holder does may be higher weighted than how the job-
holder accomplishes it. The supervisor may reward goal attainment without regard to
how the incumbent fulfills their responsibilities.
42
Job Specifications
Job or person specifications document the knowledge, skills, abilities, experiences
and personal characteristics expected for job success. A job specification example is
included as Appendix D. The specifications should be valid, meaning they predict job
success, and reliable, meaning they produce consistent results over repeated
measurements (Byars, 2006). Often the person selected for a job partially fulfills the job
expectations. Grant (1997) surveyed 200 non-managerial employees in 60 businesses
regarding the usefulness of their job descriptions. Eighty-five percent reported their job
descriptions as deficient and about 70 percent said key elements of their job were left out
of their job descriptions. The job description should explicitly communicate the key
things that the job incumbent is expected to do, or to avoid doing (Grant, 1997).
The job specification is written to improve the person-job fit. Employee
information is necessary to establish either the job fit or gap. An existing employee skills
inventory list may be maintained to identify their accomplishments, skills and
characteristics. The interview process, reference checks, resumes and job application
forms are common sources of employee information referenced during the selection
process for new employees. It is assumed that the new job incumbent’s person-job gaps
should be identified if they are expected to be closed.
The job selection process uses job specifications to identify the knowledge, skills,
abilities and characteristics (KSAC) that the jobholder should possess in order to fulfill
the job description requirements. Some abilities are required immediately, some must be
acquired over time and some may be compensated for by other abilities. Job incumbent
43
KSAC variation results in gaps between a job incumbent’s capabilities and those required
by the job.
Wilkinson and Zwaneberg (1994) evaluated the person or job specification
development process and developed an expert system to define the job specification
development process. They defined a job description as a statement of the job to be done,
in terms of tasks or activities and a job specification as the attributes of a successful
applicant. The job specification is normally derived from the job description. Job
specifications describe the attributes of a person necessary to do the job. The attributes
vary in importance and the ability to be measured. Job specification measures need to be
consistent or reliable and accurate or valid. The job specification details the levels of
skills, abilities, knowledge, and experiences required to do the job well or to standard.
Qualifications in the job specification include the experience and education necessary for
the employee to acquire the skills, knowledge, and abilities necessary to perform at
standard. Wilkinson and Zwaneberg’s (1994) sample of job specifications reviewed for
managerial jobs had from four to 70 desired characteristics with an average of 16.
The job specification model is presented in Figure 8. A cut-off selection model
disqualifies job candidates if they fail to meet essential attribute minimum requirements.
High evaluation scores on one attribute can compensate for low scores on another. The
process looks for samples from candidates to verify they have the attributes required to
perform necessary activities and signs that they will be able to develop abilities to
achieve the desired activities.
A methodical process for the development of job description and job
specifications is critical for the development of custom job designs and descriptions
44
(Wilkinson & Zwanenberg, 1994). See Appendix C for an example of a job
specification.
Managerial Job
General Activities
Specific Activities
Essential Desirable
Future Now FutureNow
Samples SignsSigns
CompensatoryCut-Off
Samples
Time Scale
Attribute Type
Selection Model
Source: (Wilkinson & Zwanenberg, 1994, p. 30)
Figure 8. Job Specification Model
Job Analysis
Job analysis is the process by which job descriptions and job specifications are
created. Job analysis subdivides jobs into tasks by means of data collection, analysis, and
synthesis.
Job analysis is usually defined as the systematic procedure of collecting and analyzing information about jobs. By using some kind of structured job analysis method, or a combination of different methods, jobs are broken down into components. Basically job analysis consists of two elements: a job description and a job specification (Visser et al., 1997, p. 2).
45
Many alternative job analysis methods exist. Ash and Levine (1983) evaluated
seven widely used alternative methods using a critical incident questionnaire mailed to
experienced job analysts. Two techniques, Task Inventory CODAP (Comprehensive
Occupational Data Analysis Programs) and Functional Job Analysis, were rated best for
developing job descriptions (Levine et al., 1983).
Job Customization – Incumbent Initiated
Some degree of job customization by the job incumbent will happen in lieu of a
formal effort. Wrzesniewski (2001) described job description customization by an
incumbent as “job crafting.” Job crafting is initiated by an employee to assert control
over their work, remain engaged, to create a positive work self-image and to connect to
others. An incumbent will craft their job in lieu of an intentional method due to unmet
needs. She compared the “job crafting” model to other related models and justified its
acceptance by comparing and contrasting the model to other related models. See
Appendix E for Wrzesniewski’s job crafting model and the three types of job crafting
identified. The first form of job crafting listed in Appendix E might be viewed as job
design customization initiated by the job incumbent.
Job Design Evolution
Miner (1990) developed a model that selectively retains jobs and implied that
adaptive change can occur in the absence of clear and consistent goals. She argued that
46
structural evolution may occur through the turnover of jobs. Miner tested the evolution
of jobs using the partial likelihood analysis of the hazard rate of job death among 347
formalized jobs in a large organization over a six-year period (Miner, 1991). These jobs
were classified as idiosyncratic jobs. The job adaptations may or may not be documented
or replicated.
All evolutionary change processes require that there be a system for replicating activities over time, a source of variation in activities, and mechanisms which permit some activities to persist while others do not. … Idiosyncratic jobs – or jobs created around particular people rather than in the abstract – serve as a mechanism for unplanned variation in sets of job duties. Unplanned variation in task accomplishment are retained and reproduced over time. Formalized job descriptions provide consistency of behavior over time; idiosyncratic jobs provide a source of unanticipated variation with selective retention (Miner, 1990, p. 196).
Formalized Job Systems
Miner described a formal job system as one that has a job classification system,
general descriptions of job groups and individual job descriptions. She described a job
classification system as a powerful source of consistency of behavior and therefore a
replication system. “The written job description and individual job descriptions may
form expectations for incumbents, managers, and other employees” (Miner, 1990, p.
197).
Structural Evolution Perspective
The structural evolution perspective predicts that job design formalization may
enhance rather than deter effective adaptation, and that organizations can adapt over time
without clear initiatives to do so. “Formalization along with experimental jobs allows the
47
organization to adapt. The formalized job system is the organization’s memory” (Miner,
1990, p. 199).
Structural Contingency Theory
Structural contingency theory argues that changing environments require more
organic structures to permit adaptation to a changing environment. These arguments
imply that formalization will decrease the organization’s ability to adapt to changing
environments (Miner, 1990).
Situational Leadership
The Situational Leadership Model for developing and coaching people is
predicated on the understanding of the readiness level of people whom the leader is
attempting to influence (Hersey & Blanchard, 1993). Hersey and Blanchard (1993)
define a changing leadership style by the degree of task behavior and relationship
behavior exhibited by the leader. Task behavior is defined as the degree that the leader
details the tasks and responsibilities to be performed. Relationship behavior is defined as
the degree of two-way communication. The leadership style is defined for each task or
group of tasks (competencies) and it changes as the learner progresses through four
stages of readiness (Hersey & Blanchard, 1993). Readiness is defined as “the extent to
which a follower has the ability and willingness to accomplish a specific task” (Hersey &
Blanchard, 1993, p. 189). The theory is built on the assumption that well-formulated task
statements are developed. Task performance is measured on both ability and willingness
48
to perform. Situational leadership has been a well-accepted model for coaching and
developing people. “It has been a major factor in training and development programs for
more than 400 of the Fortune 500 companies” (Hersey & Blanchard, 1993, p. 215).
Situational leadership has well documented face validity as an effective approach for
coaching workers to close task performance gaps.
Bureaucracy Risk
Weber (1968) described characteristics of the modern bureaucracy that are
generally structured by rules and administrative regulations. Regular activities are
assigned as official duties, authority to command the discharge of duties is distributed in
a stable way, and fulfillment of the duties is performed methodically. Management is
based on written documents and a staff of subordinate officials and writers. The officials
and their files and materials make up a bureau. Management of the office follows stable,
general rules. Knowledge of these rules constitutes special technical expertise. Officials
do not own the position, but agree to fulfill the duties. Bureaucracy is tied to the
availability of continuous revenues to maintain it. Detached experts are assigned to deal
with complexity, specialization, and objectivity. “The individual bureaucrat is a small
cog in a ceaselessly moving mechanism which ascribes to him an essentially fixed route
of march” (Weber, 1968, p. 988). Bureaucracies may be seen as indispensable and
impersonal, yet they are easy to steer by new management. Once new management has
gained control it is easier to keep them running. Bureaucracies make radical change
difficult (Weber, 1968).
49
Bureaucracy may be defined as the division of labor into well documented tasks
where experts are assigned to fulfill them, and a management structure ensures
compliance (Weber, 1968). Workers perform duties as opposed to owning their tasks and
bureaucratic structures are predictable, slow to change, and less productive than those
required by the marketplace (Weber, 1968). Documentation that is easy to use, maintain
and change is expected to minimize the bureaucratic effect.
Lean Leader Job Design
The selection of the lean leader and their job design is critical to the success of an
organization’s lean transformation. Over 100 lean leader positions listed on job posting
sites in September 2007 were reviewed. The job descriptions posted with the job listings
were relatively simple with a variety of knowledge and skills listed. Over 50 types of job
tasks were included in the job descriptions. The following job titles were identified:
Business Process Lean Deployment, Kaizen/Lean Manufacturing Coordinator, Lean
8 Process knowledge Operations and business processes 5.17 8 Role model for lean application 5.17 1.1 8 Status Updates Progress reporting 5.17 8 Subject Matter Expertise Maintained, applied and used to
develop personal credibility 5.17
9 Organization Personal and project 5.00 10 Cost reduction 4.50 4.2 10 Quality tools and systems 4.50 4.1 11 Documentation Procedures, guidelines, training
materials etc. 4.33 2.4.4
11 Promotion – Lean principles & application
Newsletters, articles, speaking opportunities etc. 4.33
1.1
11 Scheduling and planning 4.33 3.1 11 Supervision 4.33 12 Benchmark 3.83 2.4.4 13 Special Projects Not specified in JD or objectives 3.50 14 Costing or cost accounting 3.33 3.1 14 Six Sigma Application 3.33 15 Information systems Expertise or administration 2.67 3.1
Italic font indicates task performance self assessed on lean leader survey. BOK # refers to Appendix G.
53
Models for Analyzing Person-Job Fit
“Person-environment (P-E) fit has been broadly defined as the compatibility
between an individual and a work environment that occurs when their characteristics are
well matched” (Kristof-Brown et al., 2005a, p. 281). Person-job fit is one of the
components of person-environment fit. Kristof-Brown et al. (2005a) performed a meta-
analysis, using 172 studies, that investigated the relationships between person: job,
organization, group and supervisor fits. The criteria used to assess the fit included
attitudes, performance, withdrawal behaviors, strain and tenure. Much of the meta-
analysis was concerned with the moderators of the fit-outcome relationships and
evaluating empirical evidence regarding their impact.
Fit has alternatively been conceptualized as similarity, need-satisfaction, and demand-ability match. Further, it has been operationalized using a variety of content dimensions, including skills, needs, preferences, values, personality traits, goals, and attitudes. Strategies for measuring fit also vary widely, from directly asking individuals to report their perceived fit to researchers indirectly assessing fit through explicit comparisons of separately rated P and E characteristics (Kristof-Brown et al., 2005a, p. 282).
Kristof-Brown et al. (2005a) defined demands-abilities fit and needs-supplies fit
as complementary where an individual’s characteristics fill a gap in the current
environment or vice versa. Demands-abilities fit is operationalized as the match between
the incumbent’s knowledge, skills, and abilities and the job. Needs-supply fit occurs
when the incumbent’s needs, desires, or preferences are met by the job. Preferred
behavior or personality is a key person-environment fit moderator.
54
The Kristof-Brown et al. (2005a) study confirmed that direct or perceived
measures of fit had stronger relationships than indirect objective measures for job
satisfaction, overall performance and intent to quit. They also confirmed that the
temporal or time separation of relationships had little bias on fit-attitude relationships
except for organizational commitment. These findings confirm the validity of collecting
participant data with a cross-sectional design that collects all the data at one point in time.
Lauver and Kristof-Brown (2001) performed a study that evaluated the
relationship between employee perceptions of person-job (P-J) fit and person-
organization (P-O) fit. “Person environment (P-E) fit has been positively related to
individuals’ career involvement, job satisfaction, organizational commitment, and career
success and negatively related to turnover intentions and behaviors” (Lauver & Kristof-
Brown, 2001, p. 454). They concluded that both P-J and P-O fit had a unique impact on
job satisfaction and intent to quit. P-O fit was a better predictor of intent to quit than was
P-J. They measured task performance objectively by using normalized performance
review ratings for office personnel and driver performance was a combination of miles
driven and frequency of accidents. They used regression to measure the correlation
coefficients and β coefficients between the P-J and P-O fit measures and each of the
variables: Job satisfaction, intent to quit, task performance and contextual performance.
Scroggins (2003) developed and tested a self-concept-job perceptual measure of
person-job fit. The measure assessed the fit between the individual and the job and not
the individual and organization.
Perceptions that job tasks and behaviors were consistent with an individual’s self-concept would make the performance of those tasks and behaviors meaningful. Meaningful work would increase the individual’s attraction to the job and work and decrease the likelihood that the individual would engage in turnover behavior.
55
The importance of self-concept-job fit was supported. Perceptions of self-concept-job fit were strong predictors of both meaningful work and intentions to leave (Scroggins, 2003, p. 201).
The study provided empirical evidence that needs-supplies fit and self-concept-
job fit combined had additive effects and the greatest impact on and power for predicting
meaningful work and intent-to-leave. Meaningful work was reported as a strong
predictor of organization commitment, job satisfactions and intention to leave; however,
it was a weaker predictor of job performance (Scroggins, 2003, pp. 190-191). Hackman
and Oldham (1987) also included meaningfulness of work in their Job Characteristics
theory.
Objective 1 – Customized Job Design Effect
The literature review described and measured relationships between person-job
fit, job satisfaction, task performance and intent to quit. Job design processes and
methods for documenting the job requirements in the form of a job description or position
description are well documented. Methods to define and document person-specifications
used in the selection process are defined. Selection and interviewing techniques have
been developed to increase the likelihood of selecting a person with a good person-job fit.
Formal and informal methods have been suggested for how jobs may be adapted or
changed over time to meet changing organization needs or jobholder preferences.
Processes for the adaptation of jobs initiated idiosyncratically by the jobholder or through
a formal job design process were discussed.
Richard Hackman and Greg Oldham’s (1980) Job Characteristic theory described
56
moderators that would affect the motivational properties of a job design. A gap between
the individual’s knowledge, skills and abilities and those required by the job are expected
to result in job incumbent frustration and poor performance even though the job was
designed with high motivational potential characteristics.
The person-environment fit research shows wide variation in correlations with
overall performance. There were nineteen studies included in a person-environment fit
meta-analysis (Kristof-Brown et al., 2005a) that studied the relationship with person-job
fit. The correlation coefficient between person-job fit and overall performance had a 95
percent confidence interval between -0.19 and 0.51. As a comparison the correlation
coefficient between person-job fit and intent to quit (16 studies) at a 95 percent
confidence interval was between -0.15 and -0.59. Reasons for the variation include both
poor objective measures of task performance and the gap between the knowledge, skills
and abilities required by the job and provided by the incumbent. Job design
customization is targeted at closing the person-job fit gap.
Objective 1 - Literature References
Kristof-Brown et al. (2005a) performed a meta-analysis that summarized the
person-environment fit literature related to person-job, person-organization, person-
group, and person-supervisor fit. Output criteria included job satisfaction, intent to quit,
and overall performance. Lauver & Kristof-Brown (2001) performed a person-job fit and
person-organization fit study of both hourly and salary workers. Output criteria included
job satisfaction, intent to quit, and objective measures of task performance. The Job
Content Questionnaire (Karasek, Brisson, Kawakami et al., 1998) is a questionnaire-
57
based instrument designed to measure the content of a respondent's work tasks in a
general manner which is applicable to all jobs and jobholders in the U.S. Scroggins
(2003) developed a self-concept-job fit measure that is an additive component of person-
job fit with demands-abilities fit and needs-supplies fit. Scroggins (2007) confirmed an
additive effect for the three types of person-job fit types on job satisfaction and intent to
quit. Self-concept-fit accounted for more of the variation in intent to quit and less for job
satisfaction when compared to demands-abilities and needs-supplies.
Objective 2 - Job Description Customization
The study of the effect of customized or accurate job descriptions on person-job
fit or the outcome criteria variables of job satisfaction, task performance and intent to quit
was not found in literature. The study of the effect of job descriptions updated as a
position description to clarify the expectations of a redesigned job was also not found in
literature.
Objective 2 - Literature References
Grant (1989) researched the use of job descriptions and developed a guide for
their analysis, preparation and application. Grant (1997) summarized content that is
frequently missing in job descriptions. Joison (2001) detailed methods for creating job
descriptions that are easier to create, maintain and use by grouping tasks into clusters or
duties. Fiermonte (2006) measured the effect of position description use in the hiring
process.
58
Objective 3 - Preferred Behavior Effect
Personality has been used to assess supplementary fit in the domains of person-
organization, person-group, and person-supervisor fit literature (Kristof-Brown, Barrick,
& Stevens, 2005b). Kristof-Brown et al. (2005b) assessed the person-team fit for
extraversion on member’s attraction to the team and found a unique relationship between
team level outcomes and team members’ extraversion. Most studies of personality-based
fit emphasize the benefits that accrue from supplementary fit, or personality similarity,
between individuals and others in their social environment. Kristof-Brown and Jansen
(2006) proposed first that individuals high on conscientiousness will place greater
emphasis on task-related than interpersonal forms of fit. Second, individuals high on
agreeableness will place greater emphasis on interpersonal forms of fit rather than task-
related forms of fit.
The agreeableness dimension of personality is expected to have an impact on the
type of person-environment fit that is most important to the person. “Individuals high on
agreeableness may find inter-personal forms of fit (e.g. person-person, person-group)
more salient than task-related forms of fit (e.g. person-job, person-vocation) because their
cooperative nature and tendency to get along with others reinforces the importance of
interpersonal fit. Second, individuals high on conscientiousness are likely to place
greater emphasis on task-related rather than inter-personal forms of fit … because they
are driven to perform effectively and efficiently on the job” (Kristof-Brown & Jansen,
2006, p. 200).
59
The “DiSC one” system classifies preferred behavior types. The acronym refers
to the following preferred behavior labels: Dominance, Influence, Steadiness or
Conscientiousness. “The D and i styles both tend to perceive that they are more powerful
than their environment. They feel they have control over their surroundings and may be
more assertive and pro-active. On the other hand, the S and C styles both tend to
perceive that they are less powerful than their environment. They feel they have little
direct control over the environment and may be more adaptive and reactive. The D and C
styles tend to perceive their environment as unfavorable (i.e., resistant, unwelcoming, or
skeptical). The i and S styles tend to see the environment as favorable (i.e., accepting,
welcoming, or friendly)” (Inscape Publishing, 2004, pp. 2-1, 2-2). The DiSC
classifications enables group comparisons by type to assess possible effects on job
customization, person-job fit and the outcome variables.
Objective 3 - Literature References
Marston (1928) identified what he called four “primary emotions” and associated
behavioral responses, which today Inscape Publishing (2004) describes as the DiSC
system for classifying preferred behavior. Kristof-Brown et al. (2005a) performed a
meta-analysis of person-job, person-organization, person-group, and person-supervisor
fit. The relationship between personality to broad job classifications was also established
by O’Reilly (1977). Kristof-Brown (2005a) measured the significant effect of
extraversion on person-group fit. Extraversion is expected to have an effect on the
frequency of job customization. Kristof-Brown and Jansen (2006) proposed relationships
among conscientiousness, agreeableness and task-related forms of fit.
60
Objective 4a - Assignment Priority Index
Kristof-Brown and Jansen (2006) recommended a single person-environment (P-
E) fit model that measured P-E fit with multiple variables such as person-job fit with:
job, group, organization, supervisor, and vocation. They described the need to develop
salience weights associated with each fit type. “The additive relationship implies that the
salience-weighted sum of fit assessments reflects a compensatory effect between fit
dimensions. In other words, good fit with one salient dimension of the environment may
compensate for the lack of fit with other less salient dimensions” (Kristof-Brown &
Jansen, 2006, p. 198).
Scroggins (2007) examined the additive effects of person-job fit on job
satisfaction and intent to quit. He used hierarchical regression to investigate the additive
effects of employee perceptions of person-job and person-organization fit. Results
indicated that the effects of three types of person-job fit on job satisfaction and intent to
quit were additive.
If relevant person-task fit factors are additive then a weighted composite index
might be developed to support the person-task assignment decision making process. The
literature included the following task assignment decision criteria factors affecting
person-task fit.
Performance
Smart (1999) coined the term topgrading as a verb that describes the process of
filling every job with an A player, at an appropriate compensation level. Smart (1999)
61
defined A players as the top 10 percent of all talent who are available and willing to
accept a job offer. By experience he estimated that 10 percent of available job applicants
are A players, 25 percent B players, and 65 percent C players. He offered a structured
interview methodology (Chronological In-Depth Structured Interview Guide) to increase
the likelihood of hiring A players and suggests ways that B or C players may be moved or
coached to the A player classification. The causes of C player performance include: mis-
hired, mis-promoted, or mis-deployed. Solution alternatives for improving performance
include redesigning the job so that the jobholder might successfully perform at a higher
level.
Narrow the person’s job to include only those responsibilities that the person is
competent performing and pay accordingly. People are C performers when they are mis-hired, mis-promoted, or mis-deployed within their companies (Smart, 1999, p. 38).
Extra training and coaching is offered as the first option. All employees may
theoretically be classified as A performers when job redesign is an option.
Preferences
A multi-dimensional work preference research instrument was designed to
measure person preferences that affect work or job selection (Gilbert, Sohi, &
McEachern, 2008). The study developed a multi-dimensional Work Preference Indicator
tool to measure the person-job fit. “The 17 validated constructs were culled from career
development-related psychology that has variously been identified with learning styles,
work interests, work values, and temperament” (Gilbert et al., 2008, p. 56). Fifteen of the
constructs are directly related to preferences regarding tasks within the categories of
62
Work Interests, Work Values, Personality or Temperament, and Learning Style. Table 3
presents the measure titles and inter-correlations from a sample of 975 subjects.
The Work Preference Indicator model includes constructs that were derived from
different areas of concentration within the field of career psychology. They recognized
that work preferences may be affected by many variables including: education, gender,
life and career stages, college major, race, ethnicity, socioeconomic status, and other
organizational characteristics (Gilbert et al., 2008). The study was viewed as an initial
effort to establish the Work Performance Indicator as a valid multidimensional tool to
name is associated with a maximization problem for the best choice of essentials that can
fit into one bag to be carried on a trip. Given a set of items, each with a cost and a value,
the quantity of each item is determined so that the total cost is less than a given limit and
the total value is maximized. The problem can be modeled as a muliple generalized
assignment problem (Alberto & Giovanni, 2006).
There are a variety of assignment problem models developed in the field of
Operations Research. Linear assignment problems (LAP) use linear programming to
model task assignment problems. Linear programming is designed to solve
transportation problems which minimize the cost to ship goods from multiple sources to
multiple locations. The transportation problem is a task assignment problem where the
transportation cost is the cost of the task assignment. There are objective functions and
constraint equations. Constraints may include the available hours of the assigned person
or agent. An optimal solution assignment scenario optimizes the objective function while
meeting constraint requirements. The linear programming model assigns a variable to
each person and task combination. Binary assignments of 1 for task assignment and 0 for
no task assignment are frequently made. Constraint equations are developed to ensure
that each task is assigned a client and that no agent is assigned more than a maximum
number of tasks. Semi-assignments can split the assignment to multiple agents if their
cost coefficients are equal (Kennington & Wang, 1992). The objective function has a
cost coefficient assigned to each agent task combination. The optimal solution minimizes
the objective function while fulfilling the requirements of the constraints. A Generalized
Assignment Problem (GAP) is similar to a LAP except agents are assigned to tasks where
both the tasks and agents have size (Anderson, Sweeney, & Williams, 2004).
66
A greedy solution will make the best task assignment first followed by the next
best task assignment. The scenario created depends on the past choices but not on future
task assignments. Greedy choices are made iteratively one after another, reducing each
given problem into a smaller one. Choices are never reconsidered unlike dynamic
programming which makes decisions based on decisions at previous stages and may
reconsider those decisions (Gaetan, Pierre, & Brigitte, 1999).
Workflow software routes the next operation of an electronic work order routing
to a worker in real time. The software matches the capabilities required by the job with
the capabilities of available workers. A supervisor tracks performance with system
reporting and intervenes to ensure process goals are met. The software may consider
additional factors such as task proficiency and labor cost.
Some models factor in learning curves, worker proficiency in facets of the task,
and simulations. Brahms simulation practice for work systems design model incorporates
the affect of the communication method used for completing work.
A Brahms model of work practice reveals circumstantial, interactional influences on how work actually gets done, especially how people involve each other in their work. In particular, a model of practice reveals how people accomplish collaboration through multiple and alternative means of communication, such as meetings, computer tools, and written documents. Choices of what and how to communicate are dependent upon social beliefs and behaviors— what people know about each other’s activities, intentions, and capabilities and their understanding of the norms of the group (Clancey, Sachs, Sierhuis, & Hoof, 1998).
Objective 4 - Literature References
Kristof-Brown and Jansen (2006) defined the need to develop composite
measures of person-environment fit with salience-weightings or coefficients indicating
67
the relative magnitude of each component. Scroggins (2007) demonstrated that the three
types of person-job fit (demands-abilities, needs-supplies & self-concept-job) had
additive effects on the outcomes of job satisfaction and intent to quit. Hackman &
Oldham (1987) developed the job characteristics model to measure the motivational
potential of job designs. Model factors included skill variety, task identity, task
significance, feedback and autonomy. Morgeson and Humphrey (2006) developed a
more comprehensive measure for assessing job design with the Work Design
Questionnaire (WDQ). The WDQ job design measures are intended to compare
competing job designs. Developing and Validating a Comprehensive Measure for
Assessing Job Design and the Nature of Work. Daniels (1995) developed a typology for
tasks based on the two dimensions for predictability and delay tolerance. The four types
of tasks were labeled routine, troubleshooting, project and negotiable. Negotiable tasks
are a combination of troubleshooting and project. Gazzara (2003) studied the
relationships between routine, troubleshooting, and project tasks and the mix that would
create “flow” in work. Gilbert et al. (2008) developed a multi-dimensional tool to
measure person-job fit using career development-related psychology literature. Smart
(1999) developed the theory of topgrading where an organization frequently employs the
top ten percent of the people who would be willing to accept the job for the current pay
rate. The theory includes candidate interviewing methods, performance measurement,
performance gap identification, and a fixed period for closing gaps by improving
performance, changing job design or reassigning jobs.
68
Body of Knowledge
Engineering Management Body of Knowledge (BOK)
Job design is directly related to three fields of study and related courses within the
Engineering Management BOK (Merino, 2007). First, Individual/People oriented
behavior with the Organizational Behavior course. Related content includes: 1.A.1.C.2 -
Understanding personality and work performance, 1.A.1.C.3 - Work-related attitudes
and work performance, 1.A.1.C.4 - Cognition and work performance, and 1.A.1.D.3 -
Job design and enrichment. Second, Organizational/Group Oriented with the
Management Theory course. Third, Functional and Technical Management with the
Engineering Management course. Related content include 5.A.1.I.B.3 - Human Aspects
of Organizing – Motivation and Control, and 5.A.1.II.B - Achieving effectiveness as an
engineer (Merino, 2007).
SME & AME Lean Body of Knowledge (BOK)
Appendix G contains an outline of the Society of Manufacturing Engineers
(SME) & Association for Manufacturing Excellence (AME) Lean Body of Knowledge.
The American Society for Quality (ASQ) is developing a lean BOK that includes Six
Sigma quality methods within the scope.
Human Resources Body of Knowledge (BOK)
The Human Resource Certification Institute (HRCI) developed the Human
Resources Managers credentialing program for Professional in Human Resources (PHR)
69
and Senior Professional in Human Resources (SPHR)
(www.hrci.org/Certification/BOK/NBOK, 11/10/07). The latest revision of the Body of
Knowledge items related to job design is listed in Appendix J.
person-organization fit, and other dependent variables. The β coefficient for each
correlation indicated the strength of the relationship. Correlation was tested by
developing confidence intervals for βs. The variable correlation analysis methodology
was similar to that performed by Lauver and Kristof-Brown (2001).
Face Validity
The data collection content, clarity and ease-of-use were assessed by lean leader
professionals, youth leader professionals and Western Michigan University graduate
students.
89
Convergent Validity
Lean leader and youth leader results were compared and contrasted. Similar
results were expected based on similar job characteristics. A second version of the youth
leader survey measured job characteristic motivational potential using variables included
in Hackman and Oldham’s (1980) Job Characteristics Model. The theory assumes that
the motivational potential is moderated by the degree that the person has the knowledge,
skills, and abilities to perform the job. Job customization ratings were expected to
positively correlate with job characteristics. See Figure 11 for an overview of job
characteristics theory relationships.
Job Characteristics Psychological states Personal & Work Outcomes Skill variety
Meaningfulness High motivation
Task identity High quality work Task significance High satisfaction with work
Autonomy Responsibility for outcomes Low turnover/absenteeism Feedback Knowledge of results
Motivating potential is moderated by the levels of growth need, knowledge, skills abilities, and contextual satisfaction. Source: (Hackman & Oldham, 1980) Figure 11. Job Characteristics Model
Divergent Validity
The second version of the youth leader survey measured additional person-
environment and job characteristics that have motivating potential but should not be
significantly correlated with job customization. Table 2 summarizes the survey item
content. The comparisons demonstrated that job customization is different from other
variables that are also known to affect the outcome criteria. Items from the Job
Scroggins (2003) 2 Person-Job Fit: Self-Concept-Job Fit
Objective 2a – Customized Job Description
Assess the value of a knowledge worker’s job description that is updated to reflect
a job that was redesigned or customized to better fit the job incumbent KSAC. Confirm
expected improved levels of self-reported job satisfaction, task performance and intent to
quit for knowledge workers who have both customized jobs and job descriptions updated
to reflect the changes when compared to knowledge workers who indicate customized
jobs but not updated job descriptions documenting the redesign.
92
2a. Null Hypothesis
There will be no significant difference in self-reported person-job fit for
knowledge workers with customized jobs who have customized job descriptions and
those who do not have customized job descriptions. The null hypothesis was expected to
be rejected. Grant (1997) makes the point that job descriptions should clearly state what
the organization wants the employee to do for them to be useful to the job incumbent and
the organization.
Objective 2b – Accurate Job Description
Assess the value of an accurate job description. Confirm that the degree of job
description accuracy will not significantly correlate with outcomes of self-reported job
satisfaction, task performance or intent to quit. Job redesign and subsequent job
description updates rather than job description accuracy were expected to affect the
outcomes.
2b. Null Hypothesis
There will be no significant difference in self-reported person-job fit, job
satisfaction, task effectiveness or intent to quit between knowledge workers who have
accurate job descriptions and those who do not. The null hypothesis was expected to be
not rejected. Grant (1997) studied 200 non-managers and 85 percent said that their job
descriptions were deficient and 70 percent had key elements omitted. It was expected
93
that the infrequent use of job descriptions and their incompleteness will mask the minor
effect that accurate job descriptions may have on these outcome criteria.
Measurement
The hypothesis was tested with data that were collected from the youth leader and
lean leader surveys. The self-scored survey items presented in Table 8 were used to
evaluate the hypothesis. Intent to quit, job satisfaction, person-job fit and task
effectiveness were recorded on seven-point Likert scales. The person-job fit measure
was measured in terms of demands-abilities fit, needs-supplies fit and self-concept fit.
The aggregate person-job fit measure was a non-weighted average of the three person-job
fit types.
Table 8. Variables to Test Hypotheses for Objectives 2a and 2b Objective Variables Lean Leader Items
Appendix A Youth Leader Items
Appendix B 2a Job Customization 1a, 6a 1a, 6a
2a and 2b Person-Job Fit 2a, c, e, g, i, k, m, n 2a, c, e, g, I, k, m, n 2a Demands-Abilities Fit 2a, 2g, 2m 2a, 2g, 2m 2a Needs-Supplies Fit 2c, 2i, 2k 2c, 2i, 2k 2a Self-Concept-Job 2e, 2n 2e, 2n 2a Customized Job Description
The worker fills gaps or needs in the workplace. The following variables are
associated with what the worker supplies to the workplace.
101
AB - Abilities Fit. Assessment of the worker’s abilities to perform the proposed
task assignment and transferable abilities that may help compensate for gaps.
KN - Knowledge Fit. Assessment of the worker’s knowledge regarding the
proposed task assignment and transferable knowledge that may help compensate for
knowledge gaps.
SK - Skills Fit. Assessment of the worker’s skills regarding the proposed task
assignment and transferable skills that may help compensate for gaps.
TR - Training Status. The assessment of the worker’s previous level of task
training that may consider transferable or compensating skills that are expected to
increase the probability of a good person task match.
Needs-Supplies Fit
The job incumbent’s needs are met by similar characteristics within the
workplace environment. The following variables are associated with the worker needs
that are supplied by the workplace.
PB - Dominant Preferred Behavior or DiSC Match. Each worker is assigned a
primary preferred behavior type based either on worker or manager assessment. Each
task is also assessed by the manager to determine if there is a primary preferred behavior
that would be a best fit for the job. The preferred behavior type if identified is entered as
102
a parameter for the assigned task. A match of preferred behavior type between the
worker and the task is assigned a value of 1 and no match is assigned a PBdisc value of 0.
Scales other than the DiSC may be substituted by the manager.
PR - Preference Fit. Preferences are what a person wants from their work and
what they want the work setting to be like. Fifteen preference items were assessed for
model inclusion. Table 11 defines the fifteen constructs for task preference.
TQ - Task Quotient. The task quotient is the split of assigned tasks among the
categories of routine, problem solving, or planning. There is a mix that each worker is
desirous of maintaining to sustain a work rhythm and variety to stay motivated. A person
is more likely to be assigned to a task type where he or she has currently under assigned
as compared to the ideal task quotient (Gazzara, 2004).
Self-Concept-Job Fit
This person-job fit type measures the degree of fit between the task and the
individual’s self-concept. If there is a good fit then the individual will experience work
as meaningful. The following two factors might be considered components. Multiple
regression results indicated the strength of the relationships.
CP – Career Plan Fit. Assessment of the task fit with the candidate’s career plan.
103
GR – Grade Match. Assessment of the fit between the candidate’s job grade and
the lowest level of job grade expected to be able to perform the task.
Table 11. Task Preference Constructs and Definitions Area Construct Description
Work Interests
Data (Numbers)
Task requires working with numbers, analyzing numbers, and keeping data records.
Factual Info. (Study)
Task requires studying information, retaining it and using it.
Help Others
Tasks allows performer to care for, coach, or help others.
Take Charge (Lead Others)
Task requires taking responsibility for other's work and taking charge
Mechanical (Things)
Task requires working with, studying about, building, or repairing THINGS.
Work Values
Independence
Task requires working independently and making own decisions.
Likeable (Get Along)
Task allows worker to be well liked and get along with others.
Positive Value (Results)
Task results are known and the positive value to the organization is understood.
Team Oriented Task requires working with others. Requires being an effective and integral part of the team. Successes will be shared with others.
Personality or Temperament
Clarity (Guide)
Guidance is given to clarify task expectations. Task has helpful training and specific instructions.
Flexibility (Freedom)
Task allows personal freedom to choose when and how to perform the task.
Idea Task requires thinking in terms of ideas and possibilities. May work with concepts or theories. May generate ideas through creative thinking and research.
Plan Ahead (Time Mgt.)
Task requires organization with daily events planned ahead.
Learning Style
Aural Learning (Talk)
Task requires learning through open conversation and explanations.
Written Material (Read)
Task requires reading from written materials, computers or other visual sources of information.
Source: (Gilbert et al., 2008, pp. 61-62)
104
Performance Assessment
These variables were added to the Assignment Priority Index to account for high
performance in current task assignments and for the potential to accept greater value-
added assignments in the future.
PR – Promotability. Each worker is assessed with regard to their promotability.
The concept recognizes that workers with high promotability are expected to be assigned
increasingly difficult tasks with accompanying higher risks and rewards. The following
definitions for promotability were defined by Smart (1999, p. 18). Promotable to
organization’s top level jobs = 3, Promotable to next one or two more demanding level of
jobs = 2, or Current job level demands = 1.
PE - Overall Task Performance. Task performance was measured subjectively for
up to three tasks by each survey responder. The mean of each subject’s individual task
assessment ratings was used to measure overall task performance. An overall assessment
of job performance was not measured.
Objective 4b – Task Assignment Tool
Assess the effectiveness and expected value of a task assignment tool (TAT)
designed to collect relevant task assignment data and guide decision makers through a
person-task assignment process. The TAT was designed and tested to illustrate how it
might enable a management process to develop a work group task assignment scenario
105
that better fits each knowledge worker’s KSAC and task demands. The tool incorporates
person and job characteristics affecting person-job fit in terms of demands-abilities,
needs-supplies and self-concept-job fit.
Task Assignment Tool Test Hypotheses
There were five hypotheses designed to test the value of the task assignment tool.
Solution confidence, insight from application, predictor of task performance, likelihood
or recommending application, and overall satisfaction were assessed by tool applicators.
4a. Null Hypothesis
Solution Confidence: There will be a non-significant level of positive confidence
in the TAT solution. TAT reviewers assessed the following question on a seven-point
scale ranging from strongly disagree to strongly agree: I feel more CONFIDENT with the
Task Assignment Tool predicted task performance RATINGS than my initial task
performance ratings.
4b. Null Hypothesis
Insight from Application: There will be a non-significant level of positive insight
in the task assignment decision based on TAT application. TAT reviewers assessed the
following question on a seven-point scale ranging from strongly disagree to strongly
agree: The Task Assignment Tool provided helpful INSIGHT regarding the task
assignment decision.
106
4c. Null Hypothesis
Predictor of Task Performance: There will be a non-significant positive
predictive difference between application of TAT and previous method(s). TAT
reviewers assessed the following question on a seven-point scale ranging from strongly
disagree to strongly agree: The Task Assignment Tool is a better PREDICTOR of task
performance than methods I normally use.
4d. Null Hypothesis
Likelihood of Recommending Application: There will be a non-significant
expectation that TAT application will be recommended to other applicators. TAT
reviewers assessed the following question on a seven-point scale ranging from strongly
disagree to strongly agree: I would RECOMMEND using a knowledge worker task
assignment tool as a decision making job aid if a similar tool was adopted by my
organization.
4e. Null Hypothesis
Overall Satisfaction: There will be a non-significant overall positive satisfaction
with TAT application. It was expected that satisfaction with the insight provided by the
assessment and indexes would be moderated by the time and evaluation work needed to
enter the assignment tool inputs. TAT reviewers assessed the following question on a
seven-point scale ranging from strongly disagree to strongly agree: Considering all
aspects of this Task Assignment Tool, my overall SATISFACTION is ...
107
Measurement
The hypotheses were tested with data that were collected from knowledge worker
supervisors, lean leaders, youth leaders, knowledge worker supervisors, and people who
reported the responsibility for assigning tasks to knowledge workers. See Appendix U
for a copy of the survey.
Participants were asked to test the task assignment tool by first selecting a task for
which they knew of two persons capable of performing the task. A Microsoft Excel
spreadsheet was generated with Visual Basic code presenting 19 forms for data entry,
defining the task assignment problem and assessing the person-task fit combinations.
They were asked to compare their initial person-task performance rating with the rating
predicted by the task assignment tool measures (Vickery & Narasimhan, 1988). They
also assessed the task assignment tool for the insight into the task assignment decision,
overall satisfaction with the tool, and willingness to recommend the tool to others. The
hypotheses were evaluated with the non-parametric 1-sample sign test of the median to
test the probability that the actual median was greater than the average rating of four.
Job Customization Process Flow
A process for initiating job customization for knowledge workers was developed
based in part on the literature review and is graphically presented in Figure 13. The
model was developed to integrate job customization into a management model. The
model integrates Job Analysis, Topgrading (Smart, 1999), Situational Leadership -
Partnering for Performance (Blanchard, 2001) and Job Customization through job design
A draft workgroup task assignment spreadsheet model was created in Microsoft
Excel that incorporated 25 predictive factors. The worksheet was designed to collect the
input data for each person in a work group. The data are combined into a second
worksheet for the work group. One worksheet is used to assign tasks using a
prioritization method that uses calculated task Assignment Priority Indexes. There are
eight additional worksheets with matrices that record task and worker dependent variable
assignments. Five of the worksheets have data entered by the manager and three are
calculated by the spreadsheet. The complexity of a work group tool may be significantly
reduced by eliminating less salient factors as performed for objective four. The work
group task assignment worksheet example is included as Appendix L.
Task Assignment Process
The task assignment tool is expected to be applied to a job design and
management process. Appendix O contains the steps that might be included in a process
designed to periodically reassess person-task assignments.
Data Collection Design
The data collected were from a descriptive or observational design collecting
information that already exists as opposed to an experimental design. The design was
cross-sectional given that it provides descriptive data at one fixed point in time (Fink,
2003).
112
The data collected are both qualitative and quantitative. “Qualitative surveys
collect information on the meanings that people attach to their experiences and the ways
they express themselves. Quantitative or statistical surveys provide information
answering questions like count, average, and comparisons” (Fink, 2003, p. 61).
Qualitative surveys often explore knowledge, feelings, opinions, and values. They may
be designed to collect information from a small number of people, people who are
unlikely to participate in a traditional survey, to learn about people in their natural
environment, to supplement traditional surveys, or to collect data when traditional
research methods are ineffective. The data may come from text, observation, interviews,
survey or focus groups and content analysis may be either inductive or deductive. An
inductive analysis reviews the data for common themes while the themes are pre-selected
in deductive analysis (Fink, 2003). Both deductive and inductive analyses were part of
this study’s data analysis.
Pilot Study
Pilot studies were performed to validate the survey tool data collection
effectiveness. The survey methodology for collecting data effectiveness was confirmed
with a pilot study survey sent to lean leaders, youth leaders and Western Michigan
University graduate students. Additional pilot survey items assessed the survey purpose
and question clarity as part of the survey validity assessment.
The electronic lean leader survey web-link was sent to each potential participant’s
e-mail address. The introductory e-mail containing the web-link is included as Appendix
113
K. The following question was asked after the survey questions to receive recommended
improvements. Please add comments regarding suggested changes to improve question
clarity.
Scales
Seven-point Likert style scales were used for items requiring perceived measures
on an ordinal scale. Lauver & Kristof-Brown (2002) used a 7-point Likert scale ranging
from strongly disagree to strongly agree to measure person-job fit survey items. Task
performance was measured for each of three tasks using a 7-point scale.
Research Type
The study is a mixed model of quantitative and qualitative research. It is
qualitative in that it collects descriptive information. Ex post facto research studies
relationships that can be determined but without experimental control using events that
have already occurred. This type of study is similar to a quasi-experiment as defined by
Cook and Campbell (1979); however, factors are not being manipulated so they would
define this study as a passive-observational study.
Quasi-experiment … comparisons depend on nonequivalent groups that differ from each other in many ways other than the presence of a treatment whose effects are being tested. The task confronting persons who try to interpret the results from quasi-experiments is basically one of separating the effects of a treatment from those due to the initial non-comparability between the average units in each treatment group; only the effects of the treatment are of research interest (Cook & Campbell, 1979, p. 6).
114
Cook and Campbell referred to this type of study in literature as either a
correlational method or non-experimental method for inferring cause from passive
observation. They created the new term, passive-observational study, to better describe
this type of research.
The methods … try to infer causal processes based on observations of concomitances as they occur in natural settings, without the advantage of deliberate manipulation and controls to rule out extraneous causal influences (Cook & Campbell, 1979, p. 295).
Variables in this study with known effects on the dependent variables were
collected to control their effects or to reduce unexplained variation. Statistical
assessments of covariance between variables tested in each hypothesis were conducted.
Causal modeling by path analysis was not conducted. See Figure 9 on page 82 for the
study model path diagram.
Cook and Campbell warned researchers that most path modeling causation conclusions are suspect when the researcher is not able to manipulate the cause. They also warned against attempts to validate a causal path because they require reductions in complexity and the elimination of possible causal connections (Cook & Campbell, 1979, p. 308).
The members of the two professional organizations were the target audience
representing a larger group of members and non-members. The selection of the
respondents was biased toward those who both read the organization newsletters and
were willing and able to complete the survey via the web-link.
115
Variables - Ordinal
1) Job Customization: The following two items measured job customization on a 7-
point Likert scale: The design of my job (assigned tasks, roles & responsibilities) has
been changed to better fit my knowledge, skills, abilities or characteristics, and Some
of my job tasks, roles or responsibilities have been changed to better utilize my
knowledge, skills, abilities or characteristics.
2) Job Satisfaction: The following two measures were included to measure job
satisfaction and its associated reliability: Considering all aspects of my job, my
overall level of job satisfaction is… (Castillo & Cano, 2004, p. 68) and Job
Characteristics Survey item 3.6: I feel a great sense of personal satisfaction when I
do this job well (Hackman & Oldham, 1980).
3) Task Effectiveness: Mean of perceived task performance for one to three tasks. A
measure weighted by individual task importance was compared with the mean of each
subject’s task assessments. The task performance mean correlations were stronger
with lower p-values.
4) Person -Job Fit: Person-job fit questions were measured with eight questions scored
on a seven-point Likert scale in order to assess correlations and check measurement
reliability. Person-job fit was measured in terms of demands-abilities fit, needs-
supplies fit and self-concept-job fit. Perceptions of fit as opposed to actual fit were
collected. The perception of fit better predicts outcomes (Cable & Judge, 1997).
116
Cable and DeRue (2002) expanded the definition of person-job fit to include both
demands-abilities (congruence between an employee’s skills and the job) and needs-
supplies (congruence between the needs of the employee and the rewards they receive
from their service on the job).
a) The following three items measured demands-abilities fit: The match is very good
between the demands of my job and my personal skills, My abilities and training
are a good fit with the requirements of my job, and My personal abilities and
education provide a good match with the demands that my job places on me.
Cable and DeRue (2002, p. 879) measured a reliability α = .84 for a multiple-firm
sample.
b) The following three items measured needs-supplies fit: There is a good fit
between what my job offers me and what I am looking for in a job. The attributes
that I look for in a job are fulfilled very well by my present job, and The job that I
currently hold gives me just about everything that I want from a job. Cable and
DeRue (2002, p. 879) measured a reliability α = .93 for a multiple-firm sample.
c) The following two items measured self-concept-job fit: The performance of my
job tasks makes me realize that I have several good qualities, and the
performance of my job tasks makes me feel good about the person that I am.
Scroggins (2007, p. 1655) measured coefficient alpha at 0.76 for a three-item
group of questions that contained these questions.
117
5) Intent to quit: The following three items scored on a 7-point Likert scale were
adapted from four O’Reilly items (O’Reilly, Chatman, & Caldwell, 1991) by Lauver
& Kristof-Brown (2001) to measure intent to quit: I would prefer another job to the
one I have now. If I have my way, I won’t be working for this company a year from
now. I have seriously thought about leaving this company. The three had a high α
correlation of 0.85 (p. 461). The questions were limited to the first two items given
that they are less ambiguous, clearly measure different dimensions, reliability needs
to be assessed, and unnecessary sensitive questions may lead to balking and
incomplete surveys.
6) Person – organization fit: The following two Cable and DeRue (2002) items
measured person-organization fit: The things I value in life are very similar to the
things my organization values and My personal values match the organization’s
values and culture.
7) Person-supervisor fit (P-S) and person-group fit (P-G): P-S and P-G fits were
assessed in the second version of the youth leader survey. These types of fit have a
lower correlation to perceived job satisfaction than P-O and P-J fits are less
commonly studied (Kristof-Brown et al., 2005a).
Variables – Categorical or Nominal Data
8) Job Description: The following questions measured job description existence,
accuracy, periodic review frequencies with supervisor(s) and customization.
118
Branching was used to skip irrelevant questions within the electronic survey based on
answers to previous questions. For example if a no response is received for question
number a then all remaining job description questions are skipped.
a) Do you have a job description for your current job? b) Is your job description used?
c) Have you and your supervisor identified gaps between your job description
requirements and your capabilities?
d) Do your task assignments have priorities?
e) Do you have estimates for your time allocation to each task?
f) My job description accurately describes by job responsibilities.
g) Do you and your Supervisor(s) review your job description periodically?
h) How frequently do you review your job description?
i) Who initiated the job design change?
j) Is your job description modified to reflect any of the following?
k) If tasks were eliminated from your job description then where were they
reassigned?
9) Kano Satisfaction Questions: The Kano analysis was performed to better understand
the importance of a change. It is used to help improve a product, service or process
(George, Rowlands, Price, & Maxey, 2005). A pair of Kano-styled questions were
asked to measure the job incumbent’s qualitative satisfaction expected from a custom
job description. The functional form of the question was: How would you feel if your
job description is customized to match your strengths, experiences and preferences?
119
The dysfunctional form of the question was: How would you feel if your job
description is a listing of job responsibilities common to most lean leaders? The
questions indicated if the job description customization is considered to be a Surprise
& Delight, More-is-Better, Must-Be or Dissatisfier.
10) Open Ended Question: The following open-ended questions were asked: How might
you and your supervisor(s) better design or use your job description in order to
improve your job effectiveness? And, Please think of a specific situation when your
job design was modified to enhance your effectiveness. Why and how was it
modified? Responses were categorized to report how and why jobs have been
effectively customized; however, the limited number of responses and terse
descriptions were inconclusive.
11) Task Assignment Tool Data Collection: Leader subjects selected a routine, problem
solving, and project oriented task from a list of three based on the perceived impact
on their job outcomes. They provided task assignment tool input parameter data by
responding to nine items for each of the three tasks assessed. They also provided
answers to 15 items that measured their task performance preferences.
Preferred Behavior Type
A combination of two survey items provided the inputs to assign the preferred
behavior levels as either: Dominance, Influence, Steadiness or Conscientiousness (DiSC).
Marston (1928) identified four primary emotions and associated behavioral responses,
120
which today Inscape Publishing (2004) describes as DiSC. The concepts of perceived
power and perceived favorability to the environment were created in the 1980s. These
concepts aligned with Marston’s work, but they were impractical for providing normal
emotions insight. Inscape Publishing found more contemporary language that supports
the Marston model and was more effective in conveying meaningful behavior that is
easily put into practice. The model as illustrated in Figure 15 has vertical and horizontal
dimensions with a moderate to strong correlations with the two DiSC dimensions
(Inscape Publishing, 2004).
Appendix F contains the Inscape Publishing, Inc. authorization agreement. The
preferred behavior items have been correlated to the results that would be collected from
the administration of the full 28 question DiSC instrument. The DiSC labels serve as
natural preferred behavior groupings as defined by the questions. The questions were
Source: Copyright 2004 by Inscape Publishing, Inc. All rights reserved. Used by permission of Inscape Publishing, Inc.
Figure 15. DiSC Dimensions
121
Large Sample Low Content Versus Smaller Sample High Content
The data were collected with a large sample and relatively less data than what
might be collected with a smaller sample data collection method. Surveying a large
population enables more precise statistical comparisons and the random sampling across
the population controls the effects of special causes of variation and demographics not
studied. Direct interviews or longer surveys were not performed; however, they would
enable the collection of data for additional variables and open-ended question feedback.
The additional data might enable the identification of unknown root-causes of variation
and the additional variables might enable partial correlation studies to better understand
the additional variable impact.
A survey of the two large populations is convenient due to the existence of
professional groups that have agreed to submit the survey to their large member
populations. The professional groups are also interested in reporting the results to their
constituencies. The cost, time, and quality of the data collection for the large quantity
survey are good due to the existence of electronic survey tools. However, the time
required to complete the survey, and associated data collected, must be minimized to
reduce the cost to the responders, to increase the response rate, and to reduce the response
error rate.
An electronic survey sent to members of two professional societies was selected
as the instrument for data collection. The samplings were considered a non-probability or
a convenience sample given that professional societies were chosen for each group. A
122
survey question also confirmed the participant’s primary job responsibility as either a
lean leader or youth leader.
Reliability
General Reliability
The information gathered was consistent because the wording was simple and the
questions were clear and precise. The pilot studies reduced measurement error by
identifying and clarifying items that were difficult to understand.
Equivalence and Internal Consistency
Alternate-form reliability was assessed by presenting two or more items for each
key study variable. Internal consistency among items measuring the same construct was
assessed using Cronbach’s alpha reliability test. Alpha values greater than 0.70 are
generally considered acceptable (Nunnally, 1983). Electronic and printed surveys
presented the survey items with common format and scales to reduce measurement error.
123
Validity
General Validity
Professionals in their respective fields assessed the validity of the study by
confirming that the instrument assessed what it is designed to measure. The additional
pilot survey items assessing the survey purpose and question clarity were part of the
validity assessment. Survey items from other validated studies identified in the literature
review were used when available.
Face and Content Validity
An initial survey version was tested for face and content validity. Four
professional youth leaders reviewed the youth leader survey and six lean professionals
reviewed the lean leader survey. The surveys were mailed to each of them with the
following instructions.
Open the attachment (file name) and critique the survey as if you were taking it. It will be sent in an electronic survey format but I think that the content is understandable in the WORD format. I would like your comments with regard to ambiguity; unclear terminology; questions that might lead you to balk and not complete the survey etc. Additionally, please think about the content. Did I miss key responsibilities or include the trivial? Does it make sense?
Survey feedback confirmed confusion over redundant questions designed to
assess question reliability; two questions were eliminated from both surveys. Changes to
124
correct terminology, grammatical errors, and requests to clarify the questions were
incorporated. The survey length was deemed reasonable and the purpose and content
were understood without help from the administrator. The definitions used within the
surveys are clear and each item asks a single question. Complete sentences were used
and abbreviations were avoided. Demographic questions that might be interpreted as too
personal or uninteresting are placed at the end of the survey to increase the percent of
participants who answer the key variable questions (Bourque & Fielder, 2003).
The face validity of the surveys was tested by three groups. Lean leader and
youth leaders reviewed their respective surveys. Western Michigan University graduate
students assessed the lean leader survey clarity, ease-of-use and time required to
complete. Feedback and changes were logged.
Criterion Validity
Regression analysis assessed the correlations among job satisfaction, task
performance, intent to quit, and P-J fit. Concurrent validity was assessed by comparing
the results to a previous study using the same questions. Scale reliabilities between
person-job fit and outcome measures were compared to Cable & DeRue’s (2002) study
results that administered the same person-job fit survey items. Outcome and person-job
fit correlations were compared to the (Kristof-Brown et al., 2005a) meta-analysis results.
Job customization questions comparing the fit of the job characteristics with job holder
KSACs were not identified in literature so concurrent validity was not tested. There is no
claim that the job customization measures or questions are better than an unknown
existing set of questions.
125
Construct Validity
A second version of the youth leader survey collected data to compare and
correlate the job customization measures with two other job design models in order to
measure the correlation between job customization variables with other factors known to
affect job satisfaction and intent to quit. The survey content is summarized in Table 12.
Table 12. Youth Leader Validation Survey Content
Questions from the Job Content Questionnaire (JCQ) were asked regarding
supervisor and co-worker social support, decision authority, feedback, and skill
discretion. Data from the JCQ were compared to national standards and correlated with
the job-customization questions. Questions regarding skill variety, task identity, task
significance, autonomy and feedback are job characteristics that are part of the Job
Characteristics Model that were asked. The characteristics measured in these two models
are expected to have positive correlations with the job customization questions. In
addition, the job customization questions should have similar strong positive correlations
Average # of Tasks Assessed per Survey 2.1 2.6 2.3
135
The actual number of surveys delivered to subjects was estimated but not
recorded given the processes for distributing the surveys. An actual return rate of 25
percent was estimated for surveys presented with a direct verbal request with a need
presentation. An actual return rate of five percent was estimated for direct e-mail
requests to the lean leader professional society. An actual return rate of two percent was
estimated for the monthly organization Newsletter participation requests. The estimated
return rates met expectations that were lowered due to the expected twenty-minute survey
completion time and the personal job assessment questions asked.
Sample Size
The quantity of samples required was driven by the quantity needed to develop
models that predict task performance for routine, problem solving and project tasks using
independent person-task fit and person characteristic variables. Tabachnick and Fidell
(2001) recommend the following formula for calculating sample size requirement: N >
50 + 8 m (where m = # of independent variables). The study sample sizes were large
enough to use 10 or 11 predictor variables for each of the routine, problem solving and
project task performance prediction multivariate models. Table 15 summarizes the
quantity and description of the person-task assessments. Task assessments were
requested for routine, problem solving and project tasks.
136
Table 15. Task Assessment Selection by Subject Group
Task Descriptions Task Type
# Responses Lean
Leader Youth Leader
Develop measurement systems
Project Tasks
29 Lead improvement events 47 Plan recognition events 3 Plan youth events 46 Raise funds 2 Recruit and train youth leaders 15 Audit project results to plan
Problem Solving Tasks
47 Facilitate improvement team meetings 14 Correct inappropriate person behaviors 21 4 Counsel youth 24 Evaluate and make corrections to programs or processes 33
Communicate to group and organization
Routine Tasks
21 25 Flow chart or characterize processes 43 Teach lean principles and tools 10 Track and record progress to goals 5 Visit youth (school, event, home, restaurant etc.) 32
Total Task Assessments by Subject Group 235 186
Response Times
The electronic surveys were placed on the Qualtrics web site for anonymous
responses to the survey. The electronic survey response times ranged from 3 minutes to
multiple hours as recorded from the Qualtrics statistics. The average response time for
those surveys taking less than 1 hour to complete was 13.7 minutes.
The descriptive results reports differences between the two subject groups,
demographics, perceived value of a customized position description, validity, person-
environment fit measurement comparison to a meta-analysis, and variable correlations.
The objective hypotheses evaluations are reported in Chapter V.
137
Subject Group Comparisons
Table 16 summarizes the measures where lean leaders and youth leaders reported
significantly different measurement levels. Confidence intervals are presented to show
the interval where the population mean difference is expected. The relative few
differences within the population data support the value of including both groups within
the study to better generalize the results.
Lean Leader Differences
When the lean leader group was compared to the youth leader group, lean leaders
reported higher intent to quit their job, higher overall task performance, and greater
expectation for being promoted to higher levels within their organization. Lean leaders
reported a higher preference for tasks that require working with, studying about, building
or repairing things and tasks that require working with numbers, analyzing numbers, and
keeping data records. Lean leaders indicated a greater preference for tasks that require
studying information, retaining it and using it and tasks where results are known and the
positive value to the organization is understood. Lean leaders show a greater preference
for thinking in terms of ideas, concepts, theories, creative thinking and research. Lean
leaders also characterized their preferred behavior as more questioning, more results
focused and direct. See Table 16 for a summary of the significant differences. The less
powerful non-parametric Mann-Whitney test for equal medians confirmed the differences
but did not indicate significant differences for promotion expectations or working in
terms of ideas, concepts, theories, creative thinking and research.
138
Table 16. Significant Differences Between Lean Leaders and Youth Leaders Measure Subject Groups Measured Difference (LL – YL)
Lean Leader Youth Leader 95% CI Lower 95% CI Upper P-value Job Satisfaction 5.66 6.03 -0.625 -0.107 0.006 Intent to Quit 3.76 2.79 0.502 1.442 0.000 Task Performance 5.80 5.48 0.037 0.583 0.026 Person-Org Fit 5.09 5.64 -0.898 -0.195 0.002 Person-Job Fit (Need-Supplies)
Prefer Ideas 6.20 5.71 0.126 0.849 0.009 2-Sample T-Test, Bold font indicates subject group with the highest measure level Scales: 1 - low to 7 - high; Promotability Scale: 1 - current level job to 3 – organization’s top-level jobs
Youth Leader Differences
When the youth leader group was compared to the lean leader group, youth
leaders reported greater satisfaction with their job, greater person-organization fit, and
greater needs-supplies job fit (needs being supplied by their job). Youth leaders had a
higher level of preference for tasks that require caring for, coaching, helping others and
tasks that allow them to be well liked and get along with others. Youth leaders had a
greater preference for tasks where guidance is given to clarify task expectations and for
tasks that have helpful training and specific instructions. Youth leaders also
characterized their preferred behavior as more accepting, enthusiastic, and sociable.
Table 16 reports a summary of the significant differences between the two subject
groups. The less powerful non-parametric Mann-Whitney test for equal medians did not
show significant differences for the work values of getting along or being well liked.
139
Demographics
The demographics are summarized in Tables 17 through Table 23. Lean leaders
were significantly older, more likely to be male, reported higher levels of education, and
had more years of experience as a leader than the youth leader group. Forty-five percent
of the lean leaders indicated that industrial engineering was the best description for their
post secondary degree(s). Thirty-one percent of the youth leaders reported that one or
more of their degrees focused on the youth leader job.
There was a significant positive correlation between the job customization
measure and reported age with a p-value of 0.004**. Table 17 reports statistics for age
by subject groups. The least square and rank order regression equations are summarized
in Table 18. Rank order regression is a non-parametric technique.
There were significant differences between gender and three of the fifteen
personal preferences. There were no significant differences for the lean leader group but
there were significant differences among youth leaders when analyzed by gender. The
three variables were not included in the three person-task fit assignment models. See
Table 19 for a summary of gender occurrence by subject group and Table 20 for a
summary of the differences by gender.
Table 19. Gender by Group
Gender Lean Leader Youth Leader # % # %
Male 62 75.6% 62 48.1% Female 20 24.4% 67 51.9%
Table 20. Gender Differences
Question Values = Male – Female
Lean and Youth Leader
Lean Leader
Youth Leader
“I prefer tasks that require working with, studying about, building or repairing things.”
1.0 No Sig. Δ
2.5
0.000*** 0.011* “I prefer tasks that require studying information, retaining it and using it.”
1.0 No Sig. Δ
1.0
0.008** 0.008** “I prefer tasks that require caring for, coaching, or helping others.”
1.0 No Sig. Δ
1.0
0.004** 0.041* Kruskal-Wallis Median Test Table reports the differences between the gender averages and p-values p-value significance indicators: *** 0.000, ** < 0.01, * < 0.05
141
The non-parametric Mood Median test for equal medians indicated that there
were no significant differences in the frequency of job customization, job outcomes or
person-environment fit by education level. However, there were significant differences
for lean leader education level in measures of person-job fit, intent to quit. Table 21 lists
the reported education level of both subject groups.
Table 21. Education Level by Group Highest Degree
Lean Leader Youth Leader # % # %
High School 0 0% 12 9%
Associate 2 2% 8 6%
Bachelor 32 39% 58 45%
Masters 43 52% 48 37%
Doctorate 3 4% 0 0%
None of Above 2 2% 3 2%
Lean leaders with associate’s degrees reported significantly lower levels of
person-job fit than those with masters and doctorate degrees and those with a bachelor’s
degrees reported significantly lower levels of person-job fit than those with doctorate
degrees. Those with associate degrees reported a significantly greater intent to quit than
those with a doctorate degree.
There were significant correlations between leader role experience and both task
performance (r= 0.249**, p = 0.003) and job demand-abilities fit (r = 0.158*, p = 0.023).
The lean leader’s perception of both task performance and job demand-abilities fit were
positively correlated with on-the-job experience. There were no other significant
correlations between job experience and job customization, job outcomes or person-
142
environment fit. Table 22 summarizes the responses for: How many years have you held
a title similar to (lean or youth) leader?
Table 22. Experience in Job Similar to Leader Role
Using the non-parametric Mood Median test for equal medians there were no
significant differences in the frequency of job customization, job outcomes or person-
environment fit by lean leader education discipline.
Table 23 lists the reported education discipline frequency for lean leaders. Thirty-
one percent of youth leader degrees focused on youth leadership.
Kano style functional and dysfunctional questions were asked to identify the
expected effect of both the presence and absence of a job description that was customized
for the incumbent. The following two questions were asked:
Functional Question: How would you feel if your current job description was customized to better match your knowledge, skills, attributes and characteristics? Dysfunctional Question: How would you feel if your current job description is a listing of job responsibilities common to most (youth or lean depending on survey) leaders?
Table 35 summarizes the response classification coding logic. Table 36
summarizes the results from the Kano assessment.
Table 35. Kano Responder Satisfaction Coding
Question Responses
Dysfunctional Question Like it that way
Should be that way
Neutral Live with it that way
Dislike it that way
Func
tiona
l Like Q R D D O Should be R Q D D M Neutral I -D I I M Live with I -D I I M Dislike O MNB I I Q
D: Delighter, I: Indifferent, M: Must-Be, O: One-Dimensional, Q: Questionable Result R: Reverse, MNB: Must not Be
Table 38 presents the correlation matrix and Table 39 presents the non-parametric
Rank Order Correlation. Tables 28 and 29 on page 152 confirmed a significant positive
correlation between person-job fit and job customization for both the youth leaders and
lean leader subject groups.
Table 38. Job Customization and Person-Job Fit Correlation Matrix Measure Custom Job Demand-
Abilities Need-
Supplies Person-Job Fit 0.350 Med
0.000*** Demand-Abilities 0.300 Med
0.000*** Need-Supplies 0.312 Med 0.691 Hi
0.000*** 0.000*** Self-Concept-Job 0.286 Low 0.641 Hi 0.566 Hi
0.000*** 0.000*** 0.000*** Note: DA, NS and SCJ fits are components of Person-Job fit Table presents Pearson’s correlation coefficients (r) and p-values. p-value significance indicators: *** 0.000, ** < 0.01, * < 0.05 Table 39. Job Customization and Person-Job Fit Rank Order Correlation
Note: DA, NS and SCJ fits are components of Person-Job fit Table presents Spearman’s Rank Order Correlation Coefficients and Test of Concordance p-values. p-value significance indicators: *** 0.000, ** < 0.01, * < 0.05
157
Objective 1b - Customized Job Design and Outcomes
Assess the value of the redesign of a knowledge worker’s job to better fit the job
incumbent’s knowledge, skill, abilities and characteristics (KSAC) in terms of job
outcomes. This hypothesis was expected to confirm a positive correlation between
knowledge worker self-reported degree of job customization and outcomes of self-
reported job satisfaction and task performance. A negative correlation was expected
between job customization and intent to quit.
1b Null Hypothesis
There will be no significant difference in self-reported job satisfaction, task
performance or intent to quit between knowledge workers who have customized jobs and
those who do not.
Results
The null hypothesis was rejected for job satisfaction and intent to quit. The
hypothesis was supported for job satisfaction and intent to quit. The hypothesis was
rejected for the task performance. The evidence supports a positive difference between
the job customization measure and the outcomes of job satisfaction and intent to quit.
There was not enough evidence to reject the hypotheses for average task
performance. Task performance was measured as an average of the one to three tasks
that each respondent self-assessed. Tables 29 on page 152 confirmed a significant
positive correlation between job customization and the measures of job satisfaction,
158
intent to quit and task performance for youth leaders. Therefore, the youth leader
performance for the selected tasks was significantly correlated with the outcomes.
However, Table 28 on page 152 presents a low insignificant correlation between job
customization and task performance for lean leaders.
The correlation coefficients for lean leader job customization and the outcome
variables of job satisfaction and intent to quit would have significant p-values less than
0.05 if their sample size quantities were 89 for job satisfaction and 113 for intent to quit.
The actual sample sizes were 80 for job satisfaction and 79 for intent to quit.
Table 40 summarizes the regression results, Table 41 presents the correlation
matrix, and Table 42 presents the non-parametric Rank Order Correlation. Table 28 on
page 152 reported significant positive correlations between job customization and the
outcome measures of job satisfaction and intent to quit. Table 29 on page 152 reported
significant correlations between job customization and the measures of job satisfaction
and intent to quit for lean leaders; however, increasing the sample size by 34 would have
resulted in a significant correlation between job customization and intent to quit.
Increasing the sample size by nine would have resulted in a significant correlation for job
1 Non-significant correlations with task performance. Eliminated 10 variables.
2 High bivariate correlations > 0.70. Eliminated training and either knowledge or skill from each task type model.
3 Iterative Process: Highest p-value and small contribution to R².
Eliminated 3 variables and reduced the number of significant predictive variables
by task type.
Table 50 records the independent variable correlations with task performance for
each of the three task types of problem solving, project and routine. The table also
indicates those variables that were eliminated from each of the three data reduction steps.
The second step eliminated variables with strong bivariate correlations.
Tabachnick and Fidell (2001) recommend considering removal of variables with bivariate
correlations greater than 0.70. High bivariate correlations between skill, knowledge and
training resulted in the elimination of the level of training variable. High correlations
(e.g.: r = 0.840 for routine tasks) between knowledge and skill caused the elimination of
either the task or skill independent variable from each task type predictor equations. Two
predictor variables were eliminated from step two.
167
Table 50. Task Performance and Independent Variable Correlation Matrix Independent Variable \ Task Type Y1:
Problem Solving
Y2: Project
Y3: Routine
Y1+Y2
+Y3 Step #
Reduced
Promo: Promotable to higher levels of org -.007 -.031 -.023 0.069 1
TaskLess: Desire to perform task type less .171* -.012 .124 0.141** 3 TaskKnow: Knowledge to perform task .665*** .548*** .560*** 0.624*** (2) TaskSkill: Skills to perform tasks .697*** .516*** .630*** 0.603*** (2) TaskAbility: Abilities to perform task .521*** .353*** .477*** 0.441*** TaskTrain: Fully trained .574*** .442*** .504*** 0.497*** 2 Grade: Task matches job grade or level -.011 .014 .009 0.006 1 Career: Career Plan Fit with Task .408*** .267** .251** 0.3*** MatDiSC: Preferred behavior type task fit .166* .137 .219* 0.166** Preferences: Things: Working with things -.140 .053 .097 0.012 1 Numbers: Working with numbers .034 .079 .059 0.059 1 Study: Studying and using info. -.075 .004 -.020 -0.028 1 TakeCharge: Taking responsibility .007 .309*** .124 0.153** HelpOthers: Caring, helping & coaching .173* .130 .164 0.153** 3 Independent: Working independently -.056 -.033 -.135 -0.076 1 GetAlong: Getting along with others .083 .177* -.077 0.059 3 Positive: Know task positive value to org. .127 .229** .056 0.134** Team: Be integral part of a team .197* .195* .130 0.171*** Guide: Tasks with guidance is given .001 -.038 .092 0.019 1 Ideas: Thinking in ideas & possibilities .187* .302*** .132 0.207*** Plan: Organization & planning ahead .077 .258** .285** 0.213*** Freedom: Choose when & how to perform -.044 .074 -.101 -0.022 1 Talk: Prefer open conversation .067 .155 -.059 0.054 1 Read: Prefer written & visual information -.055 -.014 -.052 -0.039 1 Table presents Pearson’s correlation coefficients (r) Bold font: Indicates API person-task performance predictive independent variables p-value significance indicators: *** 0.000, ** < 0.01, * < 0.05 (2): Knowledge and Skill were highly correlated so only the highest correlated variable is included.
The multiple regression method was applied in the third step to develop a best fit
linear equation for predicting task performance for each task type. The total number of
predictive variables for each task type must be ten or less given the sample size by task
type; however, minimizing the number of measures without losing predictive value
improves the resulting tool’s ease-of-use. Measures were eliminated iteratively by
selecting the variable with the highest p-value and low beta coefficient. Those variables
with negative coefficients, due to over fitting, were eliminated during this process. The
following three variables were eliminated from all three task type equations: 1)
168
Preference for caring for helping or coaching others, 2) Preference for getting along
with others and 3) Desire to perform the task type less. Step 3 of the data reduction
process reduced R2 values by 0.9 for each task type. Appendix Z presents the multiple
regression data from the beginning and end of the third step of the data reduction process.
The reduction process for each task type was complete when an incremental variable
reduction created a (0.20 to 1.0) reduction in R2 values as reported in Appendix Z.
Fifteen independent variables were eliminated from the task performance
prediction model. Table 51 summarizes the variables that were eliminated from the
model.
169
Table 51. Independent Variables Eliminated from Model Variable Question & Scale
Freedom I prefer tasks that allow personal freedom to choose when and how to perform. Scale: 1 = Strongly Disagree to 7 = Strongly Agree
Get Along I prefer tasks that allow me to be well liked and get along with others. Scale: 1 = Strongly Disagree to 7 = Strongly Agree
Guidance I prefer tasks where guidance is given to clarify task expectations and the tasks have helpful training and specific instructions. Scale: 1 = Strongly Disagree to 7 = Strongly Agree
Help Others I prefer tasks that require caring for, coaching, or helping others. Scale: 1 = Strongly Disagree to 7 = Strongly Agree
Independence I prefer tasks that require working independently and making my own decisions.” Scale: 1 = Strongly Disagree to 7 = Strongly Agree
Job Grade The task requires more capability and effort than what should be expected form my current job level. Scale: 1 = Strongly Disagree to 7 = Strongly Agree
Numbers I prefer tasks that require working with numbers, analyzing numbers and keeping data records. Scale: 1 = Strongly Disagree to 7 = Strongly Agree
Performance Overall
I believe that I perform the SELECTED TASK well. Average of 1 to 3 ratings. Scale: 1 = Strongly Disagree to 7 = Strongly Agree
Promotion Which level of job demands do you feel capable of performing? 1 = current job level demands, 2=next level of more demanding jobs, 3= Organization’s top level jobs
Reading I prefer tasks that require reading from written materials, computers or other visual sources of information. Scale: 1 = Strongly Disagree to 7 = Strongly Agree
Studying I prefer tasks that require studying information, retaining it and using it. Scale: 1 = Strongly Disagree to 7 = Strongly Agree
Talking I prefer tasks that require learning through open conversation and explanations. Scale: 1 = Strongly Disagree to 7 = Strongly Agree
Things I prefer tasks that require working with, studying about, building or repairing things. Scale: 1 = Strongly Disagree to 7 = Strongly Agree
Training I am fully trained to perform the task well. Scale: 1 = Strongly Disagree to 7 = Strongly Agree
Type Task Frequency
Would you like to allocate more or less of your work time to this TASK TYPE of task similar to the three listed? Scale: 1= more, 2= same, 3= less
There were ten significant independent variables included in the model. The
definition and measurement scale for each predictive variable included in the model are
170
recorded in Table 52. The correlation matrices for all ten variables by task type are
I have the abilities or general capability to perform the task well. I have the necessary physical, mental, financial and positional power. Scale: 1 = Strongly Disagree to 7 = Strongly Agree
CP: Task Career Plan Fit
The task fits my career plan well. Scale: 1 = Strongly Disagree to 7 = Strongly Agree
ID: Ideas I prefer tasks that require thinking in terms of ideas and possibilities. They might require working with concepts or theories, idea generation, creative thinking or research. Scale: 1 = Strongly Disagree to 7 = Strongly Agree
KN: Task Knowledge
I have the knowledge, identifiable factual information, familiarity, awareness, or understanding gained through experience or study necessary to perform the task well. Scale: 1 Strongly Disagree to 7 Strongly Agree
PB: Preferred Behavior
Binary: 1 = Persons preferred behavior type matches that necessary to perform the job well. 0 = behavior type does not match.
PL: Plan I prefer tasks that require organization with daily events planned ahead. Scale: 1 = Strongly Disagree to 7 = Strongly Agree
PV: Positive Value
I prefer tasks where results are known and the positive value to the organization is understood. Scale: 1 = Strongly Disagree to 7 = Strongly Agree
SK: Task Skill I have the skills, ease of movement and the dexterity acquired or developed through training or experience that is necessary to perform the task well. Scale: 1 = Strongly Disagree to 7 = Strongly Agree
TC: Take Charge
I prefer tasks that require taking responsibility for others work and taking charge. Scale: 1 = Strongly Disagree to 7 = Strongly Agree
TE: Team I prefer tasks that require being an effective and integral part of a team. Scale: 1 = Strongly Disagree to 7 = Strongly Agree
The Assignment Priority Index (API) model is found in Equation 2. Equation 3
contains the parameters and coefficients summarized in Table 53.
Adler, P. S. (1999). Building better bureaucracies. The Academy of Management
Executive, 13(4), 14.
Alberto, C., & Giovanni, R. (2006). A Branch-and-Price Algorithm for the Multilevel Generalized Assignment Problem. Operations Research, 54(6), 1172.
Albright, S.C. (2001). VBA for Modelers, Pacific Grove, CA: Duxbury
Anderson, D. R., Sweeney, D. J., & Williams, T. A. (Eds.). (2004). Quantitative Methods for Business. Mason, Ohio: Thomson South-Western.
Bakke, D. W. (2005). Joy at Work. Seattle, WA: PVG.
Barna, G. (2001). Pastors Paid Better, But Attendance Unchanged. In G. Barna (Ed.): The Barna Group.
Blanchard, K. (2001). Situational Leadership II - The Article. San Diego: Ken Blanchard Compainies.
Bourque, L. B., & Fielder, E. P. (2003). How to Conduct Self-Administered and Mail Surveys. Thousands Oaks, CA: Sage Publications, Inc.
Bradford D. Smart, P. D. (1999). Topgrading. Paramus, NJ: Prentice Hall, Inc.
Byars, L. R., Leslie. (2006). Human Resource Management (Eighth ed.). Boston, MA: McGraw-Hill Irwin.
Cable, D., & DeRue, D. S. (2002). The convergent and discriminant validity of subjective fit perceptions. . Journal of Applied Psychology, 87(5), 10.
Cable, D. M., & Judge, T. A. (1997). Interviewers’ perceptions of person–organization fit and organizational selection decisions. Journal of Applied Psychology, 82, 16.
Caldwell, D., & O'Reilly, C.A. (1982). Task perceptions and job satisfaction: A question of causality. Journal of Applied Psychology, 67(3), 9.
Campion, M. A. (1988). Interdisciplinary Approaches to Job Design: A Constructive Replication with Extensions. Journal of Applied Psychology, 73(3), 14.
Campion, M. A., & Berger. (1990). Conceptual Integration and Empirical Test of Job Design and Compensation Relationships. Personnel Psychology, 43(3), 28.
Campion, M. A., Mumford, T. V., Morgeson, F. P., & Nahrgang, J. D. (2005). Work redesign: Eight obstacles and opportunities. Human Resource Management, 44(4), 367-390.
197
Castillo, J. X., & Cano, J. (2004). Factors Explaining Job Satisfaction in Faculty. Journal of Agricultural Education, 45(3), 9.
Choppin, J. (1996). Total quality appraisals. Managing Service Quality, 6(4), 3.
Clancey, W. J., Sachs, P., Sierhuis, M., & Hoof, R. v. (1998). Brahms: Simulating Practice for Work Systems Design. International Journal of Human-Computers Studies.
Cook, T. D., & Campbell, D. T. (1979). Quasi-Experimentation Design & Analysis Issues for Field Settings. Boston: Houghton Mifflin Company.
Daniels, W. R. (1995). Breakthrough Performance: Managing for Speed and Flexibility: ACT Publishing
Davenport, T., Thomas, R., & Cantrell, S. (2002). The mysterious art and science of knowledge-worker performance. MIT Sloan Management Review, 44(1), 7.
Denscombe, M. (2006). Web-Based Questionnaires and the Mode Effect: An Evaluation Based on Completion Rates and Data Contents of Near-Identical Questionnaires Delivered in Different Modes. Social Science Computer Review, 24, 8.
Drucker, P. (1999). Knowledge-worker productivity: the biggest challenge. California Management Review, 41(2), 6.
Edwards, J. R. (1991). Person–job fit: A conceptual integration, literature review, and methodological critique. International Review of Industrial and Organizational Psychology, 6, 75.
Emiliani, M. L. (2003). Linking leaders’ beliefs to their behaviors and competencies Management Decision, 41(9), 893-910.
Fiermonte, R. V. (2006). The effectiveness of position descriptions in the hiring of entry level employees: A survey of the Society for Human Resource Management in Tampa, Florida. Unpublished Ph.D., Capella University, United States -- Minnesota.
Fink, A. (2003). The Survey Handbook (2nd ed.). Thousand Oaks, CA: Sage Publications, Inc.
Gaetan, C., Pierre, H., & Brigitte, J. (1999). The assignment problem with seniority and job priority constraints. Operations Research, 47(3), 449.
Gazzara, D. K. D. (2004, 12-13 Aug. 2004). Using task-quotient (TQ) to maximize individual motivation & job satisfaction. Paper presented at the Engineering Management Conference, 2004 IEEE/UT.
198
Gazzara, K. D., D.M. (2003). The relationships among the mixture of task types, performance, satisfaction, and the implications for flow. University of Phoenix, Arizona.
George, M. L., Rowlands, D., Price, M., & Maxey, J. (2005). The Lean Six Sigma Toolbook. New York: McGraw-Hill.
Gilbert, G. R., Sohi, R. S., & McEachern, A. G. (2008). Measuring work preferences: A multidimensional tool to enhance career self-management Career Development International 13(1), 23.
Gilbert, L. (2001). The Big Book of Job Descriptions for Ministry. Ventura CA: Gospel Light.
Gilbreth, F. B., & Kent, R. T. (2008). Motion Study: A Method for Increasing the Efficiency of the Workman (1911). Whitefish, MT: Kessinger Publishing, LLC.
Grant, P. C. (1989). Multiple Use Job Descriptions: a guide to analysis, preparation, and applications for human resource managers (1 ed.). Westport: Quorum Books.
Grant, P. C. (1997). Job descriptions: What's missing. Industrial Management, 39(6), 9.
Griffin, C. (2002). Job Carving: A Guide for Job Developers and Employment Specialists.
Griffin, R., & McMahan, G. (1994). Motivation Through Job Design. In J. Greenberg (Ed.), Organizational Behavior (pg 23-43 ed., pp. 21). Hillsdale, NJ: Lawerence Erlbaum Associates.
Hackman, R. J., & Oldham, G. R. (1980). Work Redesign: Addison-Wesley Publishing Company.
Hair, J. F., JR., Anderson, R. E., Tatham, R. L., & Black, W. C. (1995). Multivariate Data Analysis (4th ed.). Englewood Cliffs, New Jersey: Prentice Hall.
Hersey, P., & Blanchard, K. H. (1993). Management of Organizational Behavior (6th ed.). Engelwood Cliffs, NJ: Prentice Hall.
Herzberg, F. (1968). One More Time: How Do You Motivate Employees? Harvard Business Review, 15.
Holland, i. L. (1985). Making vocational choices (2nd ed.). Englewood Cliffs, NJ: Prentice-Hall.
Humphrey, S.E., Nahrgang, J.D., & Morgeson, F.P. (2007). Integrating motivational, social, and contextual work design features: A meta-analytic summary and theorectical extension of the work design literature. Journal of Applied Psychology, 92, 1332-1356
Joison, C. (2001). Refocusing Job Descriptions. HR Magazine, 46(1), 7.
Judge, T., & Bono, J. E. (2001). Relationship of core self-evaluations traits--self-esteem, generalized self-efficacy, locus of control, and emotional stability--with job satisfaction and job performance: A meta-analysis. Journal of Applied Psychology, 81(1), 13.
Karasek, R., Brisson, C., Kawakami, N., Houtman, I., Bongers, P., & Amick, B. (1998). The Job Content Questionnaire (JCQ): An Instrument for Internationally Comparative Assessments of Psychosocial Job Characteristics. Journal of Occupational Health Psychology, 3(4), 322-355.
Kennington, J., & Wang, Z. (1992). A Shortest Augmenting Path Algorithm for the Semi-Assignment Problem. Operations Research, 40(1), 178.
Kristof-Brown, A., Barrick, M. R., & Stevens, C. K. (2005b). When Opposites Attract: A Multi-Sample Demonstration of Complementary Person-Team Fit on Extraversion Journal of Personality, 73(4), 24.
Kristof-Brown, A., & Jansen, K. J. (2006). Toward a Multidimensional Theory of
Person-Environment Fit. Journal of Managerial Issues, 18(2), 19.
Kristof-Brown, A. L., Zimmerman, R. D., & Johnson, E. C. (2005a). Consequences of Individuals' Fit at Work: A Meta-Analysis of Person-Job, Person-Organization, Person-Group, and Person-Supervisor Fit. Personnel Psychology, 58(2), 281-342.
Kristof, A. L. (1996). Person-organization fit: An integrative review of its conceptualizations, measurement, and implications. Personnel Psychology, 49(1), 1.
Labor, U. S. D. o. (2008). Occupational Outlook Handbook, 2008-09 edition (Publication no. http://www.bls.gov/oco/home.htm). Retrieved April 26, 2008, from Bureau of Labor Statistics:
Lauver, K. J., & Kristof-Brown, A. (2001). Distinguishing between Employees’ Perceptions of Person–Job and Person–Organization Fit. Journal of Vocational Behavior, 59, 17.
Leung, Y. T. (2005). The Case for the Business Process Engineer [Electronic Version] from http://domino.research.ibm.com/library/cyberdig.nsf/papers/C742AED2667D171C8525704B004D4E48/$File/rj10355.pdf.
Levine, E. L., Ash, R. A., Hall, H., & Sistrunk, F. (1983). Evaluation of Job Analysis Methods by Experienced Job Analysts. The Academy of Management Journal, 26(2), 339-348.
Liker, J. K., & Meier, D. P. (2007). Toyota Talent. New York: McGraw-Hill.
Lummis, A., Nieman, J., Roozen, D., & Thumma, S. (2010). Approximate Distribution of U.S. Protestant and Other Christian Churches by size from http://hirr.hartsem.edu/research/fastfacts/fast_facts.html#numcong
Luthans, F. (2005). Organizational Behavior (10 ed.). New York, NY: McGraw-Hill.
Marcus, B., Bosnjak, M., Lindner, S., Pilischenko, S., & Schutz, A. (2007). Compensating for Low Topic Interest and Long Surveys: A Field Experiment on Nonresponse in Web Surveys. Social Science Computer Review, 25, 12.
Marston, W. M. (1928). Emotions of Normal People. New York: Harcourt, Brace and Company.
Merino, D. N. (2007, November, 2007). The American Society for Engineering Management (ASEM) Engineering Management Body of Knowledge (EM BoK). Paper presented at the American Society of Engineering Management (ASEM) Annual Conference Proceedings.
Miner, A. S. (1990). Structural Evolution Through Idiosyncratic Jobs: The Potential for Unplanned Learning. Organization Science, 1(2), 195-210.
Miner, A. S. (1991). Organizational Evolution and the Social Ecology of Jobs. American Sociological Review, 56(6), 772-785.
Morgeson F.P., & Humphrey, S.E. (2008) Job and team design: Toward a more integrative conceptualization of work design, Research in Personnel and Human Resources Management, 27, 39-91
Morgeson F.P., & Humphrey, S.E. (2006) The Work Design Questionnaire (WDQ): Developing and Validating a Comprehensive Measure for Assessing Job Design and the Nature of Work. Journal of Applied Psychology, 91(6), 1321-1339
Motowidlo, S. J., & Van Scotter, J. R. (1994). Evidence that task performance should be distinguished from contextual performance. Journal of Applied Psychology, 79(4), 6.
Nunnally, J. C. (1983). Psychometric Theory. New York: McGraw-Hill.
O’Reilly, C. A., III. (1977). Personality–job fit: Implications for individual attitudes and performance. Organizational Behavior and Human Performance, 18, 11.
O’Reilly, C. A., III, Chatman, J., & Caldwell, D. F. (1991). People and organizational culture: A profile comparison approach to assessing person-organization fit. Academy of Management Journal, 34, 30.
Oldham, G. R., & Hackman, J. R. (2005). How Job Characteristics Theory Happened. In K. G. Smith & M. A. Hitt (Eds.), Great Minds in Management: The Process of Theory Development (1 ed., pp. 28). USA: Oxford University Press.
Oldham, G. R., Hackman, J. Richard, Kulik, Carol T. (1987). Work design as an approach to person-environment fit. Journal of Vocational Behavior, 31(3), 18.
Porter, S. R., & Whitcomb, M. E. (2005). E-mail Subject Lines and Their Effect on Web Survey Viewing and Response. Social Science Computer Review, 23, 8.
Riss, U.V., Rickayzen, A., Maus, H., van der Aalst, W. (2005). Challenges for Business Process and Task Management, Journal of Universal Knowledge Management 0(2), 77.
Scroggins, W. A. (2003). Selection, meaningful work and employee retention: A self-concept based approach to person-job fit New Mexico State University.
Scroggins, W. A. (2007). An examination of the additive versus convergent effects of employee perceptions of fit. Journal of Applied Social Psychology, 37(7), 17.
Smart, B. D., Ph.D. (1999). Topgrading. Paramus, NJ: Prentice Hall, Inc.
Smith, A., Osborne, G., & Wright, J. (2007). The Wealth of Nations: With a Foreword by George Osborne, MP and an Introduction by Jonathan B. Wright, University of Richmond Petersfield, UK: Harriman House.
Soukhanov, A. H. (Ed.) (1992) The American Heritage Dictionary of the English Language (3rd ed.). Boston: Houghton Mifflin Company.
Tabachnick, B. G., & Fidell, L. S. (2001). Using multivariate statistics (4th ed.). New York: Harper Collins.
Taylor, F. W. (1911). The principles of scientific management.. New York: Harper & Bros.
Vickery, S. K., & Narasimhan, R. (1988). An Experimental Evaluation Of Articulation Of Preferences. Decision Sciences, 19(4), 9.
Visser, C., Altink, W., & Algera, J. (1997). From job analysis to work profiling. Do traditional procedures still apply?
Weber, M. (Ed.). (1968). Economy and Society. New York: Bedminister Press.
Wilkinson, L., & Zwanenberg, N. v. (1994). Development of a Person Specification System for Managerial Jobs Personnel Review, 23(1), 2.
202
Wrzesniewski, A., & Dutton, J. E. (2001). Crafting a Job: Revisioning Employees as Active Crafters of Their Work. The Academy of Management Review, 26(2), 179-201.
203
Appendix A
Lean Leader Job Design Survey
204
Lean Leader Job Design Survey
Note: (Text entered parenthetically with an italic font describes the survey methodology and will not be included in the final survey. The survey will be administered electronically) Consent: You are invited to participate in a research project titled "Development of a Task Assignment Tool to Customize Job Descriptions to Close Job Specification and Person-Job Fit Gaps". The study is designed to analyze the effects of job customization and to develop a task assignment tool to improve a work groups person-job fit by better matching a job incumbent’s skills, knowledge, abilities and characteristics to their assigned tasks. The study is being conducted by Dr. Larry Mallak and Graduate Student Bryan Booker from Western Michigan University, Department of Industrial & Manufacturing Engineering. This research is being conducted as part of the dissertation requirements for Bryan Booker.
This survey instrument is comprised of 70 to 83 multiple choice and 2 open ended questions. The survey should take approximately 20 minutes to complete. Your replies will be completely anonymous, so do not put your name anywhere on the form. You may choose to not answer any question and simply leave it blank. Participation is voluntary. This consent document was approved for use for one year by Western Michigan University's HSIRB on _______. Do not participate after ________. Completing the survey indicates your consent for use of the answers you supply. If you have any questions, you may contact Larry Mallak at 269-276-3369, Bryan Booker at 616-886-9222, the Human Subjects Institutional Review Board (269-387-8293) or the vice president for research (269-387-8298).
Survey Purpose: To measure and better understand the relationship between a Lean Leader’s job design, job satisfaction and job effectiveness. The data will be used to develop a knowledge worker task assignment tool to improve Person-Job fit.
Instructions: Please indicate your response selection by filling the appropriate circle or responding to the open ended questions.
About your job description… 1) The following questions are regarding your responsibilities and job description:
a) “Some of my job tasks, roles or responsibilities have been changed to better
utilize my knowledge, skills, abilities or characteristics.” Strongly Disagree 1 2 3 4 5 6 7 Strongly Agree
b) Do you have a job description for your current job? Yes No (if No then skip 1c-k)
c) How would you feel if your current job design and description were customized to better match your knowledge, skills, attributes and characteristics? (Choose one best answer)
I would like it that way. It should be that way. I am neutral. I could live with it that way. I would dislike it that way. None of the above.
d) How might you and your supervisor(s) better design or use your job description in order to improve your job effectiveness? ____________________________________________________________________________________________________________________________________
f) Do you or your supervisor use your job description? Yes No (if No then skip 1g-j)
g) Have you and your supervisor identified gaps between your job requirements and your knowledge, skills, and abilities?
Yes No
h) Are your assigned tasks prioritized by importance within your job description? Yes No
i) Do you have an expected amount of time that you should allocate to each task included in your job description?” Yes No
206
j) Do you and your supervisor(s) review your job description periodically? Yes No (If no then skip 1.j.i) i) How frequently do you review your job description?
Monthly Quarterly Six months Annually Bi-Annually None of the above
k) How would you feel if your current job description is a listing of job responsibilities common to most lean leaders? (Choose one best answer)
I would like it that way It should be that way I am neutral I could live with it that way I would dislike it that way None of the above
About your job…
2) The following 15 questions are regarding your satisfaction or fit with your
organization and your job. a) D-A “My abilities and training are a good fit with the requirements of my job.” Strongly Disagree 1 2 3 4 5 6 7 Strongly Agree
b) JS “Considering all aspects of my job, my overall level of job satisfaction is…”
Very Dissatisfied 1 2 3 4 5 6 7 Very Satisfied
c) N-S “There is a good fit between what my job offers me and what I am looking for in a job.” Strongly Disagree 1 2 3 4 5 6 7 Strongly Agree
d) ITQ “I would prefer another job to the one I have now.” Strongly Disagree 1 2 3 4 5 6 7 Strongly Agree
e) Self-Concept-Job “The performance of my job tasks makes me realize that I have several good qualities.” Strongly Disagree 1 2 3 4 5 6 7 Strongly Agree
207
f) P-O “The things I value in life are very similar to the things my organization values.”
Strongly Disagree 1 2 3 4 5 6 7 Strongly Agree g) D-A “My personal abilities and education provide a good match with the demands
that my job places on me.” Strongly Disagree 1 2 3 4 5 6 7 Strongly Agree
h) PROMO Which level of job demands do you feel capable of performing in the future?” Current job level demands Next level of more demanding jobs Organization’s top level jobs
i) N-S “The attributes that I look for in a job are fulfilled very well by my present
n) Self-Concept-Job “The performance of my job tasks makes me feel good about
the person that I am.” Strongly Disagree 1 2 3 4 5 6 7 Strongly Agree
o) P-O “My personal values match the organization’s values and culture.” Strongly Disagree 1 2 3 4 5 6 7 Strongly Agree
208
About your lean responsibilities…
3) The following question(s) are about your lean responsibilities: a) Do your job responsibilities include lean leadership?
Yes No (If no then skip to 5)
b) Is your lean leadership role your primary job responsibility? Yes No
c) How many years have you held a job title similar to lean leader? 0 - 1 2 – 6 7 – 11 12 – 16 17 – 21 22 – 26 27 – 31 32 – 36 37 – 41 42+
d) How many people work in the organization that your job interacts with? 1 - 50 51 - 150 151 – 350 351 – 750 751 – 1550 1551 - 3150 >3150
About your current job responsibilities …
4) The next questions will focus on tasks for your current job responsibilities as a lean leader: a) Which one of the following tasks has the greatest impact on your job outcomes? Develop measurement systems Lead improvement events Plan recognition or celebration events
i) Would you like to allocate more or less of your work time to project tasks
similar to the above? More Current or Same Less
ii) “The “TASK SELECTED IN PART a” task is critical for my job’s success.” Strongly Disagree 1 2 3 4 5 6 7 Strongly Agree
iii) “I believe that I perform the “TASK SELECTED IN PART a” task well.”
Strongly Disagree 1 2 3 4 5 6 7 Strongly Agree
iv) “I have the knowledge, identifiable factual information, familiarity, awareness, or understanding gained through experience or study necessary to “TASK SELECTED IN PART a.” well.” Strongly Disagree 1 2 3 4 5 6 7 Strongly Agree
v) “I have the skills, ease of movement and the dexterity acquired or developed
through training or experience that is necessary to “TASK SELECTED IN PART a.” well.” Strongly Disagree 1 2 3 4 5 6 7 Strongly Agree
209
i) “I have the abilities or general capability to “TASK SELECTED IN PART a.”
well. I have the necessary physical, mental, financial and positional power.” Strongly Disagree 1 2 3 4 5 6 7 Strongly Agree
vi) “I am fully trained to “TASK SELECTED IN PART a. well” Strongly Disagree 1 2 3 4 5 6 7 Strongly Agree
vii) “The “TASK SELECTED IN PART a.” requires more capability and effort than what should be expected from my current job level.” Strongly Disagree 1 2 3 4 5 6 7 Strongly Agree
viii) “The “TASK SELECTED IN PART c.” task fits my career plan well.” Strongly Disagree 1 2 3 4 5 6 7 Strongly Agree
b) Which one of the following tasks has the greatest impact on your job outcomes? Audit project results to plan Facilitate improvement team meetings Correct inappropriate person behaviors
i) Would you like to allocate more or less of your work time to tasks similar to the above? More Current or Same Less
ii) “The “TASK SELECTED IN PART b” task is critical for my job’s success.” Strongly Disagree 1 2 3 4 5 6 7 Strongly Agree
iii) “I believe that I perform the “TASK SELECTED IN PART b” task well.”
Strongly Disagree 1 2 3 4 5 6 7 Strongly Agree
iv) “I have knowledge, the identifiable factual information, familiarity, awareness, or understanding gained through experience or study necessary to “TASK SELECTED IN PART b.” well.” Strongly Disagree 1 2 3 4 5 6 7 Strongly Agree
v) “I have the skills, ease of movement and the dexterity acquired or developed
through training or experience that is necessary to “TASK SELECTED IN PART b.” well.” Strongly Disagree 1 2 3 4 5 6 7 Strongly Agree
ii) “I have the abilities or general capability to “TASK SELECTED IN PART b.” well. I have the necessary physical, mental, financial and positional power.” Strongly Disagree 1 2 3 4 5 6 7 Strongly Agree
210
vi) “I am fully trained to “TASK SELECTED IN PART b. well” Strongly Disagree 1 2 3 4 5 6 7 Strongly Agree
vii) “The “TASK SELECTED IN PART b.” requires more capability and effort than what should be expected from my current job level.” Strongly Disagree 1 2 3 4 5 6 7 Strongly Agree
viii) “The “TASK SELECTED IN PART b.” task fits my career plan well.” Strongly Disagree 1 2 3 4 5 6 7 Strongly Agree
c) Which one of the following tasks has the greatest impact on your job outcomes? Communicate to group and organization Flow chart or characterize processes Teach lean principles and tools
i) Would you like to allocate more or less of your work time to routine tasks
similar to the above? More Current or Same Less
ii) “The “TASK SELECTED IN PART c” task is critical for my job’s success.” Strongly Disagree 1 2 3 4 5 6 7 Strongly Agree
iii) “I believe that I perform the “TASK SELECTED IN PART c” task well.”
Strongly Disagree 1 2 3 4 5 6 7 Strongly Agree
iv) “I have the knowledge, identifiable factual information, familiarity, awareness, or understanding gained through experience or study necessary to “TASK SELECTED IN PART c.” well.” Strongly Disagree 1 2 3 4 5 6 7 Strongly Agree
v) “I have the skills, ease of movement and the dexterity acquired or developed
through training or experience that is necessary to “TASK SELECTED IN PART c.” well.” Strongly Disagree 1 2 3 4 5 6 7 Strongly Agree
iii) “I have the abilities or general capability to “TASK SELECTED IN PART c” well. I have the necessary physical, mental, financial and positional power.” Strongly Disagree 1 2 3 4 5 6 7 Strongly Agree
vi) “I am fully trained to “TASK SELECTED IN PART c. well” Strongly Disagree 1 2 3 4 5 6 7 Strongly Agree
vii) “The “TASK SELECTED IN PART c.” requires more capability and effort than what should be expected from my current job level.” Strongly Disagree 1 2 3 4 5 6 7 Strongly Agree
211
viii) “The “TASK SELECTED IN PART c.” task fits my career plan well.” Strongly Disagree 1 2 3 4 5 6 7 Strongly Agree
About for Your Work Preferences … 5) The next fifteen questions will focus on four different types of work preferences:
a) Work Interests:
i) “I prefer tasks that require working with, studying about, building or repairing THINGS.” Strongly Disagree 1 2 3 4 5 6 7 Strongly Agree
ii) “I prefer tasks that require working with numbers, analyzing numbers, & keeping data records.” Strongly Disagree 1 2 3 4 5 6 7 Strongly Agree
iii) “I prefer tasks that require studying information, retaining it and using it.”
Strongly Disagree 1 2 3 4 5 6 7 Strongly Agree
iv) “I prefer tasks that require taking responsibility for others work and taking charge.” Strongly Disagree 1 2 3 4 5 6 7 Strongly Agree
v) “I prefer tasks that require caring for, coaching, or helping others.” Strongly Disagree 1 2 3 4 5 6 7 Strongly Agree
b) Work Values:
i) “I prefer tasks that require working independently and making my own
ii) “I prefer tasks that allow me to be well liked and get along with others.” Strongly Disagree 1 2 3 4 5 6 7 Strongly Agree
iii) “I prefer tasks where results are known and the positive value to the organization is understood.” Strongly Disagree 1 2 3 4 5 6 7 Strongly Agree
iv) “I prefer tasks that require being an effective and integral part of a team.” Strongly Disagree 1 2 3 4 5 6 7 Strongly Agree
c) Personality or Temperament:
212
i) “I prefer tasks where guidance is given to clarify task expectations and the tasks have helpful training and specific instructions.” Strongly Disagree 1 2 3 4 5 6 7 Strongly Agree
ii) “I prefer tasks that require thinking in terms of ideas and possibilities. They might require working with concepts or theories, idea generation, creative thinking or research.” Strongly Disagree 1 2 3 4 5 6 7 Strongly Agree
iv) “I prefer tasks that allow personal freedom to choose when and how to perform.” Strongly Disagree 1 2 3 4 5 6 7 Strongly Agree
d) Learning Style:
i) “I prefer tasks that require learning through open conversation and explanations.” Strongly Disagree 1 2 3 4 5 6 7 Strongly Agree
ii) “I prefer tasks that require reading from written materials, computers or other visual sources of information.” Strongly Disagree 1 2 3 4 5 6 7 Strongly Agree
About changes to your job to reflect you … 6) “The design of my job (assigned tasks, roles & responsibilities) has been changed to
better fit my knowledge, skills, abilities or characteristics.” a) Strongly Disagree 1 2 3 4 5 6 7 Strongly Agree
(If 1-4 then skip 6. b-f)
b) Who initiated the job design change? You Your Work Group Your Supervisor Other
c) Was your job description updated to reflect the changes made to your job to better fit your knowledge, skills, abilities or characteristics? Yes No (If no then skip 6 d )
d) Was your current job description modified to reflect any of the following? Check all that apply Experience Education Skills Personality Knowledge Career Goals
213
Preferences Coworker Job Descriptions e) If tasks were eliminated from your job design then where were they reassigned?
Check all that apply Delegated to your subordinate Not reassigned
Reassigned to person with different job description Reassigned to other person with similar job description Tasks were eliminated
f) “Please think of a specific situation when your job design was modified to enhance your effectiveness. Why and how was it modified?” ____________________________________________________________________________________________________________________________________
About you and your preferred behaviors … 7) The following two questions address your preferred behaviors as a lean leader:
a) Are you MORE: active fast paced, assertive with louder speech
(if checked then answer. 7b)
- or -
moderate paced, thoughtful, calm with softer speech. (if checked then answer 7c) Copyright 2004 by Inscape Publishing, Inc. All rights reserved. Used by permission of Inscape Publishing, Inc.
b) Are you MORE: questioning, results focused and direct (D: Dominance)
- or - accepting, enthusiastic, and sociable. (I: Influence) Copyright 2004 by Inscape Publishing, Inc. All rights reserved. Used by permission of Inscape Publishing, Inc.
214
c) Are you MORE: questioning, accuracy focused and analytical. (C: Conscientiousness)
or accepting, patient and empathetic. (S: Steadiness)
Copyright 2004 by Inscape Publishing, Inc. All rights reserved. Used by permission of Inscape Publishing, Inc.
The following questions are about you and your experience …. 8) What is the highest level of formal education degree that you attained?
High School (skip 10) Associate Bachelors Masters Doctorate None of the above (skip 9)
9) Which of the following disciplines does your degree(s) best fit? Industrial Engineering Manufacturing Engineering Engineering (other) Business Administration Social Sciences Physical Sciences Education Other
10) What is your current age? 17 - 21 22 – 26 27 – 31 32 – 36 37 – 41 42 – 46 47 - 51 52 – 56 57 – 61 62 – 66 67 – 71 72+
11) What is your gender? Male Female Thank you for investing your time and thought to provide feedback that will be used to
improve lean implementation effectiveness and lean leader job satisfaction. The data will
also be used to develop a model for effectively assigning tasks within a work group
215
Appendix B
Youth Leader Job Design Survey
216
Youth Leader Job Design Survey
NOTE: (Text entered parenthetically with an italic font describes the survey methodology and will not be included in the final survey. The survey will be administered electronically.) Consent:
You are invited to participate in a research project titled "Development of a Task Assignment Tool to Customize Job Descriptions to Close Job Specification and Person-Job Fit Gaps". The study is designed to analyze the effects of job customization and to develop a task assignment tool to improve a work groups Person-Job fit by better matching a job incumbent’s skills, knowledge, abilities and characteristics to their assigned tasks. The study is being conducted by Dr. Larry Mallak and Graduate Student Bryan Booker from Western Michigan University, Department of Industrial & Manufacturing Engineering. This research is being conducted as part of the dissertation requirements for Bryan Booker.
This survey instrument is comprised of 70 to 83 multiple choice and two and 2 open ended questions. The survey should take approximately 20 minutes to complete. Your replies will be completely anonymous, so do not put your name anywhere on the form. You may choose to not answer any question and simply leave it blank. Participation is voluntary. This consent document was approved for use for one year by Western Michigan University's HSIRB on _______. Do not participate after ________. Completing the survey indicates your consent for use of the answers you supply. If you have any questions, you may contact Larry Mallak at 269-276-3369, Bryan Booker at 616-886-9222, the Human Subjects Institutional Review Board (269-387-8293) or the vice president for research (269-387-8298).
Survey Purpose: To measure and better understand the relationship between a youth leader’s job design, job satisfaction and organization effectiveness. The data will be used to develop a knowledge worker task assignment tool to improve person-job fit. Instructions: Please indicate your response selection by clicking the appropriate circle or responding to the open ended questions.
1) The following questions are regarding your responsibilities and job description: a) “Some of my job tasks, roles or responsibilities have been changed to better
utilize my knowledge, skills, abilities or characteristics.” Strongly Disagree 1 2 3 4 5 6 7 Strongly Agree
b) Do you have a job description for your current job? Yes No (if No then skip 1c-k)
c) How would you feel if your current job description was customized to better match your knowledge, skills, attributes and characteristics? (Choose one best answer)
I would like it that way. It should be that way. I am neutral. I could live with it that way. I would dislike it that way. None of the above.
d) How might you and your supervisor(s) better design or use your job description in order to improve your job effectiveness? ____________________________________________________________________________________________________________________________________
e) Does your job description accurately describe your job responsibilities? Yes No
f) Do you or your supervisor use your job description?
Yes No (if No then skip 1g-j)
g) Have you and your supervisor identified gaps between your job requirements and your knowledge, skills, and abilities?
Yes No
h) Are your assigned tasks prioritized by importance within your job description? Yes No
i) Do you have an expected amount of time that you should allocate to each task included in your job description?” Yes No
218
j) Do you and your supervisor(s) review your job description periodically? Yes No (If no then skip 1.j.i) i) How frequently do you review your job description?
Monthly Quarterly Six months Annually Bi-Annually None of the above
k) How would you feel if your current job description is a listing of job responsibilities common to most lean leaders? (Choose one best answer)
I would like it that way It should be that way I am neutral I could live with it that way I would dislike it that way None of the above
About your job… 1) The following 15 questions are regarding your satisfaction or fit with your
organization and your job. Note: Your organization refers to the church or organization who employs you as a youth leader. a) D-A “My abilities and training are a good fit with the requirements of my job.” Strongly Disagree 1 2 3 4 5 6 7 Strongly Agree
b) JS “Considering all aspects of my job, my overall level of job satisfaction is…”
Very Dissatisfied 1 2 3 4 5 6 7 Very Satisfied
c) N-S “There is a good fit between what my job offers me and what I am looking for in a job.” Strongly Disagree 1 2 3 4 5 6 7 Strongly Agree
d) ITQ “I would prefer another job to the one I have now.” Strongly Disagree 1 2 3 4 5 6 7 Strongly Agree
e) Self-Concept-Job “The performance of my job tasks makes me realize that I have several good qualities.”
219
Strongly Disagree 1 2 3 4 5 6 7 Strongly Agree
f) P-O “The things I value in life are very similar to the things my organization values.”
Strongly Disagree 1 2 3 4 5 6 7 Strongly Agree g) D-A “My personal abilities and education provide a good match with the demands
that my job places on me.” Strongly Disagree 1 2 3 4 5 6 7 Strongly Agree
h) PROMO Which level of job demands do you feel capable of performing in the future?” Current job level demands Next level of more demanding jobs Organization’s top level jobs
i) N-S “The attributes that I look for in a job are fulfilled very well by my present
j) JS “I feel a great sense of personal satisfaction when I do this job well.” Strongly Disagree 1 2 3 4 5 6 7 Strongly Agree
k) N-S “The job that I currently hold gives me just about everything that I want from a job.” Strongly Disagree 1 2 3 4 5 6 7 Strongly Agree
l) ITQ “If I have my way, I won’t be working for this organization a year from now.” Strongly Disagree 1 2 3 4 5 6 7 Strongly Agree
m) D-A “The match is very good between the demands of my job and my personal skills.” Strongly Disagree 1 2 3 4 5 6 7 Strongly Agree
n) Self-Concept-Job “The performance of my job tasks makes me feel good about the person that I am.” Strongly Disagree 1 2 3 4 5 6 7 Strongly Agree
o) P-O “My personal values match the organization’s values and culture.” Strongly Disagree 1 2 3 4 5 6 7 Strongly Agree
220
About your youth leader responsibilities …
3) The following questions are about you and your experience as a youth leader. a) Is your role as youth leader your primary job responsibility? Yes No (If no then skip to 5)
b) Which of the following best describes your employment status? Volunteer Paid - Part Time Paid – Full Time
c) How many years have you held a job title similar to youth leader? 0 - 1 2 – 6 7 – 11 12 – 16 17 – 21 22 – 26 27 – 31 32 – 36 37 – 41 42+
d) How many people attend your youth activities on a typical week? 1 - 10 11 - 30 31 – 70 71 – 150 151 – 310 311 – 630 > 630
About your current job responsibilities …
2. The next questions will focus on tasks for current job responsibilities as a youth leader: a) Which of the one of the following tasks has the greatest impact on your job outcomes?
Plan youth events Raise funds Recruit and train youth leaders
i) Would you like to allocate more or less of your work time to project tasks similar to the above? More Current or Same Less
ii) “The “TASK SELECTED IN PART a” task is critical for my job’s success.” Strongly Disagree 1 2 3 4 5 6 7 Strongly Agree
iii) “I believe that I perform the “TASK SELECTED IN PART a” task well.”
Strongly Disagree 1 2 3 4 5 6 7 Strongly Agree
iv) “I have the knowledge, identifiable factual information, familiarity, awareness, or understanding gained through experience or study necessary to “TASK SELECTED IN PART a.” well.” Strongly Disagree 1 2 3 4 5 6 7 Strongly Agree
v) “I have the skills, ease of movement and the dexterity acquired or developed
through training or experience that is necessary to “TASK SELECTED IN PART a.” well.”
221
Strongly Disagree 1 2 3 4 5 6 7 Strongly Agree
vi) “I have the abilities or general capability to “TASK SELECTED IN PART a” well. I have the necessary physical, mental, financial and positional power.” Strongly Disagree 1 2 3 4 5 6 7 Strongly Agree
vii) “I am fully trained to “TASK SELECTED IN PART a. well” Strongly Disagree 1 2 3 4 5 6 7 Strongly Agree
viii) “The “TASK SELECTED IN PART a.” requires more capability and effort than what should be expected from my current job level.” Strongly Disagree 1 2 3 4 5 6 7 Strongly Agree
ix) “The “TASK SELECTED IN PART a.” task fits my career plan well.” Strongly Disagree 1 2 3 4 5 6 7 Strongly Agree
b) Which of the one of the following tasks has the greatest impact on your job outcomes?
Correct inappropriate youth behaviors Counsel youth Evaluate and make corrections to programs or processes
i) Would you like to allocate more or less of your work time to tasks similar to
the above? More Current or Same Less
ii) “The “TASK SELECTED IN PART b” task is critical for my job’s success.” Strongly Disagree 1 2 3 4 5 6 7 Strongly Agree
iii) “I believe that I perform the “TASK SELECTED IN PART b” task well.”
Strongly Disagree 1 2 3 4 5 6 7 Strongly Agree
iv) “I have the knowledge, identifiable factual information, familiarity, awareness, or understanding gained through experience or study necessary to “TASK SELECTED IN PART b.” well.” Strongly Disagree 1 2 3 4 5 6 7 Strongly Agree
v) “I have the skills, ease of movement and the dexterity acquired or developed
through training or experience that is necessary to “TASK SELECTED IN PART b.” well.” Strongly Disagree 1 2 3 4 5 6 7 Strongly Agree
vi) “I have the abilities or general capability to “TASK SELECTED IN PART b.” well. I have the necessary physical, mental, financial and positional power.”
222
Strongly Disagree 1 2 3 4 5 6 7 Strongly Agree
vii) “I am fully trained to “TASK SELECTED IN PART b. well” Strongly Disagree 1 2 3 4 5 6 7 Strongly Agree
viii) “The “TASK SELECTED IN PART b.” requires more capability and effort than what should be expected from my current job level.” Strongly Disagree 1 2 3 4 5 6 7 Strongly Agree
ix) “The “TASK SELECTED IN PART b.” task fits my career plan well.” Strongly Disagree 1 2 3 4 5 6 7 Strongly Agree
c) Which of the one of the following tasks has the greatest impact on your job outcomes? Communicate to the group and organization Track and record progress to goals Visit youth (school, event, home, restaurant etc.)
i) Would you like to allocate more or less of your work time to routine tasks
similar to the above? More Current or Same Less
ii) “The “TASK SELECTED IN PART c” task is critical for my job’s success.” Strongly Disagree 1 2 3 4 5 6 7 Strongly Agree
iii) “I believe that I perform the “TASK SELECTED IN PART c” task well.”
Strongly Disagree 1 2 3 4 5 6 7 Strongly Agree
iv) “I have the knowledge, identifiable factual information, familiarity, awareness, or understanding gained through experience or study necessary to “TASK SELECTED IN PART c.” well.” Strongly Disagree 1 2 3 4 5 6 7 Strongly Agree
v) “I have skills, the ease of movement and the dexterity acquired or developed
through training or experience that is necessary to “TASK SELECTED IN PART c.” well.” Strongly Disagree 1 2 3 4 5 6 7 Strongly Agree
vi) “I have the abilities or general capability to “TASK SELECTED IN PART c” well. I have the necessary physical, mental, financial and positional power.” Strongly Disagree 1 2 3 4 5 6 7 Strongly Agree
vii) “I am fully trained to “TASK SELECTED IN PART c. well” Strongly Disagree 1 2 3 4 5 6 7 Strongly Agree
viii) “The “TASK SELECTED IN PART c.” requires more capability and effort than what should be expected from my current job level.”
223
Strongly Disagree 1 2 3 4 5 6 7 Strongly Agree
ix) “The “TASK SELECTED IN PART c.” task fits my career plan well.” Strongly Disagree 1 2 3 4 5 6 7 Strongly Agree
About your work preferences … 3. The next fifteen questions will focus on four different types of work preferences:
a) Work Interests:
i) “I prefer tasks that require working with, studying about, building or repairing THINGS.” Strongly Disagree 1 2 3 4 5 6 7 Strongly Agree
ii) “I prefer tasks that require working with numbers, analyzing numbers, & keeping data records.” Strongly Disagree 1 2 3 4 5 6 7 Strongly Agree
iii) “I prefer tasks that require studying information, retaining it and using it.”
Strongly Disagree 1 2 3 4 5 6 7 Strongly Agree
iv) “I prefer tasks that require taking responsibility for others work and taking charge.” Strongly Disagree 1 2 3 4 5 6 7 Strongly Agree
v) “I prefer tasks that require caring for, coaching, or helping others.” Strongly Disagree 1 2 3 4 5 6 7 Strongly Agree
b) Work Values:
i) “I prefer tasks that require working independently and making my own
ii) “I prefer tasks that allow me to be well liked and get along with others.” Strongly Disagree 1 2 3 4 5 6 7 Strongly Agree
iii) “I prefer tasks where results are known and the positive value to the organization is understood.” Strongly Disagree 1 2 3 4 5 6 7 Strongly Agree
iv) “I prefer tasks that require being an effective and integral part of a team.” Strongly Disagree 1 2 3 4 5 6 7 Strongly Agree
224
c) Personality or Temperament: i) “I prefer tasks where guidance is given to clarify task expectations and the
tasks have helpful training and specific instructions.” Strongly Disagree 1 2 3 4 5 6 7 Strongly Agree
ii) “I prefer tasks that require thinking in terms of ideas and possibilities. They might require working with concepts or theories, idea generation, creative thinking or research.” Strongly Disagree 1 2 3 4 5 6 7 Strongly Agree
iv) “I prefer tasks that allow personal freedom to choose when and how to perform.” Strongly Disagree 1 2 3 4 5 6 7 Strongly Agree
d) Learning Style:
i) “I prefer tasks that require learning through open conversation and explanations.” Strongly Disagree 1 2 3 4 5 6 7 Strongly Agree
ii) “I prefer tasks that require reading from written materials, computers or other visual sources of information.” Strongly Disagree 1 2 3 4 5 6 7 Strongly Agree
About changes to your job to reflect you … 4. “The design of my job (assigned tasks, roles & responsibilities) has been changed to
better fit my knowledge, skills, abilities or characteristics.” Strongly Disagree 1 2 3 4 5 6 7 Strongly Agree (If 1 - 4 then skip 6.a-e) a) Who initiated the job design change? You Work Group Supervisor
b) Was your job description updated to reflect the changes made to your job to better fit your knowledge, skills, abilities or characteristics? Yes No (If no then skip 7.c-e)
c) Was your current job description modified to reflect any of the following? Check all that apply
d) If tasks were eliminated from your job design then where were they reassigned? Check all that apply Delegated to your subordinate Not reassigned Reassigned to person with different job description Reassigned to other person with similar job description Tasks were eliminated
e) Please think of a specific situation when your job was modified to accommodate you or enhance your effectiveness. Why and how was it modified? __________________________________________________________________
About you and your preferred behaviors…
5. The following two questions address your preferred behaviors as a youth leader:
a) Are you MORE: active fast paced, assertive with louder speech.
(if checked then answer. 7b) - or -
moderate paced, thoughtful, calm with softer speech. (if checked then answer 7c)
b) Are you MORE:
questioning, results focused and direct.
(D: Dominance or Assertiveness) - or -
accepting, enthusiastic, and sociable. (I: Influence or Communication) Copyright 2004 by Inscape Publishing, Inc. All rights reserved. Used by permission of Inscape Publishing, Inc.
c) Are you MORE: questioning, accuracy focused and analytical.
(C: Conscientiousness or Patience) or
accepting, patient and empathetic.
226
(S: Steadiness or Structure) Copyright 2004 by Inscape Publishing, Inc. All rights reserved. Used by permission of Inscape Publishing, Inc.| About you and your experiences…
6. The following questions are about you and your experience
a) What is the highest level of formal education degree that you attained?
High School Associate Bachelors Masters Doctorate None of the above
b) Did one or more of your degrees focus on the youth leader job? Yes No
c) What is your current age? 17 - 21 22 – 26 27 – 31 32 – 36 37 – 41 42 – 46 47 - 51 52 – 56 57 – 61 62 – 66 67 – 71 72+
d) What is your gender? Male Female
Thank you for investing your time and thought to provide feedback that will be used to help better understand the effect of job customization on youth leader job satisfaction and task effectiveness. The data will also be used to develop a task assignment tool for effectively assigning tasks within a work group.
227
Appendix C
Youth Job Descriptions
228
Youth Job Descriptions: (Gilbert, 2001)
The following job descriptions might all be considered part of a youth pastors job; however, they may be defined to customize the youth pastor job and improve organizational effectiveness.
• Youth Activities Assistant
• Youth Activities Coordinator
• Youth Care Group Leader
• Youth Chaperone
• Youth Class Secretary
• Youth Counselor/Mentor
• Youth Fund-Raising Coordinator
• Youth Guest Follow-Up Assistant
• Youth Missions Coordinator
• Youth Outreach Leader (Job description follows)
• Youth Pastor (Job description follows)
• Youth Records Clerk
• Youth Snack Coordinator
• Youth Teacher
• Youth Teacher Assistant
• Person Specification for Youth Pastor
229
Youth Pastor
The youth pastor will direct and oversee the youth ministry; educate, minister to and include teens in the ministry of the church and follow up with teen guests.
Ministry Area/Department Youth Position Youth pastor Accountable To Pastor Ministry Target Teens Position Is Paid staff Position May Be Filled By Church member Minimum Maturity Level Stable, mature Christian Spiritual Gifts Pastor/shepherd • Mercy-showing • Administration •
Teaching Talents or Abilities Desired Education and experience in theology and counseling •
Good role model • No criminal record Best Personality Traits Expresser-leader • Compassionate • Dependable •
Analytical Passion For Ministering to and with teens, with a heart for
understanding their special needs and a desire to include this valuable group of people in the ministry of the church
Length of Service Commitment Two years minimum
Anticipated Time Commitments 1. Doing ministry/preparing for ministry: forty hours a week, off on Saturday and one
day during week, except for emergencies and special occasions 2. Participating in meetings/training: one hour a month
Responsibilities/Duties 1. Give direction to and oversee the youth ministry.
a. Identify the needs and interests of teens within the church and community. b. Plan and develop programs for the youth ministry. c. Evaluate existing programs to determine effectiveness. d. Identify and provide ministry opportunities for teens.
230
2. Meet monthly with youth ministry leaders to pray and to discuss upcoming events, challenges, solutions and praises.
3. Recruit youth workers as needed. Provide training for youth workers as needed. Plan one major training/inspirational workshop a year.
4. Provide counseling and spiritual direction to teens on an individual basis. 5. Participate in outreach ministry to teens who have visited the church: visits, letters,
etc. 6. Lead midweek Bible study for teens. 7. Plan at least one yearly youth retreat for the purpose of spiritual edification. 8. Visit teens who are hospitalized. 9. Participate in training opportunities yearly, or as presented.
10. Develop the youth ministry budget and track expenditures throughout the year. 11. Compile a youth directory, have copies made and distribute to teens and youth
workers.
Youth Outreach Leader
The youth outreach leader is responsible for contacting and beginning relationships with prospects, visitors and new members of the youth group in order to point them to Christ and assimilate them into the church through Sunday School or other Bible-study groups.
Ministry Area/Department Youth Position Youth outreach leader Accountable To Youth pastor Ministry Target Teens Position Is Volunteer Position May Be Filled By Church member Minimum Maturity Level Stable, maturing Christian Spiritual Gifts Exhortation • Evangelism • Administration Talents or Abilities Desired Able to communicate well with others • Organized •
Good role model • No criminal record Best Personality Traits Expresser-leader • Outgoing Passion For Influencing teens for Christ and encouraging them to
231
become involved in the local church Length of Service Commitment One year minimum Anticipated Time Commitments 1. Doing ministry/preparing for ministry: two to four hours a week 2. Participating in meetings/training: one hour a month Responsibilities/Duties: 1. Participate in training opportunities. 2. Coordinate efforts with church outreach director and inform of visitation progress. 3. Work with youth class members to identify, witness to and minister to prospects and
enroll new members. 4. Develop a prospects file and keep a record of contacts and results. 5. Pray for prospects, visitors and new members. 6. Initiate follow-up contacts with youth class visitors: phone, write, visit. 7. Contact prospects to inform them of youth class studies and activities, and invite
them to participate: phone, write, visit. 8. Be prepared to lead prospects to Christ or to provide a counselor when needed. 9. Welcome visitors and help new members feel accepted; introduce them to others;
assimilate them into the life of the church.
232
Appendix D
Job/Person Specification Example
233
Job/Person Specification Example (www.christchurch-virginiawater.co.uk/youthpastor.pdf, 9/07/07)
Statement about the Current Youth Ministry Christ Church is a conservative evangelical church in leafy Surrey, with an average Sunday attendance of over 400. We have been blessed in recent years with considerable growth, and are committed to continuing to reach out to our community with the good news of Jesus Christ. Our Youth Ministry (ages 11-18) is a vibrant and growing ministry area which involves over 90 young people, and which now needs to be taken forward by someone who will teach faithfully, think strategically, minister relationally, build leaders and cast the vision for the next 5 years, and beyond. Vision: To see the young people of Virginia Water, brought into a personal relationship with God through Jesus Christ, to nurture them in the faith and prepare them for adulthood as fully devoted followers of Jesus Christ. Aims and Objectives: We are seeking to appoint a church based full time youth pastor to work with ages 11-18, to: • Provide overall vision and leadership to the youth ministry at Christ Church in line
with the church’s aims and objectives. • Consolidate and expand the youth ministry in and through Christ Church. • Successfully manage the transitions from Sunday Club to Youth Ministry, and from
Youth Ministry to Student and Adult Ministry. • Identify, equip and train new leaders to share in the youth ministry. Desirable Qualifications • A clear calling to youth ministry. • Experience of working with young people in a Christian setting. • A degree or equivalent in theology or youth ministry. Personal Attributes: • A vibrant personal faith in Jesus Christ. • A love for young people. • A role model of Christian values, disciplines and spiritual life. • Ability to teach the Bible to young people. • A confidence in leading both small and large groups or meetings. • Relational and bridge-building skills. • Humility and teachable. • Willingness to work within a ministry team. • Flexibility and enthusiasm. • Good time management • A sense of humour.
Principal Responsibilities: 1. To take responsibility for the evangelisation, spiritual growth and pastoral care of
the youth of Christ Church Virginia Water, and integrate them within the church family.
2. To plan and pray for the development of Christian youth work in and through
Christ Church with particular reference to the school years 7-13. Specifically: To teach the existing Pathfinder Sunday club group for aged 11-14. To train additional leaders for the youth ministry. To teach the existing 14-18 year old Bible study group. To participate in and initiate greater youth involvement in Sunday services. To be responsible for the 14-18 activities on Sunday Evenings. To be responsible for monthly Youth led Services. To lead the 11-14 year old W@C (Wednesdays @ Christ Church) activities 3. To exercise active pastoral concern for the young people of the church. To come
along side them, respond to their needs and help them to know God personally. 4. To support existing leaders and encourage and motivate new leaders to expand the
youth ministry at Christ Church. 5. To explore, recommend and facilitate new initiatives in evangelistic outreach
among the young people of Virginia Water in partnership with the clergy and staff team.
6. To be aware of current legislation regarding the welfare and protection of young
people and to ensure adherence to the Child Protection Policy agreed by Christ Church PCC, as it applies to the Youth Ministry (ages 11-18).
7. Continue an agreed programme of personal development and theological training. Accountability: 1. The contract will be between the youth pastor and Christ Church PCC. The youth
pastor will be accountable to a designated member of the clergy. 2. It would be a condition of employment that the youth worker become a fully
participating member of Christ Church, endorse the vision, five year plan, distinctive values, membership scheme and attend services regularly.
3. The Youth pastor will meet weekly with a nominated supervisor for planning and
review of activities, and for support. Working Relationships: 1. The youth pastor will join the Church staff team.
235
2. The youth pastor will meet with a designated member of the clergy on a weekly
basis for supervision, support and accountability.
3. The youth pastor will participate in the weekly staff meeting and ministry meeting.
Liaison: 1. The youth pastor is expected to maintain contact with the Diocesan Youth
Advisor and participate in Diocesan events and training arranged for parish youth workers as appropriate.
2 The youth pastor is encouraged to develop working relationships with other
locally based youth workers, as appropriate. Training & Support: 1 All staff are encouraged to continue their personal and professional development.
Funding for this may be available.
2 A performance review will take place with the supervisor after three months and then in January and July
236
Appendix E
Job Crafting Model
237
Job Crafting Model
(Wrzesniewski & Dutton, 2001, pp. p. 182, 185)
Forms of Job Crafting:
o Changing number, scope, and type of job tasks
o Changing quantity and/or amount of interaction with others encountered in job
o Changing cognitive task boundaries
A Model of Job Crafting
Motivations Moderating Variables
Job Crafting Practices Specific Effects General Effects
Need for control over job
and work meaning
Perceived opportunity to
job craft
Changing task boundaries
(alter number or type of tasks)
Change the design of the
job
Change the meaning of
work
Need for positive self-
image
Individual orientation
toward work
Changing cognitive task
boundaries
Change the social
environment at work
Change ones work identity
Need for human
connection with others
Motivational orientations
Changing relational
boundaries (who and nature of
interactions)
238
Appendix F
Inscape Publishing, Inc. DiSC Question Authorization Letter
239
Inscape Publishing, Inc. DiSC Question Authorization Letter
240
241
Appendix G
SME and AME Lean Body of Knowledge (BOK)
242
SME and AME Lean Body of Knowledge (BOK) (Version 2, March 2006)
1. Enablers for Lean 1.1. Leadership 1.2. Empowerment and Human Development
2. Lean Core Operations
2.1. Operational Vision and Strategy
2.2. Innovations in Product Design and Market Service
2.3. Suppliers and Customers (relationship development) 2.3.1. Suppliers 2.3.2. Customers 2.3.3. Distribution and Transportation Alliances
2.4. Core Operations & Processes
2.4.1. Systematic Identification and Elimination of Waste 2.4.2. Just-In-Time Operations 2.4.3. Cellular and Continuous Flow 2.4.4. Lean Tools for Continuous Improvement
3. Business Core Operations Support Functions
3.1. Administrative Vision and Strategy in Finance and Accounting, Human Resources, Materials Management, Information Technology, Sales and Marketing, Quality Assurance, Process & Manufacturing Engineering and Legal & Regulatory
3.1.1. The BOK in this section is analogous to Module 2, it applies to business and service processes
3.1.2. Alignment and Systematic Service and Business Process Design. 4. Quality Cost and Delivery Measures
5. Business Results 5.1. Customer Satisfaction Results 5.2. Business Results 5.3. Profitability Measurement
243
Appendix H
Herzberg’s Principles of Vertical Job Loading
244
Herzberg’s Principles of Vertical Job Loading
Principle Motivators Involved A Removing some controls while
retaining accountability
Responsibility and personal achievement
B Increasing the accountability of individuals for own work
Responsibility and recognition
C Giving a person a complete natural unit of work (module, division, area and so on)
Responsibility, achievement, and recognition
D Granting additional authority to employees in their activity; job freedom
Responsibility, achievement, and recognition
E Making periodic reports directly available to the workers themselves rather than to supervisors
Internal recognition
F Introducing new and more difficult tasks not previously handled
Growth and learning
G Assigning individuals specific or specialized tasks, enabling them to become experts
Responsibility, growth, and advancement
245
Appendix I
Twelve Different Job Description Characteristics
246
Twelve Different Job Description Characteristics
(Grant, 1989, pp. 2-3)
1. The work design.
2. Justification for human resource investment.
3. Degree of specificity by which the jobholder can mold the job to better
match their specific needs and characteristics.
4. What an employee does in the organization. Tasks and responsibilities.
5. Major components of the job structure.
6. How the job relates administratively and operationally, to other jobs in the
organizational system.
7. Jobs within the organization are interdependent to make up the whole.
8. Job boundaries.
9. Pattern of behavior expectations.
10. The role: “work relations with others, justification for existence of the
position, the impact of one’s behavior in the position on the other workers,
as well as when, where, and with what resources tasks should be
performed.”
11. The position: “The JD attaches to the position not the person. An employee
may perform the tasks incorporated in a number of different positions at
times. The employees job does not change even if they are asked fulfill
other jobs in addition to their own.” (Grant, 1989) (p. 3)
12. Reason for the job.
247
Appendix J
Human Resources Body of Knowledge (BOK) - Related to Job Design
248
Human Resources Body of Knowledge (BOK) - Related to Job Design
(www.hrci.org/Certification/BOK/NBOK, 11/10/07)
The Human Resource Certification Institute (HRCI) developed the Human Resources Managers credentialing program for Professional in Human Resources (PHR) and Senior Professional in Human Resources (SPHR). The PHR and SPHR exams are maintained to reflect actual HR practices. The latest revision to the BOK was completed in 2005.
02 WORKFORCE PLANNING AND EMPLOYMENT Developing, implementing, and evaluating sourcing, recruitment, hiring, orientation, succession planning, retention, and organizational exit programs necessary to ensure the workforce’s ability to achieve the organization’s goals and objectives. Responsibilities: 03 Conduct job analyses to create job descriptions and identify job competencies. 04 Identify and document essential job functions for positions. 05 Establish hiring criteria based on job descriptions and required competencies. 07 Assess skill sets of internal workforce and external labor market to determine the availability of qualified candidates, utilizing third party vendors or agencies as appropriate. 11 Develop and implement selection procedures, including applicant tracking, interviewing, testing, reference and background checking, and drug screening.
Knowledge of: 14 Reliability and validity of selection tests/tools/methods. 15 Use and interpretation of selection tests (for example, psychological/personality, cognitive, motor/physical assessments, performance, assessment center). 21 Internal workforce assessment techniques (for example, skills testing, skills inventory, workforce demographic analysis) and employment policies, practices, and procedures (for example, orientation and retention).
03 HUMAN RESOURCE DEVELOPMENT Developing, implementing, and evaluating activities and programs that address employee training and development, performance appraisal, talent and performance management, and the unique needs of employees, to ensure that the knowledge, skills, abilities, and performance of the workforce meet current and future organizational and individual needs. Responsibilities: 03 Develop/select and implement employee training programs (for example, leadership skills, harassment prevention, computer skills) to increase individual and organizational effectiveness. Note that this includes training design and methods for obtaining feedback from training (e.g., surveys, pre- and post-testing). 04 Evaluate effectiveness of employee training programs through the use of metrics (for example, participant surveys, pre- and post-testing). 05 Develop, implement, and evaluate talent management programs that include assessing talent, developing talent, and placing high-potential employees. 08 Develop, implement, and evaluate performance management programs and procedures (for example, goal setting, job rotations, promotions). 09 Develop/select, implement, and evaluate programs (for example, flexible work arrangements, diversity initiatives, repatriation) to meet the unique needs of employees.
Knowledge of: 27 Training program development techniques to create general and specialized training programs. 28 Training methods, facilitation techniques, instructional methods, and program delivery mechanisms. 29 Task/process analysis. 30 Performance appraisal methods (for example, instruments, ranking and rating scales). 31 Performance management methods (for example, goal setting, job rotations, promotions).
CORE KNOWLEDGE REQUIRED BY HR PROFESSIONALS 69 Needs assessment and analysis. 73 Adult learning processes. 74 Motivation concepts and applications. 75 Training techniques (for example, computer based, classroom, on-the-job). 84 Job analysis and job description methods. 89 Methods for assessing employee attitudes, opinions, and satisfaction (for example, opinion surveys, attitude surveys, focus groups/panels).
250
Appendix K
Lean Leader Pilot Participation Request
251
Lean Leader Pilot Participation Request
The following e-mail will be sent to IIE lean division members e-mail address if the newsletter survey participation rate is low. SUBJECT: Do you fit your job or does the job fit you? - Doctoral research survey participation request Your knowledge as a professional lean leader will be of great value to my research project. I am a doctoral student and my dissertation research project uses a survey instrument to collect data focused on lean leader job design. The dissertation project is titled: “Closing the Job Specification and Incumbent Person-Job Fit Gaps by Customizing Job Descriptions.” Please help me improve the meaningfulness of this project by participating in this job design survey pilot study. The survey responses will be anonymous. A summary of the study results will be published on the Institute of Industrial Engineers (IIE) lean division community web site. Your participation is voluntary. This survey and my research protocol have been approved by the Western Michigan University Human Subjects Institutional Review Board. The research project purpose is to measure and better understand the relationship between a lean leader’s job design, job satisfaction and job effectiveness. The knowledge gained is expected to better understand the key components of a lean leader’s job, the effect of customizing a job to better fit the jobholder, and to generalize the conclusions for other knowledge workers with non-routine tasks. Please participate in my doctoral research project by completing the survey accessed through the web link (URL LINK). The survey should take 20 minutes to complete. Thank you Bryan W. Booker Doctoral Candidate Department of Industrial & Manufacturing Engineering Western Michigan University 616-886-9222 [email protected]
The Lean Leader has a broad set of responsibilities that includes leadership for the overall operation and continuous improvement of value streams. The position will lead and sustain the lean transformation by administering continuous improvement activities, providing hands-on technical support, and driving necessary cultural change. The position will also train and facilitate personnel use of the tools and processes necessary to implement Lean methodologies throughout the organization.
ORGANIZATIONAL RELATIONS
Reports to Vice President of Operations. Direct reports include engineer(s), trainer(s) and or coordinator(s). Indirectly responsible for cross-functional and functional improvement teams. Customers include suppliers, all departments within the organization, distribution network, management at all levels, and end-user customers.
ESSENTIAL FUNCTIONS
Strategic Vision: Develop and recommend a strategic vision for a lean process that will drive radical change and continual improvement. Coach: Coach and counsel the leadership team and workforce in the vision, values, and lean processes. Communication: Use and continually improve communication tools to foster the Lean environment and culture.
Lean Assessment: Conduct a structured, organization wide lean assessment from the customer backwards to identify and measure gaps. Value Stream Definition: Understand and document the current value stream flow of information and material for each product group. Define future states. Future State Improvement Plan: Develop targeted improvement plans using projects, and high impacting Kaizen activities.
256
Performance Management: Develop annual improvement priorities, key performance indicators, and measurements. Track and validate improvements using performance metrics for Lean processes that supports business strategies and goals. Knowledge: Continually improve understanding of lean systems, processes and tools and spread that knowledge throughout the organization. Training: Define learning needs and develop training plans. Develop training material and train targeted personnel to apply Lean manufacturing tools that includes: 5-S, Data Collection and Analysis, Value Stream Mapping, Kaizen events, SMED, OEE, Standard Work, 8D and problem solving tools. Facilitate: Facilitate improvement teams, continuous improvement and Kaizen intervention projects. Manage Improvement Projects: Identify, prioritize, initiate, coordinate, manage, and support change implementation. Audit Results: Assess the actual process performance and financial impact of improvement activities. Communicate the impact. Benchmark: Compare measured process performance with relevant competitors and the industry’s best in class. Facilitate the sharing of best practices. Supervise Direct Reports
JOB REQUIRMENTS AND QUALIFICATIONS:
Education: B.S. Degree in Engineering (Technical and advanced degree preferred)
Experience: Five to seven years of proven track record of implementing business and operational improvement supported by Lean manufacturing techniques. Lean Knowledge: Specialized knowledge in the principles, practices, and implementation of Lean principles and methods. Facilitating & Teaching: Successfully facilitated project teams ranging in size from four to twenty people and effectively taught lean training materials. Project Management: Extensive project management experience that includes working with suppliers, customers and management at all levels.
Communication: Excellent verbal and written communication skills.
257
Appendix N
Position Description – Lean Leader
258
POSITION DESCRIPTION
Position Description: Lean Leader JD Ref. Number: ______________ Job Description: Lean Leader – Operations PD Ref. Number: ______________ Department or Location: Operations Job Grade: 18 Pay Status: Salary Date Prepared/Revised: April 23, 2008 Approved by: _________________
JOB SUMMARY
The Lean Leader has a broad set of responsibilities that includes leadership for the overall operation and continuous improvement of value streams. The position will lead and sustain the lean transformation by administering continuous improvement activities, providing hands-on technical support, and driving necessary cultural change. The position will also train and facilitate personnel use of the tools and processes necessary to implement Lean methodologies throughout the organization.
ORGANIZATIONAL RELATIONS
Reports to Vice President of Operations. Direct reports include engineer(s), trainer(s) and or coordinator(s). Indirectly responsible for cross-functional and functional improvement teams. Customers include suppliers, all departments within the organization, distribution network, management at all levels, and end-user customers.
ESSENTIAL FUNCTIONS (% Time)
Planned Work: Supervise Direct Reports: (7-10%) Strategic Vision: Develop and recommend a strategic vision for a lean process that will drive radical change and continual improvement. (4-6%) Lean Assessment: Conduct a structured, organization wide lean assessment from the customer backwards to identify and measure gaps. (5-8%) Value Stream Definition: Understand and document the current value stream flow of information and material. Define the future state. (5-8%) Future State Improvement Plan: Develop targeted improvement plans using projects, and high impacting Kaizen activities. (5-8%)
259
Facilitate: Facilitate improvement teams and continuous improvement Kaizen intervention projects. (10-15%) Manage Improvement Projects: Identify, prioritize, initiate, coordinate, manage, support implementation (10-15%) Temporary Work: Coach: Coach and counsel the leadership team and workforce in the vision, values, and lean processes necessary for acceptance or “buy-in”. Emphasize the design of continuous product flow, the use of pull systems where flow is not currently possible, and the leveling of the workload. (2-3%) Communication: Develop and implement communication tools to foster the Lean environment and culture. (4-6%) Knowledge: Develop a thorough understanding of lean systems, processes and tools and spread that knowledge throughout the organization in an intentional and written process. (3-5%) Performance Management: Develop and implement performance metrics for Lean processes that supports business strategies and goals. Develop annual improvement priorities, key performance indicators, and measurements. Track and validate improvements. (8-10%)
Training: Define learning needs and develop training plans. Develop training material and train targeted personnel to apply Lean manufacturing tools that includes: 5-S, Data Collection and Analysis, Value Stream Mapping, Kaizen events, SMED, OEE, Standard Work, 8D and problem solving tools. (10-15%)
Audit Results: Assess the actual process performance and financial impact of improvement activities. Communicate the impact. (5-7%) Benchmark: Compare measured process performance with relevant competitors and the industry’s best in class. Facilitate the sharing of best practices. (3-5%) Semi-Work Activities: Administrative tasks, meetings, travel, socialization, delays, and personal activities. (5-7%) Unplanned-Work Activities: • Self-initiated (3-5%) • Directives from others (5-7%) • Unexpected problems (3-5%)
260
Appendix O
Task Assignment Process Example
261
Task Assignment Process Example
Step
No.
Activ
ity #
Step Description Activities
Man
ager
Perfo
rmer
Gro
up
Faci
litat
or
Elap
sed
Labo
r
~5 jo
bs
1a Plan Task assignment process, roles & responsibilities. 2 1 2 0.5b Communicate Meet to confirm purpose, roles, responsibilities and timing. 2 1 1 2 1 1
2a List List tasks performed beginning with active verb. 2 3 0.5b Consensus Task list consensus. Content, scope and descriptions. 2 1c Identify Tasks as primarily routine, problem solving, or project (TQ). 2 1c Identify Tasks that may be flexibly reassigned. (flex tasks) 2 1d Validate Meet to define tasks and ability to reassign. 2 1 1 1 1 1
3a Record Time to perform task over a representative period (~1 wk.) 2 1 5 0.5b Estimate Average time required for infrequently occurring activities. 1 2c Load Load task time results in worksheet. 2
4a Load Desire expressed by person for each flex task. 2 0.05b Load Grade reassignment limitations & TQ assignment. 2 0.05c Load Performance (A,B,C) & promotability (1,2,3) ratings/person 2 0.05d Assess & Load Development plan for each person related flex tasks. 2 0.1e Assess & Load Flex tasks performed better with a preferred behavior type. 2 0.1f Assess & Load Flex tasks that might be assigned to multiple persons. 2 0.1g Assess & Load Tasks requiring current labor grade or higher. 2 0.05h Assess & Load Knowledge fit for each employee & flex task combination. 2 0.1i Assess & Load Primary preferred behavior type (DISC) per person & task. 2 0.1j Assess & Load Skills fit for each employee & flex task combination. 2 0.1k Assess & Load Training matrix data/person & flex task combination. 2 0.1
Standardize Best methods for similar "key" tasks. 2 1 1 1Level Load Schedule, prioritize or increase flexibility to respond. 2 1 1 1
Increase Capacity Identify backups and manage with training matrix. 2 1 1 16
a Load Task time data/person into Task Assignment Tool. 2 0.2b Assess & Load Task time data (quality and reconcile variation) 2 0.2c Validate Test task assignment tool functionality and validity. 2 1 0.2
7a Use Tool Assign tasks/person following heuristic(s), record scenarios. 2 0.1b Use Tool Develop alternative scenarios based on non-modeled factors. 2 0.2
8
a PlanPlan task assignment assessment meeting. Decide between combination of 1-on-1 and/or group meetings. 2 1 1 0.3
b Consensus Meet to evaluate and propose alternative task assignments. 2 1 1 1 1 19
a Update Task assignment matrix 1 0.3b Update Position descriptions 1 1
Total Days: 23 11.7
2
Load Task Time Data into Spreadsheet
Identify Tasks
Task Assignment to Positions / People
Develop Task Assignment Scenarios
1
Responsibility
2
2
Perfo
rmed
con
curr
ently
with
R
ecor
d Ta
sk T
ime
Activ
ities
Improve Task Design
Load Task Assignment Tool Data
Collect Current Task Time Data
1
Plan and Communicate Position Description Task Assignment
Time- Days
0.75
1
1
Document Task Assignments
Note: Number 2 assignment indicates a primary responsibility
262
Appendix P
Person-Job Fit Versus Updated Job Description
263
Kruskal-Wallis Test: PJFit versus JDUpdated
110 cases were used 118 cases contained missing values Kruskal-Wallis Test on PJFit JDUpdated N Median Ave Rank Z 1 50 5.938 62.7 2.16 2 60 5.750 49.5 -2.16 Overall 110 55.5 H = 4.67 DF = 1 P = 0.031 H = 4.69 DF = 1 P = 0.030 (adjusted for ties) Kruskal-Wallis Test: DAFit versus JDUpdated 112 cases were used 116 cases contained missing values Kruskal-Wallis Test on DAFit JDUpdated N Median Ave Rank Z 1 52 6.000 61.4 1.49 2 60 6.000 52.2 -1.49 Overall 112 56.5 H = 2.23 DF = 1 P = 0.135 H = 2.31 DF = 1 P = 0.128 (adjusted for ties) Kruskal-Wallis Test: NSFit versus JDUpdated 113 cases were used 115 cases contained missing values Kruskal-Wallis Test on NSFit JDUpdated N Median Ave Rank Z 1 52 6.000 66.0 2.69 2 61 5.333 49.3 -2.69 Overall 113 57.0 H = 7.25 DF = 1 P = 0.007 H = 7.36 DF = 1 P = 0.007 (adjusted for ties) Kruskal-Wallis Test: SCJFit versus JDUpdated 111 cases were used 117 cases contained missing values Kruskal-Wallis Test on SCJFit JDUpdated N Median Ave Rank Z 1 50 6.000 60.9 1.44 2 61 6.000 52.0 -1.44 Overall 111 56.0 H = 2.07 DF = 1 P = 0.151 H = 2.21 DF = 1 P = 0.137 (adjusted for ties)
264
Test for Equal Variances: PJFit versus JDUpdated 95% Bonferroni confidence intervals for standard deviations JDUpdated N Lower StDev Upper 1 50 0.518034 0.64434 0.84525 2 60 0.649433 0.79368 1.01369 * 105 0.876204 1.02259 1.22353 Bartlett's Test (Normal Distribution) Test statistic = 14.07, p-value = 0.001 Levene's Test (Any Continuous Distribution) Test statistic = 4.99, p-value = 0.008
Two-Sample T-Test and CI: PJFit, JDUpdated JDUpdated N Mean StDev SE Mean 1 50 5.900 0.644 0.091 2 60 5.552 0.794 0.10 Difference = mu (1) - mu (2) Estimate for difference: 0.348 95% CI for difference: (0.076, 0.620) T-Test of difference = 0 (vs not =): T-Value = 2.54 P-Value = 0.013 DF = 107 Two-Sample T-Test and CI: DAFit, JDUpdated JDUpdated N Mean StDev SE Mean 1 52 5.942 0.791 0.11 2 60 5.678 0.898 0.12 Difference = mu (1) - mu (2) Estimate for difference: 0.265 95% CI for difference: (-0.052, 0.581) T-Test of difference = 0 (vs not =): T-Value = 1.66 P-Value = 0.100 DF = 109 Two-Sample T-Test and CI: NSFit, JDUpdated JDUpdated N Mean StDev SE Mean 1 52 5.769 0.796 0.11 2 61 5.20 1.16 0.15 Difference = mu (1) - mu (2) Estimate for difference: 0.567 95% CI for difference: (0.201, 0.933) T-Test of difference = 0 (vs not =): T-Value = 3.07 P-Value = 0.003 DF = 106 Two-Sample T-Test and CI: SCJFit, JDUpdated JDUpdated N Mean StDev SE Mean 1 50 6.090 0.668 0.094 2 61 5.885 0.673 0.086 Difference = mu (1) - mu (2) Estimate for difference: 0.205 95% CI for difference: (-0.049, 0.458) T-Test of difference = 0 (vs not =): T-Value = 1.60 P-Value = 0.112 DF = 105
265
Appendix Q
Person-Job Fit Versus Preferred Behavior (DiSC)
266
Kruskal-Wallis Test: PJFit versus DiSC 200 cases were used 28 cases contained missing values DiSC N Median Ave Rank Z C 55 5.250 79.4 -3.18 D 37 5.750 106.0 0.64 I 54 5.750 112.3 1.76 S 54 5.750 106.4 0.88 Overall 200 100.5 H = 10.49 DF = 3 P = 0.015 H = 10.53 DF = 3 P = 0.015 (adjusted for ties) Kruskal-Wallis Test: NSFit versus DiSC 208 cases were used 20 cases contained missing values DiSC N Median Ave Rank Z C 56 5.000 78.7 -3.75 D 40 5.500 109.1 0.53 I 56 5.667 119.2 2.14 S 56 5.500 112.3 1.13 Overall 208 104.5 H = 14.78 DF = 3 P = 0.002 H = 14.94 DF = 3 P = 0.002 (adjusted for ties) Kruskal-Wallis Test: DAFit versus DiSC 210 cases were used 18 cases contained missing values DiSC N Median Ave Rank Z C 56 5.667 89.4 -2.31 D 41 6.000 121.4 1.87 I 58 6.000 107.1 0.24 S 55 6.000 108.3 0.40 Overall 210 105.5 H = 6.89 DF = 3 P = 0.076 H = 7.09 DF = 3 P = 0.069 (adjusted for ties) Kruskal-Wallis Test: SCJFit versus DiSC 202 cases were used 26 cases contained missing values DiSC N Median Ave Rank Z C 55 6.000 96.6 -0.74 D 37 6.000 99.7 -0.20 I 55 6.000 107.0 0.82 S 55 6.000 102.1 0.09 Overall 202 101.5 H = 0.93 DF = 3 P = 0.819 H = 0.99 DF = 3 P = 0.804 (adjusted for ties)
267
Appendix R
Customized Job Versus Preferred Behavior (DiSC)
268
Kruskal-Wallis Test: CustJob versus DiSC 208 cases were used 20 cases contained missing values Kruskal-Wallis Test on CustJob DiSC N Median Ave Rank Z C 55 5.000 109.3 0.69 D 40 4.000 83.4 -2.47 I 57 5.000 116.2 1.73 S 56 5.000 102.9 -0.23 Overall 208 104.5 H = 7.48 DF = 3 P = 0.058 H = 7.57 DF = 3 P = 0.056 (adjusted for ties) Two-Sample T-Test and CI: CustJob_D, CustJob_I Two-sample T for CustJob_D vs CustJob_I N Mean StDev SE Mean CustJob_D 40 4.05 1.51 0.24 CustJob_I 57 4.89 1.53 0.20 Difference = mu (CustJob_D) - mu (CustJob_I) Estimate for difference: -0.836 95% CI for difference: (-1.458, -0.214) T-Test of difference = 0 (vs not =): T-Value = -2.67 P-Value = 0.009 DF = 84 Two-Sample T-Test and CI: CustJob_C, CustJob_D Two-sample T for CustJob_C vs CustJob_D N Mean StDev SE Mean CustJob_C 55 4.64 1.66 0.22 CustJob_D 40 4.05 1.51 0.24 Difference = mu (CustJob_C) - mu (CustJob_D) Estimate for difference: 0.586 90% CI for difference: (0.043, 1.129) T-Test of difference = 0 (vs not =): T-Value = 1.79 P-Value = 0.076 DF = 88
269
Appendix S
Graduate Student Feedback
270
Graduate Student Feedback
1) Q56: How many people work in the organization(s) that your job typically interacts
with? a) FEEDBACK:
i) Awkward wording ii) My organization or other organizations?
b) DECISION: i) The full range of options were selected so the question will be reworded to
“How many people did you interact with while performing your job within the last 6 months?”
2) Q21. How would you feel if your current job description is a listing of job
responsibilities common to most lean leaders?; (Choose one best answer) a) FEEDBACK:
i) Not sure what this questions means or how to help you. ii) 75% of people chose the neutral response.
b) DECISION: i) Most of the graduate students were not lean leaders and did not understand
what it meant. ii) No change given that the lean leader and youth leader questions were written
specifically for them. Other Survey Changes: The expected time to complete the survey was changed from 20 minutes to 15 minutes and the HSIRB approval and expiration dates were added to the introduction. However, the expected response time was changed back to 20 minutes following the lean leader and youth leader survey reviews. All Relevant Comments: 1) Some of my current job tasks, roles or responsibilities have been changed or
reassigned to better ... a) My area of responsibilities have been defined based on my core competencies. b) I started as an entry level engineer. I think it would be safe to say that ALL entry-level positions
would have changed from the original tasks, roles, etc. over 3-4 years. I think this could be re-worded to better capture what you're trying to get from the question.
2) How would you feel if your responsibilities were matched to your core competencies?
a) I feel this is the same question as before. 3) Do you have an estimate of the expected amount of your time to allocate to each task
included in ... a) Question is irrelevant. It is up to the individual to manage their time and
accomplish tasks accordingly.
271
4) How frequently do you review your job description?
a) How often do you meet to review your performance against expectations. 5) My abilities and training are a good fit with the requirements of my job.
a) � Yes or no. 6) Considering all aspects of my job, my overall level of job satisfaction is ..."
a) My overall satisfaction is based partially on compensation aspects of my job. I compartmentalize job satisfaction between internal rewards from the job and compensation from my employer. It's an assumption that "all aspects" includes both.
7) "I would prefer another job to the one I have now. a) If I am satisfied with my current job, that doesn't necessarily mean I would not be
satisfied with another.
8) "Which level of job demands do you feel capable of performing in the future? a) Depends somewhat on what is meant by top level jobs.
9) "The attributes that I look for in a job are fulfilled very well by my present job.
a) I didn't and still don't have a predefined model for the perfect job. Life consists of unplanned opportunities which contribute to job satisfaction. So my answer of less than strong agreement doesn't mean my job is lacking in this way.
10) The match is very good between the demands of my job and my personal skills a) Yes, in that the demands are related to my level of skill.
11) My personal values match the organization values and culture.
a) Spelling error (Was corrected)
12) The things I value in life are very similar to the things my organization values. a) These are similar questions I guess but with different responses
13) How many people work in the organization(s) that your job typically interacts with?
a) my organization or other organizations
b) awkward wording i) (Question Reworded: “How many people did you interact with while
performing your job within the last 6 months?” The youth leader question is “How many people attend your youth activities on a typical week.
272
Appendix T
Lean Leader and Youth Leader Feedback
273
Lean Leader and Youth Leader Feedback
Four lean leaders and four youth leaders reviewed the survey with the researcher and
provided comments. Frustration was confirmed with repeated questions with similar
content that were designed to measure item reliability. The relatively long length of the
survey was expected to reduce the response rate but they felt that it was reasonable given
the study objectives. They agreed that tasks to be assessed by task type were common
and the task descriptions were clear. The expected time to complete the survey was
returned to 20 minutes based on the feedback from the two groups.
Frustration with repeated questions in different form. X X X X
Length of Survey long but reasonable given objectives X X X X X X X X
Task descriptions were clear and common to the profession. X X X X X X X X
274
Appendix U
Task Assignment Tool Feedback Survey
275
Task Assignment Tool Feedback Survey
The Task Assignment Tool was developed by Bryan Booker from Western Michigan University's Department of Industrial & Manufacturing Engineering. This research is being conducted as part of the dissertation requirements for Bryan Booker. Instructions: Please answer the following six questions which are expected to take approximately 2 minutes to complete. Your replies will be completely anonymous, so do not put your name anywhere on the forms. You may choose to not answer any question and simply leave it blank. Participation is voluntary. This consent document was approved by Western Michigan University's HSIRB on October 23, 2009. Do not participate after February 26, 2011. Completing the survey indicates your consent for use of the answers you supply. If you have any questions, you may contact Dr. Larry Mallak at 269-276-3369, Bryan Booker at 616-886-9222, the Human Subjects Institutional Review Board (269-387-8293) or the vice president for research (269-387-8298). 1. Which of the following describe your job. (Check all that apply)
a) Lean Leader b) Youth Leader c) Process Improvement Leader d) Engineer e) Manager or Supervisor f) I Make Task Assignment Decisions g) If other, please specify
2. “I feel more CONFIDENT with the Task Assignment Tool predicted task
performance RATINGS than my initial task performance rating.” Strongly Disagree 1 2 3 4 5 6 7 Strongly Agree
4. “The Task Assignment Tool is a better PREDICTOR of task performance than methods I normally use.” Strongly Disagree 1 2 3 4 5 6 7 Strongly Agree
5. “I would RECOMMEND using a knowledge worker task assignment tool as a decision making job aid if a similar tool was adopted by my organization.” Strongly Disagree 1 2 3 4 5 6 7 Strongly Agree
6. “Considering all aspects of this Task Assignment Tool, my overall SATISFACTION is … Very Dissatisfied 1 2 3 4 5 6 7 Very Satisfied
7. What changes to the Task Assignment Tool would you recommend?
276
Appendix V
Human Subject Institutional Review Board Approval
277
278
279
Appendix W
Task Assignment Tool Improvement Feedback
280
Task Assignment Tool Responses to the Question:
What changes to the Task Assignment Tool would you recommend?
1. Better graphical presentation. More extensive definition of individual components of the items being measured in the tool.
2. Offer option for more people.
3. The entry of data into the tool is still dependent upon your overall feeling about the individuals. It
may be a good idea to remove personal emotion from the data entry and base it upon prior employee performance reports or some other form of tangible data.
4. The tool was useful and not obtrusive. I did find myself favoring one candidate over another.
That could cloud the results. I could see this expanded into a decision making tool. Kepner Tregoe has a Decision Analysis methodology that would fit this process very well. It was effective because it was simple. It was not comprehensive enough because it was simple. For simple decisions/assignments it works great.
5. Selection of questions with mutually exclusive answer choice. For example, loud speech, fast
paced and assertive is not necessarily mutually exclusive with calm, slow paced, empathetic. The tool seemed to predict the lower rating better than higher rating.
6. More initial training on input factors. Use of examples and guidelines for input of these factors. With an initial run through, and "making it up" as I went, I was impressed with how well the result came out. This from just moving the input sliders to an approximate location based on "guesstimate" of the factor. However with better guidance on the input, it appears it could be a significant decision making tool.
7. I think its a great tool to be able to evaluate who is better at a task. This would be very helpful in
management setting where multiple employees are being evaluated. If this tool was designed to tell me which person would be better at completing the task, then I believe it was valuable. I wish I could have asked someone questions regarding the results.
8. Somewhat confused as to the difference between skills and ability. These two terms seem the
same to me and I found it too difficult to think about what their differences would be.
9. I think the interpretation of the output requires more explanation, though training or a tutorial.
10. I like the concept of this tool and I think it works well for a "one task-two person" situation. I wonder if it's feasible to expand the tool so a manager can store the behaviors, personalities, and ratings of skill, knowledge, and ability for all of his/her employees. Then, when a new task arrives, simply input a few specific details and have the tool assign the task to one person out of a group of maybe 5-10.
11. It did take a little longer than five minutes to complete the first time. But could be quickly done in the future.
281
Appendix X
Task Assignment Tool Variable Correlations Tables by Task Type
282
Task Assignment Tool Variable Correlations Tables by Task Type
Factors Ability Career Plan Idea Know-
ledgePreferred Behavior Plan Positive
Value Skill Take Charge Team
Ability 1Career Plan .255** 1
Idea 0.067 0.187* 1Knowledge .647*** .423*** .286** 1