Page 1
I
Development of a tool for automatic
segmentation of the cerebellum in MR
images of children
Priya Lakshmi Narayanan
Department of Human Biology
University of Cape Town
Thesis presented for the degree of
Doctor of Philosophy
February 2015
Page 2
I
Declaration
I, Priya Lakshmi Narayanan, hereby declare that the above thesis is my own
unaided work both in concept and execution, and that apart from the normal
guidance from my supervisor, I have received no assistance.
The thesis has been presented by me for examination for the degree of Doctor of
Philosophy in Medicine in Biomedical Engineering.
----------------
Signature
09.02.2015
----------------
Date
Page 3
II
Abstract Thesis: Development of a tool for automatic segmentation of the cerebellum in
MR images of children
Author’s Name: Priya Lakshmi Narayanan Date: 09-02-2015
The human cerebellar cortex is a highly foliated structure that supports both motor and
complex cognitive functions in humans. Magnetic Resonance Imaging (MRI) is commonly
used to explore structural alterations in patients with psychiatric and neurological diseases.
The ability to detect regional structural differences in cerebellar lobules may provide valuable
insights into disease biology, progression and response to treatment, but has been hampered
by the lack of appropriate tools for performing automated structural cerebellar segmentation
and morphometry.
In this thesis, time intensive manual tracings by an expert neuroanatomist of 16 cerebellar
regions on high-resolution T1-weighted MR images of 18 children aged 9-13 years were used
to generate the Cape Town Pediatric Cerebellar Atlas (CAPCA18) in the age-appropriate
National Institute of Health Pediatric Database (NIHPD) asymmetric template space. An
automated pipeline was developed to process the MR images and generate lobule-wise
segmentations, as well as a measure of the uncertainty of the label assignments. Validation in
an independent group of children with ages similar to those of the children used in the
construction of the atlas, yielded spatial overlaps with manual segmentations greater than
70% in all lobules, except lobules VIIb and X. Average spatial overlap of the whole
cerebellar cortex was 86%, compared to 78% using the alternative Spatially Unbiased Infra-
tentorial Template (SUIT), which was developed using adult images.
Since multi atlas fusion methods account for inter subject variability and reduce residual
errors that may arise from using an atlas developed from a different population, we were
interested in investigating whether our pre-adolescent training data could be used to
accurately segment an adult data set. The performance of three different methods to
propagate labels from the pre-adolescent training data used in the construction of the
CAPCA18 atlas to 35 adult subjects were compared in the next section. These included direct
warping of CAPCA18, multi atlas majority voting (MAMV) and multi atlas generative model
Page 4
III
(MAGM) based label fusion. Our results demonstrate that multi atlas based label propagation
methods achieved good segmentation accuracy and consistently performed better than direct
warping, presumably due to the fact that these methods capture more of the variation present
in the training data.
Finally, we compared cerebellar segmentation accuracy in the 35 adult test subjects between
these two different multi atlas label fusion methods using the manually segmented data of 20
training subjects that were used in the construction of SUIT. Even though the training and test
data were collected in two different laboratories on two different scanner platforms, mean
Dice coefficients in the test subjects were greater than 0.89 in all regions except lobules VIIb,
VIIIa, VIIIb, and X, confirming the robustness and reliability of our multi atlas segmentation
pipeline.
Page 5
IV
Acknowledgements
First and foremost, I would like to express my sincere gratitude to my supervisor Ernesta
Meintjes for her advice, support, encouragement and MRI expertise. Also I would like to
extend my special thanks to her for advising me on my thesis despite of all the mysteries
happened in the last minute. I truly appreciate the many hours she spent on revisions of the
chapters and as well as the time she spent on discussion in critical hours.
My deepest gratitude goes to Dr Andre van der Kouwe for welcoming me into the laboratory
of computational neuroimaging during my visit to the Martinos centre. His support,
encouragement in the field of MRI was most valuable. I would like to thank Dr Lilla Zöllei,
for her valuable advice and review of different draft versions of my two chapters with so
much patience, and her willingness to collaborate in this project.
I got the opportunity to work in an innovative, independent and truly multidisciplinary
project. I also thank Dr. Christopher Warton, who has really shared his time to educate me
about the concepts in neuroscience. My friends and colleagues at the lab provided a joyful
and energetic atmosphere. Also, thank you Ali Alhamud, Jia Fan and Dan Auger for
rendering all possible help throughout the years. I would also like to thank my collegues:
Frances Robertson, Kenneth Mbugua, Keri Woods, Lindie Du Plessis, Mohammed Saleh,
Paul Taylor and Martha Holmes for all the discussions related to MRI and its different
perspectives. You have all turned my graduate life to an amazing learning experience.
I am grateful to my parents and also very much indebted to their patience throughout my
graduate life. My mother has really extended all possible help without which I would not
have been able to do my few chapters.
Finally, I am grateful to my son Ryan and my husband Jesuchristopher who patiently listened
to me grumble about my thesis and supported me during all my four years at Cape Town.
Page 6
V
Table of Contents
Declaration ................................................................................................................................. I
Abstract ..................................................................................................................................... II
Acknowledgements .................................................................................................................. IV
Table of Contents ...................................................................................................................... V
List of Tables ......................................................................................................................... VII
List of Figures ....................................................................................................................... VIII
List of Abbreviations………………………………………………………………………..XII
Preface……………………………………………………………………………………...XIII
1. Introduction .......................................................................................................................... 1
1.1 Anatomy of the human brain ............................................................................................ 3
1.2 Medical Imaging .............................................................................................................. 6
1.3 Medical Imaging Modalities ............................................................................................ 7
1.3.1 Computed Tomography ............................................................................................. 7
1.3.2 Positron Emission Tomography ................................................................................ 8
1.3.3 Magnetic Resonance Imaging ................................................................................... 8
1.4 Image Registration ......................................................................................................... 12
1.5 Brain Template ............................................................................................................... 20
1.6 Brain Atlas...................................................................................................................... 23
1.7 Structural MR Image Analysis ....................................................................................... 26
1.7.1 MR Image Label Map .............................................................................................. 27
1.7.2 Automated cerebellar structure segmentation methods ........................................... 27
1.7.3 Atlas-based segmentation ........................................................................................ 28
1.7.4 Multi-atlas based segmentation ............................................................................... 29
Page 7
VI
2. Improved labelling of cerebellar structures in children using probabilistic atlas-based
segmentation ........................................................................................................................... 31
2.1 Introduction .................................................................................................................... 33
2.2 Methods .......................................................................................................................... 36
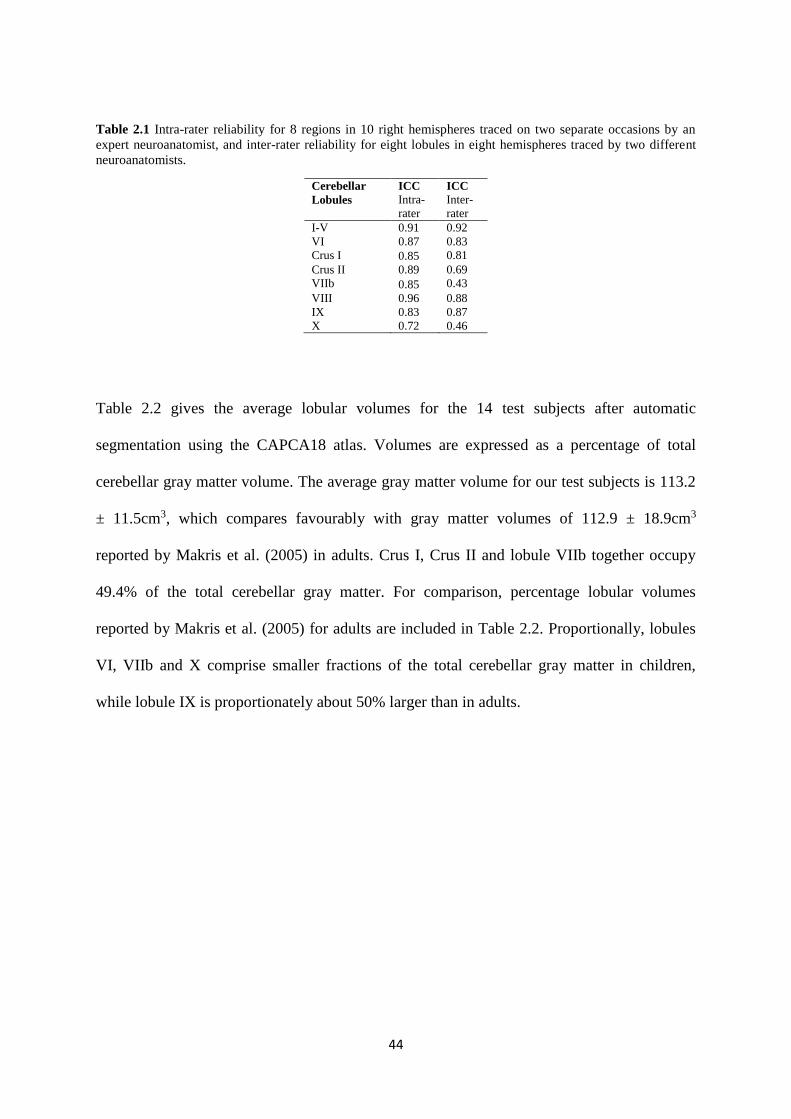
2.3 Results ............................................................................................................................ 43
2.4 Discussion ...................................................................................................................... 49
2.5 Conclusion ...................................................................................................................... 52
3. Assessment of different label propagation methods for segmenting cerebellar
structures in adults using the CAPCA18 pediatric cerebellar atlas .................................. 54
3.1 Introduction .................................................................................................................... 55
3.2 Materials and Methods ................................................................................................... 59
3.3 Results ............................................................................................................................ 66
3.4 Discussion ...................................................................................................................... 72
3.5 Conclusion ...................................................................................................................... 73
4. Multi Atlas based labelling of cerebellar structures ....................................................... 74
4.1 Introduction .................................................................................................................... 75
4.2 Methods .......................................................................................................................... 78
4.3 Results ............................................................................................................................ 83
4.4 Discussion ...................................................................................................................... 90
4.5 Conclusion ...................................................................................................................... 93
5. Discussion............................................................................................................................ 94
6. Conclusions ....................................................................................................................... 102
Page 8
VII
List of Tables
Table. 1.1 Features of different adult brain templates ............................................................. 22
Table 2.1 Intra-rater reliability for 8 regions in 10 right hemispheres traced on two separate
occasions by an expert neuroanatomist, and inter-rater reliability for eight lobules in eight
hemispheres traced by two different neuroanatomists. ............................................................ 44
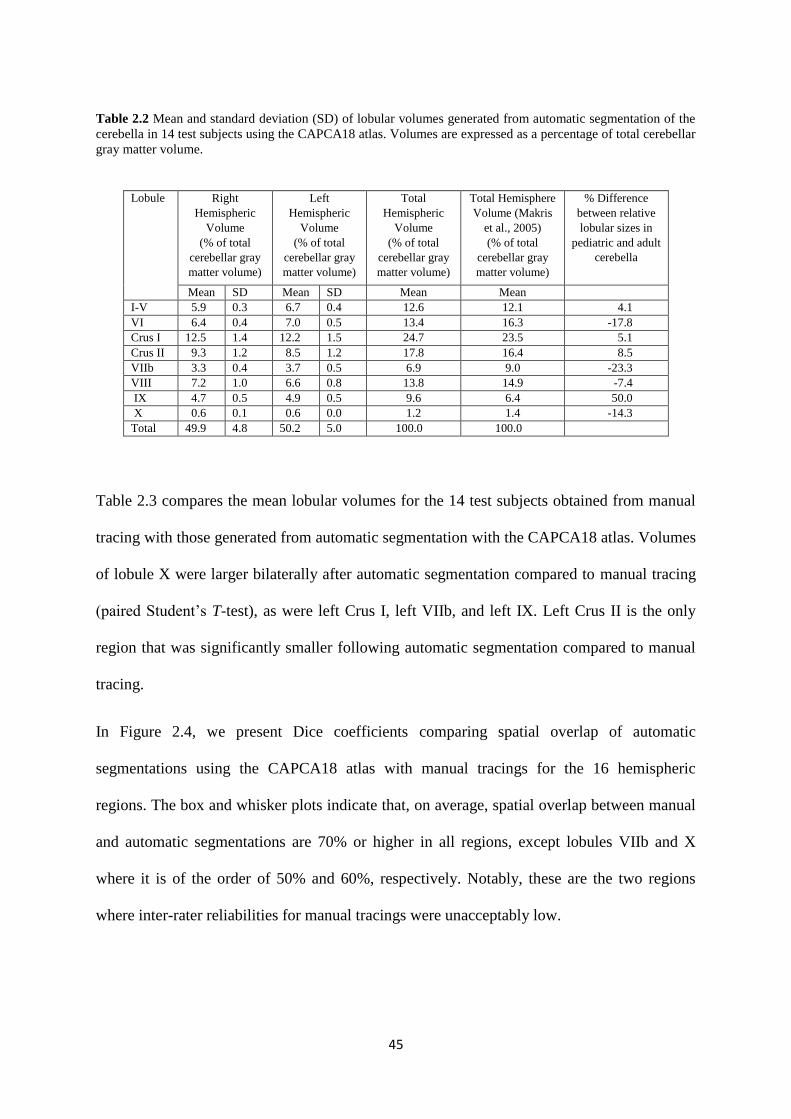
Table 2.2 Mean and standard deviation (SD) of lobular volumes generated from automatic
segmentation of the cerebellain 14 test subjects using the CAPCA18 atlas. Volumes are
expressed as a percentage of total cerebellar gray matter volume. .......................................... 45
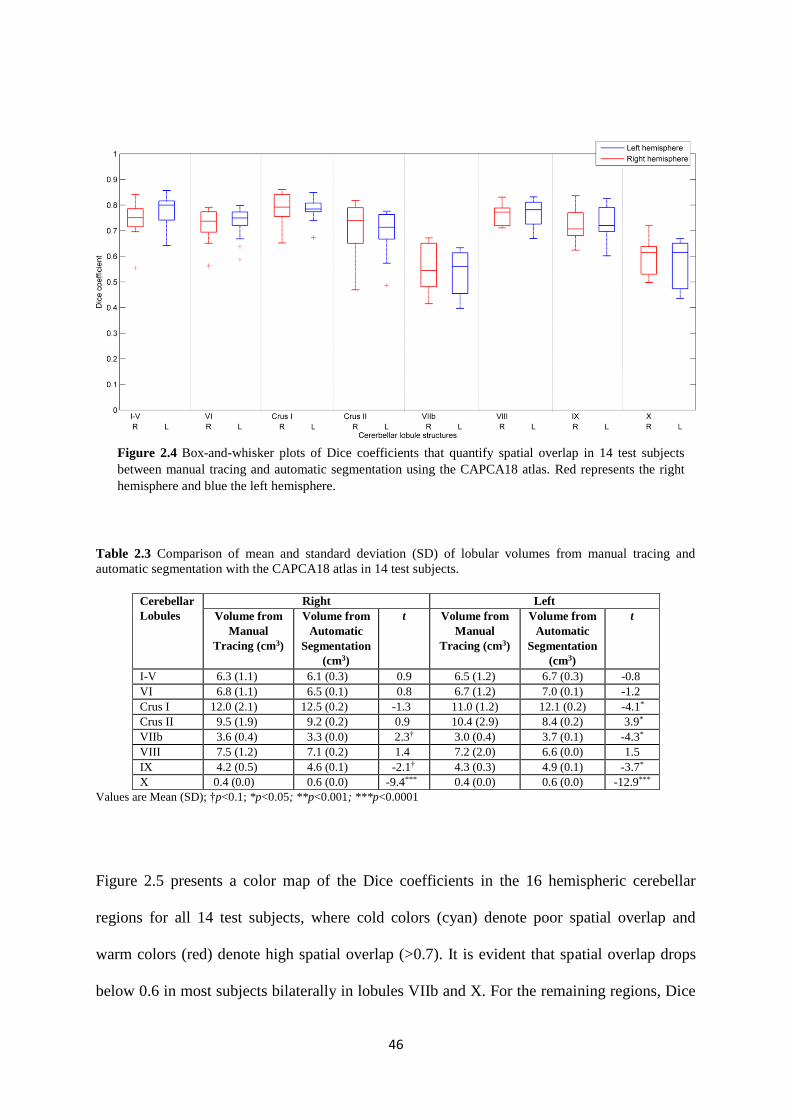
Table 2.3 Comparison of mean and standard deviation (SD) of lobular volumes from manual
tracing and automatic segmentation with the CAPCA18 atlas in 14 test subjects. ................. 46
Table 2.4 Comparison of mean and standard deviation (SD) of volumes of cerebellar lobules
obtained from manual tracing and SUIT segmentation in 14 test subjects.............................. 47
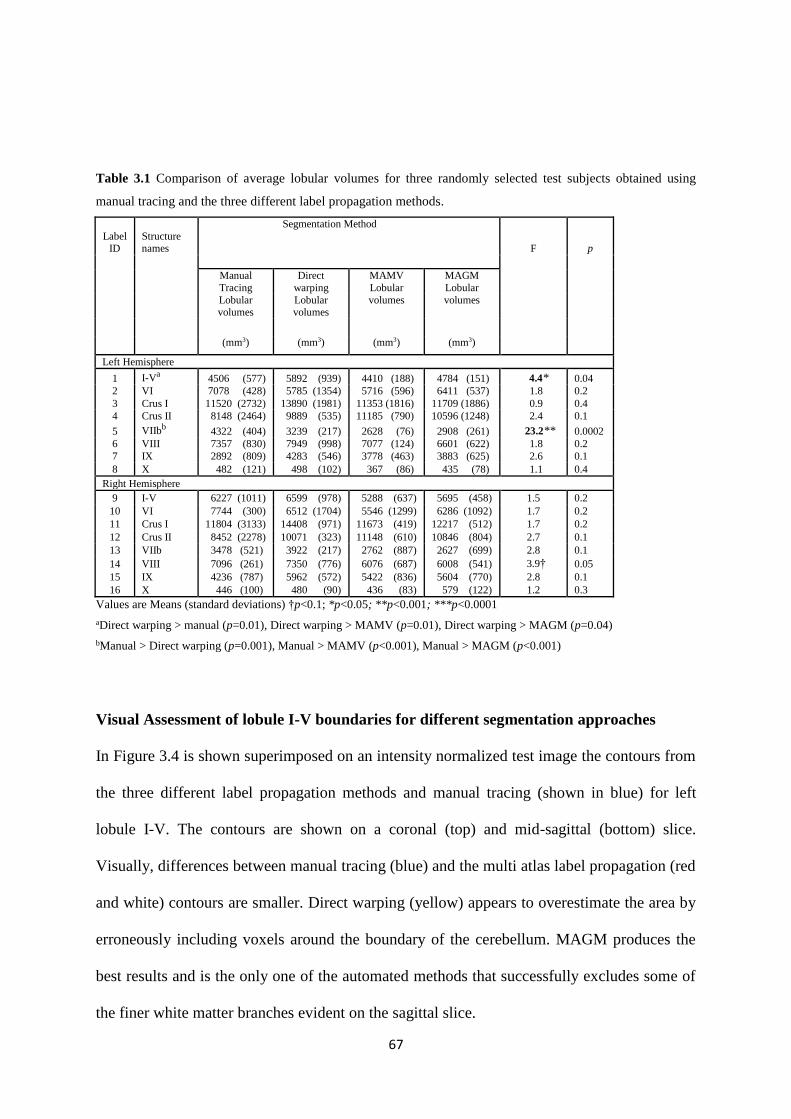
Table 3.1 Comparison of average lobular volumes for three randomly selected test subjects
obtained using manual tracing and the three different label propagation methods. ................ 67
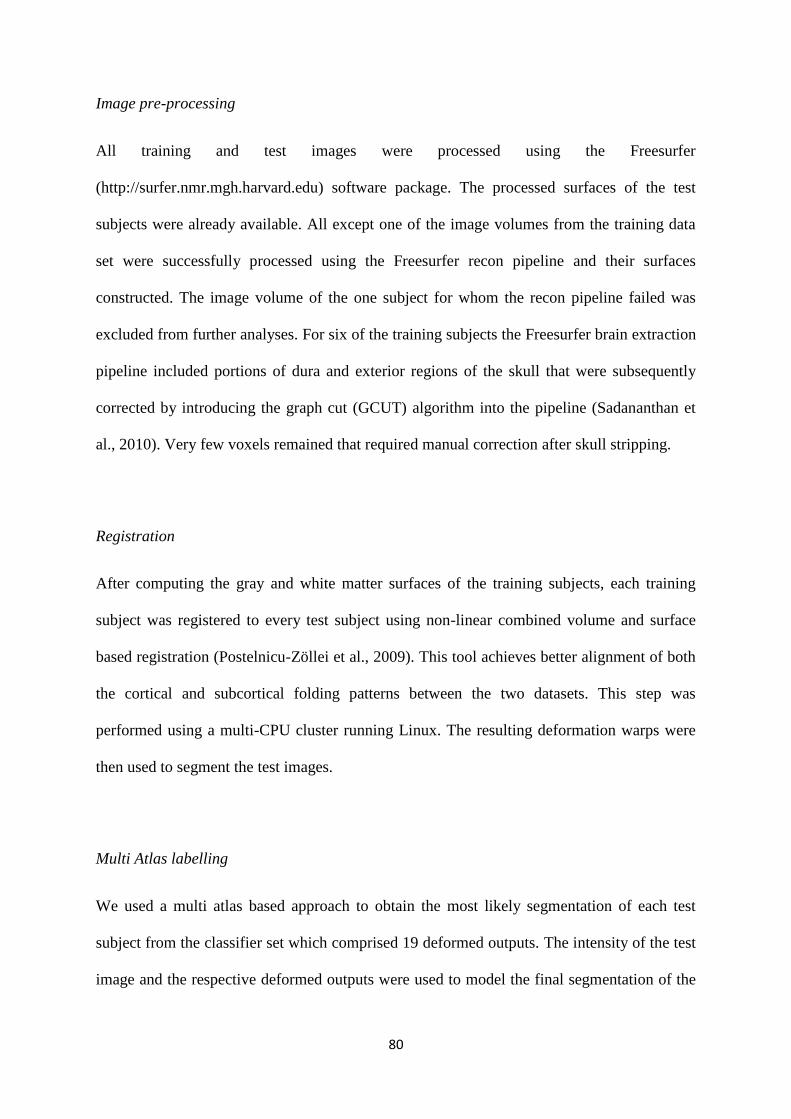
Table 4.1 The 28 cerebellar structures and their color representations as used in the current
study ......................................................................................................................................... 79
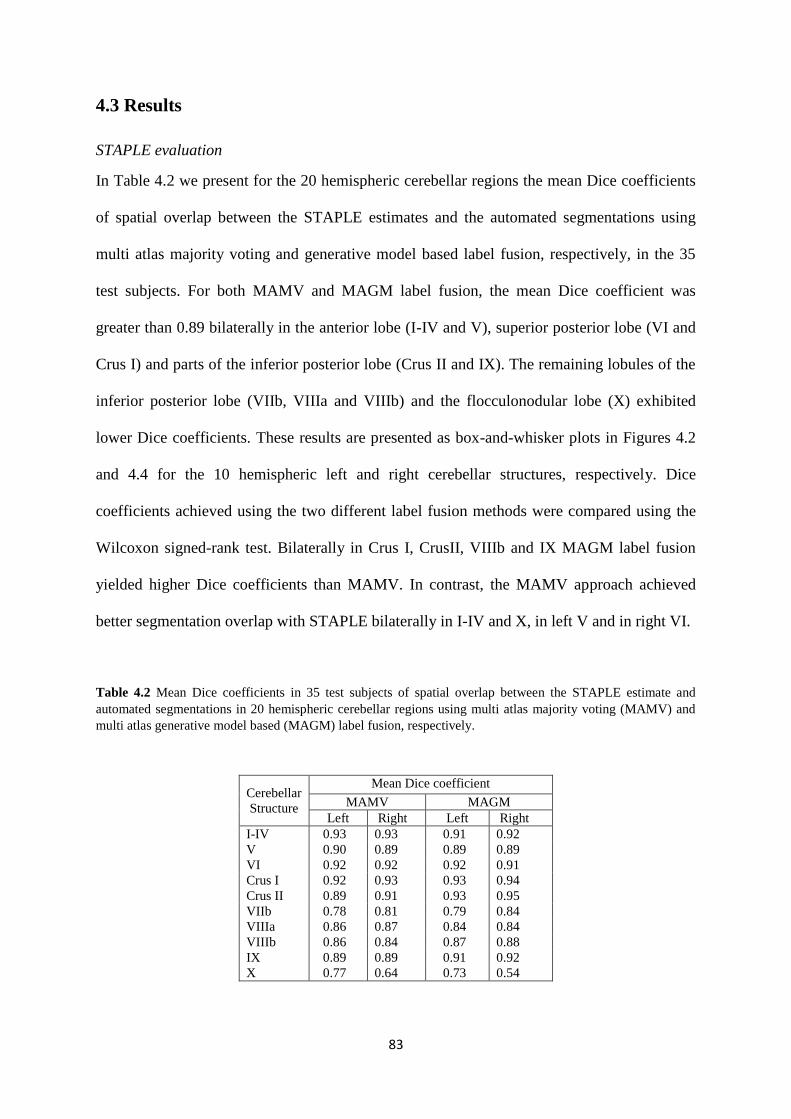
Table 4.2 Mean Dice coefficients in 35 test subjects of spatial overlap between the STAPLE
estimate and automated segmentations in 20 hemispheric cerebellar regions using multi atlas
majority voting (MAMV) and multi atlas generative model based (MAGM) label fusion,
respectively. ............................................................................................................................. 83
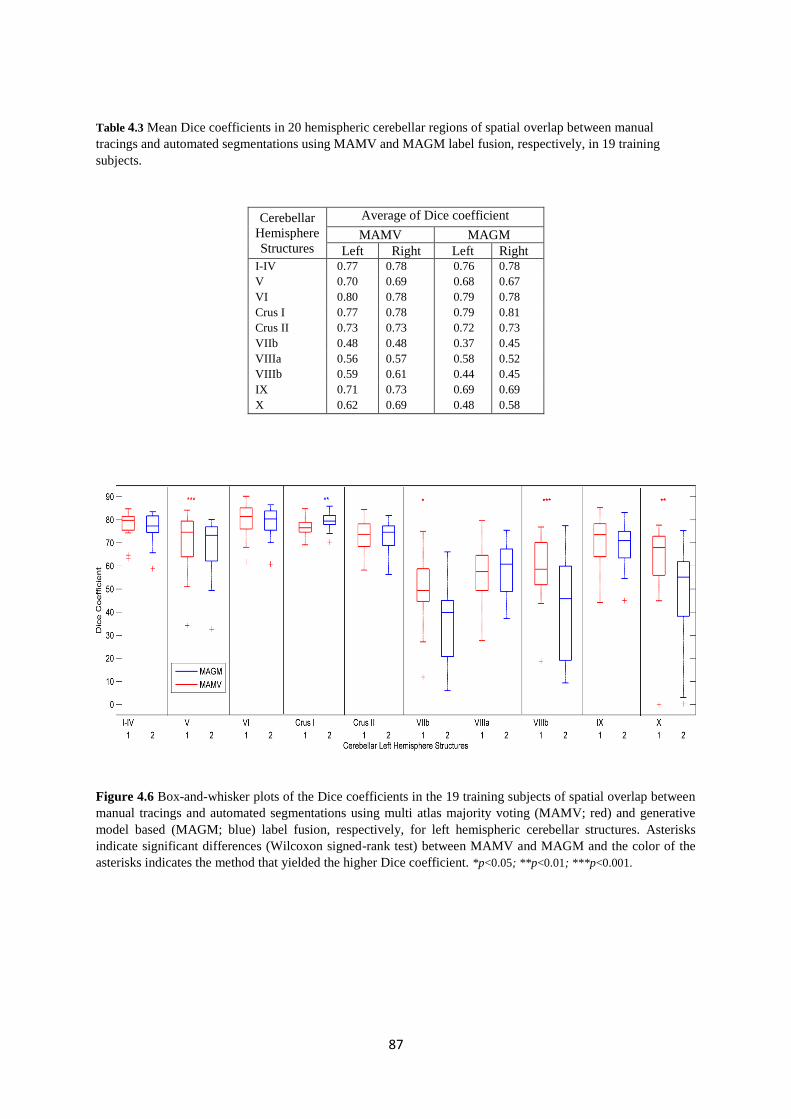
Table 4.3 Mean Dice coefficients in 20 hemispheric cerebellar regions of spatial overlap
between manual tracings and automated segmentations using MAMV and MAGM label
fusion, respectively, in 19 training subjects. ............................................................................ 87
Page 9
VIII
List of Figures
1.1 Somatotopic representation of structure and function of cerebellum (Left). (Images
reproduced from Ermanno Manni and Laura Petrosini (2004)). Histological images (Right)
representing anterior view (A and B), posterior view (C and D), inferior view (E and F) of the
cerebellum. ................................................................................................................................. 5
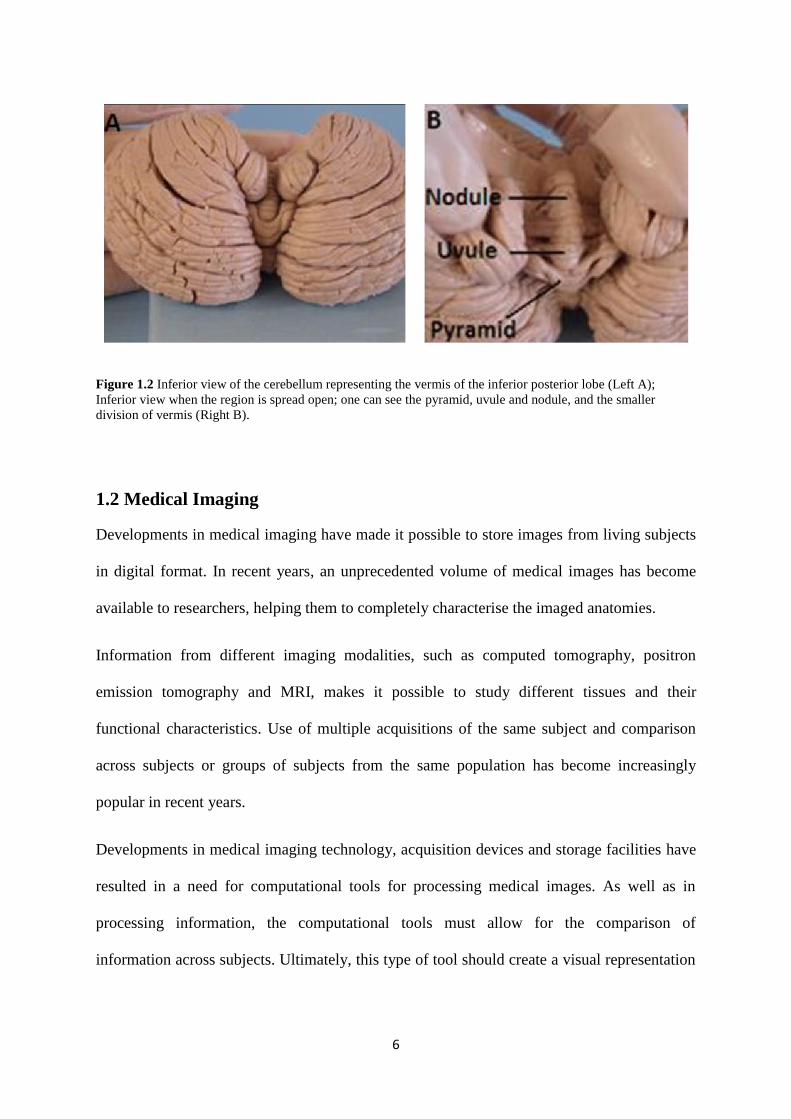
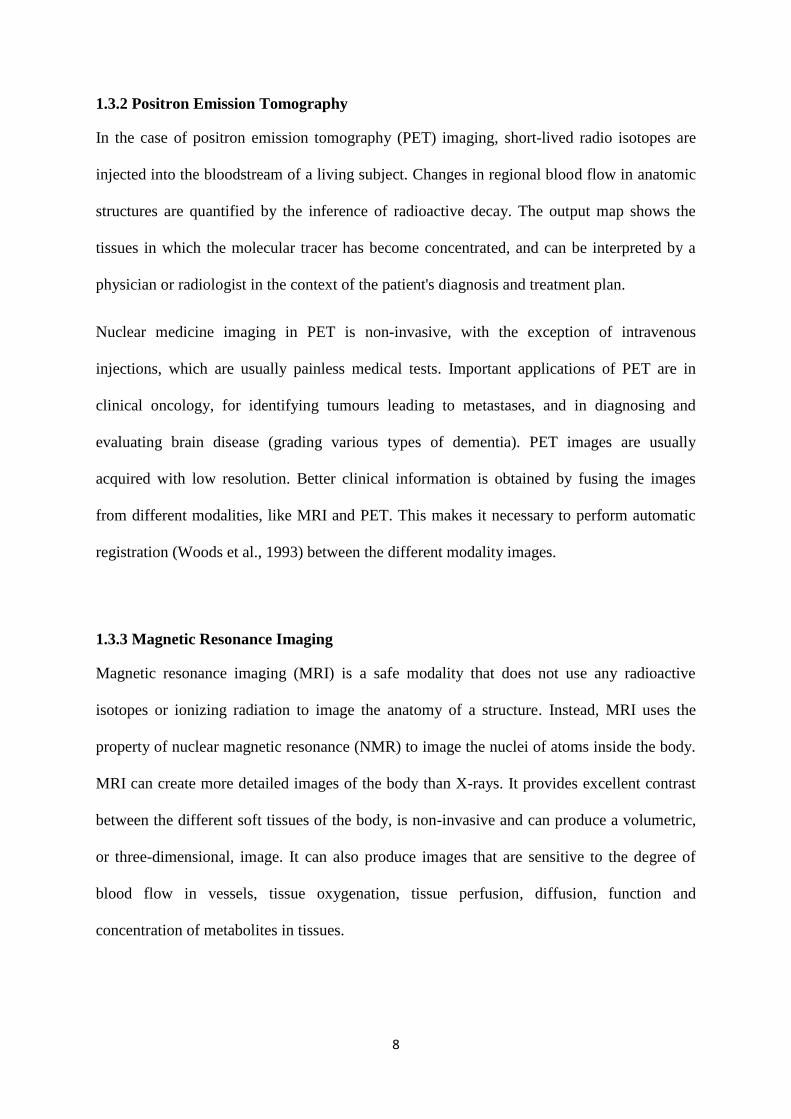
1.2 Inferior view of the cerebellum representing the vermis of the inferior posterior lobe (Left
A); Inferior view when the region is spread open; one can see the pyramid, uvule and nodule,
and the smaller division of vermis (Right B). ............................................................................ 6
1.3 Wrap-around artefact (yellow arrow) that shows the patient nose in each of the orthogonal
planes (sagittal, and axial) ........................................................................................................ 12
1.4 Schematic representing the three components of image registration ................................. 13
1.5 Example of 2D image rigid registration............................................................................. 15
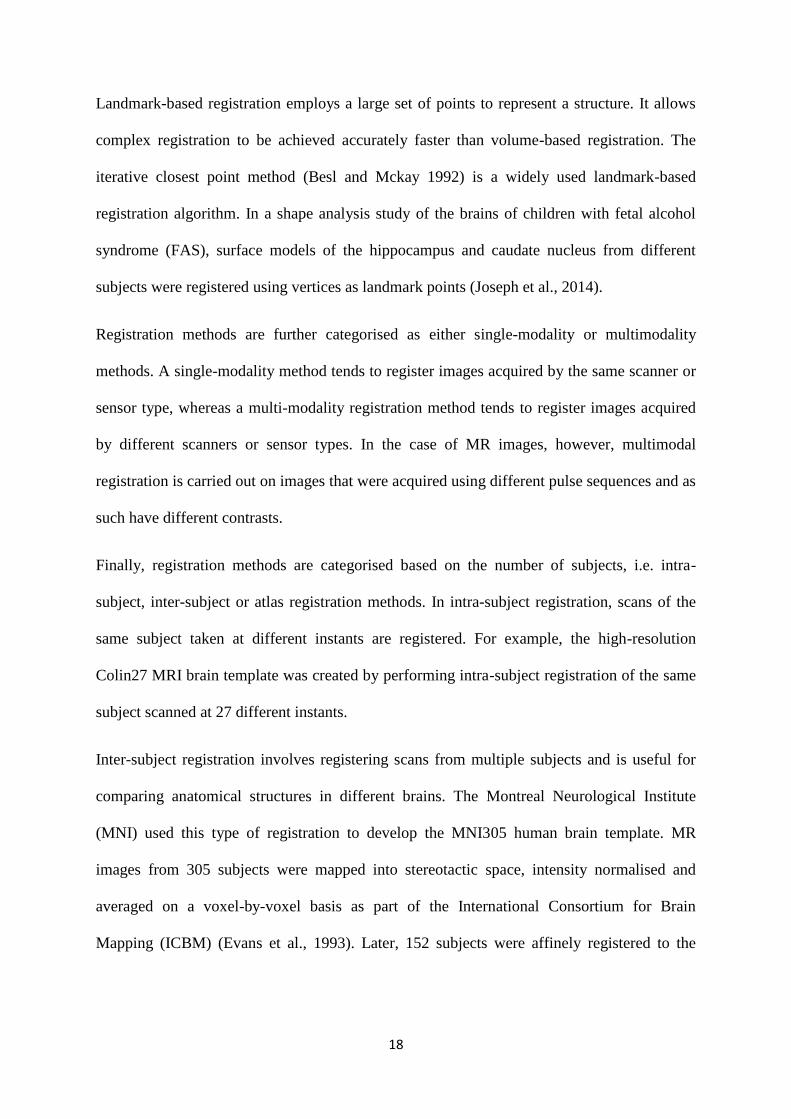
1.6 Average anatomical image of the cerebellum before registration (left) ; Average
anatomical image after affine linear registration to the national institute of health pediatric
database (NIHPD) template (middle); Average anatomical image after affine linear and non-
linear registration with the NIHPD template (right). ............................................................... 20
1.7 The intersection of lines passing through anterior commissure (AC) and posterior
commissure (PC) define the origin of the stereotactic co-ordinate system. The left quadrant
takes negative values and the right quadrant takes positive values. ........................................ 22
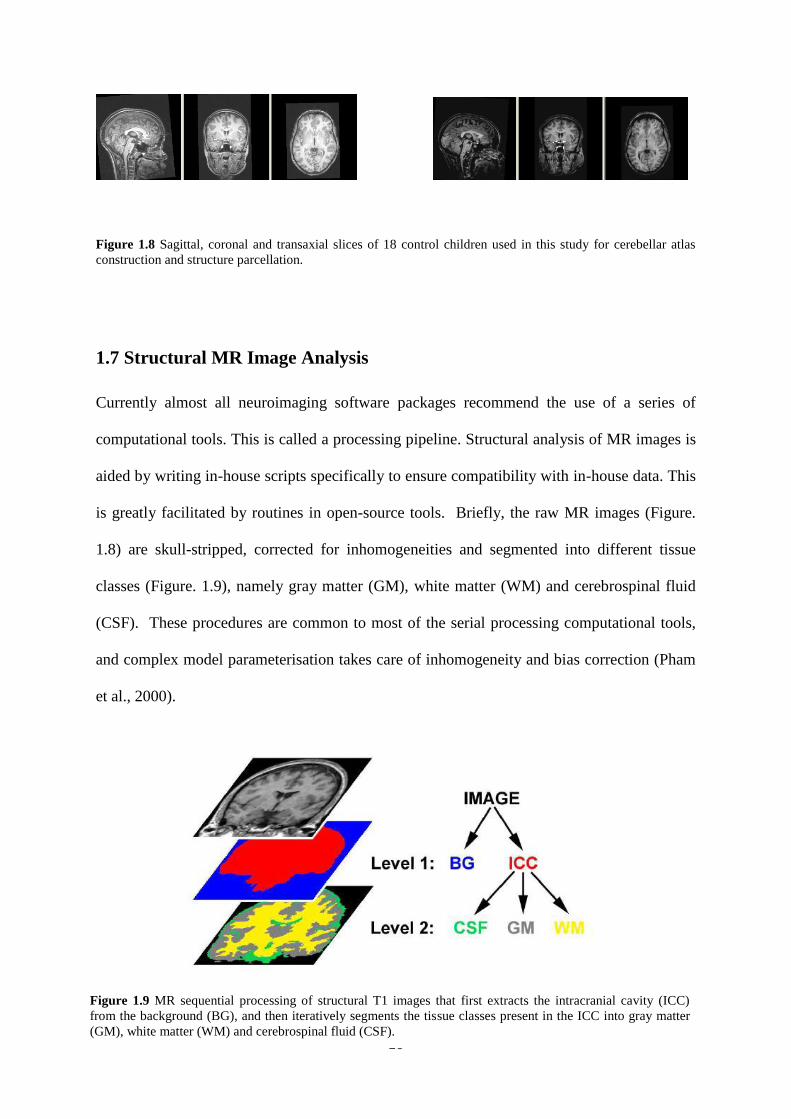
1.8 Sagittal, coronal and transaxial slices of 18 control children used in this study for
cerebellar atlas construction and structure parcellation. .......................................................... 26
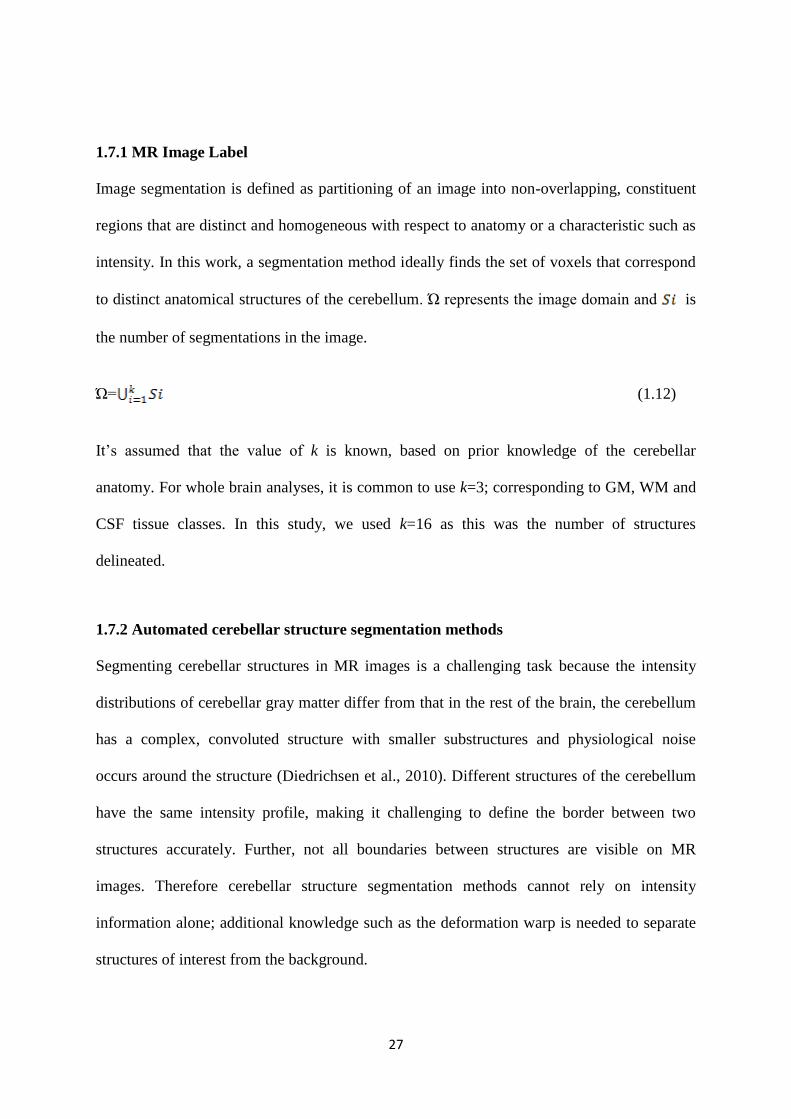
1.9 MR sequential processing of structural T1 images that first extracts the intracranial cavity
(ICC) from the background (BG), and then iteratively segments the tissue classes present in
the ICC into gray matter (GM), white matter (WM) and cerebrospinal fluid (CSF)............... 26
1.10 Schematic of atlas based segmentation. ........................................................................... 29
1.11 Schematic of multi atlas based segmentation. ................................................................. 30
Page 10
IX
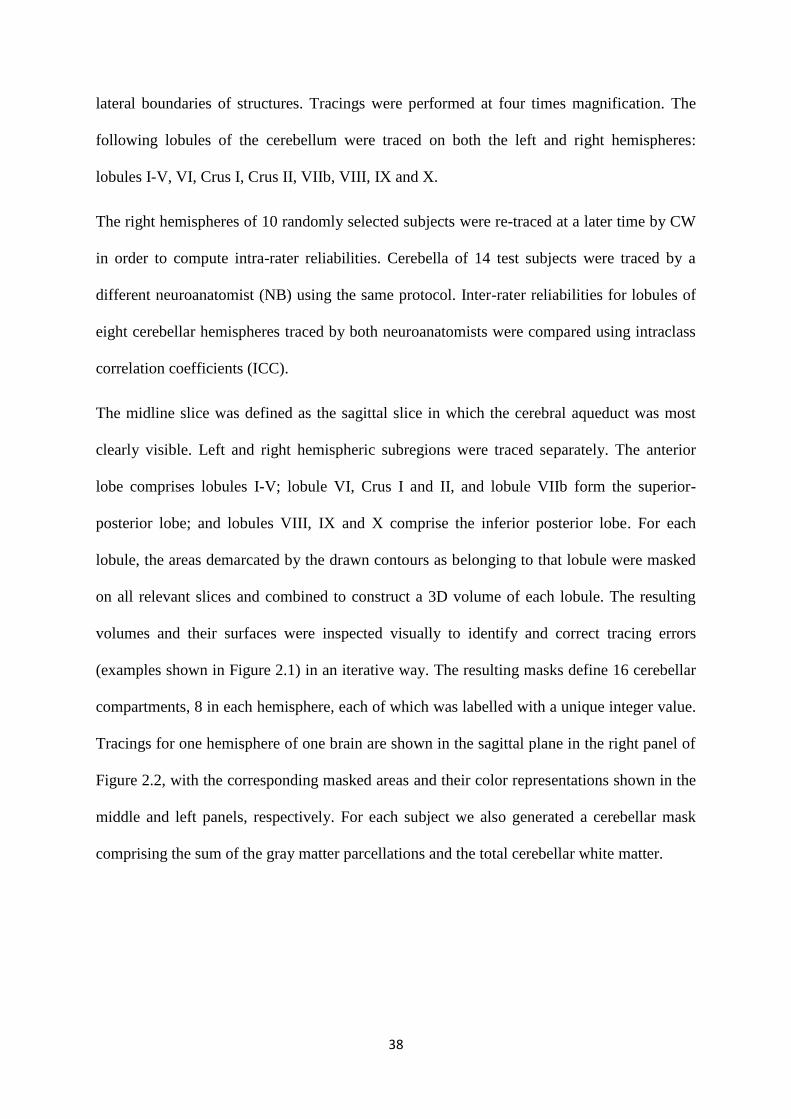
2.1 Illustration of Crus II volumes for the 18 training subjects with tracing errors in two
(indicated by the black arrows), which were manually corrected by the expert
neuroanatomist. ........................................................................................................................ 39
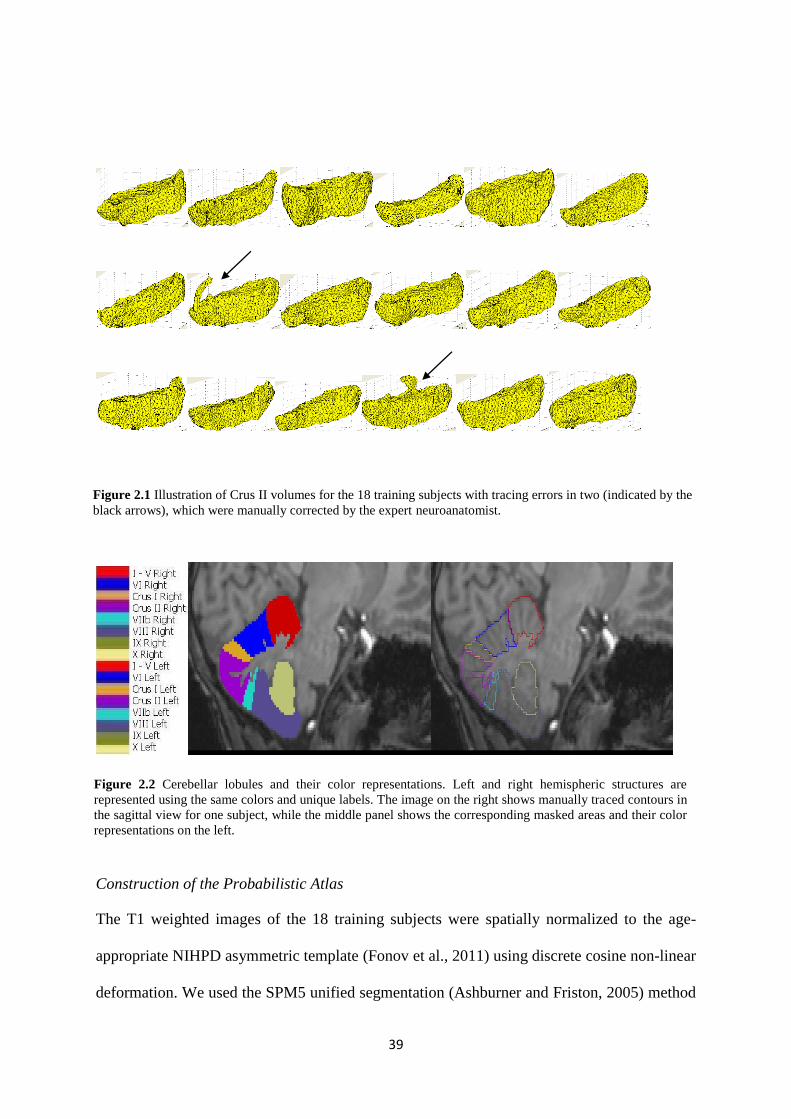
2.2 Cerebellar lobules and their color representations. Left and right hemispheric structures
are represented using the same colors and unique labels. The image on the right shows
manually traced contours in the sagittal view for one subject, while the middle panel shows
the corresponding masked areas and their color representations on the left. ........................... 39
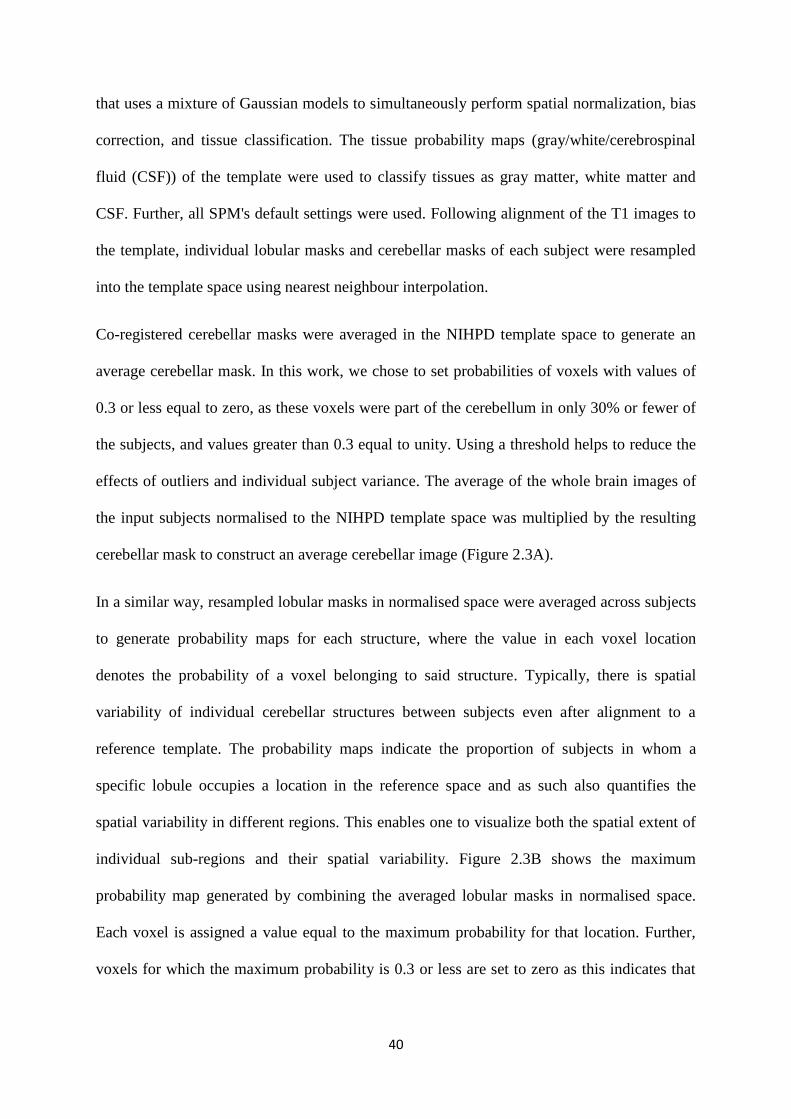
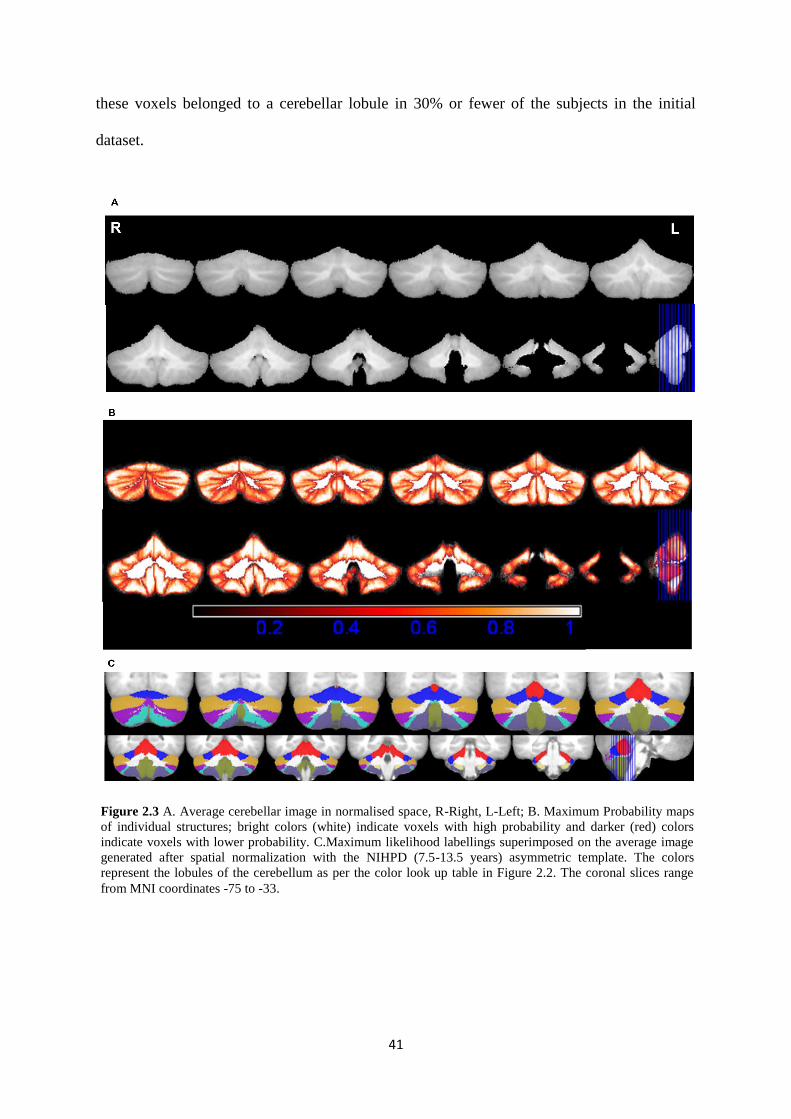
2.3 A. Average cerebellar image in normalised space, R-Right, L-Left; B. Maximum
Probability maps of individual structures; bright colors (white) indicate voxels with high
probability and darker (red) colors indicate voxels with lower probability. C. Maximum
likelihood labellings superimposed on the average image generated after spatial
normalization with the NIHPD (7.5 - 13.5 years) asymmetric template. The colors represent
the lobules of the cerebellum as per the color look up table in Figure 2.2. The coronal slices
range from MNI coordinates -75 to -33. .................................................................................. 41
2.4 Box-and-whisker plots of Dice coefficients that quantify spatial overlap in 14 test subjects
between manual tracing and automatic segmentation using the CAPCA18 atlas. Red
represents the right hemisphere and blue the left hemisphere. ................................................ 46
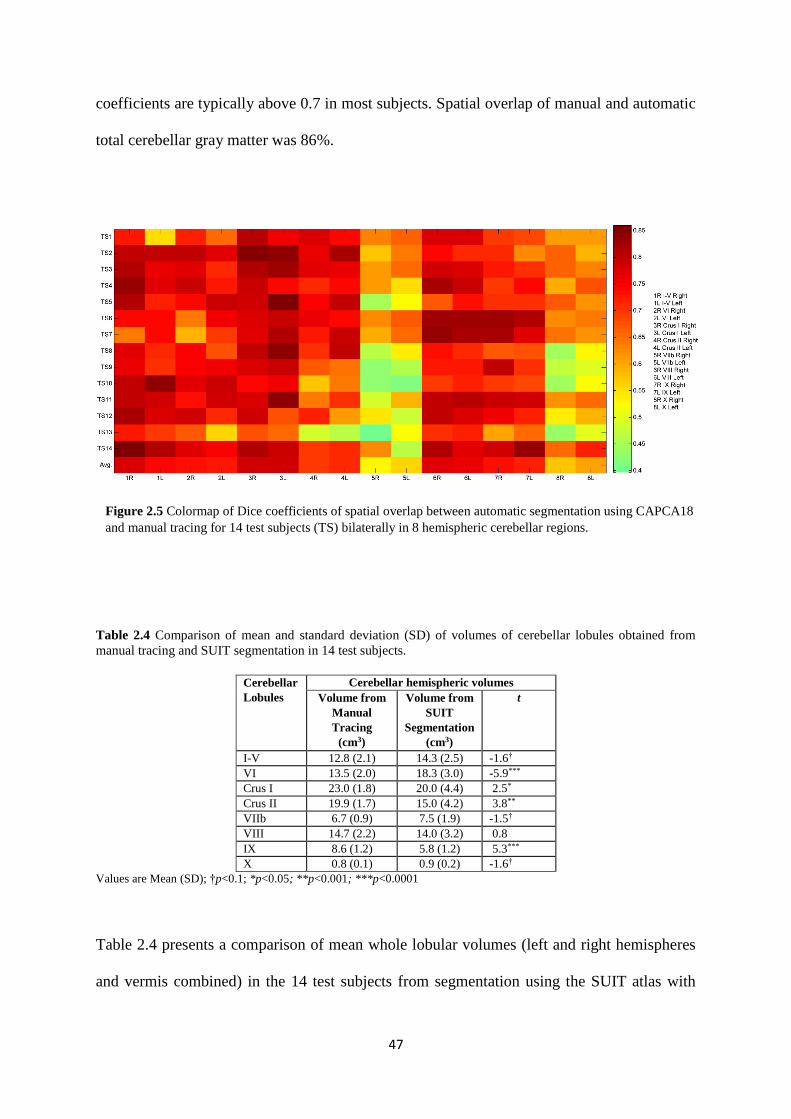
2.5 Colormap of Dice coefficients of spatial overlap between automatic segmentation using
CAPCA18 and manual tracing for 14 test subjects (TS) bilaterally in 8 hemispheric cerebellar
regions. ..................................................................................................................................... 47
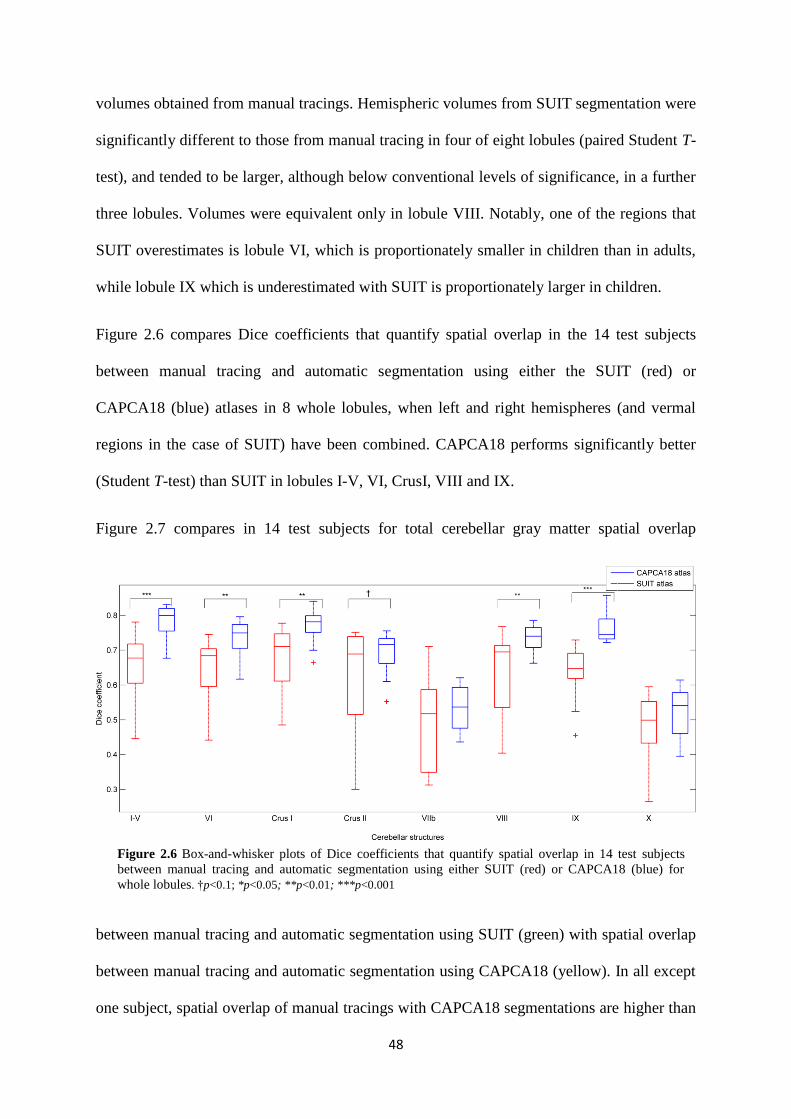
2.6 Box-and-whisker plots of Dice coefficients that quantify spatial overlap in 14 test subjects
between manual tracing and automatic segmentation using either SUIT (red) or CAPCA18
(blue) for whole lobules. .......................................................................................................... 48
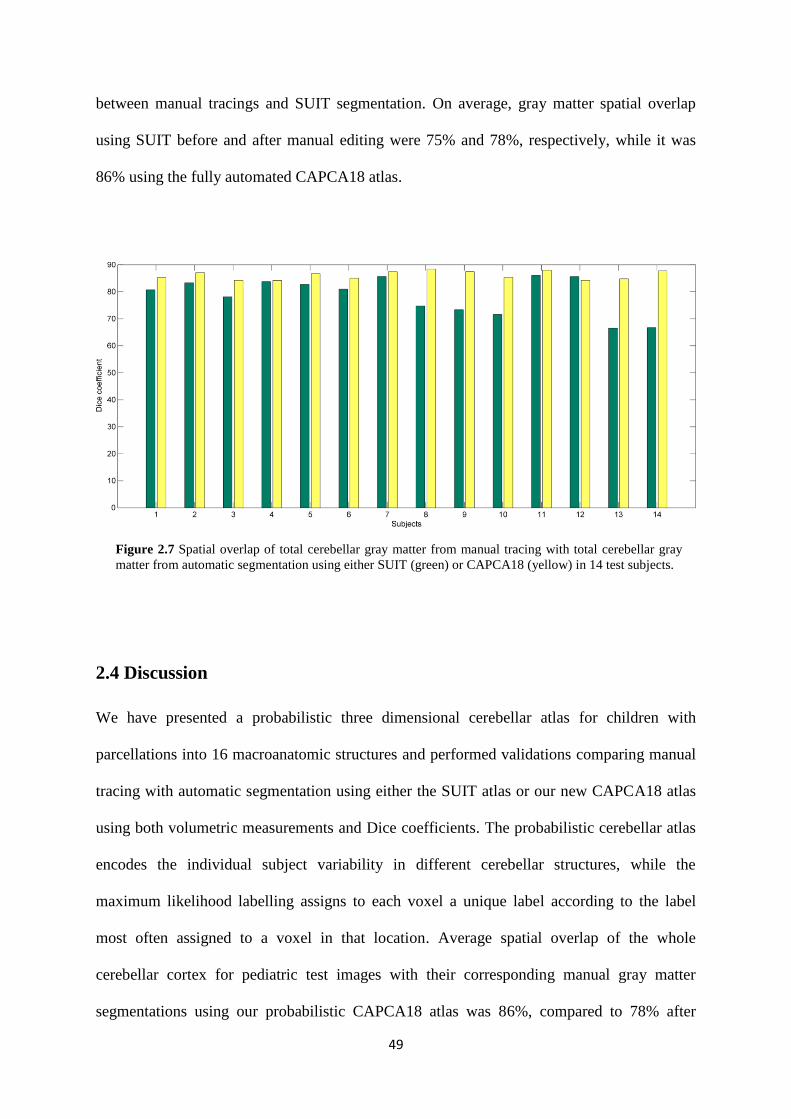
2.7 Spatial overlap of total cerebellar gray matter from manual tracing with total cerebellar
gray matter from automatic segmentation using either SUIT (green) or CAPCA18 (yellow) in
14 test subjects. ........................................................................................................................ 49
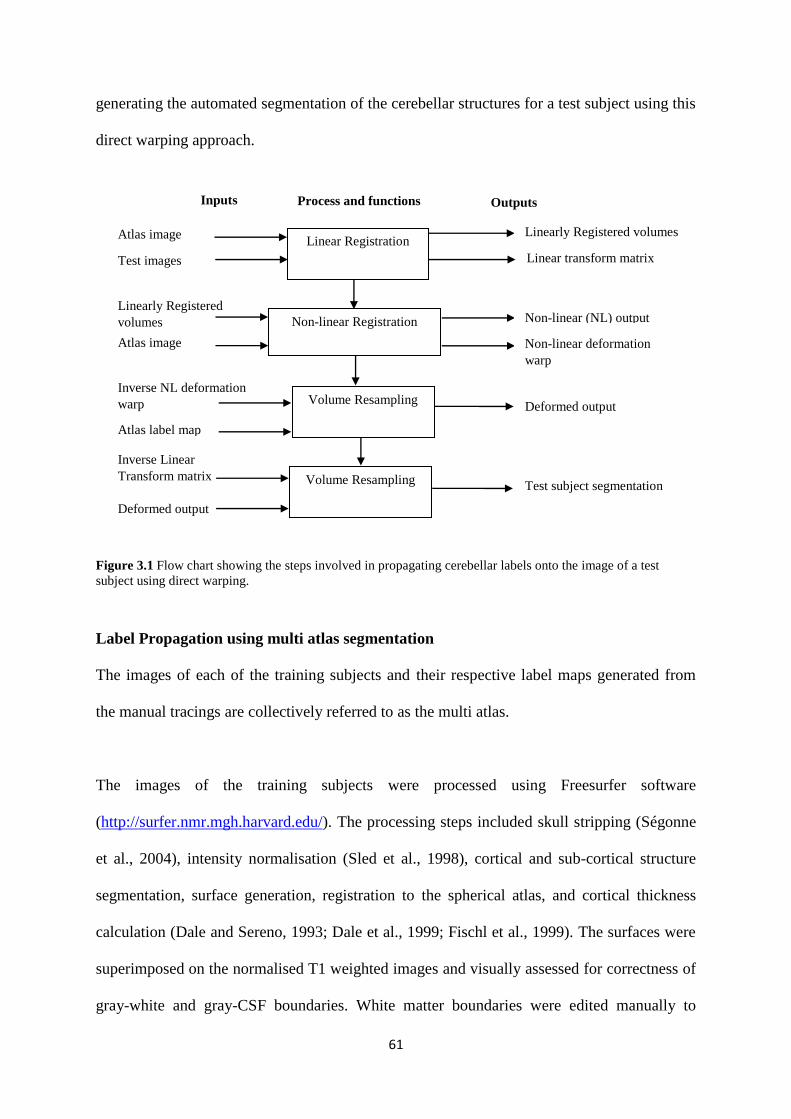
3.1 Flow chart showing the steps involved in propagating cerebellar labels onto the image of
a test subject using direct warping. .......................................................................................... 61
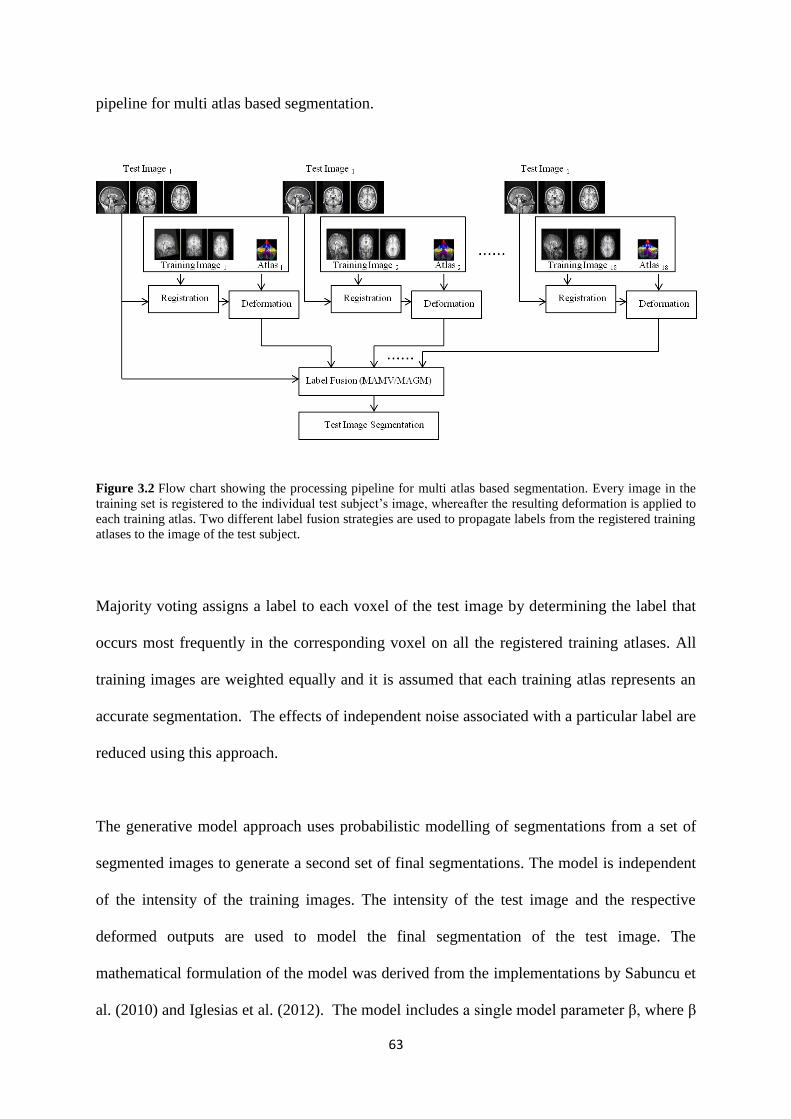
3.2 Flow chart showing the processing pipeline for multi atlas based segmentation. Every
image in the training set is registered to the individual test subject’s image, whereafter the
resulting deformation is applied to each training atlas. Two different label fusion strategies
are used to propagate labels from the registered training atlases to the image of the test
subject. ..................................................................................................................................... 63
Page 11
X
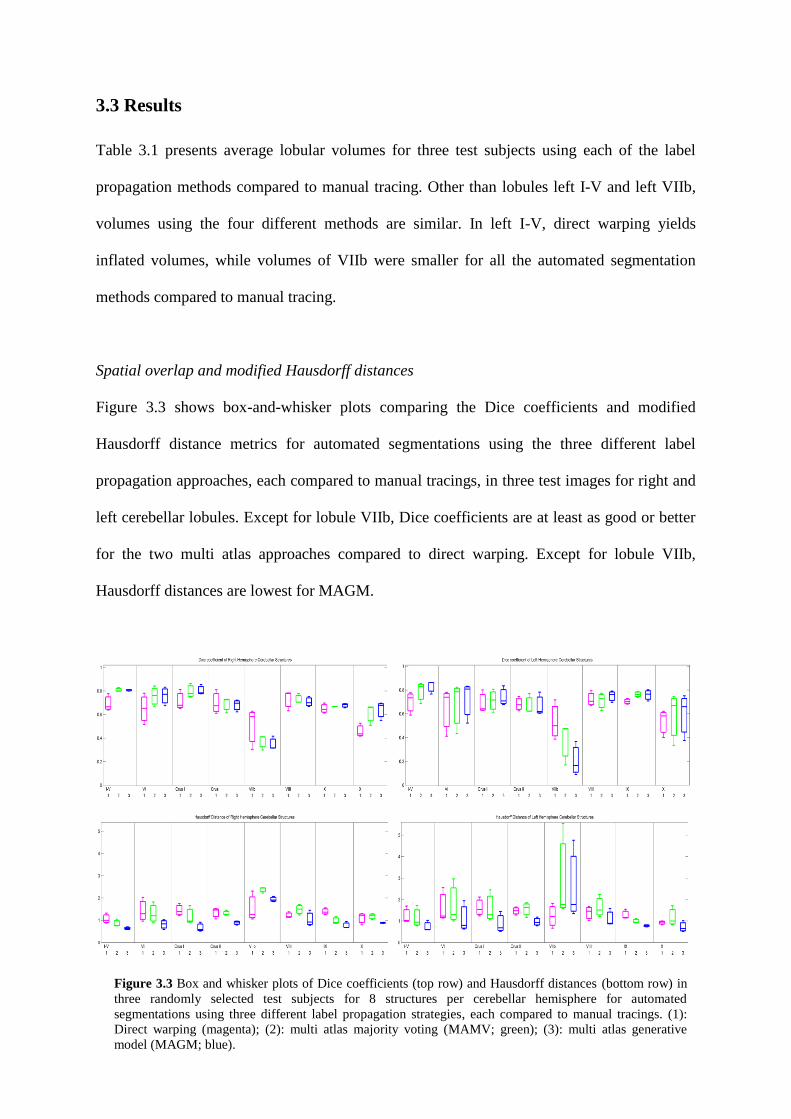
3.3 Box and whisker plots of Dice coefficients (top row) and Hausdorff distances (bottom
row) in three randomly selected test subjects for 8 structures per cerebellar hemisphere for
automated segmentations using three different label propagation strategies, each compared to
manual tracings. (1): Direct warping (magenta); (2): multi atlas majority voting (MAMV;
green); (3): multi atlas generative model (MAGM; blue). ...................................................... 66
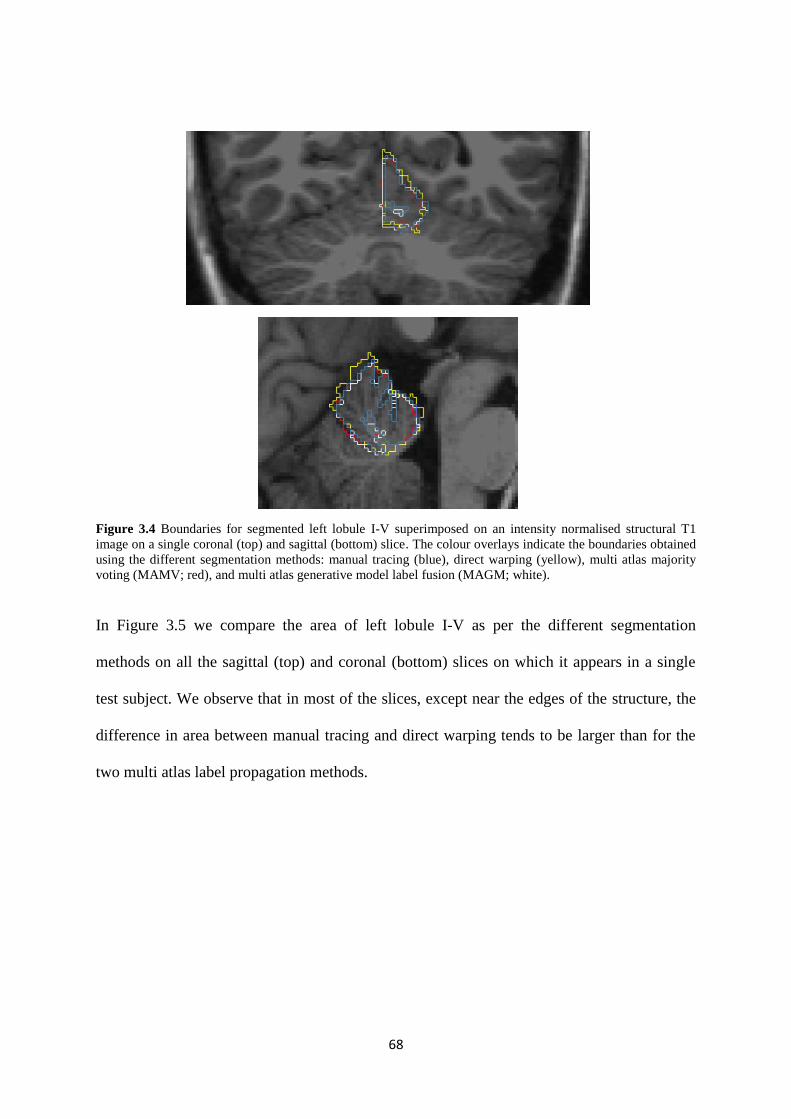
3.4 Boundaries for segmented left lobule I-V superimposed on an intensity normalised
structural T1 image on a single coronal (top) and sagittal (bottom) slice. The colour overlays
indicate the boundaries obtained using the different segmentation methods: manual tracing
(blue), direct warping (yellow), multi atlas majority voting (MAMV; red), and multi atlas
generative model label fusion (MAGM; white)....................................................................... 68
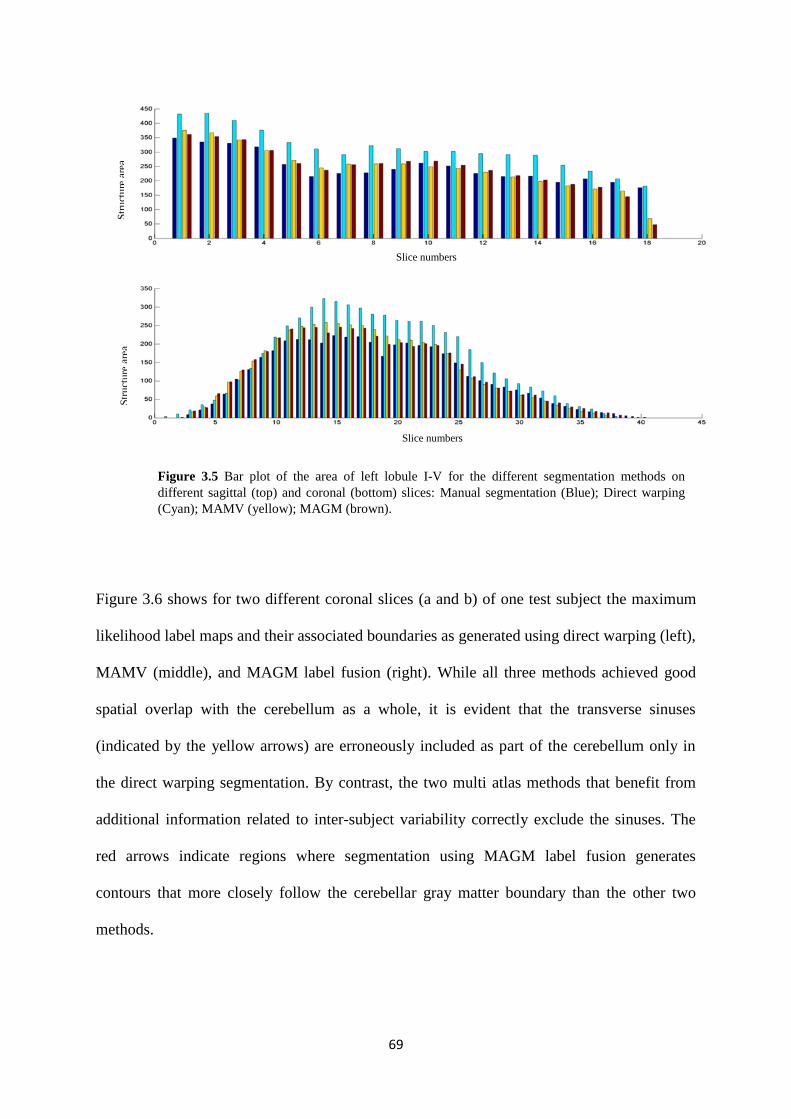
3.5 Bar plot of the area of left lobule I-V for the different segmentation methods on different
sagittal (top) and coronal (bottom) slices: Manual segmentation (blue); Direct warping
(cyan); MAMV (yellow); MAGM (brown). ............................................................................ 69
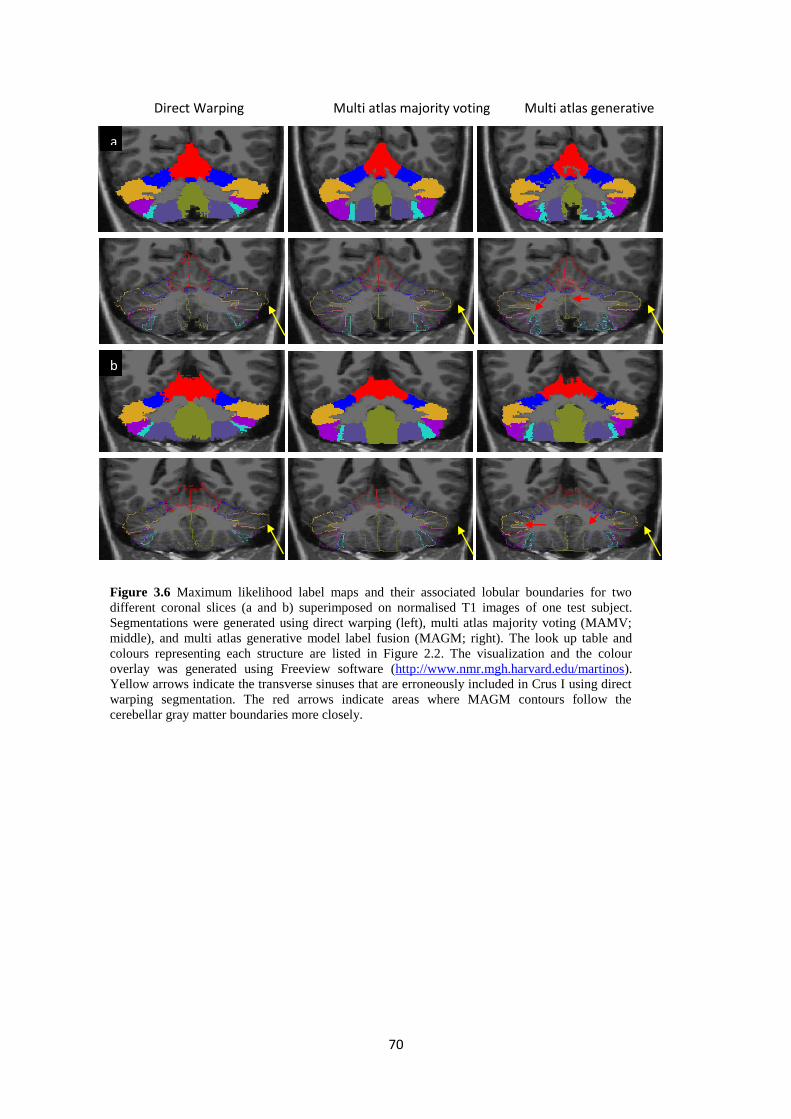
3.6 Maximum likelihood label maps and their associated lobular boundaries for two different
coronal slices (a and b) superimposed on normalised T1 images of one test subject.
Segmentations were generated using direct warping (left), multi atlas majority voting
(MAMV; middle), and multi atlas generative model label fusion (MAGM; right). The look up
table and colours representing each structure are listed in Figure 2.2. The visualization and
the colour overlay was generated using Freeview software
(http://www.nmr.mgh.harvard.edu/martinos). Yellow arrows indicate the transverse sinuses
that are erroneously included in Crus I using direct warping segmentation. The red arrows
indicate areas where MAGM contours follow the cerebellar gray matter boundaries more
closely. ..................................................................................................................................... 70
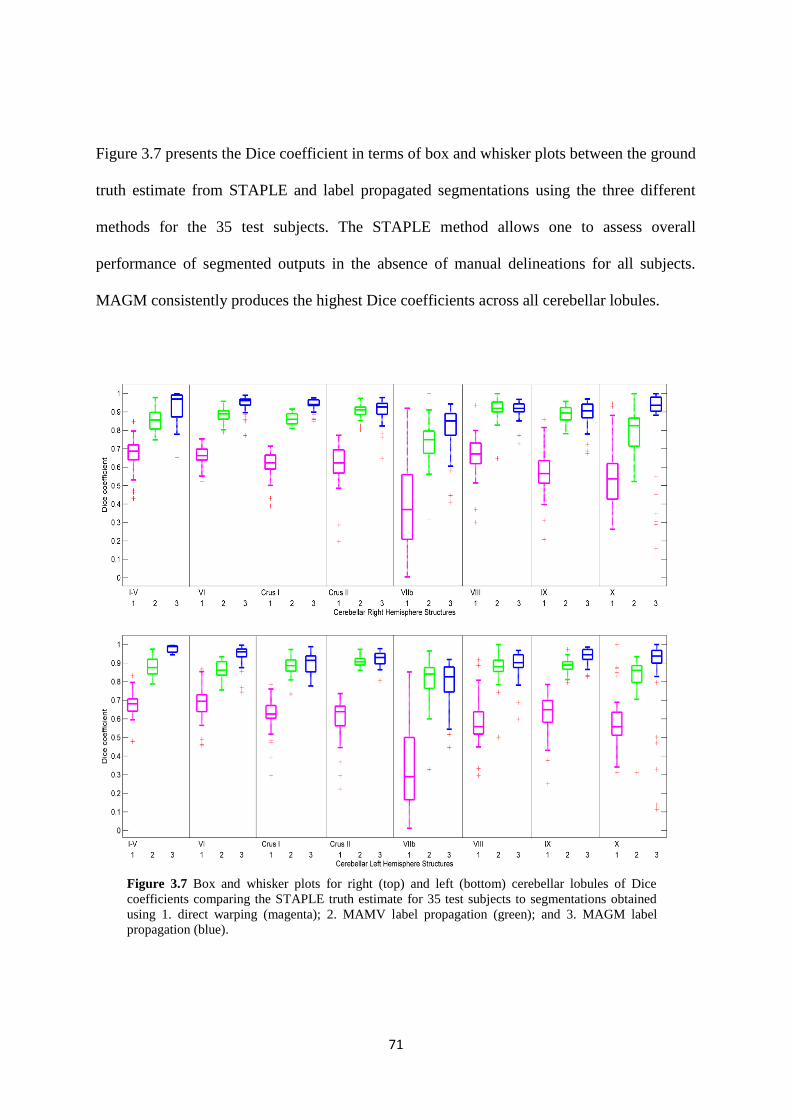
3.7 Box and whisker plots for right (top) and left (bottom) cerebellar lobules of Dice
coefficients comparing the STAPLE truth estimate for 35 test subjects to segmentations
obtained using 1. direct warping (magenta); 2. MAMV label propagation (green); and 3.
MAGM label propagation (blue). ............................................................................................ 71
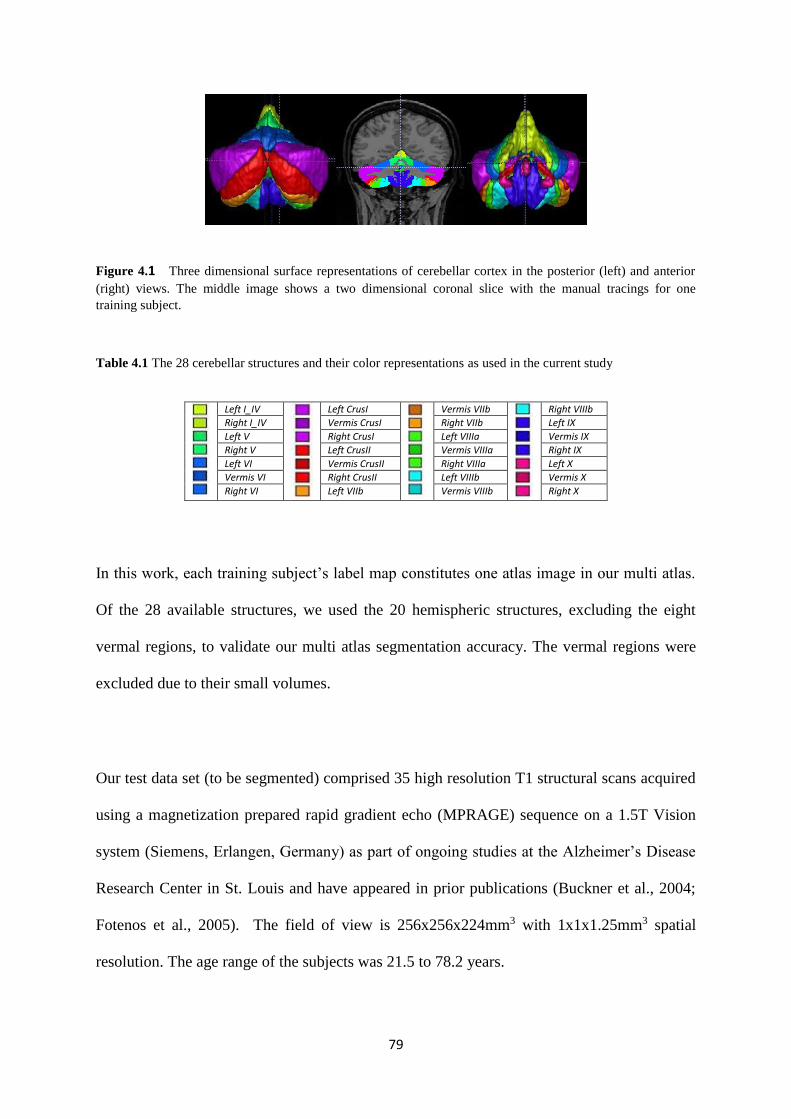
4.1 Three dimensional surface representations of cerebellar cortex in the posterior (left) and
anterior (right) views. The middle image shows a two dimensional coronal slice with the
manual tracings for one training subject. ................................................................................. 79
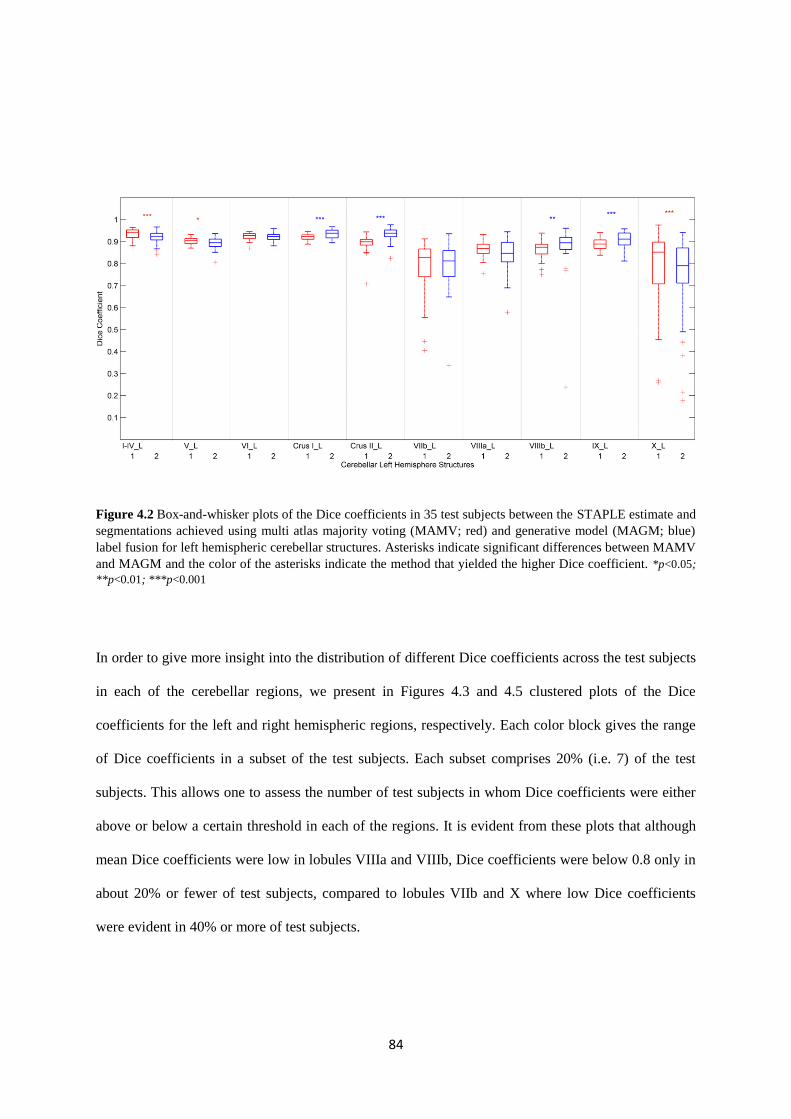
4.2 Box-and-whisker plots of the Dice coefficients in 35 test subjects between the STAPLE
estimate and segmentations achieved using multi atlas majority voting (MAMV; red) and
generative model (MAGM; blue) label fusion for left hemispheric cerebellar structures.
Asterisks indicate significant differences between MAMV and MAGM and the color of the
asterisks indicate the method that yielded the higher Dice coefficient. ................................... 84
Page 12
XI
4.3 Clustered plot representation of the Dice coefficients of spatial overlap with the STAPLE
estimate for automated segmentations based on majority voting (1) and generative model
based (2) label fusion for the left hemispheric cerebellar structures. ...................................... 85
4.4 Box-and-whisker plots of the Dice coefficients in 35 test subjects between the STAPLE
estimate and segmentations achieved using multi atlas majority voting (MAMV; red) and
generative model (MAGM; blue) label fusion for right hemispheric cerebellar structures.
Asterisks indicate significant differences between MAMV and MAGM and the color of the
asterisks indicate the method that yielded the higher Dice coefficient. ................................... 85
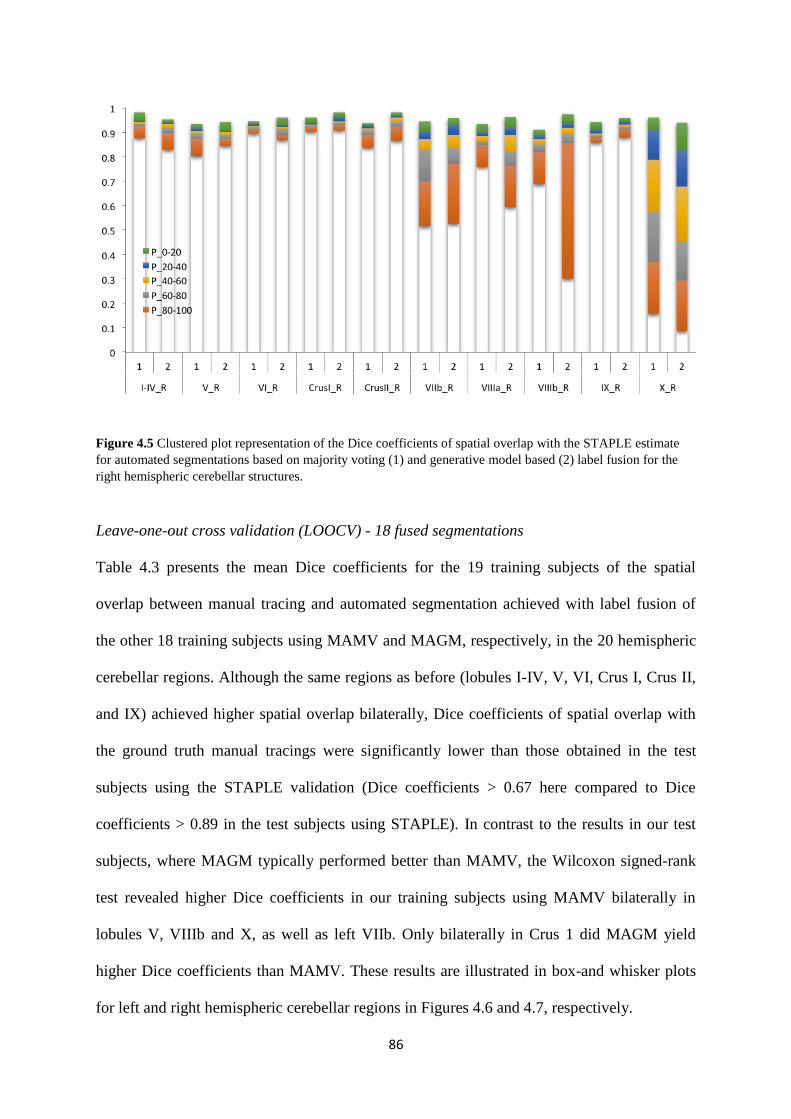
4.5 Clustered plot representation of the Dice coefficients of spatial overlap with the STAPLE
estimate for automated segmentations based on majority voting (1) and generative model
based (2) label fusion for the right hemispheric cerebellar structures. .................................... 86
4.6 Box-and-whisker plots of the Dice coefficients in the 19 training subjects of spatial
overlap between manual tracings and automated segmentations using multi atlas majority
voting (MAMV; red) and generative model based (MAGM; blue) label fusion, respectively,
for left hemispheric cerebellar structures.. ............................................................................... 87
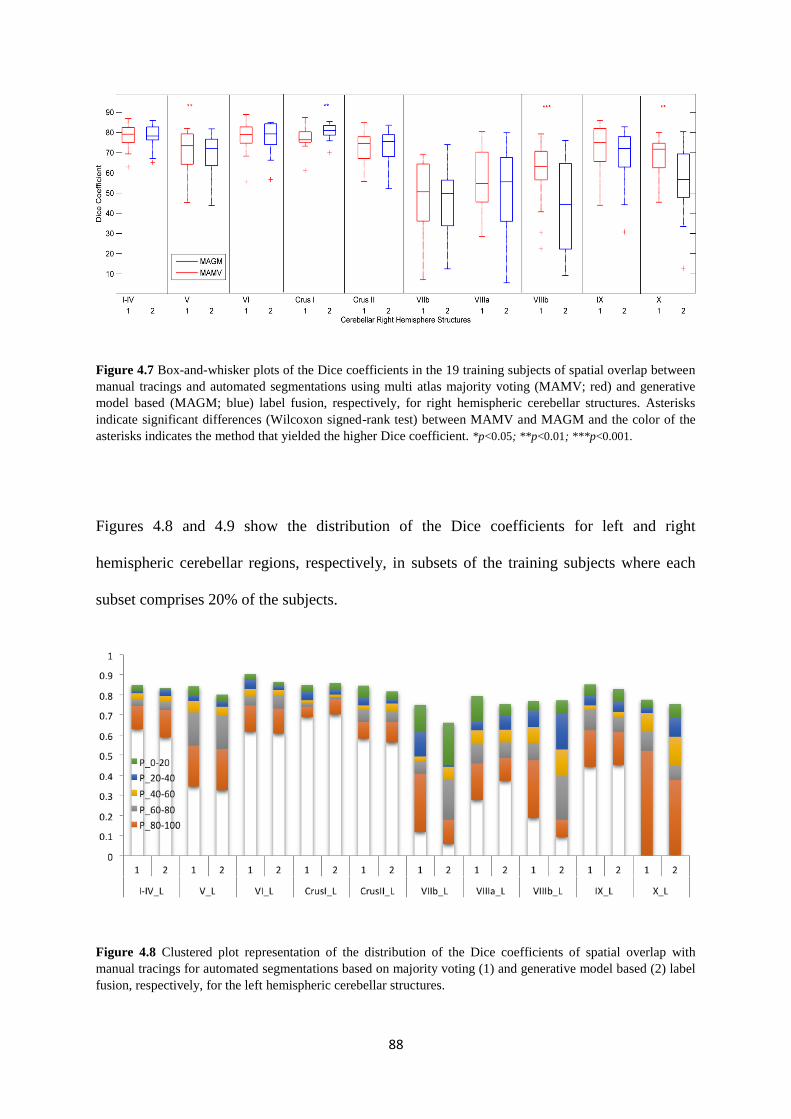
4.7 Box-and-whisker plots of the Dice coefficients in the 19 training subjects of spatial
overlap between manual tracings and automated segmentations using multi atlas majority
voting (MAMV; red) and generative model based (MAGM; blue) label fusion, respectively,
for right hemispheric cerebellar structures... ........................................................................... 88
4.8 Clustered plot representation of the distribution of the Dice coefficients of spatial overlap
with manual tracings for automated segmentations based on majority voting (1) and
generative model based (2) label fusion, respectively, for the left hemispheric cerebellar
structures. ................................................................................................................................. 88
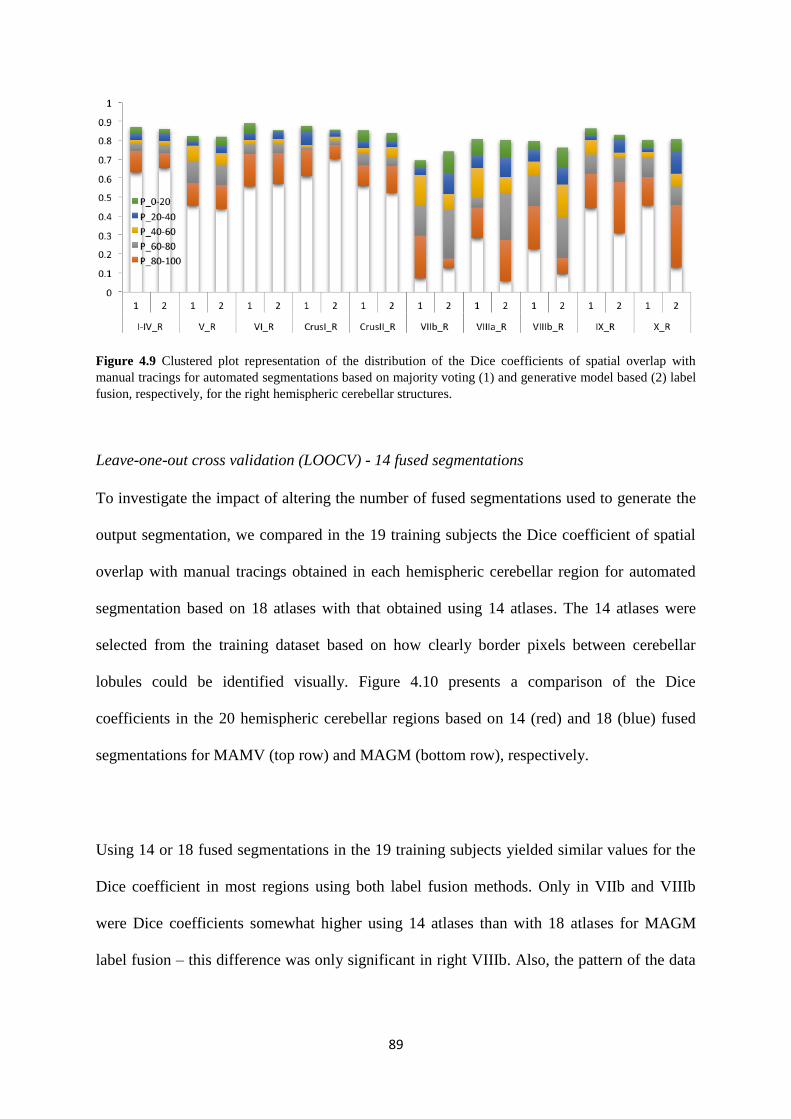
4.9 Clustered plot representation of the distribution of the Dice coefficients of spatial overlap
with manual tracings for automated segmentations based on majority voting (1) and
generative model based (2) label fusion, respectively, for the right hemispheric cerebellar
structures.. ................................................................................................................................ 89
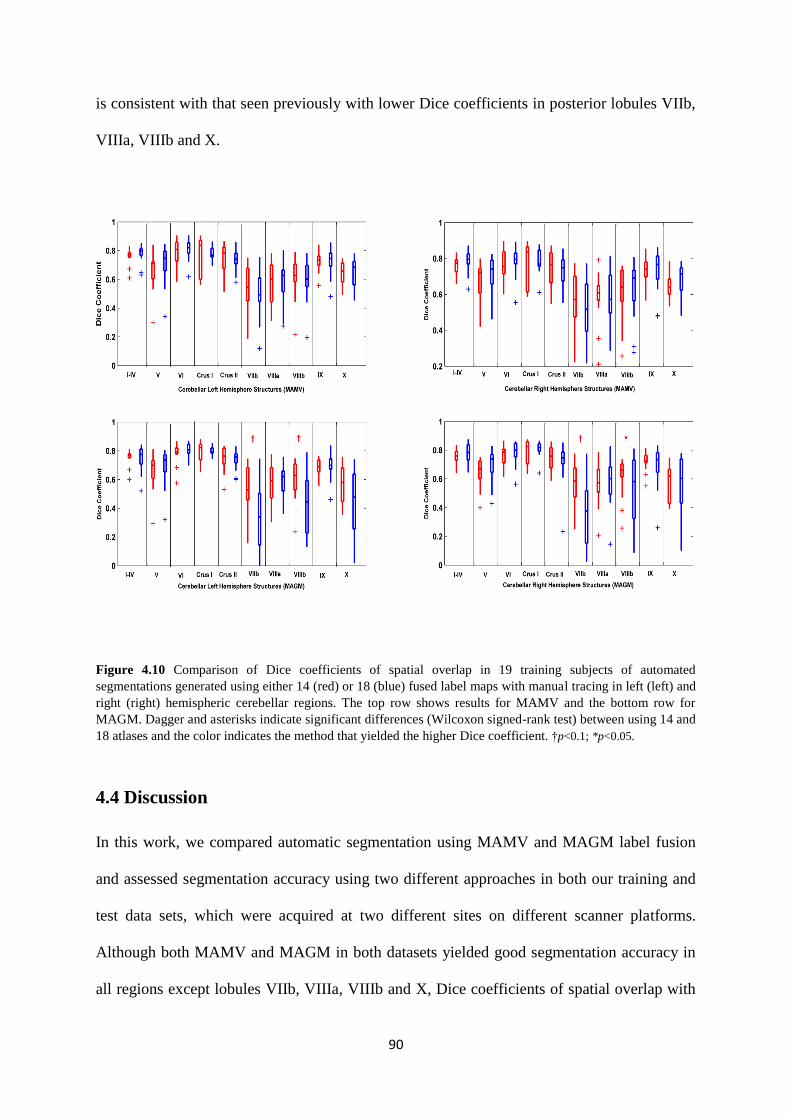
4.10 Comparison of Dice coefficients of spatial overlap in 19 training subjects of automated
segmentations generated using either 14 (red) or 18 (blue) fused label maps with manual
tracing in left (left) and right (right) hemispheric cerebellar regions. The top row shows
results for MAMV and the bottom row for MAGM.. .............................................................. 90
Page 13
XII
List of abbreviations
The following table describes the significance of various abbreviations and acronyms used
throughout the thesis.
CT Computed Tomography
CAT Computer Assisted Tomography
PET Positron Emission Tomography
MRI Magnetic Resonance Imaging
RF Radio Frequency
TR Repetition Time
NMR Nuclear magnetic resonance
3D Three dimension
MAMV Multi Atlas Majority Voting
MAGM Multi Atlas Generative Model
LOOCV Leave One Out Cross Validation
CUBIC Cape Universities Brain Imaging Centre
NIHPD National Institute of Health Pediatric Database
GM Gray Matter
WM White Matter
CSF Cerebral Spinal Fluid
AC Anterior Commissure
PC Posterior Commissure
SNR Signal to Noise Ratio
AAL Automatic Anatomical Labelling
LONI Laboratory of Neuro Imaging
LPBA40 LONI Probabilistic Brain Atlas
AIR Automated Image Registration
SUIT Spatially Unbiased Infra tentorial Template
CAPCA18 Cape Town Pediatric Cerebellar Atlas
STAPLE Simultaneous Truth and Performance Level Estimation
SPM Statistical Parametric Mapping
FMRIB Centre for Functional Magnetic Resonance Imaging of the Brain
FSL FMRIB Software Library
FLIRT FMRIB’s Linear Image Registration Tool
MNI Montréal Neurological Institute
ICBM International Consortium for Brain Mapping
Page 14
XIII
Preface
This dissertation proposes a reliable method for automatically parcellating cerebellar
structures in magnetic resonance (MR) images of children. This method involves the use of a
fully automated pipeline for processing MR images and generating parcellation labels
associated with the cerebellum.
A comprehensive introduction provides the necessary background and context to this work.
Thereafter, this thesis includes three independent articles that will be submitted for
publication. The articles are presented respectively in chapters two, three and four, then a
chapter that discusses and expands on findings and a concluding chapter that summarises
salient points from the preceding chapters. The organisation of the work into chapters is
designed to facilitate direct access to and concise evaluation of different methodologies, and
follows the logical progression of the work. As a complete document, however, this thesis
contains some necessary repetition. This is because each core chapter is presented as an
independent article.
For the purpose of thesis examination the contributions from co-authors are given below.
Chapter one provides the background and rationale for the current study, as well as a
discussion of clinical imaging modalities, MRI physics and registration, and an overview of
recent methods of atlas-based segmentation. It also provides the background theory for image
segmentation methods investigated in the remainder of the thesis.
Chapter two presents the construction of the Cape Town Probabilistic Cerebellar Atlas
(CAPCA18) from MR images of 18 healthy children aged 9 to 13 years, and its
implementation for atlas-based segmentation of cerebellar structures, as validated on a
Page 15
XIV
different set of children dataset. Further, the output segmentations are validated against
manual segmentation using the standard performance metric for image analysis. Ernesta
Meintjes supervised and directed the work covered in chapter two. The project design and
implementation of the algorithms was that of the candidate, as well as the writing of the
manuscript. Lilla Zöllei provided critical input on improving the validation methods. This
chapter has been prepared as a manuscript, reviewed by all co-authors and is ready to be
submitted for publication.
Chapter three details work conducted by the candidate during a study visit to the Martinos
Center for Biomedical Imaging in Boston, in which all the subjects and corresponding
parcellations from the CAPCA18 datasets were used to yield the cerebellar segmentation on
adult dataset (Buckner et al., 2004). We utilized a group of 35 adult test subjects to
investigate three label propagation methods: 1) using a traditional approach with a
probabilistic group atlas; 2) individual registration of subjects to each reference atlas,
followed by multi atlas majority voting (MAMV) label propagation; and 3) individual
registration of subjects to each reference atlas, followed by multi atlas generative model
(MAGM) based label propagation. We further validated for each method using 1)
segmentations derived from the simultaneous truth and performance level estimate
(STAPLE) algorithm; and 2) quantitative comparison with manual tracings of three test
subjects. Ernesta Meintjes directed and supported the work. Lilla Zöllei provided expert
advice and systematic guidance for conducting complex registration experiments to achieve
precise registration results. The candidate designed the study, implemented the algorithms,
performed all the tests and analyses, and prepared the manuscript. This chapter has been
prepared as a manuscript and will be submitted for publication.
Chapter four presents results of experiments performed using the developed pipeline with
datasets collected in two different labs. We present an optimized pipeline to obtain
Page 16
XV
automated parcellation of 28 cerebellar structures using manually delineated atlases on a set
of test subjects using two types of multi-atlas based segmentation. The performance of the
methods is evaluated using the STAPLE algorithm obtained in terms of Dice coefficient on
test subjects. In addition, the results are evaluated against manual segmentation using the
leave-one-out cross-validation (LOOCV) strategy on training subjects.
Chapter five is a critical discussion of the findings of the previous chapters. It identifies the
limitations of the methods presented in the previous chapters. It also suggests possible
improvements to the current implementation of the label propagation method in cerebellar
structures.
Chapter six presents the conclusions of the study, summarising all salient points.
Page 17
1
Chapter 1
Introduction
Rationale and Motivation
The different modalities of Magnetic resonance imaging (MRI), along with computational
image analysis tools, have enhanced our ability to “see through” the human brain. MRI
makes it possible to investigate brain structures and structure-related pathologies that haven’t
previously been fully understood. It enables the investigation of, amongst others, anatomical
structures of the brain across different age groups, helping us better understand the
developing brains of children. With automated parcellation, it also has the potential to
provide insight into the neurobiology of psychiatric diseases and into responses to treatments.
This thesis aims to contribute to the development of tools for pipelining analysis of the
cerebellum, specifically in pre-adolescent children. Many brain image analysis tools leave out
the cerebellum and little detail about its sub-structures is available to the research community.
Further, most atlases are developed using adult data and often perform poorly in pediatric
data as they do not account for subtle differences in the developing brain. Subtle differences
between white and gray matter in the cerebellum make segmentation tricky. Further,
segmentation targeting smaller regions of the cerebellum is challenging, even for expert
neuroanatomists.
To date, neuroscientists rely on manual procedures, which are time consuming and
susceptible to risks related to inter- and intra-rater reliability. Due to time and cost
constraints, manual procedures also aren’t feasible for large samples. Because of the
associated difficulties, manual segmentations generated for this study are employed as spatial
priors and propagated to test performance in test subjects whose segmentations are unknown.
In each chapter, the test subjects constitute a different sample from that used to develop the
Page 18
2
algorithms. It is important for the reader to note the details of the test dataset and training
dataset in each chapter.
This thesis presents a reliable cerebellar atlas construction procedure, based on structural T1
MRI images acquired at the Cape Universities Brain Imaging Centre (CUBIC) in Cape Town,
South Africa. This work originated due to the limitations associated with structural
segmentations of the cerebellum in children. The main objective was to obtain precise
structural segmentation output using prior knowledge obtained from the manual
segmentations performed on 18 subjects. The cerebellar atlas built in this study is designed to
be used in routines to obtain cerebellar structure segmentation on any given test subject. The
adult test subjects used for evaluation were the part of prior publication (Buckner et al., 2004)
and the data were available with Freesurfer software package.
Contributions
In this work, we present the Cape Town Pediatric Cerebellar Atlas (CAPCA18) for
segmentation of cerebellar structures.
1. Investigation on using CAPCA18 by evaluating on test dataset from children.
2. Investigation of using CAPCA18 atlas images using three different label propagation
methods by using a dedicated pipeline and analysis methods for achieving cerebellar
structure segmentation on adult test subjects. Three methods used for label
propagation are direct warping, multi atlas based majority voting (MAMV) and multi
atlas based generative model (MAGM).
3. Investigation of using spatially unbiased infratentorial template (SUIT) atlas images
using multi atlas based segmentation for achieving cerebellar structure segmentation
on adult test subjects.
Page 19
3
1.1 Anatomy of the human brain
The human brain comprises 100 billion neurons at birth. A child’s brain has only one fifth of
the volume of an adult brain (Thompson et al., 2005). The cells proliferate as the child
continues to learn and to progress through various developmental stages. The dendritic
branching of neurons increases with the increase in number of synaptic connections, which in
turn is influenced by the learning process, and by environmental and genetic factors. So the
shape of a brain depends on different developmental stages. Brain development is also
influenced by gene expression (Armstrong et al., 1995; Ashburner 2009; Panizzon et al.,
2009).
Growth in the field of MRI has enabled researchers to study the anatomical structures of the
brain in more detail than was possible through post-mortem autopsy. Emerging neuroscience
studies focus on mapping the structures, physiology, functions and connectivity of brain
structures in individuals and across different populations. Central to these tasks is the
construction of comprehensive brain atlases for different populations.
Brains can be anatomically divided into different regions. Based on embryonic development,
the brain has three divisions– namely forebrain, midbrain and hindbrain. The forebrain, or
cerebrum, is the largest part of the brain, where most information processing takes place. The
midbrain consists of brainstem and connects the hindbrain and the forebrain. The hindbrain
consists of brainstem, the cerebellum and the pons.
As further context for a discussion of the cerebellum, it is important to understand the tissues
of the brain. Gray matter (GM) comprises largely of unmyelinated neurons, most of which
are interneurons. The gray matter regions are the areas of nerve connections and processing.
White matter (WM) is made mostly of myelinated neurons that connect the regions of gray
matter to each other and to the rest of the body. The white matter acts as the information
Page 20
4
highway of the brain, receiving and sending information from and to every other part of the
brain.
The cerebellum, which is the focus of this study, is one of the major parts of the central
nervous system. It is located at the base of the skull, above the brain stem and beneath the
occipital lobe of the cerebral cortex. This region is part of several neuronal networks. It is
functionally heterogeneous, or involved in multiple functions, including sensory, motor,
cognitive and affective processing (Stoodley and Schmahmann, 2009; Schlerf et al., 2010;
Strick et al., 2009; Schmahmann and Sherman; 1998; Makris et al, 2005; Buckner et al.,
2011).
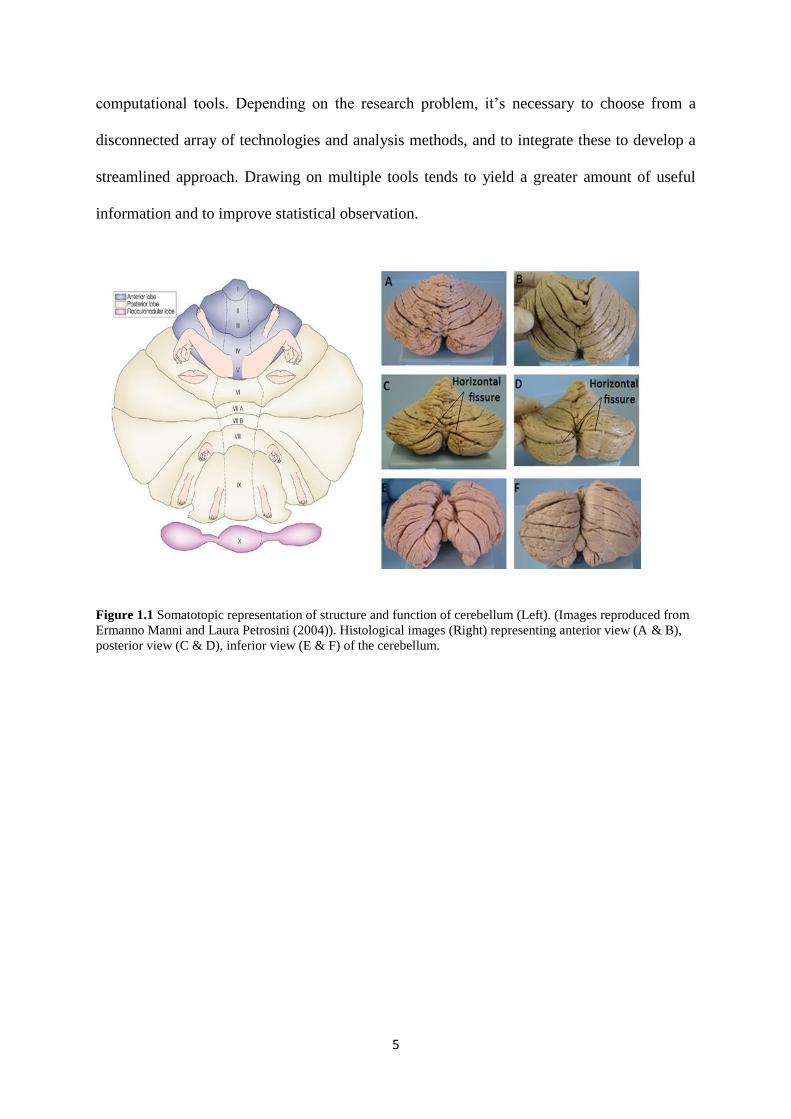
Lobar parcellation using the identification of major fissures allowed the cerebellum to be
divided into three sections, as in histological images Figure (1.1). These were the anterior
lobe, the posterior lobe and the flocculonodular lobe. The anterior lobe comprises lobules I –
V. The posterior lobe has superior posterior and inferior posterior regions. The superior
posterior lobe comprises lobule VI and Crus I; and the inferior posterior lobe contains the
lobules from Crus II to lobule IX. The flocculonodular lobe corresponds to lobe X. Smaller
parcellation in an individual cerebellar lobe is called a lobule. In each lobule of the
cerebellum, medial structures called vermis are present closer to the midline and hemispheric
structures are present more laterally.
The most striking gross morphologic feature of the cerebellum is its highly convoluted
cortical mantle (Figure 1.2). The convolutions allow a large cortical surface area to be
contained within its volume. This distinctive property adds to the challenge associated with
analysing the cerebellar structure and function (Van Essen et al., 2002).
Understanding the functionalities of the cerebellum and its inter-connections with cerebral
lobes is a challenging task, one that typically necessitates the integration of several
Page 21
5
computational tools. Depending on the research problem, it’s necessary to choose from a
disconnected array of technologies and analysis methods, and to integrate these to develop a
streamlined approach. Drawing on multiple tools tends to yield a greater amount of useful
information and to improve statistical observation.
Figure 1.1 Somatotopic representation of structure and function of cerebellum (Left). (Images reproduced from
Ermanno Manni and Laura Petrosini (2004)). Histological images (Right) representing anterior view (A & B),
posterior view (C & D), inferior view (E & F) of the cerebellum.
Page 22
6
1.2 Medical Imaging
Developments in medical imaging have made it possible to store images from living subjects
in digital format. In recent years, an unprecedented volume of medical images has become
available to researchers, helping them to completely characterise the imaged anatomies.
Information from different imaging modalities, such as computed tomography, positron
emission tomography and MRI, makes it possible to study different tissues and their
functional characteristics. Use of multiple acquisitions of the same subject and comparison
across subjects or groups of subjects from the same population has become increasingly
popular in recent years.
Developments in medical imaging technology, acquisition devices and storage facilities have
resulted in a need for computational tools for processing medical images. As well as in
processing information, the computational tools must allow for the comparison of
information across subjects. Ultimately, this type of tool should create a visual representation
Figure 1.2 Inferior view of the cerebellum representing the vermis of the inferior posterior lobe (Left A);
Inferior view when the region is spread open; one can see the pyramid, uvule and nodule, and the smaller
division of vermis (Right B).
Page 23
7
of the different structures present in the images, along with the overall scan and quantitative
results.
1.3 Medical Imaging Modalities
1.3.1 Computed Tomography
Computed tomography (CT), also known as computed axial tomography or computer-
assisted tomography (CAT), is a medical imaging procedure that uses computer-processed X-
rays to produce tomographic images or “slices” of specific areas of the body. These cross-
sectional images are used for diagnostic purposes in various medical disciplines. Digital
geometry processing is used to generate a three-dimensional image of the imaged anatomy
from a large series of two-dimensional X-ray images taken around a single axis of rotation.
Historically, the images generated were in the axial or transverse plane, perpendicular to the
long axis of the body. However, modern scanners allow this volume of data to be reformatted
in various planes or even as volumetric three dimensional (3D) representations of structures.
CT scanning of the head is typically used to detect infarction, tumours, calcifications,
haemorrhage or bone trauma. Hypodense (dark) structures can indicate infarction.
Hyperdense (bright) structures indicate calcifications or haemorrhage, and bone trauma can
be seen as disjunction in bone windows. Tumours can be detected by the swelling and
anatomical distortion they cause, or by surrounding oedema. Basically CT uses ionized (or X-
ray) radiation to image the region of interest. It gives less information about the soft tissues
and more information about bone structures and calcification.
Page 24
8
1.3.2 Positron Emission Tomography
In the case of positron emission tomography (PET) imaging, short-lived radio isotopes are
injected into the bloodstream of a living subject. Changes in regional blood flow in anatomic
structures are quantified by the inference of radioactive decay. The output map shows the
tissues in which the molecular tracer has become concentrated, and can be interpreted by a
physician or radiologist in the context of the patient's diagnosis and treatment plan.
Nuclear medicine imaging in PET is non-invasive, with the exception of intravenous
injections, which are usually painless medical tests. Important applications of PET are in
clinical oncology, for identifying tumours leading to metastases, and in diagnosing and
evaluating brain disease (grading various types of dementia). PET images are usually
acquired with low resolution. Better clinical information is obtained by fusing the images
from different modalities, like MRI and PET. This makes it necessary to perform automatic
registration (Woods et al., 1993) between the different modality images.
1.3.3 Magnetic Resonance Imaging
Magnetic resonance imaging (MRI) is a safe modality that does not use any radioactive
isotopes or ionizing radiation to image the anatomy of a structure. Instead, MRI uses the
property of nuclear magnetic resonance (NMR) to image the nuclei of atoms inside the body.
MRI can create more detailed images of the body than X-rays. It provides excellent contrast
between the different soft tissues of the body, is non-invasive and can produce a volumetric,
or three-dimensional, image. It can also produce images that are sensitive to the degree of
blood flow in vessels, tissue oxygenation, tissue perfusion, diffusion, function and
concentration of metabolites in tissues.
Page 25
9
When atomic nuclei with magnetic properties are placed in a magnetic field, they can absorb
electromagnetic waves of characteristic frequencies. The exact frequency depends on the type
of nucleus, the field strength, and the physical and chemical environment of the nucleus. The
absorption and re-emission of such radio waves is the basic phenomenon utilised in MRI.
Hydrogen proton (1H) is the most commonly used because of its abundance in bodily tissues,
given that they occur in water and fat. Nuclei that have at least one unpaired proton, like the
hydrogen proton, possess inherent spins. They have magnetic properties that distinguish them
from non-magnetic isotopes.
A mechanical analogy to the magnetic nature of the nucleus is that it has a spinning mass
with a small net positive charge. Because of the motion of the electric charge, a small
magnetic field is created. The magnetic properties of the atomic nuclei make them precess
around the external field. The frequency ω of this precessing motion is given by the following
equation, called the Larmor equation:
ωL = γ × B0, (1.1)
in which ωL is the angular Larmor frequency (unit: MHz), and γ is the gyromagnetic ratio
(unit: MHz/T), which describes the ratio of the mechanical and magnetic properties of the
nucleus and depends on the type of nucleus. B0 is the strength of the magnetic field in Tesla
(T). When an electromagnetic wave of appropriate frequency (equal to the Larmor frequency)
reaches a nuclei in a state of lower energy, the nuclei is transferred to a state of higher energy.
This is one of the few fundamental equations to understand in relation to NMR, MRI, its
technology and its applications.
In the absence of a magnetic field, hydrogen protons are randomly aligned and the net
magnetisation is zero. When a person is placed inside the powerful magnetic field (B0) of an
Page 26
10
MRI scanner, the magnetic moments of many protons become aligned with the direction of
the field, creating a net magnetisation parallel to the main magnetic field.
A radiofrequency (RF) pulse applied to a coil perpendicular to B0, creates a small rotating
magnetic field (B1(t)) at the Larmor precession frequency perpendicular to the main magnetic
field. For the duration of the RF pulse, the spins will precess around B1, effectively rotating
the net magnetisation out of the longitudinal plane into the transverse plane perpendicular to
the B0 field. Upon termination of B1, the spins lose energy and return to their equilibrium
state. This loss of magnetisation creates the MR signal.
The energy loss occurs in two main ways – spin-lattice relaxation and spin-spin interactions.
Spin-lattice interactions involve an exchange of energy between the spins and their
surroundings. This results in the recovery of the longitudinal component of the magnetisation
after a time (T1).
Spins also interact with themselves in a more rapid process than spin-lattice interactions, and
this leads to a loss of phase coherence among the spins. The time for the resulting loss in the
transverse component of the magnetisation is called T2. In general, T2 is less than T1.
Different tissues have different T1 and T2 time constants. For example, myelinated white
matter has a shorter T1 than gray matter. This means that in T1-weighted MR images of adult
brains, white matter recovers faster and therefore appears brighter in the images than gray
matter. In T2-weighted images, gray matter will appear brighter than white matter.
A tissue with a long T1 and T2 (like water) is dark in a T1-weighted image and bright in a
T2-weighted image. A tissue with a short T1 and a long T2 (like fat) is bright in a T1-
weighted image but gray in a T2-weighted image.
Page 27
11
T1 contrast may be manipulated in images by varying the repetition time (TR), which defines
the time between successive RF pulses. In this thesis, structural T1 weighted images have
been used throughout.
An MR pulse sequence diagram is a simple way of showing how the RF pulses and gradients
are applied during an acquisition. Enormous numbers of pulse sequences have been
developed, each with its own application.
Three mutually orthogonal magnetic field gradients – namely the slice select gradient, phase
encoding gradient and frequency encoding gradient – are usually applied in different
combinations and at different times during image acquisition to achieve spatial encoding of
the MRI signal to construct the MR image.
Arbitrary orientations of the linear gradients can be achieved through the simultaneous
application of fixed-orientation gradients in the X, Y, and Z axes. The basis for spatial
localisation is the fact that the nuclear precession frequency is directly proportional to the
magnetic field (eq. 1.1). The gradients induce linearly varying magnetic fields, resulting in
spatially encoded precessional frequencies. For example, if the gradient is applied during
excitation, only spins that match the resonance condition will be excited. In this way, an
imaging slice is selected. Similarly, by applying the gradients during readout, the location
from which a signal with a specific frequency and phase originated can be determined,
yielding a “profile” image.
In order to produce a topographic image, it is necessary to acquire multiple profile images, so
signal excitation needs to be repeated many times, with allowances for relaxation time
between excitation. The program that controls the timings and order that the different
components of the imaging sequence are applied is the pulse sequence.
Page 28
12
Brain MR images may be affected by various sources of noise, for example, magnetic field
inhomogeneities, ambiguous intensity patterns inside and outside the brain and partial volume
effects. Partial volume effects occur when the intensities of voxels are influenced by multiple
structures, resulting in a blurring of intensity across boundaries. These effects are common in
MRI data where the resolution of the images is relatively large compared to the brain
microstructure and images are often not isotropic.
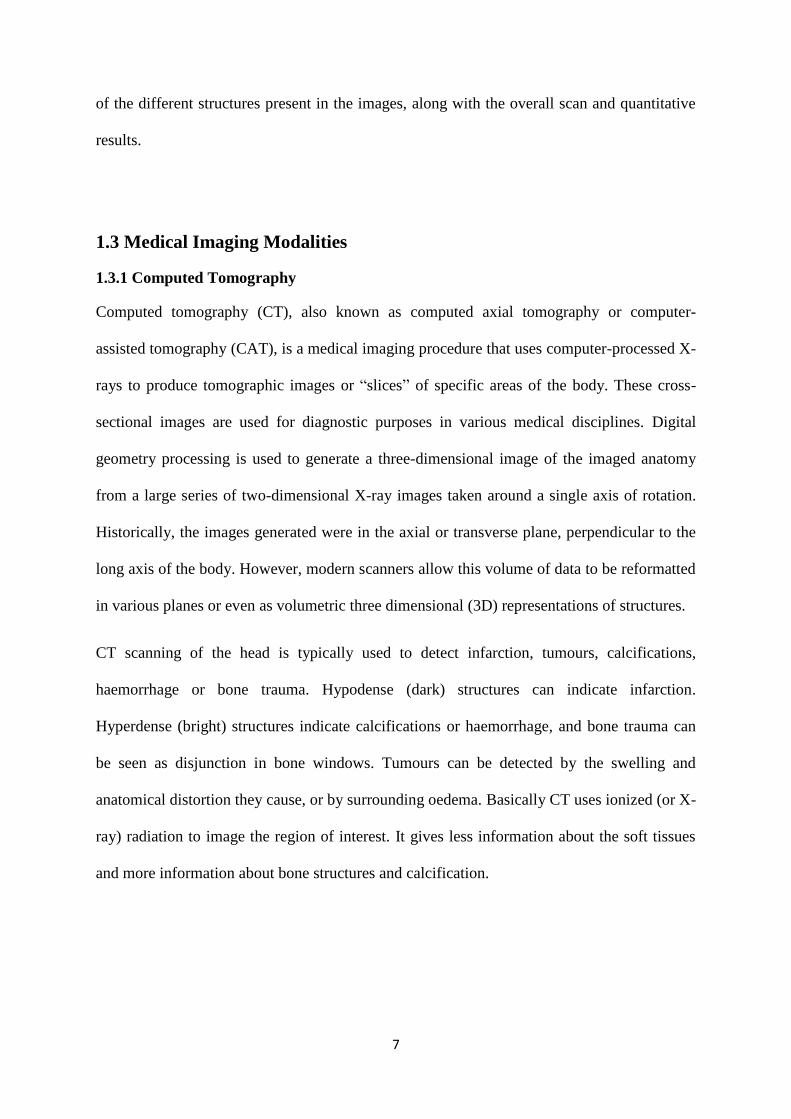
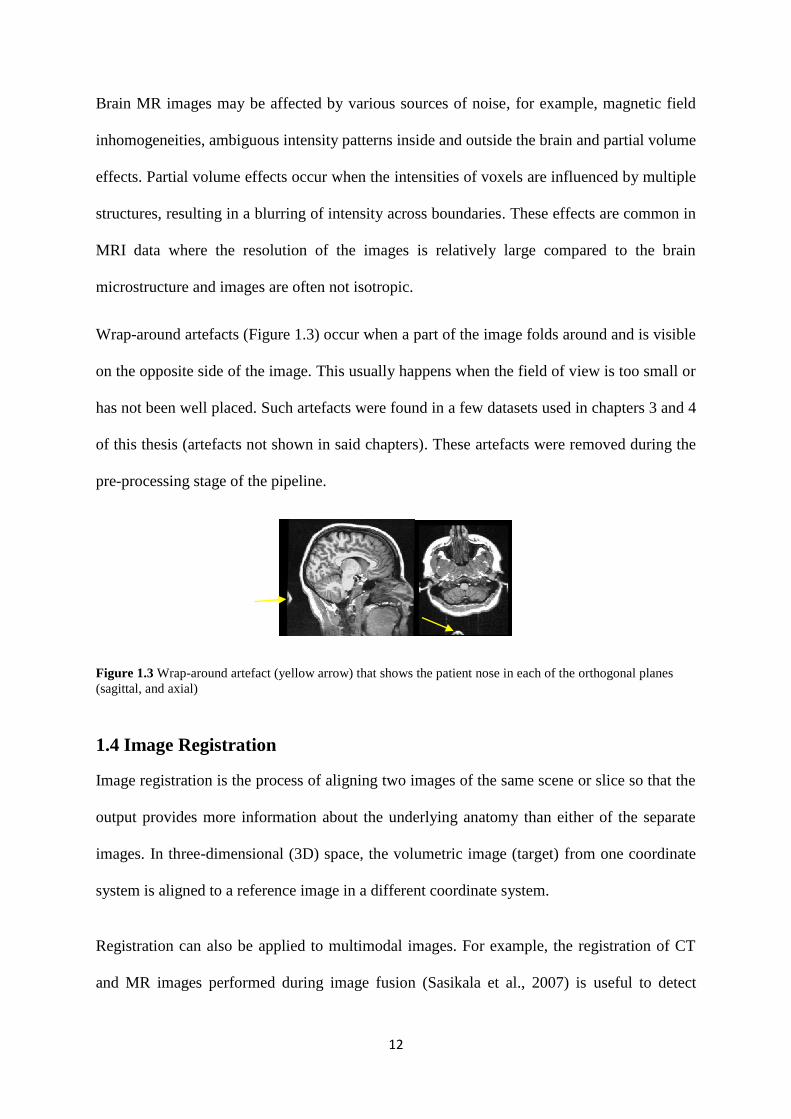
Wrap-around artefacts (Figure 1.3) occur when a part of the image folds around and is visible
on the opposite side of the image. This usually happens when the field of view is too small or
has not been well placed. Such artefacts were found in a few datasets used in chapters 3 and 4
of this thesis (artefacts not shown in said chapters). These artefacts were removed during the
pre-processing stage of the pipeline.
1.4 Image Registration
Image registration is the process of aligning two images of the same scene or slice so that the
output provides more information about the underlying anatomy than either of the separate
images. In three-dimensional (3D) space, the volumetric image (target) from one coordinate
system is aligned to a reference image in a different coordinate system.
Registration can also be applied to multimodal images. For example, the registration of CT
and MR images performed during image fusion (Sasikala et al., 2007) is useful to detect
Figure 1.3 Wrap-around artefact (yellow arrow) that shows the patient nose in each of the orthogonal planes
(sagittal, and axial)
Page 29
13
localised atrophy or neuropathology associated with certain diseases, or to aid in the diagnose
of brain tumours. The review paper by Maintz and Viergever (1998) provides a
comprehensive overview of key concepts related to image registration.
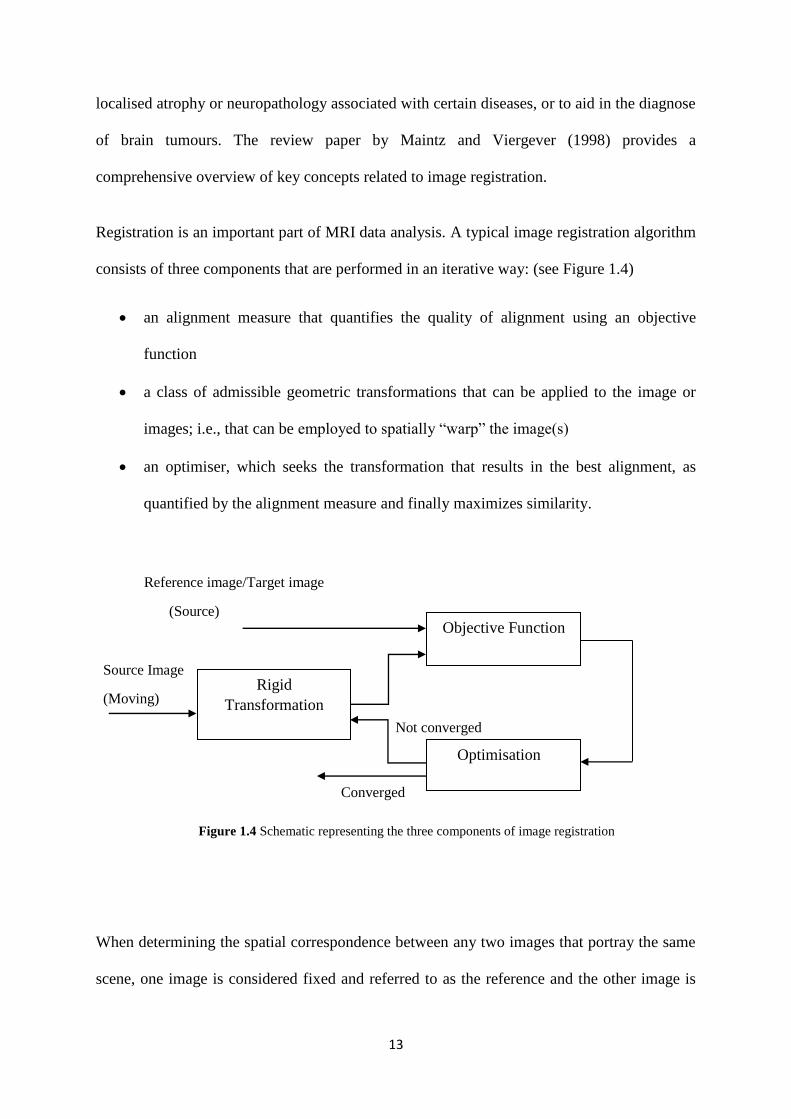
Registration is an important part of MRI data analysis. A typical image registration algorithm
consists of three components that are performed in an iterative way: (see Figure 1.4)
an alignment measure that quantifies the quality of alignment using an objective
function
a class of admissible geometric transformations that can be applied to the image or
images; i.e., that can be employed to spatially “warp” the image(s)
an optimiser, which seeks the transformation that results in the best alignment, as
quantified by the alignment measure and finally maximizes similarity.
Reference image/Target image
(Source)
Source Image
(Moving)
Not converged
Converged
When determining the spatial correspondence between any two images that portray the same
scene, one image is considered fixed and referred to as the reference and the other image is
Objective Function
Rigid
Transformation
Optimisation
Figure 1.4 Schematic representing the three components of image registration
Page 30
14
the target. The registration framework basically consists of transformation, optimisation and
interpolation steps. Transformation helps to achieve spatial correspondence by transforming
from one coordinate space to another coordinate space. Optimisation is used during a
multiresolution approach when using high resolution images in order to reduce computational
demands. Multiresolution registration refers to the process where registration is performed
iteratively in regions of increasing spatial resolution. Multiresolution based optimization
(Jenkinson et al., 2002) is commonly used in most registration methods.
Registration algorithms are classified in terms of the following five features:
1. dimensionality,
2. the nature of the transformation,
3. the basis functions used during registration,
4. imaging modality, and
5. whether registration is within or between subjects.
Dimensionality depends on the spatial dimensions of the images involved in the registration
process, and registration may be between images with either similar or different
dimensionalities. For example, intra-operatively multiple 2D projection images often need to
be registered to a 3D image acquired previously during surgical planning.
Transformations are categorized into rigid, affine, non-linear, projectile and curved
transformations. Linear transformations can be either rigid or affine; rigid allows only for
translation and rotation, while affine transformations allow for translation, rotation, scaling
Page 31
15
and shear between the images. Projectile and curved transformations are not used in our
study.
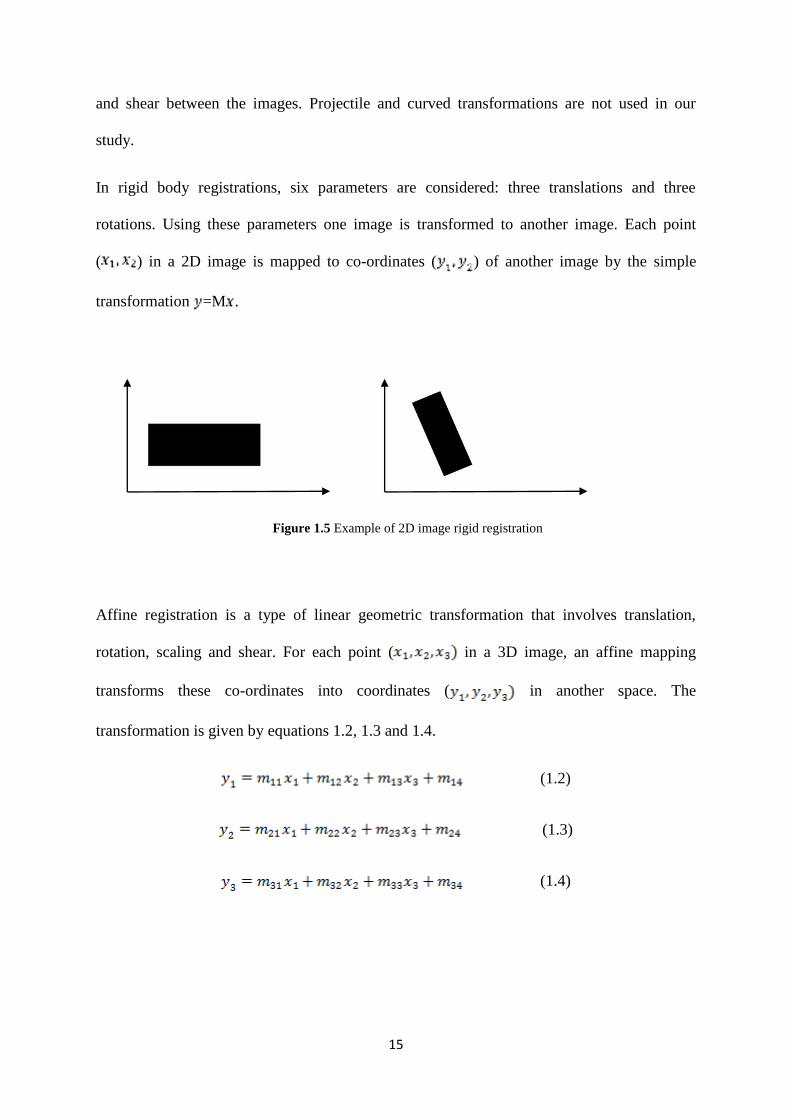
In rigid body registrations, six parameters are considered: three translations and three
rotations. Using these parameters one image is transformed to another image. Each point
( ) in a 2D image is mapped to co-ordinates ( ) of another image by the simple
transformation =M .
Affine registration is a type of linear geometric transformation that involves translation,
rotation, scaling and shear. For each point ( in a 3D image, an affine mapping
transforms these co-ordinates into coordinates ( in another space. The
transformation is given by equations 1.2, 1.3 and 1.4.
(1.2)
(1.3)
(1.4)
Figure 1.5 Example of 2D image rigid registration
Page 32
16
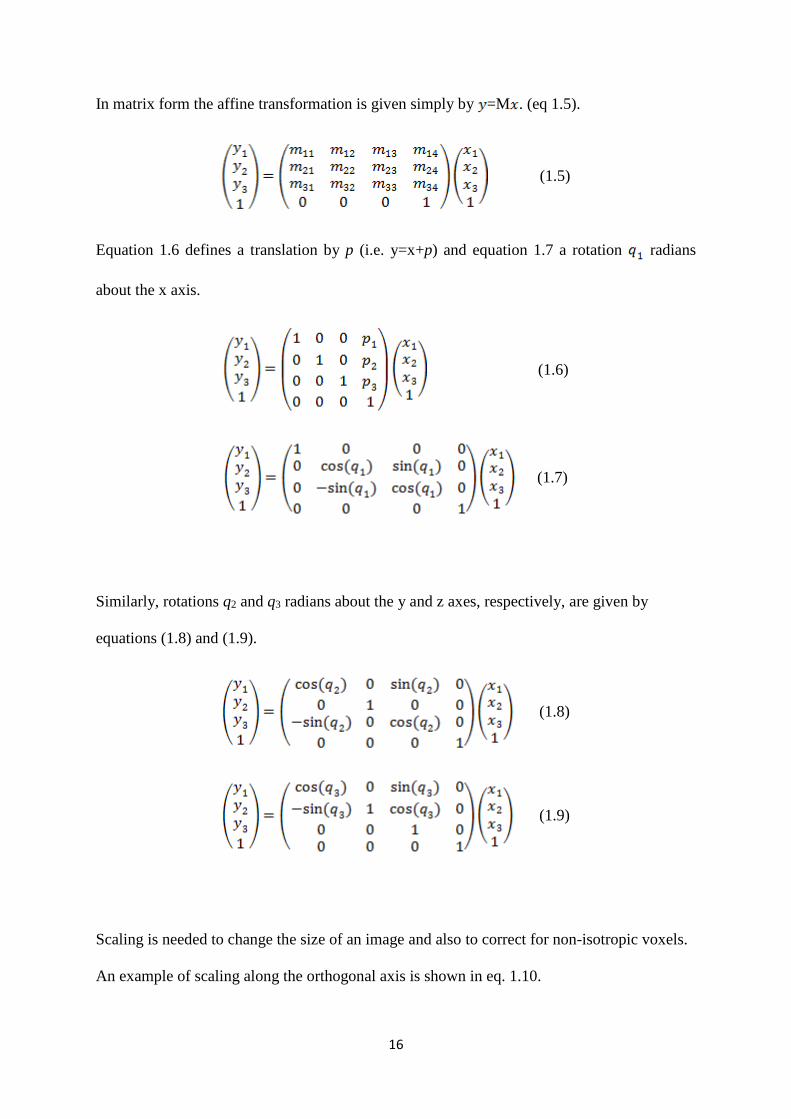
In matrix form the affine transformation is given simply by =M . (eq 1.5).
(1.5)
Equation 1.6 defines a translation by p (i.e. y=x+p) and equation 1.7 a rotation radians
about the x axis.
(1.6)
(1.7)
Similarly, rotations q2 and q3 radians about the y and z axes, respectively, are given by
equations (1.8) and (1.9).
(1.8)
(1.9)
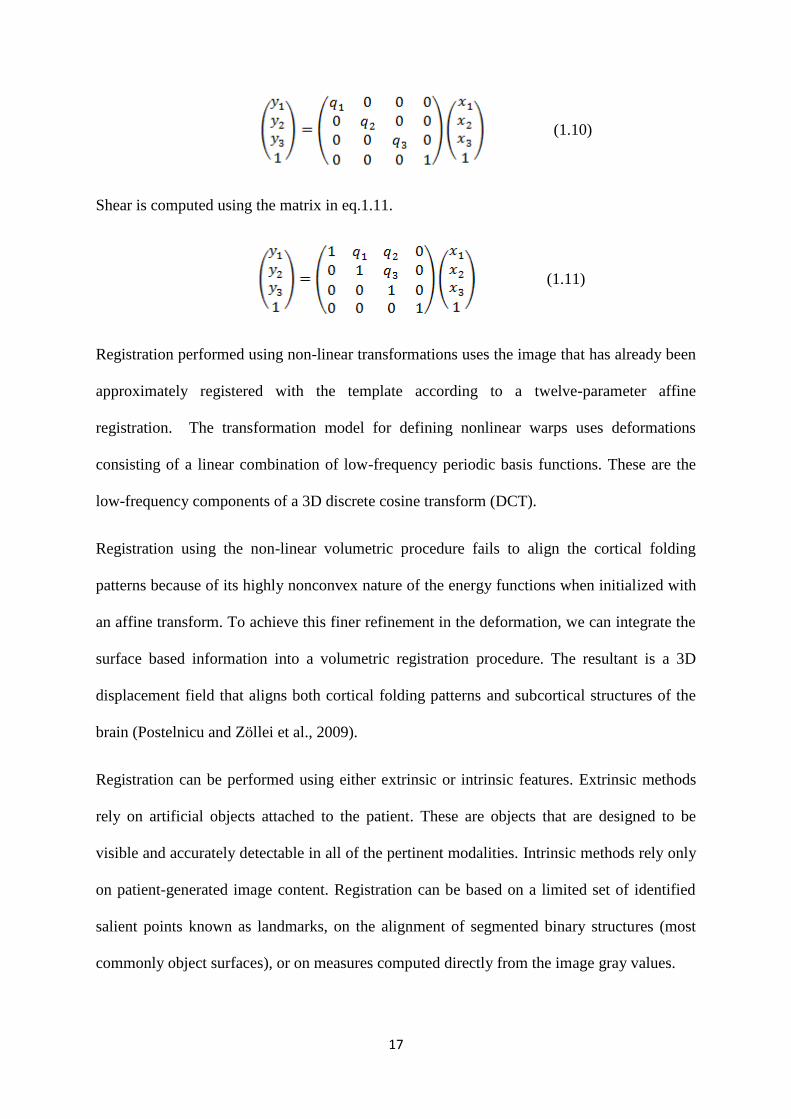
Scaling is needed to change the size of an image and also to correct for non-isotropic voxels.
An example of scaling along the orthogonal axis is shown in eq. 1.10.
Page 33
17
(1.10)
Shear is computed using the matrix in eq.1.11.
(1.11)
Registration performed using non-linear transformations uses the image that has already been
approximately registered with the template according to a twelve-parameter affine
registration. The transformation model for defining nonlinear warps uses deformations
consisting of a linear combination of low-frequency periodic basis functions. These are the
low-frequency components of a 3D discrete cosine transform (DCT).
Registration using the non-linear volumetric procedure fails to align the cortical folding
patterns because of its highly nonconvex nature of the energy functions when initialized with
an affine transform. To achieve this finer refinement in the deformation, we can integrate the
surface based information into a volumetric registration procedure. The resultant is a 3D
displacement field that aligns both cortical folding patterns and subcortical structures of the
brain (Postelnicu and Zöllei et al., 2009).
Registration can be performed using either extrinsic or intrinsic features. Extrinsic methods
rely on artificial objects attached to the patient. These are objects that are designed to be
visible and accurately detectable in all of the pertinent modalities. Intrinsic methods rely only
on patient-generated image content. Registration can be based on a limited set of identified
salient points known as landmarks, on the alignment of segmented binary structures (most
commonly object surfaces), or on measures computed directly from the image gray values.
Page 34
18
Landmark-based registration employs a large set of points to represent a structure. It allows
complex registration to be achieved accurately faster than volume-based registration. The
iterative closest point method (Besl and Mckay 1992) is a widely used landmark-based
registration algorithm. In a shape analysis study of the brains of children with fetal alcohol
syndrome (FAS), surface models of the hippocampus and caudate nucleus from different
subjects were registered using vertices as landmark points (Joseph et al., 2014).
Registration methods are further categorised as either single-modality or multimodality
methods. A single-modality method tends to register images acquired by the same scanner or
sensor type, whereas a multi-modality registration method tends to register images acquired
by different scanners or sensor types. In the case of MR images, however, multimodal
registration is carried out on images that were acquired using different pulse sequences and as
such have different contrasts.
Finally, registration methods are categorised based on the number of subjects, i.e. intra-
subject, inter-subject or atlas registration methods. In intra-subject registration, scans of the
same subject taken at different instants are registered. For example, the high-resolution
Colin27 MRI brain template was created by performing intra-subject registration of the same
subject scanned at 27 different instants.
Inter-subject registration involves registering scans from multiple subjects and is useful for
comparing anatomical structures in different brains. The Montreal Neurological Institute
(MNI) used this type of registration to develop the MNI305 human brain template. MR
images from 305 subjects were mapped into stereotactic space, intensity normalised and
averaged on a voxel-by-voxel basis as part of the International Consortium for Brain
Mapping (ICBM) (Evans et al., 1993). Later, 152 subjects were affinely registered to the
Page 35
19
MNI305 template to create the ICBM152 template (Mazziotta et al., 2001; Mazziotta et al.,
1995).
The ICBM152 template is widely used as a registration target during functional analyses in a
variety of popular computational neuroimaging tools, including SPM
(www.fil.ion.ucl.ac.uk/spm/), FSL (www.fmrib.ox.ac.uk/fsl/) and AIR (bishopw.loni.ucla.edu/air5).
Precise registration algorithms have become critical for brain mapping applications because it
allows comparisons of experimental findings from different subjects.
In structural imaging, image registration methods are applied sequentially. Linear registration
is initially used to obtain global correspondence. This is followed by non-linear parametric
transformation yielding smooth deformations across local structures (Figure 1.6). Non-linear
deformations range from smooth parametric deformations to high-dimensional, non-
parametric deformations. High-dimensional, non-parametric deformations are not driven by
intensity variations, but take geometric information, curvature and other image features into
account and follow either elastic or optical flow-based registration.
Since human brains are highly variable and also differ depending on age, gender, race, etc., it
may be difficult to choose a suitable registration target. Standard brain templates are often
used to provide an anatomical reference for individual or population based assessment of
brain structure and function.
Page 36
20
(For more detail on image registration, reader can refer to Maintz and Viergever (1998),
Crum et. al., 2004 and Crum et al., 2014.)
1.5 Brain Template
Brain templates are constructed from one or more representations of the brain (Toga and
Thompson 2001). Brain templates have facilitated the increase in the number of
investigations focusing on the structural and functional organization of the brain.
In humans and other species, the brain’s complexity and variability across subjects is so large
that templates are essential to manipulate, analyse and interpret brain data from multiple
subjects. Registration helps to establish a common coordinate system for evaluation of
different images. Images are typically registered onto a reference space via affine
transformations (Mazziota et al., 2001).
The reference space can be defined by a single subject as per the initial coordinate system
proposed by Talairach (Talairach and Tournoux, 1988). The Talairach coordinate system is
based on the post-mortem brain of a single subject. However, such an atlas template is biased
towards the chosen reference subject space and may not represent the average geometry of
the population. Several different approaches have been explored for using multiple subjects
in the construction of average intensity atlases. The Montreal Neurological Institute (MNI)
constructed the standard MNI305 whole-brain template by registering 305 scans using 9-
Figure 1.6 Average anatomical image of the cerebellum before registration (left) ; Average anatomical
image after affine linear registration to the national institute of health pediatric database (NIHPD) template
(middle); Average anatomical image after affine linear and non-linear registration with the NIHPD template
(right).
Page 37
21
parameter linear transformation. Their next generation template, popularly known as the
ICBM152 template (Evans et al., 1993), was built using 12-parameter linear and non-linear
registration in a stereotactic co-ordinate system. It also included the previously excluded
posterior regions and reduced the complexities arising from inter-subject structure variability
associated with individual brains. The ICBM template in MNI space is representative of the
average brain size and shape. Cortical structures are, however, quite blurred due to the effect
of low-pass filtering in the averaging process. The initial template covers the whole head with
posterior regions excluding the cerebellum. The brain template is the result of an averaging
operation after linear and non-linear registration.
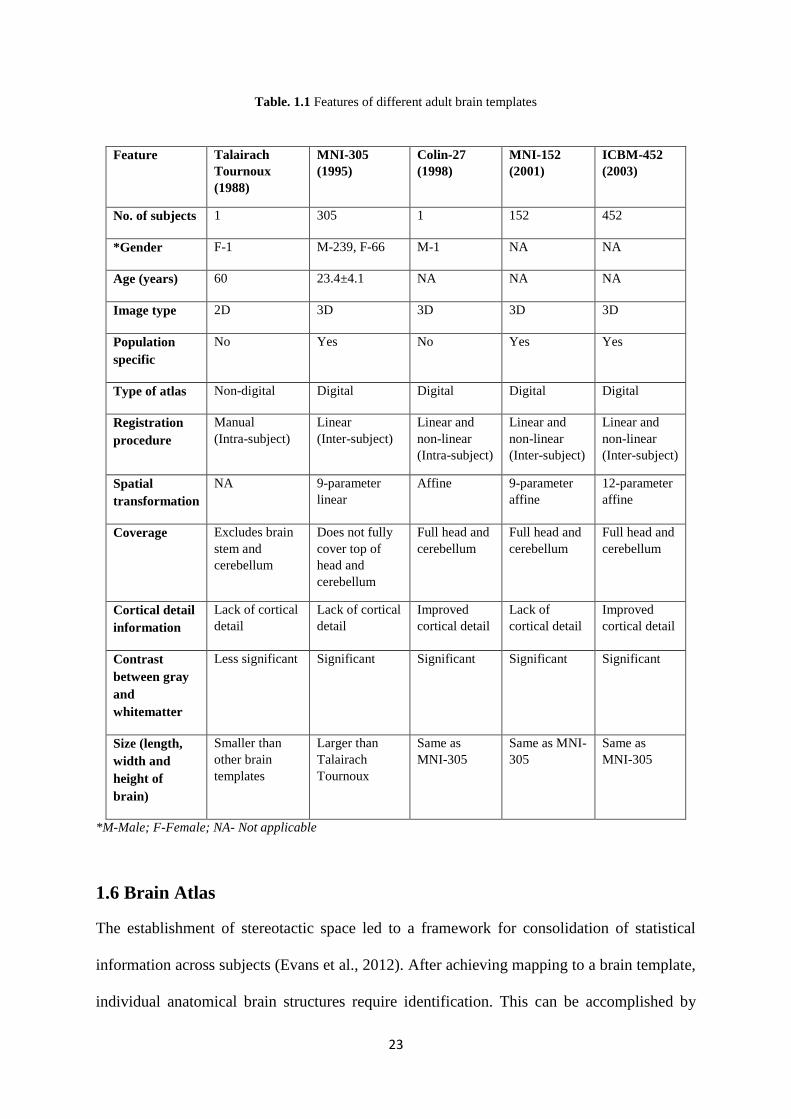
The historical evolution of different whole brain templates using linear and non-linear
registration is well documented by Evans et al. (2012) in a review of brain templates. The
characteristic features of available adult brain templates are listed in Table 1. In addition to
these adult templates, the National Institutes of Health Pediatric Database (NIHPD) has
constructed a set of age-specific paediatric templates for child populations. These were
constructed via iterative non-linear registration (Fonov et al., 2011) and enable mapping of
the brain using a standard co-ordinate system.
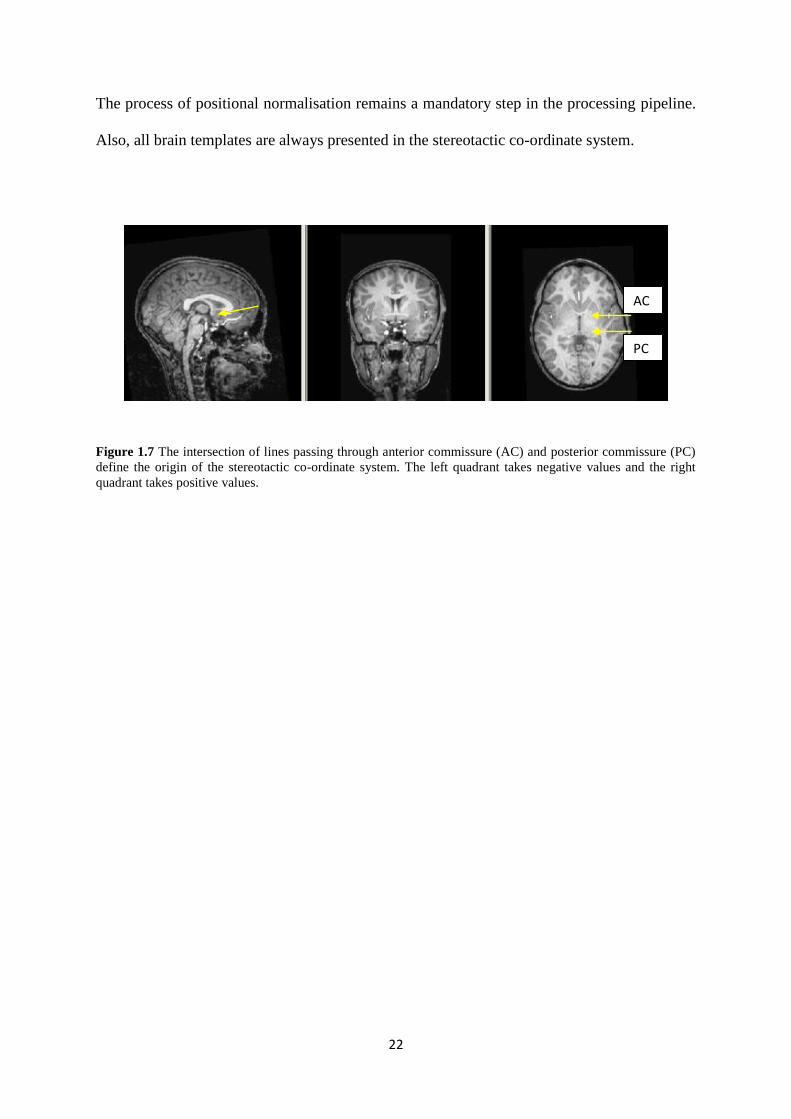
The stereotactic co-ordinate system is one example of a widely used standard co-ordinate
system in the neuroscience community. It uses the anterior and posterior commissure (AC-
PC) to determine the origin of the coordinate system (Figure 1.7). The X-axis is defined as
the line passing through the AC point and perpendicular to the AC-PC line. The Y-axis is
defined by the line connecting the most superior point of the AC and the most inferior point
of the PC. The Z-axis is defined by the line on a vertical plane (while the horizontal plane is
defined by the X-axis and Y-axis) passing through the inter-hemispheric fissure and the AC
point (Chau et al., 2005).
Page 38
22
The process of positional normalisation remains a mandatory step in the processing pipeline.
Also, all brain templates are always presented in the stereotactic co-ordinate system.
Table. 1.1 Features of different adult brain templates
PC
AC
Figure 1.7 The intersection of lines passing through anterior commissure (AC) and posterior commissure (PC)
define the origin of the stereotactic co-ordinate system. The left quadrant takes negative values and the right
quadrant takes positive values.
Page 39
23
Table. 1.1 Features of different adult brain templates
Feature Talairach
Tournoux
(1988)
MNI-305
(1995)
Colin-27
(1998)
MNI-152
(2001)
ICBM-452
(2003)
No. of subjects 1 305 1 152 452
*Gender F-1 M-239, F-66 M-1 NA NA
Age (years) 60 23.4±4.1 NA NA NA
Image type 2D 3D 3D 3D 3D
Population
specific
No Yes No Yes Yes
Type of atlas Non-digital Digital Digital Digital Digital
Registration
procedure
Manual
(Intra-subject)
Linear
(Inter-subject)
Linear and
non-linear
(Intra-subject)
Linear and
non-linear
(Inter-subject)
Linear and
non-linear
(Inter-subject)
Spatial
transformation
NA 9-parameter
linear
Affine 9-parameter
affine
12-parameter
affine
Coverage Excludes brain
stem and
cerebellum
Does not fully
cover top of
head and
cerebellum
Full head and
cerebellum
Full head and
cerebellum
Full head and
cerebellum
Cortical detail
information
Lack of cortical
detail
Lack of cortical
detail
Improved
cortical detail
Lack of
cortical detail
Improved
cortical detail
Contrast
between gray
and
whitematter
Less significant Significant Significant Significant Significant
Size (length,
width and
height of
brain)
Smaller than
other brain
templates
Larger than
Talairach
Tournoux
Same as
MNI-305
Same as MNI-
305
Same as
MNI-305
*M-Male; F-Female; NA- Not applicable
1.6 Brain Atlas
The establishment of stereotactic space led to a framework for consolidation of statistical
information across subjects (Evans et al., 2012). After achieving mapping to a brain template,
individual anatomical brain structures require identification. This can be accomplished by
Page 40
24
using an established atlas in which brain structures have been parcellated, often referred to
simply as a brain atlas. A brain atlas consists of a spatial map of the relative locations of
individual structures. It describes the underlying anatomy of a structure in terms of structural
morphology, size and shape. Atlases are typically created from multiple subjects through
manual segmentation of the anatomical structures of the brain.
Brain atlases may be extended to include a probabilistic map of individual brain structures. A
probabilistic atlas encodes the underlying anatomical variability in the structures across
different subjects. A probability map of segmented structures in the standard coordinate
system makes it possible to describe image data with significant statistical and visual power.
Anatomical variability is determined by using data from multiple subjects during the atlas
construction procedure. Volumetric parcellated atlases for identification of brain structures
have been developed by various groups around the globe. Automatic Anatomical Labelling
(AAL) is an early atlas comprising 45 volumes per hemisphere created from the Colin27
brain, non-linearly warped to MNI152 space (Tzourio-Mazoyer et al., 2002). It included both
cerebral and cerebellar parcellations. The Laboratory of Neuro Imaging (LONI) used 40 brain
images to generate the LONI Probabilistic Brain Atlas (LPBA40 Shattuck et al., 2008). It is
available to the neuroimaging community in a set of different variants in normalized
stereotactic space. The atlas construction pipeline used different normalisation techniques to
generate different variants of the same atlas. The probability map of LPBA40 was derived
from manual labels using the well-established LONI protocols.
Analysis of structural MR images using templates and atlases requires certain standard pre-
processing steps, described in the following section.
Page 42
26
1.7 Structural MR Image Analysis
Currently almost all neuroimaging software packages recommend the use of a series of
computational tools. This is called a processing pipeline. Structural analysis of MR images is
aided by writing in-house scripts specifically to ensure compatibility with in-house data. This
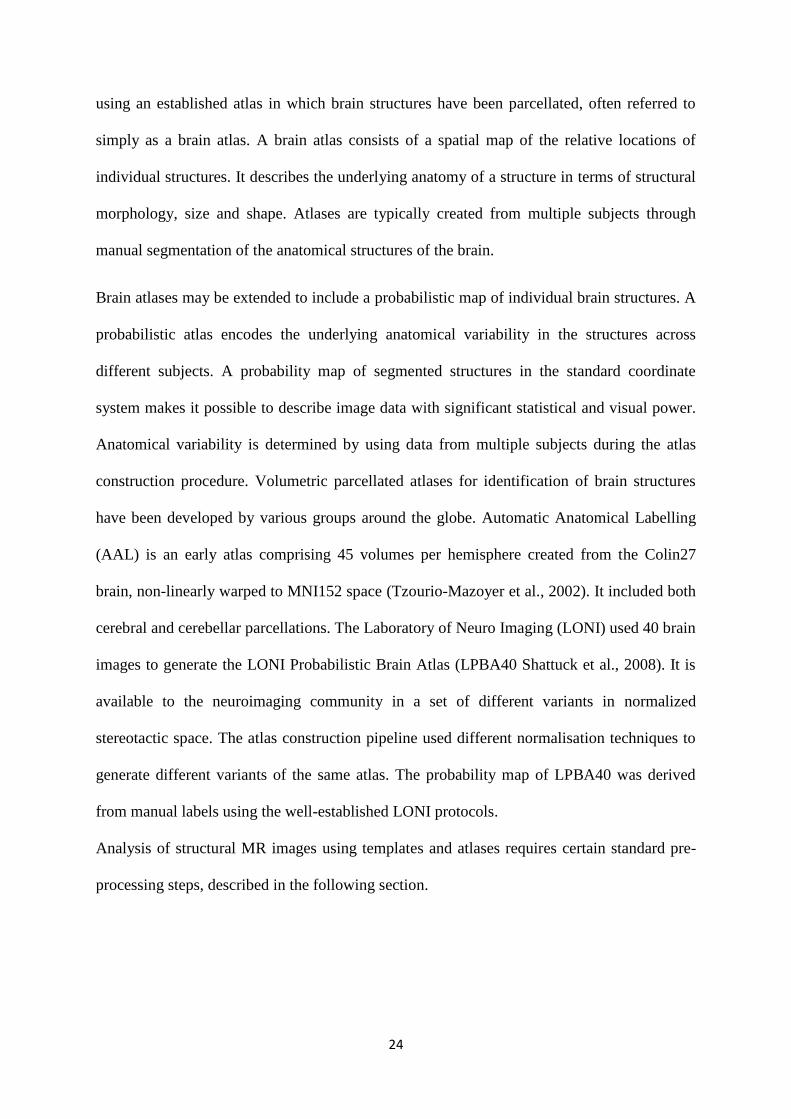
is greatly facilitated by routines in open-source tools. Briefly, the raw MR images (Figure.
1.8) are skull-stripped, corrected for inhomogeneities and segmented into different tissue
classes (Figure. 1.9), namely gray matter (GM), white matter (WM) and cerebrospinal fluid
(CSF). These procedures are common to most of the serial processing computational tools,
and complex model parameterisation takes care of inhomogeneity and bias correction (Pham
et al., 2000).
Figure 1.8 Sagittal, coronal and transaxial slices of 18 control children used in this study for cerebellar atlas
construction and structure parcellation.
Figure 1.9 MR sequential processing of structural T1 images that first extracts the intracranial cavity (ICC)
from the background (BG), and then iteratively segments the tissue classes present in the ICC into gray matter
(GM), white matter (WM) and cerebrospinal fluid (CSF).
Page 43
27
1.7.1 MR Image Label
Image segmentation is defined as partitioning of an image into non-overlapping, constituent
regions that are distinct and homogeneous with respect to anatomy or a characteristic such as
intensity. In this work, a segmentation method ideally finds the set of voxels that correspond
to distinct anatomical structures of the cerebellum. Ώ represents the image domain and is
the number of segmentations in the image.
Ώ= (1.12)
It’s assumed that the value of k is known, based on prior knowledge of the cerebellar
anatomy. For whole brain analyses, it is common to use k=3; corresponding to GM, WM and
CSF tissue classes. In this study, we used k=16 as this was the number of structures
delineated.
1.7.2 Automated cerebellar structure segmentation methods
Segmenting cerebellar structures in MR images is a challenging task because the intensity
distributions of cerebellar gray matter differ from that in the rest of the brain, the cerebellum
has a complex, convoluted structure with smaller substructures and physiological noise
occurs around the structure (Diedrichsen et al., 2010). Different structures of the cerebellum
have the same intensity profile, making it challenging to define the border between two
structures accurately. Further, not all boundaries between structures are visible on MR
images. Therefore cerebellar structure segmentation methods cannot rely on intensity
information alone; additional knowledge such as the deformation warp is needed to separate
structures of interest from the background.
Page 44
28
The current brain structure segmentation literature can be broadly classified into two
categories, based on the type of additional knowledge that they incorporate, namely atlas-
based segmentation and multi-atlas based segmentation. These are briefly introduced in the
following sections. In practice, this categorization is not always clear-cut and a combination
of these methods may result in superior performance.
1.7.3 Atlas-based segmentation
Atlas-based segmentation refers to the process of generating segmentation via registration of
an atlas and a candidate image. The spatial correspondence established between the intensity
images is used to obtain an output label map of the structure on the candidate image (Figure
1.10). By using a non-rigid deformation field in the registration process, it is possible to
extract information relating to subtle differences between subjects.
An atlas-guided approach is generally suited for segmentation of structures that are stable
over the population of study (Pham et al., 2000). It has numerous biomedical applications,
such as quantification of tissue volumes, diagnosis and localisation of pathology,
investigation of particular structures, treatment planning and computer-integrated surgery.
Page 45
29
1.7.4 Multi-atlas based segmentation
Multi-atlas based segmentation has proven to be one of the most competitive techniques in
medical image segmentation (Heckemann et al., 2006, Asman et al., 2013, Wang et al.,
2013). In a multi-atlas based segmentation approach (Figure 1.11), multiple atlas images are
registered to a target image and their segmentations are combined, to obtain segmentation of
the target image. This approach produces robust segmentation, transferring segmentations
from expert-labelled images, or atlases, to a target image using deformable image
registration. Errors produced by label transfer are further reduced by label fusion, which
Figure 1.10 Schematic of atlas based segmentation. Atlas construction is illustrated to the left of the blue line
and atlas based segmentation to the right. Training images are registered to a standard template and the resulting
transformation warps are applied to the individual atlases comprising the manually traced data of each subject.
The labels in each location of the registered individual atlases are averaged to create the probability map.
During segmentation, the test image is first registered to the template. The inverse of this transformation is then
applied to the probability map to warp the labels to the test image.
Page 46
30
combines the results produced by all atlases into a consensus solution. Regardless of the
approach, fusion algorithms are generally dependent on large atlas sets and highly accurate
registration.
Training Image1
and Atlas1
Training Image 18
and Atlas 18
Test Image
Registration and Warping
Registration and Warping
Deformed Test Image
segmentation 1
Deformed
Test Image segmentation
18
Label Fusion
(MAMV/MAGM)
Consensus Segmentation of
Test Image
Figure 1.11 Schematic of multi atlas based segmentation. The segmentation of one test image is determined
from the pairing of each training image (18 in total) with the test image. Linear and nonlinear warping is used to
transform the test image to each training image to obtain 18 distinct segmentations based on the 18 individual
atlases. These 18 deformed segmentations of the test image are transformed back into the test image space using
the inverse transformations. Label fusion methods are applied to obtain the final segmentation from the 18
distinct segmentations.
Page 47
31
Chapter 2
Improved labelling of cerebellar structures in children using probabilistic
atlas-based segmentation Priya Lakshmi Narayanan1,2, Natalie Boonazier1,,Christopher Warton1, Christopher D Molteno3, Jesuchristopher Joseph1,2, Joseph L
Jacobson1,4, Sandra W Jacobson1,4, Lilla Zöllei5 and Ernesta M Meintjes1,2
1Department of Human Biology, Faculty of Health Sciences, University of Cape Town, South Africa
2MRC/UCT Medical Imaging Research Unit, University of Cape Town, South Africa
3Departmentof Psychiatry, University of Cape Town, South Africa
4Department of Psychiatry and Behavioral Neurosciences, Wayne State University School of Medicine, Detroit,
United States
5Martinos Center for Biomedical Imaging, MGH, Boston, United States
*Corresponding author: Priya Lakshmi Narayanan, MRC/UCT Medical Imaging Research Unit, Faculty of
Health Sciences, University of Cape Town, South Africa. Fax: +27 21 448 7226
Email address: [email protected]
Page 48
32
Abstract
Consistent morphometry and functional localization of cerebellar cortex in a standard
coordinate system is important for interpretation of functional data, as well as comparisons of
results and anatomy across sites and populations. We present the first pediatric cerebellar
atlas for improved labelling of cerebellar structures in children. The Cape Town Pediatric
Cerebellar Atlas (CAPCA18) was constructed in the age-appropriate National Institute of
Health Pediatric Database (NIHPD) asymmetric template space using manual tracings of 16
cerebellar compartments in 18 healthy children aged 9-13 years from Cape Town, South
Africa. The probabilistic CAPCA18 atlas provides both valid assignments of labels to
specific spatial coordinate locations, as well as a quantitative measure of the uncertainty of
such assignments. Segmentation using this atlas was validated through comparison to manual
tracing in an independent set of 14 healthy children in the same age range and from the same
community. Results were compared to the performance of the Spatially Unbiased Infra-
tentorial Template (SUIT) on the same dataset. Average spatial overlap of the whole
cerebellar cortex for test images with their corresponding manual segmentations using the
probabilistic CAPCA18 atlas was 86%, compared to 78% after normalisation to the SUIT
template. Spatial overlap between automated and manual segmentations using the CAPCA18
atlas of individual lobules in both hemispheres were 70% or higher for all lobules, except
lobules VIIb and X where the overlap was on the order of 50-60%. On average, these values
were 8% higher than those obtained using SUIT for this pediatric dataset.
Keywords: Probabilistic atlas, cerebellum, brain mapping
Page 49
33
2.1 Introduction
The human brain is a complex structure and mapping its functional organization presents an
ongoing challenge. Recent findings suggest that the cerebellum is functionally heterogeneous,
with different topological regions subserving sensory, motor, cognitive, and affective
processing (Stoodley and Schmahmann, 2009; Schlerf et al., 2010; Strick et al., 2009;
Schmahmann and Sherman, 1998; Makris et al., 2005). As such, it has become increasingly
important to identify precisely which lobule is activated in functional imaging studies. Efforts
to map cerebellar function have, however, been limited by the fact that available cerebellar
atlases are generally limited to gross morphologic relationships (Crosby et al., 1962;
Carpenter et al., 1976; DeArmond et al., 1976; Waddington et al., 1984; Roberts et al., 1987;
Kretshmann and Weinrich, 1992), that the individual cerebellar lobules are generally not
labelled, and only limited sections are depicted in either one or two of the cardinal planes
with large gaps between these. Furthermore, the terminology used to identify the fissures and
lobules in these atlases is not uniform and is often contradictory.
Schmahmann et al. (2000) presented a human cerebellar atlas with sections at 2mm intervals
in three cardinal planes based on high-resolution T1-weighted Magnetic Resonance (MR)
images of a single human cerebellum that was coregistered to the Montreal Neurological
Institute (MNI) template (Evans et al., 1993) and annotated using a revised and simplified
nomenclature. Using the above MR Image Atlas of the Human Cerebellum as a basis for
identification of landmarks and fissures, Makris et al. (2005) developed a manual method
aided by a set of computer-assisted algorithms to facilitate the parcellation of the cerebellar
cortex into 32 Parcellation Units (PUs) per hemicerebellum in a manageable period of time.
In their implementation, the fissures divide the cortex into lobules, while longitudinal
Page 50
34
divisions separate the vermis from the hemispheres, and subdivide the hemispheres into
medial and lateral zones. The large lateral hemispheric region of Crus I and II is divided into
a further two zones. The authors found that intraclass correlation coefficients (McGraw and
Wong, 1996; Shrout and Fleiss, 1979) for both intra- and inter-rater reliability were
significantly improved by clustering PUs according to lobar divisions, anatomical
connectivity, or functional connectivity. Lobar clusters are widely used (Pierson et al., 2002)
and divide the cerebellum into anterior, posterior and flocculonodular lobes that are separated
by the primary and the posterolateral fissures, respectively. In all these studies only data
acquired from adults were used.
Subsequently, Diedrichsen (2006) developed the high-resolution Spatially Unbiased Infra-
tentorial Template (SUIT) of the cerebellum by normalizing individual cerebella of 20
healthy adults non-linearly to each other before averaging, which improved specificity when
labelling regions in functional MRI data.
Although atlases are widely used to assign anatomical labels to locations, there is a high risk
for error due to high spatial variability of individual cerebellar structures between different
populations. Probabilistic atlases allow for the assignment of labels to specific regions, while
providing a quantitative measure of the uncertainty of such assignments. Currently, whole
brain probabilistic atlases typically treat the cerebellum as a single structure without any
lobular divisions (Hammers et al., 2003; Shattuck et al., 2008). In 2009, the first probabilistic
cerebellar SUIT atlas was created (Diedrichsen et al., 2009) based on manual tracings of
lobules on T1-weighted MRI scans (1mm isotropic resolution) of 20 healthy adult
participants (10 male, 10 female, age range 19-27 years). The SUIT atlas defines twenty-eight
compartments: lobules I-IV and V divided into left and right hemispheres; lobules VI, Crus I,
Crus II, VIIb, VIIIa, VIIIb, IX, and X divided into vermal sections in addition to left and right
hemispheres. This atlas aims specifically to improve inter-subject co-registration of
Page 51
35
cerebellums to yield improved specificity of cerebellar activations and valid assignments of
functional activations to specific cerebellar lobules. Recently, Bogovic et al. (2013) described
a method that uses multiple object geometric deformable models to perform cerebellar
segmentation and demonstrated superior performance compared to SUIT atlas-based and
multi-atlas fusion approaches.
We were interested in examining cerebellar anatomy in children (age 9-13 years) from the
Cape Coloured (mixed ancestry) community in Cape Town, South Africa. Since manual
tracing is both time intensive and subjective, we wanted to perform automatic cerebellar
segmentation. It has been noted previously, however, that a specialized atlas should be
created for research in children (Diedrichsen, 2006) as the shape and ratio of gray matter to
white matter in the cerebellums of children differ significantly from that of adults (Fonov et
al., 2011). To our knowledge, no pediatric cerebellar atlas is currently available.
In developing an atlas, one important decision relates to the registration target (template) to
use. It has been shown previously that a template closer to the study population reduces
morphometric bias and the amount of non-linear deformation required to establish spatial
alignment (Yoon et al., 2009) between the template and subject. Previously, Wilke et al.
(2008) developed the ‘Template O Matic’ toolbox for SPM to create an age specific whole
brain template by initially using linear co-registration of subjects and regressing for age and
gender in pediatric populations. The resulting template, however, appears smoothed and lacks
anatomical detail in the areas of greatest variability.
The unbiased nonlinear National Institutes of Health Pediatric Database (NIHPD) template
created by Fonov et al. (2011) provides better spatial resolution and improved contrast
compared to the classical International Consortium for Brain Mapping (ICBM152) template.
Templates are available for different age ranges for normal brain development. In their work,
Page 52
36
the pediatric population was grouped into five categories between the ages of 4.5 and 18.5
years. For each category, two templates were constructed, one that preserves asymmetry and
another with symmetric hemispheres. Deformation studies using these five different
templates have shown that the average magnitude of deformation increases with increasing
difference in age between the template used and the subject being studied (Fonov et al.,
2011). In the present study we used the NIHPD unbiased nonlinear template that preserves
asymmetry closest to the age range of our subject population (7.5 years to 13.5 years).
In this work, we present the probabilistic Cape Town Pediatric Cerebellar Atlas (CAPCA18),
for improved labelling of cerebellar structures in children. The atlas was constructed in the
already established age-appropriate NIHPD template space from manual tracings of 16
cerebellar compartments in 18 healthy children (age range 9-13 years, 6 male) according to
the nomenclature introduced in the MRI atlas of the human cerebellum (Schmahmann et al.,
2000). The probabilistic presentations of each compartment provide a quantitative measure of
the spatial variability. Our atlas was validated by comparing manually traced segmentations
with automated segmentations using the CAPCA18 atlas in an independent set of 14 healthy
children (age range 8.9-11.8 years, 10 male) from the same community.
2.2 Methods
High resolution T1-weighted structural images were acquired on a 3T Allegra (Siemens,
Erlangen, Germany) MRI scanner using a Magnetization Prepared Rapid Gradient Echo
(MPRAGE) sequence (TR 2300ms, TE 3.93ms, TI 1100ms, 160 slices, flip angle 12 degrees,
1.3x1.0x1.0mm3, 6.03 minutes) in 18 healthy children (mean age 11.8±1.2 years) from the
Cape Coloured community in Cape Town, South Africa who were recruited as typically
developing controls for ongoing studies of Fetal Alcohol Spectrum Disorder (Jacobson et al.,
Page 53
37
2008). A further 14 healthy children (mean age 10.5 ± 0.8 years) from the same community
were scanned using a volumetric navigated (Tisdall et al., 2012) multiecho (ME) MPRAGE
sequence (van der Kouwe et al., 2008) (128 sagittal slices, TR 2530ms, TE
1.53/3.21/4.89/6.57ms, TI 1100ms, flip angle 7 degrees, 1.3x1.0x1.3mm3). All children were
scanned according to protocols that had been approved by the Faculty of Health Sciences
Human Research Ethics Committee at the University of Cape Town; parents of all children
provided written informed consent and children provided oral assent.
Image Pre-processing
The images were reoriented with the horizontal line defined by the anterior posterior
commisure (ACPC orientation) and the sagittal planes parallel to the midline. The images
were resampled to isotropic 1mm3 voxels using windowed sinc interpolation in Brain
Voyager (Goebel et al., 2006). The resulting images were cropped to a fixed bounding box by
removing the empty slices from the volume using a customised script written in MATLAB
(www.mathworks.com). This process ensured removal of the neck and generated similarly
oriented whole brain images.
Manual Tracing
The cerebella of the 18 input subjects were manually traced in native space according to the
revised nomenclature defined by Schmahmann et al. (2000) using Multitracer (Woods et al.,
2003) software on a tablet PC by an expert neuroanatomist (CW) who was blind to the age
and sex of the children. Although tracings were largely performed in the sagittal view, all
three planes were used to ensure three dimensional (3D) continuity. Tracings performed in
the coronal and axial planes appeared as dots in the sagittal view and were used to define
Page 54
38
lateral boundaries of structures. Tracings were performed at four times magnification. The
following lobules of the cerebellum were traced on both the left and right hemispheres:
lobules I-V, VI, Crus I, Crus II, VIIb, VIII, IX and X.
The right hemispheres of 10 randomly selected subjects were re-traced at a later time by CW
in order to compute intra-rater reliabilities. Cerebella of 14 test subjects were traced by a
different neuroanatomist (NB) using the same protocol. Inter-rater reliabilities for lobules of
eight cerebellar hemispheres traced by both neuroanatomists were compared using intraclass
correlation coefficients (ICC).
The midline slice was defined as the sagittal slice in which the cerebral aqueduct was most
clearly visible. Left and right hemispheric subregions were traced separately. The anterior
lobe comprises lobules I-V; lobule VI, Crus I and II, and lobule VIIb form the superior-
posterior lobe; and lobules VIII, IX and X comprise the inferior posterior lobe. For each
lobule, the areas demarcated by the drawn contours as belonging to that lobule were masked
on all relevant slices and combined to construct a 3D volume of each lobule. The resulting
volumes and their surfaces were inspected visually to identify and correct tracing errors
(examples shown in Figure 2.1) in an iterative way. The resulting masks define 16 cerebellar
compartments, 8 in each hemisphere, each of which was labelled with a unique integer value.
Tracings for one hemisphere of one brain are shown in the sagittal plane in the right panel of
Figure 2.2, with the corresponding masked areas and their color representations shown in the
middle and left panels, respectively. For each subject we also generated a cerebellar mask
comprising the sum of the gray matter parcellations and the total cerebellar white matter.
Page 55
39
Construction of the Probabilistic Atlas
The T1 weighted images of the 18 training subjects were spatially normalized to the age-
appropriate NIHPD asymmetric template (Fonov et al., 2011) using discrete cosine non-linear
deformation. We used the SPM5 unified segmentation (Ashburner and Friston, 2005) method
Figure 2.1 Illustration of Crus II volumes for the 18 training subjects with tracing errors in two (indicated by the
black arrows), which were manually corrected by the expert neuroanatomist.
Figure 2.2 Cerebellar lobules and their color representations. Left and right hemispheric structures are
represented using the same colors and unique labels. The image on the right shows manually traced contours in
the sagittal view for one subject, while the middle panel shows the corresponding masked areas and their color
representations on the left.
Page 56
40
that uses a mixture of Gaussian models to simultaneously perform spatial normalization, bias
correction, and tissue classification. The tissue probability maps (gray/white/cerebrospinal
fluid (CSF)) of the template were used to classify tissues as gray matter, white matter and
CSF. Further, all SPM's default settings were used. Following alignment of the T1 images to
the template, individual lobular masks and cerebellar masks of each subject were resampled
into the template space using nearest neighbour interpolation.
Co-registered cerebellar masks were averaged in the NIHPD template space to generate an
average cerebellar mask. In this work, we chose to set probabilities of voxels with values of
0.3 or less equal to zero, as these voxels were part of the cerebellum in only 30% or fewer of
the subjects, and values greater than 0.3 equal to unity. Using a threshold helps to reduce the
effects of outliers and individual subject variance. The average of the whole brain images of
the input subjects normalised to the NIHPD template space was multiplied by the resulting
cerebellar mask to construct an average cerebellar image (Figure 2.3A).
In a similar way, resampled lobular masks in normalised space were averaged across subjects
to generate probability maps for each structure, where the value in each voxel location
denotes the probability of a voxel belonging to said structure. Typically, there is spatial
variability of individual cerebellar structures between subjects even after alignment to a
reference template. The probability maps indicate the proportion of subjects in whom a
specific lobule occupies a location in the reference space and as such also quantifies the
spatial variability in different regions. This enables one to visualize both the spatial extent of
individual sub-regions and their spatial variability. Figure 2.3B shows the maximum
probability map generated by combining the averaged lobular masks in normalised space.
Each voxel is assigned a value equal to the maximum probability for that location. Further,
voxels for which the maximum probability is 0.3 or less are set to zero as this indicates that
Page 57
41
these voxels belonged to a cerebellar lobule in 30% or fewer of the subjects in the initial
dataset.
Figure 2.3 A. Average cerebellar image in normalised space, R-Right, L-Left; B. Maximum Probability maps
of individual structures; bright colors (white) indicate voxels with high probability and darker (red) colors
indicate voxels with lower probability. C.Maximum likelihood labellings superimposed on the average image
generated after spatial normalization with the NIHPD (7.5-13.5 years) asymmetric template. The colors
represent the lobules of the cerebellum as per the color look up table in Figure 2.2. The coronal slices range
from MNI coordinates -75 to -33.
Page 58
42
From the maximum probability map, we also constructed an atlas of maximum likelihood
labellings, which assigns to every voxel a label indicating the individual cerebellar structure
located at that voxel most often. At the boundaries between structures, where a voxel may
have equal probability of belonging to two different lobules, the label that occurs most often
in a 3x3x3mm3 region surrounding the voxel was assigned to the voxel (Figure 2.3C).
Validation
The images of the 14 test subjects were pre-processed using the same pipeline as the training
subjects. To segment the cerebella of the 14 test subjects using our CAPCA18 cerebellar
atlas, the unified normalisation algorithm in SPM5 was applied to simultaneously perform
tissue classification and normalisation of each subject’s whole-brain images to the NIHPD
asymmetric template. Labels from our CAPCA18 atlas were resampled to subject space using
the inverse of the deformation warps obtained during normalisation.
We computed for each test subject both individual lobular volumes and total cerebellar gray
matter volume. We compared the percentage of total gray matter volume that each lobule
occupies in children from our study with values previously reported for adults (Makris et al.,
2005).
For comparison, labelling was also performed using the SUIT cerebellar atlas that is available
in SPM5 and was developed using adult data. Briefly, each subject’s images were cropped to
the region of the cerebellum after co-registration to the ICBM152 template. Individual
cerebella were normalised to the SUIT template to obtain deformation maps for each subject.
Manual editing was required around the anterior borders between the cerebellum and the
temporal and occipital lobes for 8 of the test subjects. After editing, the cerebellar cortex
achieved 78% average overlap with the SUIT template, which is higher than the 75%
previously reported (Diedrichsen et al., 2009). Normalisation was repeated after manual
Page 59
43
editing and the labels from the SUIT atlas were resampled to the cropped test subject space
using the inverse of the deformation warps obtained during normalisation. Finally, labels
were resampled to native test subject space using the suit_reslice command.
Cerebellar parcellations derived from manual tracings were compared to those generated
using our CAPCA18 atlas and the SUIT atlas using both volumetric measurements and the
Dice coefficient as a measure of spatial overlap (Dice et al., 1945). CAPCA18 atlas-based
labelling was compared to manual tracings in all 16 hemispheric regions. SUIT labelling
differs from the conventions followed in this paper, in that the vermis is defined as a single
medial entity in SUIT, while it was not traced separately in our work and as such was
included in our hemispheric regions. In order to avoid errors due to omission or inclusion of
the vermal regions when comparing data from SUIT to manual tracings, the left and right
SUIT hemispheric regions and the SUIT vermal region were combined for each lobule to
define whole lobules and compared to whole lobules (left plus right) from the manual
tracings. As such, SUIT atlas-based labelling was compared to manual tracings in 8 whole
lobules, comprising both hemispheric and vermal regions combined.
2.3 Results
Intra-rater reliabilities for 10 right hemispheres traced on two separate occasions by CW
yielded ICCs ranging from 0.72 to 0.96 for different structures (Table 2.1). Only in the small
lobules IX and X were ICCs below 0.85. Furthermore, inter-rater reliabilities for lobules of
eight cerebellar hemispheres traced by two different neuroanatomists show ICCs greater than
0.8 in five of eight lobules traced. ICCs in VIIb and X were unacceptably low, indicating that
these regions are difficult to trace reliably.
Page 60
44
Table 2.1 Intra-rater reliability for 8 regions in 10 right hemispheres traced on two separate occasions by an
expert neuroanatomist, and inter-rater reliability for eight lobules in eight hemispheres traced by two different
neuroanatomists.
Cerebellar
Lobules
ICC
Intra-
rater
ICC
Inter-
rater
I-V 0.91 0.92
VI 0.87 0.83
Crus I 0.85 0.81
Crus II 0.89 0.69
VIIb 0.85 0.43
VIII 0.96 0.88
IX 0.83 0.87
X 0.72 0.46
Table 2.2 gives the average lobular volumes for the 14 test subjects after automatic
segmentation using the CAPCA18 atlas. Volumes are expressed as a percentage of total
cerebellar gray matter volume. The average gray matter volume for our test subjects is 113.2
± 11.5cm3, which compares favourably with gray matter volumes of 112.9 ± 18.9cm3
reported by Makris et al. (2005) in adults. Crus I, Crus II and lobule VIIb together occupy
49.4% of the total cerebellar gray matter. For comparison, percentage lobular volumes
reported by Makris et al. (2005) for adults are included in Table 2.2. Proportionally, lobules
VI, VIIb and X comprise smaller fractions of the total cerebellar gray matter in children,
while lobule IX is proportionately about 50% larger than in adults.
Page 61
45
Table 2.2 Mean and standard deviation (SD) of lobular volumes generated from automatic segmentation of the
cerebella in 14 test subjects using the CAPCA18 atlas. Volumes are expressed as a percentage of total cerebellar
gray matter volume.
Lobule Right
Hemispheric
Volume
(% of total
cerebellar gray
matter volume)
Left
Hemispheric
Volume
(% of total
cerebellar gray
matter volume)
Total
Hemispheric
Volume
(% of total
cerebellar gray
matter volume)
Total Hemisphere
Volume (Makris
et al., 2005)
(% of total
cerebellar gray
matter volume)
% Difference
between relative
lobular sizes in
pediatric and adult
cerebella
Mean SD Mean SD Mean Mean
I-V 5.9 0.3 6.7 0.4 12.6 12.1 4.1
VI 6.4 0.4 7.0 0.5 13.4 16.3 -17.8
Crus I 12.5 1.4 12.2 1.5 24.7 23.5 5.1
Crus II 9.3 1.2 8.5 1.2 17.8 16.4 8.5
VIIb 3.3 0.4 3.7 0.5 6.9 9.0 -23.3
VIII 7.2 1.0 6.6 0.8 13.8 14.9 -7.4
IX 4.7 0.5 4.9 0.5 9.6 6.4 50.0
X 0.6 0.1 0.6 0.0 1.2 1.4 -14.3
Total 49.9 4.8 50.2 5.0 100.0 100.0
Table 2.3 compares the mean lobular volumes for the 14 test subjects obtained from manual
tracing with those generated from automatic segmentation with the CAPCA18 atlas. Volumes
of lobule X were larger bilaterally after automatic segmentation compared to manual tracing
(paired Student’s T-test), as were left Crus I, left VIIb, and left IX. Left Crus II is the only
region that was significantly smaller following automatic segmentation compared to manual
tracing.
In Figure 2.4, we present Dice coefficients comparing spatial overlap of automatic
segmentations using the CAPCA18 atlas with manual tracings for the 16 hemispheric
regions. The box and whisker plots indicate that, on average, spatial overlap between manual
and automatic segmentations are 70% or higher in all regions, except lobules VIIb and X
where it is of the order of 50% and 60%, respectively. Notably, these are the two regions
where inter-rater reliabilities for manual tracings were unacceptably low.
Page 62
46
Table 2.3 Comparison of mean and standard deviation (SD) of lobular volumes from manual tracing and
automatic segmentation with the CAPCA18 atlas in 14 test subjects.
Cerebellar
Lobules
Right Left
Volume from
Manual
Tracing (cm3)
Volume from
Automatic
Segmentation
(cm3)
t
Volume from
Manual
Tracing (cm3)
Volume from
Automatic
Segmentation
(cm3)
t
I-V 6.3 (1.1) 6.1 (0.3) 0.9 6.5 (1.2) 6.7 (0.3) -0.8
VI 6.8 (1.1) 6.5 (0.1) 0.8 6.7 (1.2) 7.0 (0.1) -1.2
Crus I 12.0 (2.1) 12.5 (0.2) -1.3 11.0 (1.2) 12.1 (0.2) -4.1*
Crus II 9.5 (1.9) 9.2 (0.2) 0.9 10.4 (2.9) 8.4 (0.2) 3.9*
VIIb 3.6 (0.4) 3.3 (0.0) 2.3† 3.0 (0.4) 3.7 (0.1) -4.3*
VIII 7.5 (1.2) 7.1 (0.2) 1.4 7.2 (2.0) 6.6 (0.0) 1.5
IX 4.2 (0.5) 4.6 (0.1) -2.1† 4.3 (0.3) 4.9 (0.1) -3.7*
X 0.4 (0.0) 0.6 (0.0) -9.4*** 0.4 (0.0) 0.6 (0.0) -12.9***
Values are Mean (SD); †p<0.1; *p<0.05; **p<0.001; ***p<0.0001
Figure 2.5 presents a color map of the Dice coefficients in the 16 hemispheric cerebellar
regions for all 14 test subjects, where cold colors (cyan) denote poor spatial overlap and
warm colors (red) denote high spatial overlap (>0.7). It is evident that spatial overlap drops
below 0.6 in most subjects bilaterally in lobules VIIb and X. For the remaining regions, Dice
Figure 2.4 Box-and-whisker plots of Dice coefficients that quantify spatial overlap in 14 test subjects
between manual tracing and automatic segmentation using the CAPCA18 atlas. Red represents the right
hemisphere and blue the left hemisphere.
Page 63
47
coefficients are typically above 0.7 in most subjects. Spatial overlap of manual and automatic
total cerebellar gray matter was 86%.
Table 2.4 Comparison of mean and standard deviation (SD) of volumes of cerebellar lobules obtained from
manual tracing and SUIT segmentation in 14 test subjects.
Cerebellar
Lobules
Cerebellar hemispheric volumes
Volume from
Manual
Tracing
(cm3)
Volume from
SUIT
Segmentation
(cm3)
t
I-V 12.8 (2.1) 14.3 (2.5) -1.6†
VI 13.5 (2.0) 18.3 (3.0) -5.9***
Crus I 23.0 (1.8) 20.0 (4.4) 2.5*
Crus II 19.9 (1.7) 15.0 (4.2) 3.8**
VIIb 6.7 (0.9) 7.5 (1.9) -1.5†
VIII 14.7 (2.2) 14.0 (3.2) 0.8
IX 8.6 (1.2) 5.8 (1.2) 5.3***
X 0.8 (0.1) 0.9 (0.2) -1.6†
Values are Mean (SD); †p<0.1; *p<0.05; **p<0.001; ***p<0.0001
Table 2.4 presents a comparison of mean whole lobular volumes (left and right hemispheres
and vermis combined) in the 14 test subjects from segmentation using the SUIT atlas with
Figure 2.5 Colormap of Dice coefficients of spatial overlap between automatic segmentation using CAPCA18
and manual tracing for 14 test subjects (TS) bilaterally in 8 hemispheric cerebellar regions.
Page 64
48
volumes obtained from manual tracings. Hemispheric volumes from SUIT segmentation were
significantly different to those from manual tracing in four of eight lobules (paired Student T-
test), and tended to be larger, although below conventional levels of significance, in a further
three lobules. Volumes were equivalent only in lobule VIII. Notably, one of the regions that
SUIT overestimates is lobule VI, which is proportionately smaller in children than in adults,
while lobule IX which is underestimated with SUIT is proportionately larger in children.
Figure 2.6 compares Dice coefficients that quantify spatial overlap in the 14 test subjects
between manual tracing and automatic segmentation using either the SUIT (red) or
CAPCA18 (blue) atlases in 8 whole lobules, when left and right hemispheres (and vermal
regions in the case of SUIT) have been combined. CAPCA18 performs significantly better
(Student T-test) than SUIT in lobules I-V, VI, CrusI, VIII and IX.
Figure 2.7 compares in 14 test subjects for total cerebellar gray matter spatial overlap
between manual tracing and automatic segmentation using SUIT (green) with spatial overlap
between manual tracing and automatic segmentation using CAPCA18 (yellow). In all except
one subject, spatial overlap of manual tracings with CAPCA18 segmentations are higher than
Figure 2.6 Box-and-whisker plots of Dice coefficients that quantify spatial overlap in 14 test subjects
between manual tracing and automatic segmentation using either SUIT (red) or CAPCA18 (blue) for
whole lobules. †p<0.1; *p<0.05; **p<0.01; ***p<0.001
Page 65
49
between manual tracings and SUIT segmentation. On average, gray matter spatial overlap
using SUIT before and after manual editing were 75% and 78%, respectively, while it was
86% using the fully automated CAPCA18 atlas.
2.4 Discussion
We have presented a probabilistic three dimensional cerebellar atlas for children with
parcellations into 16 macroanatomic structures and performed validations comparing manual
tracing with automatic segmentation using either the SUIT atlas or our new CAPCA18 atlas
using both volumetric measurements and Dice coefficients. The probabilistic cerebellar atlas
encodes the individual subject variability in different cerebellar structures, while the
maximum likelihood labelling assigns to each voxel a unique label according to the label
most often assigned to a voxel in that location. Average spatial overlap of the whole
cerebellar cortex for pediatric test images with their corresponding manual gray matter
segmentations using our probabilistic CAPCA18 atlas was 86%, compared to 78% after
Figure 2.7 Spatial overlap of total cerebellar gray matter from manual tracing with total cerebellar gray
matter from automatic segmentation using either SUIT (green) or CAPCA18 (yellow) in 14 test subjects.
Page 66
50
normalisation to the SUIT template. This finding suggests that our pediatric cerebellar atlas
helps to reduce bias and segmentation errors that might occur from using an atlas constructed
from adult data.
We also computed spatial overlap in individual cerebellar lobules and achieved spatial
overlap in both hemispheres of 70% or higher in all lobules, except lobules VIIb and X where
it was of the order of 50-60%. Notably, these are the smallest cerebellar lobules, comprising
only 1.2% (lobule X) and 6.9% (lobule VIIb) of the total cerebellar gray matter, so that even
small differences will result in low Dice coefficients. These are also regions that are difficult
to trace reliably as evidenced by the poor inter-rater reliabilities in these regions. The
accuracy of structure segmentation depends on its spatial location and tissues surrounding the
structure. The inferior lobe VIIb comprises a very thin layer of gray matter and the inclusion
of additional white matter in the manual tracing of this structure in the training subjects
appear to have resulted in lower accuracies when automatically segmenting this area. Lobe X
is the smallest structure in the cerebellum making it very sensitive to errors.
In all regions except lobules VI and IX, Dice coefficients for the children in our study using
CAPCA18 compare favourably to values reported in adults by Bogovic et al. (2013) who
used an automatic classification of cerebellar lobules algorithm that employs an implicit
multi-boundary evolution (ACCLAIM) approach. The ACCLAIM method relies on good
contrast between CSF and GM and high spatial resolution (0.828x0.828x1.1mm3) and as such
may perform less well in our pediatric data.
Fissures in an average child brain are not as clearly distinguishable as in an average adult
brain and the gray matter to white matter ratio also tends to vary in this population (Fonov et
al., 2011). As a result, improved co-registration and segmentation results are expected using a
cerebellar atlas for children. To our knowledge, this is the first pediatric cerebellar atlas with
Page 67
51
16 parcellations that can serve as a better spatial prior to analyze cerebellar morphometry in
children.
The average percentage gray matter volume occupied by each lobule in the cerebellar
hemispheres were compared with values previously reported by Makris et al. (2005) to
examine potential relative size differences in children compared to adults. It was found that
lobule IX is proportionately larger in children, while lobules VI, VIIb and X are
proportionately smaller. The increased volume in lobule IX in children may be due to
increased gray matter around the posterior lobes of the cerebellum. It has been shown
previously, when deforming pediatric brains to the adult ICBM152 nonlinear template, that
gray matter around the posterior lobe is increased in children and that the shape and ratio of
gray and white matter in children is different to that of adults (Fonov et al., 2011), with
differences ranging from 4 to 23%. The good spatial overlap achieved between manual
tracing and automated parcellation using CAPCA18 in lobule IX provides further support for
the fact that this region is relatively larger in children.
We have used publicly available SPM software to construct the atlas, which ensures that our
CAPCA18 atlas can be easily used for both segmentation and localisation in morphometric
and functional imaging studies, respectively.
For the data used in the current study no manual editing was required when performing
segmentation using the newly presented CAPCA18 cerebellar atlas. It is, however, important
to check the images generated after initial pre-processing as well as after each intermediate
step to ensure that no errors are introduced in the pipeline when computing the deformation
between the atlas and test subject.
One limitation of the present study is that the number of boys and girls were not equal in
either the training or test data sets. In the training data set there were twice as many girls as
Page 68
52
boys, while 70% of the test subjects were boys. This could have introduced bias into the atlas,
which may have resulted in poorer segmentation performance in the test subjects. We
examined gender differences by comparing lobular volumes from manual tracings in boys
and girls. Although lobular volumes in both hemispheres were equivalent between boys and
girls (all p’s > 0.1) in this small sample, we expect that the atlas may be improved if the
training data set had equal numbers of boys and girls.
2.5 Conclusion
This paper presents the CAPCA18 pediatric cerebellar atlas which can be used to
automatically segment the cerebella of children into 16 lobules. The segmentation was
validated in 14 test subjects from the same age group as children whose data were used in the
construction of the atlas. We believe that the maximum probability maps and the maximum
likelihood labellings will be a useful tool in analysing the cerebellum in structural and
functional imaging studies in children. Future work will focus on improving the accuracy of
individual parcellations and performing validation in a larger number of subjects. Higher
dimensional registration and using multiple atlases for label fusion can potentially improve
the segmentation.
Acknowledgments
Cerebellar neuroimaging data were collected with funding from NIH Fogarty International
Research Collaboration (FIRCA; R03 TW007030) and National Institute on Alcohol Abuse
and Alcoholism (NIAAA; R01AA016781). Recruitment of the Cape Town longitudinal
cohort was funded by two administrative supplements from NIAAA to R01AA09524 and the
NIH Office of Research on Minority Health; recruitment of the Cape Town cross-sectional
Page 69
53
cohort, by NIH FIRCA (R03 TW007030). This research was supported by funding from
NIH/NIAAA (R21AA017410), a National Research Foundation of South Africa Focus Area
grant (FA2005040800024), South African Research Chairs Initiative of the Department of
Science and Technology and National Research Foundation of South Africa, Medical
Research Council of South Africa, a Children’s Bridge grant from the Office of the President
of Wayne State University, a seed money grant from the University of Cape Town; and
grants from the Joseph Young, Sr., Fund from the State of Michigan. LZ was supported for
this research in part by NICHD grants 1K99HD061485-01A1 and R00 HD061485-03.We
thank M. September, J. Croxford, and A.S. Marais for their work on recruitment and retention
of the cohorts; the staff at the Cape Universities Brain Imaging Centre and our University of
Cape Town research staff for collection of the neuroimaging data. We also express our
gratitude to the mothers and children who have participated in the Cape Town Longitudinal
Cohort Studies.
Page 70
54
Chapter 3
Assessment of different label propagation methods for segmenting
cerebellar structures in adults using the CAPCA18 pediatric cerebellar
atlas Priya Lakshmi Narayanan1,2, Ernesta M Meintjes1,2, Christopher Warton1, Andre van der Kouwe3, and Lilla Zöllei3
1Department of Human Biology, University of Cape Town, South Africa, 2MRC/UCT Medical Imaging Research
Unit, University of Cape Town, South Africa, 3Martinos Center for Biomedical Imaging, MGH, Boston, United
States
Abstract
Effective methods for the propagation of cerebellar labels from structural atlases facilitate
studies of cerebellar morphometry. The cortical cerebellar structures in our atlas were
manually labelled in 18 healthy pre-adolescent children (training data) and comprise 8 labels
per hemisphere. Typically, labels are propagated from a single probabilistic atlas or from
individual atlases of the training dataset (multi atlas approach). Here we propagate the
training data labels generated from a pre-adolescent population to 35 adult test subjects after
establishing spatial correspondence between them using efficient and robust linear and
nonlinear registration tools. This paper compares the performance of three different label
propagation methods for labelling cerebellar structures. First we use a probabilistic atlas
constructed from the training dataset and propagate the atlas labels to test subjects by warping
the label map directly on to the test image. We compare this direct warping approach to two
different multi atlas label propagation methods: multi atlas majority voting (MAMV;
Heckemann et al., 2006) and multi atlas generative model (MAGM) based label propagation
(Iglesias et al., 2012). Every training image is first registered to each test image in a pairwise
manner (Postelnicu-Zöllei et al., 2009), generating 18 registered training atlases for each test
Page 71
55
image. Label propagation on each test image is achieved by combining the deformed output
segmentations iteratively for all structures. The improved final multi atlas segmentation is
thus derived from 18x35 segmentations for the whole test dataset. The resulting
segmentations from these three methods were compared with manual tracings available for 3
test subjects using the Dice coefficient, the modified Hausdorff distance, and volumetrics.
Further, the performance of the three methods was evaluated using the simultaneous truth and
performance level estimate (STAPLE) (Warfield et al., 2004). Results indicate that multi
atlas based label propagation methods consistently perform better than direct warping. The
multi atlas based segmentation captures all possible variations present in the training data and
helps to achieve precise segmentations closer to manual segmentations.
3.1 Introduction
Magnetic resonance imaging (MRI) is a non-invasive method to study neuroanatomical
structures of the brain in vivo and is useful to advance our understanding of neurological
disorders (Thompson et al., 2004) and evaluate longitudinally (Reuter et al., 2012; Bernal-
Rusiel et al., 2012) neuropathology and treatment (Thompson et al., 2007; Gering et al.,
2001). In general, parcellated brain atlases are generated by manual delineation of structures
of interest on MR images acquired from a group of subjects by an expert neuroanatomist
adhering to standard protocols. This manual method is extremely time consuming and subject
to inter- and intra-rater variations. To eliminate this, automatic parcellation of structures can
be performed using already parcellated brain atlases that produce reproducible and consistent
results compared to manual segmentation. Only a few whole brain parcellated atlases, such as
the automated anatomic labelling atlas (Tzourio-Mazoyer et al., 2002) and LONI
probabilistic brain atlas LPBA40 (Shattuck et al., 2008), are publicly available for
parcellation/segmentation of brain structures. Popular software packages like FreeSurfer
(http://surfer.nmr.mgh.harvard.edu/fswiki) are often used in brain mapping to study cortical
Page 72
56
thickness and perform morphometric analysis over the whole brain. However, the automated
parcellation is limited to cerebral structures limiting its usefulness for morphometric analyses
of cerebellar structures. Using recent advances in registration and label propagation methods,
this work aims to improve methods for automatic parcellation of cerebellar structures.
Average intensity images (templates) are usually presented in a stereotactic coordinate
system, such as Montreal Neurological Institute (MNI) or Talairach space. The standard
whole brain MNI305 template was constructed by registering 305 scans using 9-parameter
linear transformation. The next generation template released by MNI, popularly known as the
International Consortium of Brain Mapping (ICBM152) template (Evans et al., 1993), was
constructed from co-registration of images from 152 subjects. Templates built in stereotactic
coordinate systems aid inter-subject comparisons and alleviate the complexities arising from
structural variability between individual brains. The historical evolution of different whole
brain templates using linear and non-linear registration has been well documented by Evans
et al. (2012). The ICBM152 template serves as the registration target in analysis tools such as
SPM (Ashburner et al., 1999) and FSL (Smith et al., 2004). The template, however, has poor
signal to noise ratio (SNR) and lacks anatomical detail to distinguish the subregions of the
cerebellum. Recently, unbiased non-linear age-specific templates for children in various age
categories have been made available by Fonov et al. (2011) along with their corresponding
tissue priors. These templates have higher SNR and increased resolution compared to the
classic ICBM152 template.
Parcellations on an average template image serve as a map of the spatial arrangement of
anatomical structures of the brain and is called an atlas. Maximum likelihood label maps
indicate the label that occurs in a specific voxel in the largest number of subjects during atlas
Page 73
57
construction, while probabilistic maps provide a measure of the uncertainty of a specific label
assignment. The CAPCA18 atlas used in our study provides labels for 16 distinct cerebellar
structures, 8 in each hemisphere, namely lobules I-V, VI, Crus I, Crus II, VIIb, VIII, IX and
X.
Label propagation refers to the process of transferring labels from an atlas to a test image
following some sort of spatial transformation and is highly dependent on the registration
framework that is used to initially establish the spatial correspondence. Registration
algorithms (Woods et al., 1993; Ashburner et al., 1999; Fischl et al., 1999; Jenkinson and
Smith 2001; Joshi et al., 2004; Postelnicu-Zöllei et al., 2009) differ primarily in their
objective function, the optimization method used, the degrees of freedom, and the number of
parameters used. Registration methods are primarily classified into volume- or surface-based
where the former uses intensity differences and the latter uses topological properties and
geometric features of the cortex to guide the registration. A recent study comparing surface-
and volume-based registration (Ghosh et al., 2010) clearly demonstrated the superior
performance of surface-based approaches. The spatial transformation generated from
registration is then applied to the label map to propagate the labels to the test image. The
accuracy of the resulting segmentation decreases if the anatomy of the atlas is very different
from that of the test subject. In such cases, one possible solution is to use multi atlas based
segmentation methods that better capture the underlying anatomical variation by using
multiple registrations. The multiple atlas concept was originally demonstrated for segmenting
microscopy images of bee brains (Rohlfing et al., 2004). Label propagation in human brain
images using multi atlas majority voting (MAMV; Heckemann et al., 2006) is achieved by
registering several atlases to the test image and then combining the resulting segmentations to
obtain the final segmentation of the test image. Recently, a multi atlas generative model
Page 74
58
(MAGM) approach (Iglesias et al., 2012; Iglesias et al., 2013) was used to apply the final
enhanced segmentation of the test subject. This method is independent of the intensities of
the training images and exploits the relationship between the volume of the test image and its
propagated labels. Previous studies have shown that multi atlas approaches increase the
accuracy and robustness of cortical segmentations with label fusion (Wang et al., 2013;
Asman et al., 2013).
The cerebellum, which is much smaller than the cerebrum, is functionally heterogeneous with
different topological regions responsible for various sensory, motor, cognitive, and affective
processing (Stoodley and Schmahmann, 2009; Schlerf et al., 2010; Strick et al., 2009; Makris
et al., 2005). The cerebellar atlas in MNI coordinate space developed by Schmahmann et al.
(2000) details the gross morphology of the cerebellum and its arrangement of fissures.
Diedrichsen et al. (2009) constructed a probabilistic atlas of the cerebellum and brainstem,
popularly known as the Spatially Unbiased Infratentorial Template (SUIT), by warping
images of 20 healthy adults into MNI space. This probabilistic atlas provides the probability
with which labels occur at each spatial location as opposed to segmentation per se. Recently,
cerebellar segmentation in adults using SUIT was compared with multi object deformable
models that were custom built from manual delineations of cerebellar structures (Bogovic et
al., 2013). Performance of the latter was shown to be superior compared to both SUIT atlas-
based segmentation and multi atlas approaches.
To our knowledge, the performance of different automated label propagation methods has not
been established for cerebellar segmentation. The present study aims to compare the accuracy
of cerebellar segmentation in 35 adult test subjects using three different label propagation
methods applied to the CAPCA18 atlas that was constructed from manual tracings of
Page 75
59
cerebellar structures in 18 healthy pre-adolescents. Volumes are compared in the 16
cerebellar regions, 8 in each hemisphere. Finally, we evaluate the segmented output using the
Dice coefficient and the modified Hausdorff distance metric in 3 representative test subjects
compared to manual segmentations by an expert neuroanatomist (CW).
3.2 Materials and Methods
CAPCA18 Atlas
The details of the CAPCA18 atlas construction are provided in the previous chapter. Briefly,
high resolution T1-weighted images were acquired on a 3T Allegra MRI scanner (Siemens,
Erlangen, Germany) in the sagittal plane using a magnetization-prepared rapid gradient echo
(MPRAGE) sequence in 18 healthy pre-adolescent children (mean age 11.8±1.2 years, range
9-13 years, 6 males) who had been recruited as control subjects for on-going studies on fetal
alcohol spectrum disorders (Jacobson et al., 2011) in Cape Town, South Africa. The cerebella
of the 18 children were segmented into 16 regions, 8 in each hemisphere, by an expert
neuroanatomist (CW) using Multitracer software (Woods et al., 2003) according to the
nomenclature defined by Schmahmann et al. (2000). Each cerebellar region includes some
white matter due to the fine branching structure of the cerebellar white matter making it
difficult to exclude during the delineation process. Each child’s brain was warped to the age-
appropriate NIHPD asymmetric template using the SPM5 unified segmentation approach.
Co-registered images were averaged to generate an average cerebellar image in normalised
space. Further, the same transformations were applied to the individual lobular masks and the
cerebellar masks of each subject, which were then averaged to construct the probabilistic
atlas and the maximum likelihood label maps in the NIHPD template space.
Page 76
60
MRI protocol for adults (test dataset)
High resolution MRI scans were acquired on a 1.5T Vision system (Siemens, Erlangen,
Germany) for 35 adult subjects as part of studies being conducted at the Washington
University Alzheimer’s Disease Research Center (ADRC) in St. Louis. T1-weighted
magnetization prepared rapid gradient echo (MPRAGE) scans were obtained according to the
following protocol: two sagittal acquisitions, FOV = 256, matrix = 256 x 256, resolution =
1x1x1.25 mm3, TR 9.7ms, TE 4ms, flip angle 10 degrees, TI 20ms, TD 200ms. The two
acquisitions were averaged to increase the contrast-to-noise ratio. Descriptions of these
images have appeared in prior publications (e.g., Buckner et al., 2004; Fotenos et al., 2005).
Label propagation using direct warping
Skull stripped intensity normalised images of the test subjects were co-registered to the
average image generated from the co-registered training images. The image volume of each
test subject was registered to the target image using a two-step volumetric registration. First
we applied linear registration using FLIRT (http://fsl.fmrib.ox.ac.uk/fsl/), followed by non-
linear volumetric (MRI_NL_ALIGN) registration in Freesurfer
(http://surfer.nmr.mgh.harvard.edu/fswiki). The deformation field was geometrically driven
and diffused to the volume based on elasticity to align the volumetric images (Postelnicu-
Zöllei et al., 2009).
The registration yields a deformation from each test image to the atlas. By applying the
inverse transformation, the maximum likelihood label map of the CAPCA18 atlas was
warped to the native coordinate system of the test image and could be used directly to
propagate individual labels to the test subject. Figure 3.1 illustrates the steps involved in
Page 77
61
generating the automated segmentation of the cerebellar structures for a test subject using this
direct warping approach.
Figure 3.1 Flow chart showing the steps involved in propagating cerebellar labels onto the image of a test
subject using direct warping.
Label Propagation using multi atlas segmentation
The images of each of the training subjects and their respective label maps generated from
the manual tracings are collectively referred to as the multi atlas.
The images of the training subjects were processed using Freesurfer software
(http://surfer.nmr.mgh.harvard.edu/). The processing steps included skull stripping (Ségonne
et al., 2004), intensity normalisation (Sled et al., 1998), cortical and sub-cortical structure
segmentation, surface generation, registration to the spherical atlas, and cortical thickness
calculation (Dale and Sereno, 1993; Dale et al., 1999; Fischl et al., 1999). The surfaces were
superimposed on the normalised T1 weighted images and visually assessed for correctness of
gray-white and gray-CSF boundaries. White matter boundaries were edited manually to
Non-linear Registration
Volume Resampling
Volume Resampling
Linear Registration
Process and functions
Linearly Registered
volumes
Atlas image
Inverse Linear
Transform matrix
Deformed output
Inverse NL deformation
warp
Atlas label map
Inputs
Atlas image
Test images
Non-linear (NL) output
Non-linear deformation
warp
Test subject segmentation
Deformed output
Outputs
Linear transform matrix
Linearly Registered volumes
Page 78
62
ensure the correct surface generation. Freesurfer quality control procedures are described in
detail at the following link
http://surfer.nmr.mgh.harvard.edu/fswiki/FsTutorial/TroubleshootingData. The surfaces of
the training subjects were edited to aid the surface registration and to achieve better
alignment of the folding patterns between the brains of different subjects.
After pre-processing, the surfaces from the training subjects were used as the moving sources
and the surfaces of the test subjects as the targets for combined volume- and surface-based
(CVS) registration. Every training subject’s surface was registered to each test subject’s
surface (i.e. 18x35 registrations). The robust CVS registration tool (Postelnicu-Zöllei et al.,
2009) achieves good correspondence between cortical folding patterns and between the
subcortical structures of the brain. The method uses the geometric information from the warp
and incorporates volume registration using Navier elasticity. The resulting non-linear
displacement fields are used to register both cortical and subcortical structures. We
performed the complex registration on a high performance computer cluster facility which
has 127 batch nodes, two quad-core Xeon 5472 3.0 GHz CPUs and 32 GB RAM. All nodes
were running the 64-bit version CentOS 6. The pair-wise registration between the training
and test surfaces yielded 630 (18x35) registered outputs and their associated deformation
morphs.
To obtain the final segmentation of each of the 35 test subjects, we combined the multiple
registered atlases resulting from the CVS registration (volume resampled output) of the
training atlases. Two different label propagation techniques were used: multi atlas majority
voting (MAMV) (Heckemann et al., 2006) and multi atlas generative model based label
propagation (MAGM; Iglesias et al., 2012). Figure 3.2 shows a flow chart of our processing
Page 79
63
pipeline for multi atlas based segmentation.
Figure 3.2 Flow chart showing the processing pipeline for multi atlas based segmentation. Every image in the
training set is registered to the individual test subject’s image, whereafter the resulting deformation is applied to
each training atlas. Two different label fusion strategies are used to propagate labels from the registered training
atlases to the image of the test subject.
Majority voting assigns a label to each voxel of the test image by determining the label that
occurs most frequently in the corresponding voxel on all the registered training atlases. All
training images are weighted equally and it is assumed that each training atlas represents an
accurate segmentation. The effects of independent noise associated with a particular label are
reduced using this approach.
The generative model approach uses probabilistic modelling of segmentations from a set of
segmented images to generate a second set of final segmentations. The model is independent
of the intensity of the training images. The intensity of the test image and the respective
deformed outputs are used to model the final segmentation of the test image. The
mathematical formulation of the model was derived from the implementations by Sabuncu et
al. (2010) and Iglesias et al. (2012). The model includes a single model parameter β, where β
Page 80
64
= 0 treats each voxel independently, β = corresponds to a single label map, and β = finite
value yields the combined output. Typically, in our experiments we used β=0 to obtain the
fused output from MAMV and β=0.3 for MAGM.
Validation
Spatial overlap
We validated the segmentation in three randomly selected test images using the Dice
coefficient as a measure of spatial overlap between automatic segmentations using the three
different label propagation approaches and manually traced regions. The Dice coefficient
(Dice et al., 1945) is given by
L=1, 2, ... 16,
where M represents the manual segmentation, T represents the automated segmentation of the
test image, and L represents the number of labels, i.e. the number of distinct segmented
regions. The three test images were manually traced by the same expert neuroanatomist (CW)
who performed the manual tracings of the training images. Further, lobular volumes were
computed and compared in the three test subjects for segmentations generated using the
different label propagation methods and manual tracings. Analysis of variance (ANOVA)
was used to examine volumetric differences between the different methods.
Modified Hausdorff Distance
The modified Hausdorff distance computes similarity of shapes (Dubuisson and Jain, 1994)
and was used to compare for the same three test subjects automated segmentations achieved
using the three different label propagation approaches with manual segmentations.
denotes the modified Hausdorff distance between the manual and automated segmentations,
Page 81
65
is the distance of the manually traced surface M from the automated segmentation
surface T, and is the distance of the surface T from the surface M. The modified
Hausdorff distance is given by:
, where
and
is the number of elements in the set. Typically, the distance is calculated from the
boundary voxels of M to its nearest boundary voxel in T and vice versa for individual label
volumes. If the boundaries of segmentations match, the distance will be zero and will
increase as the differences in the boundary increase.
Validation using STAPLE
The structural segmentations of the 35 test images resulting from the three different label
propagation methods were further compared using the Simultaneous Truth and Performance
Level Estimation (STAPLE) algorithm (Warfield et al., 2004). The STAPLE algorithm
effectively estimates the probabilistic true segmentation and also measures the performance
of the algorithm/rater, given the input segmentations from the different rater or segmentation
algorithms of an image. It uses expectation maximization for estimating the true
segmentation and determines the performance parameters of the results from a collection of
segmentations and a prior model. The Dice coefficient was recorded using STAPLE.
Page 82
66
3.3 Results
Table 3.1 presents average lobular volumes for three test subjects using each of the label
propagation methods compared to manual tracing. Other than lobules left I-V and left VIIb,
volumes using the four different methods are similar. In left I-V, direct warping yields
inflated volumes, while volumes of VIIb were smaller for all the automated segmentation
methods compared to manual tracing.
Spatial overlap and modified Hausdorff distances
Figure 3.3 shows box-and-whisker plots comparing the Dice coefficients and modified
Hausdorff distance metrics for automated segmentations using the three different label
propagation approaches, each compared to manual tracings, in three test images for right and
left cerebellar lobules. Except for lobule VIIb, Dice coefficients are at least as good or better
for the two multi atlas approaches compared to direct warping. Except for lobule VIIb,
Hausdorff distances are lowest for MAGM.
Figure 3.3 Box and whisker plots of Dice coefficients (top row) and Hausdorff distances (bottom row) in
three randomly selected test subjects for 8 structures per cerebellar hemisphere for automated
segmentations using three different label propagation strategies, each compared to manual tracings. (1):
Direct warping (magenta); (2): multi atlas majority voting (MAMV; green); (3): multi atlas generative
model (MAGM; blue).
Page 83
67
Table 3.1 Comparison of average lobular volumes for three randomly selected test subjects obtained using
manual tracing and the three different label propagation methods.
Label ID
Structure names
Segmentation Method
F
p
Manual
Tracing
Direct
warping
MAMV
Lobular
MAGM
Lobular
Lobular
volumes Lobular volumes
volumes volumes
(mm3) (mm3) (mm3) (mm3)
Left Hemisphere
1 I-Va 4506 (577) 5892 (939) 4410 (188) 4784 (151) 4.4*
0.04
2 VI 7078 (428) 5785 (1354) 5716 (596) 6411 (537) 1.8 0.2
3 Crus I 11520 (2732) 13890 (1981) 11353 (1816) 11709 (1886) 0.9 0.4
4 Crus II 8148 (2464) 9889 (535) 11185 (790) 10596 (1248) 2.4 0.1
5 VIIbb 4322 (404) 3239 (217) 2628 (76) 2908 (261) 23.2**
0.0002
6 VIII 7357 (830) 7949 (998) 7077 (124) 6601 (622) 1.8 0.2
7 IX 2892 (809) 4283 (546) 3778 (463) 3883 (625) 2.6 0.1
8 X 482 (121) 498 (102) 367 (86) 435 (78) 1.1 0.4
Right Hemisphere
9 I-V 6227 (1011) 6599 (978) 5288 (637) 5695 (458) 1.5 0.2
10 VI 7744 (300) 6512 (1704) 5546 (1299) 6286 (1092) 1.7 0.2
11 Crus I 11804 (3133) 14408 (971) 11673 (419) 12217 (512) 1.7 0.2
12 Crus II 8452 (2278) 10071 (323) 11148 (610) 10846 (804) 2.7 0.1
13 VIIb 3478 (521) 3922 (217) 2762 (887) 2627 (699) 2.8 0.1
14 VIII 7096 (261) 7350 (776) 6076 (687) 6008 (541) 3.9† 0.05
15 IX 4236 (787) 5962 (572) 5422 (836) 5604 (770) 2.8 0.1
16 X 446 (100) 480 (90) 436 (83) 579 (122) 1.2 0.3
Values are Means (standard deviations) †p<0.1; *p<0.05; **p<0.001; ***p<0.0001
aDirect warping > manual (p=0.01), Direct warping > MAMV (p=0.01), Direct warping > MAGM (p=0.04)
bManual > Direct warping (p=0.001), Manual > MAMV (p<0.001), Manual > MAGM (p<0.001)
Visual Assessment of lobule I-V boundaries for different segmentation approaches
In Figure 3.4 is shown superimposed on an intensity normalized test image the contours from
the three different label propagation methods and manual tracing (shown in blue) for left
lobule I-V. The contours are shown on a coronal (top) and mid-sagittal (bottom) slice.
Visually, differences between manual tracing (blue) and the multi atlas label propagation (red
and white) contours are smaller. Direct warping (yellow) appears to overestimate the area by
erroneously including voxels around the boundary of the cerebellum. MAGM produces the
best results and is the only one of the automated methods that successfully excludes some of
the finer white matter branches evident on the sagittal slice.
Page 84
68
Figure 3.4 Boundaries for segmented left lobule I-V superimposed on an intensity normalised structural T1
image on a single coronal (top) and sagittal (bottom) slice. The colour overlays indicate the boundaries obtained
using the different segmentation methods: manual tracing (blue), direct warping (yellow), multi atlas majority
voting (MAMV; red), and multi atlas generative model label fusion (MAGM; white).
In Figure 3.5 we compare the area of left lobule I-V as per the different segmentation
methods on all the sagittal (top) and coronal (bottom) slices on which it appears in a single
test subject. We observe that in most of the slices, except near the edges of the structure, the
difference in area between manual tracing and direct warping tends to be larger than for the
two multi atlas label propagation methods.
Page 85
69
Figure 3.6 shows for two different coronal slices (a and b) of one test subject the maximum
likelihood label maps and their associated boundaries as generated using direct warping (left),
MAMV (middle), and MAGM label fusion (right). While all three methods achieved good
spatial overlap with the cerebellum as a whole, it is evident that the transverse sinuses
(indicated by the yellow arrows) are erroneously included as part of the cerebellum only in
the direct warping segmentation. By contrast, the two multi atlas methods that benefit from
additional information related to inter-subject variability correctly exclude the sinuses. The
red arrows indicate regions where segmentation using MAGM label fusion generates
contours that more closely follow the cerebellar gray matter boundary than the other two
methods.
Str
uct
ure
are
a
Str
uct
ure
are
a
Slice numbers
Slice numbers
Figure 3.5 Bar plot of the area of left lobule I-V for the different segmentation methods on
different sagittal (top) and coronal (bottom) slices: Manual segmentation (Blue); Direct warping
(Cyan); MAMV (yellow); MAGM (brown).
Page 86
70
a
b
Figure 3.6 Maximum likelihood label maps and their associated lobular boundaries for two
different coronal slices (a and b) superimposed on normalised T1 images of one test subject.
Segmentations were generated using direct warping (left), multi atlas majority voting (MAMV;
middle), and multi atlas generative model label fusion (MAGM; right). The look up table and
colours representing each structure are listed in Figure 2.2. The visualization and the colour
overlay was generated using Freeview software (http://www.nmr.mgh.harvard.edu/martinos).
Yellow arrows indicate the transverse sinuses that are erroneously included in Crus I using direct
warping segmentation. The red arrows indicate areas where MAGM contours follow the
cerebellar gray matter boundaries more closely.
Direct Warping Multi atlas majority voting Multi atlas generative
model
Page 87
71
Figure 3.7 presents the Dice coefficient in terms of box and whisker plots between the ground
truth estimate from STAPLE and label propagated segmentations using the three different
methods for the 35 test subjects. The STAPLE method allows one to assess overall
performance of segmented outputs in the absence of manual delineations for all subjects.
MAGM consistently produces the highest Dice coefficients across all cerebellar lobules.
Figure 3.7 Box and whisker plots for right (top) and left (bottom) cerebellar lobules of Dice
coefficients comparing the STAPLE truth estimate for 35 test subjects to segmentations obtained
using 1. direct warping (magenta); 2. MAMV label propagation (green); and 3. MAGM label
propagation (blue).
Page 88
72
3.4 Discussion
In this work we present results for three different label propagation strategies, namely direct
warping, MAMV, and MAGM label fusion, to automatically segment 16 cerebellar lobules in
35 adult test subjects using our CAPCA18 atlas. For three subjects that had been manually
traced, Dice coefficients that assess spatial overlap for each cerebellar structure with the
manually traced ground truth were typically higher for the two multi atlas approaches, while
Hausdorff distances that assess deviations in shape from the ground truth were lowest for
MAGM. Further, it was shown for lobule I-V that the segmented areas on nearly all slices
from the two multi atlas approaches are more similar to those computed using manual
tracing, while direct warping consistently overestimates the area. Dice coefficients comparing
segmentation results in all 35 test subjects with the STAPLE truth estimate consistently
yielded higher values for the two multi atlas approaches, with the highest values for MAGM.
These results demonstrate the power of multi atlas label propagation strategies that are able to
account for the underlying anatomical variability between subjects. The accurate alignment of
cortical surfaces that is achieved through the pairwise combined volume and surface based
registration helps to capture all possible variations among the training subjects. One
advantage of multi atlas methods is that they are less sensitive to age related differences,
which might otherwise result in poor segmentation accuracy in situations where the ages of
the test subjects are very different to those of the training subjects used in creating the atlas.
This is evident in the high Dice coefficients (>0.9 in all lobules except lobule VIIb, >0.8 in
lobule VIIb) achieved in the present adult data set when comparing segmentations to the
STAPLE truth estimate, considering that the atlas was created from 18 pre-adolescent
children.
Page 89
73
These results also serve to demonstrate that multi atlas approaches (especially MAGM) work
well in situations where the training and test data were acquired using different sequences on
different scanners. The method does not depend on the similarity of intensities across the
atlases and the test volume, but on the consistency of intensities within regions in the test
volume. This quality makes the method well suited to parcellation of cerebellar data acquired
using different MR modalities.
In the three test subjects for whom gold standard manual tracings were available, the
segmentation accuracy was worse for the two multi atlas approaches than direct warping only
in lobule VIIb. Anatomical variability in this region and the intersection of white matter
fibers posterior to the neighbouring structure poses difficulties in determining the border
voxels of this structure and may contribute to inaccuracies in this area. Further, lobule VIIb is
a small region sandwiched between two larger lobules, Crus II and lobule VIII. In this region,
the surface to surface distance metrics for the two multi atlas approaches are high, as might
occur due to differing boundaries across the entire structure, suggesting that the entire region
may be displaced.
3.5 Conclusion
In this paper we have presented and compared three different label propagation strategies for
automatic cerebellar segmentation using the CAPCA18 atlas. Multi atlas based approaches
were shown to consistently perform better than direct warping, both in terms of higher Dice
coefficients and reduced Hausdorff distances.
Page 90
74
Chapter 4
Multi Atlas based labelling of cerebellar structures Priya Lakshmi Narayanan1,2, Ernesta M Meintjes1,2, Lilla Zöllei3
1Department of Human Biology, Faculty of Health Sciences, University of Cape Town, South Africa
2MRC/UCT Medical Imaging Research Unit, University of Cape Town, South Africa
3Athinoula A. Martinos Center for Biomedical Imaging, MGH, Boston, United States
Abstract
Multi atlas based segmentation has recently become popular in medical image segmentation.
Atlas based segmentation framework allow one to incorporate prior segmentation knowledge
by exploiting spatial information gathered via registration of images from multiple previously
analyzed subjects. However, limited knowledge is available about spatial locations that
exhibit large inter-subject variability. In this study, we present an optimized pipeline to obtain
automated cerebellar segmentations of 35 test subjects using manual delineations of 28
cerebellar structures in 20 training subjects and two different multi atlas label fusion methods.
We assess the accuracy of our segmentation for the 20 hemispheric cerebellar regions in the
test data using simultaneous truth and performance level estimates and Dice coefficients of
spatial overlap. We also evaluate segmentation accuracy using leave-one-out cross-validation
in our training data for which gold standard manual tracings are available. The training and
test data were collected in two different laboratories on two different scanner platforms.
Mean Dice coefficients in the test subjects were greater than 0.89 in all regions except lobules
VIIb, VIIIa, VIIIb, and X.
Page 91
75
4.1 Introduction
Magnetic Resonance images (MRI) require a reliable pipeline to generate segmentations of
various brain structures for quantitative analysis. Typically, a series of steps are performed
before one can analyse the structure of interest (Pierson et al., 2002; Gouttard et al., 2007;
Powell et al., 2008; Diedrichsen et al., 2009; Bogovic et al., 2013). These include brain
extraction, also known as skull stripping, which is the process of removing non-brain tissue
(Shattuck et al., 2001; Smith et al., 2002; Segonne et al., 2004; Sadananthan et al., 2010) and
dura from the images, followed by intensity normalisation (Sled et al., 1998), bias correction,
spatial normalisation and tissue classification (Ashburner and Friston 2005).
Atlas-based techniques have been used for the segmentation of various structures on images
acquired from a range of non-invasive imaging modalities (Gouttard et al., 2007; Shattuck et
al., 2008). These approaches are supervised methods where spatial priors are used to guide
the segmentation. Conventionally, a single atlas image that comprises different labelled
structures is used to generate the segmentation on an unknown (test) image. However, this
method allows no control over errors that arise from poor registration when the test image is
very different to the atlas image (Aljabar et al., 2009), which may result in incorrect labels
being assigned to voxels.
Multi atlas based approaches rely on independent pairwise registrations between every atlas
and the individual test image. Deformed segmentation labels are generated by warping every
atlas image to the test image. The warped label maps arising from every deformed
Page 92
76
segmentation act as individual classifiers and the final segmentation of the test subject is
obtained after label fusion. One widely used fusion technique is majority voting label fusion.
Multi atlas based label fusion was first applied to segmentation of brain structures
(Heckemann et al., 2006). A weighted voting approach has been demonstrated for
segmentation of cardiac structures (Isgum et al., 2009), while a more sophisticated variational
expectation maximisation approach that constructs a generative model (Iglesias et al., 2013)
has been used to fuse segmentations from multiple atlases in individual structures. These
established approaches have not been evaluated for segmentation of cerebellar structures. To
date, there are no cerebellar parcellations available in Freesurfer
(http://surfer.nmr.mgh.harvard.edu) which is a popular tool for automatic whole brain
segmentation based on probabilistic information. We propose to design a framework using
manual labels to introduce cerebellar parcellations in the Freesurfer software.
The cerebellum is located at the rear of the brain, underlying the occipital and temporal lobes
of the cerebral cortex (Figure 4.1). Although the cerebellum accounts for approximately 10%
of the brain’s volume, it contains over 50% of the total number of neurons in the brain. The
cerebellum consists of four major lobes, namely the anterior lobe (lobules I-IV and V), the
superior posterior lobe (lobules VI and Crus I), the inferior posterior lobe (Crus II and lobules
VIIb, VIIIa, VIIIb and IX), and the flocculonodular lobe (lobule X). These regions contribute
to various functional domains. The lobular subdivision helps to better understand the
structure and function of the cerebellum. Although the majority of the cerebellar outputs are
to the motor system of the brain, it is also involved in other higher order brain functions like
cognitive, sensory, affective and effective processing (Stoodley and Schmahmann, 2009;
Schlerf et al., 2010).
Page 93
77
Parcellation of the cerebellum into different sub divisions has proved to be useful to study
quantitative morphological characteristics of cerebellar structures (volumetry) and to achieve
improved anatomical localization and inter-subject coregistration in functional imaging
studies (Makris et al., 2005; Diedrichsen et al., 2009). Automated segmentation of the
cerebellum and its structures remains difficult due to its highly convoluted lobules, small
volumes of some structures (Buckner et al., 2011), and comparatively different intensity
distribution of cerebellar gray and white matter compared to the cerebrum (Datta et al., 2009;
Bogovic et al., 2013).
The Schmahmann cerebellar atlas was the first to depict the gross morphology of the
cerebellum with both fissures and individual cerebellar lobules. Later a probabilistic
representation of the cerebellum comprising 28 parcellations from both hemispheres was
constructed from 20 healthy subjects by affine registration to the ICBM152 template,
followed by normalisation to the colin27 template (Diedrichsen 2006). The average
deformation warp from the colin27 template to individual subjects resulted in the spatial
unbiased infratentorial cerebellar template (SUIT). However, the segmented output using the
SUIT atlas frequently suffers from inclusion of the transverse sinus and part of the bone
marrow (Diedrichsen et al., 2009).
The primary aim of this study was to develop a method to achieve more accurate automated
parcellation of cerebellar structures using a multi atlas based approach. More specifically, we
wanted to (1) improve the segmentation accuracy of individual cerebellar hemispheric
structures compared to a single atlas approach, (2) quantitatively evaluate our output
Page 94
78
segmentation accuracy in test subjects using simultaneous truth and performance level
estimates (STAPLE), and (3) perform leave one-out cross validation of our training subject
segmentation to compare manual and automated segmentations. To obtain feasible functional
localisation, the automatic segmentation algorithm should produce accuracy comparable with
manual segmentation performed by an expert neuroanatomist. The major contribution of this
work is the construction of a multi atlas segmentation pipeline for cerebellar structures and its
evaluation using two different datasets. To the best of our knowledge this study is one of only
a few studies to evaluate automated cerebellar segmentation using a multi atlas based
approach.
4.2 Methods
Training and Test Data Sets
High resolution structural T1-weighted images from two different centers were used in this
study. The training data set (N=20) was acquired on a 3T Philips Intera system using an
MPRAGE sequence with field of view 256x256x150 mm3 and 1x1x1mm3 resolution. The
age range of the subjects was 22 to 45 years. The cerebella of the training data were
previously manually delineated into 28 cerebellar structures for the construction of the SUIT
atlas (Diedrichsen et al., 2006; Diedrichsen et al., 2009). In this paper we refer to the 28
cerebellar segmentations as label maps. The 28 cerebellar structures and their corresponding
colors for visualization are illustrated in Figure 4.1 and Table 4.1, respectively.
Page 95
79
Figure 4.1 Three dimensional surface representations of cerebellar cortex in the posterior (left) and anterior
(right) views. The middle image shows a two dimensional coronal slice with the manual tracings for one
training subject.
Table 4.1 The 28 cerebellar structures and their color representations as used in the current study
Left I_IV
Left CrusI
Vermis VIIb
Right VIIIb
Right I_IV Vermis CrusI Right VIIb Left IX
Left V Right CrusI Left VIIIa Vermis IX
Right V Left CrusII Vermis VIIIa Right IX
Left VI Vermis CrusII Right VIIIa Left X
Vermis VI Right CrusII Left VIIIb Vermis X
Right VI Left VIIb Vermis VIIIb Right X
In this work, each training subject’s label map constitutes one atlas image in our multi atlas.
Of the 28 available structures, we used the 20 hemispheric structures, excluding the eight
vermal regions, to validate our multi atlas segmentation accuracy. The vermal regions were
excluded due to their small volumes.
Our test data set (to be segmented) comprised 35 high resolution T1 structural scans acquired
using a magnetization prepared rapid gradient echo (MPRAGE) sequence on a 1.5T Vision
system (Siemens, Erlangen, Germany) as part of ongoing studies at the Alzheimer’s Disease
Research Center in St. Louis and have appeared in prior publications (Buckner et al., 2004;
Fotenos et al., 2005). The field of view is 256x256x224mm3 with 1x1x1.25mm3 spatial
resolution. The age range of the subjects was 21.5 to 78.2 years.
Page 96
80
Image pre-processing
All training and test images were processed using the Freesurfer
(http://surfer.nmr.mgh.harvard.edu) software package. The processed surfaces of the test
subjects were already available. All except one of the image volumes from the training data
set were successfully processed using the Freesurfer recon pipeline and their surfaces
constructed. The image volume of the one subject for whom the recon pipeline failed was
excluded from further analyses. For six of the training subjects the Freesurfer brain extraction
pipeline included portions of dura and exterior regions of the skull that were subsequently
corrected by introducing the graph cut (GCUT) algorithm into the pipeline (Sadananthan et
al., 2010). Very few voxels remained that required manual correction after skull stripping.
Registration
After computing the gray and white matter surfaces of the training subjects, each training
subject was registered to every test subject using non-linear combined volume and surface
based registration (Postelnicu-Zöllei et al., 2009). This tool achieves better alignment of both
the cortical and subcortical folding patterns between the two datasets. This step was
performed using a multi-CPU cluster running Linux. The resulting deformation warps were
then used to segment the test images.
Multi Atlas labelling
We used a multi atlas based approach to obtain the most likely segmentation of each test
subject from the classifier set which comprised 19 deformed outputs. The intensity of the test
image and the respective deformed outputs were used to model the final segmentation of the
Page 97
81
test subject. Both multi atlas majority voting (MAMV) and multi atlas generative model
based (MAGM) label fusion were used to obtain 28 cerebellar labels for each test subject
(Iglesias et al., 2012). The parameterization of the model is based on iterative variational
expectation maximization (Iglesias et al., 2013) and finally uses β to generate the most likely
segmentation label. The parametrization value of β was adapted from a mathematical
formulation that appeared in prior literature (Sabancu et al., 2010; Iglesias et al., 2012). In our
work we used β=0 to obtain the fused output from MAMV and β=0.3 for MAGM. The model
captures all possible prior knowledge about the spatial location, shape and extent of the
individual atlas labels to model the posterior probability distribution of the output label on the
test subject.
Dice Coefficient
The Dice coefficient (Dice et al., 1945) is a widely used voxel-wise evaluation measure that
assesses the spatial overlap between two regions where 1 indicates perfect overlap and 0
indicates no overlap. In our study we only computed Dice coefficients for the 20 hemispheric
structures of the cerebellum (excluding the vermal regions) as previous studies have shown
lower reliability in finer parcellated structures (Makris et al., 2005). The Dice coefficient is
given by
Label=1, 2, ... 20
Page 98
82
STAPLE evaluation
For all the test subjects, we compared the multi atlas based segmentations for the 20
hemispheric cerebellar structures achieved using MAMV and MAGM label fusion,
respectively, with the probabilistic truth estimate derived from the Simultaneous Truth and
Performance Level Estimation (STAPLE) algorithm (Warfield et al., 2004). The STAPLE
algorithm effectively estimates the probabilistic true segmentation and also measures the
performance of the algorithm given a set of input segmentations of an image. It uses
expectation maximization to estimate the true segmentation and determines the performance
parameters of the output from a collection of segmentations. For each of the 20 hemispheric
cerebellar regions we computed the Dice coefficient comparing the automated segmentation
using MAMV and MAGM, respectively, with the STAPLE estimate in the 35 test subjects.
Leave-one-out cross validation (LOOCV)
To further validate our multi atlas approach, we used LOOCV on the training dataset for
which the ground truth segmentations were available. The LOOCV uses 18 atlases from the
training dataset to determine the segmentation of the remaining training image volume. This
was done iteratively for all 19 training subjects to yield automated final fused segmentations
of each training subject using multi atlas segmentation based on the other 18 training data
sets. Dice coefficients were computed to compare manual and automated segmentations for
each subject.
In order to assess the effect of varying the number of atlases used in the multi atlas
segmentation, we also evaluated the accuracy of our output segmentation in our cross
validation experiment when using a subset of only 14 atlases (instead of 18) from the training
data set.
Page 99
83
4.3 Results
STAPLE evaluation
In Table 4.2 we present for the 20 hemispheric cerebellar regions the mean Dice coefficients
of spatial overlap between the STAPLE estimates and the automated segmentations using
multi atlas majority voting and generative model based label fusion, respectively, in the 35
test subjects. For both MAMV and MAGM label fusion, the mean Dice coefficient was
greater than 0.89 bilaterally in the anterior lobe (I-IV and V), superior posterior lobe (VI and
Crus I) and parts of the inferior posterior lobe (Crus II and IX). The remaining lobules of the
inferior posterior lobe (VIIb, VIIIa and VIIIb) and the flocculonodular lobe (X) exhibited
lower Dice coefficients. These results are presented as box-and-whisker plots in Figures 4.2
and 4.4 for the 10 hemispheric left and right cerebellar structures, respectively. Dice
coefficients achieved using the two different label fusion methods were compared using the
Wilcoxon signed-rank test. Bilaterally in Crus I, CrusII, VIIIb and IX MAGM label fusion
yielded higher Dice coefficients than MAMV. In contrast, the MAMV approach achieved
better segmentation overlap with STAPLE bilaterally in I-IV and X, in left V and in right VI.
Table 4.2 Mean Dice coefficients in 35 test subjects of spatial overlap between the STAPLE estimate and
automated segmentations in 20 hemispheric cerebellar regions using multi atlas majority voting (MAMV) and
multi atlas generative model based (MAGM) label fusion, respectively.
Cerebellar
Structure
Mean Dice coefficient
MAMV MAGM
Left Right Left Right
I-IV 0.93 0.93 0.91 0.92
V 0.90 0.89 0.89 0.89
VI 0.92 0.92 0.92 0.91
Crus I 0.92 0.93 0.93 0.94
Crus II 0.89 0.91 0.93 0.95
VIIb 0.78 0.81 0.79 0.84
VIIIa 0.86 0.87 0.84 0.84
VIIIb 0.86 0.84 0.87 0.88
IX 0.89 0.89 0.91 0.92
X 0.77 0.64 0.73 0.54
Page 100
84
Figure 4.2 Box-and-whisker plots of the Dice coefficients in 35 test subjects between the STAPLE estimate and
segmentations achieved using multi atlas majority voting (MAMV; red) and generative model (MAGM; blue)
label fusion for left hemispheric cerebellar structures. Asterisks indicate significant differences between MAMV
and MAGM and the color of the asterisks indicate the method that yielded the higher Dice coefficient. *p<0.05;
**p<0.01; ***p<0.001
In order to give more insight into the distribution of different Dice coefficients across the test subjects
in each of the cerebellar regions, we present in Figures 4.3 and 4.5 clustered plots of the Dice
coefficients for the left and right hemispheric regions, respectively. Each color block gives the range
of Dice coefficients in a subset of the test subjects. Each subset comprises 20% (i.e. 7) of the test
subjects. This allows one to assess the number of test subjects in whom Dice coefficients were either
above or below a certain threshold in each of the regions. It is evident from these plots that although
mean Dice coefficients were low in lobules VIIIa and VIIIb, Dice coefficients were below 0.8 only in
about 20% or fewer of test subjects, compared to lobules VIIb and X where low Dice coefficients
were evident in 40% or more of test subjects.
Page 101
85
Figure 4.3 Clustered plot representation of the Dice coefficients of spatial overlap with the STAPLE estimate
for automated segmentations based on majority voting (1) and generative model based (2) label fusion for the
left hemispheric cerebellar structures.
Figure 4.4 Box-and-whisker plots of the Dice coefficients in 35 test subjects between the STAPLE estimate and
segmentations achieved using multi atlas majority voting (MAMV; red) and generative model (MAGM; blue)
label fusion for right hemispheric cerebellar structures. Asterisks indicate significant differences between
MAMV and MAGM and the color of the asterisks indicate the method that yielded the higher Dice coefficient.
*p<0.05; **p<0.01; ***p<0.001
Page 102
86
Figure 4.5 Clustered plot representation of the Dice coefficients of spatial overlap with the STAPLE estimate
for automated segmentations based on majority voting (1) and generative model based (2) label fusion for the
right hemispheric cerebellar structures.
Leave-one-out cross validation (LOOCV) - 18 fused segmentations
Table 4.3 presents the mean Dice coefficients for the 19 training subjects of the spatial
overlap between manual tracing and automated segmentation achieved with label fusion of
the other 18 training subjects using MAMV and MAGM, respectively, in the 20 hemispheric
cerebellar regions. Although the same regions as before (lobules I-IV, V, VI, Crus I, Crus II,
and IX) achieved higher spatial overlap bilaterally, Dice coefficients of spatial overlap with
the ground truth manual tracings were significantly lower than those obtained in the test
subjects using the STAPLE validation (Dice coefficients > 0.67 here compared to Dice
coefficients > 0.89 in the test subjects using STAPLE). In contrast to the results in our test
subjects, where MAGM typically performed better than MAMV, the Wilcoxon signed-rank
test revealed higher Dice coefficients in our training subjects using MAMV bilaterally in
lobules V, VIIIb and X, as well as left VIIb. Only bilaterally in Crus 1 did MAGM yield
higher Dice coefficients than MAMV. These results are illustrated in box-and whisker plots
for left and right hemispheric cerebellar regions in Figures 4.6 and 4.7, respectively.
Page 103
87
Table 4.3 Mean Dice coefficients in 20 hemispheric cerebellar regions of spatial overlap between manual
tracings and automated segmentations using MAMV and MAGM label fusion, respectively, in 19 training
subjects.
Cerebellar
Hemisphere
Structures
Average of Dice coefficient
MAMV MAGM
Left Right Left Right I-IV 0.77 0.78 0.76 0.78
V 0.70 0.69 0.68 0.67
VI 0.80 0.78 0.79 0.78
Crus I 0.77 0.78 0.79 0.81
Crus II 0.73 0.73 0.72 0.73
VIIb 0.48 0.48 0.37 0.45
VIIIa 0.56 0.57 0.58 0.52
VIIIb 0.59 0.61 0.44 0.45
IX 0.71 0.73 0.69 0.69
X 0.62 0.69 0.48 0.58
Figure 4.6 Box-and-whisker plots of the Dice coefficients in the 19 training subjects of spatial overlap between
manual tracings and automated segmentations using multi atlas majority voting (MAMV; red) and generative
model based (MAGM; blue) label fusion, respectively, for left hemispheric cerebellar structures. Asterisks
indicate significant differences (Wilcoxon signed-rank test) between MAMV and MAGM and the color of the
asterisks indicates the method that yielded the higher Dice coefficient. *p<0.05; **p<0.01; ***p<0.001.
Page 104
88
Figure 4.7 Box-and-whisker plots of the Dice coefficients in the 19 training subjects of spatial overlap between
manual tracings and automated segmentations using multi atlas majority voting (MAMV; red) and generative
model based (MAGM; blue) label fusion, respectively, for right hemispheric cerebellar structures. Asterisks
indicate significant differences (Wilcoxon signed-rank test) between MAMV and MAGM and the color of the
asterisks indicates the method that yielded the higher Dice coefficient. *p<0.05; **p<0.01; ***p<0.001.
Figures 4.8 and 4.9 show the distribution of the Dice coefficients for left and right
hemispheric cerebellar regions, respectively, in subsets of the training subjects where each
subset comprises 20% of the subjects.
Figure 4.8 Clustered plot representation of the distribution of the Dice coefficients of spatial overlap with
manual tracings for automated segmentations based on majority voting (1) and generative model based (2) label
fusion, respectively, for the left hemispheric cerebellar structures.
Page 105
89
Figure 4.9 Clustered plot representation of the distribution of the Dice coefficients of spatial overlap with
manual tracings for automated segmentations based on majority voting (1) and generative model based (2) label
fusion, respectively, for the right hemispheric cerebellar structures.
Leave-one-out cross validation (LOOCV) - 14 fused segmentations
To investigate the impact of altering the number of fused segmentations used to generate the
output segmentation, we compared in the 19 training subjects the Dice coefficient of spatial
overlap with manual tracings obtained in each hemispheric cerebellar region for automated
segmentation based on 18 atlases with that obtained using 14 atlases. The 14 atlases were
selected from the training dataset based on how clearly border pixels between cerebellar
lobules could be identified visually. Figure 4.10 presents a comparison of the Dice
coefficients in the 20 hemispheric cerebellar regions based on 14 (red) and 18 (blue) fused
segmentations for MAMV (top row) and MAGM (bottom row), respectively.
Using 14 or 18 fused segmentations in the 19 training subjects yielded similar values for the
Dice coefficient in most regions using both label fusion methods. Only in VIIb and VIIIb
were Dice coefficients somewhat higher using 14 atlases than with 18 atlases for MAGM
label fusion – this difference was only significant in right VIIIb. Also, the pattern of the data
Page 106
90
is consistent with that seen previously with lower Dice coefficients in posterior lobules VIIb,
VIIIa, VIIIb and X.
Figure 4.10 Comparison of Dice coefficients of spatial overlap in 19 training subjects of automated
segmentations generated using either 14 (red) or 18 (blue) fused label maps with manual tracing in left (left) and
right (right) hemispheric cerebellar regions. The top row shows results for MAMV and the bottom row for
MAGM. Dagger and asterisks indicate significant differences (Wilcoxon signed-rank test) between using 14 and
18 atlases and the color indicates the method that yielded the higher Dice coefficient. †p<0.1; *p<0.05.
4.4 Discussion
In this work, we compared automatic segmentation using MAMV and MAGM label fusion
and assessed segmentation accuracy using two different approaches in both our training and
test data sets, which were acquired at two different sites on different scanner platforms.
Although both MAMV and MAGM in both datasets yielded good segmentation accuracy in
all regions except lobules VIIb, VIIIa, VIIIb and X, Dice coefficients of spatial overlap with
Page 107
91
manual tracings in the training data were typically lower than those achieved in the test data
with STAPLE. Except for bilateral lobules I-IV and X, left V and right VI, MAGM achieved
similar or better spatial overlap with the STAPLE estimate in the test subjects compared to
MAMV. In contrast, MAGM performed better than MAMV only bilaterally in Crus 1 in the
training data set. The fact that the volume of lobule X is smaller than the other cerebellar
structures, penalizes the Dice coefficient and may account for the low spatial overlap
achieved in this region.
The cerebellum is a complex structure with fine parcellations. To date, only a few studies
have used SUIT or manual delineation to perform cerebellar segmentation (Bogovic et al.,
2013; Makris et al., 2005; Pierson et al., 2002). A previous study using manual delineation
emphasized the trade-off between achieving fine parcellations and reliability and finally used
only 24 parcellation labels excluding the vermal structures of lobule VI, Crus I, Crus II and
VIIb. In the present work, we similarly only evaluated our segmentation accuracy in the 20
hemispheric regions, excluding the smaller vermal regions in which reduced accuracy is
expected.
It has previously been reported (Diedrichsen et al., 2009) that the subjects used in the SUIT
atlas construction exhibited anatomical variability in Crus II, VIIb and IX. Notably, VIIb is
one of the structures that consistently yielded low Dice coefficients in both the test and the
training data sets in our study. Using both MAMV and MAGM, the structures located
posteriorly in the cerebellum (VIIb, VIIIa, VIIIb, IX and X) generally achieved lower
segmentation overlap compared to more anterior regions. Amongst these posterior regions,
VIIb, VIIIa and VIIIb achieved the lowest Dice coefficients. Increased variability in posterior
Page 108
92
lobules VIIb and VIIIb amongst different raters has also been reported by Bogovic et al.
(2013).
Poor contrast often makes it difficult to locate borders during manual delineation of
cerebellar structures, so that tracings are based on relative spatial position and contours on
adjacent slices rather than boundaries per se. We suspect that cerebellar structures VIIb, VIIIa
and VIIIb in the training data may have suffered from these problems in the delineation phase
resulting in poor segmentation accuracy in these regions. This may explain why MAMV
generally performed better in the training data than MAGM, as MAMV exploits knowledge
of relative position rather than voxel intensity distributions. Other studies (Artaechevarria et
al., 2009) using multi atlas parcellation have also reported better performances for different
methods (for example, majority weighting and local weighting) in different data sets. We also
observed intensity variations among the training data, which may have contributed to the
boundary estimation problem in the posterior cerebellar lobules.
Using fewer atlases appears to have increased the Dice coefficient in the posterior lobules
VIIb and VIIIb using MAGM. It may be that excluding from the training data set atlases in
which border pixels between different anatomical regions were not clearly visible due to poor
contrast, reduced the variability in these regions resulting in better segmentations and
increased Dice coefficients.
To date, very little work has been done on automatic cerebellar parcellation. Using available
delineated images we developed an optimised pipeline to achieve reliable cerebellar
segmentation. Although both the training and test data exhibited better and worse
Page 109
93
performance in the same cerebellar regions, Dice coefficients were higher in all regions in the
test data than the training data. This may be due to greater similarities between multi atlas
based segmentation and the STAPLE estimates, compared to ground truth manual tracings
that may vary significantly between subjects. Further, segmentation accuracy was reduced in
the posterior cerebellar lobules, presumably due to greater inter-subject variability in these
regions and poor contrast resulting in uncertainty in identifying boundaries during manual
delineation.
4.5 Conclusion
In this paper we present a reliable method to achieve automated cerebellar segmentation
using multiple atlases. The approach was implemented and evaluated using STAPLE in our
test dataset and compared to manual tracings using leave-one-out cross validation in our
training data. Although performance of MAMV and MAGM label fusion were generally
similar, MAGM performed better in most regions in the test data and MAMV mostly
performed better in the training data. Automated segmentation accuracy was generally poor
in lobules VIIb, VIIIa and VIIIb and further work is needed to improve segmentation
accuracy in these areas.
Page 110
94
Chapter 5
Discussion
This thesis investigates different techniques and approaches to the development of a robust
tool for segmentation of cerebellar structures on magnetic resonance (MR) images and
different validation strategies, with the aim to develop a robust pipeline for use in large
population imaging studies. The idea of constructing a pediatric cerebellar atlas and
combining it with different label propagation methods to achieve cerebellar segmentation was
one of the first of its kind and has rarely been addressed in the literature. In the previous
chapters we presented the results obtained using these different methods for the segmentation
of cerebellar structures in single or sequential images. The methods used were evaluated on
various datasets collected from different imaging centres well-known for their work in MRI.
Anatomical delineation of cerebellar structures
Although manual delineation is extremely labour intensive, it is still considered the gold
standard for volumetric assessment. Observer bias may, however, affect the results whenever
a manual method is used. Prior studies of the cerebellum have emphasized the challenges
associated with manual delineation of CrusII, lobules VIIb and VIII (Diedrichsen et al., 2009;
Bogovic et al., 2013) and that raters should consider different image features like size, depth
of fissures, location of the fissure, starting and ending points of the fissure, and lobule
boundaries when deciding where to draw boundaries. Our expert rater completed manual
tracing of individual lobules of a complete cerebellum in roughly 30-60 minutes. Intra-class
correlation coefficients (ICCs) of individual lobules traced at two different times by the same
tracer were computed to assess the variability of manual tracings.
Page 111
95
Probabilistic maps of cerebellar structures
Probability maps show the extent, shape and arrangement of regional cerebellar structures.
The map also gives an indication of the certainty with which a given voxel can be assigned to
a specific structure, based on the frequency with which that voxel was assigned to said
structure in a set of images. The spatial distribution of our probability map reveals that
individual structures superimpose accurately in medial regions, but that uncertainty increases
as one moves laterally in the structures. CAPCA18 yielded 16 maximum likelihood labels
derived from the maximum probability atlas.
Quantitative evaluation of the CAPCA18 atlas
Spatial overlap between automatically segmented cerebellar structures of a pediatric data set
using the CAPCA18 atlas and manual tracings of the same data set yielded values above 70%
bilaterally in lobules I-V, VI, crusI, crusII, VIII and IX, which compares favourably with
previous results (Bogovic et al., 2013). Spatial overlap of regions derived from CAPCA18
segmentation and manual tracing were consistently higher than spatial overlap of SUIT
segmentation and manual tracing, with significant improvement in lobules I-V, VI, CrusI,
VIII and IX cerebellar structures. It has been noted previously that direct comparison of
quantitative segmentation results across publications are difficult and not always fair due to
inconsistencies in the manual segmentation protocol, the quality of the imaging data, and
differences in the patient populations (Collins et al., 2010 ; Wang et al., 2012). Despite these
limitations, the present work demonstrates that cerebellar segmentation using the CAPCA18
atlas consistently achieved greater segmentation accuracy in the present pediatric data set
than segmentation using the SUIT atlas.
Page 112
96
Since there is no previous literature on cerebellar segmentation in children, our results help to
establish baseline values for future studies. Furthermore, it helps to highlight the significant
complexities associated with automatic segmentation of certain regions of the cerebellum. In
prior studies of brain structure segmentation, Shattuck et al., (2008) suggest that variability in
manual tracing data can also be used as a guide in determining the spatial overlap that would
be considered acceptable from an automated segmentation. To this end, we have reported in
all structures both Dice coefficients and ICCs obtained from inter- and intra-rater reliability
tests. As expected, Dice coefficients and inter-rater ICCs were low and high in the same
regions.
When comparing the average percentage of gray matter volume occupied by each lobule with
previously reported values in adults (Makris et al., 2005), we found that lobule IX occupied a
relatively greater volume in children than adults, while lobules VI, VIIb and X were
relatively smaller in children. Fonov et al. (2011) compared deformations when normalising
to an adult template compared to a pediatric template and reported greater deformation when
using an adult template for pediatric data as the shape and ratio of gray matter and white
matter near the posterior lobe of the cerebellum differ between children and adults. We also
observed in our data that segmentation using CAPCA18 yielded significantly better spatial
overlap in lobule IX compared to SUIT, and that the volume of lobule IX obtained from
SUIT segmentation (SUIT was developed using adult data) was significantly smaller than
that obtained from manual tracing. It is possible in the future to address more directly
questions relating to relative differences across cerebellar regions in different populations
using Jacobian maps of deformation.
Page 113
97
Comparing different label propagation methods to achieve cerebellar segmentation of
an adult dataset
The quality of the manual labels forces an upper bound on the quantitative metrics — an
automatic procedure can't agree with a manual rater or the segmentation from the same rater
at two instants cannot agree leaving subtle discrepancies and limiting the accuracy achievable
by any automated method (Shattuck et., 2008; Collins et al., 2010 ; Wang et al., 2012).
Keeping this in mind, we compared segmentation accuracy achieved using our CAPCA18
atlas with three different label propagation strategies to manual segmentation in 8 structures
per hemisphere in 3 adult subjects in terms of spatial overlap and modified Hausdorff
distances (Figure 3.3). The distance metric indicated that multi atlas based generative model
(MAGM) label fusion consistently performed better than the other two methods in all regions
except lobule VIIb. Previous studies (Ghosh et al., 2010) in younger children have
demonstrated that surface based registration introduce significantly less bias and that cortical
alignment is better in surface based methods compared to volume based registration. Overall,
combining deformable registration using cortical surfaces and multi atlas based label fusion
improved accuracy compared to direct warping in our study.
In chapter 4, we used the cerebellar parcellations that were available for 20 adult subjects that
had been used in the construction of the SUIT atlas (Diedrichsen et al., 2009) combined with
two different multi atlas based segmentation methods (MAMV and MAGM) to automatically
segment the cerebella of 35 test subjects, in order to evaluate the accuracy achievable when
using adult training data to achieve segmentation of adult test subjects (compared to the
pediatric training data used in the previous chapter). We compared spatial overlap between
automated segmentations in the test data and their STAPLE estimates, and performed leave
one out cross validation to segment each training subject using the remaining training atlases
for comparison with available manual tracings. Lobules I-IV, V, VI, crus I, crus II and IX
Page 114
98
achieved spatial overlaps greater than 0.7. Differences in signal intensity in the training
images negatively impacted accuracy in the posterior regions of the cerebellum for both
MAMV and MAGM resulting in low spatial overlap in these regions.
Furthermore, we examined the impact on segmentation accuracy of varying the number of
training atlases (14 versus 18) used to generate the final fused image. In contrast to previous
studies (Heckemann et al., 2006; Lötjönen et al., 2009), we found that Dice coefficients of
fused outputs from 14 and 18 atlases were similar in most structures using both MAMV and
MAGM. Unexpectedly, Dice coefficients were somewhat higher using 14 atlases than 18
atlases in VIIb and VIIIb for MAGM label fusion – a difference that was only significant in
right VIIIb. This bias might be due to the intensity difference mentioned previously or inter-
subject variability in this region and requires further investigation.
Comparison of CAPCA18 and SUIT Atlases
The SUIT atlas (Diedrichsen et al., 2009) developers mention the presence of high inter-
subject variability in the posterior lobes of the cerebellum, which one would expect to
translate into lower segmentation accuracy in these regions. This may explain why in chapter
4, which uses the manual tracings that were used in the construction of the SUIT atlas to
segment 35 adult test subjects, spatial overlap in lobules VIIb, VIIIa, VIIIb and X are
consistently lower than in other regions. In comparison, spatial overlap was low compared to
other regions only in lobule VIIb when using the CAPCA18 atlas to segment the same 35
adult test subjects.
Page 115
99
Computational complexity and performance time
Regardless of which multi atlas fusion method was used, the time to perform the combined
volume and surface based registration between the atlases and the test image, was
approximately 24 hours without parallelization. This time can be reduced by using
parallelization. The time to generate the fused images was negligible compared to that
required for the multi atlas registrations. It is worth emphasizing, however, that the additional
computational investment significantly improved the resultant segmentation accuracy
compared to direct warping.
Limitations
Labelling accuracy depends on the quality of the images, the pre-processing steps the images
were subjected to, the registration algorithms used, the label propagation pipeline (atlas/multi
atlas), and the methods used to evaluate performance. With regards the first three, we
assumed that each data set comprised a group of normal individuals whose brain images were
acquired, pre-processed, and labelled in a consistent manner.
We are not aware of any comparisons in literature between the registration of interpolated
versus non-interpolated (bias-field corrected and uncorrected, intensity normalized and non-
normalized, etc.) images. Images from the subjects used in the construction of the CAPCA18
atlas were linearly interpolated using BrainVoyager before pre-processing in SPM. All of the
images in this study were linearly interpolated twice, once to linearly register each brain to a
template, and a second time to linearly register each source brain to a target brain in the
template space, prior to nonlinear registration.
Page 116
100
Regarding the registration methods themselves, each one has a similarity measure,
transformation model, regularization method, and optimization strategy. A superior
transformation model coupled with an unsuitable similarity measure, for example, would
most likely lead to suboptimal results. We ensured that the output of individual registrations
was precise to carry out the label propagation. In the context of combined volume and surface
based registration, we followed the optimal parameter settings as per the advice from the
author of the tool.
Finally for the reslicing of the subjects label volumes, we used nearest neighbour
interpolation to preserve the label values and ensure more consistent behaviour at the edges
of individual structure.
Future work
We used images from healthy Cape Coloured children who were typically developing
controls in a different study to construct the CAPCA18 atlas. The accuracy of automated
segmentation using CAPCA18 was evaluated in a different group of healthy children from
the same ethnic group. It would be interesting to assess the performance of the CAPCA18
atlas both in children from different ethnic groups and in children in whom there may be
some underlying pathology, such as children prenatally exposed to alcohol. Longitudinal
studies of this nature would allow one to detect pathology-related changes over time rather
than differences that may exist between the individual’s brain and the template. CAPCA18
cerebellar parcellations can also be useful in accurately labelling cerebellar regions in
functional MRI studies.
The demand for tools for robust structural analysis of MR images continues to grow. Given
the interest and prevalence of data from different populations from different laboratories,
Page 117
101
large-scale multi-site experiments are becoming more routine and are producing more data
than before. Multi-centre studies and meta-analyses of cerebellar structures using our
CAPCA18 atlas has the potential to improve our understanding of the structure and function
of the cerebellum and how it may be altered/affected in different conditions.
Page 118
102
Chapter 6
Conclusions
This thesis presents the first tool for automated segmentation of the cerebellum on 3D MR images
of children. The CAPCA18 atlas has been shown to provide precise and consistent output
segmentations. In this work, we used improved registration algorithms and compared different
multi atlas label fusion methods to obtain the final segmentations. The data generated reveals
differences between adult and child cerebella.
The evaluation of the proposed atlas demonstrates that it can be used with success in both
pediatric and adult data sets. Segmentation accuracies are shown to be comparable or better than
values previously reported using SUIT.
Factors that may impact the cerebellar segmentation accuracy have been described and
limitations highlighted. To date, the cerebellum is rarely studied. Construction of a user-
friendly tool using the CAPCA18 atlas combined with multi atlas label fusion techniques will
help facilitate research on cerebellar structural abnormalities that accompany various
conditions and can greatly advance our understanding of the role of this region, which is still
not very well understood.
Page 119
103
References
Armstrong, E., Schleicher, A., Omran, H., Curtis, M., and Zilles, K. (1995). The ontogeny of human
gyrification. Cerebral Cortex, 5(1), 56-63.
Artaechevarria, X., Munoz-Barrutia, A., and Ortiz-de-Solorzano, C. (2009). Combination strategies in
multi-atlas image segmentation: Application to brain MR data. Medical Imaging, IEEE
Transactions 28, 1266-1277.
Ashburner, J., and Friston, K. J. (1999). Nonlinear spatial normalization using basis functions. Human
brain mapping, 7(4), 254-266.
Ashburner, J., and Friston, K. J. (2005). Unified segmentation. Neuroimage, 26(3), 839-851.
Asman, A. J., and Landman, B. A. (2013). Non-local statistical label fusion for multi-atlas
segmentation. Medical image analysis, 17(2), 194-208.
Bernal-Rusiel, J. L., Greve, D. N., Reuter, M., Fischl, B., and Sabuncu, M. R. (2012). Statistical
analysis of longitudinal neuroimage data with linear mixed effects models. Neuroimage.
Besl, P. J., and McKay, N. D. (1992). Method for registration of 3-D shapes. Paper presented at the
Robotics-DL tentative.
Bogovic, J. A., Bazin, P.-L., Ying, S. H., and Prince, J. L. (2013). Automated segmentation of the
cerebellar lobules using boundary specific classification and evolution. Paper presented at the
Information Processing in Medical Imaging.
Buckner, R. L., Head, D., Parker, J., Fotenos, A. F., Marcus, D., Morris, J. C., et al. (2004). A unified
approach for morphometric and functional data analysis in young, old, and demented adults
using automated atlas-based head size normalization: reliability and validation against manual
measurement of total intracranial volume. Neuroimage, 23, 724-738.
Buckner, R. L., Krienen, F. M., Castellanos, A., Diaz, J. C., and Yeo, B. T. (2011). The organization
of the human cerebellum estimated by intrinsic functional connectivity. Journal of
neurophysiology, 106(5), 2322-2345.
Carpenter, M. B. (1976). Human Neuroanatomy. Williams and Wilkins, Baltimore, Maryland.
Chau, W., and McIntosh, A.R. (2005). The Talairach coordinate of a point in the MNI space: How to
interpret it. Neuroimage 25, 408-416.
Crosby, E.C., Humphrey, T., and Lauer, E.W. (1962): Correlative Anatomy of the Nervous System.
Macmillan, NewYork p 188-192.
Crum, W. R., Rueckert, D., Jenkinson, M., Kennedy, D., and Smith, S. M. (2004). A framework for
detailed objective comparison of non-rigid registration algorithms in neuroimaging Medical
Image Computing and Computer-Assisted Intervention–MICCAI 2004 (pp. 679-686):
Springer.
Crum, W., Hartkens, T., and Hill, D. (2014). Non-rigid image registration: theory and practice.
Dale, A. M., Fischl, B., Sereno, M. I. (1999). Cortical surface-based analysis: I. Segmentation and
surface reconstruction. Neuroimage, 9, 179-194.
Page 120
104
Datta, S., Tao, G., He, R., Wolinsky, J. S., and Narayana, P. A. (2009). Improved cerebellar tissue
classification on magnetic resonance images of brain. Journal of Magnetic Resonance
Imaging, 29, 1035-1042.
DeArmond SJ, Fusco MM, Dewey MM. (1989). A Photographic Atlas: Structure of the Human Brain.
Oxford University. Press, New York.
Dice, L. R. (1945). Measures of the amount of ecologic association between species. Ecology, 26,
297-302.
Diedrichsen, J, (2006). A spatially unbiased atlas template of the human cerebellum. Neuroimage
33(1):127-138.
Diedrichsen, J., Balsters, J.H., Flavell, J., Cussans, E., and Ramnani N. (2009). A probabilistic MR
atlas of the human cerebellum. Neuroimage 46(1):39-46.
Diedrichsen, J., Verstynen, T., Schlerf, J., and Wiestler, T. (2010). Advances in functional imaging of
the human cerebellum. Current opinion in neurology, 23(4), 382-387.
Dubuisson, M.P., and Jain, A. K. (1994). A modified Hausdorff distance for object matching. Paper
presented at the Pattern Recognition, 1994. Vol. 1-Conference A: Computer Vision and
Image Processing.
Evans, A.C., Collins, D.L., Mills, S., Brown, E., Kelly, R., and Peters, T.M. (1993). 3D statistical
neuroanatomical models from 305 MRI volumes. Nuclear Science Symposium and Medical
Imaging Conference, IEEE Conference Record. p 1813-1817.
Evans, A. C., Janke, A. L., Collins, D. L., Baillet, S. (2012). Brain templates and atlases.
Neuroimage, 62, 911-922.
Fischl, B., Salat, D. H., Busa, E., Albert, M., Dieterich, M., Haselgrove, C., et al. (2002). Whole brain
segmentation: automated labeling of neuroanatomical structures in the human brain. Neuron,
33(3), 341-355.
Fischl, B., Sereno, M. I., and Dale, A. M. (1999). Cortical surface-based analysis. Neuroimage, 9,
195-207.
Fonov, V., Evans, A. C., Botteron, K., Almli, C. R., McKinstry, R. C., and Collins, D. L. (2011).
Unbiased average age-appropriate atlases for pediatric studies. Neuroimage, 54(1), 313-327.
Fotenos, A. F., Snyder, A., Girton, L., Morris, J., Buckner, R. (2005). Normative estimates of cross-
sectional and longitudinal brain volume decline in aging and AD. Neurology, 64, 1032-1039.
Gering, D. T., Nabavi, A., Kikinis, R., Hata, N., O'Donnell, L. J., Grimson, W. E. L., et al. (2001). An
integrated visualization system for surgical planning and guidance using image fusion and an
open MR. Journal of Magnetic Resonance Imaging, 13, 967-975.
Ghosh, S. S., Kakunoori, S., Augustinack, J., Nieto-Castanon, A., Kovelman, I., Gaab, N., et al.
(2010). Evaluating the validity of volume-based and surface-based brain image registration
for developmental cognitive neuroscience studies in children 4 to 11years of age.
Neuroimage, 53, 85-93.
Goebel R, Esposito F, Formisano E. (2006). Analysis of functional image analysis contest (FIAC)
data with brainvoyager QX: From single subject to cortically aligned group general linear
model analysis and self organizing group independent component analysis. Hum. Brain
Mapp. 27(5), 392-401.
Page 121
105
Hammers, A., Allom, R., Koepp, M.J., Free, S.L., Myers, R., Lemieux, L., Mitchell, T.N., Brooks,
D.J., Duncan, J.S., (2003). Three-dimentsional maximum probability atlas of the human
brain, with particular reference to the temporal lobe. Human Brain Mapping 19(4), 224-247.
Heckemann, R. A., Hajnal, J. V., Aljabar, P., Rueckert, D., and Hammers, A. (2006). Automatic
anatomical brain MRI segmentation combining label propagation and decision fusion.
Neuroimage, 33(1), 115-126.
Iglesias, J. E., Sabuncu, M. R., and Van Leemput, K. (2012). A generative model for multi-atlas
segmentation across modalities. Paper presented at the Biomedical Imaging (ISBI), 2012 9th
IEEE International Symposium.
Iglesias, J. E., Sabuncu, M.R., Van Leemput, K. (2013). A unified framework for cross-modality
multi-atlas segmentation of brain MRI. Medical image analysis, 17, 1181-1191.
Isgum, I., Staring, M., Rutten, A., Prokop, M., Viergever, M. A., and van Ginneken, B. (2009). Multi-
atlas-based segmentation with local decision fusion—Application to cardiac and aortic
segmentation in CT scans. Medical Imaging, IEEE Transactions on, 28, 1000-1010.
Jacobson, S.W., Stanton, M.E., Dodge, N.C., Pienaar, M., Fuller, D.S., Molteno, C.D., Meintjes,
E.M., Hoyme, H.E., Robinson, L.K., Khaole, N., Jacobson, J.L. (2011). Impaired delay and
trace eyeblink conditioning in school-age children with fetal alcohol syndrome. Alcoholism:
Clin and Exp Res 35(2), 250-264.
Jacobson SW, Stanton ME, Molteno CD, Burden MJ, Fuller DS, Hoyme HE, Robinson LK, Khaole
N, Jacobson JL. (2008). Impaired eyeblink conditioning in children with fetal alcohol
syndrome. Alcoholism: Clin and Exp Res 32(2). 365-372.
Jenkinson, M., Smith, S. (2001). A global optimisation method for robust affine registration of brain
images. Medical image analysis, 5, 143-156.
Jenkinson, M., Bannister, P., Brady, M., and Smith, S. (2002). Improved optimization for the robust
and accurate linear registration and motion correction of brain images. Neuroimage, 17(2),
825-841.
Joseph, J., Warton, C., Jacobson, S. W., Jacobson, J. L., Molteno, C. D., Eicher, A., et al. (2014).
Three‐dimensional surface deformation‐based shape analysis of hippocampus and caudate
nucleus in children with fetal alcohol spectrum disorders. Human brain mapping, 35(2), 659-
672.
Joshi, S., Davis, B., Jomier, M., Gerig, G. (2004). Unbiased diffeomorphic atlas construction for
computational anatomy. Neuroimage, 23, S151-S160.
Kretschmann, H.J., Weinrich, W. (1992). Cranial neuroimaging and clinical neuroanatomy. Thieme,
New York.
Lin, J., Salamon, N., Dutton, R., Lee, A., Geaga, J., Hayashi, K., et al. (2005). Three-dimensional
preoperative maps of hippocampal atrophy predict surgical outcomes in temporal lobe
epilepsy. Neurology, 65, 1094-1097.
Lötjönen, J. M., Wolz, R., Koikkalainen, J. R., Thurfjell, L., Waldemar, G., Soininen, H., et al.
(2010). Fast and robust multi-atlas segmentation of brain magnetic resonance images.
Neuroimage, 49, 2352-2365.
Maintz, J., and Viergever, M. A. (1998). A survey of medical image registration. Medical image
analysis, 2(1), 1-36.
Page 122
106
Makris, N., Schlerf, J. E., Hodge, S. M., Haselgrove, C., Albaugh, M. D., Seidman, L. J., et al. (2005).
MRI-based surface-assisted parcellation of human cerebellar cortex: an anatomically
specified method with estimate of reliability. Neuroimage, 25(4), 1146-1160.
Manni, E., and Petrosini, L. (2004). A century of cerebellar somatotopy: a debated representation.
Nature Reviews Neuroscience, 5(3), 241-249.
Mazziotta, J. C., Toga, A. W., Evans, A., Fox, P., and Lancaster, J. (1995). A probabilistic atlas of the
human brain: theory and rationale for its development the international consortium for brain
mapping (ICBM). Neuroimage, 2(2PA), 89-101.
Mazziotta, J., Toga, A., Evans, A., Fox, P., Lancaster, J., Zilles, K., et al. (2001). A probabilistic atlas
and reference system for the human brain: International Consortium for Brain Mapping
(ICBM). Philosophical Transactions of the Royal Society of London. Series B: Biological
Sciences, 356(1412), 1293-1322.
McGraw, K.O., Wong, S. (1996). Forming inferences about some intraclass correlation coefficients.
Psychological methods, 1(1), 30-46.
Panizzon, M. S., Fennema-Notestine, C., Eyler, L. T., Jernigan, T. L., Prom-Wormley, E., Neale, M.,
et al. (2009). Distinct genetic influences on cortical surface area and cortical thickness.
Cerebral Cortex, 19(11), 2728-2735.
Pham, D. L., Xu, C., and Prince, J. L. (2000). Current methods in medical image segmentation 1.
Annual review of biomedical engineering, 2(1), 315-337.
Pierson, R., Corson, P.W., Sears, L.L., Alicata, D., Magnotta, V., O'Leary D., Andreasen, N.C.
(2002). Manual and semiautomated measurement of cerebellar subregions on MR images.
Neuroimage 17(1), 61-76.
Postelnicu, G., Zöllei, L., Fischl, B. (2009). Combined volumetric and surface registration. IEEE
Transaction on Medical Imaging 28, 508-522.
Reuter, M., Schmansky, N. J., Rosas, H. D., Fischl, B. (2012). Within-subject template estimation for
unbiased longitudinal image analysis. Neuroimage, 61, 1402-1418.
Roberts, M.P., Hanaway, J., Morest, D.K. (1987). Atlas of the Human Brain in Sections. Lea and
Febiger, Philadelphia.
Rohlfing, T., Brandt, R., Menzel, R., Maurer Jr, C. R. (2004). Evaluation of atlas selection strategies
for atlas-based image segmentation with application to confocal microscopy images of bee
brains. Neuroimage, 21, 1428-1442.
Sabuncu, M. R., Yeo, B., Van Leemput, K., Fischl, B., Golland, P. (2010). A generative model for
image segmentation based on label fusion. IEEE Transactions on Medical Imaging, 29(10),
1714-1729.
Sadananthan, S. A., Zheng, W., Chee, M. W., Zagorodnov, V. (2010). Skull stripping using graph
cuts. Neuroimage, 49, 225-239.
Sasikala, M., Kumaravel, N., and Priya lakshmi, N. (2007). Multimodal Medical Image Fusion Based
on Lifting Wavelet Transform. In Proceedings International conference on Information
Processing, 414-423.
Page 123
107
Schlerf, J. E., Verstynen, T. D., Ivry, R. B., Spencer, R. M. (2010). Evidence of a novel somatopic
map in the human neocerebellum during complex actions. Journal of neurophysiology,
103(6), 3330-3336.
Schmahmann, J.D., and Sherman, J.C. (1998). The cerebellar cognitive affective syndrome. Brain,
121, 561-579.
Schmahmann, J. D., and Sherman, J. C. (1997). Cerebellar cognitive affective syndrome.
International Review of Neurobiology, 41, 433-440.
Schmahmann, J. D., Doyon, J., McDonald, D., Holmes, C., Lavoie, K., Hurwitz, A. S., et al. (1999).
Three-dimensional MRI atlas of the human cerebellum in proportional stereotaxic space.
Neuroimage, 10(3), 233-260.
Segonne, F., Dale, A., Busa, E., Glessner, M., Salat, D., Hahn, H., et al. (2004). A hybrid approach to
the skull stripping problem in MRI. Neuroimage, 22, 1060-1075.
Shattuck, D. W., Mirza, M., Adisetiyo, V., Hojatkashani, C., Salamon, G., Narr, K. L., et al. (2008).
Construction of a 3D probabilistic atlas of human cortical structures. Neuroimage, 39(3),
1064-1080.
Shattuck, D. W., Sandor-Leahy, S. R., Schaper, K. A., Rottenberg, D. A., and Leahy, R. M. (2001).
Magnetic resonance image tissue classification using a partial volume model. Neuroimage,
13, 856-876.
Shrout, P.E., Fleiss, J.L. (1979). Intraclass correlations: uses in assessing rater reliability.
Psychological bulletin 86(2),420-428.
Sled, J. G., Zijdenbos, A. P., Evans, A. C. 1998. A nonparametric method for automatic correction of
intensity nonuniformity in MRI data. IEEE Transactions on Medical Imaging, 17, 87-97.
Smith, S. M., Jenkinson, M., Woolrich, M. W., Beckmann, C. F., Behrens, T., Johansen-Berg, H., et
al. (2004). Advances in functional and structural MR image analysis and implementation as
FSL. Neuroimage, 23, S208-219.
Stoodley, C. J., and Schmahmann, J. D. (2009). Functional topography in the human cerebellum: a
meta-analysis of neuroimaging studies. Neuroimage, 44(2), 489-501.
Strick, P. L., Dum, R. P., and Fiez, J. A. (2009). Cerebellum and nonmotor function. Annual review
of neuroscience, 32, 413-434.
Talairach, J., and Tournoux, P. (1988). Co-planar stereotactic atlas of the human brain, 1988. Theime
Medical, New York.
Tang, Y., Hojatkashani, C., Dinov, I. D., Sun, B., Fan, L., Lin, X., et al. (2010). The construction of a
Chinese MRI brain atlas: A morphometric comparison study between Chinese and Caucasian
cohorts. Neuroimage, 51(1), 33-41.
Thompson, P. M., Hayashi, K. M., Dutton, R. A., CHIANG, M. C., Leow, A. D., Sowell, E. R., et al.
(2007). Tracking Alzheimer's disease. Annals of the New York Academy of Sciences, 1097,
183-214.
Thompson, P. M., Hayashi, K. M., Sowell, E. R., Gogtay, N., Giedd, J. N., Rapoport, J. L., et al.
(2004). Mapping cortical change in Alzheimer's disease, brain development, and
schizophrenia. Neuroimage, 23, S2-S18.
Page 124
108
Tisdall, M.D., Hess, A.T., Reuter, M., Meintjes, E.M., Fischl, B., Van der Kouwe, A.J. (2012).
Volumetric navigators for prospective motion correction and selective reacquisition in
neuroanatomical MRI. Magnetic Resonance in Medicine 68(2): 389-399.
Toga, A. W., and Thompson, P. M. (2001). The role of image registration in brain mapping. Image
and Vision Computing, 19(1), 3-24.
Tzourio-Mazoyer, N., Landeau, B., Papathanassiou, D., Crivello, F., Etard, O., Delcroix, N., et al.
(2002). Automated anatomical labeling of activations in SPM using a macroscopic anatomical
parcellation of the MNI MRI single-subject brain. Neuroimage, 15(1), 273-289.
Van der Kouwe, A.J., Benner, T., Salat, D.H., Fischl, B. (2008). Brain morphometry with multiecho
MPRAGE. Neuroimage 40(2),559-569.
Waddington, Margaret M, 1984. Atlas of Human Intracranial Anatomy. Rutland, Vt: Academic
Books.
Wang, H., Suh, J. W., Das, S. R., Pluta, J. B., Craige, C., and Yushkevich, P. A. (2013). Multi-atlas
segmentation with joint label fusion. Pattern Analysis and Machine Intelligence, IEEE
Transactions, 35(3), 611-623.
Warfield, S. K., Zou, K. H., and Wells, W. M. (2004). Simultaneous truth and performance level
estimation (STAPLE): an algorithm for the validation of image segmentation. IEEE
Transactions on Medical Imaging, 23(7), 903-921.
Wilke M, Holland SK, Altaye M, Gaser C. (2008): Template-O-Matic: a toolbox for creating
customized pediatric templates. Neuroimage 41(3):903-913.
Woods, R.P. (2003): Multitracer: a Java-based tool for anatomic delineation of grayscale volumetric
images. Neuroimage 19(4):1829-1834.
Woods, R. P., Mazziotta, J. C., and Cherry, S. R. (1993). MRI-PET registration with automated
algorithm. Journal of computer assisted tomography, 17(4), 536-546.
Yoon, U., Fonov, V.S., Perusse, D., Evans, A.C. (2009). The effect of template choice on
morphometric analysis of pediatric brain data. Neuroimage 45(3),769-777.