Development of a Tool for Measuring User Experience of Customers of Nordea’s Internet Bank Antero Meuronen Master’s thesis in Cognitive Science Department of Psychology Faculty of Behavioural Sciences University of Helsinki May 2005
Transcript
Development of a Tool for Measuring User Experience of Customers of Nordea’s Internet Bank
Antero Meuronen
Master’s thesis in Cognitive Science
Department of Psychology
Faculty of Behavioural Sciences
University of Helsinki
May 2005
HELSINGIN YLIOPISTO - HELSINGFORS UNIVERSITET - UNIVERSITY OF HELSINKI Tiedekunta - Fakultet – Faculty Faculty of Behavioral Sciences
Laitos - Institution – Department Department of Psychology
Tekijä - Författare – Author Antero Meuronen
Työn nimi - Arbetets title Käyttökokemusmittarin kehittäminen Nordean verkkopankkiasiakkaiden käyttökokemuksen mittaamiseen
Title Development of a Tool for Measuring User Experience of Customers of Nordea’s Internet Bank
Oppiaine - Läroämne – Subject Cognitive Science
Työn laji - Arbetets art – Level Master Thesis
Aika - Datum - Month and year May 2005
Sivumäärä - Sidoantal - Number of pages 60 + 1
Tiivistelmä - Referat – Abstract
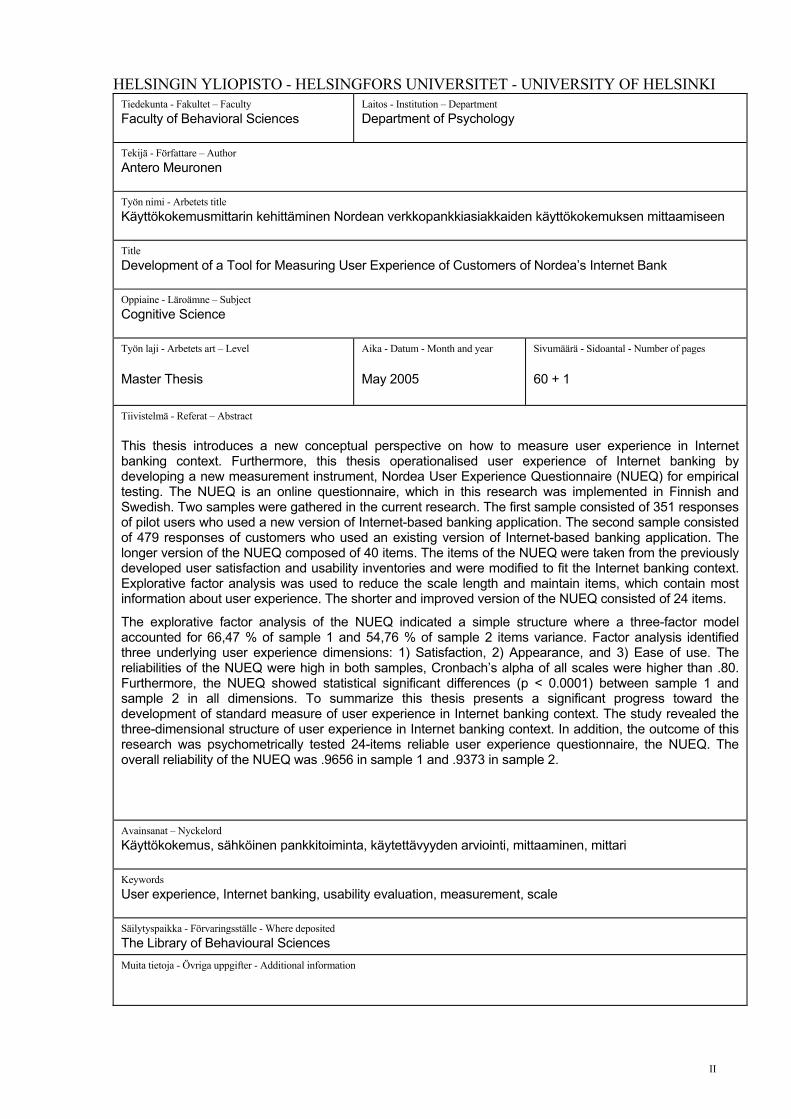
This thesis introduces a new conceptual perspective on how to measure user experience in Internet banking context. Furthermore, this thesis operationalised user experience of Internet banking by developing a new measurement instrument, Nordea User Experience Questionnaire (NUEQ) for empirical testing. The NUEQ is an online questionnaire, which in this research was implemented in Finnish and Swedish. Two samples were gathered in the current research. The first sample consisted of 351 responses of pilot users who used a new version of Internet-based banking application. The second sample consisted of 479 responses of customers who used an existing version of Internet-based banking application. The longer version of the NUEQ composed of 40 items. The items of the NUEQ were taken from the previously developed user satisfaction and usability inventories and were modified to fit the Internet banking context. Explorative factor analysis was used to reduce the scale length and maintain items, which contain most information about user experience. The shorter and improved version of the NUEQ consisted of 24 items.
The explorative factor analysis of the NUEQ indicated a simple structure where a three-factor model accounted for 66,47 % of sample 1 and 54,76 % of sample 2 items variance. Factor analysis identified three underlying user experience dimensions: 1) Satisfaction, 2) Appearance, and 3) Ease of use. The reliabilities of the NUEQ were high in both samples, Cronbach’s alpha of all scales were higher than .80. Furthermore, the NUEQ showed statistical significant differences (p < 0.0001) between sample 1 and sample 2 in all dimensions. To summarize this thesis presents a significant progress toward the development of standard measure of user experience in Internet banking context. The study revealed the three-dimensional structure of user experience in Internet banking context. In addition, the outcome of this research was psychometrically tested 24-items reliable user experience questionnaire, the NUEQ. The overall reliability of the NUEQ was .9656 in sample 1 and .9373 in sample 2.
Keywords User experience, Internet banking, usability evaluation, measurement, scale
Säilytyspaikka - Förvaringsställe - Where deposited The Library of Behavioural Sciences Muita tietoja - Övriga uppgifter - Additional information
II
HELSINGIN YLIOPISTO - HELSINGFORS UNIVERSITET - UNIVERSITY OF HELSINKI Tiedekunta - Fakultet – Faculty Käyttäytymistieteellinen tiedekunta
Laitos - Institution – Department Psykologian laitos
Tekijä - Författare – Author Antero Meuronen
Työn nimi - Arbetets title Käyttökokemusmittarin kehittäminen Nordean verkkopankkiasiakkaiden käyttökokemuksen mittaamiseen
Title Development of a Tool for Measuring User Experience of Customers of Nordea’s Internet Bank
Oppiaine - Läroämne – Subject Kognitiotiede
Työn laji - Arbetets art - Level
Pro Gradu -tutkielma
Aika - Datum - Month and year
Toukokuu 2005
Sivumäärä - Sidoantal - Number of pages
60 + 1
Tiivistelmä - Referat - Abstract
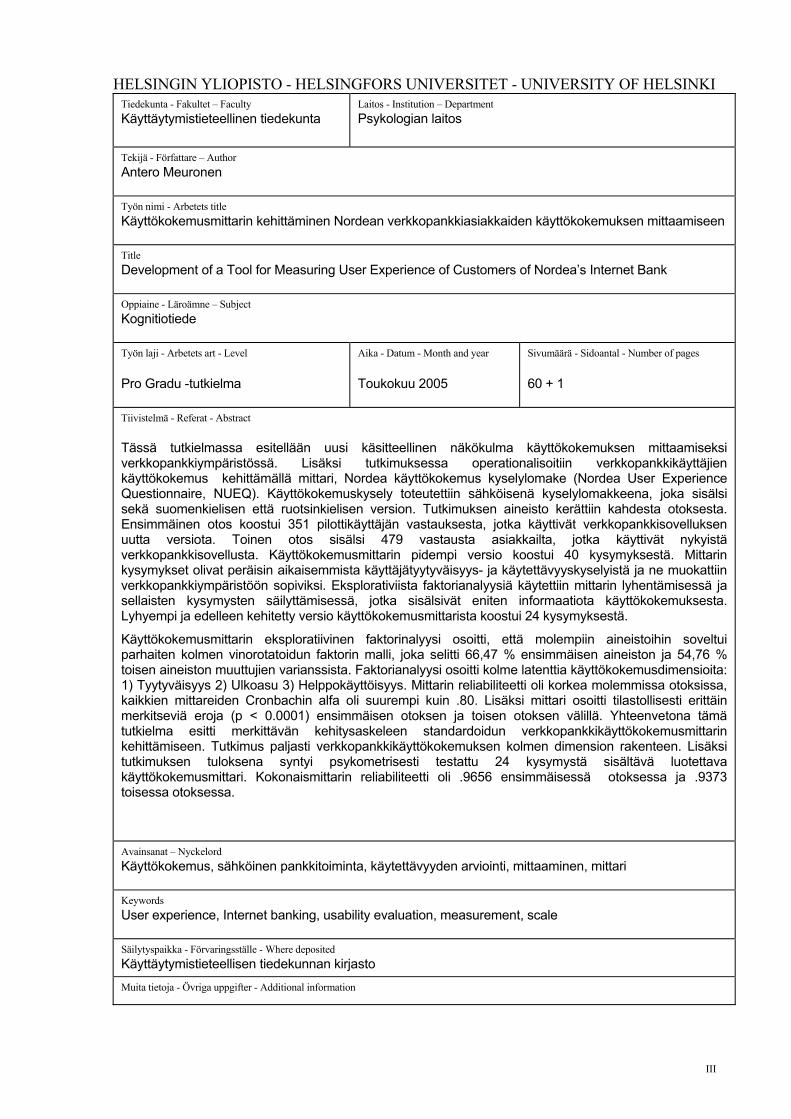
Tässä tutkielmassa esitellään uusi käsitteellinen näkökulma käyttökokemuksen mittaamiseksi verkkopankkiympäristössä. Lisäksi tutkimuksessa operationalisoitiin verkkopankkikäyttäjien käyttökokemus kehittämällä mittari, Nordea käyttökokemus kyselylomake (Nordea User Experience Questionnaire, NUEQ). Käyttökokemuskysely toteutettiin sähköisenä kyselylomakkeena, joka sisälsi sekä suomenkielisen että ruotsinkielisen version. Tutkimuksen aineisto kerättiin kahdesta otoksesta. Ensimmäinen otos koostui 351 pilottikäyttäjän vastauksesta, jotka käyttivät verkkopankkisovelluksen uutta versiota. Toinen otos sisälsi 479 vastausta asiakkailta, jotka käyttivät nykyistä verkkopankkisovellusta. Käyttökokemusmittarin pidempi versio koostui 40 kysymyksestä. Mittarin kysymykset olivat peräisin aikaisemmista käyttäjätyytyväisyys- ja käytettävyyskyselyistä ja ne muokattiin verkkopankkiympäristöön sopiviksi. Eksplorativiista faktorianalyysiä käytettiin mittarin lyhentämisessä ja sellaisten kysymysten säilyttämisessä, jotka sisälsivät eniten informaatiota käyttökokemuksesta. Lyhyempi ja edelleen kehitetty versio käyttökokemusmittarista koostui 24 kysymyksestä.
Käyttökokemusmittarin eksploratiivinen faktorinalyysi osoitti, että molempiin aineistoihin soveltui parhaiten kolmen vinorotatoidun faktorin malli, joka selitti 66,47 % ensimmäisen aineiston ja 54,76 % toisen aineiston muuttujien varianssista. Faktorianalyysi osoitti kolme latenttia käyttökokemusdimensioita: 1) Tyytyväisyys 2) Ulkoasu 3) Helppokäyttöisyys. Mittarin reliabiliteetti oli korkea molemmissa otoksissa, kaikkien mittareiden Cronbachin alfa oli suurempi kuin .80. Lisäksi mittari osoitti tilastollisesti erittäin merkitseviä eroja (p < 0.0001) ensimmäisen otoksen ja toisen otoksen välillä. Yhteenvetona tämä tutkielma esitti merkittävän kehitysaskeleen standardoidun verkkopankkikäyttökokemusmittarin kehittämiseen. Tutkimus paljasti verkkopankkikäyttökokemuksen kolmen dimension rakenteen. Lisäksi tutkimuksen tuloksena syntyi psykometrisesti testattu 24 kysymystä sisältävä luotettava käyttökokemusmittari. Kokonaismittarin reliabiliteetti oli .9656 ensimmäisessä otoksessa ja .9373 toisessa otoksessa.
3.1 Factor and Reliability Analyses of the Sample 1 ................................................................. 29
3.1.1 Latent Variables and Factor Analysis ......................................................................... 29
3.1.2 Requirements for Factor Analysis of Sample 1 .......................................................... 31
3.1.3 Factor Model of Sample 1 Based on Eigenvalue Rule and Scree test ........................ 32
3.1.4 Three-factor Model of Sample 1 with Varimax and Direct Oblim Rotation....................................................................................................................... 34
3.1.5 Two-Factor Model of Sample 1 with Varimax and Direct Oblim Rotation....................................................................................................................... 36
3.1.6 Reliabilities of Shorter Version of The NUEQ’s Scale .............................................. 40
V
3.2 Factor and Reliability Analyses of the Sample 2 ................................................................. 42
3.2.1 Structure of Shorter Version of the NUEQ................................................................. 43
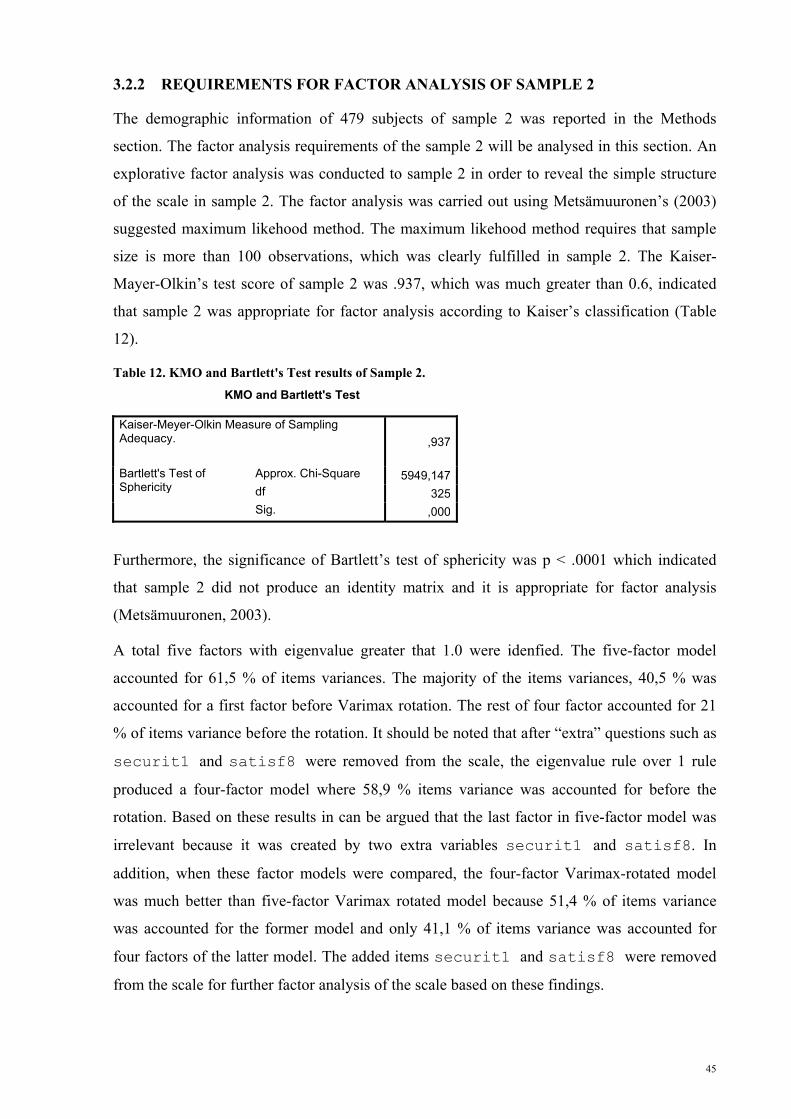
3.2.2 Requirements for Factor Analysis of Sample 2 .......................................................... 45
3.2.3 Three-factor Model WITH VARIMAX- and Oblim Rotation.................................... 46
3.3 Comparison of Scale’s Structures and Reliabilities between Sample 1 and Sample 2 ............................................................................................................................... 49
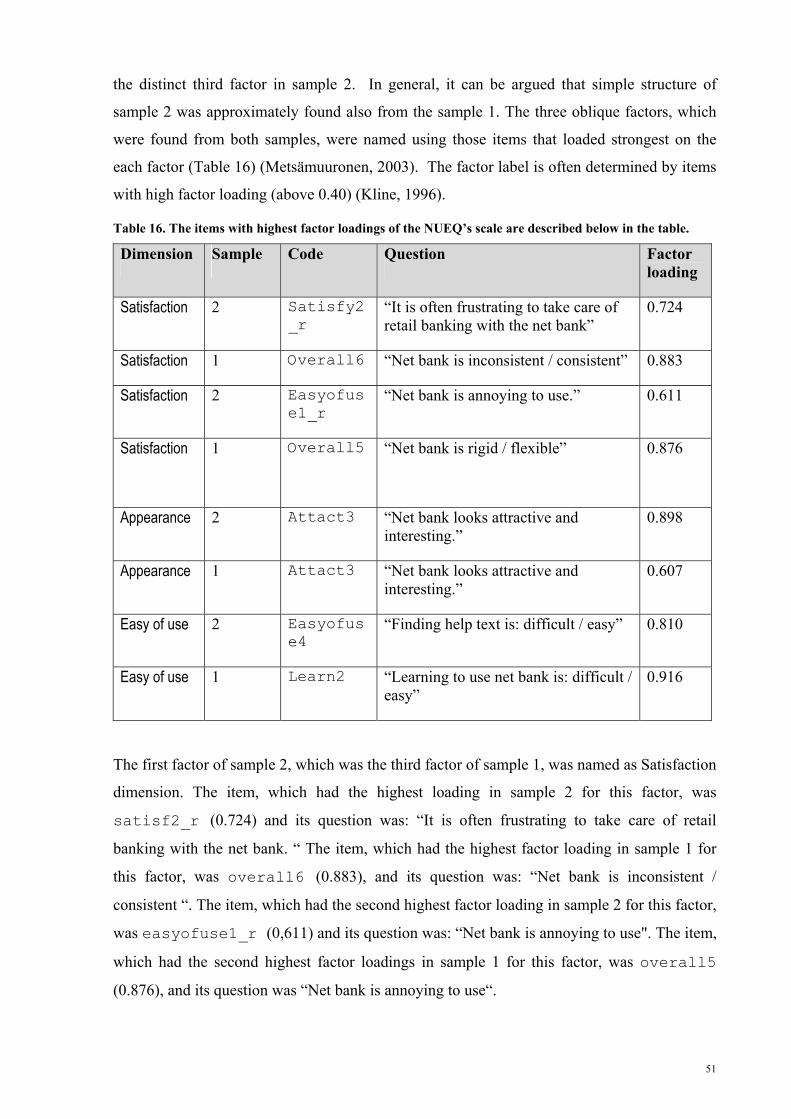
3.3.1 The Three-factor Model of Sample 1 with Direct Oblim Rotation............................. 49
3.3.2 Reliabilities of the NUEQ’s Scales in Sample 1 and Sample 2 .................................. 52
6 APPENDIX 1: USERS’ DEMOGRAPHIC INFORMATION IN BOTH SAMPLES .................... I
7 APPENDIX 2: THE STRUCTURE OF THE LONGER VERSION OF THE NUEQ’S SCALE .............................................................................................................................. I
8 APPENDIX 3: THE ONLINE FORM OF THE LONGER VERSION OF THE NUEQ ............................................................................................................................................... I
9 APPENDIX 4: EIGENVALUE OVER 1 COMMUNALITIES AND VARIMAX ROTATED MATRIX OF SAMPLE 1 ............................................................................................. I
10 APPENDIX 5: THREE-FACTOR MODEL OF SAMPLE 1 WITH VARIMAX ROTATION ...................................................................................................................................... I
11 APPENDIX 6: THREE-FACTOR MODEL OF SAMPLE 1 WITH DIRECT OBLIM ROTATION ........................................................................................................................ I
12 APPENDIX 7: TWO-FACTOR MODEL OF SAMPLE 1 WITH VARIMAX ROTATION ...................................................................................................................................... I
13 APPENDIX 8: TWO-FACTOR MODEL OF SAMPLE 1 WITH DIRECT OBLIM ROTATION ...................................................................................................................................... I
VI
14 APPENDIX 9: RELIABILITIES OF TWO OBLIQUE ROTATED FACTORS OF SAMPLE 1........................................................................................................................................ I
15 APPENDIX 10: HISTOGRAMS OF FACTOR SCORES AND SUM VARIABLES OF SAMPLE 1 .......................................................................................................... I
16 APPENDIX 11: TWO-FACTOR MODEL OF SAMPLE 2 WITH VARIMAX ROTATION ...................................................................................................................................... I
17 APPENDIX 12: TWO-FACTOR MODEL OF SAMPLE 2 WITH DIRECT OBLIM ROTATION ........................................................................................................................ I
18 APPENDIX 13: RELIABILITIES OF THE NUEQ IN SAMPLE 1 AND SAMPLE 2 I
VII
LIST OF FIGURES
Figure 1.The different banking channels presented as a continuum where left side channels are limited by time and place and channels on the right side are more free from these constraints (Hiltunen, et al 2002). ......................................................................................3
Figure 2. Internet usage among Finnish people (Finnish Banker’s Association 2004a)............5
Figure 3. Percentages of regular user of Internet banking services (Finnish Banker’s Association 2004a). ............................................................................................................6
Figure 4. An user carries out tasks with a product in the context of use, and usability measures can be used as indicators how the user achieves quality of use by using the product. (ISO 9241-11(1998, 3))...............................................................................................................9
Figure 5. Neisser's (1976, 21) perceptual cycle where a schema of an user (mental model) directs exploration of information. As a result the user selects samples from objects and selection modifies the original schema of the user...........................................................16
Figure 6. User’s information gathering from a product is directed by his or her expectations. During the information gathering the user produces perceptions, which he or she interprets. The interpreted perceptions form an user experience of the product. .............17
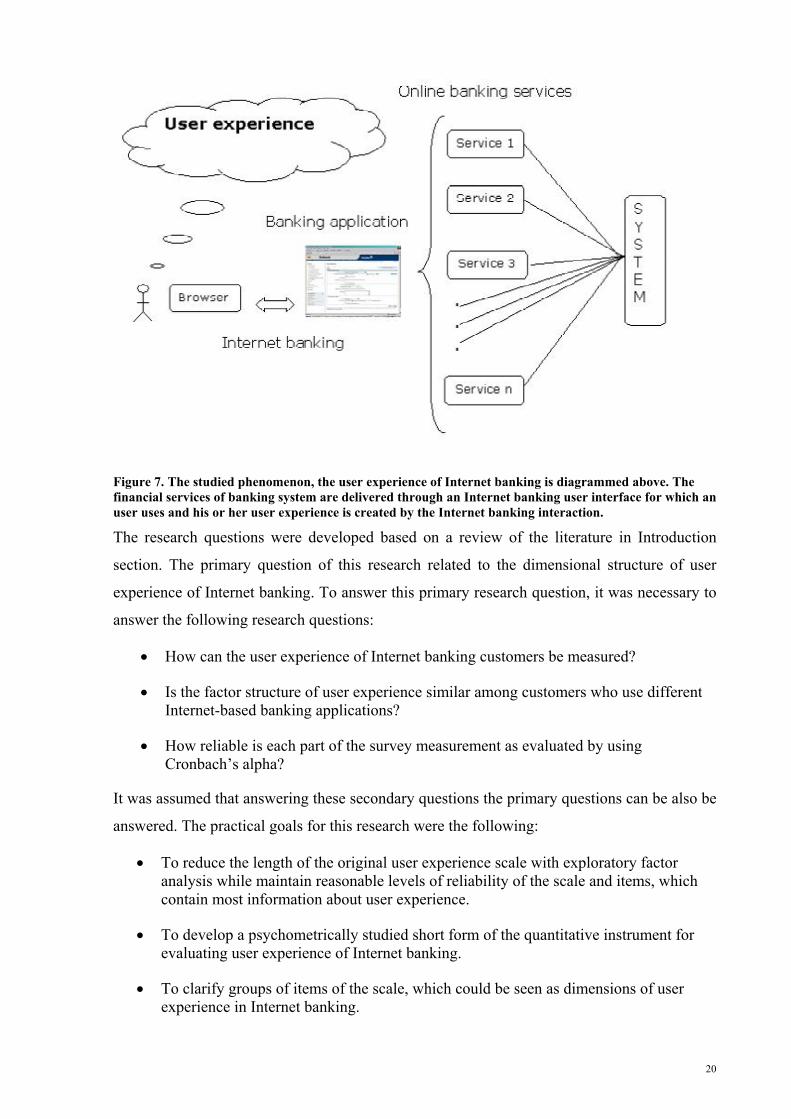
Figure 7. The studied phenomenon, the user experience of Internet banking is diagrammed above. The financial services of banking system are delivered through an Internet banking user interface for which an user uses and his or her user experience is created by the Internet banking interaction........................................................................................20
Figure 8. The data of the current research was gathered using online questionnaires, which were located in the log out page of the Internet-based banking application. ...................23
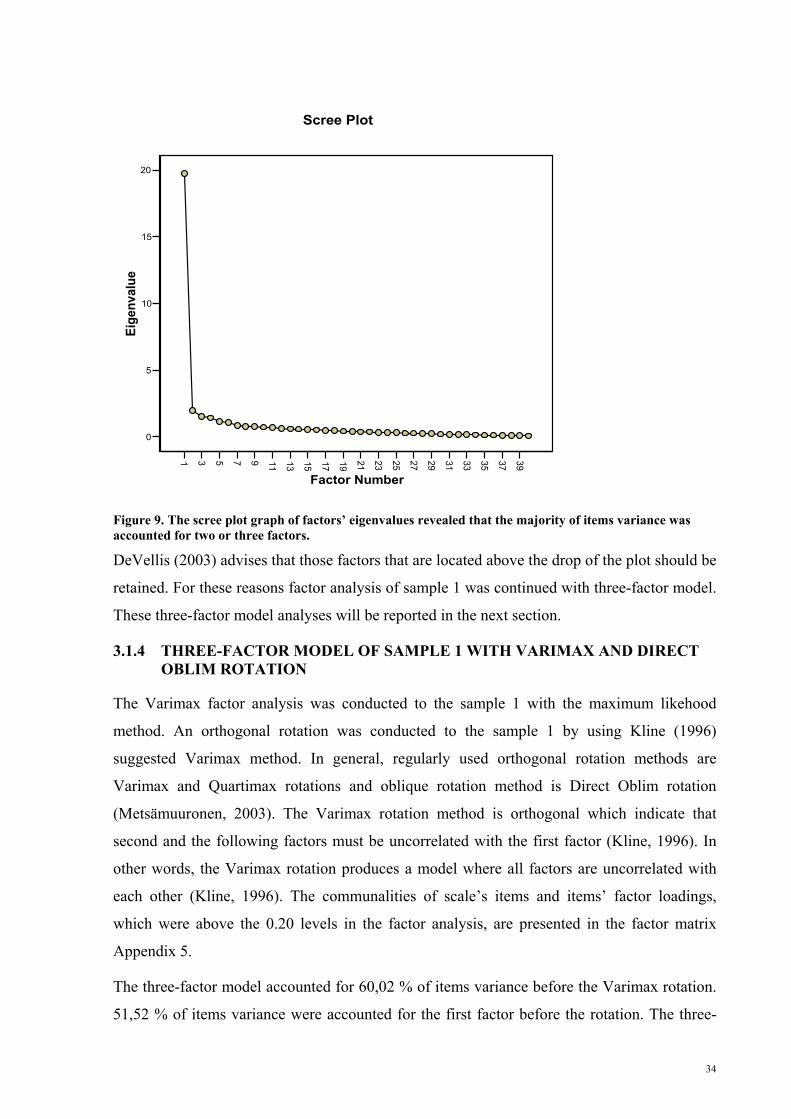
Figure 9. The scree plot graph of factors’ eigenvalues revealed that the majority of items variance was accounted for two or three factors. .............................................................34
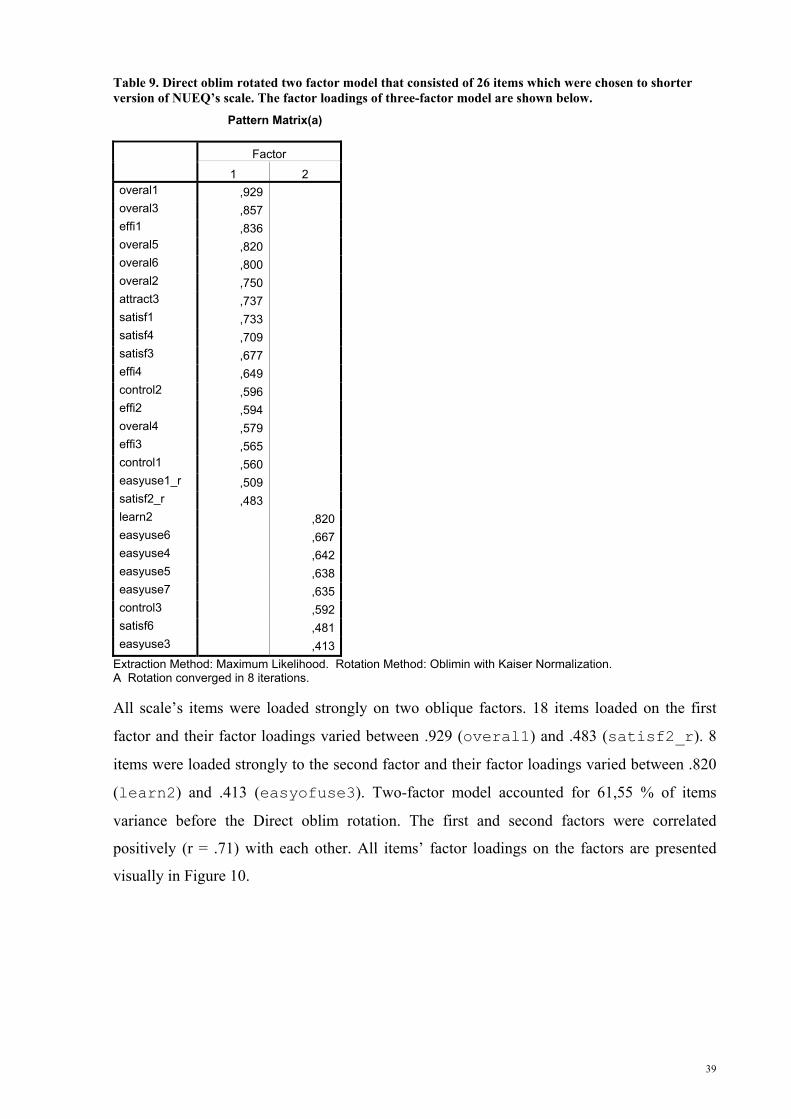
Figure 10. The NUEQ scale’s factor loadings of 26 items are visually presented above with Direct oblim rotated two factors.......................................................................................40
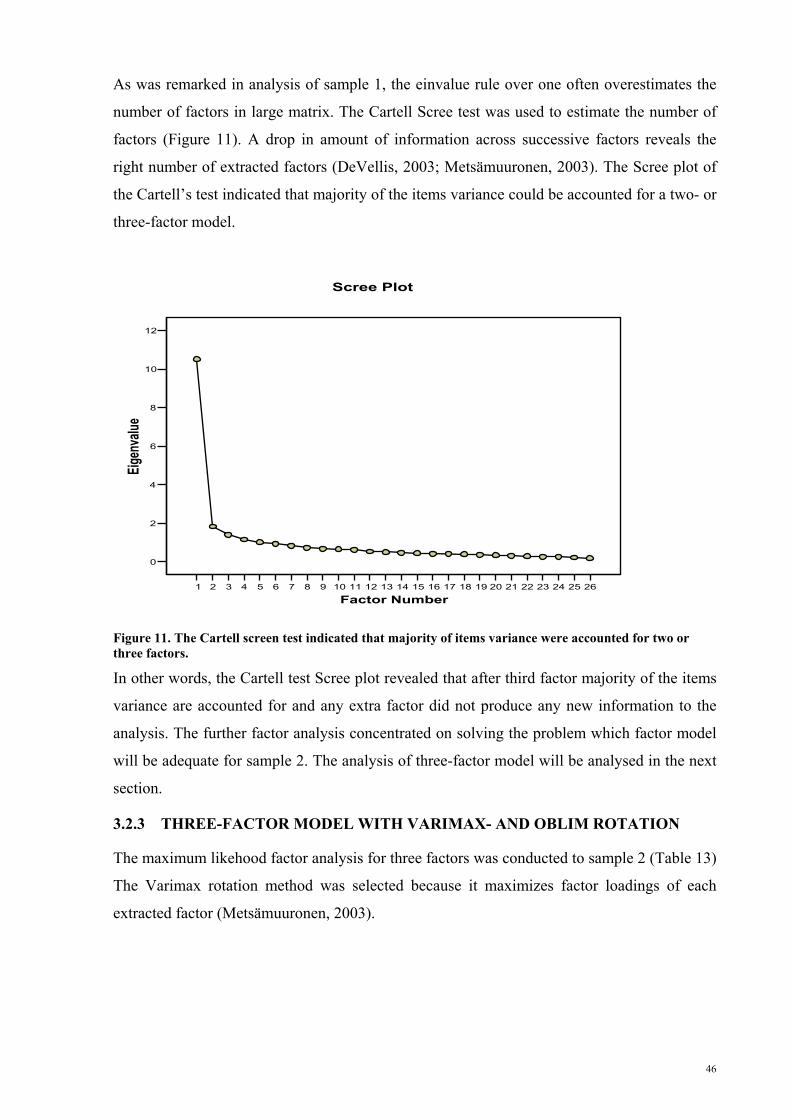
Figure 11. The Cartell screen test indicated that majority of items variance were accounted for two or three factors. ..........................................................................................................46
VIII
LIST OF TABLES
Table 1. Different forms of banking in electronic banking (modified from Daniel 1999).........2
Table 2. Components of Perceptions (modified from Hiltunen, et al., 2002). .........................18
Table 3. Expected dimensions, question examples of each dimension, items’ codes, numbers and expected latent variables are shown in the table........................................................26
Table 4. The used inventories, their codes and scales and number items, which were modified and used in the NUEQ’s scale. .........................................................................................27
Table 5 Kaiser-Meyer-Olkin's test score and Bartlett's test score of the sample 1...................32
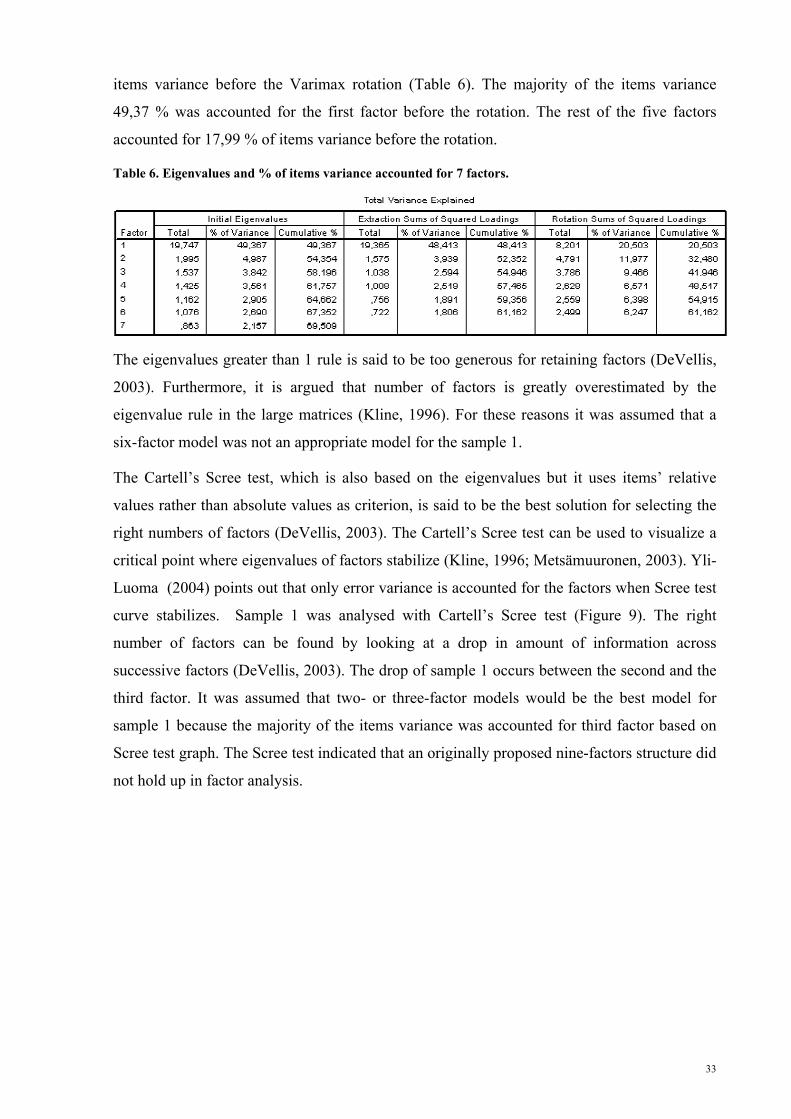
Table 6. Eigenvalues and % of items variance accounted for 7 factors. ..................................33
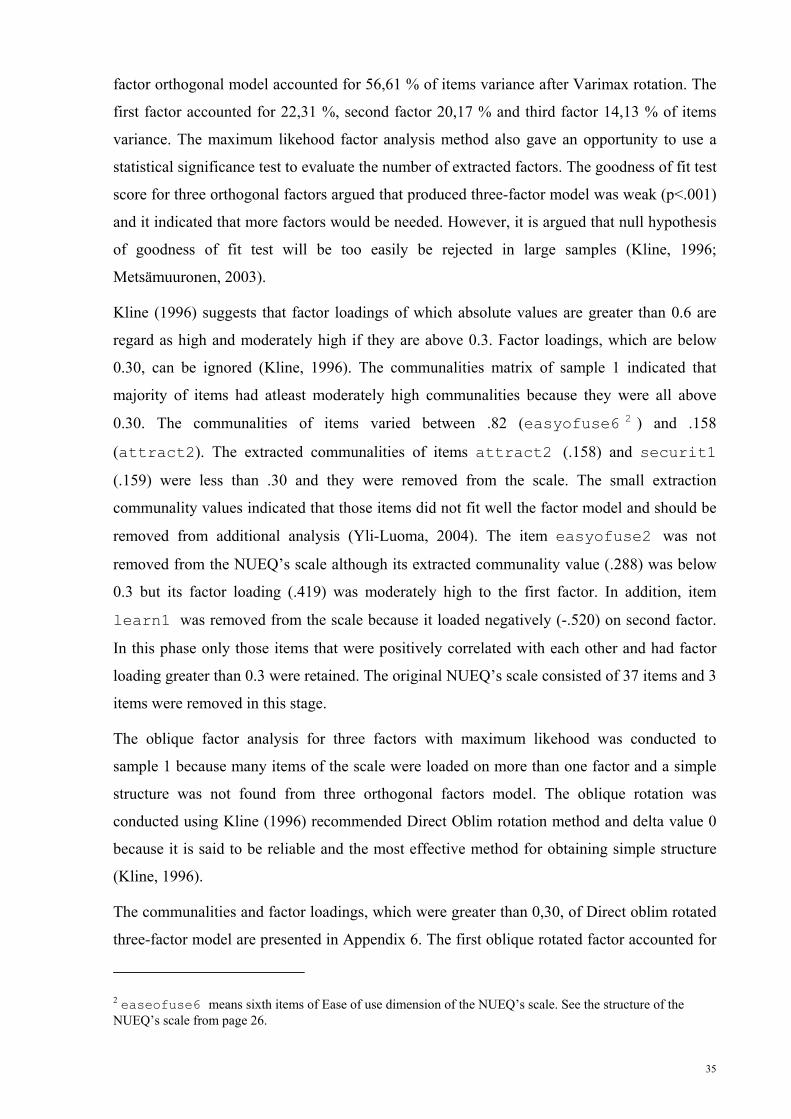
Table 7. The factor matrix of two-factor model with Direct oblim rotation where removed items of the scale are presented on grey background. ......................................................37
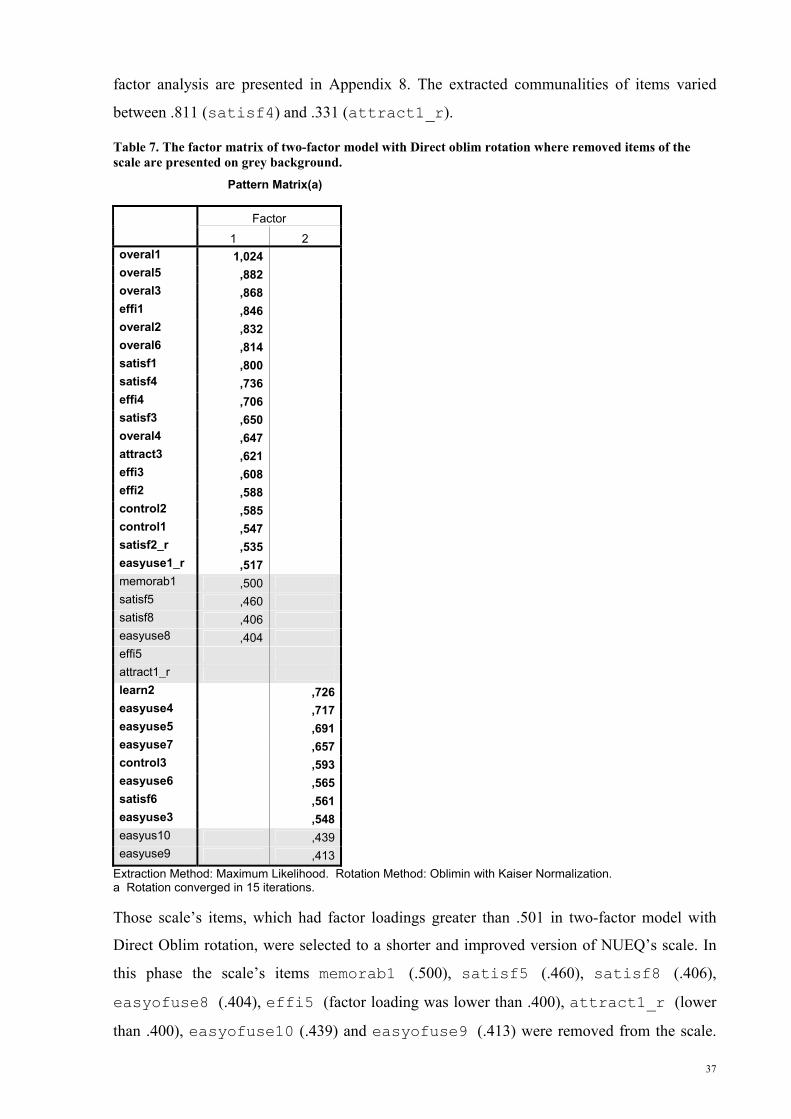
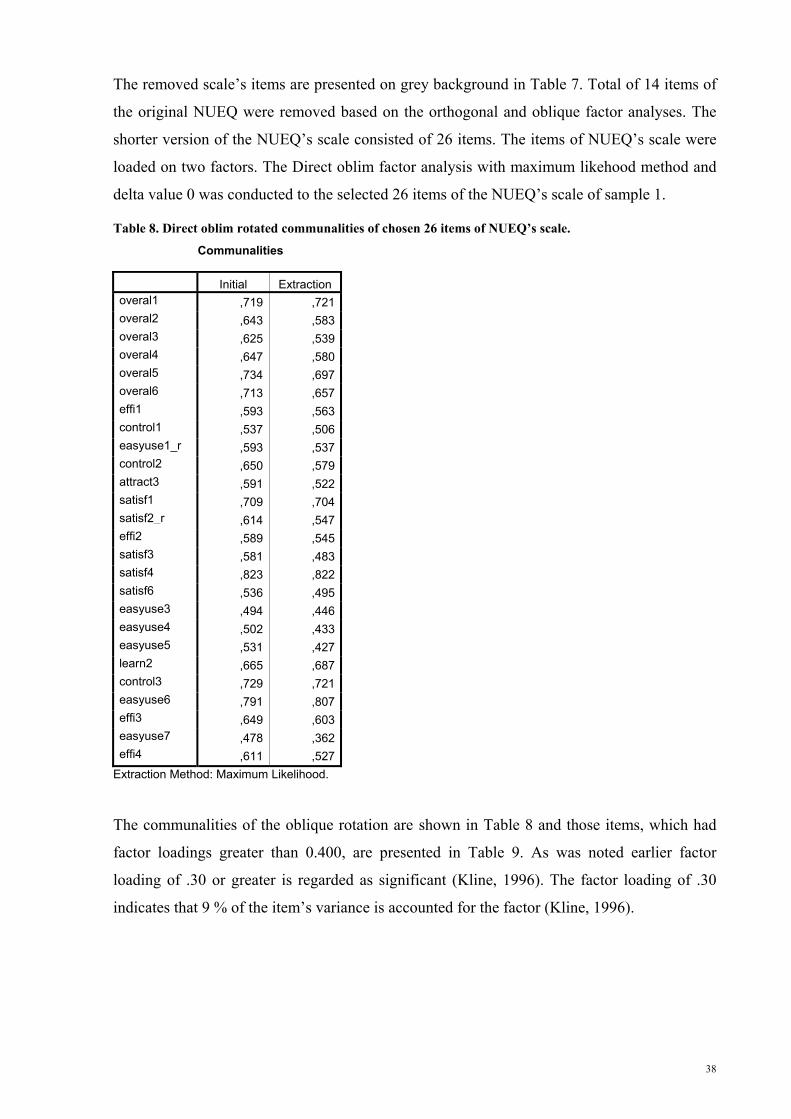
Table 8. Direct oblim rotated communalities of chosen 26 items of NUEQ’s scale................38
Table 9. Direct oblim rotated two factor model that consisted of 26 items which were chosen to shorter version of NUEQ’s scale. The factor loadings of three-factor model are shown below. ...............................................................................................................................39
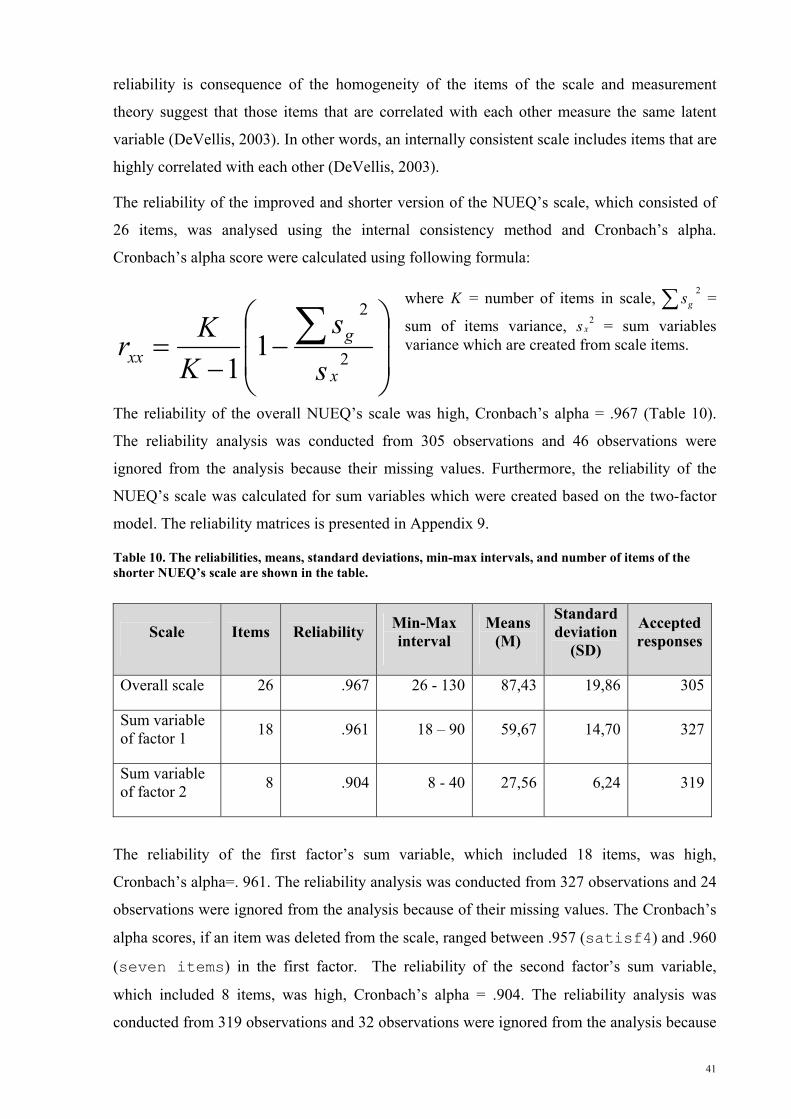
Table 10. The reliabilities, means, standard deviations, min-max intervals, and number of items of the shorter NUEQ’s scale are shown in the table. ..............................................41
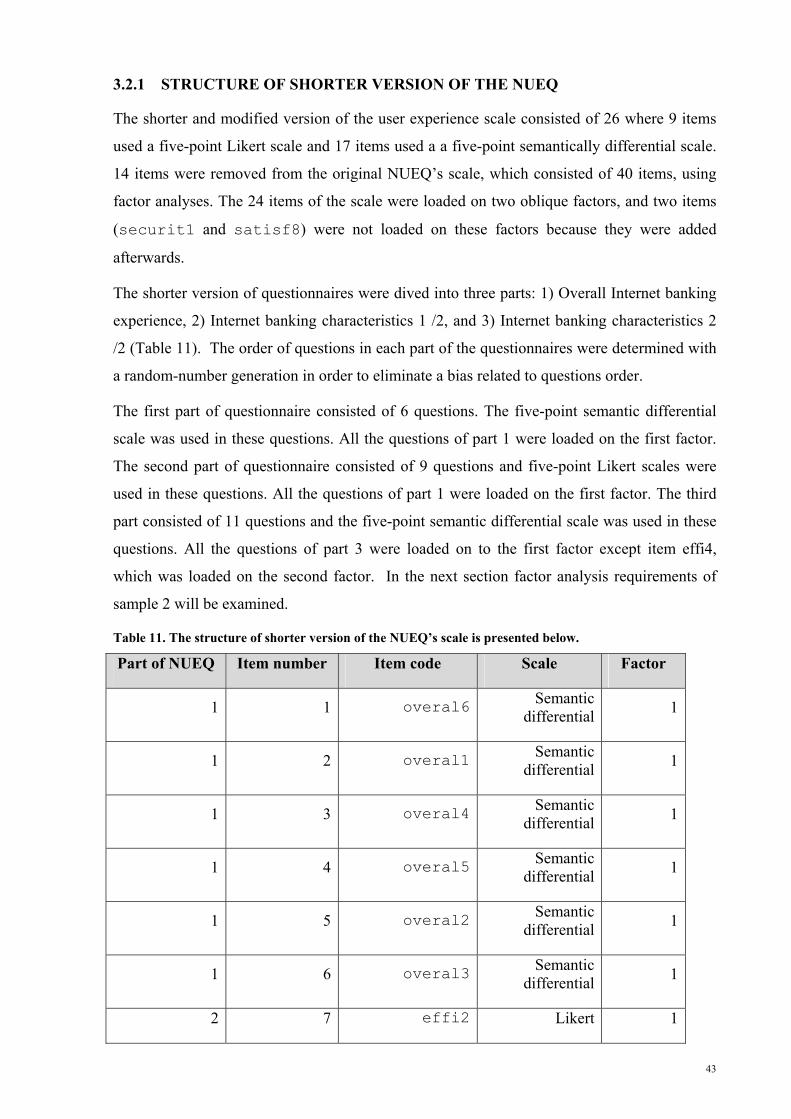
Table 11. The structure of shorter version of the NUEQ’s scale is presented below...............43
Table 12. KMO and Bartlett's Test results of Sample 2. ..........................................................45
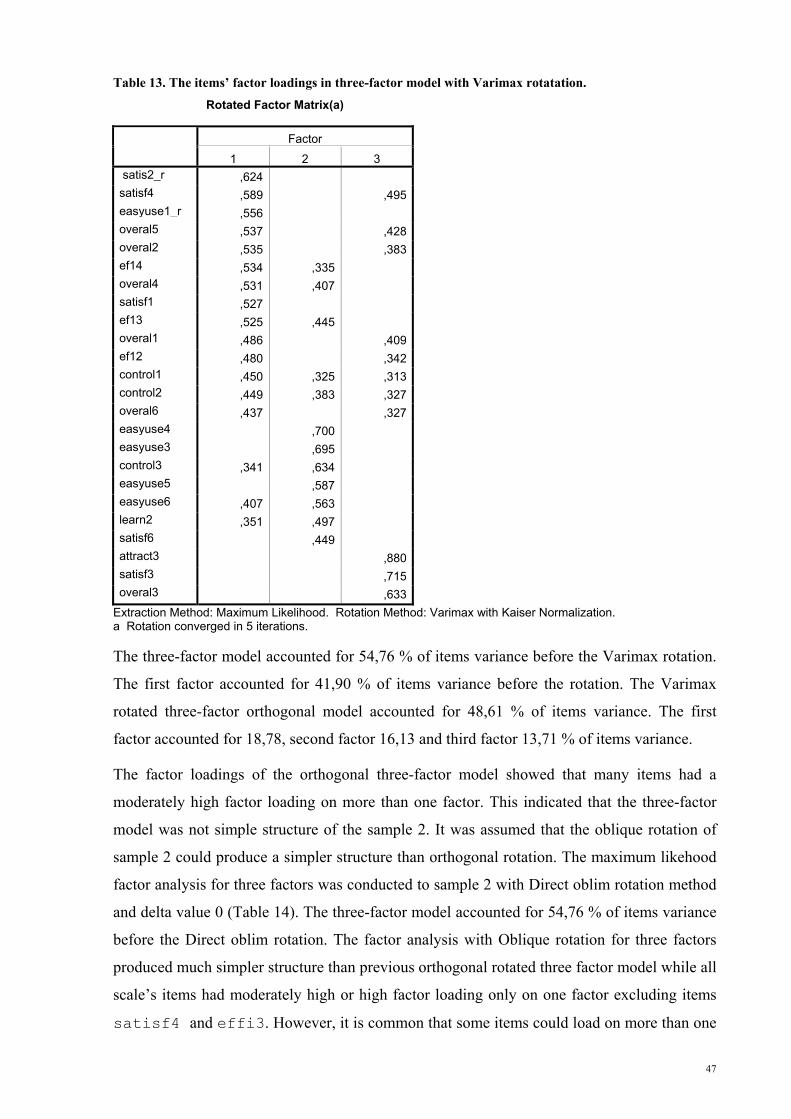
Table 13. The items’ factor loadings in three-factor model with Varimax rotatation..............47
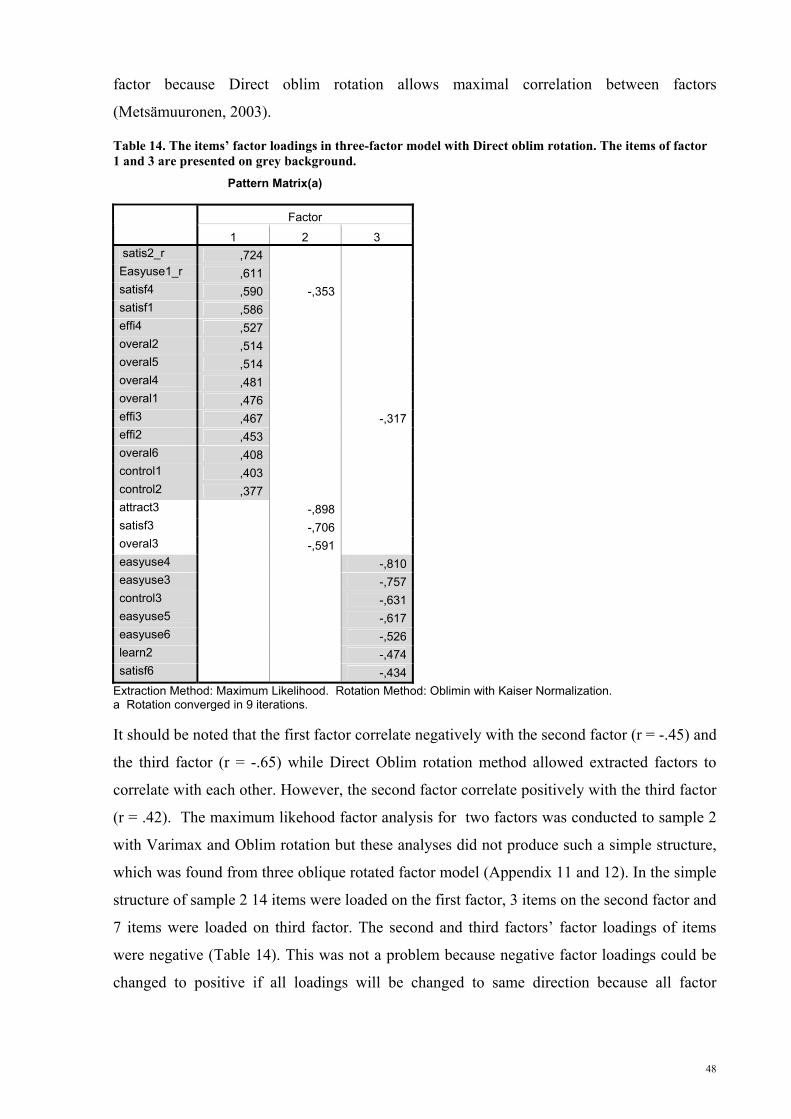
Table 14. The items’ factor loadings in three-factor model with Direct oblim rotation. The items of factor 1 and 3 are presented on grey background...............................................48
Table 15. The three-factor model of sample 2 which was consisted of 24 items.....................50
Table 16. The items with highest factor loadings of the NUEQ’s scale are described below in the table. ...........................................................................................................................51
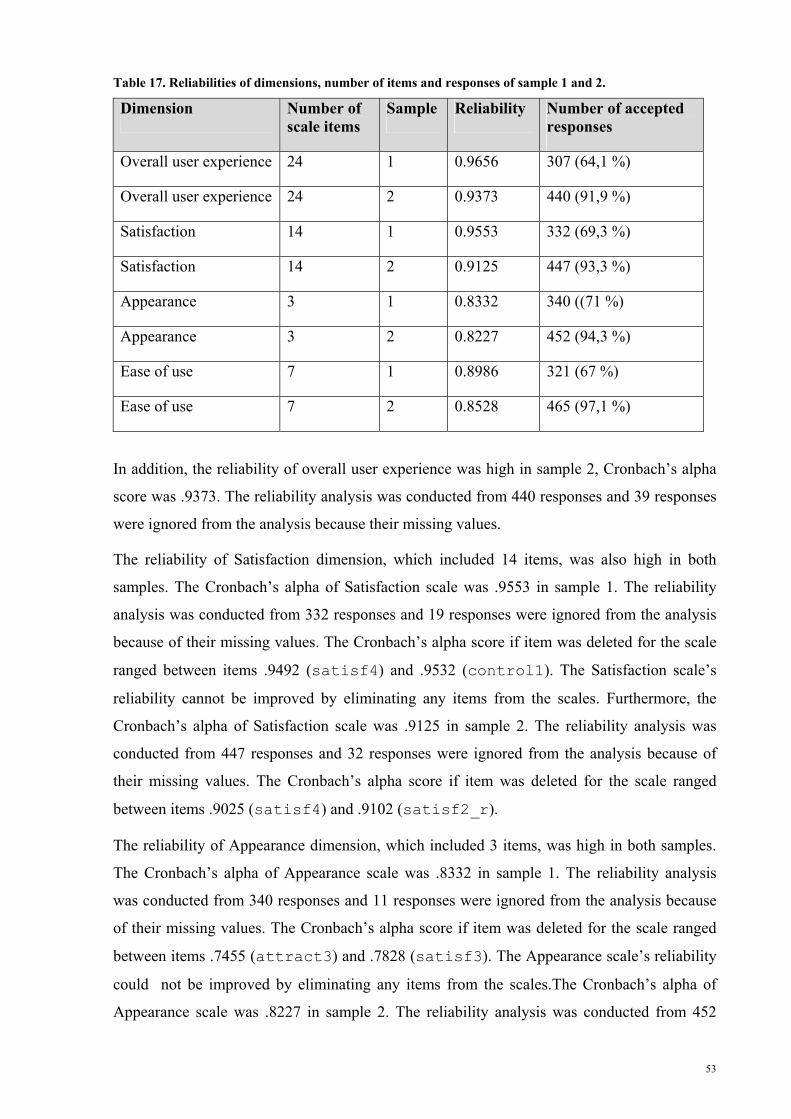
Table 17. Reliabilities of dimensions, number of items and responses of sample 1 and 2. .....53
IX
1 INTRODUCTION
In the recent years there has been explosion of Internet-based electronic banking applications
(Liao & Cheung, 2003). Beckett, Hewer & Howcroft (2000) states that the emergence of new
forms of technology has created highly competitive market conditions for bank providers.
However, the changed market conditions demand for banks to better understanding of
consumers' needs (Beckett et al., 2000).
Liao et al. (2003) stress that the success in Internet banking will be achieved with tailored
financial products and services that fulfill customer' wants, preferences and quality
expectations. Mattila (2001) concedes that customer satisfaction is a key to success in Internet
banking and banks will use different media to customize products and services to fit
customers' specific needs in the future. Liao et al. (2003) suggest that consumer perceptions of
transaction security, transaction accuracy, user friendliness, and network speed are the critical
factors for success in Internet banking. From this perspective, Internet banking includes many
challenges for human computer interaction (HCI) (Hiltunen, Heng, & Helgesen, 2004).
Hiltunen et al (2004) have remarked that there are at least two major HCI challenges in
Internet banking. The first challenge is related to the problem how to increase the number of
services of Internet banking and simultaneously guarantee the quality of service for individual
customers. The second challenge is related to the problem how to understand customer's
needs, translate them into targeted content and present them in a personalized way in usable
user interface. The HCI challenges of Internet banking have been poorly studied. Hiltunen et
al. (2004) imply that Internet banking research will concentrate more on HCI factors in the
future.
Recently, Lindgaard & Dudek (2003) emphasize that now is an ideal time for HCI researchers
to analyse user satisfaction, because there is growing interest in how to attract and increase
the number of online customers in e-business and e-commerce. Lindgaard et al. (2003) stress
that HCI researchers should reveal a structure of user satisfaction, determine how to evaluate
it and conclude how it is related to the overall user experience of online customers. However,
they admit that research on user satisfaction and user experience related to e-commerce and e-
business is its infancy. The current research aimed to clarify the dim concept of user
experience. The main goal was to operationalize this concept in the context of Internet
banking. In other words, the research objective was to develop a measurement tool to allow
the user experience of Internet banking customers to be evaluated and quantitatively
measured.
1
The Introduction chapter is divided into three subsections. First, the concept of electronic
banking is defined and the Internet banking situation in Finland is clarified. Second, the
concepts of usability, user satisfaction, and user experience are defined and user satisfaction
measurements are described. Finally, the research questions of this study are reported in
section three.
1.1 ELECTRONIC BANKING
The objective of this section is to define a concept of electronic banking, to describe its
benefits and challenges for banks and to clarify a changing Internet banking situation of
Finland. The electronic banking will be defined in the next section.
1.1.1 DEFINITION OF ELECTRONIC BANKING
The concept of electronic banking has been defined in many ways (e.g. Daniel, 1999).
According to Karjaluoto (2002) electronic banking is a construct that consists of several
distribution channels. Daniel (1999) defines electronic banking as the delivery of banks'
information and services by banks to customers via different delivery platforms that can be
used with different terminal devices such as a personal computer and a mobile phone with
browser or desktop software, telephone or digital television. The different forms of electronic
banking are summarized in Table 1.
Table 1. Different forms of banking in electronic banking (modified from Daniel 1999)
Form of banking Description
PC banking The customer installs banking software on his or her personal computer. The customer has access to his or her account with that specific software.
Internet banking Customer can access his or her bank account via the Internet using a PC or mobile phone and web-browser.
TV-based banking The use of satellite or cable to deliver account information to the TV screens of customers.
Telephone-based banking
Customers can access their bank and account via SMS and as well as by ordinary phone using services of interactive voice responses (IVR).
It should be noted that electronic banking is a larger concept than banking via the Internet
(Karjaluoto, 2002). The Internet is a main delivery channel for electronic banking and its
value to customers and banks is continuously increasing (Karjaluoto, 2002; Mattila, 2001).
2
In the current study, the term Internet banking refers to retail banking carried out by a
customer using an Internet-based banking application with a personal computer and web-
browser. The services included in the scope of the term consist of Household customer service
portfolio (payments, accounts, investments etc.) excluding, e.g. the services offered to
companies. Diverse banking channels will be described in detail from customer's point of
view in the next section.
1.1.2 CUSTOMERS AS USERS OF DIFFERENT BANKING CHANNELS
Hadden & Whalley (2002) observe that customers often simultaneously used many banking
channels. Hadden & Whalley (2002) point out that a challenge for banks is how to connect
with customers and provide financial services to them through the right channels, at the right
time and in the right way.
The HCI-related challenges in Internet banking are related to business interaction between the
bank and customer. Hadden & Whalley (2002) stress that it is crucial that the banking
interaction is suited the customer's life situation. From this perspective it is important to give
customers freedom to choose the most appropriate channel that best suits their preferences. In
addition, the type of business affects customers’ choice of channel. According to Hiltunen,
Laukka, & Luomala (2002), customers’ channel preferences vary between countries because
of cultural differences, use-habits and legislation.
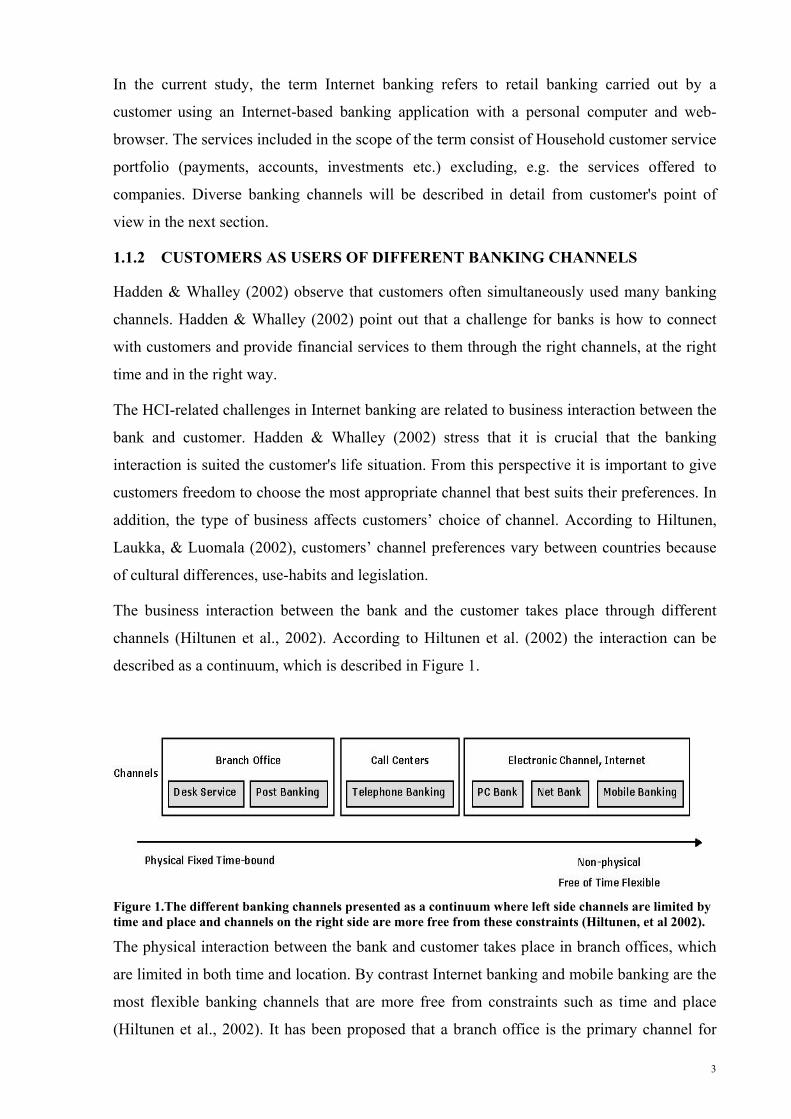
The business interaction between the bank and the customer takes place through different
channels (Hiltunen et al., 2002). According to Hiltunen et al. (2002) the interaction can be
described as a continuum, which is described in Figure 1.
Figure 1.The different banking channels presented as a continuum where left side channels are limited by time and place and channels on the right side are more free from these constraints (Hiltunen, et al 2002).
The physical interaction between the bank and customer takes place in branch offices, which
are limited in both time and location. By contrast Internet banking and mobile banking are the
most flexible banking channels that are more free from constraints such as time and place
(Hiltunen et al., 2002). It has been proposed that a branch office is the primary channel for
3
purchasing many financial products because it offers the customer a secure physical location
for the transaction of complex financial business with real people (Hadden et al., 2002)
However, The Finnish Banker's Association (2004b) concludes that Finnish retail banking
differs in many ways from typical retail banking in Europe. In Finland, the current trend is the
movement from traditional branch banking to electronic banking, which provides many
benefits, challenges, and opportunities for the whole banking sector (Karjaluoto, 2002)
From the customer's point of view, Internet banking offers new value to customer because it
makes available a full range of services that are not offered in branch offices (Karjaluoto,
2002). Modern Internet technology makes it possible to create customized banking services
for every individual customer (Mattila, 2001). According to Daniel (1999), customers' value
features in Internet banking such as convenience, increased choice of access to the bank,
improved control over their banking activities and finances, ease of use, speed and security.
From the banks perspective the main benefits of electronic banking are cost savings, reaching
new segments of the population, efficiency, cross selling, third-party integration, and
customer satisfaction (Hiltunen et al., 2004; Joseph, 1999). Wah (1999) remarks that the
success of banks operating via the Internet depends on their ability to attract and keep
customers. Sheshunoff (2000) admits that banks implement Internet banking services in an
attempt to create powerful barriers to customers exiting. In general, it has been reported that
Internet banking saves time and money, provides convenience and accessibility, and has a
positive impact on customer satisfaction (Karjaluoto, 2002; Mattila, 2001). To summarize,
Internet banking offers many benefits both to banks and their customers (Karjaluoto, 2002;
Mattila, 2001).
Despite of these benefits Internet banking includes many challenges. HCI-related challenge of
Internet banking is how to satisfy new online customer segments. Hiltunen et al. (2002) argue
that a key factor in this competition for online customers is the quality of customer service,
which includes usable user interfaces of Internet banking. From this perspective the usability
of Internet banking becomes an essential factor in the competition for online customers. It can
be stated that it is crucial to measure the user experience of the user interface in order to
estimate the quality of online customer service. Usability, user satisfaction and measurements
will be clarified in detail in the Usability of Internet Banking section. In the next section, the
changing Internet banking situation in Finland will be reported.
4
1.1.3 INTERNET BANKING IN FINLAND
The Finnish Banker's Association (2004a) reports that banks have made more than 2.8 million
electronic banking agreements with their customers based on statistics for 2002, and
commented that electronic banking services have been offered to retail customers by Finnish
banks for more than 20 years. It has been argued that Finland and Finnish banks are world
leaders in the use of banking technology and Internet banking in particular (Karjaluoto, 2002;
The_Finnish_Banker's_Association, 2004a). Karjaluoto (2002) notes that technology, in
particular the Internet, has been a key driving force behind the changes in the banking
services.
However, the expansion of electronic banking and Internet banking in particular could not
have taken place in Finland without willing customers (The_Finnish_Banker's_Association,
2004a) It is said that electronic banking services has been easy to implement and provide in
Finland because Finns have adopted financial networks as part of their everyday life
(The_Finnish_Banker's_Association, 2004a). It has been stated that Finns are eager to quickly
adopt a new technology (The_Finnish_Banker's_Association, 2004a). Their enthusiasm for
technology can be observed from statistics, which reveal that at the end of 2003 there were
4.7 million mobile phone connections in Finland. In addition, there were 9.4 Internet
connections, including both broadband and modem connections, in per 100 inhabitant
(Tilastokeskus, 2004a, 2004b). The Internet usage has steadily increased in Finland (Figure
2). The Finnish Bankers Association (2004a) reports that in 2004 71 % of Finns sometimes
used the Internet.
Figure 2. Internet usage among Finnish people (Finnish Banker’s Association 2004a).
5
The proportion of Finns who access the Internet from home is 70 % according to Statistics
Finland (Nurmela & Sirkiä, 2004) but a lower figure of 56 % was reported by the Finnish
Banker’s Association (2004b). While Statistics Finland states that over 50 % of Finns browse
the Internet from the work place Nurmela et al., (2004), the Finnish Banker’s Association
(2004b) reports the figure be one person in three. According to Nurmela et al., (2004) over 80
% of Finns aged between 15 and 74 years have occasionally used the Internet. However,
fewer than 50 % of them were daily users of Internet (Nurmela et al., 2004).
Mattila (2001) argues that the adoption of Internet banking in Finland is one of the highest in
the world. Nurmela et al., (2004) report that Finns who use the Internet at least sometimes and
belong to the age group of 15 to 74 years old, considered Internet banking safety. However,
almost 50 % of them reported that they do not buy a product via Internet even though they
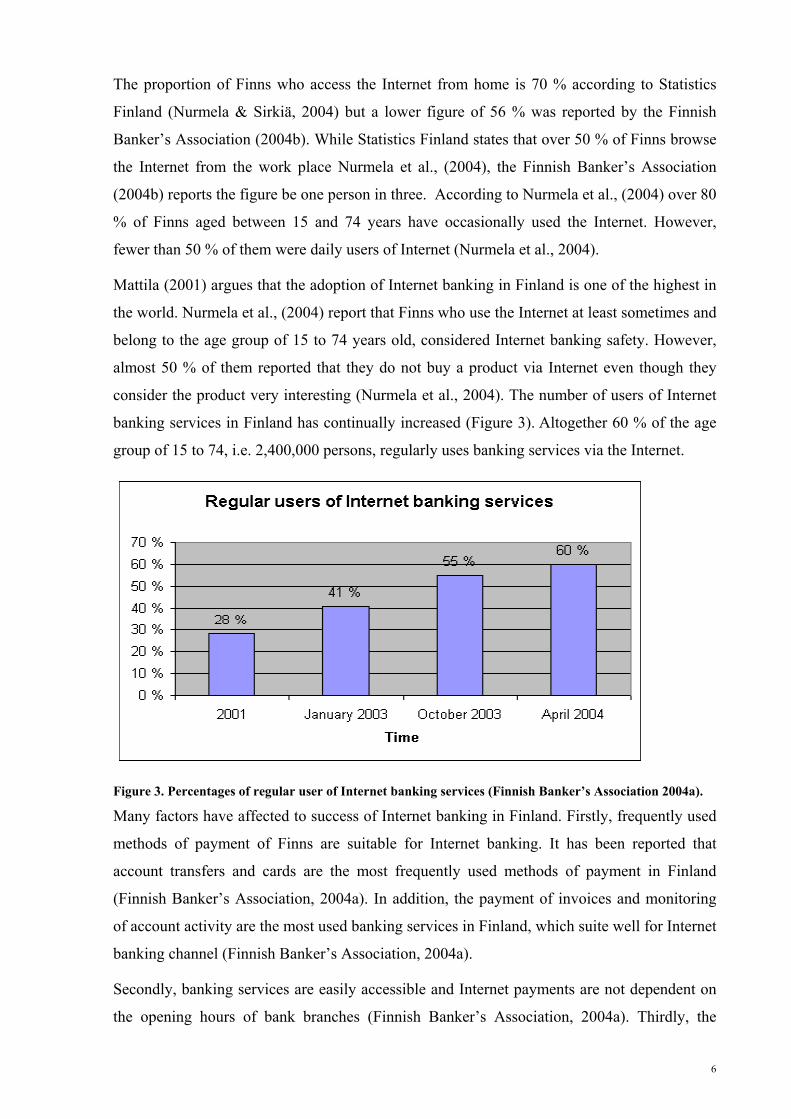
consider the product very interesting (Nurmela et al., 2004). The number of users of Internet
banking services in Finland has continually increased (Figure 3). Altogether 60 % of the age
group of 15 to 74, i.e. 2,400,000 persons, regularly uses banking services via the Internet.
Figure 3. Percentages of regular user of Internet banking services (Finnish Banker’s Association 2004a).
Many factors have affected to success of Internet banking in Finland. Firstly, frequently used
methods of payment of Finns are suitable for Internet banking. It has been reported that
account transfers and cards are the most frequently used methods of payment in Finland
(Finnish Banker’s Association, 2004a). In addition, the payment of invoices and monitoring
of account activity are the most used banking services in Finland, which suite well for Internet
Secondly, banking services are easily accessible and Internet payments are not dependent on
the opening hours of bank branches (Finnish Banker’s Association, 2004a). Thirdly, the
6
availability of banking services has improved in recent years (Finnish Banker’s Association,
2004a). Banking via Internet can be done using different terminal devices for example with
personal computer or mobile phone and web browser or PC banking software.
The success of Internet banking in Finland has created a competitive market for banks.
Karjaluoto (2002) states that banks concentrate heavily on managing and satisfying customers
with different delivery channels, particularly channels via the Internet. In addition, it has been
said that online customers prefer usable and accessible services that they feel comfortable and
secure with (Hiltunen et al., 2004). Internet banking services rely on appropriate methods to
measure the current level of customer user experience to make improvements.
The present research attempted to address the problem of how to analyse and measure
customers’ user experience of Internet banking services from the perspective of usability and
aesthetics. In the following sections concepts such as usability, user satisfaction, usability of
Internet banking and user experience, which are crucial for measuring user experience will be
analysed in detail.
1.2 USABILITY OF INTERNET BANKING
The usability of Internet banking is a poorly studied field in the academic literature because
majority of studies relate to usability of Internet banking are carried out by consultants and
results and reports are mostly confidential. This fact makes it difficult for a researcher to
know what has been studied recently in the field of usability of Internet banking. However,
Johnson (1996) emphasizes that trust, privacy, the system’s conceptual model and the nature
of feedback are the crucial factors concerning the usability of Internet banking. These
essential factors will be examined in detail in the Internet banking guideline presented by
Serco Usabilty Services (2000). First, the conceptual model of systems, which is related to
two usability attributes perceived controllability and efficiency, will be clarified. Second, the
nature of feedback will be examined. Finally, the concept of trust and privacy will be
analyzed in detail.
From the perceived controllability perspective Internet banking design guidelines of Serco
(2000) state that users often have high expectations of Internet banking sites and they are
frustrated if they have to call up with telephone for further information that they cannot find
from the service. Furthermore, the guidelines (2000) argue that Internet-based banking
applications should provide as much functionality as possible to enable users to find all the
information they require and complete their enquires online. In addition, Internet banking is
perceived as a serious business and users do not visit Internet banking sites for entertainment.
7
For these reasons, it can be argued that controllability is a key factor in the usability of
Internet banking.
Another aspect of the conceptual model of the system relates to perceived efficiency. The
Internet banking design guidelines of Serco (2000) state that the user’s main reason for using
Internet banking is the speed of the service. According to the guidelines (2000) online
financial services should allow users quick access to information they want, the application
form should be as short as possible and orientation cues should be provided to users when
they are progressing through multiple screen forms. In addition, the guidelines (2000) note
that offered interactive features that are provided by Internet-based banking applications
should be relevant to the goals and concerns of customers. From this perspective, the
perceived efficiency of Internet-based applications is an important factor for the usability of
Internet banking.
The nature of feedback is also an important factor for the usability of Internet banking
(Johnson, 1996; Serco_Usabilty_Services, 2000). The guidelines of Serco (2000) stress that a
clear feedback should always be provided on financial transactions that have been carried out
online. Furthermore, the guidelines (2000) remark that key words that are clear to users
should be used in Internet-based banking applications.
The concept of trust and privacy are essential factors for the usability of Internet banking
(Johnson, 1996; Serco_Usabilty_Services, 2000). The guidelines of Serco (2000) stress that
clear clues on the security measures of the online services should be provided to customers
because they are often concerned about the privacy of information when they enter online.
Johnson (1996) points out that a core usability challenge for Internet banking is to provide
basic financial services in an easy to use manner. In other words, the basic financial services
should be provided in such a way that users perceive the Internet-based banking application as
trustworthy, and easy and efficient to use.
To summarize perceived controllability, efficiency, trustworthiness and the nature of feedback
are key factors for the usability of Internet banking. Johnson (1996) stress that assessing
differences in customers’ perceptions of usability will produce useful information that is
essential in the design of future Internet banking user interfaces. In the next section the
concept of usability will be defined in order to clarify how user satisfaction and user
experience are related to usability.
8
1.2.1 DEFINITIONS OF USABILITY
In this section the concept of usability will be defined. In addition, those usability attributes
that were selected in the present research to define the concept of customer user experience in
the Internet banking context will be clarified.
The concept of usability has been defined in many ways in the academic literature (Nielsen,
1993; Shneiderman & Plaisant, 2005). Nielsen (1993) stresses that usability is not a single,
one-dimensional property of a user interface, and argues that usability could be defined by
using five attributes, which are learnability, efficiency, memorability, errors and satisfaction.
A formal and stricter definition of the term is derived from the ISO 9241-11 (1998) standard,
which defines usability as:
The extent to which a product can be used by specified users to achieve specified goals with effectiveness, efficiency and satisfaction in a specified context of use.
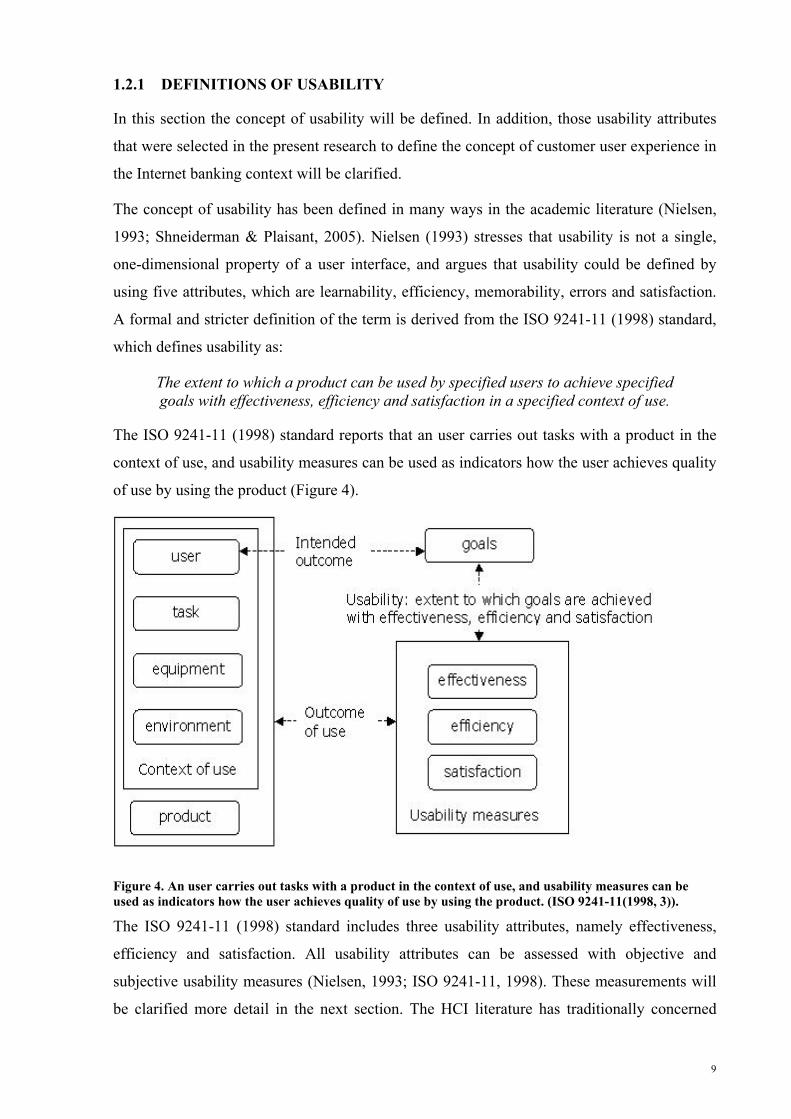
The ISO 9241-11 (1998) standard reports that an user carries out tasks with a product in the
context of use, and usability measures can be used as indicators how the user achieves quality
of use by using the product (Figure 4).
Figure 4. An user carries out tasks with a product in the context of use, and usability measures can be used as indicators how the user achieves quality of use by using the product. (ISO 9241-11(1998, 3)).
The ISO 9241-11 (1998) standard includes three usability attributes, namely effectiveness,
efficiency and satisfaction. All usability attributes can be assessed with objective and
subjective usability measures (Nielsen, 1993; ISO 9241-11, 1998). These measurements will
be clarified more detail in the next section. The HCI literature has traditionally concerned
9
merely effectiveness and efficiency and satisfaction has been seen as a by-product of good
usability (Lindgaard et al., 2003). In addition, the term satisfaction is a quite weak term
because it can mean “adequate” of “just good enough” interaction of users.
In the current research, the usability attribute of effectiveness in the ISO 9241-11 (1998)
standard was excluded from definition of user experience because it can be measured much
more effectively with objective measures and this research was conducted with subjective
measures. The usability attributes of efficiency and satisfaction, which were defined by
Nielsen (1993) and the ISO 9241-11 (1998) standard, were examined in this research with
subjective questionnaire measures. The ISO 9241-11 (1998) standard defined efficiency as:
Resources expended in relation to the accuracy and completeness with which users achieve goals.
In addition, the standard defined satisfaction as:
Freedom from discomfort, and positive attitudes towards the use of the product
Furthermore, learnabilty and memorability of Nielsen (1993) were included in an operational
definition of user experience in Internet banking. In the following section the concepts of user
satisfaction and user experience are analysed in detail.
1.2.2 MEASUREMENTS OF USER SATISFACTION
In this section, the concepts of user satisfaction and user experience will be analysed and the
user satisfaction and usability scales, which were utilized in this research, are introduced.
First, the concepts user satisfaction and user experience are defined based on previous
research. The theoretical framework of user experience used in the current study will be
introduced in the next section. Second, psychometric details of user satisfaction and usability
scales are reported. Hence, a typical subjective measurement questionnaire is referred to as a
scale, which refers to a composite measurement which based on responses to a number of
items (Likert or semantically differential scale), and which tries to reveal dimensions of
theoretical variables that cannot assess by direct means (DeVellis, 2003; Lewis, 2002). In the
current study an item refers to a statement for which a participant selects a level of response
(Lewis, 2002).
The concept of user satisfaction has been used since the early 1980 (Bailey & Pearson, 1983;
Ives, Olson, & Baroudi, 1983) and the end user computing satisfaction have been studied
since the 1980 (Bailey & Pearson, 1983; J. Chin, Diehl, & Norman, 1988; Ives et al., 1983;
Rivard & Huff, 1988; Rushinek & Rushinek, 1986). Bailey et al. (1983) state that several
factors affect the user satisfaction and it can be seen as a bi-dimensional attitude. The user
10
satisfaction can be seen sum of user’s feeling and attitudes toward several factors that affect
the usage situation (Bailey et al., 1983).
Recently, there has been growing interest in user experience (Hiltunen et al., 2002; Lindgaard
& Dudek, 2003; Wilson & Sasse, 2004), which can be seen as much larger concept than user
satisfaction. User experience has become an important factor in e-business because the end
user often pays for the majority of new products and services, which indicates that new
products characteristics such as perceived usability, usefulness, appeal and value of money
must be matched or exceeded with user expectations toward the product (Wilson & Sasse,
2004). From this perspective, assessing the user experience is essential for many technology
products and services (Wilson & Sasse, 2004).
Lindgaard & Dudek (2003) state that user experience consists of some senses of
"satisfaction". They define user satisfaction as a subjective sum of the interactive experience.
Recently, Tractinsky, Katz, & Ikar (2000) show that perceived aesthetics and perceived
usability correlated strongly with each other. They argue that "beauty" or "appeal" is linked to
the perceived usability, and consequently what is seen as beautiful is also perceived as usable.
However, Lindgaard & Dudek (2003) argue that those business to consumer (B2C) web sites
which got high appeal scores but low perceived usability score from users yielded very high
satisfaction, but low perceived usability scores, suggesting that what is perceived as beautiful
need not also be perceived to be usable.
Lindgaard & Dudek (2003) emphasize that aesthetics, emotion, expectation, likeability and
usability all influence the interactive experience, but their significance depends on the current
situation. Furthermore, they argue that usability is a important factor in experiencing
interactive B2C sites, but it is not known is user interaction with B2C sites whether usability-
or satisfaction driven. Their results suggested that web designers should pay attention to both
visual appeal and usability. Bailey et al., (1983) report that the HCI research needs a clear
definition of user satisfaction, including a complete and valid set of factors and instrument
that measures this phenomenon. Lindgaard & Dudek (2003) add that HCI researchers should
formulate a clear user experience notion, where the relationship between satisfaction, appeal,
perceived and actual usability would be determined. User satisfaction and usability
measurements will be next clarified.
In general, user interfaces can be evaluated in many ways (J. Chin et al., 1988). In addition, it
has been stated that each component of usability such as effectiveness, efficiency and
satisfaction can be examined by using either objective or subjective measures (Nielsen, 1993;
ISO 9241-11, 1998). User satisfaction has mainly been examined with subjective
11
measurements such as a multiple-item user questionnaire (J. Chin et al., 1988; Lewis, 2002;
Lindgaard & Dudek, 2003). Furthermore, the subject satisfaction, which is measured in user
test, has been also used as a indicator of user satisfaction, but results are contradictory (Notes
& Swan, 2003). Recently, other approaches such as the objective measurement of user
experience have been introduced (Wilson & Sasse, 2004).
Wilson & Sasse (2004) show that in some cases objective psychophysiological measures such
as skin conductance, heart rate and blood volume pulse can reveal users’ responses toward
product which they are either not aware of, or cannot recall at subjective assessment session
after the test. However, there are several problems in using physiological measures to analyse
user satisfaction and user experience. For example, data analysis and learning to use the
equipment are time consuming, and equipment and sensors are financial costly (Wilson &
Sasse, 2004). Furthermore, interpretation of user’s mental process and experiences contain
difficult problems even in studies where a clear cause and effect relationship has been
revealed (Ward & Marsden, 2004). Because of these problems of physiological measures,
this research concentrated on examining how the user experience of Internet banking can be
evaluated by using subjective measures.
Many studies have concentrated on developing tools to measuring user satisfaction (J. Chin et
al., 1988; Rivard & Huff, 1988), user information satisfaction (W. Chin & Lee, 2000; Ives et
al., 1983) and usability (Lin, Choong, & Salvendy, 1997). In general, the user satisfaction
measurements have been questionnaire scales for which either a Likert or a semantic
differential scale have been used. In this research, four psychometrically tested usability and
user satisfaction questionnaire measurements formed the basis of a developed user experience
questionnaire, Nordea User Experience Questionaire (NUEQ). None of the questions of
previous inventories were used directly and they were modified to fit the Internet banking
context. The international usability questionnaire measurement instruments were the QUIS,
PUTQ, PSSUQ and SUMI. Furthermore, the developed NUEQ’s scale included questions
from Nordea’s previous user questionnaire. These measurement instruments will be
introduced below. The longer version of NUEQ’s scale structure is described in detail in
Appendix 1.
QUIS
The first measurement instrument used in the current research was the Questionnaire for User
Interface Satisfaction (QUIS). J. Chin et al., (1988) developed a QUIS instrument for
measuring user satisfaction of the human computer interface at the University of Maryland.
The QUIS has gone through several psychometric development phases and shorter (47 items)
12
and longer versions (126 items) of the QUIS are available. The longer QUIS version 5.0 was
used in this research as an inspirational source.
The QUIS 5.0 consisted of six scales, which are overall reactions to the software, screen,
terminology, system information, learning and system capabilities. The first scale relating to
overall reactions to the software consisted of six questions and the other five scales include 20
questions per each. The scaling of items ranges from 1 to 9 and additional "no answer" option
is available. The endpoints of the scales are anchored by pairs of adjectives (e.g. difficult /
easy). The adjective pair is always positioned so that the scale goes form negative on the left
to positive to right. The overall reliability of QUIS 5.0 is high, Cronbach alpha = .94, but no
separate reliability measures of the five-subscale have been reported. The questions from the
QUIS used in this study are reported in the Methods section.
PUTQ
The second measurement instrument used in the current research was the Purdue Usability
Testing Questionnaire (PUTQ). The developers of PUTQ criticized the QUIS because it
primarily measures user's satisfaction toward a user interface (Lin et al., 1997). In contrast,
they argue that usability of the software systems not only user's satisfaction can be measured
with the PUTQ.
Lin et al., (1997) developed a 100-items measure for which they postulate a priori eight
different categories which were compatibility, consistency, flexibility, learnability, minimal
action, minimal memory load, perceptual limitation and user guidance. The semantically
differential scale, where items ranges from 1 to 7 and additional “no applicable” option was
available, were used in the PUTQ. The endpoints of the scales were anchored by pairs of
They emphasize that the eight factors of the PUTQ are relevant to HCI, but they did not
conduct a factor analysis of their data, which would have given an empirical results on how
the items are loaded on these eight factors. The development process of the PUTQ is based on
an assumption that user satisfaction is correlated with other usability measures such as
effectiveness, efficiency and learnability. In the factor analysis context it means that the
factors will correlate with each other and oblique rotated methods should be used in factor
analysis. This was also a basic assumption in the current research. The questions from the
PUTQ used in this study are reported in the Methods section.
13
PSSUQ
The third measurement instrument used in the current research was the Post Study System
Usability Questionnaire (PSSUQ) which was originally developed in an international IBM
project in the late 1980 entitled SUMS (System usability MetricS) (Lewis, 2002). The current
version of the PSSUQ is a 19-item instrument designed for the purpose of assessing users’
perceived satisfaction with their computer systems (Lewis, 2002). Each item of the PSSUQ
consists of a 7-point Likert scale with which the users rate the responses. The factor analysis
was conducted to the PSSUQ using data from 5 years of usability studies and the results
indicated a three-factor structure that was consistent with initially described factor structure
(Lewis, 2002). The PSSUQ consists of factors which were named System usefulness,
Information quality and Interface quality.
The following questions examples are used in PSSUQ:
• Overall, I am satisfied with how easy it is to use this system
• It was simple to use this system
• I could effectively complete the tasks and scenarios quickly using this system
• It was easy to learn this system
• It was easy to find the information I needed
The overall reliability of the PSSUQ consisting of 19 items was 0.96. The reliabilities of the
factors System usefulness, Information quality and Interface quality were 0.96, 0.92, 0.83,
respectively It should be noted that many items of PSSUQ were used simultaneously in
several sum variables which resulted in sum variables being highly correlated with each other.
The questions from the PSSUQ used in this study are reported in the Methods section.
SUMI
The fourth measurement instrument used in the current research was the Software Usability
Measurement Inventory (SUMI). Kirakowski & Corbett developed the SUMI questionnaire,
in the early 1990 at the University College of Cork in Ireland, to measure a user perceptions
of software usability (Lewis, 2002). The SUMI consists of a 50-item questionnaire which has
undergone through several psychometric tests (van Veenendaal, 1998). Each question of the
SUMI is answered with "agree", "undecided" or "disagree". The SUMI measures global
usability with five subscales: Efficiency, Affect, Helpfulness, Control and Learnability. The
following questions examples are used with the SUMI:
• This software responds too slowly to inputs
14
• The instructions and prompts are helpful
• Working with this software is satisfactory
• The way that system information is presented is clear and understandable
• I think this software is consistent
The biggest strength of the SUMI is that it has been used to develop a standardized database
consisting of over 2000 usability profiles of different kinds of applications. The standardized
database enables the usability of any application to be compared with the average usability
rating of over 2000 applications. Furthermore, the SUMI questionnaire is available in English
(UK and US), French, German, Dutch, Spanish, Italian, Greek and Swedish (van Veenendaal,
1998). To summarize, the SUMI is the only available questionnaire of the assessment of
usability of software, which have been developed, validated and standardized on a European
wide basis. (van Veenedaal, 1998). However, the SUMI questionnaire uses a three-point
Likert-scale, for which the reliability can be low because item's a lack of variance
(Metsämuuronen, 2002). The questions from SUMI used in this study are reported in the
Methods section.
The NUEQ’s scale that was created in this study from the above user satisfaction and usability
scales included 40 items. The structure of the NUEQ is described in detail in the Methods
section while the structure of longer version of NUEQ’s scale is presented in Appendix 2. In
the next section the concept of user experience will be clarified.
1.2.3 DEFINITION OF USER EXPERIENCE
In this section user experience concept is defined and its components, which were adapted to
the current research, are described. The user experience is affected by user expectations
toward to the service and service provider and user's perceptions of interaction with the
service. First, role of expectations in user experience is described. Second, role of user's
perceptions in user experience is clarified. W. Chin & Lee (2000) point out that user's a priori
and post hoc product usage perceptions are affected by his or her expectations and desires.
Furthermore, it has been argued that user experience cannot be accounted without take into
account how expectations affect user's perception (Hiltunen et al., 2002).
According to Neisser (1976) human perception of an object is a constructive process, which
consisted of stages such as exploration, perception of stimuli from the object and schemata.
Neisser’s (1976) perception cycle is depicted in Figure 5.
15
Figure 5. Neisser's (1976, 21) perceptual cycle where a schema of an user (mental model) directs exploration of information. As a result the user selects samples from objects and selection modifies the original schema of the user.
Neisser (1976) argues that user's perception can be seen as an out put of the whole cycle.
Overall, a creation of user perception begins when a user's schema directs his or her
information explorations from the environment. The user takes samples of available
information and provides results of exploration, which modifies his or her original schema.
The user's schema is often termed as a mental model in HCI literature (Norman, 1991; Otter
The components of user experience are presented in Figure 6.
Figure 6. User’s information gathering from a product is directed by his or her expectations. During the information gathering the user produces perceptions, which he or she interprets. The interpreted perceptions form an user experience of the product.
17
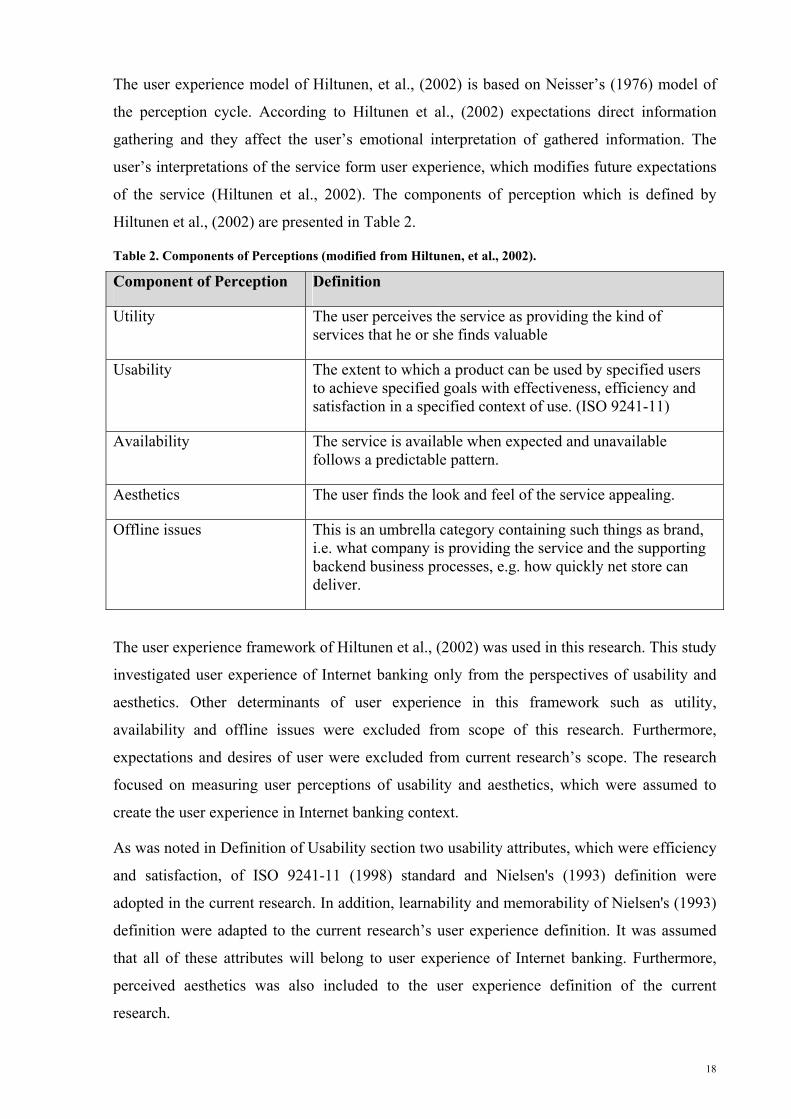
The user experience model of Hiltunen, et al., (2002) is based on Neisser’s (1976) model of
the perception cycle. According to Hiltunen et al., (2002) expectations direct information
gathering and they affect the user’s emotional interpretation of gathered information. The
user’s interpretations of the service form user experience, which modifies future expectations
of the service (Hiltunen et al., 2002). The components of perception which is defined by
Hiltunen et al., (2002) are presented in Table 2.
Table 2. Components of Perceptions (modified from Hiltunen, et al., 2002).
Component of Perception Definition
Utility The user perceives the service as providing the kind of services that he or she finds valuable
Usability The extent to which a product can be used by specified users to achieve specified goals with effectiveness, efficiency and satisfaction in a specified context of use. (ISO 9241-11)
Availability The service is available when expected and unavailable follows a predictable pattern.
Aesthetics The user finds the look and feel of the service appealing.
Offline issues This is an umbrella category containing such things as brand, i.e. what company is providing the service and the supporting backend business processes, e.g. how quickly net store can deliver.
The user experience framework of Hiltunen et al., (2002) was used in this research. This study
investigated user experience of Internet banking only from the perspectives of usability and
aesthetics. Other determinants of user experience in this framework such as utility,
availability and offline issues were excluded from scope of this research. Furthermore,
expectations and desires of user were excluded from current research’s scope. The research
focused on measuring user perceptions of usability and aesthetics, which were assumed to
create the user experience in Internet banking context.
As was noted in Definition of Usability section two usability attributes, which were efficiency
and satisfaction, of ISO 9241-11 (1998) standard and Nielsen's (1993) definition were
adopted in the current research. In addition, learnability and memorability of Nielsen's (1993)
definition were adapted to the current research’s user experience definition. It was assumed
that all of these attributes will belong to user experience of Internet banking. Furthermore,
perceived aesthetics was also included to the user experience definition of the current
research.
18
It should be noted that what was measured in this research study was user perception of easy
of use, control, attractiveness, efficiency, satisfaction and security of Internet banking rather
than objective degree of these usability attributes. The structure of developed user experience
measurement, which included usability and aesthetics dimensions, was described in detail in
Methods section.
1.3 THE AIMS OF STUDY
The target of this research was to develop and produce a scientifically approved survey
measurement with which user experience could be statistically measured among Internet
banking customers. An outcome of this research was a survey measurement tool and a Master
thesis in Cognitive Science. This survey method was developed in Finland but it can also be
applied with minor changes in other Nordic countries as well.
Two user groups were examined in the current research. The first user group, who were pilot
users, used a new version of Internet-based banking application for which they conduct they
banking issues. The second user group, who were customers of Nordea, used Internet-based
banking application, which has been in production stage for many years. A main goal for this
research was to operationalise user experience of Internet banking by developing a new
measurement instrument, Nordea User Experience Questionnaire (NUEQ) for empirical
testing. In addition, the research tried to evaluate if the same user experience factor structure
could be found from both samples. Furthermore, Nordea Bank Finland was interested in user
experience differencies between user groups but this question was not a primary research
question for the this study. The studied phenomenon the concept of user experience of
Internet banking is illustrated Figure 7.
19
Figure 7. The studied phenomenon, the user experience of Internet banking is diagrammed above. The financial services of banking system are delivered through an Internet banking user interface for which an user uses and his or her user experience is created by the Internet banking interaction.
The research questions were developed based on a review of the literature in Introduction
section. The primary question of this research related to the dimensional structure of user
experience of Internet banking. To answer this primary research question, it was necessary to
answer the following research questions:
• How can the user experience of Internet banking customers be measured?
• Is the factor structure of user experience similar among customers who use different Internet-based banking applications?
• How reliable is each part of the survey measurement as evaluated by using Cronbach’s alpha?
It was assumed that answering these secondary questions the primary questions can be also be
answered. The practical goals for this research were the following:
• To reduce the length of the original user experience scale with exploratory factor analysis while maintain reasonable levels of reliability of the scale and items, which contain most information about user experience.
• To develop a psychometrically studied short form of the quantitative instrument for evaluating user experience of Internet banking.
• To clarify groups of items of the scale, which could be seen as dimensions of user experience in Internet banking.
20
To summarize, this research tried to accomplish two objectives. The first objective was to
clarify what is the structure of user experience in Internet banking context. The second
objective was to develop a scale for which this user experience of Internet banking can be
evaluated quantitatively.
2 METHODS
The purpose of this chapter is to describe used online questionnaires, to report information
about users, to clarify a data colleting process, to justify scale-constructing process, and to
make clear an expected structure of developed NUEQ’s scale. In the next section the materials
will be described in detail.
2.1 MATERIALS
The first sample was collected with a longer version of the NUEQ. Two similar online
questionnaires were used in this stage (Appendix 1). The questionnaires were both in Finnish
and in Swedish. Each questionnaire allowed an user to evaluate his or her user experience of
Internet banking in his or her native language. The questionnaire consisted of questions:
Likert questions and questions that include bipolar adjective pairs
The online questionnaire contained seven different parts. The first part of a questionnaire
consisted of 6 demographic questions. The second part of questionnaire consisted of 6 scale’s
questions, which deal with overall Internet banking user experience. A semantic differential
scale on 1-5 was in this part of questionnaires. The third part of questionnaire consisted of 15
scale’s questions, which concerned characteristics of Internet-based banking application. In
this section respondents were asked to answer on five-point Likert scale
The forth part of questionnaire included 19 scale’s questions, which handled characteristics of
Internet bank. A semantic differential scale on 1-5 was used in this section of questionnaires.
The fifth part of a questionnaire coped with an importance of Internet banking services. This
part of questionnaire were implemented by using 1-6 Likert scale where reply options were 1
The sixth part of questionnaire consisted of 4 open questions, which dealt with expectation,
opinions and suggestions for Internet bank. In this part of questionnaire respondents had an
opportunity to give feedback in their own words about the characteristics of Internet bank.
The seventh part of questionnaire contained two text fields for which respondents could input
their name and phone number if they wanted to participate to allotment.
21
In general, the longer version of NUEQ consisted total of 59 questions. The questionnaires
included 55 closed questions and 4 open questions per each. 40 items of the questionnaires
were related to the longer version of the NUEQ’s scale. All respondents could participate to
allotment by giving their name and phone number to text fields, which were at end part of
questionnaire.
The second sample was collected with a shorter and improved version of the NUEQ. The
shorter version of the NUEQ consisted of 6 demographic, 7 Interent banking services, and 26
scale questions. The questionnaires were both in Finnish and in Swedish. Each questionnaire
allowed an user to evaluate his or her user satisfaction and user experience in his or her native
language. Five-point Likert and semantic differential scales were used to measure user’s
responses. The structure of the questionnaire will be described in detail in the section 3.2.1
The Structure of the shorter version of the NUEQ. Subjects, who participated in the current
study, will be described in the next section.
2.2 SUBJECTS
Two independent Internet banking user populations were examined. The first examined user
population were pilot users of a new version of the Internet-based banking application. A
sample 1, which consisted of pilot users, was gathered between 19th of November 2004 to 9th
of January 2005 using the longer version of the NUEQ. The sample 1 consisted of 351 online
answers of respondents.
The second examined user population were customers who used an existing Internet-based
banking application, which have been in production stage for many years. A sample 2 was
gathered on 11th of February and between 14th of February to 22nd of February 2005 using the
shorter version of the NUEQ. The sample 2 consisted of 479 online answers of respondents.
Distributions of both samples were compared and they were approximately similar in
demographic information such as language, gender, age, usage frequancy, Internet banking
service experience, usage context, and connection type (Appendix 1).
2.3 PROCEDURE
In the current study two data sets were gathered in almost similar way. The demographic
information of both samples was described in detail in above section. In this section the data
gathering process will be described.
The data of both samples was gathered by using two online questionnaires where questions
were either in Finnish or in Swedish. The questionnaires were described in Materials section
22
and the structure of the NUEQ’s scale will be analysed in the Measures section. The whole
data gathering process included three phases that will be described next.
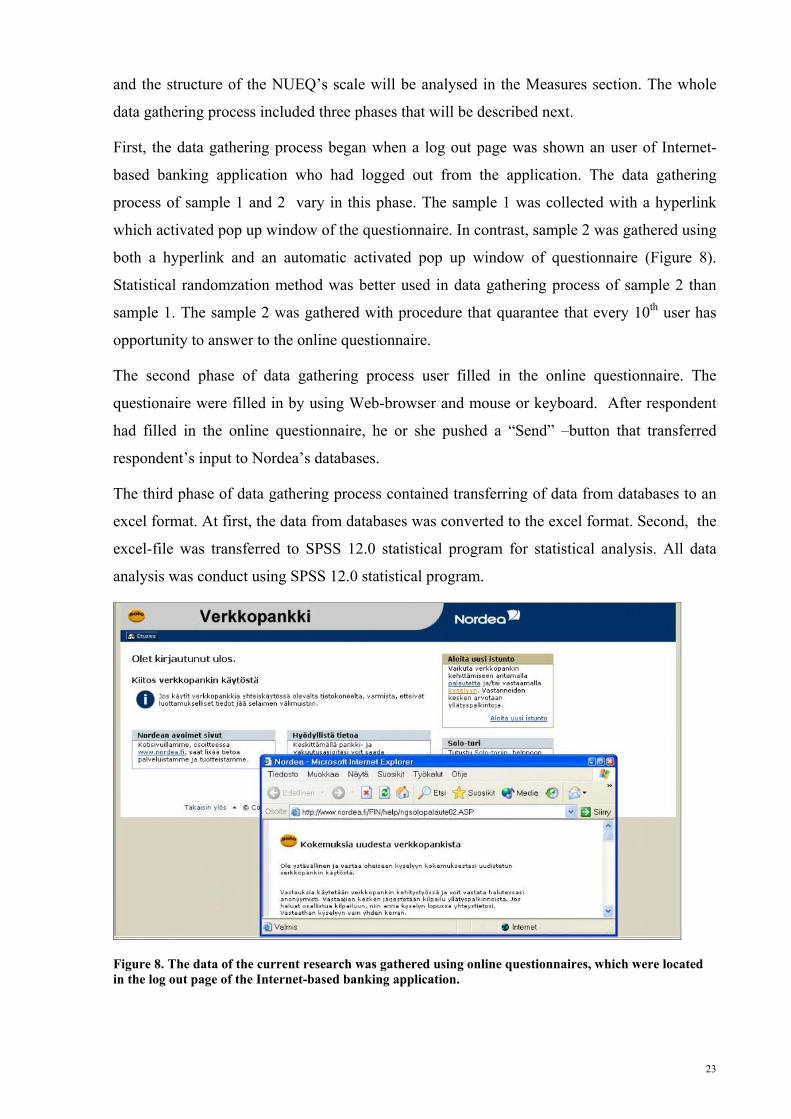
First, the data gathering process began when a log out page was shown an user of Internet-
based banking application who had logged out from the application. The data gathering
process of sample 1 and 2 vary in this phase. The sample 1 was collected with a hyperlink
which activated pop up window of the questionnaire. In contrast, sample 2 was gathered using
both a hyperlink and an automatic activated pop up window of questionnaire (Figure 8).
Statistical randomzation method was better used in data gathering process of sample 2 than
sample 1. The sample 2 was gathered with procedure that quarantee that every 10th user has
opportunity to answer to the online questionnaire.
The second phase of data gathering process user filled in the online questionnaire. The
questionaire were filled in by using Web-browser and mouse or keyboard. After respondent
had filled in the online questionnaire, he or she pushed a “Send” –button that transferred
respondent’s input to Nordea’s databases.
The third phase of data gathering process contained transferring of data from databases to an
excel format. At first, the data from databases was converted to the excel format. Second, the
excel-file was transferred to SPSS 12.0 statistical program for statistical analysis. All data
analysis was conduct using SPSS 12.0 statistical program.
Figure 8. The data of the current research was gathered using online questionnaires, which were located in the log out page of the Internet-based banking application.
23
2.4 MEASURES
In this chapter a scale development process will be described and the NUEQ’s scale structure
will be presented. The first section will clarify the phases of the scale development. The
second section will reveal the longer version of the NUEQ’s scale structure. The final section
will consider issues concerning constructing and implementing the questionnaire and the
NUEQ’s scale.
2.4.1 PHASES OF SCALE DEVELOPMENT
In the current research the NUEQ’s scale was developed using principles of Metsämuuronen
(2000b) and DeVellis (2003). Their principles of scale development are the following:
1. Determine clearly what it is you want to measure
2. Generate an item pool
3. Determine the format for measurement
4. Have the initial item pool reviewed by experts
5. Consider inclusion of validation items
6. Administer items to a development sample
7. Evaluate the items
8. Optimise scale length
The first phase was described in Introduction. Phases 2 to 6 will be described in this and the
following section. Phases 7 and 8 will be described in detail in Results section.
In the first phase a scale development process begins when a researcher has invented a
question for which he or she wants to get an answer (Metsämuuronen, 2000b). This question
was how to measure customers’ user experience of Internet banking quantitatively in the
current research.
Furthermore, the scale development requires that the researcher have learnt relevant theories
about the studied phenomenon in order to operationalize essential concepts (Metsämuuronen,
2000b). In the current research this phase contained theoretical orientation to academic
literature about electronic banking, usability, user satisfaction and user experience. Several
difficulties were confronted in a literature review because customers’ user experience of
Internet banking is poorly studied academic field and majority of results, which are
contributed by consultants, are reported as classified reports.
24
The second phase began when the objectives of this research were clear, an item pool was
generated using modified questions of inventories that were described in Introduction section.
This phase will be described in detail in Constructing of NUEQ’s scale section.
The third and forth phases began when the NUEQ was created and implemented as an online
questionnaire. The NUEQ was pilot tested when the hyperlink was sent by email to
employees and managers of Nordea Netbanking section. They filled in the questionnaire and
gave feedback from the questionnaire. The NUEQ was tested for 10 pilot users. The confused
questions, which were reported by NUEQ’s pilot respondents, were changed to more
comprehensible form. Furthermore, two employees from Nordea who have competence in
usability issues reviewed the NUEQ. Two questions were removed from the NUEQ and a
couple of questions’ wordings were changed because of the expert review meeting.
The fifth and sixth phase began when the longer version of NUEQ, which consisted of 40
scale’s items, was implemented and first sample was gathered. The seventh and eight phases
of how scale’s items were removed will be described in detail in Results section.
2.4.2 SCALE STRUCTURE OF THE NORDEA USER EXPERIENCE QUESTIONNAIRE
In this research the scale development of the NUEQ was based on a concept of latent variable.
DeVellis (2003) states that a phenomenon or construct that affect a scale’ items is called the
latent variable. The latent variable cannot be directly measured but different items, which are
affected by latent variable, can be assessed. Correlations between scale’s items and the latent
variable cannot be estimated but those items, which correlated strongly with each other, are
assumed to be indicators of the same latent variable (DeVellis, 2003).
In the current research a main goal was to find scale’s items, which were connected to latent
variables of user experience of Internet banking. It was assumed that those factors, which will
be constructed by using exploratory factor analysis, would be latent variables of user
experience.
It was assumed, based on the previous research results in Introduction, that user experience
consisted of two latent variables: perceived usability and perceived aesthetics (Table 3). The
other components of user experience in Hiltunen et al., (2002) framework such as utility,
availability and offline issues were excluded from the NUEQ’s scale. The literature in
Introduction shed some light on the potential importance of different components of user
experience. It was assumed that latent variable of perceived usability is construct of
dimensions such as controllability, efficiency, easy of use, learnability and security. A latent
variable of perceived aesthetics was expected to include dimensions such as attractiveness and
25
satisfaction. To summarize, nine dimensions: 1) Controllability1, 2) Efficiency, 3) Ease of use,
user experiences, were selected to the NUEQ’s scale. The all dimensions of the NUEQ’s scale
were expected to measure two latent variables that were perceived usability and perceived
aesthetics.
Table 3. Expected dimensions, question examples of each dimension, items’ codes, numbers and expected latent variables are shown in the table.
Dimension Example question Code Items Latent Variable
Controllability
“I can find the things I want fast and easily from a renewed net bank” (2 items on Likert scale and 1 item on semantic differential scale)
control
(1-3) 3
Efficiency “Use of a renewed net bank is: slow / fast” (Semantically different scale)
effi
(1-5) 5
Ease of Use
“Use of a renewed net bank is: difficult / easy” (Semantically different scale)
easyofus
(1-10) 10
Learnability
“Learning to use a renewed net bank is: difficult / easy” (Semantically different scale)
learn
(1-2) 2
Security “Use of a renewed net bank is: unsafe / safe” (Semantically different scale)
securit
(1) 1
Perceived Usability
1 The items of each dimension are labeled using first four to eight characters of the dimension. For instance, first item of Cotrollabilty dimension is labeled control1 (with Courier new font). See table 3 below.
26
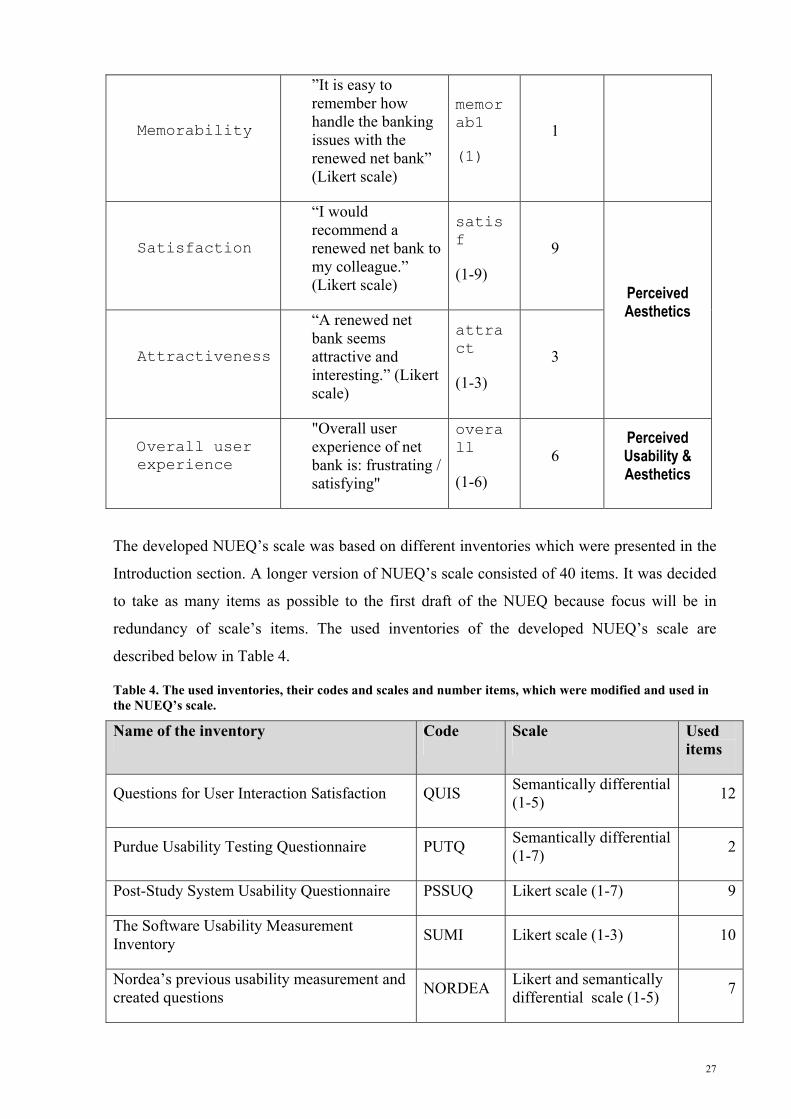
Memorability
”It is easy to remember how handle the banking issues with the renewed net bank” (Likert scale)
memorab1
(1) 1
Satisfaction
“I would recommend a renewed net bank to my colleague.” (Likert scale)
satisf
(1-9) 9
Attractiveness
“A renewed net bank seems attractive and interesting.” (Likert scale)
attract
(1-3) 3
Perceived Aesthetics
Overall user experience
"Overall user experience of net bank is: frustrating / satisfying"
overall
(1-6) 6
Perceived Usability & Aesthetics
The developed NUEQ’s scale was based on different inventories which were presented in the
Introduction section. A longer version of NUEQ’s scale consisted of 40 items. It was decided
to take as many items as possible to the first draft of the NUEQ because focus will be in
redundancy of scale’s items. The used inventories of the developed NUEQ’s scale are
described below in Table 4.
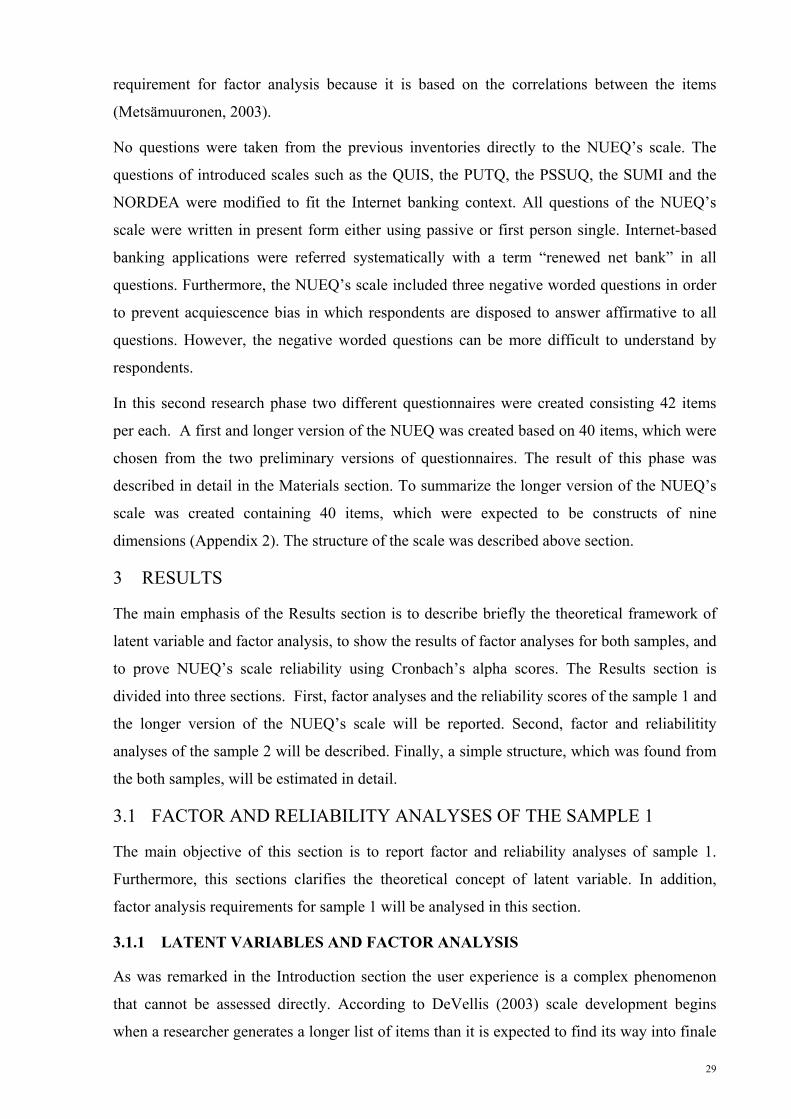
Table 4. The used inventories, their codes and scales and number items, which were modified and used in the NUEQ’s scale.
Name of the inventory Code Scale Used items
Questions for User Interaction Satisfaction QUIS Semantically differential (1-5) 12
Figure 9. The scree plot graph of factors’ eigenvalues revealed that the majority of items variance was accounted for two or three factors.
DeVellis (2003) advises that those factors that are located above the drop of the plot should be
retained. For these reasons factor analysis of sample 1 was continued with three-factor model.
These three-factor model analyses will be reported in the next section.
3.1.4 THREE-FACTOR MODEL OF SAMPLE 1 WITH VARIMAX AND DIRECT OBLIM ROTATION
The Varimax factor analysis was conducted to the sample 1 with the maximum likehood
method. An orthogonal rotation was conducted to the sample 1 by using Kline (1996)
suggested Varimax method. In general, regularly used orthogonal rotation methods are
Varimax and Quartimax rotations and oblique rotation method is Direct Oblim rotation
(Metsämuuronen, 2003). The Varimax rotation method is orthogonal which indicate that
second and the following factors must be uncorrelated with the first factor (Kline, 1996). In
other words, the Varimax rotation produces a model where all factors are uncorrelated with
each other (Kline, 1996). The communalities of scale’s items and items’ factor loadings,
which were above the 0.20 levels in the factor analysis, are presented in the factor matrix
Appendix 5.
The three-factor model accounted for 60,02 % of items variance before the Varimax rotation.
51,52 % of items variance were accounted for the first factor before the rotation. The three-
34
factor orthogonal model accounted for 56,61 % of items variance after Varimax rotation. The
first factor accounted for 22,31 %, second factor 20,17 % and third factor 14,13 % of items
variance. The maximum likehood factor analysis method also gave an opportunity to use a
statistical significance test to evaluate the number of extracted factors. The goodness of fit test
score for three orthogonal factors argued that produced three-factor model was weak (p<.001)
and it indicated that more factors would be needed. However, it is argued that null hypothesis
of goodness of fit test will be too easily be rejected in large samples (Kline, 1996;
Metsämuuronen, 2003).
Kline (1996) suggests that factor loadings of which absolute values are greater than 0.6 are
regard as high and moderately high if they are above 0.3. Factor loadings, which are below
0.30, can be ignored (Kline, 1996). The communalities matrix of sample 1 indicated that
majority of items had atleast moderately high communalities because they were all above
0.30. The communalities of items varied between .82 (easyofuse6 2 ) and .158
(attract2). The extracted communalities of items attract2 (.158) and securit1 (.159) were less than .30 and they were removed from the scale. The small extraction
communality values indicated that those items did not fit well the factor model and should be
removed from additional analysis (Yli-Luoma, 2004). The item easyofuse2 was not
removed from the NUEQ’s scale although its extracted communality value (.288) was below
0.3 but its factor loading (.419) was moderately high to the first factor. In addition, item
learn1 was removed from the scale because it loaded negatively (-.520) on second factor.
In this phase only those items that were positively correlated with each other and had factor
loading greater than 0.3 were retained. The original NUEQ’s scale consisted of 37 items and 3
items were removed in this stage.
The oblique factor analysis for three factors with maximum likehood was conducted to
sample 1 because many items of the scale were loaded on more than one factor and a simple
structure was not found from three orthogonal factors model. The oblique rotation was
conducted using Kline (1996) recommended Direct Oblim rotation method and delta value 0
because it is said to be reliable and the most effective method for obtaining simple structure
(Kline, 1996).
The communalities and factor loadings, which were greater than 0,30, of Direct oblim rotated
three-factor model are presented in Appendix 6. The first oblique rotated factor accounted for
2 easeofuse6 means sixth items of Ease of use dimension of the NUEQ’s scale. See the structure of the NUEQ’s scale from page 26.
35
16,91 %, second factor 10,55 % and third 15,04 % of items variance. It should be noted that
Direct oblim rotation allows factors correlate with each other. For this reason factors’
cumulative accounted portion cannot be estimated. Furthermore, the oblique factor analysis
revealed that first factor and second factor correlate positively (r = 0.564) to each other. In
contrast, first and third factor correlated strongly negatively (-0.715) to each other.
Furthermore, second and third factor correlated negatively (-0.500) to each other.
Two scale items were removed from the scale after oblique factor analysis. The first removed
item was easyofuse2 because its extracted communality value was low (.288). The
second removed item was satisf9, which had an average communality value (.566) but it
was realized that its content is not suitable for analyzing user experience of other banking
application user group. The original NUEQ’s scale consisted of 35 items and 5 items were
removed in this stage. It was assumed that scale’s items variance can be accounted for two
factor because many items had factor loading greater than 0.30 on more than one factor and
the simple structure could not be found (Appendix 6). The factor analysis with two-factor
model was conducted to the sample 1 which will be reported in the next section.
3.1.5 TWO-FACTOR MODEL OF SAMPLE 1 WITH VARIMAX AND DIRECT OBLIM ROTATION
The Varimax rotated factor analysis for two factors with maximum likehood method was
conducted to the sample 1 because the simple structure was not found from orthogonal and
oblique three-factor model. The communalities of the factor analysis are presented in
Appendix 7. The extracted communalities of items varied between .811 (satisf4) and .291
(satisf7).
The two-factor model accounted for 57,58 % before the Varimax rotation and after the
rotation 54,77 % of the items variance. The first factor accounted for 52,38 % and second
factor 5,18 % of items variance before the rotation. After Varimax rotation the first factor
accounted for 31,28 % and second factor accounted for 23,49 % of items variance. The item
satisf7 was removed from the scale because of its low extracted communality value
(.291). The original NUEQ’s scale consisted of 34 items and 6 items were removed in this
stage.
The orthogonal two-factor model revealed that many items were still loaded on both factors.
For this reason Direct oblim factor analysis for two factors with maximum likehood method
was conducted to the sample 1. The Direct oblim rotation was conducted with delta value 0 to
sample 1, and only those items that were positively correlated with the other items and had
factor loadings greater than 0.40 were taken into analysis (Table 7). The communalities of
36
factor analysis are presented in Appendix 8. The extracted communalities of items varied
between .811 (satisf4) and .331 (attract1_r).
Table 7. The factor matrix of two-factor model with Direct oblim rotation where removed items of the scale are presented on grey background.
Extraction Method: Maximum Likelihood. Rotation Method: Oblimin with Kaiser Normalization. a Rotation converged in 15 iterations. Those scale’s items, which had factor loadings greater than .501 in two-factor model with
Direct Oblim rotation, were selected to a shorter and improved version of NUEQ’s scale. In
this phase the scale’s items memorab1 (.500), satisf5 (.460), satisf8 (.406),
easyofuse8 (.404), effi5 (factor loading was lower than .400), attract1_r (lower
than .400), easyofuse10 (.439) and easyofuse9 (.413) were removed from the scale.
37
The removed scale’s items are presented on grey background in Table 7. Total of 14 items of
the original NUEQ were removed based on the orthogonal and oblique factor analyses. The
shorter version of the NUEQ’s scale consisted of 26 items. The items of NUEQ’s scale were
loaded on two factors. The Direct oblim factor analysis with maximum likehood method and
delta value 0 was conducted to the selected 26 items of the NUEQ’s scale of sample 1.
Table 8. Direct oblim rotated communalities of chosen 26 items of NUEQ’s scale.
The communalities of the oblique rotation are shown in Table 8 and those items, which had
factor loadings greater than 0.400, are presented in Table 9. As was noted earlier factor
loading of .30 or greater is regarded as significant (Kline, 1996). The factor loading of .30
indicates that 9 % of the item’s variance is accounted for the factor (Kline, 1996).
38
Table 9. Direct oblim rotated two factor model that consisted of 26 items which were chosen to shorter version of NUEQ’s scale. The factor loadings of three-factor model are shown below.
Extraction Method: Maximum Likelihood. Rotation Method: Oblimin with Kaiser Normalization. A Rotation converged in 8 iterations. All scale’s items were loaded strongly on two oblique factors. 18 items loaded on the first
factor and their factor loadings varied between .929 (overal1) and .483 (satisf2_r). 8
items were loaded strongly to the second factor and their factor loadings varied between .820
(learn2) and .413 (easyofuse3). Two-factor model accounted for 61,55 % of items
variance before the Direct oblim rotation. The first and second factors were correlated
positively (r = .71) with each other. All items’ factor loadings on the factors are presented
visually in Figure 10.
39
-1,0 -0,5 0,0 0,5 1,0
Factor 1
-1,0
-0,5
0,0
0,5
1,0
Fact
or 2
overal1
overal2
overal4
overal5overal6
control1easyu1_rsatis2_r
effi2satisf3
satisf4
satisf6
easyuse4easyuse5learn2
control3
effi3
easyuse7
effi4
Factor Plot in Rotated Factor Space
Figure 10. The NUEQ scale’s factor loadings of 26 items are visually presented above with Direct oblim rotated two factors.
3.1.6 RELIABILITIES OF SHORTER VERSION OF THE NUEQ’S SCALE
After the second and improved version of the NUEQ’s scale was determined using factor
analyses, the reliability of the shorter NUEQ’s scale was analysed. In general, the reliability
of scale can be defined as the absence of measurement error (Bailey & Pearson, 1983). In
other words, a reliable scale measures same phenomenon consistently and free from error
(Bailey & Pearson, 1983). In this research the scale’s reliability is defined as an item’s
amount of variance that is caused by the true score of the latent variable (DeVellis, 2003).
DeVellis (2003) remarks that all variance in the items scores of the scale are due to error and
actual variation across individuals in the phenomenon that the scale measures.
The reliability can be measured using either a parallel test, a test-retest or an internal
consistency method (Ives et al., 1983; Metsämuuronen, 2003). DeVellis (2003) argues that
scale’s internal consistency is typically equated with Cronbach’s coefficient alpha. In basic
research acceptable reliability scores for scales are greater than 0.80 (Ives et al., 1983). The
internal consistency in this study meant the amount of which the items of the NUEQ’s scale
captured the true scores of the latent variables of user experience. The internal consistency
40
reliability is consequence of the homogeneity of the items of the scale and measurement
theory suggest that those items that are correlated with each other measure the same latent
variable (DeVellis, 2003). In other words, an internally consistent scale includes items that are
highly correlated with each other (DeVellis, 2003).
The reliability of the improved and shorter version of the NUEQ’s scale, which consisted of
26 items, was analysed using the internal consistency method and Cronbach’s alpha.
Cronbach’s alpha score were calculated using following formula:
where K = number of items in scale, 2∑ gs =
sum of items variance, s = sum variables variance which are created from scale items.
−
−= ∑
2
2
11 x
gxx s
sK
Kr2
x
The reliability of the overall NUEQ’s scale was high, Cronbach’s alpha = .967 (Table 10).
The reliability analysis was conducted from 305 observations and 46 observations were
ignored from the analysis because their missing values. Furthermore, the reliability of the
NUEQ’s scale was calculated for sum variables which were created based on the two-factor
model. The reliability matrices is presented in Appendix 9.
Table 10. The reliabilities, means, standard deviations, min-max intervals, and number of items of the shorter NUEQ’s scale are shown in the table.
Scale Items Reliability Min-Max interval
Means (M)
Standard deviation
(SD)
Accepted responses
Overall scale 26 .967 26 - 130 87,43 19,86 305
Sum variable of factor 1 18 .961 18 – 90 59,67 14,70 327
Sum variable of factor 2 8 .904 8 - 40 27,56 6,24 319
The reliability of the first factor’s sum variable, which included 18 items, was high,
Cronbach’s alpha=. 961. The reliability analysis was conducted from 327 observations and 24
observations were ignored from the analysis because of their missing values. The Cronbach’s
alpha scores, if an item was deleted from the scale, ranged between .957 (satisf4) and .960
(seven items) in the first factor. The reliability of the second factor’s sum variable,
which included 8 items, was high, Cronbach’s alpha = .904. The reliability analysis was
conducted from 319 observations and 32 observations were ignored from the analysis because
41
of their missing values. The Cronbach’s alpha score, if an item was deleted from the scale
ranged between .882 (easyofuse6) and .900 (easyuse7) in the first factor.
To summarize, reliability scores of sum variables ranged between .967 and .904 in the
NUEQ’s scale, which were created from sample 1. It can be argued that the developed
NUEQ’s scale was a reliable instrument because its reliability scores were high which meant
that a very little of variance in responses of selected items of the NUEQ’s scale was due to
measurement error. According to Metsämuuronen (2000b) high reliability score indicates that
scale’s items measure the same underlying latent variable and the scale separate individuals in
reliable and efficient way (Metsämuuronen, 2000b).
The factors’ factor scores of the two-factor model were compared to created sum variables.
The first factor score correlate strongly (r = .995) with the first sum variable (SUM1). The
second factor score correlate strongly (r = .973) with the second sum variable (SUM2). This
procedure was conducted to guarantee that the sum variables SUM1 and SUM2 were adequate
indicators to factor scores of two-factor model.
The strong correlation between two sum variables was indicated also when factor scores’ and
sum variables’ correlations were compared. The first factor score correlate strongly (r = .796)
with second sum variable (SUM2). In addition, second factor score correlated strongly (r
= .773) with the first sum variable (SUM1). The factor scores and sum variables were
distributed approximately like a normal distribution (Appendix 10).
3.2 FACTOR AND RELIABILITY ANALYSES OF THE SAMPLE 2
The factor analyses of the first sample produced a shorter version of the NUEQ’s scale. The
main purpose for this activity was to create a scale that had fewer items than the original
version while maintaining a high reliability. In addition, second objective was to improve the
percentage of completed questionnaires in the following samples. The structure of produced
scale was changed so that two items (effi1 and easyofuse7) were removed from the
scale before the collection of a sample 2. The items were removed because it was realized that
their contents were not appropriate for measuring user experience of Internet banking in
banking context of sample 2. Furthermore, two eliminated items (satisfy_8 and
securit1) were added to the scale because they produced relevant information to the
Nordea. The structure of the NUEQ’s scale, which was used in collecting sample 2, will be
described in the next section.
42
3.2.1 STRUCTURE OF SHORTER VERSION OF THE NUEQ
The shorter and modified version of the user experience scale consisted of 26 where 9 items
used a five-point Likert scale and 17 items used a a five-point semantically differential scale.
14 items were removed from the original NUEQ’s scale, which consisted of 40 items, using
factor analyses. The 24 items of the scale were loaded on two oblique factors, and two items
(securit1 and satisf8) were not loaded on these factors because they were added
afterwards.
The shorter version of questionnaires were dived into three parts: 1) Overall Internet banking
experience, 2) Internet banking characteristics 1 /2, and 3) Internet banking characteristics 2
/2 (Table 11). The order of questions in each part of the questionnaires were determined with
a random-number generation in order to eliminate a bias related to questions order.
The first part of questionnaire consisted of 6 questions. The five-point semantic differential
scale was used in these questions. All the questions of part 1 were loaded on the first factor.
The second part of questionnaire consisted of 9 questions and five-point Likert scales were
used in these questions. All the questions of part 1 were loaded on the first factor. The third
part consisted of 11 questions and the five-point semantic differential scale was used in these
questions. All the questions of part 3 were loaded on to the first factor except item effi4,
which was loaded on the second factor. In the next section factor analysis requirements of
sample 2 will be examined.
Table 11. The structure of shorter version of the NUEQ’s scale is presented below.
Part of NUEQ Item number Item code Scale Factor
1 1 overal6 Semantic differential 1
1 2 overal1 Semantic differential 1
1 3 overal4 Semantic differential 1
1 4 overal5 Semantic differential 1
1 5 overal2 Semantic differential 1
1 6 overal3 Semantic differential 1
2 7 effi2 Likert 1
43
2 8 attract3 Likert 1
2 9 satisf3 Likert 1
2 10 satisf4 Likert 1
2 11 control2 Likert 1
2 12 satisf2_r Likert 1
2 13 satisf1 Likert 1
2 14 easyofuse1_r Likert 1
2 15 control1 Likert 1
3 16 learn2 Semantic differential 2
3 17 satisf8 Semantic differential
3 18 control3 Semantic differential 2
3 19 easyofuse5 Semantic differential 2
3 20 easyofuse6 Semantic differential 2
3 21 easyofuse3 Semantic differential 2
3 22 easyofuse4 Semantic differential 2
3 23 effi4 Semantic differential 1
3 24 satisf6 Semantic differential 2
3 25 effi3 Semantic differential 2
3 26 securit1 Semantic differential
44
3.2.2 REQUIREMENTS FOR FACTOR ANALYSIS OF SAMPLE 2
The demographic information of 479 subjects of sample 2 was reported in the Methods
section. The factor analysis requirements of the sample 2 will be analysed in this section. An
explorative factor analysis was conducted to sample 2 in order to reveal the simple structure
of the scale in sample 2. The factor analysis was carried out using Metsämuuronen’s (2003)
suggested maximum likehood method. The maximum likehood method requires that sample
size is more than 100 observations, which was clearly fulfilled in sample 2. The Kaiser-
Mayer-Olkin’s test score of sample 2 was .937, which was much greater than 0.6, indicated
that sample 2 was appropriate for factor analysis according to Kaiser’s classification (Table
12).
Table 12. KMO and Bartlett's Test results of Sample 2.
KMO and Bartlett's Test Kaiser-Meyer-Olkin Measure of Sampling Adequacy. ,937
Approx. Chi-Square 5949,147df 325
Bartlett's Test of Sphericity
Sig. ,000
Furthermore, the significance of Bartlett’s test of sphericity was p < .0001 which indicated
that sample 2 did not produce an identity matrix and it is appropriate for factor analysis
(Metsämuuronen, 2003).
A total five factors with eigenvalue greater that 1.0 were idenfied. The five-factor model
accounted for 61,5 % of items variances. The majority of the items variances, 40,5 % was
accounted for a first factor before Varimax rotation. The rest of four factor accounted for 21
% of items variance before the rotation. It should be noted that after “extra” questions such as
securit1 and satisf8 were removed from the scale, the eigenvalue rule over 1 rule
produced a four-factor model where 58,9 % items variance was accounted for before the
rotation. Based on these results in can be argued that the last factor in five-factor model was
irrelevant because it was created by two extra variables securit1 and satisf8. In
addition, when these factor models were compared, the four-factor Varimax-rotated model
was much better than five-factor Varimax rotated model because 51,4 % of items variance
was accounted for the former model and only 41,1 % of items variance was accounted for
four factors of the latter model. The added items securit1 and satisf8 were removed
from the scale for further factor analysis of the scale based on these findings.
45
As was remarked in analysis of sample 1, the einvalue rule over one often overestimates the
number of factors in large matrix. The Cartell Scree test was used to estimate the number of
factors (Figure 11). A drop in amount of information across successive factors reveals the
right number of extracted factors (DeVellis, 2003; Metsämuuronen, 2003). The Scree plot of
the Cartell’s test indicated that majority of the items variance could be accounted for a two- or
Extraction Method: Maximum Likelihood. Rotation Method: Varimax with Kaiser Normalization. a Rotation converged in 5 iterations. The three-factor model accounted for 54,76 % of items variance before the Varimax rotation.
The first factor accounted for 41,90 % of items variance before the rotation. The Varimax
rotated three-factor orthogonal model accounted for 48,61 % of items variance. The first
factor accounted for 18,78, second factor 16,13 and third factor 13,71 % of items variance.
The factor loadings of the orthogonal three-factor model showed that many items had a
moderately high factor loading on more than one factor. This indicated that the three-factor
model was not simple structure of the sample 2. It was assumed that the oblique rotation of
sample 2 could produce a simpler structure than orthogonal rotation. The maximum likehood
factor analysis for three factors was conducted to sample 2 with Direct oblim rotation method
and delta value 0 (Table 14). The three-factor model accounted for 54,76 % of items variance
before the Direct oblim rotation. The factor analysis with Oblique rotation for three factors
produced much simpler structure than previous orthogonal rotated three factor model while all
scale’s items had moderately high or high factor loading only on one factor excluding items
satisf4 and effi3. However, it is common that some items could load on more than one
47
factor because Direct oblim rotation allows maximal correlation between factors
(Metsämuuronen, 2003).
Table 14. The items’ factor loadings in three-factor model with Direct oblim rotation. The items of factor 1 and 3 are presented on grey background.
Extraction Method: Maximum Likelihood. Rotation Method: Oblimin with Kaiser Normalization. a Rotation converged in 9 iterations. It should be noted that the first factor correlate negatively with the second factor (r = -.45) and
the third factor (r = -.65) while Direct Oblim rotation method allowed extracted factors to
correlate with each other. However, the second factor correlate positively with the third factor
(r = .42). The maximum likehood factor analysis for two factors was conducted to sample 2
with Varimax and Oblim rotation but these analyses did not produce such a simple structure,
which was found from three oblique rotated factor model (Appendix 11 and 12). In the simple
structure of sample 2 14 items were loaded on the first factor, 3 items on the second factor and
7 items were loaded on third factor. The second and third factors’ factor loadings of items
were negative (Table 14). This was not a problem because negative factor loadings could be
changed to positive if all loadings will be changed to same direction because all factor
48
loadings are vectors in factor space and their absolute values did not change in this procedure
(Metsämuuronen, 2003).
The main purpose for this research was to develop a measurement instrument with which user
experiences of Internet banking application customers could be estimated quantitatively.
Unfortunately, the original simple structure of sample 1 was not found from factor analysis of
sample 2. The simple structure of sample 1 was an orthogonal two-factor model where as the
simple structure in sample 2 was a oblique rotated three-factor model. It was assumed that
simple structure of sample 2 of the scale was more reliable than the simple structure of sample
1 because the sample 2 were gathered from real customers and the random sample methods
were used in the data collection process. For these reasons sample 1 was re-analysed with
factor structure of sample 2. In the next section the oblique rotated three-factor models and
the reliabilities of the scales will be compared between samples.
3.3 COMPARISON OF SCALE’S STRUCTURES AND RELIABILITIES BETWEEN SAMPLE 1 AND SAMPLE 2
In this section the simple structure of sample 2, which was oblique three-factor model, will be
produced from sample 1 and both factor structures will be compared. In addition, reliability
scores will be presented for both samples’ overall and dimensions scales.
3.3.1 THE THREE-FACTOR MODEL OF SAMPLE 1 WITH DIRECT OBLIM ROTATION
The maximum likehood factor analysis for three factors with Direct oblim rotation were
conducted to 24 items of sample 1, which were selected based on the factor analysis of sample
2. (Table 15). The three-factor model accounted for 66,47 % of items variance before the
Direct oblim rotation. The first factor accounted for 56,75 % of items variance before the
rotation.
49
Table 15. The three-factor model of sample 2 which was consisted of 24 items.